Embed Size (px)
Citation preview
This project has received funding from the European Union’s Horizon 2020 research and innovation programme under grant agreement No 731218
Demonstration of Intelligent grid technologies for renewables Integration and Interactive
consumer participation enabling Interoperable market solutions and Interconnected stakeholders
Task 1.4 – Design of Consumer’s Engagement Strategies
Consumer’s Engagement Strategies
D1.4

D1.4 Consumer’s Engagement Strategies
InteGrid GA 731218 2 | 94
Topic Demonstration of smart grid, storage and system integration technologies with increasing share of renewables: distribution system
Call LCE 02 - 2016 - SGS
Grant
Agreement
Number
731218
Project Acronym InteGrid
Document D1.4 Consumer’s Engagement Strategies
Type
(Distribution
Level)
☒ Public
☐ Confidential
Due Delivery
Date 30.06.2018
Date of Delivery 30.06.2018
Status and
Version 1
Number of Pages 94
WP Responsible CNET
Deliverable
Responsible KTH
Author(s)
Carmen Escudero Guirado | Comillas
Victoria Labajo | Comillas
Carmen Valor | Comillas
Paula Bögel | KTH
Annika Giersiepen | KTH
Carolina Koronen | KTH
Aram Mäkivierikko | KTH
Anders Nilsson | KTH
Hossein Shahrokni | KTH
Reviewer 1 Pedro Coimbra Costa | EDP Comercial
Reviewer 2 Rafael Cossent Arín| Universidad Pontificia Comillas
File Name InteGrid_D1.4_ Design_of_Consumer’s_Engagement_Strategies
D1.4 Consumer’s Engagement Strategies
InteGrid GA 731218 3 | 94
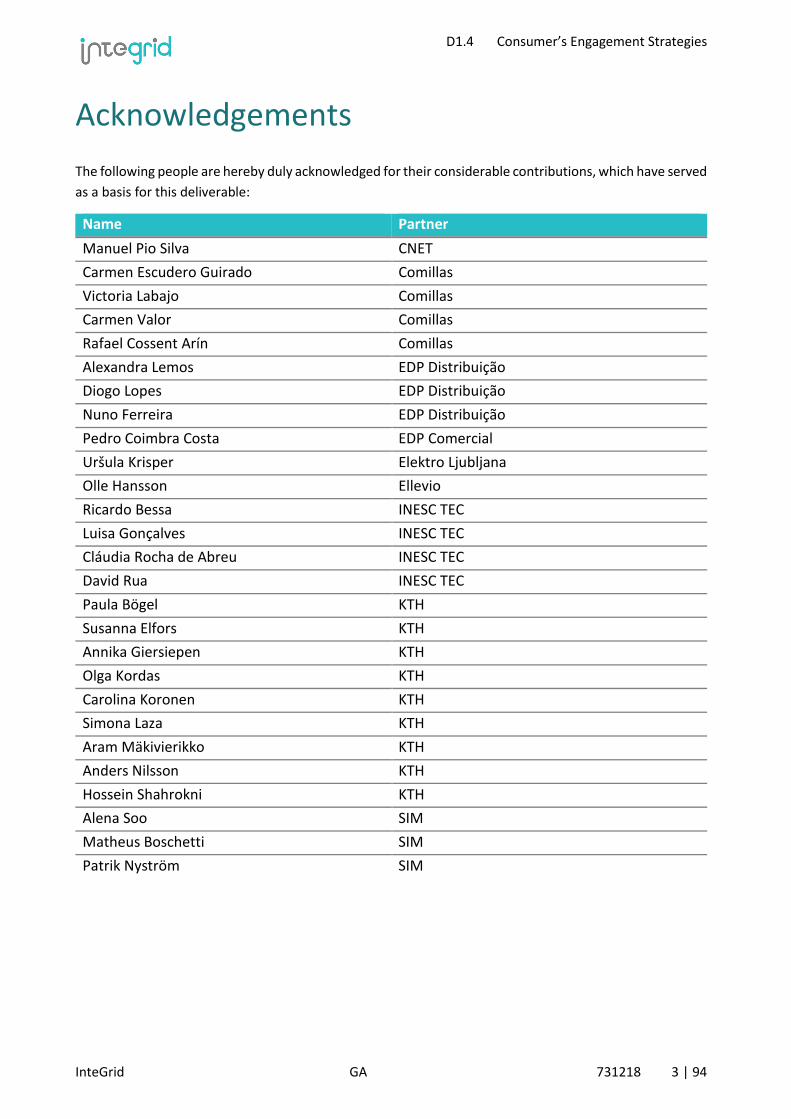
Acknowledgements
The following people are hereby duly acknowledged for their considerable contributions, which have served
as a basis for this deliverable:
Name Partner
Manuel Pio Silva CNET
Carmen Escudero Guirado Comillas
Victoria Labajo Comillas
Carmen Valor Comillas
Rafael Cossent Arín Comillas
Alexandra Lemos EDP Distribuição
Diogo Lopes EDP Distribuição
Nuno Ferreira EDP Distribuição
Pedro Coimbra Costa EDP Comercial
Uršula Krisper Elektro Ljubljana
Olle Hansson Ellevio
Ricardo Bessa INESC TEC
Luisa Gonçalves INESC TEC
Cláudia Rocha de Abreu INESC TEC
David Rua INESC TEC
Paula Bögel KTH
Susanna Elfors KTH
Annika Giersiepen KTH
Olga Kordas KTH
Carolina Koronen KTH
Simona Laza KTH
Aram Mäkivierikko KTH
Anders Nilsson KTH
Hossein Shahrokni KTH
Alena Soo SIM
Matheus Boschetti SIM
Patrik Nyström SIM
D1.4 Consumer’s Engagement Strategies
InteGrid GA 731218 4 | 94
Executive Summary
This deliverable is the outcome of task 1.4 in the InteGrid project; it revolves around an inherently
transdisciplinary challenge: long-term engagement of consumers in the smart electricity grid. The
contributions of this report stand on three legs that provide the InteGrid with insights, and practical
guidelines on how to better engage the end users in the smart grid, across the demo sites in Sweden,
Portugal and Slovenia. The results are however also relevant to the wider smart grid community.
The first leg of this report is a literature review on eco-feedback covering feedback-based interventions for
increasing energy savings. The review was oriented to identify key design features of devices and/or
features related to the implementation of the devices (e.g. device placement). This review resulted in a
number of practical recommendations to the project that are particularly important to HLUC 9 and
HLUC 11. The recommendations included feedback timing, duration of feedback, mediums used, content
of feedback, granularity of feedback, units, tailored feedback with concrete recommended actions, working
with penalties and rewards, design strategies, and specifically, designing devices for families and homes. To
enable more tailored feedback, algorithms with household-specific baselines were proposed to customise
the feedback to the actual household and to increase consumer trust in the feedback.
The second leg of the report is related to the local stakeholder consultation workshops with end users of
smart grid solutions. This report provides guidelines for how to conduct stakeholder consultation
workshops towards these aims. A literature review was also conducted that highlighted how stakeholder
consultation workshops have been used in the energy field in the past, and what stakeholders were
included. This spanned questions that have been discussed with residential users, such as their reactions
and beliefs to dynamic pricing, self-consumption, and smart meters.
Subsequently, residential stakeholder consultation workshops were conducted in Stockholm and Lisbon
where the main topics were community storage and feedback. In addition, two office employee stakeholder
consultation workshops were conducted by Elektro Ljubljana with their office employees in Domzale and
Ljubljana, aimed at identifying a CSR program where office employees could support flexibility increasing
actions and their role in the building’s peak load reduction. The workshop objectives were therefore: to
raise awareness on building energy performance among employees; to find out about current habits and
attitudes related to energy; to identify action points in an upcoming behavioral change program aimed at
conserving and shifting energy; and to build approval of the program among employees. The workshop
resulted in the decision to focus on two measures in the behavioral change program: management of the
air conditioning; and close attention to switching off computers and their equipment when not in use.
To better understand how consumers interpret and react to energy feedback given in the context of a social
network application, two stakeholder consultation workshops were held – one in Stockholm and one in
Lisbon – where a visual prototype of the energy feedback functionality was presented and discussed in
focus groups. The participants generally found that presenting the feedback as percentages made it difficult
to grasp and they would prefer colors and bars. They appreciated the concrete tips provided on what
practical actions to take in order to reach the energy goals. In the Portuguese workshop, they also wanted
data on how much money they were saving by reaching their energy goals. The attitudes towards
comparing energy conservation and load shifting achievements with other households or neighborhoods
were different among the participants; the competitive element appealed to some but not to others. The
D1.4 Consumer’s Engagement Strategies
InteGrid GA 731218 5 | 94
Stockholm workshop also assessed the significance of feedback aggregation levels; apartment, building or
neighborhood. The results suggested that apartment level may be the most relevant in encouraging people
to take action and it also makes their contribution directly visible in the feedback. Building or neighborhood
level however may add more to the social sustainability by uniting people towards a common goal.
The workshop on energy storage in Stockholm revealed a desire for independence and a need for a
“comfortable” solution that completely takes care of customers’ needs, as two contrasting motives
underlying residents’ decision on energy storage facilities in their apartments. Several participants also
associated the new, shared energy system with an improved sense of community, addressing a need for
increased social belonging in a currently rather isolated society. In Portugal the majority of participants
favored having an own battery in their apartments while in Sweden nearly all participants favored a
common battery. This relates to findings on preference for shared versus individual solutions in the two
countries: While Swedish participants favored a shared option, Portuguese partners perceived this rather
as a risk. The named risks, e.g. running out of energy due to high demand of neighbours, was also mentioned
by some Swedish participants but played an overall smaller role in the decision process. A reason for this
might be that sharing concepts in housing, e.g. shared laundry rooms are more common in Sweden and
people got used to this solution. A compromise of this conflict that was named in both workshops is a
“limited sharing”, e.g. with the possibility to reserve a certain amount of energy for each resident.
In Ljubljana and Domzale the office employees indicated an interest and willingness to participate in the
projects peak reduction program by reducing plug loads during the mid-day peak hours, particularly during
their lunch hour.
The third leg of this report – evaluation – while outside the scope of this task, was considered important to
be developed in T1.4 for further implementation in the demonstration work packages. A survey was
designed that covers energy attitudes, behaviours, and intentions, as well as social identity and cohesion in
their neighbourhoods and buildings. The baseline surveys were conducted and summarized in Lisbon and
Stockholm, where there are residential consumers in the demonstrators.
The Stockholm survey shows that participants energy saving behavior is mainly influenced by their attitudes
and the perceived control they have over energy saving activities. Neighbours opinions did not have an
influence, possibly because participants did not identify strongly with them. Measurements of social
cohesion reveal room for improvement regarding neighborhood social bonds and again indicate a need for
increased social belonging.
The Lisbon survey did not find an influence of attitudes and perceived control on energy saving behavior,
which might be partly due to the fact that a shorter version of the questionnaire, designed to increase
usability, was tested here. However, as in the Swedish sample, we found a comparatively low identification
with the neighborhood and need for improvement in social bonds.
Differences between the samples regarding both energy behavior and the evaluation of social interactions
highlight the importance of tailored approaches to engage consumers in different communities with
different needs.
D1.4 Consumer’s Engagement Strategies
InteGrid GA 731218 6 | 94
Table of Contents
1. Aims and Objectives of the Report ___________________________________ 12
1.1. Objectives ______________________________________________________________ 12
1.2. The Challenge of Long-Term Residential Engagement in the Smart Grid ______________ 13
2. InteGrid’s Consumer-Facing Technologies and Flexibility Goals ____________ 14
2.1. HLUC 9 – Home Energy Management System __________________________________ 14
2.2. PUC 01-11 – Active House __________________________________________________ 15
2.3. PUC 02-11 – LocalLife _____________________________________________________ 16
2.3.1. Background _________________________________________________________________ 16
2.3.2. LocalLife as a Context for Energy Feedback ________________________________________ 18
2.3.3. LocalLife as an Enabler of Social Sustainability _____________________________________ 19
2.4. HLUC 12 – Virtual Power Plant ______________________________________________ 19
3. Methodology ____________________________________________________ 20
3.1. Literature Review ________________________________________________________ 20
3.2. Stakeholder Consultation Design ____________________________________________ 30
3.2.1. Stakeholder Consultation Workshops (SCW) _______________________________________ 30
3.2.2. Survey Design _______________________________________________________________ 37
4. Results _________________________________________________________ 42
4.1. Feedback Design Recommendations _________________________________________ 42
4.2. Providing Comparative Feedback ____________________________________________ 51
4.2.1. Problems with Comparative Feedback ____________________________________________ 52
4.2.2. Proposed Solution: Household-Specific Baselines ___________________________________ 54
4.3. Residential Consultation Workshops on Feedback and Community Storage ___________ 57
4.3.1. Feedback – Stockholm ________________________________________________________ 57
4.3.2. Feedback – Lisbon ___________________________________________________________ 60
4.3.3. Energy Storage Stockholm _____________________________________________________ 60
4.3.4. Energy Storage – Lisbon _______________________________________________________ 65
4.4. Evaluation Survey – T0 Baseline Sweden ______________________________________ 67
4.4.1. Descriptive Statistics __________________________________________________________ 67
4.5. Evaluation Survey – T0 Baseline Portugal ______________________________________ 71

D1.4 Consumer’s Engagement Strategies
InteGrid GA 731218 7 | 94
4.5.1. Descriptive Statistics __________________________________________________________ 71
4.5.2. Influencing Factors of Behavioural Intentions ______________________________________ 74
4.6. Office Employee Consultation Workshops – Ljubljana and Domzale _________________ 75
5. Summary _______________________________________________________ 78

D1.4 Consumer’s Engagement Strategies
InteGrid GA 731218 8 | 94
List of Figures
Figure 1. The start-page dashboard of the Tingco Home display. ________________________________ 15
Figure 2. Conceptual Model for Smart Grids. Source: Siano (2014, 464)___________________________ 23
Figure 3. Stakeholder mapping: the power/attention matrix. Adapted from Newcombe (2003). _______ 26
Figure 4. The Stakeholder Circle for stakeholder visualization. __________________________________ 27
Figure 5. Example of feedback screen used in the energy feedback consultation workshop. __________ 31
Figure 6. Age distribution of registered participants in the energy storage consultation workshop _____ 35
Figure 7. Research questions for literature review on engagement strategies ______________________ 51
Figure 8. Energy consumption statistics (0-25-50-75-100 percentile) for 11 months in 124 apartments
divided into six area groups. The apartments are recently built and participate in a pilot in the InteGrid EU
project in Stockholm Royal Seaport. ______________________________________________________ 53
Figure 9. Simulated energy consumption for Swedish apartments for different combinations of area (30-
110 m2) and number of residents (1-5). Simulated using Energikalkylen, an online household electricity
calculator provided by the Swedish Energy Agency. __________________________________________ 53
Figure 10. Example of personalized goal setting using household-specific baselines for two hypothetical
households. _________________________________________________________________________ 54
D1.4 Consumer’s Engagement Strategies
InteGrid GA 731218 9 | 94
List of Tables
Table 1. Listing and clarification of the objectives of D1.4. _____________________________________ 12
Table 2. InteGrid Energy and Flexibility Goals Across Residential Pilots ___________________________ 14
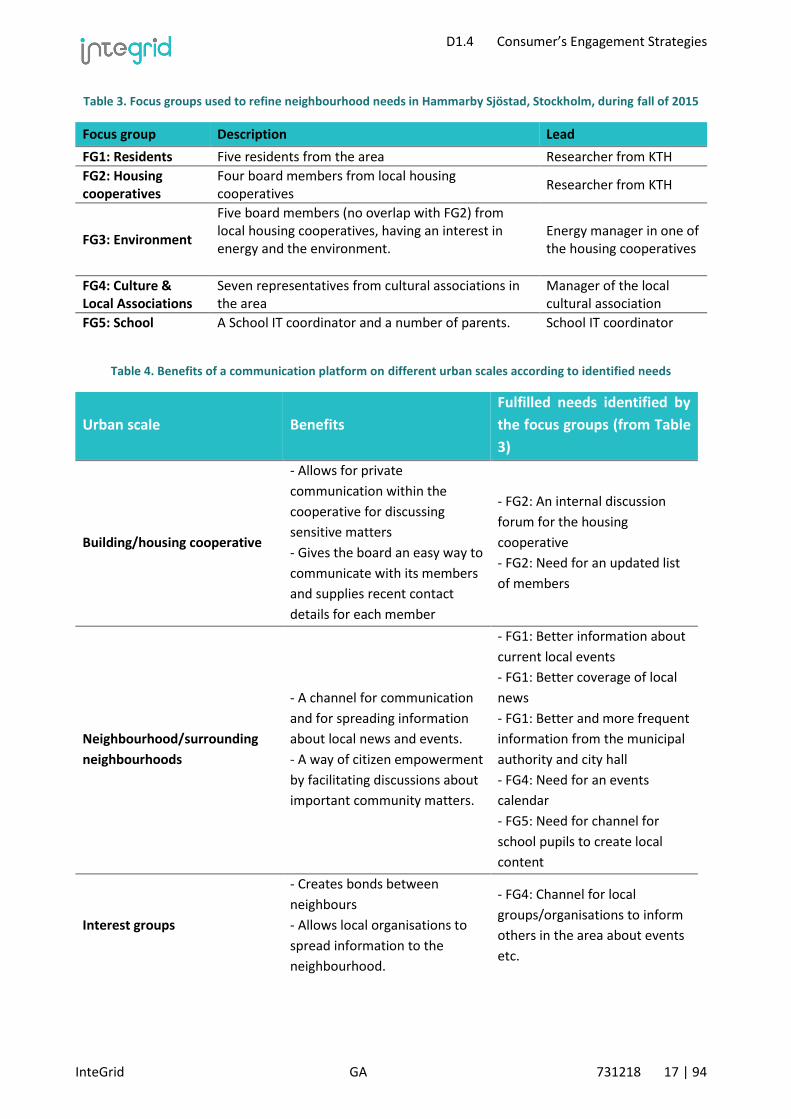
Table 3. Focus groups used to refine neighbourhood needs in Hammarby Sjöstad, Stockholm, during fall of
2015 _______________________________________________________________________________ 17
Table 4. Benefits of a communication platform on different urban scales according to identified needs _ 17
Table 5. Potential Stakeholders for Energy Consultarion. Source: CIVITAS Initiative (2011). ___________ 24
Table 6. Synthesis of the literature review on stakeholder consultation in energy projects. ___________ 28
Table 7. Advantages and disadvantages of options presented to the participants in the energy storage
consultation workshop. ________________________________________________________________ 33
Table 8. Feedback for energy conservation. Synthesis of recommendations based on literature review. _ 49
Table 9. Electrical household loads, their typical share of household electricity use _________________ 56
Table 10. Input values for household electricity consumption calculation._________________________ 57
Table 11. Frequency of energy saving behaviours mentioned in the survey (Sweden). _______________ 68
Table 12. Measurement of social bonds (Sweden) ___________________________________________ 69
Table 13. People in participants social network (Sweden)______________________________________ 69
Table 14. Additional descriptive statistics social sustainability (Sweden) __________________________ 69
Table 15. Descriptive and correlations of behavioural and social scales (Sweden). __________________ 70
Table 16. Hierarchical regression analyses predicting intention to save energy (Sweden) _____________ 71
Table 17. Frequency of energy saving behaviour (Portugal) ____________________________________ 72
Table 18. Measurement of social bonds (Portugal). __________________________________________ 72
Table 19. People in participants social network (Portugal). _____________________________________ 73
Table 20. Additional descriptive statistics social sustainability (Portugal). _________________________ 73
Table 21. Descriptives and correlations of behavioural & social scales (Portugal). ___________________ 74
Table 22. Hierarchical regression analyses predicting intention to save energy (Portugal). ____________ 75

D1.4 Consumer’s Engagement Strategies
InteGrid GA 731218 10 | 94
List of Equations
Equation 1. Baseline household electricity consumption ______________________________________ 56

D1.4 Consumer’s Engagement Strategies
InteGrid GA 731218 11 | 94
Abbreviations and Acronyms
AH Active House
AMI Advanced Metering Infrastructure
CSR Corporate Social Responsibility
DSO Distribution System Operator
EV Electric Vehicle
FG Focus Group
FMT Feedback Management Technology
GA Grant Agreement
HEMS Home Energy Management System
HLUC High-Level Use Case
IAP2 International Association for Public Participation
IHD In-Home Display
MV Medium Voltage
NGO Non-Governmental Organisation
PUC Primary Use Case
PV Photovoltaics
SCW Stakeholder Consultation Workshop
SME Small and Medium-sized Enterprises
SRS Stockholm Royal Seaport
TSO Transmission System Operator
VPP Virtual Power Plant
D1.4 Consumer’s Engagement Strategies
InteGrid GA 731218 12 | 94
1. Aims and Objectives of the Report
This report outlines how the consumer-facing smart grid technologies should be adapted to capture the
requirements of users and support them to enroll in flexibility products. It particularly provides
recommendation on how interfaces and feedback mechanisms should be adapted and designed. As such,
this work supports the vision for the InteGrid project which is precisely to bridge the gap between citizens,
technology and the other players of the energy system.
The report is structured around insights from three research methods employed. These were literature
review studies, stakeholder consultation workshops, and surveys for evaluation. The literature reviews
formed the basis for providing design recommendation on feedback mechanisms. The stakeholder
consultation workshops provided additional insights on how proposed solutions are understood and
received by their intended users. Finally, the surveys were designed and developed for the demonstration
work packages to evaluate how their user-facing technologies are influencing user engagement over time.
The stakeholder consultation workshops also explored the barriers and opportunities on community
storage solutions.
1.1. Objectives
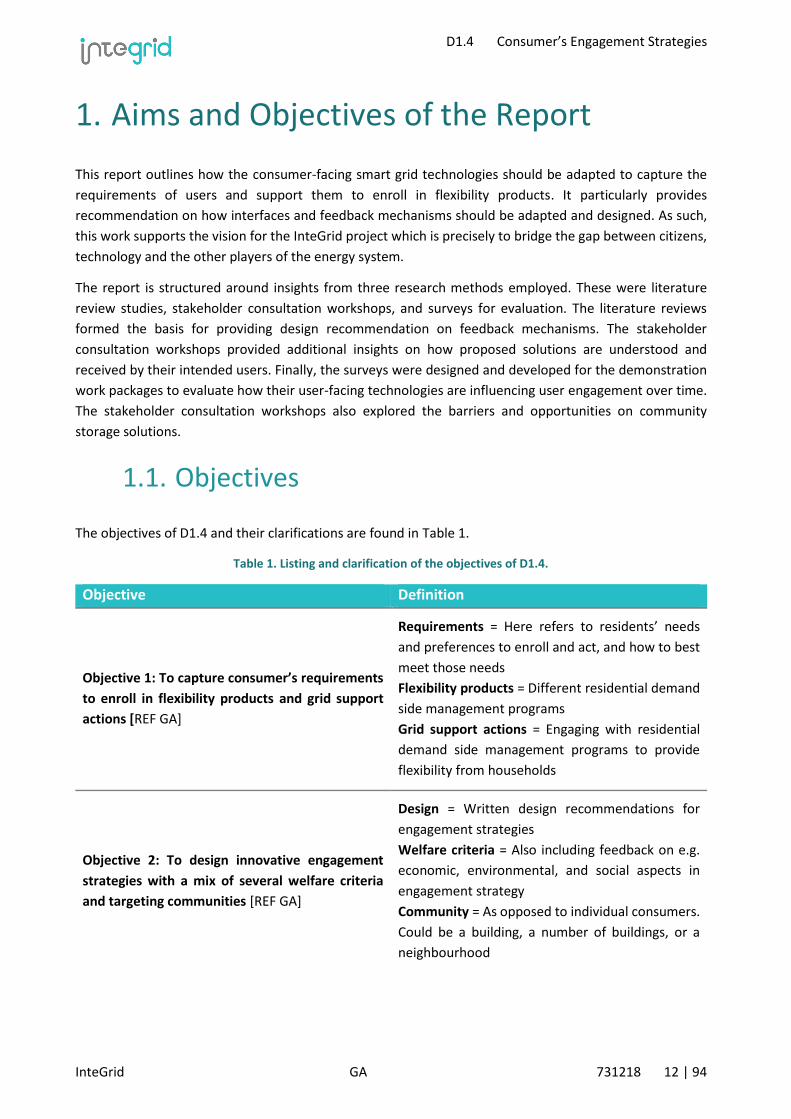
The objectives of D1.4 and their clarifications are found in Table 1.
Table 1. Listing and clarification of the objectives of D1.4.
Objective Definition
Objective 1: To capture consumer’s requirements
to enroll in flexibility products and grid support
actions [REF GA]
Requirements = Here refers to residents’ needs
and preferences to enroll and act, and how to best
meet those needs
Flexibility products = Different residential demand
side management programs
Grid support actions = Engaging with residential
demand side management programs to provide
flexibility from households
Objective 2: To design innovative engagement
strategies with a mix of several welfare criteria
and targeting communities [REF GA]
Design = Written design recommendations for
engagement strategies
Welfare criteria = Also including feedback on e.g.
economic, environmental, and social aspects in
engagement strategy
Community = As opposed to individual consumers.
Could be a building, a number of buildings, or a
neighbourhood

D1.4 Consumer’s Engagement Strategies
InteGrid GA 731218 13 | 94
1.2. The Challenge of Long-Term Residential
Engagement in the Smart Grid
A smart grid needs engaged residents to reach its full potential (Honebein, Cammarano and Boice, 2011).
Households, which are associated with 20% of the European CO2 emissions (Eurostat, 2016), could
contribute to the mitigation by reducing their overall consumption and by also participating in demand-side
management programs, acting as controllable energy consumers. However, achieving long-term
household engagement for these kinds of measures has proven to be hard for various reasons.
The monetary savings are often too low compared to the lost comfort (Hargreaves, Nye and Burgess, 2013);
appealing to environmental concern is believed to be important but shows little effect in reality (Cialdini
and Schultz, 2004); and initial interest in pure environmental feedback (i.e. from in-home energy monitors)
diminishes over time (Hargreaves, Nye and Burgess, 2013). On the other hand, social “pressure” together
with a sense of community responsibility has shown some promise. Whether by increasing comfort,
appealing to environmental concerns, reducing household costs, or utilizing collective goals while
strengthening local group identity - identifying effective long-term residential engagement mechanisms is
vital to the future smart grid. This report aims to further that pursuit for the design and evaluation of
engagement mechanisms in the InteGrid project and those of the other European smart grid projects.
D1.4 Consumer’s Engagement Strategies
InteGrid GA 731218 14 | 94
2. InteGrid’s Consumer-Facing Technologies
and Flexibility Goals
This section provides a description of consumer-facing use cases in the InteGrid project. The consortium
partners have each indicated their ambitions with the respective technology implementations in their local
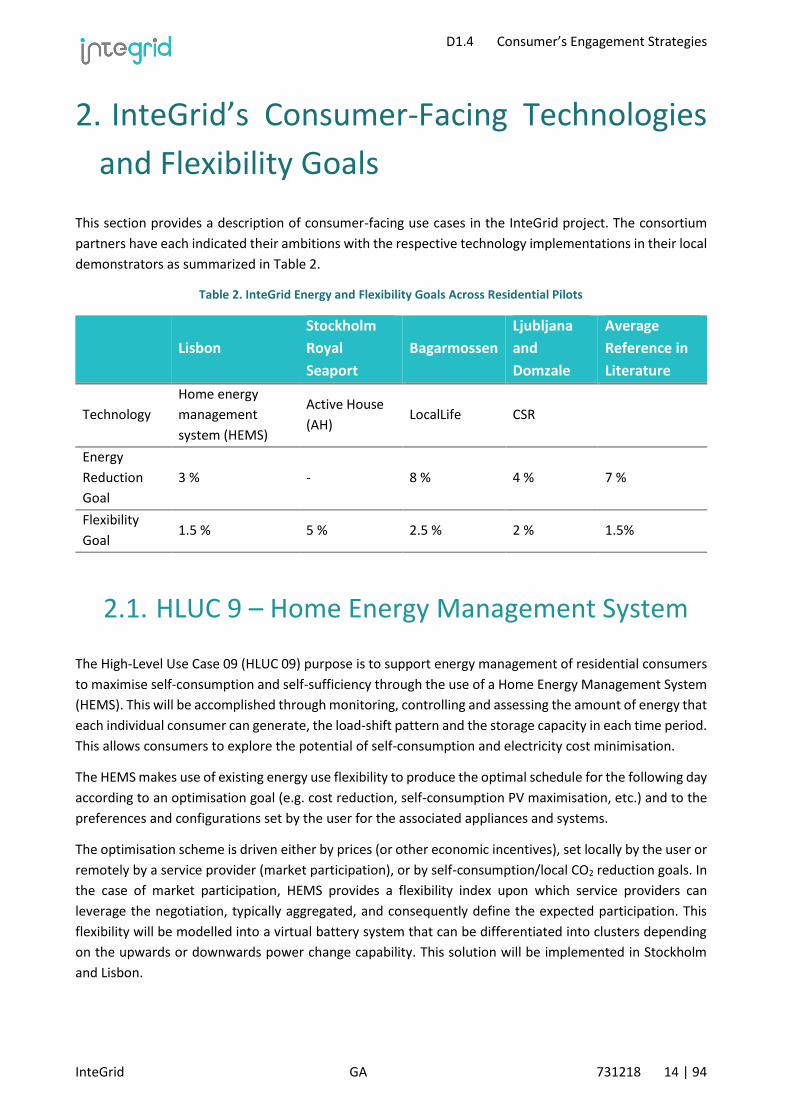
demonstrators as summarized in Table 2.
Table 2. InteGrid Energy and Flexibility Goals Across Residential Pilots
Lisbon
Stockholm
Royal
Seaport
Bagarmossen
Ljubljana
and
Domzale
Average
Reference in
Literature
Technology
Home energy
management
system (HEMS)
Active House
(AH) LocalLife CSR
Energy
Reduction
Goal
3 % - 8 % 4 % 7 %
Flexibility
Goal 1.5 % 5 % 2.5 % 2 % 1.5%
2.1. HLUC 9 – Home Energy Management System
The High-Level Use Case 09 (HLUC 09) purpose is to support energy management of residential consumers
to maximise self-consumption and self-sufficiency through the use of a Home Energy Management System
(HEMS). This will be accomplished through monitoring, controlling and assessing the amount of energy that
each individual consumer can generate, the load-shift pattern and the storage capacity in each time period.
This allows consumers to explore the potential of self-consumption and electricity cost minimisation.
The HEMS makes use of existing energy use flexibility to produce the optimal schedule for the following day
according to an optimisation goal (e.g. cost reduction, self-consumption PV maximisation, etc.) and to the
preferences and configurations set by the user for the associated appliances and systems.
The optimisation scheme is driven either by prices (or other economic incentives), set locally by the user or
remotely by a service provider (market participation), or by self-consumption/local CO2 reduction goals. In
the case of market participation, HEMS provides a flexibility index upon which service providers can
leverage the negotiation, typically aggregated, and consequently define the expected participation. This
flexibility will be modelled into a virtual battery system that can be differentiated into clusters depending
on the upwards or downwards power change capability. This solution will be implemented in Stockholm
and Lisbon.

D1.4 Consumer’s Engagement Strategies
InteGrid GA 731218 15 | 94
2.2. PUC 01-11 – Active House
The Active House (AH) is a residential demand response intervention program taking place in a city district
under current development in Stockholm; the Stockholm Royal Seaport. The AH program aims to stimulate
energy conservation and increase demand flexibility – with a set target of 5-15% peak load reduction –
among 154 newly built apartments equipped with HEMS’s. All households were recruited through a broader
agreement with the housing and property companies (body corporates) collaborating with the AH program;
tenants signed participation agreements during the acquisition of the apartments. In general, the consumer
engagement strategy of the AH program builds on the assumption that HEMS allows for increased
monitoring and control of household energy consumption. Hence, it is hypothesised that households will
engage with HEMS for reduced energy costs, reduced climate impact, and increased home comfort.
A new HEMS innovation, Tingco Home, was developed for the AH program by the local power utility
company, involving several types of monitoring options and features provided to the householders through
in-home displays. The in-home display (see Figure 1) includes the following main functionalities:
• Energy feedback: Feedback on current consumption of electricity, hot tap water, and heating,
accompanied by historical comparisons (hourly/daily/weekly/monthly) and comparisons to other
participating households of similar size.
• Smart lightning: For control of lightning (switching on/off/dimming lamps) of different rooms.
• Smart plugs: Each household has two smart plugs to attach to optional appliances, to monitor and
control (switch on/off) appliance-specific consumption.
• Smart washing machine/dryer: Allowing for time scheduling of washer/dryer sessions.
• Home/Away switch: To switch on/off all lightning and smart plugs simultaneously.
Figure 1. The start-page dashboard of the Tingco Home display.
The display is laid out as follows: Feedback on electricity (top left); hot tap water (top middle); and heating
(top right) consumption, respectively, accompanied by historical comparisons (green dots, and
hourly/daily/weekly/monthly consumption by clicking on the energy meters) and comparisons with other

D1.4 Consumer’s Engagement Strategies
InteGrid GA 731218 16 | 94
households (yellow dots). Feedback on monthly distribution of electricity, hot tap water, and heating
consumption, respectively, is provided at the bottom left, and day-by-day historical comparisons at the
bottom right. Additionally, menus for accessing smart home features are located in the bottom middle.
2.3. PUC 02-11 – LocalLife
2.3.1. Background
The potential for environmental feedback to be noticed and acted upon increases if it is displayed in an
everyday, frequently used context. Generally, when a product or service becomes frequently used, this
indicates an underlying user need. As the aim is to target households, our design approach rests on
identifying household needs (market-pull) relevant to the engagement problem of energy utilities
(technology-push) (Goncalves Da Silva et al., 2012). A number of household needs were explored, in focus
group discussions with residents, as possible intervention strategies for integrating household energy
feedback including the need to be able to stay updated with real-time information about the surrounding
area (traffic, public transport, crime, and relevant news) (Ectors, 2014); a joint family calendar for planning
household-related tasks; and a household health and stress monitoring application to monitor household
well-being.
The need that was most compatible with the intended aim was identified by a strong trend best articulated
by Hayes (2007): “globally connected yet locally isolated”. People have rapidly become globally connected,
with numerous social networks providing real-time interactivity with friends and family around the globe,
public figures and organisations, and colleagues across continents. At the same time, there has been a trend
for increasing “local isolation”, exemplified by the fact that more than half of Americans (Smith, 2010) and
over 70% of all Swedes living in an apartment (Svenska Postkodlotteriet, 2016) only know a few, if any, of
their neighbours well. This local isolation erodes the local social capital (Putnam, 1995) – the very fabric
that holds societies together. One way of increasing local social capital is by fostering relationships among
neighbours. They often have locally relevant information that is not readily available online and has the
potential to be helpful in numerous ways. The chosen context should therefore provide a way that helps
neighbours connect, in order to reverse this trend of local isolation.
Having recognised the potential for a digital, neighbour-connecting communication platform containing a
social aspect, we decided to explore the idea of using a social network specifically targeted at
neighbourhoods as a context. To discover neighbourhood needs that would be facilitated by such a social
network and to design features that catered for those needs, five neighbourhood-based focus groups were
consulted. They are presented in Table 3.
The main needs identified by the focus groups were related to a better way of local communication about
various issues of importance and different types of local events. These communication needs were reflected
in the design of the proposed social network.
D1.4 Consumer’s Engagement Strategies
InteGrid GA 731218 17 | 94
Table 3. Focus groups used to refine neighbourhood needs in Hammarby Sjöstad, Stockholm, during fall of 2015
Focus group Description Lead
FG1: Residents Five residents from the area Researcher from KTH
FG2: Housing cooperatives
Four board members from local housing cooperatives
Researcher from KTH
FG3: Environment
Five board members (no overlap with FG2) from local housing cooperatives, having an interest in energy and the environment.
Energy manager in one of the housing cooperatives
FG4: Culture & Local Associations
Seven representatives from cultural associations in the area
Manager of the local cultural association
FG5: School A School IT coordinator and a number of parents. School IT coordinator
Table 4. Benefits of a communication platform on different urban scales according to identified needs
Urban scale Benefits
Fulfilled needs identified by
the focus groups (from Table
3)
Building/housing cooperative
- Allows for private
communication within the
cooperative for discussing
sensitive matters
- Gives the board an easy way to
communicate with its members
and supplies recent contact
details for each member
- FG2: An internal discussion
forum for the housing
cooperative
- FG2: Need for an updated list
of members
Neighbourhood/surrounding
neighbourhoods
- A channel for communication
and for spreading information
about local news and events.
- A way of citizen empowerment
by facilitating discussions about
important community matters.
- FG1: Better information about
current local events
- FG1: Better coverage of local
news
- FG1: Better and more frequent
information from the municipal
authority and city hall
- FG4: Need for an events
calendar
- FG5: Need for channel for
school pupils to create local
content
Interest groups
- Creates bonds between
neighbours
- Allows local organisations to
spread information to the
neighbourhood.
- FG4: Channel for local
groups/organisations to inform
others in the area about events
etc.
D1.4 Consumer’s Engagement Strategies
InteGrid GA 731218 18 | 94
Based on the outputs from the focus groups and the literature review, we developed the concept of a
sustainability-oriented local social network called LocalLife. It is designed to blend the digital
neighbourhood with the physical neighbourhood and functions on three urban scales: the building/housing
cooperative, the neighbourhood and surrounding neighbourhoods. It caters to everyday needs in a
neighbourhood by strengthening neighbour-to-neighbour interactions, in which building- or
neighbourhood-level local interest groups can be created, either ad hoc by neighbours or by existing
organisations.
The different urban scales and interest groups allow for separate communications; private internal
discussions can be held within housing cooperatives and interest groups, while sending a message to the
neighbourhood or surrounding neighbourhoods quickly spreads information to a large area. This design has
the potential to meet most of the local information- and communication-based needs identified by the
focus groups as shown in Table 4. Peer moderation is used as a way to minimise inappropriate content.
2.3.2. LocalLife as a Context for Energy Feedback
Being a social network, LocalLife is by its nature a social context, and it is expected to be frequently used
since it caters for neighbourhood needs identified by the authors and in focus group consultations. This
means LocalLife should be suitable for energy feedback, according to the literature. By showing feedback
as part of this frequently used context, it should have greater chances of being noticed by the residents
compared with conventional feedback contexts such as web pages provided by energy utilities, energy apps
or in-home energy displays.
Household energy consumption can be compared with that of similar households (descriptive social norm),
while also enabling collective comparison and feedback on the housing cooperation and neighbourhood
level. This collective feedback is expected to decrease the boomerang effect of already energy-efficient
households by making them part of a collective reduction effort. The dynamics of the neighbourhood –
with new neighbours joining, others moving away, and some hopefully changing their behaviour – by itself
adds a changing element to the feedback. Gamification elements could make it even more appealing,
especially to younger residents. The feedback, including any energy-saving tips, can be individually tailored,
possibly based on different types of personas. According to the literature, feedback based on these design
principles has the potential to be effective.
One advantage of having full control over LocalLife is that the feedback design, its placement and its
intertwining with other features of the social network can be fully controlled and customised. This would
not be possible had the feedback been included as part of an existing social network such as Facebook. For
example, this makes it possible to show an energy feature in a space that would commonly be occupied by
advertisements. It also enables deeper links to the content of the social network, such as showing
encouraging and/or spurring posts about the household’s or the neighbours’ energy performance in
relation to individually set goals; creating periodic energy reports; having energy savings competitions; and
including gamification that could give rewards. Such rewards could be badges or some form of virtual
currency usable for other future services within the network. A first version of the visual appearance of the
energy feedback within LocalLife is described in detail in section 3.2.1.1.
The electricity consumption data for the energy feedback, provided in hourly or monthly resolution, is
collected from the local Swedish distribution system operators (DSO’s). In order for LocalLife to gain access
D1.4 Consumer’s Engagement Strategies
InteGrid GA 731218 19 | 94
to household consumption data, each household must give its consent. This process normally requires the
user to find their meter ID, sign a printed contract and send it to the DSO – a task that probably only the
most environmentally interested users would complete. To increase the chances of getting a larger user
base for energy feedback, we have been cooperating with one of the largest DSO’s in Sweden, resulting in
an easier and fully digital consent process that can be initiated from within LocalLife.
2.3.3. LocalLife as an Enabler of Social Sustainability
LocalLife is designed not only to provide a context for energy feedback and thus increase environmental
sustainability, but also to help increase social sustainability when introduced in an area. Local needs are
met through offering possibilities for communication and self-organisation of neighbours, thus facilitating
everyday tasks such as getting a recommendation on a local dentist, notifying neighbours about a lost
wallet, borrowing a tool, initiating a local project and quickly alerting neighbours about local incidents. The
increased frequency of communication and physical meetings between neighbours is expected, in turn, to
increase aspects of social capital such as the feeling of place identity, social cohesion, safety and trust. The
latter is also an important enabler for the sharing economy; as local social capital and a sense of trust
increases, eventually neighbours may feel more comfortable participating in sharing economy activities
that require a higher degree of trust such as car-sharing or babysitting. As sharing economy activities are
usually less resource-intensive than conventional options, in both an economic and environmental sense,
it can be concluded that an increase in local social capital also has the potential to increase both
environmental and economic sustainability in a neighbourhood.
2.4. HLUC 12 – Virtual Power Plant
Another use case that will benefit from these findings is one directly connected to demand response
schemes. A virtual power plant (VPP) offers bids in flexibility markets by aggregating the flexibility from
eligible consumers and distributed energy resources and exploit management functions to support their
participation in energy and ancillary services (i.e., frequency services for TSO and non-frequency services
for DSO). The VPP, comprising distributed generation and loads, will be integrated with AMI, EV charging
system, commercial buildings and existing, small scale grid batteries management systems and combined
with MV optimization, estimation and forecasting algorithms [REFD4.1]. This solution will be implemented
in Ljubljana and Lisbon. The results from this report can support the demand side management programs
in these roll-outs.
D1.4 Consumer’s Engagement Strategies
InteGrid GA 731218 20 | 94
3. Methodology
3.1. Literature Review
To assess the most promising engagement strategies with residential consumers for energy savings, a
literature review was conducted. The review has identified the core parameters or success factors
pinpointed by previous studies. For each of these parameters, a summary is offered of previous results to
guide decision makers. When possible, the review differentiates between design of feedback and design of
device. However, there is a dearth of studies examining the influence of design-related features on energy
savings (e.g. whether use of coloured bars vs. black-and-white bars when providing the information
influence energy consumption) (Vine et al., 2013). Future studies should thus examine whether design
features influence household energy conservation behaviour.
There have been other papers trying to offer a guideline for designers. For instance, Bartram (2015, p. 2)
proposed such model so to “develop a framework for this still ill-defined design space, underpinned by
three interlinked types of factors: knowledge (cognitive), motivation, and effort (technological overhead)”.
The design framework proposed organises dimensions into five categories: Data, psychological factors,
effort and interaction, context, and communicative scope. These are described as follows:
• Data dimensions describe the mental model, physical and social scope of information, and level of
detail.
• Psychological dimensions describe the communicative intent of the feedback, which cognitive
models and motivational strategies it addresses, and the kind of knowledge the feedback supports
(analytic, awareness, or operational).
• Effort is determined by the attentional requirements, cognitive interpretation, and interactivity
expected of the user. For example, does the visualization require active attention and interaction,
or does it support at-a-glance, passive awareness?
• Contextual dimensions consider how the visualization is situated: where and when the resource is
consumed in relation to where the feedback is provided and how tightly bound the data
representation is to the delivery context.
• The dimensions of communicative scope include aesthetics, appeal and affect, and ecological fit.
Although this paper may be useful to identify the key parameters upon which the designer has to make
decisions, the suggestions are not grounded on solid evidence. This is a shortcoming that the present
document tries to address.
Papers were selected using Google Scholar and Web of Science (WOS) with the keywords: “eco feedback”
OR “feedback AND energy” OR “feedback AND shift load” OR “smart meter” AND “feedback”. Only papers
published in the year 2000 and onwards were included in the review. Meta-analysis and review papers were
privileged in the selection filters. After screening out papers with little bearing on the subject, 35 journal
papers and 10 conference papers were selected and analysed. In addition, papers on customer engagement
from the marketing discipline (10 papers) and past papers reporting results of similar European-funded
projects were also added and included (20 case studies).
D1.4 Consumer’s Engagement Strategies
InteGrid GA 731218 21 | 94
Also, to guide the stakeholder consultation guidelines, a toolkit was developed to assist the partners in the
process. The purpose of the stakeholder consultation varies depending on at what point in the process it is
being carried out. Before implementing the solutions, the stakeholder consultation aims to explore the
users’ views of the planned intervention, in order to identify potential shortfalls and barriers that may
jeopardise the success of the intervention. It also aims at identifying what support different stakeholders
must provide to ensure the success of the intervention, as well as informing strategies to align different
stakeholders with the desired goals (European Union, 2014). Users are not aware of how energy systems
work; providing such information in advance may contribute to device solutions for potential problems
(Natural Resources, 2014).
After implementation, the stakeholder consultation aims at evaluating the interventions to ensure
replicability. This evaluation focuses on identifying the drivers and barriers for users’ engagement and on
proposing new avenues of work that can improve consumer engagement, community participation and
involvement of stakeholders in the European energy policy targets.
More generally, stakeholder consultation facilitates decision making processes, as those with a stake in the
project have a say at the initial stages. This helps identifying potential problems that could jeopardize the
feasibility of the project and fosters innovation by obtaining the views of different parties involved. It also
facilitates reaching agreements among stakeholders with different goals and preferences. As it creates a
sense of ownership, it contributes to enhanced involvement with the interventions. Stakeholder
consultations should be understood as a continuous learning process that allow for better design and
delivery of sustainable solutions, especially in those interventions or policies that demand active
participation and acceptance of citizens.
Bear in mind that the relationship with stakeholders may go from informing stakeholders to co-creation
and co-implementation of solutions. Asking the views of stakeholders, commenting on decisions and
collaboratively working on solutions lies between consultation and involvement of stakeholders
(Community Places, 2014; Natural Resources, 2014).
As aforementioned, a toolkit was created to facilitate the design and implementation of stakeholder
consultation in InteGrid project. The design of the consultation involves deciding who should be consulted;
about what they should be consulted; how they should be involved; timing and budget consideration. To
facilitate these decisions, this report will provide four tools, each covered in the respective section: (1) a
stakeholders mapping and identification tool; (2) a suggestion of items for the consultation; (3) a proposal
of methods for stakeholders’ involvement and (4) information about the budget and time involved.
Templates have been created to assist partners to design and implement the consultation processes locally
(following Natural Resources 2014).
To prepare this toolkit different sources have been used. First, other guidelines for stakeholder consultation
compiled by the European Union, the World Bank or regional authorities such as the Scottish government
have been used for inspiration and advice; the websites of the International Association for Public
Participation (IAP2) and VOICE have been invaluable. Second, past research reporting stakeholder
consultations in energy projects (usually with consumers, DSO’s and retailers) (Boork et al., 2014; Gangale
et al., 2013; Geelen et al., 2013; Krishnamurti et al., 2012; Paetz et al., 2012; Park et al., 2014). Third,
examples of stakeholder consultation of energy companies have been revised.

D1.4 Consumer’s Engagement Strategies
InteGrid GA 731218 22 | 94
The proposed design for stakeholder consultation is inspired and intends to honour the pillars for
participation outlined by the IAP2. These are:
Public participation…
• is based on the belief that those who are affected by a decision have a right to be involved in the
decision-making process.
• includes the promise that the public’s contribution will influence the decision.
• promotes sustainable decisions by recognizing and communicating the needs and interests of all
participants, including decision makers.
• seeks out and facilitates the involvement of those potentially affected by or interested in a decision.
• seeks input from participants in designing how they participate.
• provides participants with the information they need to participate in a meaningful way.
• communicates to participants how their input affected the decision.
The toolkit identifies three key decisions: stakeholder mapping, content of consultation, and consultation
methods. Templates have been created to facilitate information collection and dissemination among
partners and to facilitate consultation planning (see Annex 1). Each of the key decisions are explained
below.
Decision 1: Stakeholder mapping
The first decision in the process of design and implementation of stakeholder consultation is to determine
who should be consulted. Given the heterogeneity of stakeholders, this identification must be accompanied
by an assessment of the importance that each of them represents to the project, so that priorities can be
set. Representing this identification and assessment in tools, such as figures or maps, facilitates decision
making.
These steps correspond to the first three phases of the methodology of Stakeholder Circle®, that has been
designed to put stakeholders on the “project management radar”, as this method helps to:
• Identify the project’s stakeholders and understand their needs
• Prioritize the stakeholders
• Visualize the key stakeholders using the Stakeholder Circle®
• Engage with the stakeholders, by building and implementing an effective communication plan
based on the stakeholders’ supportiveness and receptiveness
• Monitor changes over time to analyse the effectiveness of the communication plan
The first three phases of this decision, that are appropriate to conduct in the stakeholder identification are
explained in the following sections.
Step 1: Identify your project’s stakeholders and understand their needs
Before determining appropriate engagement methods and developing communication messages, it is
important to first identify key stakeholders. A stakeholder is any individual, group or organisation affected
by, or able to affect, a proposed project and its implementation. Those individuals or groups depend on a
potential action to fulfil their own goals and on whom, in turn, it depends. Stakeholders can be divided into
D1.4 Consumer’s Engagement Strategies
InteGrid GA 731218 23 | 94
internal stakeholders (e.g. managers and staff) and external stakeholders. External stakeholders are of four
types:
• Economic (e.g. operators, suppliers)
• Social/political (e.g. government agencies, academia)
• Technological (e.g. standards agencies)
• Community (e.g. local residents, non-profit and community-based organisations)
In order to determine stakeholders, a number of tools may be utilized, including brainstorming, mind
mapping, generic stakeholder lists, and reviewing previous similar projects with stakeholder identification
and consultation.
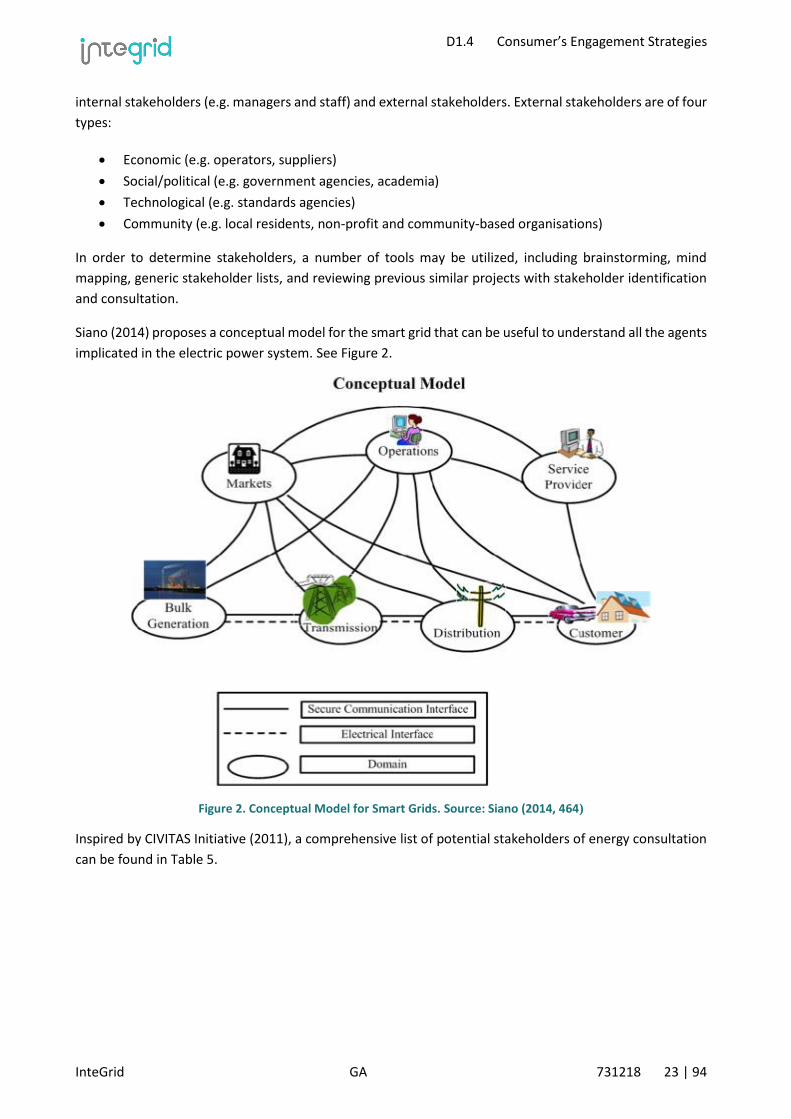
Siano (2014) proposes a conceptual model for the smart grid that can be useful to understand all the agents
implicated in the electric power system. See Figure 2.
Figure 2. Conceptual Model for Smart Grids. Source: Siano (2014, 464)
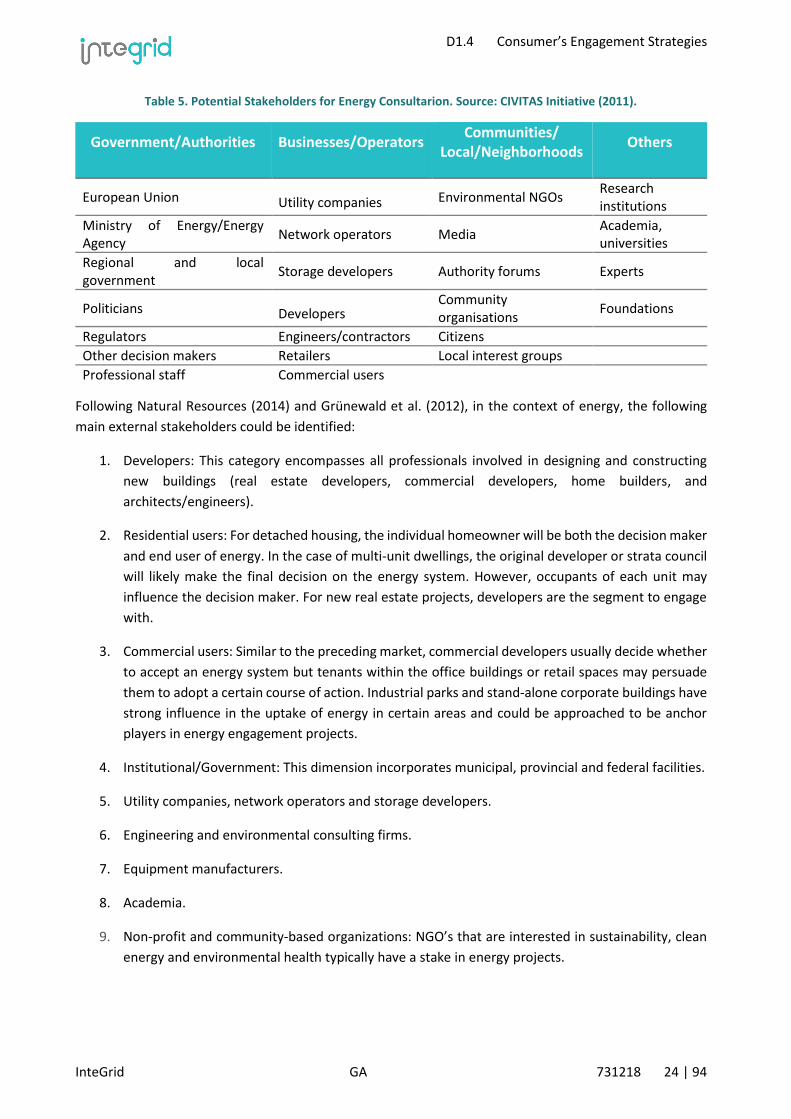
Inspired by CIVITAS Initiative (2011), a comprehensive list of potential stakeholders of energy consultation
can be found in Table 5.
D1.4 Consumer’s Engagement Strategies
InteGrid GA 731218 24 | 94
Table 5. Potential Stakeholders for Energy Consultarion. Source: CIVITAS Initiative (2011).
Government/Authorities Businesses/Operators Communities/
Local/Neighborhoods Others
European Union Utility companies Environmental NGOs Research institutions
Ministry of Energy/Energy Agency
Network operators Media Academia, universities
Regional and local government
Storage developers Authority forums Experts
Politicians Developers Community organisations
Foundations
Regulators Engineers/contractors Citizens
Other decision makers Retailers Local interest groups
Professional staff Commercial users
Following Natural Resources (2014) and Grünewald et al. (2012), in the context of energy, the following
main external stakeholders could be identified:
1. Developers: This category encompasses all professionals involved in designing and constructing
new buildings (real estate developers, commercial developers, home builders, and
architects/engineers).
2. Residential users: For detached housing, the individual homeowner will be both the decision maker
and end user of energy. In the case of multi-unit dwellings, the original developer or strata council
will likely make the final decision on the energy system. However, occupants of each unit may
influence the decision maker. For new real estate projects, developers are the segment to engage
with.
3. Commercial users: Similar to the preceding market, commercial developers usually decide whether
to accept an energy system but tenants within the office buildings or retail spaces may persuade
them to adopt a certain course of action. Industrial parks and stand-alone corporate buildings have
strong influence in the uptake of energy in certain areas and could be approached to be anchor
players in energy engagement projects.
4. Institutional/Government: This dimension incorporates municipal, provincial and federal facilities.
5. Utility companies, network operators and storage developers.
6. Engineering and environmental consulting firms.
7. Equipment manufacturers.
8. Academia.
9. Non-profit and community-based organizations: NGO’s that are interested in sustainability, clean
energy and environmental health typically have a stake in energy projects.
D1.4 Consumer’s Engagement Strategies
InteGrid GA 731218 25 | 94
Step 2: Prioritise the stakeholders
Stakeholder mapping identifies stakeholder power and attention in order to understand political priorities.
In a scenario of scarce resources for attention, communication and negotiation with all groups affected by
a potential action, this prioritization is essential for the allocation of time and efforts between groups. The
degree of mobilization of each stakeholder, as well as their ability to influence, are not independent from
the set of actions or issues to be discussed that are being considered in each situation, so each course of
action or consultation point will require different maps.
There are different models and frameworks that may help to categorise stakeholders. Despite the
differences between them, they also have some common characteristics. They all try to guide the reflection
based on the interest of each group in the action that is being evaluated and its ability to influence, both in
the definition of the action and in its implementation. These models also allow us to build an influence-
interest matrix that categorises stakeholders according to their stake in the consultation point, as well as
their influence. The most important thing is to involve as many stakeholders as possible who can be
considered key players (with high degree of influence and a high stake), while stakeholders with a low level
of influence and a low stake requires minimal effort.
In this toolkit, the methodology of Newcombe (2003) for the design of the power/attention matrix is
adopted. The matrix classifies stakeholders in relation to the power they hold and the extent to which they
are likely to attend actively to a particular issue.
For this purpose, power is the ability of individuals or groups to persuade, induce or force others into
following certain courses of action. Different sources of power must be considered:
● Hierarchy (formal power), e.g. autocratic decision-making, regulation
● Influence (informal power), e.g. charisma, leadership
● Control of strategic resources, e.g. materials, money
● Possession of knowledge or skills, e.g. partners, specialists
● Involvement in action implementation
Stakeholders also vary in the attention they pay to a particular issue. Even powerful stakeholders may not
attend closely to everything. Three factors are particularly important:
● Criticality – how much does it matter to the stakeholder? The extent to which the particular
expectations of a stakeholder may be affected (positively or negatively) by a particular action,
determines its level of interest. Stakeholders can express their interest in a topic through different
mechanisms. An explicit communication indicating its agreement or disagreement with certain
actions, a call to mobilise for or against a plan, or a clear acknowledgment of personal priorities and
the importance of these (whatever the chosen action), enable testing the degree of interest of a
stakeholder.
● Channels – are the communication channels good? If the appropriate communication channels are
not established, the apparent lack of mobilisation of a stakeholder, in the face of a potential action,
may respond more to their lack of knowledge about it than to their indifference. This leads to a risk
D1.4 Consumer’s Engagement Strategies
InteGrid GA 731218 26 | 94
of conflict at a later point in the process, when certain proposals that could have avoided it are no
longer feasible.
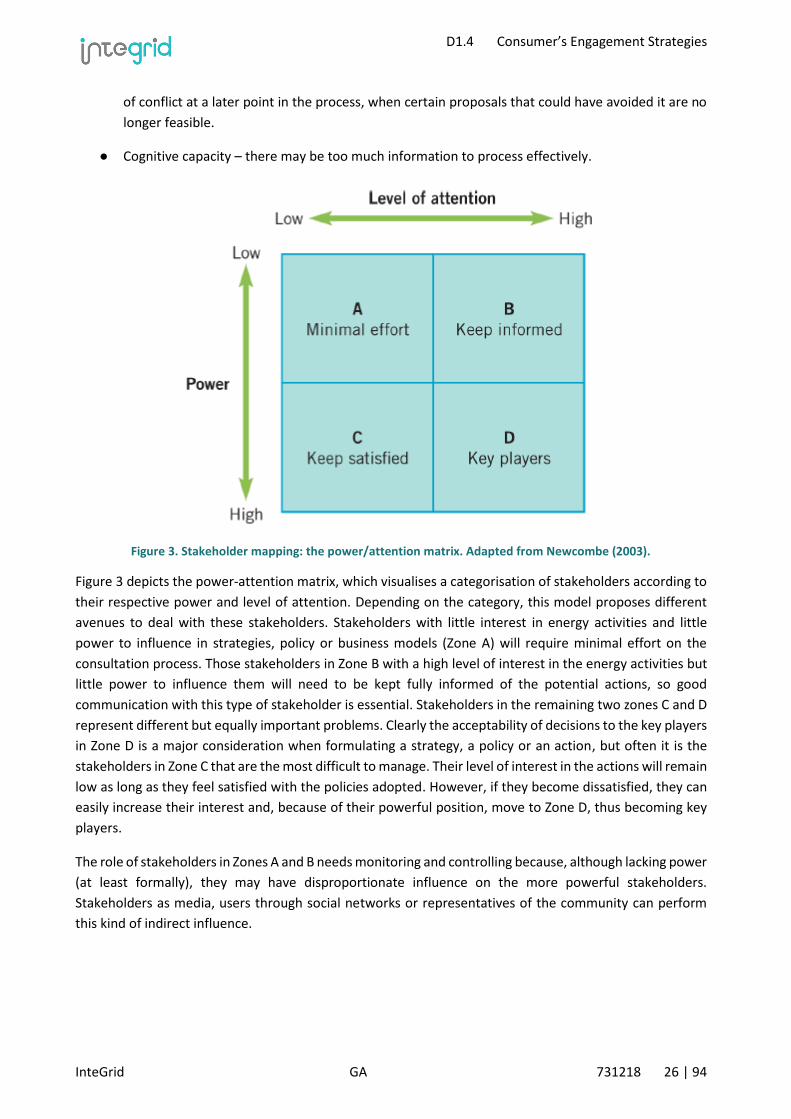
● Cognitive capacity – there may be too much information to process effectively.
Figure 3. Stakeholder mapping: the power/attention matrix. Adapted from Newcombe (2003).
Figure 3 depicts the power-attention matrix, which visualises a categorisation of stakeholders according to
their respective power and level of attention. Depending on the category, this model proposes different
avenues to deal with these stakeholders. Stakeholders with little interest in energy activities and little
power to influence in strategies, policy or business models (Zone A) will require minimal effort on the
consultation process. Those stakeholders in Zone B with a high level of interest in the energy activities but
little power to influence them will need to be kept fully informed of the potential actions, so good
communication with this type of stakeholder is essential. Stakeholders in the remaining two zones C and D
represent different but equally important problems. Clearly the acceptability of decisions to the key players
in Zone D is a major consideration when formulating a strategy, a policy or an action, but often it is the
stakeholders in Zone C that are the most difficult to manage. Their level of interest in the actions will remain
low as long as they feel satisfied with the policies adopted. However, if they become dissatisfied, they can
easily increase their interest and, because of their powerful position, move to Zone D, thus becoming key
players.
The role of stakeholders in Zones A and B needs monitoring and controlling because, although lacking power
(at least formally), they may have disproportionate influence on the more powerful stakeholders.
Stakeholders as media, users through social networks or representatives of the community can perform
this kind of indirect influence.

D1.4 Consumer’s Engagement Strategies
InteGrid GA 731218 27 | 94
Step 3: Visualize the key stakeholders using the Stakeholder Circle®
A ranked list of all the stakeholders would provide a starting point for developing a communication plan.
The Stakeholder Circle® allows to map the top 15 stakeholders into a symbolic circular stakeholder
community, using colour codes, size and placement in the diagram to depict their relative importance. It
shows the relative influence of each stakeholder and offers a visual tool to facilitate decisions about the
amount of effort the project team will allocate when managing the relationship with any given stakeholder.
An example of a stakeholder circle is found in Figure 4.
The overall size (or area) of a stakeholder’s segment gives an indication of the overall influence of that
stakeholder on the project. The power of a stakeholder is represented by the radial depth of the segment.
The importance and degree of influence of the stakeholder is represented by the relative size of the
segment measured on the outer circumference. Power and proximity values interact on the same
dimension.
Colour coding is essential to interpreting the nature and structure of the stakeholder community: senior
managers (upwards) are coded orange; external stakeholders (outwards), blue; the project team
(downwards), green; the project manager’s peers, purple. The relationships are summarised by showing
each stakeholder’s priority number, direction of influence and the nature of their relationship with the
project (Bourne, 2006).
Figure 4. The Stakeholder Circle for stakeholder visualization. Source: https://stakeholder-management.com/.
Categorisation and charting of key stakeholders holds the key to targeting the right stakeholders at the right
time in the life of the project and providing them with the right level of engagement, information and
communication.
Decision 2: Consultation content
The second decision of the design involves defining the items stakeholders will be consulted about. To
design this stage, reflection about the role of each stakeholder in the process of adoption and
D1.4 Consumer’s Engagement Strategies
InteGrid GA 731218 28 | 94
implementation of the desired change is the first task. On the basis of this reflection, items to consult about
can be proposed for each stakeholder.
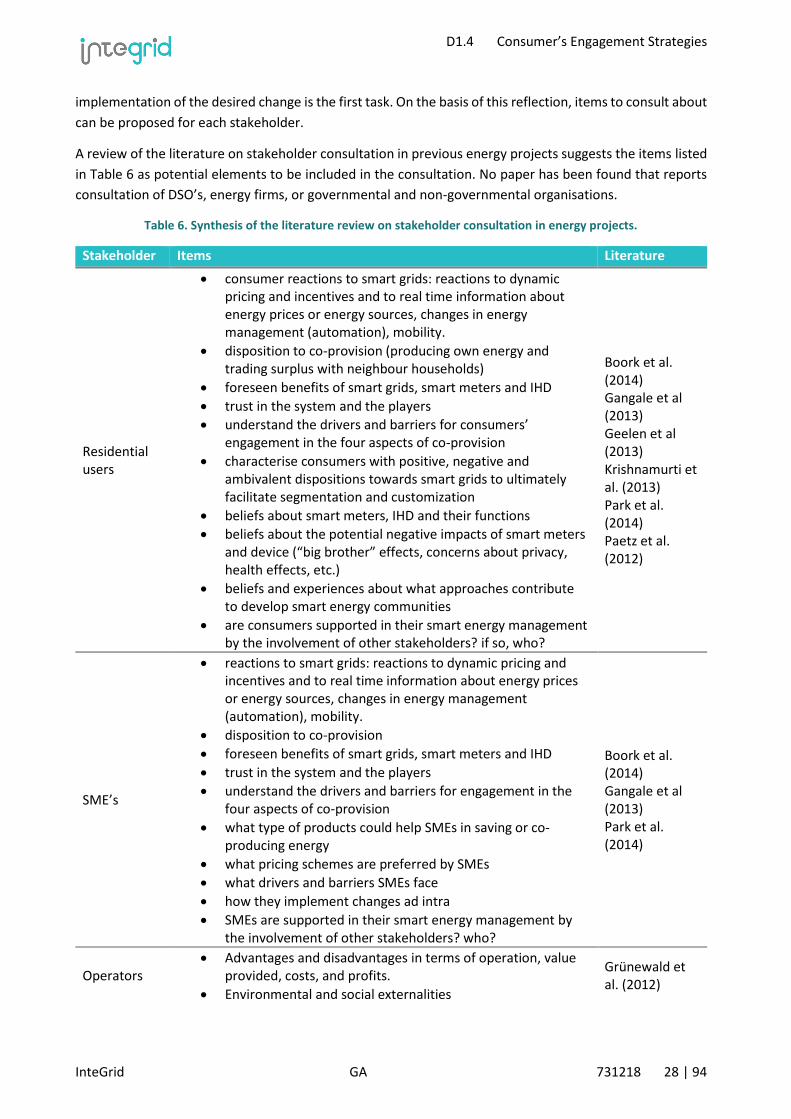
A review of the literature on stakeholder consultation in previous energy projects suggests the items listed
in Table 6 as potential elements to be included in the consultation. No paper has been found that reports
consultation of DSO’s, energy firms, or governmental and non-governmental organisations.
Table 6. Synthesis of the literature review on stakeholder consultation in energy projects.
Stakeholder Items Literature
Residential users
• consumer reactions to smart grids: reactions to dynamic pricing and incentives and to real time information about energy prices or energy sources, changes in energy management (automation), mobility.
• disposition to co-provision (producing own energy and trading surplus with neighbour households)
• foreseen benefits of smart grids, smart meters and IHD
• trust in the system and the players
• understand the drivers and barriers for consumers’ engagement in the four aspects of co-provision
• characterise consumers with positive, negative and ambivalent dispositions towards smart grids to ultimately facilitate segmentation and customization
• beliefs about smart meters, IHD and their functions
• beliefs about the potential negative impacts of smart meters and device (“big brother” effects, concerns about privacy, health effects, etc.)
• beliefs and experiences about what approaches contribute to develop smart energy communities
• are consumers supported in their smart energy management by the involvement of other stakeholders? if so, who?
Boork et al. (2014) Gangale et al (2013) Geelen et al (2013) Krishnamurti et al. (2013) Park et al. (2014) Paetz et al. (2012)
SME’s
• reactions to smart grids: reactions to dynamic pricing and incentives and to real time information about energy prices or energy sources, changes in energy management (automation), mobility.
• disposition to co-provision
• foreseen benefits of smart grids, smart meters and IHD
• trust in the system and the players
• understand the drivers and barriers for engagement in the four aspects of co-provision
• what type of products could help SMEs in saving or co-producing energy
• what pricing schemes are preferred by SMEs
• what drivers and barriers SMEs face
• how they implement changes ad intra
• SMEs are supported in their smart energy management by the involvement of other stakeholders? who?
Boork et al. (2014) Gangale et al (2013) Park et al. (2014)
Operators
• Advantages and disadvantages in terms of operation, value provided, costs, and profits.
• Environmental and social externalities
Grünewald et al. (2012)
D1.4 Consumer’s Engagement Strategies
InteGrid GA 731218 29 | 94
Decision 3: Consultation Methods
There are different methods that can be used to involve stakeholders in the planning or evaluation process
(Community Places 2014; Natural Resources 2014). Here four of these methods are described:
• Surveys
• In-depth interviews
• Workshops
• Web-based engagement
Surveys are widely used in stakeholder consultations as they allow collecting homogeneous data from large
samples in short time. In particular online surveys are easy to distribute and very affordable, although they
usually attain low responses rates and are inadequate to reach the digital illiterate. Bear in mind that if you
need a sample of 200 you will have to contact a population of 2000 to obtain the sample, as responses rates
are as low as 10%. Online surveys can be supplemented with pen-and-pencil questionnaires to reach other
segments of population.
In-depth interviews are adequate for establishing a real dialogue with stakeholders, eliciting their opinions
about the intervention. Also, they may avoid the problem of the desirability bias that may arise in
workshops: as informants feel more anonymity and privacy they speak more freely about certain matters
than in focus groups. Focus groups are similar but a group of 8-10 people is invited to discuss together an
issue.
Workshops are usually carried out in groups of 6-10 people. Workshops can be done for each type of
stakeholder or alternatively, a single workshop with representatives of different stakeholders can be held.
In web based engagement participants are prompted with questions, vignettes or photos to initiate a
discussion using dedicated blogs, forums, websites, or social media pages. This technique is especially
suitable for consultation of geographically scattered stakeholders that cannot be gathered in focus groups
or workshops.
Other techniques that can be used to energise and stimulate discussion and innovation in the context of
workshops are listed here (Community Places 2014):
● Photography: Disposable cameras can be given to selected stakeholders so that they may capture
their likes and dislikes in an area. The results can be exhibited to generate further discussion or to
promote additional events.
● Image elicitation: Participants are asked to choose images that reflect the main drivers and barriers
with the project or that capture their overall evaluation. Images are then posted in a college to
stimulate collective discussion.
● Vox Pox: Short, interviews with representatives of stakeholders at different times. Like photographs
the results can be shown to other participants and used to prompt discussion.
● Maps and photographs of neighbourhood or houses: Can be used to illustrate how people can
manage energy in their area; what they like or dislike, or improvements they would like to see in
order to save more energy. Ideas are generated in small group discussions and recorded on post-it

D1.4 Consumer’s Engagement Strategies
InteGrid GA 731218 30 | 94
notes or pre-prepared cards. Collage building with these post-its helps explore key issues, build
consensus and identify potential solutions and problems.
3.2. Stakeholder Consultation Design
To integrate stakeholder consultation within InteGrid two different consultation methods were used: (1)
stakeholder consultation workshops and (2) a survey.
The aims of the stakeholder consultation workshops were two-folded, addressing different stakeholder
groups. Workshops in Sweden and Portugal aimed at co-creating design with users. These workshops
covered two different topics: (I) development of energy feedback and (II) stakeholders’ preferences for
energy storage business models. While these workshops addressed residential users, the workshop in
Slovenia focused on employees’ energy behaviour and the identification of action points through occupant
participation. More detailed information on workshop objectives and methods used to obtain the
objectives are presented in the following section of this report.
The survey was part of LocalLife and aimed at (a) understanding the status quo of residents’ energy
behaviour; (b) the status quo of social sustainability in the neighbourhood and (c) the influencing factors
for energy behaviour and behaviour change, with specific regard to the influence of social factors to
examine the connection between ecological and social sustainability. Findings from the results will be used
for improving the design of LocalLife, e.g. to analyse if individual versus group level feedback can be
assumed to achieve better results. A telephone survey was used for this. Telephone surveys combine some
of the advantages of the above mentioned online surveys and interviews: with standardised questions and
conducted via telephone they are more economic than in-depth personal interviews and can therefore
create bigger sample sizes. At the same time, the more personal approach increases the response rates
compared to online surveys. The methodology of the survey is described in detail in 3.2.2.
3.2.1. Stakeholder Consultation Workshops (SCW)
3.2.1.1. SCW on Energy Feedback
In this consultation workshop, a visual prototype of an energy feedback functionality as part of the social
network application LocalLife was tested in focus groups, with people who are representative of the target
users. The workshop was designed to examine participants’ understanding of feedback about their
household energy use and how this feedback can motivate them to change their behaviour, towards
achieving energy conservation and load-shifting.
Objectives
The general objective of the workshop was
• To assess how residents understand, relate to and are motivated by feedback on household
energy use and local community social sustainability, when it is given to them as part of a social
network with different aggregation levels.

D1.4 Consumer’s Engagement Strategies
InteGrid GA 731218 31 | 94
The theoretical assumption behind this is that feedback on household electricity consumption provided in
a frequently used context and containing social elements is more effective than the energy feedback
provided by energy companies in a traditional way.
More specifically, the workshop aimed to answer the following questions:
• How should the feedback of household electricity use in the social network application be
designed in a way that makes it comprehensible, motivating and engaging?
• What social aggregation level is most relevant and/or motivating?
The considered aggregation levels are apartment level, housing cooperation or building level, and
neighbourhood level.
Figure 5. Example of feedback screen used in the energy feedback consultation workshop.
Design
The workshop was set up as a stepwise information process with moderated group discussions centered
around different aspects of the energy feedback. An example of one of the prototype screens used in the
workshop is found in Figure 5Figure 5. Example of feedback screen used in the energy feedback consultation
workshop.. The first step revealed the participants’ immediate reactions and spontaneous understanding
of the information on the feedback screen, as they are asked to interpret it without any prior explanation.
Then followed an explanation of the various features on the screen and the discussion about the design
continued. The participants were asked to share their impressions and thoughts on the following aspects
of the energy feedback screens:
• Spontaneous interpretation and understanding
D1.4 Consumer’s Engagement Strategies
InteGrid GA 731218 32 | 94
• Influence of explanation on understanding
• Relevance of the information in helping to achieve goals
• Relevance of motivational features in helping to achieve goals
• Clarifications and other suggested changes
There were four focus groups of which half discussed a prototype with feedback given on an apartment
level, i.e. individual household feedback, while the other two discussed feedback given on a building and
neighbourhood level, i.e. collective feedback. By comparing the outcome of the different group discussions,
the workshop also provided insights on:
• Significance of aggregation level
Participants of the workshop were divided into groups of 4-6 people and the discussions were moderated
by a member of the KTH team. The group discussions were recorded by voice recorder for later analysis.
3.2.1.2. SCW on Energy Storage
Objectives
The aim of this workshop was to engage consumers at an early stage of the development of energy storage
projects in order to understand their preferences on different business models (Burlinson & Giulietti 2017).
Consumers’ perceptions and related actions will be crucial for the question which business models for
energy storage will prevail in the long run; as Burlinson & Giulietti (2017) in their presentation on business
models conclude: “it is essential to identify the target customers in energy storage business models (e.g
generators, network operators, households etc.) and evaluate whether the business model can deliver
something that is valued by such customers (e.g. flexibility, aggregation, affordability).
The workshop focused on household consumers and their role with respect to innovative concepts of
energy storage in apartment buildings. A key issue in this regard is the different roles assigned to consumers
in the business models – ranging from the (currently) mostly passive user of energy to an active prosumer
role, engaging in energy production, consumption and distribution. Previous studies indicate that
consumers’ attitudes towards energy storage models seem to be overall positive (Romanach at al. 2013),
and recent findings from research projects on energy storage in the UK indicate overall acceptance of the
new technologies. The willingness to share energy storage facilities might be related to an overall
willingness to share. Findings on the motivations behind the attitudes suggest that these might differ
between countries, e.g. based on different attitudes towards sharing concepts in more general terms, which
in turn are supposedly related to different level of individualism versus collectivism (Hofstede 2001). To
examine cross-country differences the workshop was conducted both in Sweden and Portugal, with Sweden
representing rather high levels of individualism compared to Portugal (Index Sweden: 71; Index Portugal:
27).
A key challenge on early consumer engagement is that consumers show low levels of awareness of the new
technologies (Achterberg et al. 2010; Zachariah-Wolff & Hemmes, 2006). This results in difficulties to derive
meaningful responses with regard to consumers’ perceptions, e.g. the problem of “pseudo opinions” and
“non-attitudes” (de Best-Waldhober et al., 2009). As mentioned in the guidelines on consumer engagement
from the IAP2 presented earlier in this report, a precondition is therefore that “public participation provides
participants with the information they need to participate in a meaningful way”. To achieve this goal, we
D1.4 Consumer’s Engagement Strategies
InteGrid GA 731218 33 | 94
used storytelling for the presentation of the technology. Storytelling was recently discussed as an innovative
methodology approach in energy research (Moezzi et al. 2017). Previous approaches focus first on existing
stories and narratives as a form of data, and secondly on storytelling as a process to facilitate stakeholder
engagement1. Our approach instead combines the previously separated two approaches; storytelling as a
process to improve participation, but also as a method of simultaneous data collection, to gain a deeper
understanding of consumers’ perception of new energy storage technologies. A detailed description of the
workshop methodology is given below.
Design
The workshop consisted of “three acts”. The main storyline used was to ask participants to imagine that
they had just recently bought a new apartment – still under construction – which uses innovative energy
solutions and that their input is needed on their preferences during the construction phase.
In Part 1 of the workshop they were asked to individually specify their preferences for the energy storage
in their new apartment buildings. To facilitate this task, a morphological table (Pereverza et al., 2017) was
used with five criteria and these criteria were presented one at a time, including two options for each
criterion that participants could choose between. The following five criteria were included:
(1) Place of battery: common battery in cellar vs. individual battery in apartment;
(2) Financing of battery: buy vs. rent;
(3) Management of battery: local energy supplier vs. self-management;
(4) Electric vehicles: bi-directional charging vs. no inclusion of EVs in the storage system;
(5) Sharing: sharing energy vs. use of individual production/storage.
A short overview on advantages and disadvantages of the two options were given to provide participants
with relevant information while trying to keep the information balanced. The overview is found in Table 7.
Table 7. Advantages and disadvantages of options presented to the participants in the energy storage consultation workshop.
Criteria Specifications
(1) Place of battery: common
battery in cellar vs. individual
battery in apartment
Common battery
+ financial risks are lower; takes
up no place in flat
- less control over purchase and
installation
Own battery
+ greater control
- takes place in apartment;
(low) potential health risk;
access to apartment needed
for maintenance
(2) Financing of battery: buy vs.
rent
Renting
+ no initial investment
- higher costs in the long run
Buying
+ cheaper in the long-run
- major investment at the
beginning; pay back isn’t sure
1 See e.g. https://www.smartgrid-engagement-toolkit.eu/fileadmin/s3ctoolkit/user/guidelines/TOOL_MONITORING_AND_EVALUATION_THROUGH_STORIES_-_MOST_SIGNIFICANT_CHANGE.pdf
D1.4 Consumer’s Engagement Strategies
InteGrid GA 731218 34 | 94
(3) Management of battery:
local energy supplier vs. self-
management
Local energy company
+ no time investment
- no control over use of energy;
distribution might not be
optimized for your own needs
Self-management via App
+ save energy based on own
needs; earn money when
selling energy
- need to invest tie; functions
could be complex
(4) Electric vehicles: bi-
directional charging vs. no
inclusion of EV’s in the storage
system
Bi-directional charging
+ lower costs; increased capacity
- cars might be discharged when
needed; transportation system
might change and less cars are
needed for transport
No EV’s included
+ cars will also be charged
- higher costs because more
batteries in the house are
needed
(5) Sharing:2 sharing energy vs.
use of individual
production/storage
Sharing
+ more flexibility as stored
electricity will be available to
everyone
- first come, first served: energy
might be used up
Individual use
+ fair use
- total costs increase because
not all energy is used
After all criteria were presented, participants were given another few minutes to reflect on their choices
and changes answers now that they knew all options.
Part 2 of the workshop was a focus group discussion regarding criteria choices. To facilitate discussions,
participants were first asked to “move into” one of two houses with the two houses representing opposite
combinations of the five criteria.
House 1 represented a Prosumer-Sharing solution including
(1) a common battery,
(2) renting the battery,
(3) self-management,
(4) EVs not included and
(5) sharing of energy
House 2 represented a Comfort-Independence option, including
(1) an own battery in each apartment,
(2) buying the battery,
(3) local energy company managing the system,
(4) EV’s as a part of the system and
2 In Sweden many participants interpreted the sharing also with relation to costs: They assumed that a shared concept would include a flat rate for energy use.
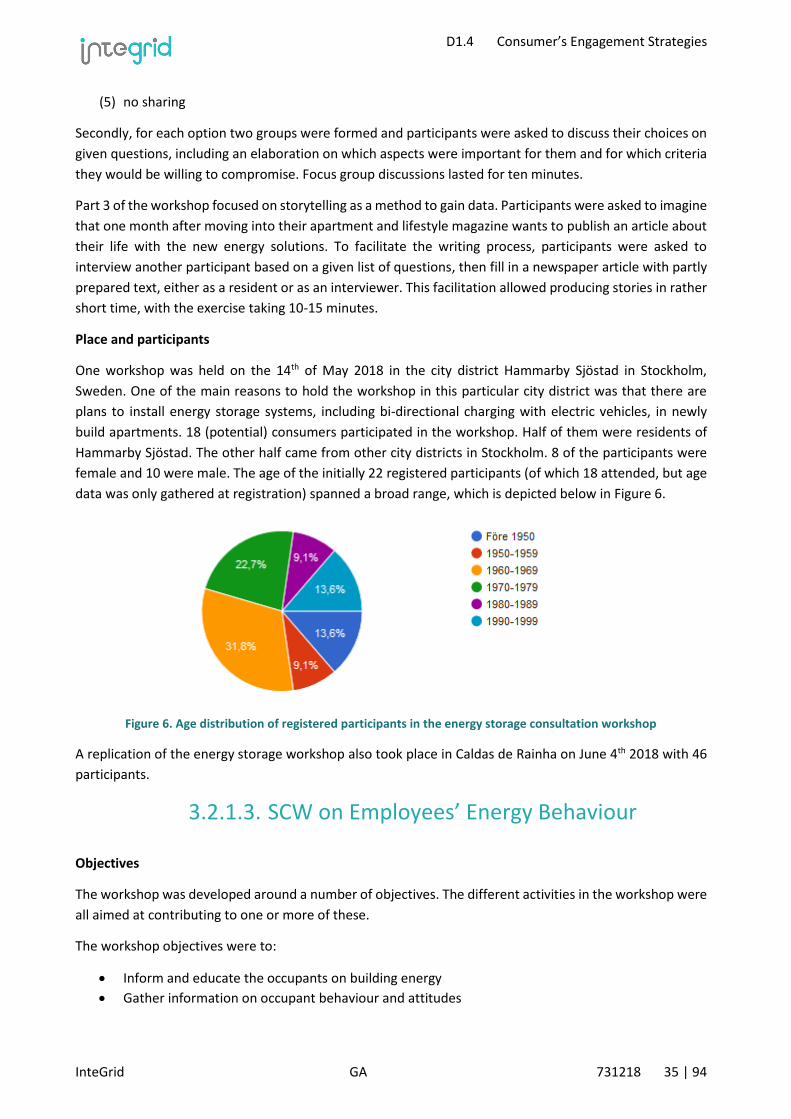
D1.4 Consumer’s Engagement Strategies
InteGrid GA 731218 35 | 94
(5) no sharing
Secondly, for each option two groups were formed and participants were asked to discuss their choices on
given questions, including an elaboration on which aspects were important for them and for which criteria
they would be willing to compromise. Focus group discussions lasted for ten minutes.
Part 3 of the workshop focused on storytelling as a method to gain data. Participants were asked to imagine
that one month after moving into their apartment and lifestyle magazine wants to publish an article about
their life with the new energy solutions. To facilitate the writing process, participants were asked to
interview another participant based on a given list of questions, then fill in a newspaper article with partly
prepared text, either as a resident or as an interviewer. This facilitation allowed producing stories in rather
short time, with the exercise taking 10-15 minutes.
Place and participants
One workshop was held on the 14th of May 2018 in the city district Hammarby Sjöstad in Stockholm,
Sweden. One of the main reasons to hold the workshop in this particular city district was that there are
plans to install energy storage systems, including bi-directional charging with electric vehicles, in newly
build apartments. 18 (potential) consumers participated in the workshop. Half of them were residents of
Hammarby Sjöstad. The other half came from other city districts in Stockholm. 8 of the participants were
female and 10 were male. The age of the initially 22 registered participants (of which 18 attended, but age
data was only gathered at registration) spanned a broad range, which is depicted below in Figure 6.
Figure 6. Age distribution of registered participants in the energy storage consultation workshop
A replication of the energy storage workshop also took place in Caldas de Rainha on June 4th 2018 with 46
participants.
3.2.1.3. SCW on Employees’ Energy Behaviour
Objectives
The workshop was developed around a number of objectives. The different activities in the workshop were
all aimed at contributing to one or more of these.
The workshop objectives were to:
• Inform and educate the occupants on building energy
• Gather information on occupant behaviour and attitudes
D1.4 Consumer’s Engagement Strategies
InteGrid GA 731218 36 | 94
• Identify action points through occupant participation
• Build approval and motivation for the program among occupants
The design of the workshop is freely based on user/employee awareness advice found in the publication
Creating an awareness campaign3.
Design
Informing and educating the occupants creates a common knowledge and understanding of the building
energy situation. This is beneficial for the participative parts of the workshop as it puts all participants on
an equal knowledge level, contributing to equal influence in the discussions. The theoretical background of
the test case and the occupant behaviour program shows the occupants why they are asked to contribute
and hence supports acceptance and motivation. To fulfil this objective the workshop began with an
introduction of the InteGrid project and the theoretical background of grid flexibility and occupant
behaviour demand response. The specific energy profiles of the Elektro Ljublijana office buildings were
shared and the influence of the respective plug-loads were explained.
The next objective of the workshop was to gather information about the occupants’ working hours, the
existing plug-loads in the building and the occupants’ interactions with them. This information is important
input in the development of the action plan, since it provides a list of appliances, flexibility time frames and
the starting point occupant behaviours. Asking questions forces occupants to reflect on their plug-load
interactions and creates awareness. In this part of the workshop, participants were asked to list the plug-
loads in their office and to report how and when they interact with them. The occupants were also asked
to report their typical office hours, including breaks. This was done individually aided by a written survey
during the workshop.
The most central purpose of the workshop was to facilitate a participative, bottom-up process for
developing the building occupant behaviour program. Involving the occupants in the creation of the
program and taking their opinions and concerns into consideration early on is a way of building acceptance
and motivation. It also raises the quality of the program and gives it a better chance of succeeding since the
suggested actions can be refined to better align with the reality of the occupants. In the workshop, the
occupants were divided into smaller groups and tasked with setting up action points for building flexibility
and conservation. The suggested actions were then discussed, with all participants, in terms of ease of
implementation and how they would affect the occupants’ work environment. The occupants were also
asked to give their advice on the timing, responsibilities and any practical requirements needed to follow
the program.
The objective of building approval of the program permeated each stage of the workshop. The leader of
the workshop was advised to listen and take note of all suggestions and concerns that are raised by the
occupants. It was also discussed what the occupants might need in terms of motivational reminders and
awards that could contribute to a successful implementation of the occupant behaviour program.
3 The Carbon Trust, Creating an Awareness Campaign, [PDF guide], 2013, https://www.carbontrust.com/home/
D1.4 Consumer’s Engagement Strategies
InteGrid GA 731218 37 | 94
3.2.2. Survey Design
To measure environmental awareness and selected aspects of social sustainability, questionnaires were
used. This questionnaire, carried out at the time of the introduction of our proposed social network
LocalLife in a neighbourhood, provides the baseline against which changes can be traced with the aid of
follow-up questionnaires.
3.2.2.1. Method Sweden
A Swedish version of the baseline questionnaire (see Annex II) was conducted in Stockholm Royal Seaport
(SRS), one of LocalLife’s pilot neighbourhoods, during April and May 2018. The data collection was done
using phone interviews by the marketing research company Novus. Novus conducted 300 phone interviews
with SRS residents who were randomly chosen from the overall population. 33 participants were existing
LocalLife users since around 1-3 months back. However, as LocalLife hasn’t yet gone beyond registration
and first information we did not expect to find an influence of LocalLife on the social sustainability
parameters but rather consider this as a baseline measurement The energy attitudes are assumed to be
unchanged since no energy feedback existed in LocalLife at that point of time. The participants were
informed that the survey was conducted by the Royal Institute of Technology (Kungliga Tekniska Högskolan,
KTH) to gain understanding of the social context in their neighbourhood, to prepare for energy technology
interventions.
The survey contained several sub-groups of questions dedicated to the different constructs measured. To
align the structure of this method section with the results section below, the following scales are described
in a slightly different order, by construct rather than timeline.
At the beginning of the survey, three questions assessed the participants’ living situation: What kind of
household they live in (apartment, row house, separate house, student room or other), the ownership the
building they live in (housing cooperation, rented, self-owned, other) and their personal ownership of the
apartment/house they live in (own, rent, rent second/third hand, lodger, other). The answers to these
questions were used by the interviewer in all following questions to replace generic terms such as “your
building”/”your neighborhood” with the actual names of the individual participants building and
neighborhood to make the questions more relatable and relevant for the participants.
The constructs measured as influencing factors of energy saving behaviour were based on the Theory of
Planned Behaviour (Ajzen, 1991; Fishbein & Ajzen, 2010). The scales to measure the additional constructs
relating to social identity theory were based on those used by Fielding and Colleagues (2008), who studied
the influence of TPB variables and social identity on sustainable agricultural practices. Items were adapted
for the context of energy saving behaviour. This was to extend comparability of our results with previous
work on the connection between social identity and sustainable behaviour.
The general attitude towards saving energy in one’s household was therefore measured using six semantic
differentials. Participants rated each of the statements “I feel that saving energy at my household is good
(…is wise/beneficial/pleasant/satisfying/favourable)” on a seven-point scale (e.g. from 1= extremely bad to
7 = extremely good).
D1.4 Consumer’s Engagement Strategies
InteGrid GA 731218 38 | 94
To measure perceived behavioural control, one of the central influencing factors in the Theory of Planned
Behaviour, we asked how much control participants have over saving energy at their household (1= very
little to 7 = a great deal), if saving energy is easy for them (1 = very difficult / 7 = very easy) and to rate their
knowledge about possible ways to save energy (1 = very low / 7 = very high). We only used three of the five
items from Fielding et al. (2008) for this construct, to limit the overall length of the survey. For past
behaviour, participants indicated how much effort and how much time and labour, respectively, they have
been putting into saving energy (both 1 = none at all to 7 = a lot).
Behaviour at the present time and behavioural intention were each measured with one item each, asking
to what extent participants were saving energy at the time of the survey and to what extent they planned
to do so in the next six month, both on a scale from 1 = not at all, to 7 = a lot. To gain a more detailed
understanding of the status quo of energy saving behaviour, we also added some further questions to
measure specific energy saving behaviours. These were taken from the 2016 version of a yearly citizen
survey “Du och din miljö” (You and your environment) conducted by Stockholm Municipality (obtained by
personal correspondence). Items unrelated to apartments were removed. The original binary scale (yes/no)
was replaced with a categorical (often/sometimes/never) to provide more nuance to the responses. Items
inquired about participants’ purchase of environmentally certified electricity, actions done in the past to
save energy for their household (first spontaneous and then aided) (see the results section for the full list)
and actions already mentioned spontaneously were skipped.
The survey also contained a question to assess the willingness of the participants for load shifting. As this
concept might not be familiar for all participants, we used a form of vignette: Participants were asked to
assume that they own a washing machine and usually wash clothes during the afternoon when the
electricity consumption is high in the area they live in. The interviewer then asked if they would instead
wash their clothes during the night if they knew that a) it would save money due to cheaper electricity
prices and b) it would be good for the environment due to less polluting electricity production. Answers
were given on a scale from 1 = extremely unlikely to 7 = extremely likely.
As one potential influencing factor for energy saving behaviours, we assessed different forms of social
influence: both the influence exerted by the broader group of important others and also of relevant
reference groups (e.g. Terry & Hogg, 1996; Terry et al., 1999). In the context of this study, the inhabitants
of a participants building were seen as a relevant reference pool for energy saving behaviour. We also
included the broader group of inhabitants of their neighbourhood, in case a lot of participants lived alone
in their building and therefore did not have a reference group on the building level. Hence, social influence
was measured for each of this groups separately. For the subjective social norms with regard to important
others, participants were asked if people important to them would approve of them saving energy, would
think saving energy would be desirable, and would think that they should save energy. To measure the
perceived group norms of people living in their building, the interviewer asked how many people in the
participants’ building would think that saving energy was a good thing, how likely it was that the other
people in the building saved energy, and how much agreement there is among the inhabitants of the
building that saving energy is a good thing. The items for the perceived group norms of the neighbourhood
were identical, with the name of the neighbourhood replacing the name of the building. All answers were
given on seven-point Likert scales (e.g. from 1 = disapprove to 7 = approve or from 1 = very few to 7 = most).
Again, these items were adapted from Fielding et al. (2008) for our context but shortened to three instead
of five items per group.
D1.4 Consumer’s Engagement Strategies
InteGrid GA 731218 39 | 94
Next, group identification with both the building and the neighbourhood participants lived in were assessed
with four items each. This scale was a shortened adaptation of Hogg and Hains’ (1996) group relations
questionnaire, also used by Fielding et al. (2008). Participants rated how important the people in their
building/neighbourhood are to them (from 1 = not important at all to 7 = very important), how much they
identify with them (1 = not at all / 7 = very much), how strong the ties to them are (1 = very weak ties / 7 =
very strong ties) and to what extent they see themselves as belonging to the people of their
building/neighbourhood (1 = not all at / 7 = very much).
As the concept of the neighbourhood as a social network is central to LocalLife, and in order to assess the
status quo of social sustainability, we included several items and scales to measure constructs related to
this more in detail. These were adaptations from a survey conducted by Eriksson (2010; based on several
other instruments, see e.g. Onyx and Bullen, 2001; Narayan and Cassidy, 2001) on building environment
and health. First, we included a scale of six items the perceived trust and safety participants experience in
their building and neighbourhood (Eriksson, 2010). The interviewer asked if the participant felt they can
trust people in general, in their building and in their neighbourhood, respectively, and if they feel safe in
their building and in their neighbourhood (all answers on a scale from 1 = not all at to 7 = yes, completely).
These questions were rephrased to fit the context of our study and the answering format changed to a
seven-point scale to make it more consistent with previous scales of our survey and thus easier to
understand for the participants.
To measure the social bonds that participants experience in their neighbourhood, they were asked how
common it is for neighbours at the place the participant lives to talk to each other when they meet (1 = not
common all at / 7 = very common). Like the items above, this was an adaption from Eriksson (2010) where
we changed the answering format to a seven-point scale. We also added two scales and two single item
measurements from the same survey to further assess this construct. The first scale contained five
statements describing the social bonds in the participants living area, e.g. “Where I live, you take
responsibility for each other’s children”, which were rated on a three-point scale (1 = too much / 2 =
moderate / 3 = too little). The second scale assessed the social network of the participants by asking if they
have a good social relationship with their family, relatives, friends, neighbours and peers, respectively (with
a yes/no/not applicable scale). Finally, participants were asked how many of their neighbours they thought
know where they live (in categories from 1 = none to 6 = more than 15) and how often they hang out with
any of their neighbours (from 1 = daily/almost daily to 5 = never).
Another construct regarding the social aspects of the participants neighbourhood that we measured was
the place attachment participants felt regarding their neighbourhood. Place attachment is defined as “the
bond between people and places” by Kudryavtsevet al. (2012, p. 2). We adapted a scale from the same
authors which originally measured place attachment to the Bronx, by inserting the name of our participants
neighbourhood in the eight items of the scale. Three of these Items were reversed, e.g. “there are better
places to be than my neighbourhood”; all items were rated on a scale from 1 = I completely disagree to 7 =
I completely agree. As with previous items, we changed the answering options from a five- to a seven-point-
scale for consistency reasons.
As a final construct regarding the social sustainability of our participants neighbourhood, we measured to
what extent they participated in a sharing economy. To this end, we adapted a scale from the previously
mentioned “Du och din miljö” survey from its original “yes/no” scale to a version where participants were
asked if they had “borrowed from their neighbours / lent to their neighbours / used a pool to share with
D1.4 Consumer’s Engagement Strategies
InteGrid GA 731218 40 | 94
their neighbours” a number of different items (clothes, toys, tools, home appliances,
computer/tablet/mobiles, tv/video/dvd/stereos, bicycles, cars/other motor vehicles).
At the end of the survey, participants were asked some demographic questions regarding year of birth, age,
education and occupation, and country of birth. This section also included some questions about the
household the participants lived in, such as the number and age of people living in the same household, the
size of their apartment or house and if they felt they could live comfortably on their current household
income. These were mainly adapted from Eriksson’s (2010) study as well. Finally, participants were given
some information about LocalLife and directed to the projects homepage if they expressed interest to learn
more about it.
3.2.2.2. Method Portugal
A shortened version of the questionnaire used in Sweden was conducted in Caldas da Rainha from 19th
March until 30st March, 2018. The data collection was done via intercept interviews by a team from EDP
Distribuição. All in all, 65 interviews were conducted. Each interview took about 15 to 20 minutes.
The questionnaire was a shortened and translated version of the Swedish survey described above. Most of
the answering formats were altered to a ten-point scale to attune them to the cultural frame of evaluation
widely used in Portugal; some were adapted to better fit the circumstances in Portugal, for example
regarding the most common living arrangements. The goal of these changes was to test a more user-friendly
version of the questionnaire in terms of length and complexity. Again, the following measurements are
described by construct rather than the exact timeline of the interview.
First, participants were asked where they live (house, semi-detached house, apartment) and whether they
own or rent that space. The general attitude towards saving energy in one’s household was measured with
one item, asking “Do you feel that saving energy at your household is….” (from 1 = very bad to 10 = very
good). To measure behavioral control, we asked how much control participants felt they have over saving
energy at their household (1= very little to 10 = a great deal).
Current energy saving behavior was measured by two items asking if the participants currently save energy
at their household (1 = very little to 10 = too much) and how much effort they put into doing so (1= very
little to 10 = a great deal). Behavioral intention was measured by asking participants if they plan to save
energy in their household in the next 6 months (1 = I completely agree to 10 = I completely disagree). Load
shifting was assessed using the same example and two questions as in the Swedish survey on a scale from
1 = extremely unlikely to 10 = extremely likely.
To gain a more detailed understanding of the energy saving behavior of the participants, we also asked if
the household they live in has an energy certification (yes/no/I don’t know) and with which frequency they
take actions to save energy in their household (never/occasionally/frequently). Afterwards, the interviewer
read the participants a list of seven energy saving behaviors and asked if the participant had performed this
action in the past to save energy (turn off unneeded lights, buy efficient home appliances, turn off TV
instead of standby, add insulation, lower indoor temperature, use less hot water, adjust temperature in
fridge/freezer).
To measure subjective social norms and group norms, participants were asked if they think people
important to them think that they should save energy (1 = should not to 10 = should). As the participants’
D1.4 Consumer’s Engagement Strategies
InteGrid GA 731218 41 | 94
neighborhood was identified as the most relevant reference group for energy saving behavior in this
sample, we also asked if the participants believe that their neighbours save energy (1 = extremely unlikely
to 10= extremely likely).
Group identification in this sample was assessed with a single-item-measurement asking how the
participants describe the relationship to their neighbors (1 = extremely unlikely to 10= extremely likely). The
items measuring trust (both general and in participants neighbors) and perceived safety were the same as
described in the Swedish sample, but with a ten-point scale.
The items measuring social bonds were again mostly the same as in the previous survey, with the answering
format to the question “Is it common for people at the place where you live to talk to each other when they
meet” adapted to a ten-point scale (1 = not common at all / 10 = very common). In the questions regarding
the social relationships with family, friends etc., the category “relatives” was excluded for translation
reasons and the additional answering option of “not presently” was added. Place attachment was assessed
with a shortened version of the scale described in the Swedish sample, with only the five items and the
answering format again adapted to a ten-point scale for consistency (1 = I completely disagree to 10 = I
completely agree). The scales for sharing economy were again the same as those used in the Swedish survey
as were the final demographic questions.
D1.4 Consumer’s Engagement Strategies
InteGrid GA 731218 42 | 94
4. Results
4.1. Feedback Design Recommendations
Informational strategies are widely used to support energy conservation policies (Steg, 2008). Information
strategies work on the assumption that people do not behave as they should because they are unaware of
their own energy consumption. If provided with such information, they would act curbing down their
consumption (Jain et al., 2012).
However, evidence has shown that information alone increases knowledge but does not lead to behavioral
change (Steg, 2008; Hargreaves et al., 2013). This could be for a number of reasons:
(1) Information strategy is ill-devised.
(2) Individuals do not care, so even if provided with the information they will not change their behavior.
Information is only effective if the user already holds a strong goal to act based on that information
(McCalley and Midden, 2002).
(3) Contexts make it difficult or impede that individuals change their behavior. Buchanan et al. (2014)
emphasise that feedback may be of little use in situations where energy use cannot be reduced.
In support of the first line of work, extensive work has been conducted to unveil the conditions under which
information strategies, in particular information based on feedback, may lead to energy conservation
(Burguess and Nye, 2008). Yet, Buchanan et al. (2014) criticised the paucity of work on how feedback works,
as most papers have focused on whether or not it works. Additionally, there has been limited empirical
work on feedback and shift load: the majority of papers have examined the influence of feedback on energy
savings. However, according to the meta-review of Ehrhardt-Martinez et al. (2010), programs targeting load
shifting are more successful than those targeting energy savings, but energy savings are greater in the latter.
Demand response programs (see a review in Shariatzadeh et al., 2015) offer a wide set of possibilities for
encouraging load shifting.
The review of literature shows that points 2 and 3 have been limitedly addressed. Moreover, even when
the information strategy is well-devised the problems 2 and 3 may still hold: users are not particularly
inclined to use the eco-feedback devices (Buchanan et al., 2015). Those already concerned about energy
savings are more willing to use it; thus, there is a risk of self-selection that may confound the effect of
feedback and lead policymakers to believe that displays may provide the solution to achieve the target of
20% reduction. There is other evidence that suggests that eco-feedback may only work when users are
motivated to engage with them. For instance, number of interactions is a good predictor of energy
decrease; user logins correlate with savings (Jain et al., 2012). However, it is difficult to maintain
motivations; even households interacting with the devices seem to lose interest over time and stop
engaging with it – an effect called fallback effect (Buchanan et al., 2015). Thus, there is need to develop
more innovative feedback mechanisms that are engaging and simultaneously avoid or minimise the
potential shortcomings. Feedback mechanisms should be complemented with motivational mechanisms
(Ehrhardt-Martinez et al., 2010).

D1.4 Consumer’s Engagement Strategies
InteGrid GA 731218 43 | 94
Feedback can be delivered by different means. We focus on interactive feedback, provided by a computer,
mobile or device accompanying a smart meter or in-home display (hereafter IHD, eco-devices or devices).
Studies on eco-feedback has shown great variability in results, from 5% to 55% energy reduction (Jain et al.,
2012). Darby (2006) found that improved feedback may reduce consumption by up to 20%, but the Energy
Demand Research Project obtained a reduction of 1% (cited in Buchanan et al., 2015). These differences
are attributed to characteristics of the device (Jain et al., 2012), household demographics and weather
contexts (Buchanan et al., 2015), as well as type of energy. The Energy Demand Research Project, the largest
project to date on feedback and energy reduction, found that electricity was reduced but not gas, failing to
provide any theoretical explanation for this finding. If effects of feedback are moderated by
sociodemographic information, the conclusion follows that it must be specifically adapted to the
households’ characteristics (age, housing type and household income) and consumer preferences in order
to make it relevant for end users. Additionally, it is important to identify households with larger savings
potential during the early stages of these types of studies (Vassileva et al., 2013). The use of energy
information feedback devices in groups of households where consumption is already low might, in some
cases, cause the opposite effect: when realising that they consume less, occupants give less importance to
their behavior impact on electricity consumption. However, to our knowledge, studies have not tested the
moderating effect of these contextual features on feedback-based interventions, examining only how
different features of feedback may improve energy savings.
This review examines past studies on feedback interventions and design of feedback devices in order to (1)
identify the parameters of design that should be taken into account when creating such devices and (2)
recommend courses of action for each of them.
Ten parameters were identified in the literature that are further broken down in relevant dimensions. These are summarized in a table at the end of the section together with the main recommendations for design.
1. Frequency and immediacy
The ideal frequency of feedback is unclear, but computerized feedback systems provide a level of flexibility in data presentation and access that was previously unavailable (Froehlich, 2009).
Regarding frequency four possibilities are found:
● Real time feedback. Real time feedback decreases energy use (Delmas et al., 2013; Parker et al., 2008) that some authors estimate that could lie between 5-15% (Faruqui et al., 2010) or 2.7-18% (PowerCost Monitor4). Feedback reviews and users’ evaluation suggest that real time feedback is superior to enhanced feedback (Ehrhardt-Martinez et al., 2010; Fitzpatrick and Smith, 2009; Vine et al., 2013)
● Indirect feedback. Indirect feedback is provided via letters, billings and door hangers. It is less effective than real time feedback (Delmas et al., 2013).
● Number of interactions. Frequent feedback is more effective than infrequent. Also, more logins result in greater decreases in energy (Karlin et al, 2013).
● Push vs. pull information (information always available in a visible place vs “on demand” info). Even when “push” mechanisms seem to be effective (Becker and Seligman, 1978; cited by Froehlich, 2009) reported that an average of 15% savings in energy consumption was found in homes that contained the signaling device. It is likely that an effective system would consist of both push and
4 https://www.bluelineinnovations.com/features
D1.4 Consumer’s Engagement Strategies
InteGrid GA 731218 44 | 94
pull approaches.
2. Duration of feedback to change habits
For each additional month of experiment based on feedback, there is a small but significant increase in
energy use. This casts doubts on durability of effects (Delmas et al., 2013) after the so-called “honeymoon
period” (Hargreaves et al., 2013). Erhardt-Martínez et al. (2010) found that it is more effective in periods
less than 6 months than in longer periods. Also, Karlin et al. (2013) found lesser effect in studies with a
length of more than a year. Persistent effects would be more likely if feedback is given over a longer time
(Fisher, 2008) but long-term effects of feedback are unknown; few long-term studies (> 12 months) show
that energy savings cannot be maintained (Vine et al., 2013). Thus, overall studies are pessimistic about the
persistence of effects due to feedback; after one year of deployment of the eco-feedback it was not possible
to see any significant increase or decrease in the household consumption (Pereira et al., 2013). Results
show an increased awareness regarding electricity consumption despite a significant decrease in
interactions with the device (Hargreaves et al., 2013).
3. Medium
Two basic media may be used: electronic media and written material (Fisher, 2008).
● Electronic feedback: It is the medium providing flexibility, real time data and customisation.
However, it demands more involvement from users. In workplace contexts, emails were considered
better communication channels than posters and leaflets (Kamilaris et al, 2015).
● Written feedback: Electricity bill as a carrier of feedback information. As an advantage it is read
more carefully and raises more interest than additional material. However, it only provides indirect
feedback.
Household characteristics have also been found to play an important role when it comes to choosing a
visualisation tool (type of display). Households with high income usually prefer websites or in-home displays
(Vassileva et al., 2013). Recent studies show that linking energy consumption and source through localised
displays is a promising direction (Froehlich, 2009). McCalley and Midden (2003) gave consumers immediate
feedback about washing machine energy usage via an attached control panel and found a 21% reduction in
energy use. Ueno et al. (2005) installed sensors for each home appliance and monitored total electric power
and gas consumption and found a 12% reduction in energy usage after system installation.
4. Content
Most studies have examined content of feedback; in particular, content has been provided in comparative
terms, being the comparison with the user, with peers or with a goal set by user or given by an external
party.
Historical comparison compares present consumption with past consumption; 24 hours, weekly or monthly.
From this consumption and the recall of past activities, users can infer what causes energy consumption
(however, many studies show that users are not that willing to make such inferences or that their inferences
are not very accurate and defend the need for disaggregation). Most studies and meta-analysis
acknowledge that historical comparison is a basic feature of the device (Faruqui et al., 2010; Jain et al.,
2012; Vine et al., 2013). The opposite to historical comparison is to provide users with estimations of how
much energy will be used in a 30-day period (Faruqui et al., 2010). However, there have been no studies
testing the influence of such feature on energy savings.
D1.4 Consumer’s Engagement Strategies
InteGrid GA 731218 45 | 94
Normative comparison uses social influence to impact the energy consumption behaviour of users exposed
to normative eco-feedback (state change empirical ratio value of 1.5) (Jain et al., 2013). Yet, in meta-analysis
social comparative feedback is the least effective form of comparison. Abrahamse and Steg (2013) in a
meta-analysis of social influence approaches found that social comparison in feedback provision is the
second least effective of all strategies considered. Worse, Fisher (2008) found a boomerang effect, where
best performers found a sort of “moral license” to spend more energy. Comparison is more effective if it is
established with people that are similar to us (same building or neighbourhood) (Jain et al., 2012).
Regarding content of normative comparison, it seems important to provide injunctive and not only
descriptive norms; that is, do not give only the comparison, but offer some form of valuation, for instance
in the form of smiley or angry faces (Vine et al., 2013). In Jain et al (2012) users logging into the normative
comparison logged twice as much as users without this feature but did not save significantly more energy.
It raised curiosity but did not change behaviour. Also, some countries may reject comparative standards
(UK) while others seem to prefer them (US and Norway) (Darby, 2006; Vine et al., 2013). For the UK (IEA
2005) and for Sweden (Sernhed et al., 2003) citizens are more interested in comparison with their own
previous consumption, and less with other households. On the contrary, Finnish customers (Haakana et al.,
1997) and Japanese (Ueno et al., 2005) prefer comparisons with peers (Fisher, 2008).
Goal comparison or goal-based feedback significantly increased energy savings (Vine et al, 2013). Even
when users are not given real-time feedback the commitment to a specific goal yielded greater savings in
gas consumption (McCalley and Midden, 2002). In contrast, groups with no goals and feedback did not
achieve significant savings. Furthermore, in combination with other interventions it yielded better results.
It is argued that in the case of goal comparison, energy savings cannot be explained by psychological or
sociodemographic characteristics; interventions based on goal setting and feedback do not work only with
those environmentally motivated (Abrahamse et al., 2009).
Regarding the goal-setting and the characteristics of the goal, there are a number of things to consider:
• It is key that the person sets goals at the appropriate level in the hierarchy (e.g. focal task goals).
Feedback effects on performance are enhanced if feedback is directed to the focal task level
(McCalley et al., 2011). For instance, users should be told to reduce energy by 10% when doing the
washing up, rather than fighting climate change or being environmentally friendly.
• Feedback + goal and feedback + goal + incentive had higher effect sizes than feedback alone (Karlin
et al., 2013). The size of the standard-feedback gap may be significant but it has not been studied.
• It makes no difference whether the goal is set by the person or set by an external party (Abrahamse
et al., 2007). It is significant the reduction if the goal is difficult (they set 5%; experimental group
did decrease energy consumption by 5%). Vine et al. (2013) report another study where a goal of
2% was set but the experimental group managed to decrease energy by 5.7%. However, the group
given a difficult goal of 20% managed to reduce 15.7%.
• Group goal setting and group feedback, although it had been successful at workplace settings, did
not lead to energy savings (Abrahamse et al. 2007). The person should be able to choose the goal
in different measurement units.
It is key to provide the information together with an evaluation (Buchanan et al., 2015). Consumers have
difficulties in deciphering their consumption. Thus, the design of the feedback has to provide clues of the
evaluation; whether they are in red or green, whether they are increasing or decreasing compared to
yesterday, whether their costs are being down certain threshold etc. Still, evaluation may differ across
users, which also depend on their motivation. Also, it may provide wrong incentives, so that consumers feel

D1.4 Consumer’s Engagement Strategies
InteGrid GA 731218 46 | 94
that their actual levels of consumption are ok if they see them in green, reducing motivation to further
decrease consumption.
Regarding the design, usually comparative information is given in the form of bars. Bars are usually coloured
(red, yellow, green) to show good or bad performance (Jain et al., 2012). Bars are preferred to curves by
users (Vine et al., 2013). Appliance level information is better displayed in pie charts with texts for further
clarification (Vine et al., 2013). Other IHD use lines graphs. There are no sound empirical evidences to
support a decision about what form of graph yields better results (see some evidence in Wood and
Newborough, 2007 but not based on experimental studies).
Yet, bars are not the only choice to instruct users about their consumption. Rodgers and Bartram (2011)
propose other forms of visualisation of power consumption based on ambient technologies and tested
them for understandability in a small sample of 25 users. Results show that users prefer these forms of
feedback to conventional bars and numbers. However, according to users’ surveys, users do not wish
ambient technologies incorporated into smart meters (Fitzpatrick and Smith, 2009). Thus, whether or not
ambient features can improve the effectiveness of devices is a matter for further research.
For goal comparison, some devices have used ticks and cross to show whether or not the user is on target
to meet a goal (Hargreaves et al., 2010).
Regarding normative comparison bars are also chosen, where a green bar usually means that a given user
was 20% below the average of building, and red 20% above. Also, some IHD allow users to add friends to
the friends feed and use this set for further comparisons. Other devices show in the friends feed whether
friends have redeemed points or obtained incentives, rather than giving only the normative information. In
most of devices normative information is voluntary, i.e. only displayed if the user chooses to.
Design should also manage two psychological problems: Cognitive dissonance and information overload.
First, it may create a cognitive dissonance, as meta-analysis show that this is a requirement for a change of
habits (make people aware that their own consumption is greater than they thought). However, if the
person is systematically a poor performer it may respond by rejecting feedback or distancing from the
situation. Also, design should avoid the information overload, displaying the information in a friendly and
understandable manner.
As aforementioned the friends feed can be an important feature of the device. Other studies have
suggested that social networking has an important role to play in supporting education and personal change
of energy consumption and emissions. However, the role of Facebook and other social sharing sites in
supporting social issues is a relatively new topic of research (Mankoff et al., 2007). One role that social
networking sites may play is in providing accountability and pressure to be energy efficient. Pallack et al.
(1980) carried out an experiment involving households. The group that agreed to publish the results of their
performance used 15% less natural gas and 20% less electricity. It is likely that users who share their energy
usage online will similarly feel pressure to engage in energy efficient behaviour (cited in Froehlich, 2009).
5. Disaggregation
Disaggregation, also called granularity, could be considered a parameter in itself or a part of the feedback
content. It regards the level of disaggregation of information to appliance level, so that users know how
much energy is used by each appliance (Faruqui et al., 2010). Jain et al. (2012) did not find significant
differences, but meta-analysis show that granularity is a key moderator of feedback effect; granularity
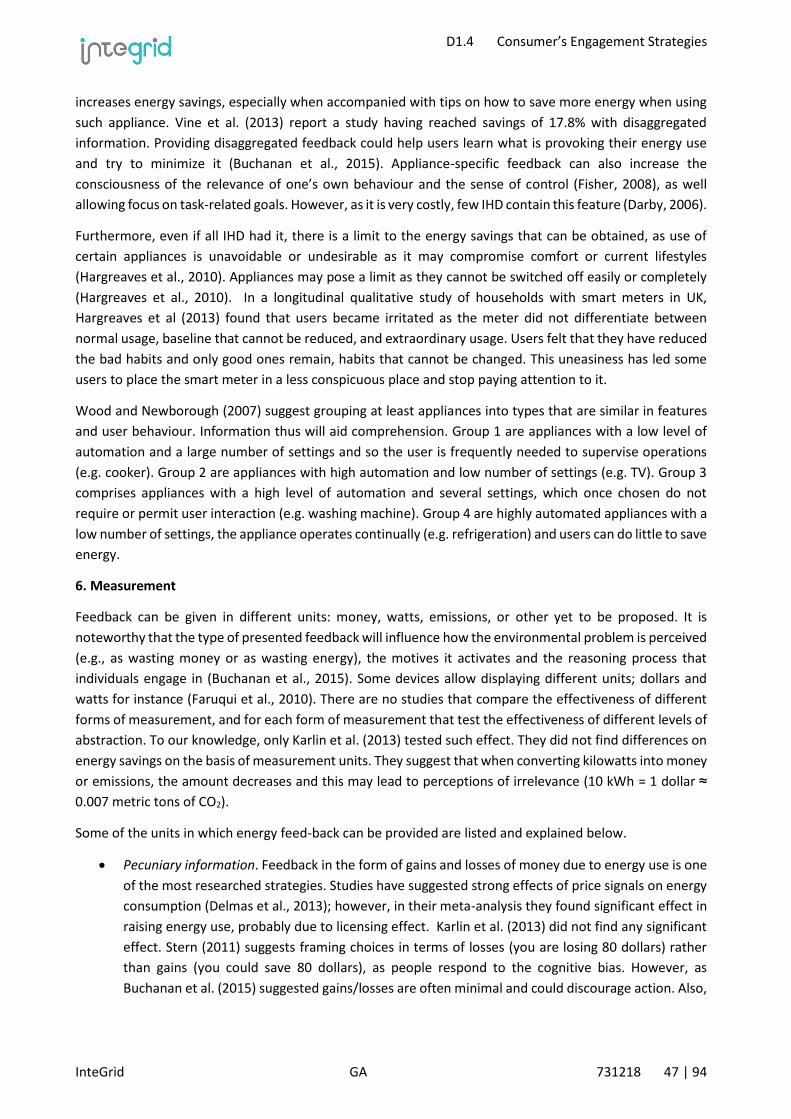
D1.4 Consumer’s Engagement Strategies
InteGrid GA 731218 47 | 94
increases energy savings, especially when accompanied with tips on how to save more energy when using
such appliance. Vine et al. (2013) report a study having reached savings of 17.8% with disaggregated
information. Providing disaggregated feedback could help users learn what is provoking their energy use
and try to minimize it (Buchanan et al., 2015). Appliance-specific feedback can also increase the
consciousness of the relevance of one’s own behaviour and the sense of control (Fisher, 2008), as well
allowing focus on task-related goals. However, as it is very costly, few IHD contain this feature (Darby, 2006).
Furthermore, even if all IHD had it, there is a limit to the energy savings that can be obtained, as use of
certain appliances is unavoidable or undesirable as it may compromise comfort or current lifestyles
(Hargreaves et al., 2010). Appliances may pose a limit as they cannot be switched off easily or completely
(Hargreaves et al., 2010). In a longitudinal qualitative study of households with smart meters in UK,
Hargreaves et al (2013) found that users became irritated as the meter did not differentiate between
normal usage, baseline that cannot be reduced, and extraordinary usage. Users felt that they have reduced
the bad habits and only good ones remain, habits that cannot be changed. This uneasiness has led some
users to place the smart meter in a less conspicuous place and stop paying attention to it.
Wood and Newborough (2007) suggest grouping at least appliances into types that are similar in features
and user behaviour. Information thus will aid comprehension. Group 1 are appliances with a low level of
automation and a large number of settings and so the user is frequently needed to supervise operations
(e.g. cooker). Group 2 are appliances with high automation and low number of settings (e.g. TV). Group 3
comprises appliances with a high level of automation and several settings, which once chosen do not
require or permit user interaction (e.g. washing machine). Group 4 are highly automated appliances with a
low number of settings, the appliance operates continually (e.g. refrigeration) and users can do little to save
energy.
6. Measurement
Feedback can be given in different units: money, watts, emissions, or other yet to be proposed. It is
noteworthy that the type of presented feedback will influence how the environmental problem is perceived
(e.g., as wasting money or as wasting energy), the motives it activates and the reasoning process that
individuals engage in (Buchanan et al., 2015). Some devices allow displaying different units; dollars and
watts for instance (Faruqui et al., 2010). There are no studies that compare the effectiveness of different
forms of measurement, and for each form of measurement that test the effectiveness of different levels of
abstraction. To our knowledge, only Karlin et al. (2013) tested such effect. They did not find differences on
energy savings on the basis of measurement units. They suggest that when converting kilowatts into money
or emissions, the amount decreases and this may lead to perceptions of irrelevance (10 kWh = 1 dollar ≈
0.007 metric tons of CO2).
Some of the units in which energy feed-back can be provided are listed and explained below.
• Pecuniary information. Feedback in the form of gains and losses of money due to energy use is one
of the most researched strategies. Studies have suggested strong effects of price signals on energy
consumption (Delmas et al., 2013); however, in their meta-analysis they found significant effect in
raising energy use, probably due to licensing effect. Karlin et al. (2013) did not find any significant
effect. Stern (2011) suggests framing choices in terms of losses (you are losing 80 dollars) rather
than gains (you could save 80 dollars), as people respond to the cognitive bias. However, as
Buchanan et al. (2015) suggested gains/losses are often minimal and could discourage action. Also,

D1.4 Consumer’s Engagement Strategies
InteGrid GA 731218 48 | 94
payment in arrears may prove less effective when combined with feedback (Darby, 2006); keypad
meters, progressive block pricing or pay-as-you-go pricing strategies could create synergies with
feedback. Pecuniary feedback may not work if the prices of energy are low or flat (Wood and
Newborough, 2007).
• Kilowatts. This should be understood as the most neutral measurement and may reinforce the
abstractness of energy, jeopardising motivation for improvement. It is the least preferred by users
(Fitzpatrick and Smith, 2009) as it is difficult to decipher (Wood and Newborough, 2007).
• Emissions. Emissions may stimulate environmental concerns. Again, emissions are abstract and may
not help focus on task-related goals. Fitzpatrick and Smith (2009) found that although users have
expressed a preference for CO2 emissions, in practice they did not use the feature of the display,
partly because they did not understand what the amount of emissions meant and partly because
they did not feel the information was useful for them.
• Health. Health-based frame induced persistent energy savings behavior of 8-10% over 100 days;
whereas a more traditional cost savings frame, drove sharp attenuation of treatment effects after
2 weeks with no significant savings versus control after 7 weeks (Asensio and Delmas, 2016).
7. Problem solving
Some IHD provide recommendations for users to act upon their energy consumption. There are two main
problem-solving strategies:
• Audits or tailored recommendations. Audits or personalised recommendations (e.g. plug out
your kettle and you will save this amount of energy) have yielded significant effects in energy
reductions (Abrahamse et al., 2007; Delmas et al., 2013). Also, specific advice about targeted
ways to save energy and specific information on the impact on the environment were the most
useful for users (Kamilaris et al., 2015)
• Energy tips. These are broad, general tips for reducing energy. They have had a non-significant
effect in energy conservation (Delmas et al., 2013).
8. Consequences of feedback
As aforementioned, some authors claim that feedback itself may not lead to behavioural change unless is
accompanied with penalties or rewards. There has been a paucity of studies addressing the effect of
penalties/rewards on energy use.
● Penalties. Users who receive penalisations in the first engagements are less likely to use the device
again (Jain et al., 2012).
● Rewards. Receiving rewards in initial engagement, makes it more likely (2.5 times) to engage again (Jain et al., 2012). Other forms of rewards are incentives or the possibility of obtaining points and redeem it for prizes or discounts (Jain et al., 2012). This may influence positively energy savings. Also, Delmas et al. (2013) found that incentives significantly decreased energy use. However, financial incentives may crowd out prosocial motivations.
9. Other lessons learned from user-centered design of devices
Eco-feedback is one strategy; one step further is scripting (Lilley et al. 2005) where the product is designed
in such a way that the design triggers the sustainable use by either creating obstacles for unsustainable use,
or by making sustainable behaviour so easy, it is performed almost without thinking about it by the user. A
third strategy would be forced-functionality; intelligent products (as defined by Lilley, 2005) that adapt
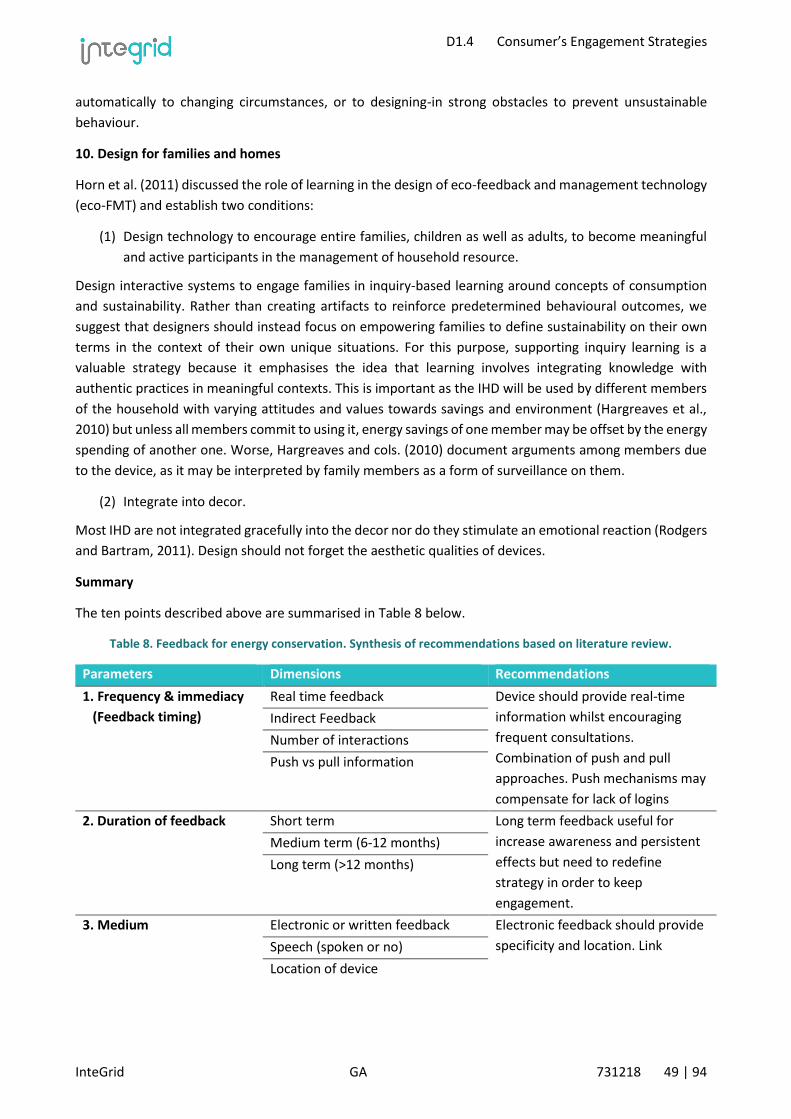
D1.4 Consumer’s Engagement Strategies
InteGrid GA 731218 49 | 94
automatically to changing circumstances, or to designing-in strong obstacles to prevent unsustainable
behaviour.
10. Design for families and homes
Horn et al. (2011) discussed the role of learning in the design of eco-feedback and management technology
(eco-FMT) and establish two conditions:
(1) Design technology to encourage entire families, children as well as adults, to become meaningful
and active participants in the management of household resource.
Design interactive systems to engage families in inquiry-based learning around concepts of consumption
and sustainability. Rather than creating artifacts to reinforce predetermined behavioural outcomes, we
suggest that designers should instead focus on empowering families to define sustainability on their own
terms in the context of their own unique situations. For this purpose, supporting inquiry learning is a
valuable strategy because it emphasises the idea that learning involves integrating knowledge with
authentic practices in meaningful contexts. This is important as the IHD will be used by different members
of the household with varying attitudes and values towards savings and environment (Hargreaves et al.,
2010) but unless all members commit to using it, energy savings of one member may be offset by the energy
spending of another one. Worse, Hargreaves and cols. (2010) document arguments among members due
to the device, as it may be interpreted by family members as a form of surveillance on them.
(2) Integrate into decor.
Most IHD are not integrated gracefully into the decor nor do they stimulate an emotional reaction (Rodgers
and Bartram, 2011). Design should not forget the aesthetic qualities of devices.
Summary
The ten points described above are summarised in Table 8 below.
Table 8. Feedback for energy conservation. Synthesis of recommendations based on literature review.
Parameters Dimensions Recommendations
1. Frequency & immediacy
(Feedback timing)
Real time feedback Device should provide real-time
information whilst encouraging
frequent consultations.
Combination of push and pull
approaches. Push mechanisms may
compensate for lack of logins
Indirect Feedback
Number of interactions
Push vs pull information
2. Duration of feedback Short term Long term feedback useful for
increase awareness and persistent
effects but need to redefine
strategy in order to keep
engagement.
Medium term (6-12 months)
Long term (>12 months)
3. Medium Electronic or written feedback Electronic feedback should provide
specificity and location. Link Speech (spoken or no)
Location of device

D1.4 Consumer’s Engagement Strategies
InteGrid GA 731218 50 | 94
Physical appearance (screen,
robot)
consumption and source can boost
reduction in energy use.
Including “social cues” (speech
and/or robot) results in lower
energy consumption
4. Content Comparison (historical, normative,
goal)
Combination of different forms of
content but privilege goal-based
feedback; include friends feed if
social comparison is socially
accepted.
Need to take into account
individual's goal orientation and
emotional traits as well as
persuasion profile.
Make people aware that their own
consumption is greater than they
thought, displaying the information
in a friendly and understandable
manner (graphs, colours, images)
Sign of feedback
(positive/negative)
Persuasion strategy
Cognitive load & Image type
5. Disaggregation
(granularity)
Information broken down by
appliance or source of energy
Prior evaluation of energy saving
potential according to users´ habits
and appliances;
Information as disaggregated as
possible (at least group of
appliances)
Broken down by group of
appliances
Aggregated information
6. Measurement unit Monetary units No differences on energy savings
on the basis of measurement units,
energy conservation could be long-
lived with health framing.
Frame as potential losses rather
than potential gains.
Kilowatts
Emissions
Health
7. Problem solving Audits or tailored recommendation Provide smart meters with tailored
recommendations for users to act
upon their energy consumption,
not general tips.
If possible combine other features
of the device with audit (e.g. goal
setting, granularity)
Energy tips
8. Consequences of
feedback
Penalties Incorporate rewards to strengthen
the commitment to using smart
meters
Rewards
9. Design strategies Eco-feedback Scripting (product is designed in
such a way that the triggers the
sustainable use). Forced-
Scripting
Forced functionality
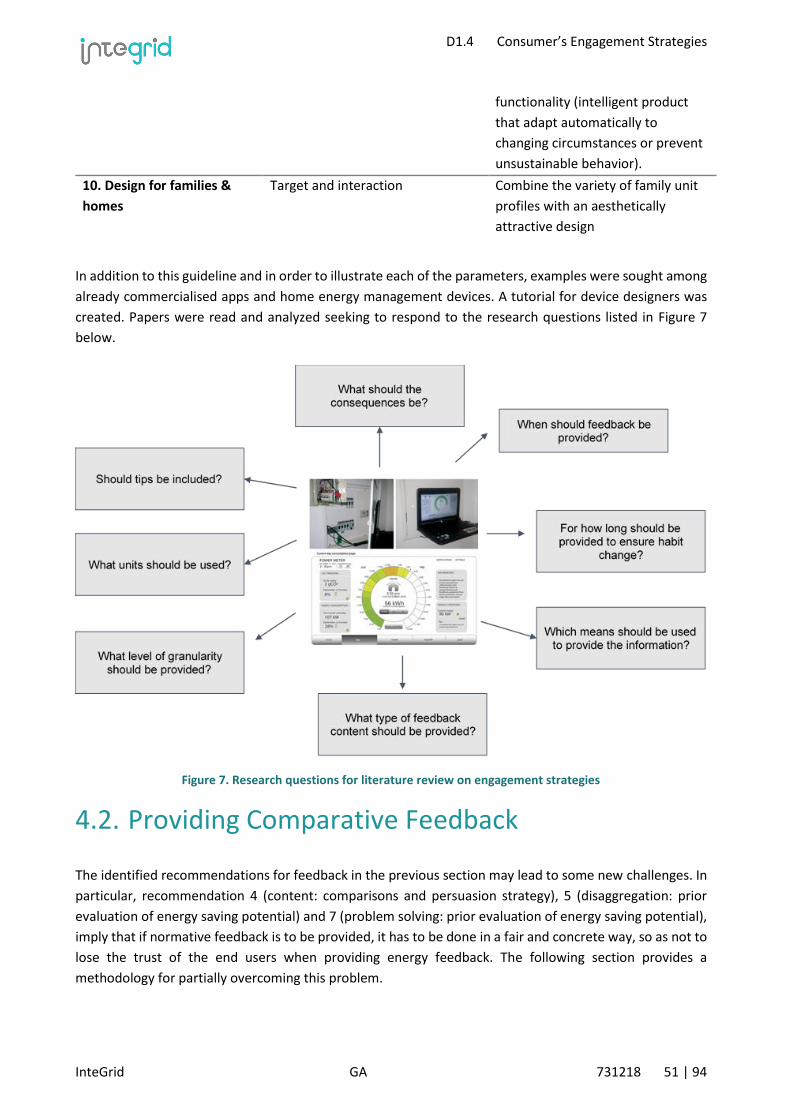
D1.4 Consumer’s Engagement Strategies
InteGrid GA 731218 51 | 94
functionality (intelligent product
that adapt automatically to
changing circumstances or prevent
unsustainable behavior).
10. Design for families &
homes
Target and interaction Combine the variety of family unit
profiles with an aesthetically
attractive design
In addition to this guideline and in order to illustrate each of the parameters, examples were sought among
already commercialised apps and home energy management devices. A tutorial for device designers was
created. Papers were read and analyzed seeking to respond to the research questions listed in Figure 7
below.
Figure 7. Research questions for literature review on engagement strategies
4.2. Providing Comparative Feedback
The identified recommendations for feedback in the previous section may lead to some new challenges. In
particular, recommendation 4 (content: comparisons and persuasion strategy), 5 (disaggregation: prior
evaluation of energy saving potential) and 7 (problem solving: prior evaluation of energy saving potential),
imply that if normative feedback is to be provided, it has to be done in a fair and concrete way, so as not to
lose the trust of the end users when providing energy feedback. The following section provides a
methodology for partially overcoming this problem.
D1.4 Consumer’s Engagement Strategies
InteGrid GA 731218 52 | 94
4.2.1. Problems with Comparative Feedback
To increase the likelihood of engagement, feedback on household energy performance should be carefully
designed using best practices from the field of human-computer interaction and behavioural sciences
(Karjalainen, 2011; Pierce et al, 2010). Comparative feedback is suggested to be an effective feedback
mechanism as it has led to sustained engagement in some cases (Allcott, 2011). One challenging problem
with this type of feedback is that if it only considers the total household electricity consumption – usually
the only data point that is available through smart meters – the feedback cannot be normalised in a fair
way; a large family that make efforts to reduce their energy use will almost always perform worse than a
single-member household in the same community.
One common normalised metric of energy use in buildings is energy consumption per floor area (kWh/m2),
which allows for meaningful comparisons of area-dependent energy use such as heating. For household
electricity consumption (kWhelec) however, this metric is not optimal since other factors such as the type of
household, the number of residents, or the existence of certain electricity loads such as electric vehicles
often affect the consumption more.
In order for a household to better understand its electricity consumption performance, it is common to
compare its consumption to its previous consumption or to the consumption of other households. These
types of comparisons have limitations that are discussed below.
Comparisons with the household’s previous consumption can show a decreasing or increasing trend in the
consumption, but not whether the actual consumption is high or low, taking into account the characteristics
of the apartment. This makes it harder to set fair energy reduction goals. For example, a reduction goal of,
say, 20% is easily achieved by a household with a wasteful energy behaviour, while an already energy-
efficient household will find the same 20% reduction challenging. Therefore, knowing a baseline
consumption based on the household’s characteristics would be useful when setting reduction goals.
Comparisons with other households are often used to give comparative feedback. A direct electricity use
comparison using kWh can be done between apartments, but it is only suitable when comparing
apartments with similar characteristics; a small one-person apartment will most probably use much less
than a large apartment having four residents. To make households comparable, the kWh/m2 metric is often
used, but household area is only one of many determinants of the energy consumption. Figure 8 shows the
electricity consumption of 124 Swedish apartments divided into six groups of similarly-sized household. It
shows a trend of increasing use per area, but the trend is broken for the largest household sizes. More
importantly, the data reveals that the number of residents within each area group and their behaviour have
an important effect on the total energy consumption. The importance of the number of residents is further
confirmed by simulations (see Figure 9); a large 110 m2 single-person apartment consumes less than small
30 m2 one with two residents.
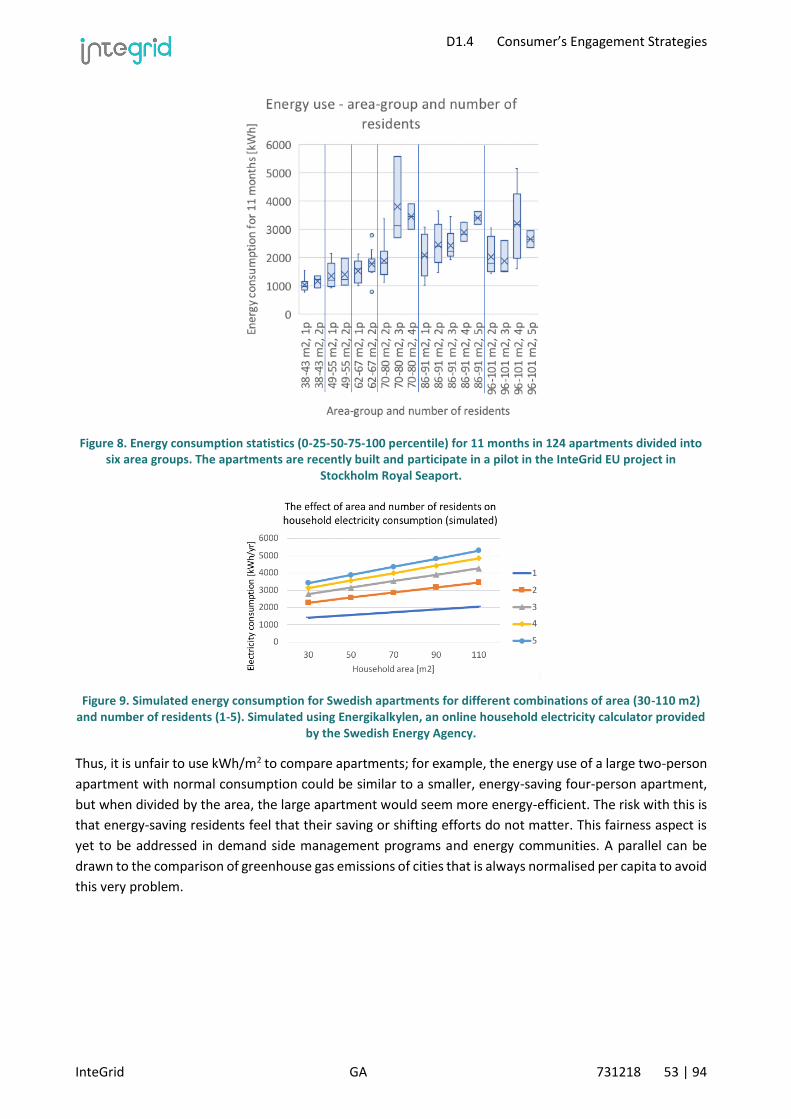
D1.4 Consumer’s Engagement Strategies
InteGrid GA 731218 53 | 94
Figure 8. Energy consumption statistics (0-25-50-75-100 percentile) for 11 months in 124 apartments divided into six area groups. The apartments are recently built and participate in a pilot in the InteGrid EU project in
Stockholm Royal Seaport.
Figure 9. Simulated energy consumption for Swedish apartments for different combinations of area (30-110 m2) and number of residents (1-5). Simulated using Energikalkylen, an online household electricity calculator provided
by the Swedish Energy Agency.
Thus, it is unfair to use kWh/m2 to compare apartments; for example, the energy use of a large two-person
apartment with normal consumption could be similar to a smaller, energy-saving four-person apartment,
but when divided by the area, the large apartment would seem more energy-efficient. The risk with this is
that energy-saving residents feel that their saving or shifting efforts do not matter. This fairness aspect is
yet to be addressed in demand side management programs and energy communities. A parallel can be
drawn to the comparison of greenhouse gas emissions of cities that is always normalised per capita to avoid
this very problem.

D1.4 Consumer’s Engagement Strategies
InteGrid GA 731218 54 | 94
4.2.2. Proposed Solution: Household-Specific
Baselines
To overcome the limitations of conventional comparative feedback, our proposed solution is a household-
specific baseline. The baseline is calculated using selected household characteristics and indicates how
much an average household with the same characteristics would consume. Comparing the household’s
actual consumption with the baseline reveals how energy-efficient the household is compared to the
average household. Household-specific baselines would allow for:
1. Personalized goals. Figure 10 compares two hypothetical households, A and B. By only looking at
the current consumption (grey bars), household B seems to be more efficient than A. However, by
introducing the household-specific baseline (black horizontal lines), it can be seen that A is actually
more efficient since its consumption is below its baseline. When setting reduction goals, instead of
giving both households a 20% goal (red bars) relative to their current consumption, the efficient
household A could get a personalized goal of 10% while B gets 30% (green bars).
Figure 10. Example of personalized goal setting using household-specific baselines for two hypothetical households.
2. A fairer comparison of energy efficiency between households. By using the deviation in percent from
the household-specific baseline as a metric, households with differing characteristics can be
compared with each other. For example, in Figure 10, household A is about 15% below its baseline
while B is 65% above, so A is much more efficient than B. Another example: An apartment with a
young couple consuming 300 kWh/month and a similarly sized household of four with both parents
working from home consuming 800 kWh/month can be said to be equally energy efficient if they
both consume 20% below their household-specific baseline.
Baseline construction: Main determinants of household energy use
In order to calculate a fair baseline, the characteristics that are most relevant to the household energy
consumption need to be considered. Common ways to calculate baselines include online energy calculators
or energy simulations, but these often require many input parameters that are not readily available unless
a detailed survey is given to the household. Our approach is to minimise the number of parameters and
make assumptions based on the parameters to get a baseline that is good enough. For typical Swedish

D1.4 Consumer’s Engagement Strategies
InteGrid GA 731218 55 | 94
apartments, Vassileva (2012) suggests that apart from behaviour and attitudes, the household income,
number of residents and floor area affect the consumption. As the household income is likely to be
correlated with the other parameters (i.e. larger income affords a household with a larger floor area), and
since our main interest is comparisons within neighbourhoods having a relatively similar income level, our
hypothesis is that it is possible to create a meaningful baseline calculation using the following two main
determinants of household energy use:
• The number of residents
• The floor area
We also suggest using people hours as a main determinant, but this is outside the scope of this paper and
is explained in the “future research” section.
Baseline construction: Main household electricity loads
The main household electricity loads and their dependence on the main determinants are presented in
Table 9. Out of the loads, only the lights are dependent on the household area, while the rest are mainly
dependent on the number of residents and their behaviour. Our hypothesis of mainly person-dependent
loads was verified by studying simulation results from Energikalkylen, an online household electricity
calculator made by the Swedish Energy Agency. This is obviously a representation of Swedish conditions
and would need to be generalized for other types of households.
A model for calculating a household-specific baseline
Based on this understanding on how the main determinants of household energy use affect different
household loads, we suggest the following simple model as a starting point for calculating a household-
specific baseline:
Inputs:
A: household area [m2]
r: number of residents
w: has/uses washing machine (1 or 0)
rhome: number of residents who usually work from home, can be a decimal value such as 0.5 or 1.5 if the
residents work from home part-time.
Output:
Ebaseline: the baseline household electricity consumption [kWh/year], which is a sum of the individual loads,
described in Equation 1.

D1.4 Consumer’s Engagement Strategies
InteGrid GA 731218 56 | 94
Table 9. Electrical household loads, their typical share of household electricity use (Source: simulations using Energikalkylen), and their assumed dependency on floor area, number of residents and people hours. L = linear
dependency (y=k*x+m), S = step function, x = affected by type of people- hour.
Equation 1. Baseline household electricity consumption
Ebaseline = Elights + Ekitchen + Edevices + w * Ewash + Efridge
where the first four individual loads are calculated as linear dependencies (y = k*x + m) and the first three
are increased if people are working from home:
Elights = (klights * A + mlights) * (1 + fhome * rhomeupTo1)
Ekitchen = (kkitchen * r + mkitchen) + (kkitchen * rhome + mkitchen) * fhome
Edevices = (kdevices * r + mdevices) + (kdevices * rhome + mdevices) * fhome
Ewash = kwash * r + mwash
in which
fhome is a factor for increased energy use if working from home
rhomeUpTo1 decreases the use of lights if a single person is working part-time from home according to:
rhomeUpTo1 = {rhome if 0 ≤ rhome < 1, 1 if rhome ≥ 1}
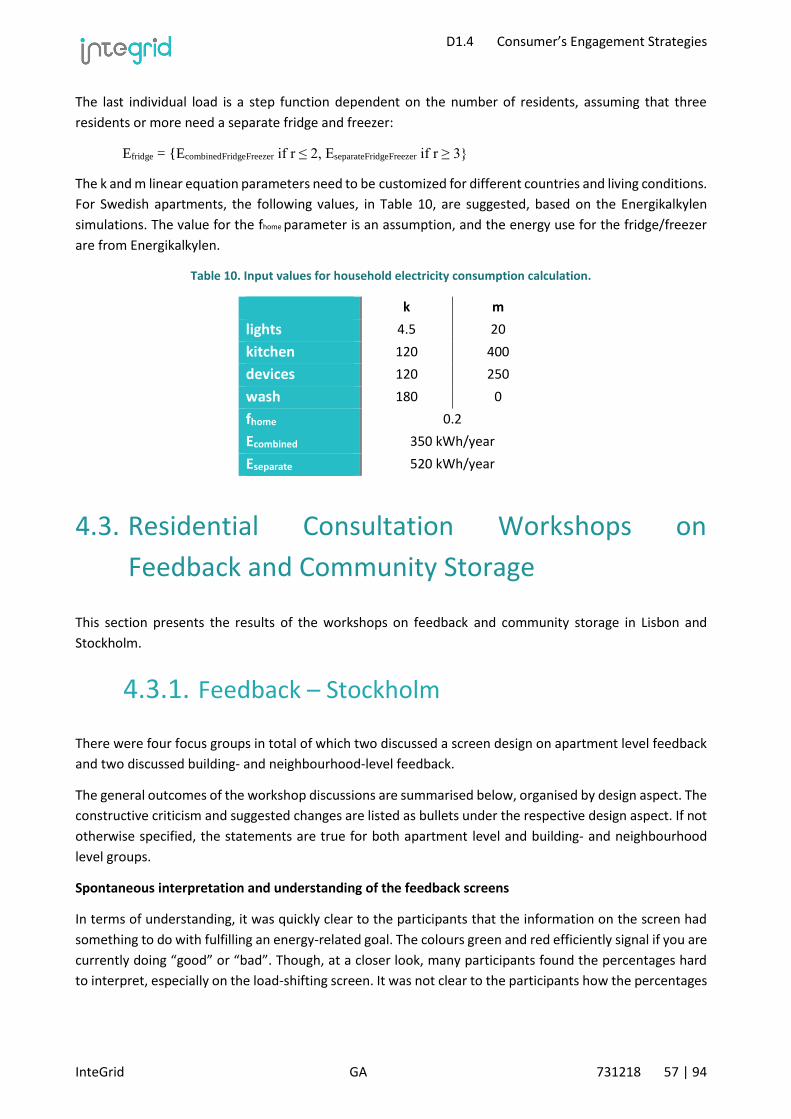
D1.4 Consumer’s Engagement Strategies
InteGrid GA 731218 57 | 94
The last individual load is a step function dependent on the number of residents, assuming that three
residents or more need a separate fridge and freezer:
Efridge = {EcombinedFridgeFreezer if r ≤ 2, EseparateFridgeFreezer if r ≥ 3}
The k and m linear equation parameters need to be customized for different countries and living conditions.
For Swedish apartments, the following values, in Table 10, are suggested, based on the Energikalkylen
simulations. The value for the fhome parameter is an assumption, and the energy use for the fridge/freezer
are from Energikalkylen.
Table 10. Input values for household electricity consumption calculation.
k m
lights 4.5 20
kitchen 120 400
devices 120 250
wash 180 0
fhome 0.2
Ecombined 350 kWh/year
Eseparate 520 kWh/year
4.3. Residential Consultation Workshops on
Feedback and Community Storage
This section presents the results of the workshops on feedback and community storage in Lisbon and
Stockholm.
4.3.1. Feedback – Stockholm
There were four focus groups in total of which two discussed a screen design on apartment level feedback
and two discussed building- and neighbourhood-level feedback.
The general outcomes of the workshop discussions are summarised below, organised by design aspect. The
constructive criticism and suggested changes are listed as bullets under the respective design aspect. If not
otherwise specified, the statements are true for both apartment level and building- and neighbourhood
level groups.
Spontaneous interpretation and understanding of the feedback screens
In terms of understanding, it was quickly clear to the participants that the information on the screen had
something to do with fulfilling an energy-related goal. The colours green and red efficiently signal if you are
currently doing “good” or “bad”. Though, at a closer look, many participants found the percentages hard
to interpret, especially on the load-shifting screen. It was not clear to the participants how the percentages
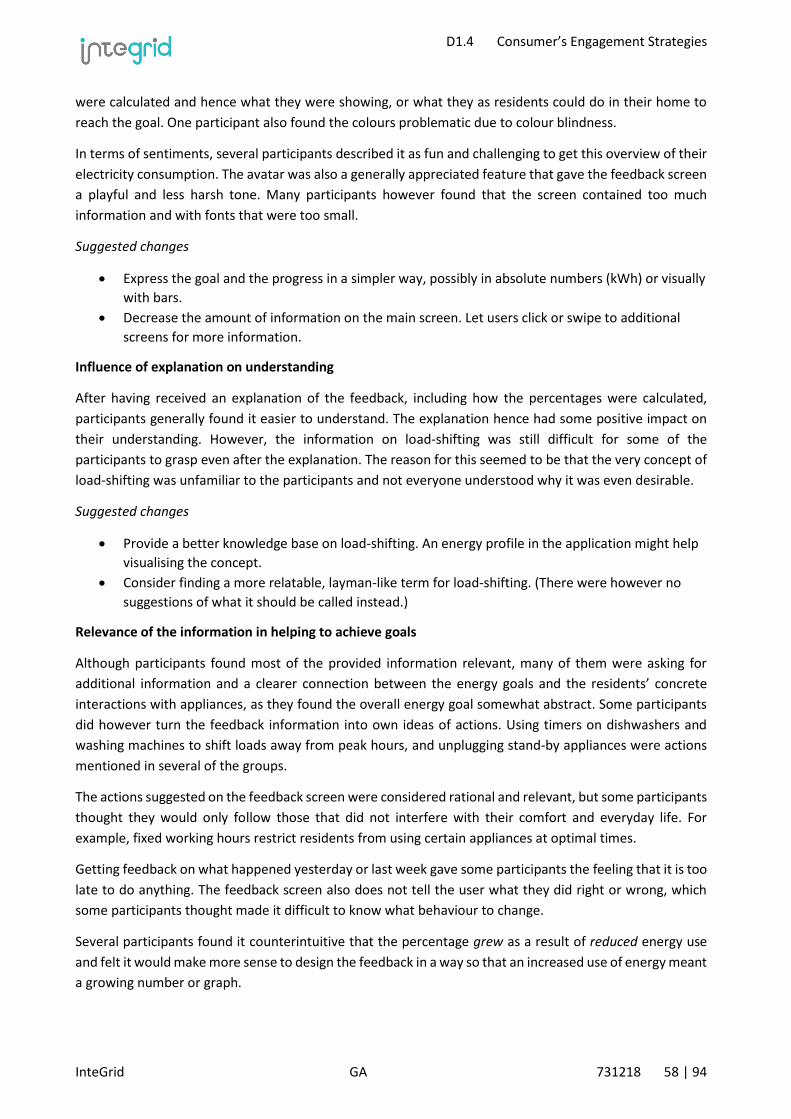
D1.4 Consumer’s Engagement Strategies
InteGrid GA 731218 58 | 94
were calculated and hence what they were showing, or what they as residents could do in their home to
reach the goal. One participant also found the colours problematic due to colour blindness.
In terms of sentiments, several participants described it as fun and challenging to get this overview of their
electricity consumption. The avatar was also a generally appreciated feature that gave the feedback screen
a playful and less harsh tone. Many participants however found that the screen contained too much
information and with fonts that were too small.
Suggested changes
• Express the goal and the progress in a simpler way, possibly in absolute numbers (kWh) or visually
with bars.
• Decrease the amount of information on the main screen. Let users click or swipe to additional
screens for more information.
Influence of explanation on understanding
After having received an explanation of the feedback, including how the percentages were calculated,
participants generally found it easier to understand. The explanation hence had some positive impact on
their understanding. However, the information on load-shifting was still difficult for some of the
participants to grasp even after the explanation. The reason for this seemed to be that the very concept of
load-shifting was unfamiliar to the participants and not everyone understood why it was even desirable.
Suggested changes
• Provide a better knowledge base on load-shifting. An energy profile in the application might help
visualising the concept.
• Consider finding a more relatable, layman-like term for load-shifting. (There were however no
suggestions of what it should be called instead.)
Relevance of the information in helping to achieve goals
Although participants found most of the provided information relevant, many of them were asking for
additional information and a clearer connection between the energy goals and the residents’ concrete
interactions with appliances, as they found the overall energy goal somewhat abstract. Some participants
did however turn the feedback information into own ideas of actions. Using timers on dishwashers and
washing machines to shift loads away from peak hours, and unplugging stand-by appliances were actions
mentioned in several of the groups.
The actions suggested on the feedback screen were considered rational and relevant, but some participants
thought they would only follow those that did not interfere with their comfort and everyday life. For
example, fixed working hours restrict residents from using certain appliances at optimal times.
Getting feedback on what happened yesterday or last week gave some participants the feeling that it is too
late to do anything. The feedback screen also does not tell the user what they did right or wrong, which
some participants thought made it difficult to know what behaviour to change.
Several participants found it counterintuitive that the percentage grew as a result of reduced energy use
and felt it would make more sense to design the feedback in a way so that an increased use of energy meant
a growing number or graph.
D1.4 Consumer’s Engagement Strategies
InteGrid GA 731218 59 | 94
Suggested changes
• Provide a more extensive list of actions that residents can take, and their relative contribution to
the goals.
• Provide more instant feedback, or even forecasts, to allow users to see the impact of their
actions.
• Make visual representation more intuitive by correlating decreasing energy use with a shrinking
graph and vice versa.
Relevance of motivational features in helping to achieve goals
The element of comparing results and possibly competing against other residents at different aggregation
levels was appealing to some, but not to all participants.
To create a stronger incentive, participants in all groups wanted to see how much money their energy
conservation was worth and how much money they could save (as individuals) by taking actions. In the
apartment level groups, some participants felt that they would be more motivated if they could set their
own goals and compare their results from different weeks.
Suggested changes
• Provide information on how much money the residents have saved or could save by taking
actions.
• Allow users to set their own goals.
Significance of aggregation level
When asked about what motivational features could be added to the application, both apartment and
building level groups mentioned, with emphasis, the individual financial gain from reducing energy costs.
In other words, even when the feedback is given on an aggregated level, this individual incentive is very
relevant.
A list of suggested actions and their relative contribution to energy conservation was requested from groups
on both aggregation level. However, the discussion about individual home appliances was more
pronounced in the apartment level groups, while building and neighbourhood level groups mentioned
things like building ventilation and (although not relevant to electricity use) heating. These slightly different
perspectives could be a reflection of the different aggregation levels that the groups were discussing. If so,
the apartment level feedback might be more efficient in encouraging people to take individual action.
One of the apartment level groups discussed the importance of feeling like they would have a real and
direct influence on the energy use reviewed by the application. One aspect of this would, according to the
group, be to have a small enough aggregation level so that their individual contribution could actually make
a visible change. This suggests that aggregation level should not be higher than perhaps building level.
In terms of comparing results in a competitive way, some in the apartment level groups who were sceptic
towards an individual contest would feel more positive about competing as a community against e.g. other
buildings.
One of the building and neighbourhood level groups were explicitly asked about their opinion on having
goals on an aggregated as opposed to individual level. The group thought that for joint goals to be relevant,
there must be a sense of community among the participating households. On the other hand, provided that

D1.4 Consumer’s Engagement Strategies
InteGrid GA 731218 60 | 94
such social capital exists, it can be strengthened by joining forces for energy conservation. The suggested
awards from achieving the goals in this context were not money, but rather things that could bring the
community closer – a social event or shared goods that can be useful to many, such as lawn games or
toolboxes.
4.3.2. Feedback – Lisbon
The workshop in Lisbon was held on the 4th of June 2018 in the area Caldas da Rainha. In terms of
demography, many of the inhabitants of this area belong to a senior age group, which was also reflected in
the composition of workshop participants.
A summary of the results from the energy feedback stakeholder consultation workshop is found below. In
the results from the Lisbon workshop, the participants’ understanding of the feedback is, unlike the
Stockholm results above, not divided into before and after explanation but presented together as the
general understanding. The Lisbon participants also got to discuss a feedback screen about social
sustainability, containing information about neighbourhood identity, trust and safety.
Understanding of the feedback screens
The participants found it overall difficult to understand the feedback screens and interpretation of them
required quite some time. The message conveyed through colours (green = good, red = bad) was clear, but
the data was not intuitive. Comparing the different feedback screens, the feedback on energy conservation
was found to be easier to understand than the feedback on load shifting. A suggested change was to use
bars instead of the current type of graphic.
Elderly people might generally find it harder to understand new apps and digital services, compared to
younger generations. This is important to keep in mind when designing the feedback, so that this age group
do not get excluded from using it.
Relevance of the information
The advice and suggested measures for reaching the goals were useful, according to the participants of the
workshop. They would like to be able to see during what hours people were consuming the most energy,
presumably to better know when to load shift themselves.
Relevance of motivational features
The participants in this workshop were questioning the need to compare to other neighbourhoods, which
suggests that they did not find it relevant as a motivational feature. Instead they thought it would be useful
to see the monetary savings they had achieved and could achieve by taking action.
4.3.3. Energy Storage Stockholm
In the following section, results regarding the five different criteria from Part 1 and Part 2 of the workshop
are presented with the order based on interrelations between decisions for the different criteria becoming
obvious in the focus group discussions. As results, as anticipated, differ between countries, in the following

D1.4 Consumer’s Engagement Strategies
InteGrid GA 731218 61 | 94
chapter 4.3.3 results for Sweden are presented. Afterwards, chapter 4.3.4 summarizes findings from the
stakeholder consultation workshop in Portugal and compares them to the Swedish findings.
Place of battery: Common battery in cellar vs. individual battery in apartment
Nearly all participants (n = 15) preferred a common battery in the cellar rather than an individual battery in
their apartments (n = 3).
Arguments in favor of an own battery were:
• an increased value of the flat due to the purchase
• an increasing independence from the neighbors and the overall energy system
As one of the participants put it:
“I am in favour of having your own battery, I rely on being able to use it even during periods of power
failure, as a backup. With the shared solution on the other hand, you do not have the same control
and there may be problems. I did like the thought of having my own battery, because I would know
that I would be in charge of it."
Related to this was distrust in neighbors to handle the energy wisely:
“Yes, if everybody were using it at the same time and no one gave it a second thought. It might not
be obvious to everybody that cutting down on consumption during a power failure and with
everyone having their own battery would be advisable. I would very much have liked to have my
own battery so that I could at least do the most necessary things.”
The latter quote also illustrates another finding, namely that participants in favor of having an own battery
rather than a common battery would also prefer to manage the energy facility themselves in order to gain
the greatest level of control.
Likewise, arguments in favor of the common battery show a relation to decisions on sharing and
management of the storage system – but in an opposite direction than the control approach outlined above.
Some participants preferred a common battery in combination with a sharing approach both based on the
assumption that this would be the option with the least level of involvement, remaining in their role of a
passive consumer rather than becoming a prosumer.
Other arguments for the common battery were:
• perceived risk that the technology might be too complicated to handle without expert knowledge
• health risk, as the following quote illustrates
“I have a tremendous respect for things like that. I don’t even want to charge my phone near my bed. It
is still kind of an experiment. We are living like that, we have no idea what it is.”
Sharing: Sharing energy vs. use of individual production and storage
The majority of participants favored a shared option (n = 11). This result is especially noteworthy given that
some of the Swedish participants assumed that sharing energy would assume a sharing of costs, e.g. in form
of a “flat rate” for energy as it is currently the case for water consumption in Sweden.
Arguments for sharing relate to social sustainability and solidarity:
D1.4 Consumer’s Engagement Strategies
InteGrid GA 731218 62 | 94
“I mean, presume you are having a massive party and lots of guests, or people who are staying over,
you will be consuming lots of electricity. Over a longer period, though… I think about solidarity as
well…. Looking back on my childhood, having a ridiculous number of siblings, there were eight of us
when I grew up and my mum became a single mother. You see, the washing machines are used
constantly, and a lot of electricity is being consumed. Now, as an adult with my children moving out
and things like that, perhaps I … I mean, what kind of society are we… Do I regard this as being part
of a large society or do I regard it as my personal house now?"
However, the pro-arguments for the sharing option do not only relate to social aspects as one might assume
based on the business model literature but rather refer to the argument of gaining independence - which
for other participants led to choices for individual solutions – was mentioned with regard to the
combination of sharing and self-management:
“But the advantages with having this app is that… then we won’t have Eon, that you buy electricity
from, saying that ”during these times you will have this and that and this and that much” but instead
you are sharing it between yourselves. I think you have your own facility. I think it would work
better.”
And
“Yes, and then there is this thing about trust, that you have your mobile app. I used to live in a house
and I think that even if I know how to read my electricity gauge, there will be someone who comes
over and does it anyhow. I do not trust them completely because it is about making a lot of money
too, there is a lot of money in it.”
Other participants address once more the need to be independent from other users:
“That is to say, the last question to me was that: here the electricity usage, and the first person to
connect draws electricity from the battery, if it is a shared one. Whereas here, I am guaranteed my
share, and you can pay a little extra or sell some if there is a surplus. That is why I chose individual
supply.”
The findings suggest that two different levels of gaining autarky and independence need to be
differentiated: (1) individual independence and (2) societal independence from current energy suppliers.
The wish to be independent contrasts with the above-mentioned preference of some participants to stay
in a passive role; while participants are motivated by the concept of energy independency, a need for
comfort and low responsibility is also mentioned several times, e.g.:
“About shared or individual, I can actually make a compromise there. It would be quite nice if others
took care of it.”
Management of battery: Local energy supplier vs. self-management
The concept of becoming a prosumer is of interest to the majority of participants (n = 13). A key argument
in favor of self-management of the energy facility is the possibility to get feedback on one’s energy
consumption and this is seen as relevant to reduce consumption and save money. Further economic
benefits are seen for this version, namely higher profits are expected without a third-party involvement.
Another argument is related to comfort: energy self-management allows optimizing the consumption based
D1.4 Consumer’s Engagement Strategies
InteGrid GA 731218 63 | 94
on own needs. This can of course be somewhat automated, but the preferences still need to be set by the
residents.
While the majority prefers managing the energy facility rather than letting it be controlled by a local energy
supplier, findings also show that the concept of being a prosumer rather than a passive consumer is clearly
not attractive to everyone. Given the euphoria over the prosumer-model in energy future scenarios, one
should also pay attention to the fact that five people decided for leaving the management responsibility
with the local energy supplier. Furthermore, it is noteworthy that even the 13 participants that preferred
the self-management of the energy facility via an app only want to take over responsibility in a limited way.
Namely, the assumed complexity of the system and the time investment discourage participants:
“The only thing I hesitated about was this mobile app. I agree with what you are saying, but I think it could … you are an amateur after all… and you are supposed to control it with an app.” “And you have a life, I think. You might not want to spend hours on end every day to, I don’t know, there are so many more important things in my life than checking an electricity gauge.”
“I was even considering having one of those apps that you control yourself. On the other hand,
wouldn’t I get bored silly? I probably would, and I would be happy to know there is an electricity
supplier that takes care of things like that.”
Financing of battery: Buy vs. rent
The majority of participants (n = 12) prefer to rent rather than buy the battery with the main reason being
that they expect a quick development of the technology and a leasing option would allow easier access to
the newest option. Another reason that also relates to less financial risks is that a rented battery wouldn’t
include an initial investment.
The third argument mentioned in favor of renting the battery relates to an aspect that also becomes salient
in the above described criteria: Comfort. Participants assume that a rented battery is easier to handle, e.g.
serviced by the providing company.
Electric vehicles: Bi-directional charging vs. no inclusion of EVs in the storage system
The majority of participants (n = 12) preferred to include bi-directional charging with electric vehicles in the
energy storage system of the house. Main reason for participants to decide against this option was the risk
of having an uncharged vehicle in the morning. A compromise mentioned by participants was to include
electric vehicles in the system but define a charging minimum dependent on residents’ needs.
Insights from stories
First of all, it is noteworthy that it only took participants a moment to get used to this more creative task
and then they were very motivated during this exercise and discussed intensively. Findings from a first
analysis of the stories reveal additional and sometimes also deeper insights into connections between the
new technology and consumers’ everyday life than gained during the classical methodology of focus groups.
This is not supposed to imply that focus groups are not of value – the findings above clearly show they
derive relevant insights into consumers’ perceptions of new energy systems – but rather to point out that
new methodologies like storytelling could complement this picture, e.g. by addressing emotional aspects
rather than rational arguments.

D1.4 Consumer’s Engagement Strategies
InteGrid GA 731218 64 | 94
Findings from the stories are in many aspects are in line with the above-mentioned results, e.g. they further
emphasize that the ease of use is important for integration of the new technology in consumers’ everyday
life:
“It is like a self-playing piano in a way, where I do not have to get that involved in the process, which
is important for me as I have a great many other things to deal with. 100% renewable energy is also
important, because although I am not very active it means I can still contribute.”
While new high-tech solutions are overall described very positively in all stories it is also highlighted that
they shouldn’t interfere with consumers’ life:
“It is important that things like air conditioning, being able to open a window or a balcony door feels
natural. I want to know that I have access to everything, for instance being able to get in and out of
the building despite there being an electrical failure. In other words, too much hi-tech can be
daunting.”
The results point out several benefits for consumers that could be gained from the new energy storage
system, including the ones mentioned above, namely (1) comfort (ease of use bringing me peace of mind)
and (2) economic benefits.
There are, however, also benefits highlighted that have not been mentioned in the focus groups. This also
indicates that storytelling as a method for data collection could derive new insights into consumers’
perceptions of new energy technologies. The main new benefit revealed here relates to sustainable
development as a driver for adapting new energy systems, including both ecological and social
sustainability.
Am I contributing to a better world?
This is the open question at the end of one of the stories created during the workshop.
Particularly the social benefits of the new system are highlighted in several stories, as the following quotes
show:
“Living in an energy-efficient house creates a great sense of community among residents”
“Creating a natural way of interacting with and getting to know your neighbours, leading to an
increased sense of security and to be able to make a difference.”
“Shared resources, for instance electricity, gives happier neighbours.”
“We are in this together.”
Summary
The workshop shows heterogeneous findings with regard to residents’ perceptions of the prosumer
concept presented in several business models on energy storage in particular and the future of energy
systems in general; an approach that contrasts with the currently rather passive role of consumers in an
often decentralised energy system in many European countries. The focus group discussions reveal
relevant insights into underlying motives of consumers’ preferences that we did not assume beforehand,
e.g. while House 1 was designed as a – rather active – prosumer-sharing option, focus groups show that –
quite the contrary – some participants choose this option because they assumed that a shared facility would
D1.4 Consumer’s Engagement Strategies
InteGrid GA 731218 65 | 94
result in low responsibility from their side. Likewise, the self-management via the app was assumed to
provide energy feedback but besides providing a possibility to monitor energy use to function rather
automatically, as the following quote shows
“I think it is a quite good app that controls everything automatically, so it is good to have an app.”
Overall, two contrasting motives seem to underlie residents’ decisions on energy storage facilities in their
apartments and relating preferences for business models on energy storage: (1) the desire to be
independent – being it independent as a community from energy suppliers or individual independence –
and (2) a need for a comfortable version that would be completely taken care. With the latter motive clearly
limiting the feasibility of the prosumer approach, as the following quote illustrates:
“And you have a life, I think. You might not want to spend hours on end every day to, I don’t know,
there are so many more important things in my life than checking an electricity gauge.”
Other relevant arguments mentioned by participants are (3) the reliability of the system and energy (4)
energy saving, with the latter mostly being of interest with regard to monetary savings.
The key controversy between independence and comfort encouraged participants to discuss compromises
between the two extremes and that they feel would fit best for them, e.g. to share energy but leave certain
parts individually; to reserve energy as participants formulate it. Another compromise is mentioned with
regard to the question of management: Residents are interested in an app to monitor their energy
consumption but do not want to be involved beyond this. The latter example illustrates the overall
perception of participating residents: There is an interest in becoming a little more active than in the current
system, e.g. there were very positive reactions with regard to energy feedback but at the same time to
remain key responsibility for energy system with third-parties. Given the distrust towards current big
energy suppliers displayed in the focus group discussions, this might be a good opportunity for niche
companies to gain momentum in the market.
The storytelling exercise reveals another factor that could drive the change towards shared energy systems:
social sustainability and the need for increased social belonging in our currently rather isolated society.
Several residential participants associated the new, shared energy system with an improved sense of
community.
4.3.4. Energy Storage – Lisbon
In the following, main results from the Portuguese workshop are presented and cross-country comparisons
between Sweden and Portugal are discussed.
Place of battery: Common battery in cellar vs. individual battery in apartment
The majority of participants (n = 27, 58.7%) preferred an individual battery in their apartment compared to
a common battery in the cellar. This result contrasts with the findings in Sweden where nearly all
participants decided for a common battery rather than an individual battery in their apartments.
Sharing: Sharing energy vs. use of individual production and storage
D1.4 Consumer’s Engagement Strategies
InteGrid GA 731218 66 | 94
The vast majority, 87% of participants, favored an individual access option over shared access. Again, this
contrasts with the Swedish findings. In the Swedish workshop, the majority of participants favored a shared
option. This is particularly noteworthy as findings from the focus group discussion in Part 2 of the workshop
reveals that this criterion was for many participants the key criterion for their decision between the
Prosumer-Sharing option (House 1) versus the Comfort-Independence setting (House 2). Namely, from the
32 participants that decided for the Comfort-Independence option, 22 mentioned that the avoidance of a
shared solution was the key argument for them. This had more weight for them then the – perceived
disadvantageous – solution of a bought battery rather than a rented battery. Thus, they accepted the
perceived higher costs for acquisition and maintenance in order to remain – or gain – independency from
their neighbors’ behaviour. A strong sense of property and possession accompanied the question of
independence from other people’s energy behaviour.
Management of battery: Local energy supplier vs. self-management
The majority of participants (n = 32, 73.9%) were interested in proactively managing the battery themselves
using an app. This criterion seemed to be of relevance for Portuguese participants. For the participants that
decided for the Prosumer-Sharing option the community energy control was a key factor for their decision.
Likewise, the majority of participants (n = 13) in Sweden were interested in using the app to control the
energy storage system themselves rather than relying on an energy supplier. It should however be kept in
mind that findings from the focus groups in Sweden also revealed that the participants expected the app
to manage most of the system automatically and that they would only partly be active. Similarly,
Portuguese participants also saw advantages of not taking over responsibility but rather leave this with
network operators.
Financing of battery: Buy vs. rent
The majority of participants (n = 28, 60.9%) prefer to rent rather than buy the battery. This result is in line
with the Swedish findings; in Sweden the majority of participants (n = 12) also prefer to rent rather than
buy the battery.
Electric vehicles: Bi-directional charging vs. no inclusion of EVs in the storage system
In contrast to the Swedish findings, the majority of participants (n = 27, 58.7%) preferred to not include
electric vehicles as part of their energy storage system. However, the focus groups discussion revealed that
this criterion is of less relevance for participants’ preference on house configuration presented in Part 2 of
the workshop. This might be caused by the slower uptake of electric vehicles in Portugal than in Sweden.
Insights from stories
This part of the workshop differed a little bit between the two countries. Namely, the Swedish workshop
asked for participants to imagine their life with the new energy storage solutions while the Portuguese
participants were presented a broader scenario of a smart house that would also include energy storage.
Participants in Portugal were then asked to list perceived advantages and disadvantages of living in a smart
house.
While the instructions differed a little, the findings were still in many ways comparable. Both Swedish and
Portuguese partners see ecological and economic benefits of the new technologies, mainly due to increased
efficiency and energy savings, as well as an increased level of comfort with positive results on well-being.
D1.4 Consumer’s Engagement Strategies
InteGrid GA 731218 67 | 94
An aspect that Swedish partners mentioned but that was not discussed in the Portuguese workshop was
improvements with regard to social sustainability, namely the closer connection between neighbours due
to shared energy facilities.
Another difference between participants from the two countries lies in the negative aspects mentioned in
this part of the workshop. In Portugal participants were more concerned about technological dependence
and the related risk of failures. Also security, including data protection, was raised as an issue. In addition,
energy justice was brought up in the discussions, relating to the aspect that the new technologies would
not be available for everyone. None of these topics were brought up in the Swedish workshop.
4.4. Evaluation Survey – T0 Baseline Sweden
4.4.1. Descriptive Statistics
Sample
Of the 300 participants, 142 (47.3%) were female and 158 (52.7%) male, all aged between 18 and 81 years
(M = 49.55, SD = 16.71). The majority of participants were born (91.0%) and/or raised (95.0%) in Sweden
and had a university degree (82%), 17.0% had finished secondary school and 1.0% had a primary school
education. Most participants were either employees (56.0%), retired (23.7%) or self-employed (9.0%).
On average, our participants shared their household with 1.30 other people (SD = 1.14). The majority of
them said the current income of the household was enough to live on comfortably (46.7%) or very
comfortably (30.0%), 19.0% were coping on current income and 4% found it difficult or very difficult to live
on their income at the time of the survey. Almost all participants (97.3%) lived in an apartment. The
buildings these apartments were in belonged mainly to a housing cooperation (58.7%) or to owners who
rented individual apartments (39.0%). The average floor size of participant’s apartments or houses was
70.75m2 (SD = 24.97).
Status quo of energy saving behaviours
On average, participants rated the extent to which they currently save energy in their household as 4.80 on
a seven-point scale (SD = 1.37). The past effort to save energy was rated at 4.41 (SD = 1.57), the past time
and labour invested in this goal at 3.61 (SD = 1.53). 39.90% obtained environmentally certified electricity,
21.00% obtained other forms of energy and 39.70% did not know the kind of energy in their household
obtained.
The results for the interview questions regarding specific energy saving behaviours are displayed in Table
11. Most of the participants (83.7%) mentioned at least one action they take to save energy in their
household, after listening to the examples of the interviewer this percentage rose to 91.3%. Almost half of
the participants (43.0%) mentioned at least one action that was not covered in the prepared list the
interviewer used, these included the use of energy saving light bulbs, cycling and composting. The most
frequently mentioned energy saving behaviours was turning of unused lights (45.0%), while only 3.3% of
the subjects had added isolations to windows or walls. For almost all behaviours (except the insulation of

D1.4 Consumer’s Engagement Strategies
InteGrid GA 731218 68 | 94
windows and walls and the setting and defrosting of fridges/freezers), the majority of those who displayed
the behaviours reported to do so often.
Table 11. Frequency of energy saving behaviours mentioned in the survey (Sweden).
Action Mentioned
Frequency
free recall prompted
often occasionally never
Turned off lights when not needed 45.0% 48.0%
93.2% 6.8% 0.0%
Turned off TV instead of using standby 21.7% 45.7%
77.7% 18.8% 3.5%
Bought energy efficient home appliances 10.7% 36.3%
68.1% 24.1% 7.8%
Set temperature in fridge/freezer, defrost 2.3% 55.7%
49.4% 45.4% 5.2%
Lowered indoor temperature 13.3% 31.0%
59.4% 36.1% 4.5%
Added insulation to windows or walls 3.3% 11.7%
40.0% 51.1% 8.9%
Lowered consumption of hot tap water 22.3% 42.3%
68.0% 28.9% 3.1%
Other 1 Item 43.0% -
89.1% 9.4% 1.6%
Other 2 Items 14.0% -
86.4% 13.6% 0.0%
Other 3+ Items 4.0% -
100.0% 0.0% 0.0%
Used/bought energy saving light bulbsa 15% - - - -
Recycled/sorted wastea 6.3% - - - -
Run washing machines full 5.7% - - - -
None 16.3% 8.7%
- - -
Note: Frequency are percentages only of those who mentioned an item, in free recall or after prompting
Status quo of social sustainability
On the scale for place attachment (Cronbach’s α = .881), participants average score was above the scale
mean, M = 4.25, SD = 1.29. To the question if people talk to each other when they meet in participants
neighbourhood, the average answer was 4.95 (SD = 1.53).
For the measuring of social bonds, as can be seen in Table 12, the majority of our participants were content
with the social bonds where they lived as they considered them neither too high nor too low. However,
25% of participants think that there is too little insight into the lives of others in their community and 23.3%
of those who said this topic applies to them think that people take too little responsibility for each other’s
children. This shows that despite the overall positive responses, there are aspects of social bonds where
people feel the need for improvement.
The same can be said for participants’ description of their social bonds (see Table 13): while they
generally reported good social relationships with all of the groups of people covered in our survey, with
especially high numbers for friends and family, there certainly is still room for improvement regarding social
bonds to neighbours.
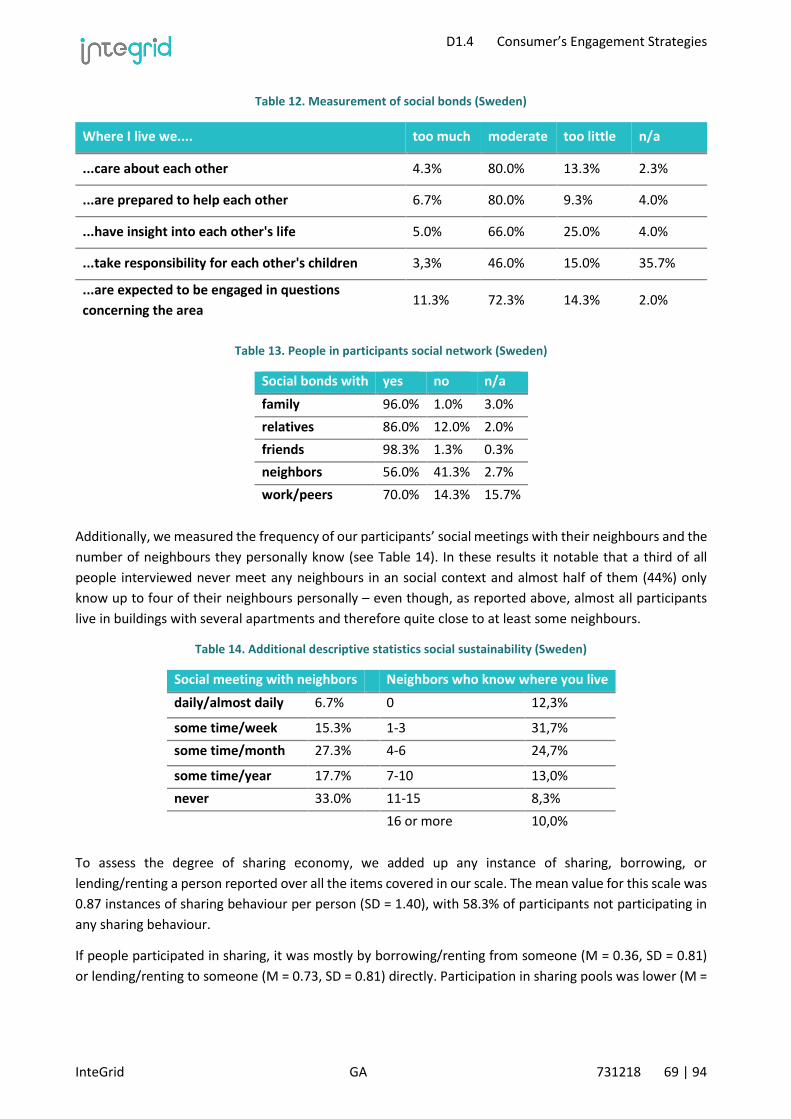
D1.4 Consumer’s Engagement Strategies
InteGrid GA 731218 69 | 94
Table 12. Measurement of social bonds (Sweden)
Where I live we.... too much moderate too little n/a
...care about each other 4.3% 80.0% 13.3% 2.3%
...are prepared to help each other 6.7% 80.0% 9.3% 4.0%
...have insight into each other's life 5.0% 66.0% 25.0% 4.0%
...take responsibility for each other's children 3,3% 46.0% 15.0% 35.7%
...are expected to be engaged in questions
concerning the area 11.3% 72.3% 14.3% 2.0%
Table 13. People in participants social network (Sweden)
Social bonds with yes no n/a
family 96.0% 1.0% 3.0%
relatives 86.0% 12.0% 2.0%
friends 98.3% 1.3% 0.3%
neighbors 56.0% 41.3% 2.7%
work/peers 70.0% 14.3% 15.7%
Additionally, we measured the frequency of our participants’ social meetings with their neighbours and the
number of neighbours they personally know (see Table 14). In these results it notable that a third of all
people interviewed never meet any neighbours in an social context and almost half of them (44%) only
know up to four of their neighbours personally – even though, as reported above, almost all participants
live in buildings with several apartments and therefore quite close to at least some neighbours.
Table 14. Additional descriptive statistics social sustainability (Sweden)
Social meeting with neighbors Neighbors who know where you live
daily/almost daily 6.7% 0 12,3%
some time/week 15.3% 1-3 31,7%
some time/month 27.3% 4-6 24,7%
some time/year 17.7% 7-10 13,0%
never 33.0% 11-15 8,3%
16 or more 10,0%
To assess the degree of sharing economy, we added up any instance of sharing, borrowing, or
lending/renting a person reported over all the items covered in our scale. The mean value for this scale was
0.87 instances of sharing behaviour per person (SD = 1.40), with 58.3% of participants not participating in
any sharing behaviour.
If people participated in sharing, it was mostly by borrowing/renting from someone (M = 0.36, SD = 0.81)
or lending/renting to someone (M = 0.73, SD = 0.81) directly. Participation in sharing pools was lower (M =
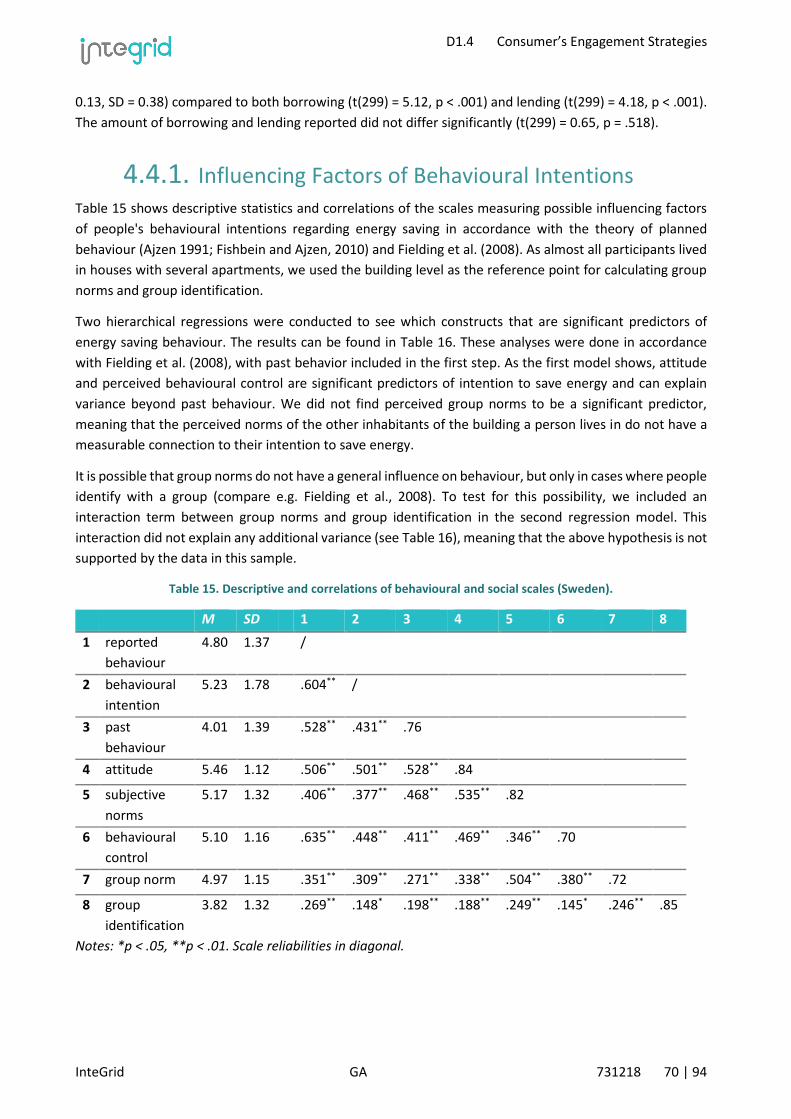
D1.4 Consumer’s Engagement Strategies
InteGrid GA 731218 70 | 94
0.13, SD = 0.38) compared to both borrowing (t(299) = 5.12, p < .001) and lending (t(299) = 4.18, p < .001).
The amount of borrowing and lending reported did not differ significantly (t(299) = 0.65, p = .518).
4.4.1. Influencing Factors of Behavioural Intentions Table 15 shows descriptive statistics and correlations of the scales measuring possible influencing factors
of people's behavioural intentions regarding energy saving in accordance with the theory of planned
behaviour (Ajzen 1991; Fishbein and Ajzen, 2010) and Fielding et al. (2008). As almost all participants lived
in houses with several apartments, we used the building level as the reference point for calculating group
norms and group identification.
Two hierarchical regressions were conducted to see which constructs that are significant predictors of
energy saving behaviour. The results can be found in Table 16. These analyses were done in accordance
with Fielding et al. (2008), with past behavior included in the first step. As the first model shows, attitude
and perceived behavioural control are significant predictors of intention to save energy and can explain
variance beyond past behaviour. We did not find perceived group norms to be a significant predictor,
meaning that the perceived norms of the other inhabitants of the building a person lives in do not have a
measurable connection to their intention to save energy.
It is possible that group norms do not have a general influence on behaviour, but only in cases where people
identify with a group (compare e.g. Fielding et al., 2008). To test for this possibility, we included an
interaction term between group norms and group identification in the second regression model. This
interaction did not explain any additional variance (see Table 16), meaning that the above hypothesis is not
supported by the data in this sample.
Table 15. Descriptive and correlations of behavioural and social scales (Sweden).
M SD
1 2 3 4 5 6 7 8
1 reported
behaviour
4.80 1.37
/
2 behavioural
intention
5.23 1.78
.604** /
3 past
behaviour
4.01 1.39
.528** .431** .76
4 attitude 5.46 1.12
.506** .501** .528** .84
5 subjective
norms
5.17 1.32
.406** .377** .468** .535** .82
6 behavioural
control
5.10 1.16
.635** .448** .411** .469** .346** .70
7 group norm 4.97 1.15
.351** .309** .271** .338** .504** .380** .72
8 group
identification
3.82 1.32
.269** .148* .198** .188** .249** .145* .246** .85
Notes: *p < .05, **p < .01. Scale reliabilities in diagonal.

D1.4 Consumer’s Engagement Strategies
InteGrid GA 731218 71 | 94
Table 16. Hierarchical regression analyses predicting intention to save energy (Sweden)
Step predictor R R2 R2ch F df
1 past behaviour 0.43 0.19 0.18 67.94** 1/298 0.16**
2 attitude 0.58 0.34 0.33 13.56** 5/293 0.27**
subjective
norms
0.05
behavioral
control
0.21**
group norms
0.07
group
identification
0.01
1 past behavior 0.58 0.34 0.33 25.01** 6/293 0.16**
attitude 0.27**
subjective
norms
0.05
behavioral
control
0.21**
group norms
0.06
group
identification
0.01
2 group norms x
identification
0.58 0.35 0.32 0.184 1/292 -0.02
Notes: *p < .05, **p < .01. ϐ-coefficients computed with all variables in the model
One reason for the nonsignificant results regarding the social variables might be the comparatively low
identification our participants reported with the relevant reference group – in our case their neighbours.
As a reference, Fielding and colleagues (2008) found an interaction between perceived group norms and
group identification only in their second study, where the average group identification was 5.41 (SD = 1.51)
on the same seven-point scale we used in our survey. In their first study, where this interaction did not
reach significance, mean group identification was at 4.58 (SD = 1.63) which is still higher than our samples
mean of 3.82 (SD = 1.32).
4.5. Evaluation Survey – T0 Baseline Portugal
4.5.1. Descriptive Statistics
Sample
Of the 65 participants of this survey, 33.8% were female and 66.2% were male, all aged between 21 and 75
years (M = 40.97, SD = 13.77). 95.4% of the participants were born in Portugal and 98.5% grew up there.

D1.4 Consumer’s Engagement Strategies
InteGrid GA 731218 72 | 94
The majority (56.9%) had a university degree, 40.0% had secondary education and 1.5% each had finished
middle school and primary school.
Most of our participants were employees (80.0%), fewer were retired (7.7%), self-employed (6.2%),
unemployed (4.6%) or students (1.5%). Participants shared their household with an average of 3.23 other
people (SD = 2.93). The majority said they were coping on their current income (50.8%), 29.2% were living
comfortably and 20.0% found it difficult or very difficult to live on their current income. About half of the
people in our sample lived in a house (50.8%), the others lived either in an apartment (41.7%) or a semi-
detached house (7.7%). 81.3% owned the space they lived in while 16.9% rented. The average floor size of
participants’ apartments or houses was 182.68 m2 (SD = 151.10).
Status quo of energy saving behaviour
At the time of the survey, participants rated their energy saving behaviour at 8.09 on a ten-point scale (SD
= 1.48). Behavioural intentions were rated at 8.58 (SD = 1.80). 47.7% of the participants lived in a household
with an energy certification, 32.3% did not have such a certification and 20.0% did not know if they had
one. The majority (66.2%) said they save energy frequently, 32.3% reported to do so occasionally and 1.5%
never save energy. The frequency with which participants show the concrete energy saving behaviours
covered in the survey can be found in Table 17.
Table 17. Frequency of energy saving behaviour (Portugal)
yes no
Turned off lights when not needed 93.8% 6.2%
Turned off the TV instead of using the
standby mode
38.5% 61.5%
Bought energy efficient home
appliances
66.2% 33.8%
Set correct temperature in
fridge/freezer, defrost regularly
27.7% 72.3%
Lowered the indoor temperature 38.5% 61.5%
Added insulation to windows or walls 43.1% 56.9%
Lowered the consumption of hot tap
water
61.5% 38.5%
Table 18. Measurement of social bonds (Portugal).
Where I live we.... too much moderate too little
...care about each other 30.8% 50.8% 18.5%
...are prepared to help each other 26.2% 63.1% 10.1%
...have insight into each other's life 38.5% 44.6% 16.9%
...take responsibility for each
other's children
9.2% 50.8% 40.0%
...are expected to be engaged in
questions concerning the area
33.8% 44.6% 21.5%
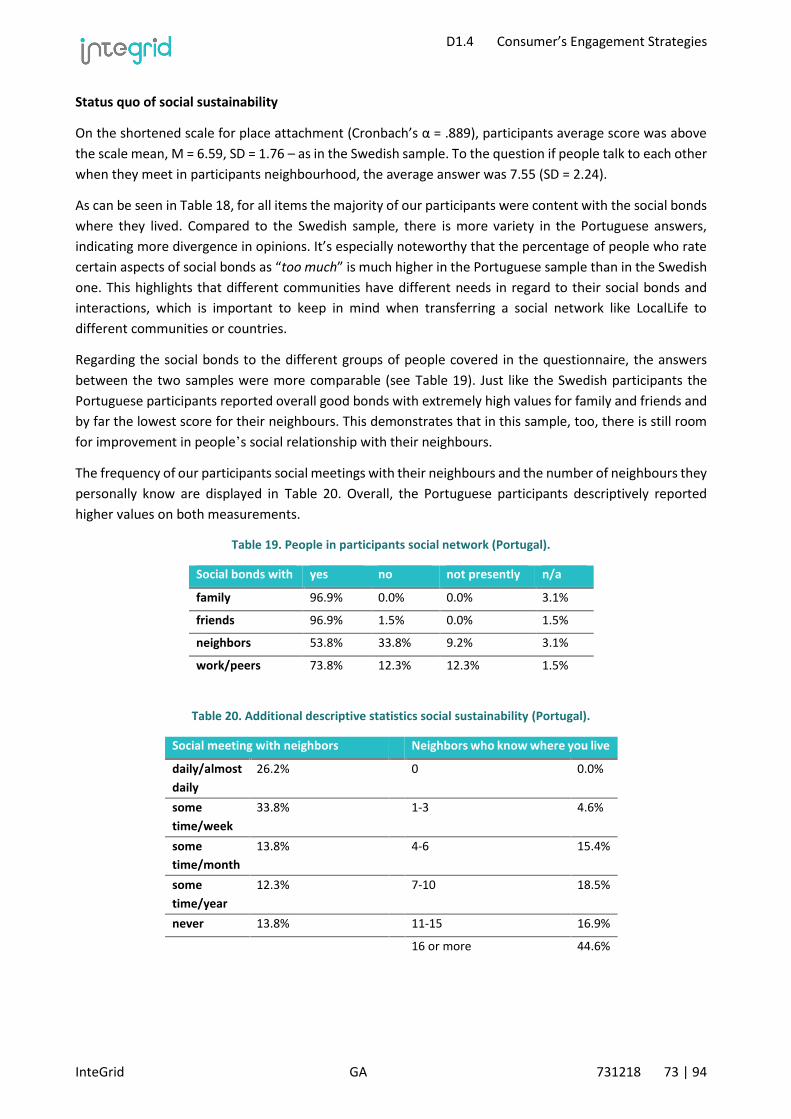
D1.4 Consumer’s Engagement Strategies
InteGrid GA 731218 73 | 94
Status quo of social sustainability
On the shortened scale for place attachment (Cronbach’s α = .889), participants average score was above
the scale mean, M = 6.59, SD = 1.76 – as in the Swedish sample. To the question if people talk to each other
when they meet in participants neighbourhood, the average answer was 7.55 (SD = 2.24).
As can be seen in Table 18, for all items the majority of our participants were content with the social bonds
where they lived. Compared to the Swedish sample, there is more variety in the Portuguese answers,
indicating more divergence in opinions. It’s especially noteworthy that the percentage of people who rate
certain aspects of social bonds as “too much” is much higher in the Portuguese sample than in the Swedish
one. This highlights that different communities have different needs in regard to their social bonds and
interactions, which is important to keep in mind when transferring a social network like LocalLife to
different communities or countries.
Regarding the social bonds to the different groups of people covered in the questionnaire, the answers
between the two samples were more comparable (see Table 19). Just like the Swedish participants the
Portuguese participants reported overall good bonds with extremely high values for family and friends and
by far the lowest score for their neighbours. This demonstrates that in this sample, too, there is still room
for improvement in people’s social relationship with their neighbours.
The frequency of our participants social meetings with their neighbours and the number of neighbours they
personally know are displayed in Table 20. Overall, the Portuguese participants descriptively reported
higher values on both measurements.
Table 19. People in participants social network (Portugal).
Social bonds with yes no not presently n/a
family 96.9% 0.0% 0.0% 3.1%
friends 96.9% 1.5% 0.0% 1.5%
neighbors 53.8% 33.8% 9.2% 3.1%
work/peers 73.8% 12.3% 12.3% 1.5%
Table 20. Additional descriptive statistics social sustainability (Portugal).
Social meeting with neighbors Neighbors who know where you live
daily/almost
daily
26.2% 0 0.0%
some
time/week
33.8% 1-3 4.6%
some
time/month
13.8% 4-6 15.4%
some
time/year
12.3% 7-10 18.5%
never 13.8% 11-15 16.9%
16 or more 44.6%
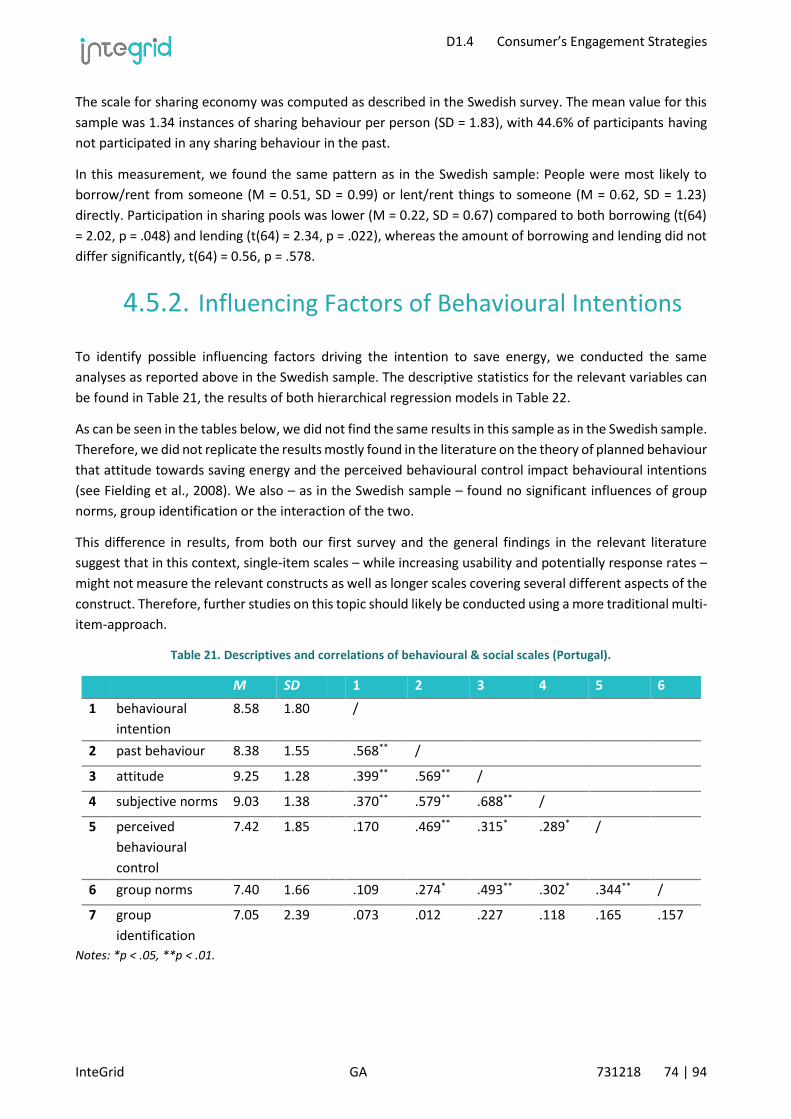
D1.4 Consumer’s Engagement Strategies
InteGrid GA 731218 74 | 94
The scale for sharing economy was computed as described in the Swedish survey. The mean value for this
sample was 1.34 instances of sharing behaviour per person (SD = 1.83), with 44.6% of participants having
not participated in any sharing behaviour in the past.
In this measurement, we found the same pattern as in the Swedish sample: People were most likely to
borrow/rent from someone (M = 0.51, SD = 0.99) or lent/rent things to someone (M = 0.62, SD = 1.23)
directly. Participation in sharing pools was lower (M = 0.22, SD = 0.67) compared to both borrowing (t(64)
= 2.02, p = .048) and lending (t(64) = 2.34, p = .022), whereas the amount of borrowing and lending did not
differ significantly, t(64) = 0.56, p = .578.
4.5.2. Influencing Factors of Behavioural Intentions
To identify possible influencing factors driving the intention to save energy, we conducted the same
analyses as reported above in the Swedish sample. The descriptive statistics for the relevant variables can
be found in Table 21, the results of both hierarchical regression models in Table 22.
As can be seen in the tables below, we did not find the same results in this sample as in the Swedish sample.
Therefore, we did not replicate the results mostly found in the literature on the theory of planned behaviour
that attitude towards saving energy and the perceived behavioural control impact behavioural intentions
(see Fielding et al., 2008). We also – as in the Swedish sample – found no significant influences of group
norms, group identification or the interaction of the two.
This difference in results, from both our first survey and the general findings in the relevant literature
suggest that in this context, single-item scales – while increasing usability and potentially response rates –
might not measure the relevant constructs as well as longer scales covering several different aspects of the
construct. Therefore, further studies on this topic should likely be conducted using a more traditional multi-
item-approach.
Table 21. Descriptives and correlations of behavioural & social scales (Portugal).
M SD
1 2 3 4 5 6
1 behavioural
intention
8.58 1.80
/
2 past behaviour 8.38 1.55
.568** /
3 attitude 9.25 1.28
.399** .569** /
4 subjective norms 9.03 1.38
.370** .579** .688** /
5 perceived
behavioural
control
7.42 1.85
.170 .469** .315* .289* /
6 group norms 7.40 1.66
.109 .274* .493** .302* .344** /
7 group
identification
7.05 2.39
.073 .012 .227 .118 .165 .157
Notes: *p < .05, **p < .01.

D1.4 Consumer’s Engagement Strategies
InteGrid GA 731218 75 | 94
Table 22. Hierarchical regression analyses predicting intention to save energy (Portugal).
Step predictor R R2 R2ch F df
1 past behaviour 0.57 0.32 0.31 29.99** 1/63 0.59**
2 attitude 0.60 0.36 0.29 0.64 6/58 0.14
subjective norms
-0.01
perceived behavioural control
-0.15
group norms
-0.08
group identification
0.07
1 past behaviour 0.57 0.32 0.31 29.99** 1/63 0.56**
2 attitude 0.60 0.36 0.29 0.64 6/58 0.18
subjective norms -0.02
perceived behavioral control
-0.11
group norms -0.09
group identification
0.06
3 norms x identification
0.61 0.37 0.29 0.82 1/57 0.10
Notes: *p < .05, **p < .01. ϐ-coefficients computed with all variables in the model
4.6. Office Employee Consultation Workshops –
Ljubljana and Domzale
This workshop concept was applied in Slovenia on the 10th of April 2018 in two office buildings belonging
to Elektro Ljublijana – one situated in central Ljublijana and one in Domzale – under the leadership of the
Elektro Ljublijana employee Uršula Krisper. Uršula reported overall successful workshops with occupants
showing positive attitudes and interests in the project.
Current occupant behaviour
These are the summarised results of the survey, enquiring about plug-load interactions and work hours:
• The plug-loads listed by the occupants in the survey were the following: Computers, monitors,
system printers, ceiling lights, individual air heaters, thermostats for heating and cooling, radio,
phone charger, refrigerator, microwave oven and toaster.
• The occupants believe that they are generally good at turning off appliances (specifically
computers and lights) that are not being used. Only a minority of occupants tend to leave
computers on.

D1.4 Consumer’s Engagement Strategies
InteGrid GA 731218 76 | 94
• The occupants typically arrive to the office at 6.30, take a lunch break around 10.00-11.00 and
leave the office at 14.30. By 15.00 cleaners arrive to the building.
Identifying action points
During the group discussions when the workshop participants were asked to suggest action points, many
creative and thoughtful suggestions came up. This is positive and shows occupant interest and
understanding of the issue.
A considerable share of the energy demand for Elektro Ljublijana comes from the air conditioning. This was
therefore central to the discussions about possible action points towards conservation and flexibility. It was
well understood and raised by the occupants themselves that this issue matters the most to the overall
building energy.
The actions suggested by the occupants, related to the air conditioning were, in summary: Using the blinds
to lessen need for air conditioning; turning off the air conditioning at the end of the workday; turning off
air conditioning when windows are open; and using the ventilation to take in cold air during the night in
summer time.
A concern highlighted by the occupants was that the air conditioning is controlled centrally and not by any
of the participants in the workshop. To change the air conditioning use pattern, a new scheme would have
to be communicated to the staff managing the central cooling of the building. It was also discussed that the
management of air conditioning must be done with care and precision in order not to compromise the
thermal comfort in the office.
In terms of other plug-loads in the office, the following actions were suggested: Turning computers off
during longer absence; turning the lights off in the bathrooms; charging electric vehicles during the night;
running washing machines and dryers during low tariffs and only when they are full; replacing old bulbs
with LED lights.
Some occupants expressed a concern that there is not much room for them to further switch off appliances
without affecting the working process.
Action points
It was concluded in the dialogue with the workshop participants that the occupant behaviour program
should focus on smarter management of the air conditioning and on encouraging occupants to be thorough
in switching off computers and monitors that are not in use, especially during the lunch breaks.
Fulfilment of objectives
The fulfilment of the workshop objectives is discussed below.
• Inform and educate the occupants on building energy
The background of the project and the concept of grid flexibility was explained to the occupants during the
workshop. Although there was no explicit indicator of how well the occupants followed the theoretical
introduction to building energy, the thoughtful suggestions and discussions during the later parts of the
workshops show that the occupants had a good understanding of the issue at hand.
D1.4 Consumer’s Engagement Strategies
InteGrid GA 731218 77 | 94
• Gather information on occupant behaviour and attitudes
The reported plug-load interactions and working hours were listed and provided input for the development
of the occupant behaviour program. The occupant attitudes were not surveyed, but their active
participation in the workshop shows interest and the workshop leader reported that the overall attitudes
towards this initiative were positive.
• Identifying action points through occupant participation
Management of air conditioning and thorough attention to switching off un-used computers and monitors
were identified as focal points in the occupant behaviour program for Elektro Ljubljana. Both action points
were found among occupant suggestions and were discussed and deemed acceptable from an occupant
perspective.
• Building approval and motivation for the program among occupants
The level of achievement of this soft objective is difficult to measure at this point, since the workshop
constitutes only an initial phase of a long-term occupant behaviour program. However, the fact that
occupants were active during the workshop and positive about the outcome are satisfactory signs with
respect to the fulfilment of this objective. Through the dialogue between occupants and the manager of
the behavior change program that took place in the workshop, insights were also gained about occupants’
(self-reported) drivers and concerns with respect to changing their energy behavior. These factors – such
as rewards, frequency of reminders, thermal comfort and effect on productivity and workload – will be
considered in the consequent design and implementation of the behavioural change program. Respecting
and meeting these occupant needs will count towards a more wide-spread approval of the program and
stronger motivation.
D1.4 Consumer’s Engagement Strategies
InteGrid GA 731218 78 | 94
5. Summary
This deliverable is the outcome of task 1.4 in the InteGrid project – and it revolves around an inherently
transdisciplinary challenge: long-term engagement of consumers in the smart electricity grid. The
contributions of this report stand on three legs that provide the InteGrid with insights, and practical
guidelines on how to better engage the end users in the smart grid – across the demo sites in Sweden,
Portugal, and Slovenia. The results are however also relevant to the wider smart grid community.
The first leg of this report was a literature review on feedback mechanisms, that drew on findings from
existing field tests and the subject matter expertise of the authors. This resulted in a number of practical
recommendations to the project that are particularly important to HLUC 9 and HLUC 11. Towards this aim,
algorithms for household-specific baselines were also important to tailor the feedback to the actual
household and to increase consumer trust in the feedback.
The second leg of this report was the local stakeholder consultation workshops where consumers in
Portugal and Sweden were invited to discuss community storage and feedback, and office employees in
Slovenia were invited to discuss their role in the building’s peak load reduction. This report also provides
comprehensive guidelines for how to conduct stakeholder consultation workshops for these aims.
To better understand how consumers interpret and react to energy feedback given in the context of a social
network application, two stakeholder consultation workshops were held – one in Stockholm and one in
Lisbon – where a visual prototype of the energy feedback functionality was presented and discussed in
focus groups. The participants generally found that presenting the feedback as percentages made it difficult
to grasp and they would prefer colors and bars. They liked the concrete tips provided on what concrete
actions to take in order to reach the energy goals. In the Portuguese demo workshop, they also wanted
data on how much money they were saving by reaching their energy goals. The attitudes towards
comparing energy conservation and load shifting achievements with other households or neighborhoods
were different among the participant; the competitive element really appealed to some but not to others.
The Stockholm workshop also assessed the significance of feedback aggregation levels; apartment, building
or neighborhood. The results suggested that apartment level may be the most relevant in encouraging
people to take action and it also makes their contribution directly visible in the feedback. Building or
neighborhood level feedback was encouraged by the participants as it adds more to the social sustainability
by uniting people towards a common goal. However based on the baseline survey results, further research
is required to determine whether social identity can be used to strengthen engagement.
Regarding consumers’ attitudes towards energy storage business models, the workshops showed that while
in Portugal the majority of participants favored having an own battery in their apartments, in Sweden nearly
all participants favored a common battery. This relates to findings on preference for shared versus
individual solutions in the two countries: Swedish participants favored a shared option, Portuguese partners
perceived this rather as a risk. The named risks, e.g. running out of energy due to high demand of
neighbours, was also mentioned by some Swedish participants but played an overall smaller role in the
decision process. A reason for this might be that sharing concepts in housing, e.g. shared laundry rooms are
more common in Sweden and people got used to this solution. A compromise of this conflict that was

D1.4 Consumer’s Engagement Strategies
InteGrid GA 731218 79 | 94
named in both workshops is a “limited sharing”, e.g. with the possibility to reserve a certain amount of
energy for each user.
In Ljubljana and Domzale the office employees indicated an interest and willingness to participate in the
projects peak reducton program by reducing plug loads during the mid-day peak hours, particularly during
their lunch hour. The workshops resulted in a one year campaign proposal at Elektro Ljubljana based on a
flexibility competition between two offices [REFD4.1].
The third – evaluation – while outside the scope of this task, was considered important to be developed in
T1.4 for further implementation in the demonstration work packages. A survey was designed that covers
energy attitudes, behaviors, and intentions, as well as social identity and cohesion in their neighborhoods
and buildings. The baseline surveys were conducted and summarized in Lisbon and Stockholm, where there
are residential consumers in the demonstrators. The Stockholm survey shows that the participants’ energy
saving behaviours are mainly influenced by their attitudes and the perceived control they have over energy
saving activities. At this point in the project, the residents did not identify strongly with their neighbourhood
or buildings, which therefore made the role of social identity inconclusive. Measures of social cohesion
reveal room for improvement regarding neighbourhood social bonds and again indicate a need for
increased social belonging.
The Lisbon survey did not find an influence of attitudes and perceived control on energy saving behaviour,
which might be partly due to the fact that a shorter version of the questionnaire, designed to increase
usability, was tested here. Differences between the samples regarding both energy behaviour and the
evaluation of social interactions highlight the importance of tailored approaches to engage consumers in
different communities with different needs.
D1.4 Consumer’s Engagement Strategies
InteGrid GA 731218 80 | 94
References
InteGrid Documents
[REF GA] InteGrid’s Grant Agreement
[REF D6.1] Concept of the market hub, central platform and services. Deliverable D6.1, June 2017.
External Documents
Abrahamse, W., & Steg, L. (2009). How do socio-demographic and psychological factors relate to households’ direct and indirect energy use and savings?. Journal of economic psychology, 30(5), 711-720.
Abrahamse, W., & Steg, L. (2013). Social influence approaches to encourage resource conservation: A meta-analysis. Global environmental change, 23(6), 1773-1785.
Abrahamse, W., Steg, L., Vlek, C., & Rothengatter, T. (2007). The effect of tailored information, goal setting, and tailored feedback on household energy use, energy-related behaviors, and behavioral antecedents. Journal of environmental psychology, 27(4), 265-276.
Achterberg, P., Houtman, D., van Bohemen, S., & Manevska, K. (2010). Unknowing but Supportive? Predispositions, Knowledge, and Support for Hydrogen Technology in the Netherlands. International Journal of Hydrogen Energy, 35 (12), 6075–83.
Ajzen, I., 1991. The theory of planned behavior. Orgnizational Behav. Hum. Decis. Process. 50, 179–211. doi:10.1016/0749-5978(91)90020-T
Allcott, H. (2011). Social norms and energy conservation. Journal of Public Economics. Asensio, O. I., & Delmas, M. A. (2016). The dynamics of behavior change: Evidence from energy
conservation. Journal of Economic Behavior & Organization, 126, 196-212. Bartram, L. (2015). Design challenges and opportunities for eco-feedback in the home. IEEE Computer
Graphics and Applications, 35argeant, J., Mcnaughton, E., Mercer, S., Murphy, D., Sullivan, Sargeant, J., Mcnaughton, E., Mercer, S., Murphy, D., Sullivan, P., & Bruce, D. A. (2011). Providing feedback: exploring a model (emotion, content, outcomes) for facilitating multisource feedback. Medical teacher, 33(9), 744-749.
Boork, M., Thomtén, M., Brolin, M., Uyterlinde, M., Straver, K., Kraan, C., ... & Maggiore, S. (2014). Key success factors and barriers to end-user engagement in smart grid projects. In BEHAVE2014-Behaviour and Energy Efficiency Conference.
Bourne, L. (2006). Project relationships and the Stakeholder Circle. Paper presented at PMI® Research Conference: New Directions in Project Management, Montréal, Québec, Canada. Newtown Square, PA: Project Management Institute.
Broms, L., Katzeff, C., Bång, M., Nyblom, Å., Hjelm, S. I., & Ehrnberger, K. (2010, August). Coffee maker patterns and the design of energy feedback artefacts. In proceedings of the 8th ACM conference on designing interactive systems (pp. 93-102). ACM.
Buchanan, K., Russo, R., & Anderson, B. (2014). Feeding back about eco-feedback: How do consumers use and respond to energy monitors?. Energy Policy, 73, 138-146.
Buchanan, K., Russo, R., & Anderson, B. (2015). The question of energy reduction: The problem (s) with feedback. Energy Policy, 77, 89-96.
Burgess, J., & Nye, M. (2008). Re-materialising energy use through transparent monitoring systems. Energy Policy, 36(12), 4454-4459.
Community Places (2014) Community Planning Toolkit, https://www.communityplanningtoolkit.org/sites/default/files/Engagement.pdf

D1.4 Consumer’s Engagement Strategies
InteGrid GA 731218 81 | 94
Darby, S. (2006). The effectiveness of feedback on energy consumption. A Review for DEFRA of the Literature on Metering, Billing and direct Displays, 486(2006).
Darby, S. (2008). Energy feedback in buildings: improving the infrastructure for demand reduction. Building Research & Information, 36(5), 499-508.
de Best-Waldhober, M., Daamen, D., & Faaij, A. (2009). Informed and uninformed public opinions on CO2 capture and storage technologies in the Netherlands. International Journal of Greenhouse Gas Control, 3(3), 322–332. Retrieved from http://www.sciencedirect.com/science/article/B83WP-4TS5795-1/2/b91075f64df407db46dfc2d69274fad4
Delmas, M. A., Fischlein, M., & Asensio, O. I. (2013). Information strategies and energy conservation behavior: A meta-analysis of experimental studies from 1975 to 2012. Energy Policy, 61, 729-739.
Ehrhardt-Martinez, K., Donnelly, K. A., & Laitner, S. (2010, June). Advanced metering initiatives and residential feedback programs: a meta-review for household electricity-saving opportunities. Washington, DC: American Council for an Energy-Efficient Economy.
Eriksson, M. (2010). Social capital, health and community action: implications for health promotion (Doctoral dissertation, Umeå university).
European Union, Involving Stakeholders: Toolkit on Organising Successful Consultations, the Civitas initiative, http://civitas.eu/sites/default/files/Results%20and%20Publications/Brochure_STAKEHOLDER_CONSULTATION_web.pdf
Faruqui, A., Sergici, S., & Sharif, A. (2010). The impact of informational feedback on energy consumption—A survey of the experimental evidence. Energy, 35(4), 1598-1608.
Fielding, K.S., Terry, D.J., Masser, B.M., Hogg, M.A., 2008. Integrating social identity theory and the theory of planned behaviour to explain decisions to engage in sustainable agricultural practices. Br. J. Soc. Psychol. 47, 23–48. doi:10.1348/014466607X206792
Fischer, C. (2008). Feedback on household electricity consumption: a tool for saving energy?. Energy efficiency, 1(1), 79-104.
Fishbein, M., Ajzen, I., 2010. Predicting and Changing Behavior: The Reasoned Action Approach. Psychology Press, New York.
Fitzpatrick, G., & Smith, G. (2009). Technology-enabled feedback on domestic energy consumption: Articulating a set of design concerns. IEEE Pervasive Computing, 8(1), 1536-1268/09.
Froehlich, J. (2009, February). Promoting energy efficient behaviors in the home through feedback: The role of human-computer interaction. In Proc. HCIC Workshop (Vol. 9, pp. 1-11).
Froehlich, J., Findlater, L., & Landay, J. (2010, April). The design of eco-feedback technology. In Proceedings of the SIGCHI conference on human factors in computing systems (pp. 1999-2008). ACM.
Froehlich, J., Findlater, L., Ostergren, M., Ramanathan, S., Peterson, J., Wragg, I., ... & Landay, J. A. (2012, May). The design and evaluation of prototype eco-feedback displays for fixture-level water usage data. In Proceedings of the SIGCHI conference on human factors in computing systems (pp. 2367-2376). ACM.
Froehlich, J., Larson, E., Gupta, S., Cohn, G., Reynolds, M., & Patel, S. (2011). Disaggregated end-use energy sensing for the smart grid. IEEE Pervasive Computing, 10(1), 28-39.
Gangale, F., Mengolini, A., & Onyeji, I. (2013). Consumer engagement: An insight from smart grid projects in Europe. Energy Policy, 60, 621-628.
Geelen, D., Reinders, A., & Keyson, D. (2013). Empowering the end-user in smart grids: Recommendations for the design of products and services. Energy Policy, 61, 151-161.
Grünewald, P. H., Cockerill, T. T., Contestabile, M., & Pearson, P. J. (2012). The socio-technical transition of distributed electricity storage into future networks—System value and stakeholder views. Energy
Policy, 50, 449-457. Ham, J., & Midden, C. (2010). Ambient persuasive technology needs little cognitive effort: the differential
effects of cognitive load on lighting feedback versus factual feedback. Persuasive Technology, 132-142. Hargreaves, T., Nye, M., & Burgess, J. (2010). Making energy visible: A qualitative field study of how
householders interact with feedback from smart energy monitors. Energy policy, 38(10), 6111-6119.
D1.4 Consumer’s Engagement Strategies
InteGrid GA 731218 82 | 94
Hargreaves, T., Nye, M., & Burgess, J. (2013). Keeping energy visible? Exploring how householders interact with feedback from smart energy monitors in the longer term. Energy policy, 52, 126-134.
He, H. A., Greenberg, S., & Huang, E. M. (2010, April). One size does not fit all: applying the transtheoretical model to energy feedback technology design. In Proceedings of the SIGCHI conference on human factors in computing systems (pp.927-936). ACM.
Hofstede, Geert (2001). Culture’s Consequences, 2nd edition, Sage Publications, Thousand Oaks, California.
Horn, M. S., Davis, P., Hubbard, A. K., Keifert, D., Leong, Z. A., & Olson, I. C. (2011, June). Learning sustainability: families, learning, and next-generation eco-feedback technology. In proceedings of the 10th international conference on interaction design and children (pp. 161-164). ACM.
Jain, R. K., Gulbinas, R., Taylor, J. E., & Culligan, P. J. (2013). Can social influence drive energy savings? Detecting the impact of social influence on the energy consumption behavior of networked users exposed to normative eco-feedback. Energy and Buildings, 66, 119-127.
Jain, R. K., Taylor, J. E., & Peschiera, G. (2012). Assessing eco-feedback interface usage and design to drive energy efficiency in buildings. Energy and buildings, 48, 8-17.
Karjalainen, S. (2011). Consumer preferences for feedback on household electricity consumption. Energy and Buildings, 43(2–3), pp.458–467.
Kamilaris, A., Neovino, J., Kondepudi, S., & Kalluri, B. (2015). A case study on the individual energy use of personal computers in an office setting and assessment of various feedback types toward energy savings. Energy and Buildings, 104, 73-86.
Karlin, B., Zinger, J. F., & Ford, R. (2015). The effects of feedback on energy conservation: A meta-analysis.Psychological Bulletin, Vol 141(6), 1205-1227.http://dx.doi.org/10.1037/a0039650
Kudryavtsev, A., Stedman, R. C., & Krasny, M. E. (2012). Sense of place in environmental education. Environmental education research, 18(2), 229-250.
Krishnamurti, T., Schwartz, D., Davis, A., Fischhoff, B., de Bruin, W. B., Lave, L., & Wang, J. (2012). Preparing for smart grid technologies: A behavioral decision research approach to understanding consumer expectations about smart meters. Energy Policy, 41, 790-797.
McCalley, L. T., & Midden, C.J. (2002). Energy conservation through product-integrated feedback: The roles of goal-setting and social orientation. Journal of economic psychology, 23(5), 589-603.
McCalley, L. T., de Vries, P. W., & Midden, C. J. (2011). Consumer response to product-integrated energy feedback: Behavior, goal level shifts, and energy conservation. Environment and Behavior, 43(4), 525-545.
Moezzi et al. 2017: Using stories, narratives, and storytelling in energy and climate change research, Energy Research and Social Science, 31, 1-10.
Narayan, D., & Cassidy, M. F. (2001). A dimensional approach to measuring social capital: development and validation of a social capital inventory. Current sociology, 49(2), 59-102.
Natural Resources, 2014, Stakeholder Engagement Guide, https://www.nrcan.gc.ca/sites/www.nrcan.gc.ca/files/energy/pdf/engagementguide_eng_12.pdf
Neubert, M. J. (1998). The value of feedback and goal setting over goal setting alone and potential moderators of this effect: A meta-analysis. Human Performance, 11(4), 321-335
Newcombe, R. (2003). ‘From client to project stakeholders: a stakeholder mapping approach’’, Construction Management and Economics, 21(8), 841‐8.
Onyx, J., & Bullen, P. (2001). The different faces of social capital in NSW Australia. Social capital
and participation in everyday life, 45-58.
Paetz, A. G., Dütschke, E., & Fichtner, W. (2012). Smart homes as a means to sustainable energy
consumption: A study of consumer perceptions. Journal of consumer policy, 35(1), 23-41. Park, C. K., Kim, H. J., & Kim, Y. S. (2014). A study of factors enhancing smart grid consumer engagement.
Energy Policy, 72, 211-218. Parker, D., Hoak, D., Meier, A.,
& Brown, R. (2006). How much energy are we using? Potential of residential energy demand feedback

D1.4 Consumer’s Engagement Strategies
InteGrid GA 731218 83 | 94
devices. Proceedings of the 2006 Summer Study on Energy Efficiency in Buildings, American Council for an Energy Efficient Economy, Asilomar, CA.
Pereira, L., Quintal, F., Barreto, M., & Nunes, N. J. (2013). Understanding the limitations of eco-feedback: a one-year long-term study. In Human-Computer Interaction and Knowledge Discovery in Complex, Unstructured, Big Data (pp. 237-255). Springer, Berlin, Heidelberg.
Pereverza, K., Pasichnyi, O., Lazarevic, D. & Kordas, O. (2017).: Strategic planning for sustainable heating in cities: A morphological method for scenario development and selection, Applied Energy, 186, 115-125.
Pierce, J., Fan, C., Lomas, D., Marcu, G. and Paulos, E. (2010). Some consideration on the (in)effectiveness of residential energy feedback systems. Proceedings of the 8th ACM Conference on Designing Interactive Systems - DIS ’10, [online] p.244. Available at: <http://portal.acm.org/citation.cfm?doid=1858171.1858215>.
Rodgers, J., & Bartram, L. (2011). Exploring ambient and artistic visualization for residential energy use feedback. IEEE transactions on visualization and computer graphics, 17(12), 2489-2497
Romanach L, Contreras Z, Ashworth P. Australian house holders’ interest in active participation in the distributed energy market: Survey results. Pullenvale: Report No.: EP133598.
Shariatzadeh, F., Mandal, P., & Srivastava, A. K. (2015). Demand response for sustainable energy systems: A review, application and implementation strategy. Renewable and Sustainable Energy Reviews, 45, 343-350.
Siano, P. (2014). Demand response and smart grids—A survey. Renewable and sustainable energy reviews, 30, 461-478.
Steg, L. (2008). Promoting household energy conservation. Energy policy, 36(12), 4449-4453. Stern, P. C. (2011). Contributions of psychology to limiting climate change. American Psychologist, 66(4),
303. Terry, D.J., Hogg, M.A., 1996. Group norms and the attitude-behavior relationship: A role for group
identification. Personal. Soc. Psychol. Bull. 22, 776–793. Terry, D.J., Hogg, M.A., White, K.M., 1999. The theory of planned behaviour: self-identity, social identity
and group norms. Br. J. Soc. Psychol. 38 ( Pt 3), 225–244. doi:10.1348/014466699164149 Vassileva, I. (2012). Characterization of household energy consumption in Sweden: energy savings
potential and feedback approaches (dissertation). Mälardalen University Press Dissertations, Sweden Vassileva, I., Dahlquist, E., Wallin, F., & Campillo, J. (2013). Energy consumption feedback devices’ impact
evaluation on domestic energy use. Applied energy, 106, 314-320. Vine, D., Buys, L., & Morris, P. (2013). The effectiveness of energy feedback for conservation and peak
demand: a literature review. Open Journal of Energy Efficiency, 2(1), 7-15. Wever, R., Van Kuijk, J., & Boks, C. (2008). User‐centred design for sustainable behaviour. International
journal of sustainable engineering, 1(1), 9-20. Wood, G., & Newborough, M. (2007). Energy-use information transfer for intelligent homes: Enabling
energy conservation with central and local displays. Energy and buildings, 39(4), 495-503. World Bank, Five steps for iterative consultation,
https://www.ifc.org/wps/wcm/connect/5a4e740048855591b724f76a6515bb18/PartOne_StakeholderConsultation.pdf?MOD=AJPERES
Yang, R., Newman, M. W., & Forlizzi, J. (2014, April). Making sustainability sustainable: challenges in the design of eco-interaction technologies. In Proceedings of the SIGCHI Conference on Human Factors in Computing Systems (pp. 823-832). ACM.
Zachariah-Wolff, J. L. , & Hemmes, K. (2006). Public Acceptance of Hydrogen in the Netherlands: TwoSurveys That Demystify Public Views on a Hydrogen Economy. Bulletin of Science, Technology & Society, 26(4, 339–45.
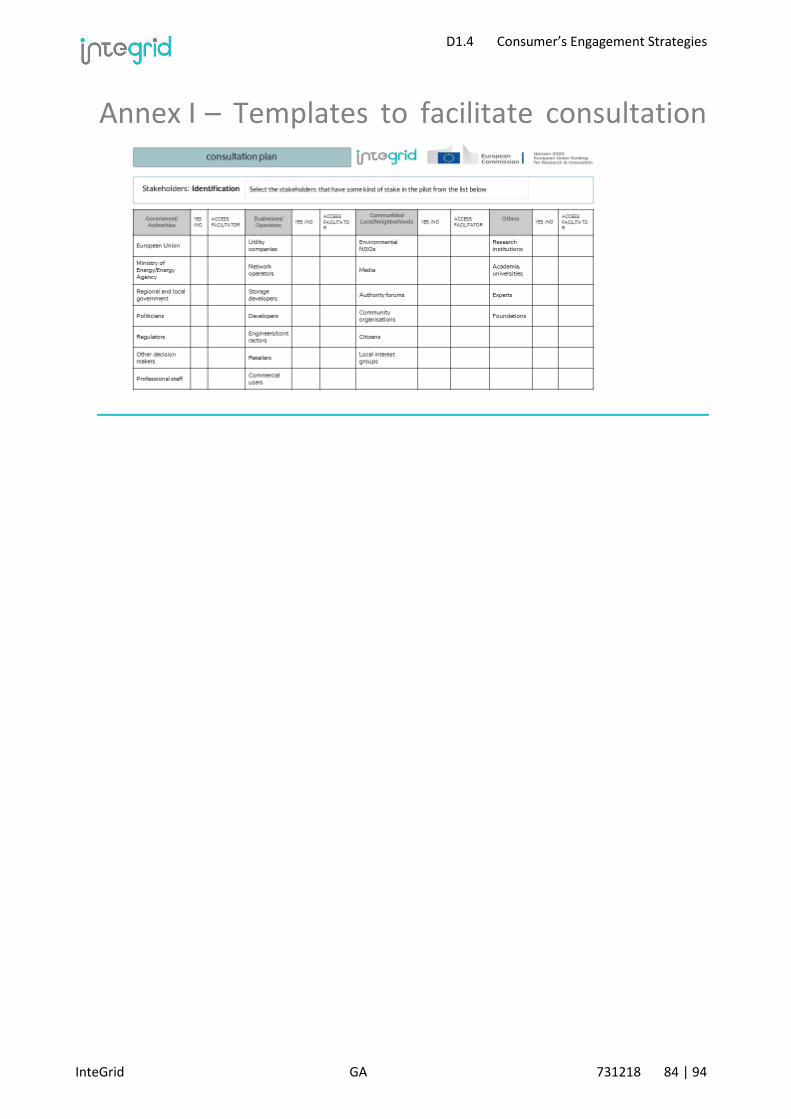
D1.4 Consumer’s Engagement Strategies
InteGrid GA 731218 84 | 94
Annex I – Templates to facilitate consultation

D1.4 Consumer’s Engagement Strategies
InteGrid GA 731218 85 | 94

D1.4 Consumer’s Engagement Strategies
InteGrid GA 731218 86 | 94

D1.4 Consumer’s Engagement Strategies
InteGrid GA 731218 87 | 94
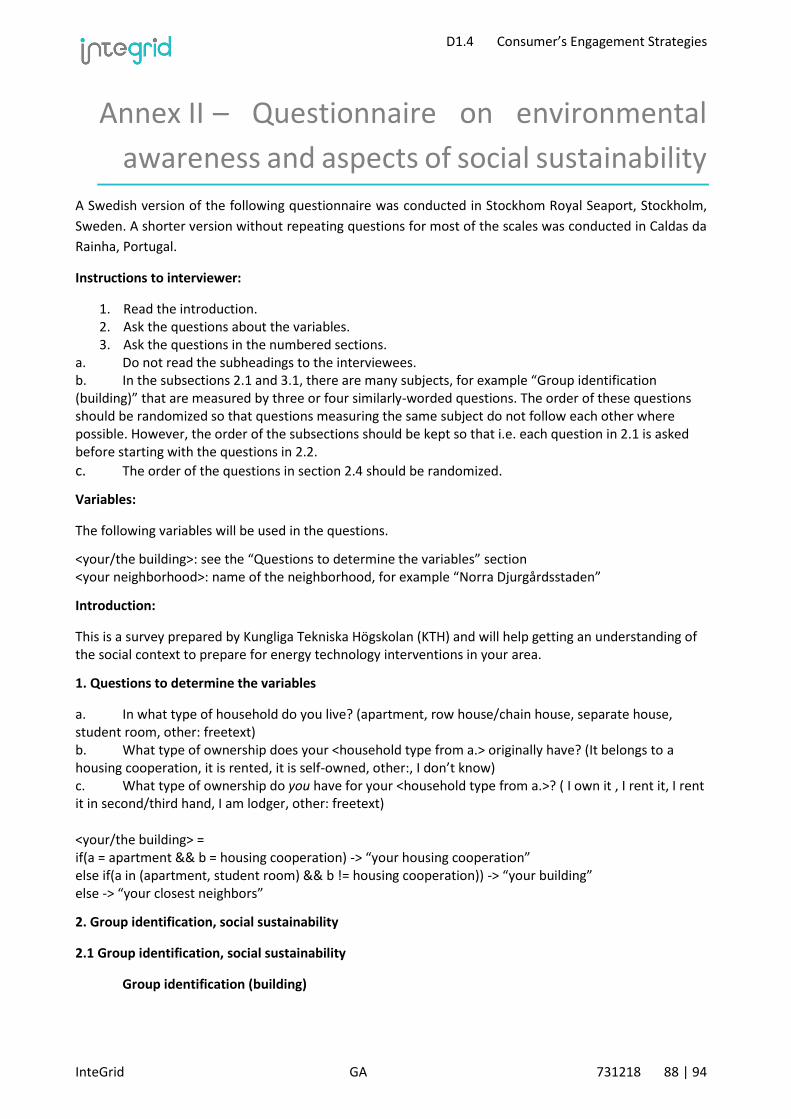
D1.4 Consumer’s Engagement Strategies
InteGrid GA 731218 88 | 94
Annex II – Questionnaire on environmental
awareness and aspects of social sustainability
A Swedish version of the following questionnaire was conducted in Stockhom Royal Seaport, Stockholm,
Sweden. A shorter version without repeating questions for most of the scales was conducted in Caldas da
Rainha, Portugal.
Instructions to interviewer:
1. Read the introduction. 2. Ask the questions about the variables. 3. Ask the questions in the numbered sections.
a. Do not read the subheadings to the interviewees. b. In the subsections 2.1 and 3.1, there are many subjects, for example “Group identification (building)” that are measured by three or four similarly-worded questions. The order of these questions should be randomized so that questions measuring the same subject do not follow each other where possible. However, the order of the subsections should be kept so that i.e. each question in 2.1 is asked before starting with the questions in 2.2.
c. The order of the questions in section 2.4 should be randomized.
Variables:
The following variables will be used in the questions.
<your/the building>: see the “Questions to determine the variables” section <your neighborhood>: name of the neighborhood, for example “Norra Djurgårdsstaden”
Introduction:
This is a survey prepared by Kungliga Tekniska Högskolan (KTH) and will help getting an understanding of the social context to prepare for energy technology interventions in your area.
1. Questions to determine the variables
a. In what type of household do you live? (apartment, row house/chain house, separate house, student room, other: freetext) b. What type of ownership does your <household type from a.> originally have? (It belongs to a housing cooperation, it is rented, it is self-owned, other:, I don’t know) c. What type of ownership do you have for your <household type from a.>? ( I own it , I rent it, I rent it in second/third hand, I am lodger, other: freetext)
<your/the building> = if(a = apartment && b = housing cooperation) -> “your housing cooperation” else if(a in (apartment, student room) && b != housing cooperation)) -> “your building” else -> “your closest neighbors”
2. Group identification, social sustainability
2.1 Group identification, social sustainability
Group identification (building)
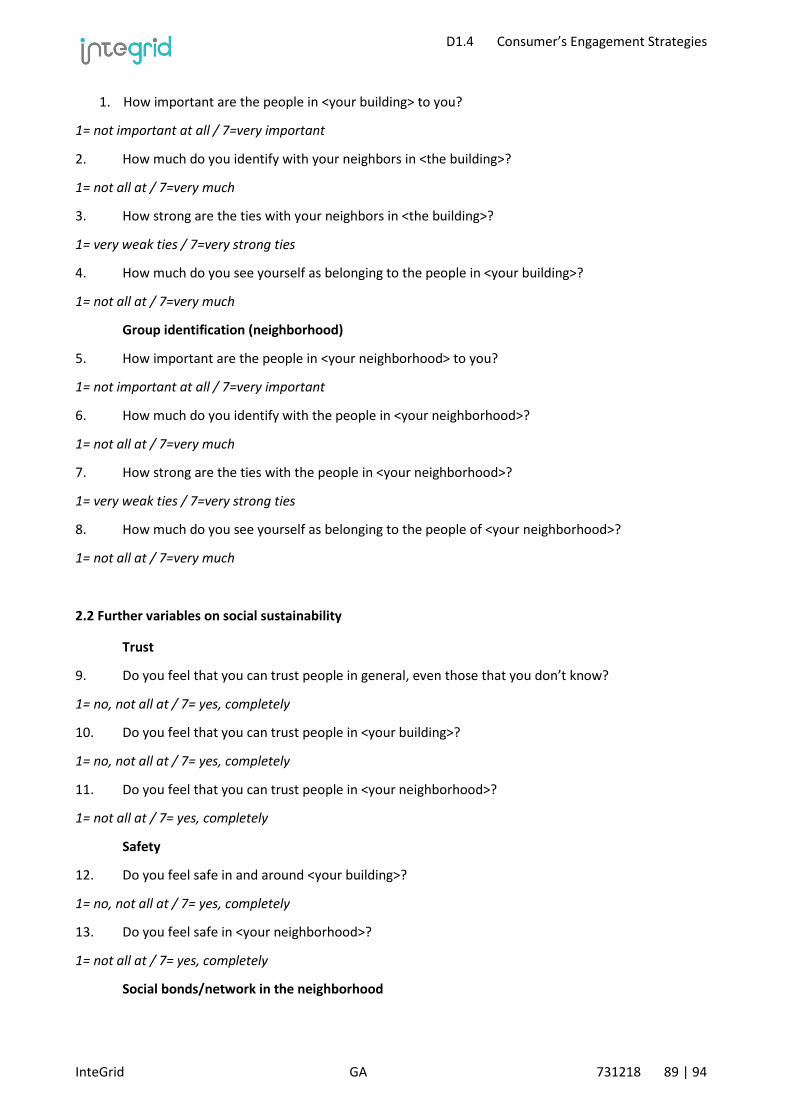
D1.4 Consumer’s Engagement Strategies
InteGrid GA 731218 89 | 94
1. How important are the people in <your building> to you?
1= not important at all / 7=very important
2. How much do you identify with your neighbors in <the building>?
1= not all at / 7=very much
3. How strong are the ties with your neighbors in <the building>?
1= very weak ties / 7=very strong ties
4. How much do you see yourself as belonging to the people in <your building>?
1= not all at / 7=very much
Group identification (neighborhood)
5. How important are the people in <your neighborhood> to you?
1= not important at all / 7=very important
6. How much do you identify with the people in <your neighborhood>?
1= not all at / 7=very much
7. How strong are the ties with the people in <your neighborhood>?
1= very weak ties / 7=very strong ties
8. How much do you see yourself as belonging to the people of <your neighborhood>?
1= not all at / 7=very much
2.2 Further variables on social sustainability
Trust
9. Do you feel that you can trust people in general, even those that you don’t know?
1= no, not all at / 7= yes, completely
10. Do you feel that you can trust people in <your building>?
1= no, not all at / 7= yes, completely
11. Do you feel that you can trust people in <your neighborhood>?
1= not all at / 7= yes, completely
Safety
12. Do you feel safe in and around <your building>?
1= no, not all at / 7= yes, completely
13. Do you feel safe in <your neighborhood>?
1= not all at / 7= yes, completely
Social bonds/network in the neighborhood

D1.4 Consumer’s Engagement Strategies
InteGrid GA 731218 90 | 94
14. Is it common at the place where you live that neighbors talk to each other when you meet?
1 = not common all at / 7=very common
2.3 Questions with different scales
Social bonds/network (continued, with different scale)
15. Take a stand for the following statements of how you think it is in the place where you live?
Where I live…
a. ... care about each other b. ... are you prepared to help each other c. ... you have "insight into each other's life" d. ... you take responsibility for each other's children e. ... you are expected to be engaged in questions concerning the area
1 = Too much / 2= Moderate / 3 = Too little
16. What people do you think you have a good social relationship with, i.e. which persons belong to your social network?´
a. The family b. Relatives c. Friends d. Neighbors e. Work/peers f. Others: free text Please motivate your response:
1=yes / 2=no / 3=has none/not current to me
17. How many neighbors do you think you know where you live? Give an exact number, or pick a range:
1 = none / 2 = 1-3 / 3 = 4-6 / 4 = 7-10 / 5 = 11-15 / 6 = more than 15
18. How often do you hang out with any of your neighbors?
1=daily/almost daily / 2=some time/week / 3=some time/month / 4= some time/year / 5=never
2.4 Place attachment
On a scale from 1 = I completely disagree / 7 = I completely agree, answer the following questions:

D1.4 Consumer’s Engagement Strategies
InteGrid GA 731218 91 | 94
19. <My neighborhood> is the best place for what I like to do. 20. I feel like <my neighborhood> is part of me. 21. Everything about <my neighborhood> reflects who I am. 22. I am more satisfied in <my neighborhood> than in other places. 23. I identify myself strongly with <my neighborhood>. 24. <My neighborhood> is not a good place for what I enjoy doing. 25. There are better places to be than <my neighborhood>. 26. <My neighborhood> reflects the type of person I am. 2.5 Sharing economy
27. Has your household lended/rented out or borrowed/rented to/with your neighbours, or used a sharing pool to get hold of, any of the following items during the last 12 months? 1 = lended/rented out, 2 = borrowed/rented, 3 = used a shared resource, 4 = no. a. Clothes b. Toys c. Tools d. home appliances e. computer/tablet/mobile f. tv/video/dvd/stero g. bicycle h. car or other motor vehicle
3. Part 2 – Energy
Predict energy savings (connect TpB & social identity theory)
Attitudes
28. I feel that saving energy at my household is • Good (1=extremely bad to 7=extremely good) • Wise (1= unwise to 7=wise) • Beneficial (1=not at all beneficial to 7 =very beneficial) • Pleasant (1=unpleasant to 7=pleasant) • Satisfying (1=unsatisfying to 7 =very satisfying) • Favourable (1=unfavourable to 7=very favourable)
3.1 Social norms, group norms, TPB
Subjective social norms
29. If I save energy at my household people who are important to me would
1 = disapprove, 7 = approve
30. Most people who are important to me think that saving energy at my household would be
1= undesirable, 7 = desirable
31. Most people who are important to me think that I <variable> save energy in my household
1= should not, 7 = should

D1.4 Consumer’s Engagement Strategies
InteGrid GA 731218 92 | 94
Perceived group norms building
32. How many of the people in <your building> would think that saving energy in your household is a good thing?
1=very few, 7 = most
33. How likely is it that people in <your building> save energy in their household?
1=very unlikely, 7 = very likely
34. How much agreement is there in <your building> that saving energy in the household is a good thing to do?
1=very little agreement, 7= a great deal of agreement
Perceived groups norms neighborhood
35. How many of the people in <your neighborhood> would think that saving energy in your household is a good thing?
1=very few, 7 = most
36. How likely is it that people in <your neighborhood> save energy in their households?
1=very unlikely, 7 = very likely
37. How much agreement is there in <your neighborhood> that saving energy in the household is a good thing to do?
1=very little agreement, 7= a great deal of agreement
Perceived behavioral control
38. How much control do you have over saving energy at your household?
1= very little, 7 = a great deal of control
39. For me, to save energy at my household is
1=very difficult, 7 = very easy
40. My knowledge about possible ways to save energy in my household is
1=very low, 7 = very high
Past behaviour
41. How much effort have you been putting in saving energy at your household?
1= none at all, 7 = a lot
42. How much time and labour have you been putting in saving energy at your household?
1=none at all, 7 = a lot
D1.4 Consumer’s Engagement Strategies
InteGrid GA 731218 93 | 94
3.2 Self-reported behaviour, behavioural intention
Self-reported behaviour t0
43. To what extent do you save energy in your household?
1=not at all, 7=a lot
Behavioral intention
44. I plan to save energy in my household over the next 6 months.
1=strongly disagree / 7=strongly agree
3.3 Further information on energy behaviour
Energy use in the household
45. Has your household ordered environmentally certified electricity from your energy company?
Yes/no/don’t know
46. Have you done any actions to save energy in your household? If so, which actions, and how often do you carry them out? often / occasionally / never
<Let the respondent answer in freetext first to capture what options he/she is aware of. Then list those of the following options that the respondent has not already mentioned> a. Turned off lights when not needed b. Turned off the TV instead of using the standby mode c. Bought energy efficient home appliances d. Set a correct temperature in fridge/freezer and defrosted them regularly e. Lowered the indoor temperature f. Added insulation to windows or walls g. Lowered the consumption of hot tap water h. Other: free text (if respondent has got inspired by the given options and remember other versions)
often / occasionally / never
Load-shifting
47. Assume that you own a washing machine and usually wash your clothes during the afternoon when the electricity consumption is high in your area. Would you instead wash your clothes during the night if you knew that it would… a. … save you money due to a cheaper electricity price? b. … be good for the environment due to less polluting electricity production?
1=extremely unlikely, 7=extremely likely
Why / Why not? <freetext>
LocalLife
48. Do you use 4. Demographic questions
1. Which year are you born? 2. What is your gender: M/F/O

D1.4 Consumer’s Engagement Strategies
InteGrid GA 731218 94 | 94
3. How many other people (excluding yourself) are living in the household? a. How many small children (0-6 years) b. How many children (7-12 years) c. How many teenagers (13-17 years) d. How many young adults (18-29) e. How many adults (30-39) f. How many adults (40-49) g. How many adults (50-64) h. How many adults (65-)
4. How large is the floor area of your household (m2) 5. Which is your highest completed education (grundskola, gymnasium, universitet/högskola) 6. What is your main occupation (employee, self-employed, student, retired, sick leave, parental
leave, searching for job, home/taking care of household, other) 7. In which country were you born? 8. In which country have you mainly grown up? 9. How would you describe your household’s current income?
1. Finding it very difficult to live on current income
2. Finding it difficult to live on current income
3. Coping on current income
4. Living comfortably on current income
5. Living very comfortably on current income