Embed Size (px)
Citation preview

Graduate Theses, Dissertations, and Problem Reports
2006
Design of composite sandwich panels for lightweight applications Design of composite sandwich panels for lightweight applications
in heavy vehicle systems in heavy vehicle systems
Thomas H. Evans West Virginia University
Follow this and additional works at: https://researchrepository.wvu.edu/etd
Recommended Citation Recommended Citation Evans, Thomas H., "Design of composite sandwich panels for lightweight applications in heavy vehicle systems" (2006). Graduate Theses, Dissertations, and Problem Reports. 4226. https://researchrepository.wvu.edu/etd/4226
This Thesis is protected by copyright and/or related rights. It has been brought to you by the The Research Repository @ WVU with permission from the rights-holder(s). You are free to use this Thesis in any way that is permitted by the copyright and related rights legislation that applies to your use. For other uses you must obtain permission from the rights-holder(s) directly, unless additional rights are indicated by a Creative Commons license in the record and/ or on the work itself. This Thesis has been accepted for inclusion in WVU Graduate Theses, Dissertations, and Problem Reports collection by an authorized administrator of The Research Repository @ WVU. For more information, please contact [email protected].

Design of Composite Sandwich Panels for Lightweight Applications in
Heavy Vehicle Systems
Thomas H. Evans
Thesis Submitted to the College of Engineering and Mineral Resources at West Virginia University
in partial fulfillment of the requirements for the degree of
Master of Science
in Mechanical Engineering
Jacky C. Prucz, Ph.D. Samir Shoukry, Ph.D. Gergis William, Ph.D.
Department of Mechanical and Aerospace Engineering
Morgantown, West Virginia 2006

ABSTRACT
Design of Composite Sandwich Panels for Lightweight Applications in Heavy Vehicle Systems
Thomas H. Evans
Vehicle systems such as cargo freight and platform trailers are a primary source
of transporting heavy cargo loads. The construction and materials used in a standard
trailer design contribute significantly to the overall weight. The U.S. Department of
Energy (DOE) and West Virginia University have conducted joint research to reduce the
amount of fuel consumption of cargo transportation trailers by initiating a lightweight
materials program. This study is aimed at the utilization of Fiber Reinforced Polymer
(FRP) composites and Composite Sandwich technology in conjunction with innovative
joining concepts to reduce trailer weight. Finite element modeling and experimental
analysis reveal the benefits of using composite sandwich technology versus existing load
bearing structures in a standard trailer design.
The composite sandwich technology in this work details the use of a core
constituent that contributes to flexural stiffness while utilizing a design that addresses
joining parameters of the faceplate and core.

iii
TABLE OF CONTENTS Abstract ............................................................................................................................... ii Table of Contents............................................................................................................... iii List of Tables ..................................................................................................................... vi List of Figures ................................................................................................................... vii Chapter 1 - Introduction...................................................................................................... 1
1.1 Introduction............................................................................................................... 1 1.2 Objectives ................................................................................................................. 1
Chapter 2 – Literature Review............................................................................................ 3 2.1 Composite Materials ..................................................................................................... 3
2.1.1 Hand Lay-up ...................................................................................................... 3 2.1.2 Bag Molding ...................................................................................................... 4 2.1.3 Autoclave Processing......................................................................................... 4 2.1.4 Compression Molding........................................................................................ 4 2.1.5 Pultrusion ........................................................................................................... 5 2.1.6 Resin Transfer Molding ..................................................................................... 5 2.1.7 Filament Winding .............................................................................................. 5
2.2 Sandwich Composites............................................................................................... 7 2.2.1 Core Structures................................................................................................... 7 2.2.2 Face Materials.................................................................................................... 9 2.2.3 Properties of Fiber Composite ......................................................................... 10 2.2.4 Lamina Analysis .............................................................................................. 12 2.2.5 Laminate Analysis ........................................................................................... 14 2.2.6 Plate Stiffness and Stress and Strain Variation................................................ 15 2.2.7 Stiffness Properties of a Sandwich Structure................................................... 20
2.3 Classical Theory of Laminate or Sandwich Plate Bending .................................... 21 2.3.1 Equilibrium Equations ..................................................................................... 21 2.3.2 Bending Analysis Excluding Transverse Shear Deformation Effects ............. 23 2.3.3 Bending Analysis Including Transverse Shear Deformation Effects .............. 24 2.3.4 Dynamic Loading of Laminates or Sandwich Panels ...................................... 25
2.4 Solutions for Rectangular Sandwich Plates ............................................................ 27 2.4.1 Navier Solution for Sandwich Plates with All Four Edges Simply Supported 27 2.4.2 Levy Solution for Plates with Two Edges Simply Supported ......................... 29
2.5 Structural Bonding .................................................................................................. 32 2.5.1 Composite Surface Preparation for Bonding Methods .................................... 33
Chapter 3 – Joining Concepts ........................................................................................... 35 3.1 Innovative Structural Joining Configurations......................................................... 35
3.1.1 Development of Model Joints and Prototype Designs..................................... 35 3.2 Prototyping of Innovative Structural and Joining Concepts ................................... 40
3.2.1 Manufacturing Process..................................................................................... 41 3.2.2 Model Trailer ................................................................................................... 42 3.2.3 Modular Design ............................................................................................... 44
3.3 Theoretical Analysis and Performance Comparisons ............................................. 45 3.3.1 Design I............................................................................................................ 45 3.3.2 Design II........................................................................................................... 47

iv
3.3.3 Design III ......................................................................................................... 48 3.3.4 Summary .......................................................................................................... 49
Chapter 4 – Analysis of Various Cross Sections for the Core Structure of Extruded Support Members.............................................................................................................. 50
4.1 Introduction............................................................................................................. 50 4.2 Cross Sections......................................................................................................... 50 4.3 Bending Analysis .................................................................................................... 51
4.3.1 Bending Results ............................................................................................... 52 4.3.2 Discussion of Finite Element Bending Results................................................ 58
4.4 Torsion Analysis ..................................................................................................... 58 4.4.1 Torsion Results ................................................................................................ 59 4.4.2 Discussion of Finite Element Torsion Results................................................. 68 4.4.3 Weight Comparison ......................................................................................... 68
4.5 Panels with Tube Section Cross Members.............................................................. 70 4.5.1 Tubeplate.......................................................................................................... 70 4.5.2 Tubegrate ......................................................................................................... 71
4.6 Sandwich Composite Panels with Aluminum Extruded Core Cross Members...... 71 4.6.1 Fiberplate ......................................................................................................... 71 4.6.2 Carbonplate ...................................................................................................... 73
4.7 Finite Element Modeling (ADINA)........................................................................ 74 4.7.1 Tubeplate.......................................................................................................... 74 4.7.2 Tubegrate ......................................................................................................... 75 4.7.3 Fiberplate ......................................................................................................... 76 4.7.4 Carbonplate ...................................................................................................... 80
Chapter 5 - Instrumentation of Sandwich Panels for Experimental Testing .................... 81 5.1 Introduction............................................................................................................. 81
5.1.1 Tubegrate ......................................................................................................... 81 5.1.2 Tubeplate.......................................................................................................... 82 5.1.3 Fiberplate ......................................................................................................... 84 5.1.4 Carbonplate ...................................................................................................... 85
Chapter 6 - Experimental Testing of Sandwich Panels .................................................... 87 6.1 Introduction............................................................................................................. 87
6.1.1 Tubeplate.......................................................................................................... 87 6.1.2 Tubegrate ......................................................................................................... 90 6.1.3 Fiberplate ......................................................................................................... 93 6.1.4 Carbonplate ...................................................................................................... 95
Chapter 7 - Finite Element Modeling ............................................................................... 98 7.1 Introduction............................................................................................................. 98
7.1.1 Tubeplate.......................................................................................................... 98 7.1.2 Tubegrate ....................................................................................................... 102 7.1.3 Fiberplate ....................................................................................................... 106 7.1.4 Carbonplate .................................................................................................... 109
7.2 Failure Analysis .................................................................................................... 111 Composite Failure................................................................................................... 114
7.3 Discussion ............................................................................................................. 116 7.4 Conclusion ............................................................................................................ 122

v
References................................................................................................................... 124

vi
LIST OF TABLES Table 3.1 - Design I Analysis for Alternative Materials................................................... 46 Table 3.2 - Design II Analysis for Alternative Materials ................................................. 48 Table 3.3 - Design III Analysis for Alternative Materials ................................................ 49 Table 4.1 - ANSYS Bending Results................................................................................ 55 Table 4.2 - ADINA Bending Results................................................................................ 58 Table 4.3 - ANSYS Torsion Results................................................................................. 63 Table 4.4 - ADINA Torsion Results ................................................................................. 66 Table 4.5 - Comparison of ANSYS and ADINA Bending and Torsion Results.............. 66 Table 4.6 - Weight Comparisons between Alternative Cross-Sections............................ 69 Table 7.1 - Failure Criteria for the Fiberplate and Carbonplate Core Structure ….…..113 Table 7.2 - Fiberplate Maximum Stress Criterion ……………………………………...115 Table 7.3 - Carbonplate Maximum Stress Criterion …………………………………....115 Table 7.4 -Weight of Panel Designs Compared to an Existing Trailer Section ………...116

vii
LIST OF FIGURES Figure 2.1: Types of sandwich core materials. .................................................................. 8 Figure 2.2: Schematic of a lamina with fibers and matrix. The lamina is unidirectional
with the longitudinal fibers oriented in the 1 direction............................................. 11 Figure 2.3: Undeformed and deformed cross sections of a laminate plate. ..................... 16 Figure 2.4: Referencing of the stacking sequence for a composite laminate................... 17 Figure 2.5: A simply supported composite plate used for Levy solution analysis. ......... 29 Figure 3.1: Alternative design concepts for the floor platform of a modified van trailer.35 Figure 3.2: Sandwich composite structure with aluminum tube core construction for
flooring platform applications. Design concept C. .................................................. 36 Figure 3.3: Type D flooring alternative using composite I-beams as cross member
supports and composite bearing bars. ....................................................................... 37 Figure 3.4: Connection method between side panels by an H-joint configuration........... 37 Figure 3.5: Double corner joint........................................................................................ 38 Figure 3.6: Corner joint for connecting the floor platform to the sidewall or side panels
of a van trailer. .......................................................................................................... 39 Figure 3.7: Alternative option for the corner joint connecting the side panels to the
flooring platform....................................................................................................... 39 Figure 3.9: Unassembled sections of the model trailer.................................................... 43 Figure 3.11: A method to assist the joining of segments for the mudular application of
the van trailer design................................................................................................. 45 Figure 3.12: Alternative floor design I consisting of I-beam cross members and “bearing
bars”. ......................................................................................................................... 46 Figure 3.13: Alternative floor design II consisting of top platform supported by C-
channels..................................................................................................................... 47 Figure 3.14: Alternative flooring design III consisting of a FRP top and bottom face plate
and hollow cross tubes comprising the core structure. ............................................. 48 Figure 4.1: The six different cross sections of the core structure. .................................... 50 Figure 4.2: Representation of a sandwich composite structure using the X2 core cross
section. ...................................................................................................................... 51 Figure 4.3: Loading scenario, dimensions, and boundary conditions for bending analysis.
................................................................................................................................... 52 Figure 4.4: Tube displacement using ANSYS................................................................. 52 Figure 4.5: Slant displacement using ANSYS.................................................................. 53 Figure 4.6: X1 displacement using ANSYS .................................................................... 53 Figure 4.7: X2 displacement using ANSYS .................................................................... 54 Figure 4.8: Box displacement using ANSYS .................................................................. 54 Figure 4.9: Box2 displacement using ANSYS ................................................................ 55 Figure 4.10: Tube displacement using ADINA ............................................................... 56 Figure 4.11: Slant displacement using ADINA ............................................................... 56 Figure 4.12: X1 displacement using ADINA .................................................................. 56 Figure 4.13: X2 displacement using ADINA .................................................................. 57 Figure 4.14: Box displacement using ADINA................................................................. 57 Figure 4.15: Box2 displacement using ADINA............................................................... 57

viii
Figure 4.16: Loading scenario, dimensions and boundary conditions for torsional analysis...................................................................................................................... 59
Figure 4.17: Tube torsion results using ANSYS ............................................................. 60 Figure 4.18: Slant torsion results using ANSYS ............................................................. 60 Figure 4.19: X1 torsion results using ANSYS................................................................. 61 Figure 4.20: X2 torsion results using ANSYS................................................................. 61 Figure 4.21: Box torsion results using ANSYS............................................................... 62 Figure 4.22: Box 2 torsion results using ANSYS............................................................ 62 Figure 4.23: Tube torsion results using ADINA.............................................................. 63 Figure 4.24: Slant torsion results using ADINA.............................................................. 64 Figure 4.25: X1 torsion results using ADINA................................................................. 64 Figure 4.26: X2 torsion results using ADINA................................................................. 65 Figure 4.27: Box 1 torsion results using ADINA ............................................................ 65 Figure 4.28: Box 2 torsion results using ADINA ............................................................ 66 Figure 4.29: Plot of maximum bending deflection for tube cross members.................... 67 Figure 4.30: Plot of maximum torsional stress within the tube cross section members.. 67 Figure 4.31: Plot of the weight comparison between cross tube members....................... 69 Figure 4.32: Schematic of the tubeplate (a) and the tubegrate (b) panel designs. ........... 70 Figure 4.33: Manufacturing process of the fiberplate design. This design incorporates
ribbed fiberglass face plates and extruded aluminum tubes as a core material. ....... 72 Figure 4.34: The fiberplate design with five aluminum tube cross members, fiberglass
top and bottom face plates, and paper honeycomb rib stiffeners.............................. 73 Figure 4.35: Tubeplate geometry, mesh, boundary conditions and applied load. ........... 75 Figure 4.36: Tubegrate geometry, mesh, boundary conditions, and applied load. .......... 76 Figure 4.37: Fiberplate design with cross sectional view. ............................................... 77 Figure 4.38: Illustration of various surface configurations of the fiberplate design........ 78 Figure 4.39: Contour plot showing the thickness of each surface segment for the
fiberplate design........................................................................................................ 79 Figure 5.1: Instrumentation of tubegrate panel with uniaxial and rosette gages. ............ 81 Figure 5.2: Rosette strain gage placement for the tubegrate panel. ................................. 82 Figure 5.4: The rosette strain gage placement for the tubeplate panel. ........................... 83 Figure 5.6: Instrumentation of the carbonplate panel with uniaxial strain gages centered
on the middle cross member and strain gage rosettes on the inset of the edge supports. .................................................................................................................... 86
Figure 6.1 (a) – (d): The Load vs. Strain data plots of the tubeplate experimental test and reference figure of strain gage locations. .................................................................. 88
Figure 6.2: Shearing strain values for the tubeplate configuration at the inset of the simply supported edges............................................................................................. 90
Figure 6.3 (a) – (d): The Load vs. Strain data plots of the tubeplate experimental test and reference figure of strain gage locations. .................................................................. 91
Figure 6.4: Shearing strain values for the tubegrate configuration at the inset of the simply supported U-channel edges. .......................................................................... 92
Figure 6.5 (a) – (d): The Load vs. Strain data plots of the fiberplate experimental test and reference figure of strain gage locations. .................................................................. 94
Figure 6.6: Shear strain values for the fiberplate configuration at the inset of the simply supported edges......................................................................................................... 95

ix
Figure 6.7 (a) - (d): The Load vs. Strain data plots of the carbonplate experimental test and reference figure of strain gage locations. ........................................................... 96
Figure 6.8: The shear strain values for the carbonplate panel at the inset of the simply supported edges......................................................................................................... 97
Figure 7.1: Tubeplate finite element model displaying the boundary conditions, load, and coupled degrees of freedom as weld connections..................................................... 99
Figure 7.2: Strain in the uniaxial direction corresponding to the strain gage placement in the experimental analysis. ....................................................................................... 100
Figure 7.3: Magnified view of the uniaxial strain next to the load area. Notice the stress concentration next to the weld point. ...................................................................... 100
Figure 7.4: Shear strain plot of the tubeplate design. .................................................... 101 Figure 7.5: Magnification of shear strain contour plot at the rosette gage location. ..... 102 Figure 7.6: Tubegrate finite element model showing the contact load, edge restraints, and
coincident nodes...................................................................................................... 103 Figure 7.7: Uniaxial strain of the tubegrate panel.......................................................... 104 Figure 7.8: Magnified view of tubegrate uniaxial strain at strain gage location. .......... 104 Figure 7.9: Shear strain contour plot of the tubegrate panel.......................................... 105 Figure 7.10: Magnification of the tubegrate shear strain rosette location. .................... 105 Figure 7.11: The fiberplate finite element model showing the simply supported edges
and load................................................................................................................... 107 Figure 7.12: Uniaxial strain of the fiberplate panel. ....................................................... 108 Figure 7.13: Shear strain contour plot of the fiberplate panel. ...................................... 108 Figure 7.14: Uniaxial strain distribution of the carbonplate .......................................... 110 Figure 7.15: Shear strain distribution of the carbonplate............................................... 110 Figure 7.16: Contour plot of Von-Mises stress in the fiberplate. .................................. 111 Figure 7.17: Contour plot of the Von-Mises stress in the core of the fiberplate. .......... 112 Figure 7.18: Contour plot of the Von-Mises stress in the carbonplate. ......................... 112 Figure 7.19: Contour plot of the Von-Mises stress in the core of the carbonplate. ........ 113 Figure 7.20: Finite element models of the trailer section and the carbonplate. ............. 117 Figure 7.21: Displacement contour plot of the trailer section model. ........................... 118 Figure 7.22: Displacement contour plot of the carbonplate-4 section. .......................... 118 Figure 7.23: Shear strain contour plot of the trailer section model. .............................. 119 Figure 7.24: Shear strain contour plot of the carbonplate-4 model. ............................... 119 Figure 7.25: Displacement contour plot of the fiberglass-4 model. ............................... 120 Figure 7.26: Shear strain contour plot of the fiberglass-4 model. ................................. 121

1
Chapter 1 - Introduction
1.1 Introduction The overall goal of this work is to devise weight saving solutions for heavy
vehicle systems. The method chosen to achieve this goal is to replace heavy structural
parts of a current trailer with lightweight composite structures, and develop the joining
methods needed to implement the designs into a trailer structure. Throughout the
process, several intermediate steps were taken, the first being the construction of a scaled
model composite trailer system. The process of analyzing, designing, and fabricating a 1
to 4 scaled model using innovative materials and joining concepts served to provide an
understanding of the problems and concerns involved with this type of design in heavy
trailer systems. The model was built with the goal to reduce the overall weight of heavy
trailer systems. Innovative materials and a modular design are the means utilized here to
reduce the weight of the trailer.
For cost effectiveness, standard commercial materials were used to build the
trailer model. However, the final design concept focuses on detailed sandwich
composite design that will incorporate fiber reinforced polymer (FRP) composite
sandwich structures as the primary method for weight reduction and load resistance. The
primary areas where sandwich composites will be most effective are in the flooring
platform, sidewalls, roof, and door of the haul trailer.
1.2 Objectives The main objective of this study is to create design and joining methods that will
allow the incorporation of lightweight composite plates, panels or structures into a van
trailer design for an overall vehicle-system weight reduction. Innovative joining methods
will create solutions to connect components in a large vehicle trailer system, in place of
mechanical joints which include bolting and riveting.
The first step was to construct a scaled replica model of a haul trailer focusing on
the possible designs for the floor, sidewalls, roof, and door using adhesive bonding and
mating geometry parts as the primary methods to join various parts. The process was an

2
investigative procedure to face first-hand the complications of fabricating a trailer haul
with FRP composites and new bonding and joining methods.
The second step was to optimize the flooring structure, sidewalls, roof and rear
door design to be most beneficial in weight saving and load bearing aspects. Several
different design ideas were developed and studied. This work will detail the design,
fabrication process, experimental testing and finite element analysis of these structures,
and will determine their potential for implementation into a large trailer haul system, or
complete composite trailer design.

3
Chapter 2 – Literature Review
2.1 Composite Materials
2.1.1 Hand Lay-up
The hand lay-up process is also referred to as a wet lay-up. It combines the
reinforcement fibers with a liquid resin in a mold. Layers of fibers are placed into the
mold and saturated with the resin. The part is hand rolled to create a uniform resin coat
and extract any voids or air pockets within the combination. Layers are added until the
thickness or desired orientation of fibers is reached. The curing process is the final stage
of the hand lay-up manufacturing; it involves the chemical process of the resin changing
state from a liquid to a solid [2].
The lay-up process begins with the development of a proper mold to
accommodate the desired part geometry and requirements of the curing process. The
material used for a mold depends on the number of times the mold will be used,
temperature and pressure of the curing process, and the manufacturing of the mold itself.
To avoid the resin curing to the mold and damaging the finished part by forced removal,
a release agent is applied to the areas where the mold and resin come into contact.
Common release agents are wax, poly vinyl alcohol, silicones, and release fabric.
The fibers are then placed on the mold to be saturated with resin. The proper
measurements of mixing ratio of the resin and catalyst must be carefully followed and
mixed thoroughly before application. After the different layers of fabric have been
applied to the mold and saturated with the resin, hand rollers are used to compress the
layers together and against the mold. Hand rolling of the lay-up ensures removal of any
air pockets that will become voids during the curing process if not removed. The curing
process is usually done at room temperature. However, elevated pressures are sometimes
applied to the part during the curing process to remove excess resin and air via bag
molding [2].

4
2.1.2 Bag Molding Pressure can be applied to a laminate during the curing process by using bag
molding techniques. Vacuum bagging uses a flexible plastic or bag that is placed over
the laminate and sealed. A vacuum pump is connected so the air is pumped out from the
inside of the bag which ultimately applies a uniform pressure onto the top surface of the
laminate. The pressure forces the laminate against the mold creating an accurate
resemblance to the mold geometry while removing excess resin and air [3].
The three main methods of applying a pressure to a laminate are by pressure bag,
vacuum bag, and autoclave manufacturing. Vacuum bagging is a popular manufacturing
process because it is relatively inexpensive, allows large size parts to be manufactured,
and the quality of the resulting part is mainly dependent on the manufacturer’s skill and
not a machining process.
2.1.3 Autoclave Processing
Autoclave processing assists vacuum bag and pressure bag molding by applying
heat and pressure to a laminate during the entire curing cycle. Curing pressures for
autoclave processing are usually in the range of 50-100 psi (377.5-755 kg/m2). The
benefits of autoclave processing are to produce a laminate with higher density and reduce
the amount of time to completely cure a laminate [4].
Autoclave processing is expensive, timely and laborious. The high cost of
autoclave processing is a result of the autoclave itself, industrial gases such as nitrogen
used for pressurization, and specialized lay-up materials that are not affected by elevated
temperature and pressure. However, autoclave processing produces high quality, complex
laminates and is beneficial for large parts and average production quantities. The method
is very common in aerospace applications but for the research done at the university
level, autoclaves are not as common because of the expense involved. An autoclave was
not used for the research in this work because of cost reasons.
2.1.4 Compression Molding
Compression molding is a molding method in which the molding material,
generally preheated, is placed in an open heated mold with matching male and female
dies. The dies then close onto the material by the means of a hydraulic press, the

5
assistance of heat and fairly high pressure cures the fibers and resin. After the part has
completely cured the mold dies are lifted and the finished part is removed from the mold
[5]. Compression molding is a fairly simple method which allows for high productive
rates and moderate operation costs.
2.1.5 Pultrusion
Pultrusion is a continuous process for manufacturing composites with a
continuous cross-sectional shape. In this process, fibers are impregnated with resin and
carried through a die which forms the reinforcement to the desired shape and then heat is
applied to cure the part [6]. Pultrusion is effective because it is inexpensive and can
produce parts of any length by converting continuous fibers and resin into a solid
laminate. The process is performed by pulling continuous fibers through a heated die
which shapes and cures the fiber and resin.
2.1.6 Resin Transfer Molding
Resin transfer molding (RTM) is an effective method to produce large continuous
fiber composites. Complex shapes can be produced under short cycle times and the
method provides the manufacturer with control of part specifications such as fiber
orientation for optimum material properties [2].
The RTM process is performed by a mold with ports to inject resin into the dry
fiber and outlets which allow air to escape. The process consists of placing the dry fiber
in the mold and closing it. The liquid resin is pumped into the closed mold until it is
completely full. The ports are then sealed and heat is applied. After the part has cured,
the mold is opened and the finished composite part can be removed [2].
2.1.7 Filament Winding
Filament winding is an automated process in which continuous filament is treated
with resin and wound on a mandrel in a pattern which will provide strength in one
direction. “The process is performed by drawing the reinforcement from a spool or creel
through a bath of resin, then winding it on the mandrel under controlled tension and in a
predetermined pattern. The mandrel may be stationary, in which event the creel structure
rotates above the mandrel, or it may be rotated on a lathe about one or more axes. By

6
varying the relative amounts of resin and reinforcement, and the pattern of winding, the
strength of filament wound structures may be controlled to resist stresses in specific
directions. After sufficient layers have been wound, the structure is cured at
temperature.”[7]. The most common shapes to produce by this process are revolved
surfaces such as pipes, cylinders, and spheres.

7
2.2 Sandwich Composites
Sandwich composites are comprised of two face sheets or top and bottom layers
with a core material placed or “sandwiched” between. This type of arrangement creates a
light and stiff structure, because the stiff faces are distanced from the neutral axis, similar
to the flanges of an I-beam. The faces carry the majority of the axial loading and
transverse bending stress. The core serves to stabilize the faces against buckling and
carries most of the shear forces [8]. When specific tailoring of a sandwich composite is
needed, the top and bottom face sheets may differ in material and thickness. A change of
this nature would aide a sandwich composite which needs temperature resistance on one
side more than the opposing side or perhaps one side will primarily carry an impact load
or static deflection.
2.2.1 Core Structures
In sandwich composite design, there are no limitations as to what material can be
used as a core structure. Developments of new core materials are a primary interest in
sandwich composite design and have evolved tremendously over the years. However,
there are four main categories: (a) foam, (b) honeycomb, (c) web, and (d) corrugated or
truss core as seen in Figure 2.1.

8
Figure 2.1: Types of sandwich core materials.
The sandwich structures shown in Figure 2.1 have variations and different
attributes for each type of core material. However, in all cases, the primary loading, both
in-plane and bending, are carried by the faces, while the core resists transverse shear
loads. It is acceptable to assume that in foam and honeycomb core sandwich composites
all the in-plane and bending loads are carried by the faces only. In web-core and truss-
core structures the core carries some of the in-plane and bending loads [9].
The main purpose of foam and honeycomb cores is to provide spacing between
the face sheets and to carry the transverse shear loads. The increase in flexural stiffness
from a monocoque construction to a sandwich composite can be shown mathematically.
When comparing the different structures, the two share in-plane stiffness values. The
difference can be shown in a flexural comparison.
Vinson [9] states the flexural stiffness per unit width, D, for a solid laminate panel
is
( )3
2
23 1
fplate
f
E tD
ν=
−
and the flexural stiffness of a sandwich panel with a foam or honeycomb core is

9
( )2
22 1f c
sandf
E thD
ν=
−
The ratio of the flexural stiffness of the sandwich panel to that of the solid
laminate plate is 23
4sand c
plate
D hD t
⎛ ⎞= ⎜ ⎟⎝ ⎠
Analyzing the ratio shows that if the ratio of the face sheet thickness, t to the core
thickness, hc is 1/20 then the flexural stiffness of the sandwich panel is 300 times greater
than that of the solid laminate plate. By comparison, the sandwich construction with the
same material and total face sheet thickness identical to the laminate thickness, results in
lower lateral deflections, higher overall buckling loads, and higher natural frequencies.
2.2.2 Face Materials
The faces of a sandwich panel can be comprised of almost any material that is
available in a thin sheet. This sole requirement allows many material options for the
designer to utilize in sandwich panel construction. As described by Zenkert [10], the
parameters which are of primary concern for developing a structurally sound sandwich
panel are
• High stiffness resulting in flexural rigidity
• High compressive and tensile strength
• Impact resistance
• Aesthetics
• Chemical and environmental resistance
• Wear resistance
10
The properties listed can be met by two different categories of face materials, metallic
and non-metallic. Metallic face materials are most commonly sheet metals because of
their geometry and applicability to a sandwich composite design. The advantages to
using a metallic face sheet are low cost, good strength and stiffness, and high impact
properties.
Non-metallic face materials are defined by fiber reinforced polymers (FRP). FRP are
composed of fibers and matrix that define the traditional composite material. Typical
fibers are glass, aramid, and carbon. These fibers are combined with a matrix by one of
the manufacturing methods previously discussed to form an FRP composite. Orienting
the fibers in the direction of applied loads utilizes their high stiffness and strength
properties and tailors the composite laminate to resist and sustain loads. Having the
ability to directionally tailor the stiffness and strength of a composite allows for reduction
of material in directions that do not experience loads, this ultimately reduces the material
being used (cost) and weight.
2.2.3 Properties of Fiber Composite
The structural properties of a composite plate can be predicted by utilizing the
material properties of the constituents at a microscopic level. The microscopic level of a
composite refers to its individual fibers and matrix. A laminate is comprised of multiple
layers of lamina arranged in a stacked sequence. The approximation of finding laminate
properties starts with the properties of the lamina and builds by approximation to an
overall laminate definition of properties.
For computational purposes, it is best to use an orthotropic lamina because
laminas usually are unidirectional, bidirectional, or random orientation.

11
Figure 2.2: Schematic of a lamina with fibers and matrix. The lamina is unidirectional with the
longitudinal fibers oriented in the 1 direction.
The rule-of-mixtures (ROM) [11] follows a linear volume fraction relationship
between the composite and its corresponding constituent properties. ROM is an effective
method for determining the Young’s modulus, shear modulus, and Poisson ratios.
Referencing Figure 2.2, the ROM equations for modulus and Poisson ratio values can be
determined.
The average modulus in the fiber direction of Figure 2.2 E1 is
1 f f m mE E V E V= +
where fV and mV are the fiber and matrix volume fractions, respectively. The constituent
properties are the fiber and matrix modulus values, fE and mE .
The determination of the transverse modulus 2E assumes that the stress is equal
in both the fiber and matrix which maintains equilibrium in the transverse direction [8].
The transverse modulus is given by
2
1 f m
f m
V VE E E
= +

12
The in-plane Poisson’s ratio 12ν is equivalent to the negative ratio of the strain in
the 2-direction to the strain in the 1-direction. The ROM equation for determining the in-
plane Poisson’s ratio is
12 f f m mV Vν ν ν= +
The determination of the in-plane shear modulus 12G assumes that the shear stress
in the fiber and matrix is equal. The average shear modulus of the lamina is given by
12
1 f m
f mG G Gν ν
= +
where fG is the fiber shear modulus and mG is the matrix shear modulus.
2.2.4 Lamina Analysis
Due to the thin nature of a composite lamina a state of plane stress can be
assumed. A plane stress assumption in a lamina yields, 3 23 31 0σ τ τ= = = . The stress and
strain relations are then
1 1 21 2 1
2 12 1 2 2
12 12 12
1/ / 0/ 1/ 0
0 0 1/
E EE E
G
ε ν σε ν σγ τ
−⎛ ⎞ ⎡ ⎤ ⎛ ⎞⎜ ⎟ ⎜ ⎟⎢ ⎥= −⎜ ⎟ ⎜ ⎟⎢ ⎥⎜ ⎟ ⎜ ⎟⎢ ⎥⎝ ⎠ ⎣ ⎦ ⎝ ⎠
1 1 21 1 1
2 12 2 2 221 12
12 12 21 12 12
01 0
10 0 (1 )
E EE E
G
σ ν εσ ν ε
ν ντ ν ν γ
⎛ ⎞ ⎡ ⎤ ⎛ ⎞⎜ ⎟ ⎜ ⎟⎢ ⎥=⎜ ⎟ ⎜ ⎟⎢ ⎥−⎜ ⎟ ⎜ ⎟⎢ ⎥−⎝ ⎠ ⎣ ⎦ ⎝ ⎠
or l l lQσ ε=
where l represents the local coordinate system.

13
The properties of the lamina can now be determined. From these properties, we
can describe the behavior of a laminate. It is first important to define coordinate systems
which relate to the lamina and laminate structures. The local coordinate system (1,2, and
3) defines the position on the lamina. The global coordinate system (x,y, and z) defines
the position on the laminate [10]. Since the properties in the local coordinate system are
known a transformation from the local coordinate system to the global coordinate system
is necessary. The transformation matrices are
2 2
2 2
2 2
22
c s scT s c sc
sc sc c s
⎡ ⎤−⎢ ⎥= ⎢ ⎥⎢ ⎥− −⎣ ⎦
2 2
1 2 2
2 2
22
c s scT s c sc
sc sc c s
−
⎡ ⎤⎢ ⎥= −⎢ ⎥⎢ ⎥− −⎣ ⎦
where cosc θ= and sins θ= . The transformation of stresses and strains between the
local and global systems are written as
1
2
12
x
y
xy
Tσ σσ στ τ
⎛ ⎞ ⎛ ⎞⎜ ⎟ ⎜ ⎟=⎜ ⎟ ⎜ ⎟
⎜ ⎟⎜ ⎟ ⎝ ⎠⎝ ⎠
1
12
12
x
y
xy
Tσ σσ στ τ
−
⎛ ⎞⎛ ⎞⎜ ⎟⎜ ⎟ = ⎜ ⎟⎜ ⎟
⎜ ⎟ ⎜ ⎟⎝ ⎠ ⎝ ⎠
1
2
12
xt
y
xy
Tε εε εγ γ
⎛ ⎞⎛ ⎞⎜ ⎟⎜ ⎟ = ⎜ ⎟⎜ ⎟
⎜ ⎟ ⎜ ⎟⎝ ⎠ ⎝ ⎠
( )1
12
12
xt
y
xy
Tε εε εγ γ
−
⎛ ⎞ ⎛ ⎞⎜ ⎟ ⎜ ⎟=⎜ ⎟ ⎜ ⎟
⎜ ⎟⎜ ⎟ ⎝ ⎠⎝ ⎠
The stress-strain equation for the global coordinate system therefore becomes
11 12 16
12 22 26
16 26 66
x x
y y
xy xy
Q Q QQ Q QQ Q Q
σ εσ ετ γ
⎛ ⎞ ⎛ ⎞⎡ ⎤⎜ ⎟ ⎜ ⎟⎢ ⎥=⎜ ⎟ ⎜ ⎟⎢ ⎥⎜ ⎟ ⎜ ⎟⎢ ⎥⎣ ⎦⎝ ⎠ ⎝ ⎠
or Qσ ε=

14
The components of the Q matrix which relate the global stresses to the global
strains is determined from[ ] [ ] [ ][ ]1 tlQ T Q T− −= . The components of the Q matrix can be
written out as
4 2 2 4
11 11 12 66 222 2 4 4
12 11 22 66 12
4 2 2 422 11 12 66 22
3 316 11 12 66 12 22 66
cos 2( 2 )cos sin sin
( 4 )cos sin (sin cos )
sin 2( 2 )cos sin cos
( 2 )sin cos ( 2 )sin cos
l l l l
l l l l
l l l l
l l l l l l
Q Q Q Q Q
Q Q Q Q Q
Q Q Q Q Q
Q Q Q Q Q Q Q
θ θ θ θ
θ θ θ θ
θ θ θ θ
θ θ θ θ
= + + +
= + − + +
= + + +
= − − + − +3 3
26 11 12 66 12 22 66
2 2 4 466 11 22 12 66 66
( 2 )sin cos ( 2 )sin cos
( 2 2 )cos sin (sin cos )l l l l l l
l l l l l
Q Q Q Q Q Q Q
Q Q Q Q Q Q
θ θ θ θ
θ θ θ θ
= − − + − +
= + − − + +
2.2.5 Laminate Analysis
Composite materials including sandwich structures are composed of many lamina
which are stacked in a defined sequence and orientation then bonded or cured together to
form a laminate. Composites have the ability to optimize the orientation of each lamina
layer which allows for tailoring of the material properties for given structure and set of
loading applied to the structure.
Sandwich structures and laminates of several layers now embody a structure of
nominal thickness. The stress-strain relationship for the x-y-z coordinate system is
defined by
11 12 13 16
12 22 23 26
13 23 33 36
44 45
45 55
16 26 36 66
0 00 00 0
20 0 0 020 0 0 020 0
x x
y y
xy z
yz yz
xz xz
xy xy
Q Q Q QQ Q Q QQ Q Q Q
Q QQ Q
Q Q Q Q
σ εσ εσ εσ εσ εσ ε
⎛ ⎞ ⎛ ⎞⎡ ⎤⎜ ⎟ ⎜ ⎟⎢ ⎥⎜ ⎟ ⎜ ⎟⎢ ⎥⎜ ⎟ ⎜ ⎟⎢ ⎥
=⎜ ⎟ ⎜ ⎟⎢ ⎥⎜ ⎟ ⎜ ⎟⎢ ⎥⎜ ⎟ ⎜ ⎟⎢ ⎥⎜ ⎟ ⎜ ⎟⎢ ⎥⎜ ⎟ ⎜ ⎟⎢ ⎥⎣ ⎦⎝ ⎠ ⎝ ⎠
where the remaining undefined Q values are

15
2 213 12 23
2 223 13 23
33 33
36 13 23
2 244 44 55
45 55 44
2 255 55 44
cos sin
sin cos
( )cos sin
cos sin( ) cos sin
cos sin
l l
l l
l
l l
l l
l l
l l
Q Q Q
Q Q QQ QQ Q Q
Q Q QQ Q Q
Q Q Q
θ θ
θ θ
θ θ
θ θθ θ
θ θ
= +
= +=
= −
= += −
= +
44 23
55 13
13 13 12 23 33
23 23 21 13 33
12 21 23 32 31 13 21 13 32
( ) /( ) /
1 2
l
l
l
l
Q GQ GQ EQ E
ν ν νν ν νν ν ν ν ν ν ν ν ν
=== + Δ= + Δ
Δ = − − − −
For a laminate composed of N lamina, the stresses and strains for the kth layer of the
laminate are related by the equation
[ ] 222
x x
y y
z zk
yz yz
xz xz
xy xyk k
Q
σ εσ εσ εσ εσ εσ ε
⎛ ⎞ ⎛ ⎞⎜ ⎟ ⎜ ⎟⎜ ⎟ ⎜ ⎟⎜ ⎟ ⎜ ⎟
=⎜ ⎟ ⎜ ⎟⎜ ⎟ ⎜ ⎟⎜ ⎟ ⎜ ⎟⎜ ⎟ ⎜ ⎟⎜ ⎟ ⎜ ⎟⎝ ⎠ ⎝ ⎠
where all matrices have the subscript k because of the orientation of the particular lamina
with respect to the global or x-y coordinate system.
2.2.6 Plate Stiffness and Stress and Strain Variation
The extension and bending stiffness of a laminate is defined by the variation of
stress and strain through the thickness of a laminate. Analysis takes into consideration
that the bonds between layers are perfect resulting in continuous displacements across the
lamina edges.
From Barbero [2], Zenkert [10], and Jones [11], the assumptions of plate stiffness
are as follows for a thin laminate and referencing Figure 2.3.
(1) A line originally straight and perpendicular to the middle surface (line A-D) remains
in this manner after the plate is deformed. This assumption is presumed from

16
experimental observations and implies that shear strains xzγ and yzγ are constant through
the thickness.
(2) Line A-D is assumed to have constant length therefore, the strain perpendicular to the
middle surface is neglected or 0zε = .
Figure 2.3: Undeformed and deformed cross sections of a laminate plate.
Figure 2.3 shows a laminate plate and a removed cross section which is viewed in
the xz plane. The laminate displacements are labeled as u, v, and w and are in the
respective x, y, and z directions. From assumption (1)
c o cu u z β= −
where owx
β ∂=
∂.
The displacement, u, at any point z through the laminate thickness becomes
oo
wu u zx
∂= −
∂
and the displacement v in the y-direction is

17
oo
wv v zy
∂= −
∂
From the assumptions and classical plate theory, 0z yz xzε γ γ= = = the strains
within the plate are defined as
2
2
2
2
2
2
o ox
o oy
o o oxy
u wu zx x x
v wv zy y y
u v wu v zy x y x x y
ε
ε
γ
∂ ∂∂= = −∂ ∂ ∂
∂ ∂∂= = −∂ ∂ ∂
∂ ∂ ∂∂ ∂= + = + −∂ ∂ ∂ ∂ ∂ ∂
or
ox x x
oy y y
oxy xy xy
zε ε κε ε κγ γ κ
⎛ ⎞⎛ ⎞ ⎛ ⎞⎜ ⎟⎜ ⎟ ⎜ ⎟
= +⎜ ⎟⎜ ⎟ ⎜ ⎟⎜ ⎟ ⎜ ⎟⎜ ⎟⎝ ⎠ ⎝ ⎠⎝ ⎠
where the midsurface strains oε and the midsurface curvatures κ are
o
oxo oyoxy
o o
uxvy
u vy x
εεγ
⎛ ⎞∂⎜ ⎟
∂⎜ ⎟⎛ ⎞⎜ ⎟∂⎜ ⎟
= ⎜ ⎟⎜ ⎟ ∂⎜ ⎟⎜ ⎟⎝ ⎠ ⎜ ⎟∂ ∂
+⎜ ⎟∂ ∂⎝ ⎠
2
2
2
2
2
2
o
xo
y
xyo
wxwyw
x y
κκκ
⎛ ⎞∂⎜ ⎟
∂⎜ ⎟⎛ ⎞⎜ ⎟∂⎜ ⎟
= −⎜ ⎟⎜ ⎟ ∂⎜ ⎟⎜ ⎟⎝ ⎠ ⎜ ⎟∂⎜ ⎟⎜ ⎟∂ ∂⎝ ⎠
The next phase of laminate analysis is to relate the resulting forces and bending
moments to the laminate strains and curvatures.
Figure 2.4: Referencing of the stacking sequence for a composite laminate.

18
A five layer composite laminate of thickness h is shown in Figure 2.4. The
dimensions above the midplane z = 0 is positive and below the midplane is negative. The
distance to the top of the kth layer is defined by hk.
Following classical plate, beam, and shell theory the stress resultants (N), stress
couples (M), and the transverse shear resultants (Q) are defined per unit width of the
overall structure without taking into account the number of lamina and their orientation.
/ 2
/ 2
x x
y yh
xy xyh
x xz
y yz
NNN dzQQ
σσσσσ
−
⎛ ⎞ ⎛ ⎞⎜ ⎟ ⎜ ⎟⎜ ⎟ ⎜ ⎟⎜ ⎟ ⎜ ⎟=⎜ ⎟ ⎜ ⎟⎜ ⎟ ⎜ ⎟⎜ ⎟ ⎜ ⎟⎝ ⎠ ⎝ ⎠
∫ and / 2
/ 2
x xh
y yh
xy xy
MM zdzM
σσσ−
⎛ ⎞ ⎛ ⎞⎜ ⎟ ⎜ ⎟
=⎜ ⎟ ⎜ ⎟⎜ ⎟ ⎜ ⎟⎝ ⎠ ⎝ ⎠
∫
In plate and shell structures, the above resultants vary in both the x and y direction
therefore, it is important to note the results are in force per unit length (width) and couple
per unit length.
In a laminate or sandwich plate, the stress values across each lamina can be
integrated. Since the stiffness matrix is constant for a single lamina, it can be removed
from the integration over each layer but is accounted for in the summation of force and
moment results for each layer.
Referencing Figure 2.4:
1 1
11 12 16
12 22 261
16 26 66
k k
k k
ox x xz zN
oy y y
k oz zxy xy xyk
N Q Q QN Q Q Q dz zdzN Q Q Q
ε κε κγ κ− −
=
⎛ ⎞⎛ ⎞⎛ ⎞ ⎛ ⎞⎡ ⎤⎜ ⎟⎜ ⎟⎜ ⎟ ⎜ ⎟⎢ ⎥= +⎜ ⎟⎜ ⎟⎜ ⎟ ⎜ ⎟⎢ ⎥⎜ ⎟⎜ ⎟ ⎜ ⎟⎜ ⎟⎢ ⎥⎣ ⎦⎝ ⎠ ⎝ ⎠⎝ ⎠⎝ ⎠
∑ ∫ ∫
1 1
11 12 162
12 22 261
16 26 66
k k
k k
ox x xz zN
oy y y
k oz zxy xy xyk
M Q Q QM Q Q Q zdz z dzM Q Q Q
ε κε κγ κ− −
=
⎛ ⎞⎛ ⎞⎛ ⎞ ⎛ ⎞⎡ ⎤⎜ ⎟⎜ ⎟⎜ ⎟ ⎜ ⎟⎢ ⎥= +⎜ ⎟⎜ ⎟⎜ ⎟ ⎜ ⎟⎢ ⎥⎜ ⎟⎜ ⎟ ⎜ ⎟⎜ ⎟⎢ ⎥⎣ ⎦⎝ ⎠ ⎝ ⎠⎝ ⎠⎝ ⎠
∑ ∫ ∫

19
Removing the values oxε , o
yε , oxyγ , xκ , and xyκ because they are midsurface
functions and not functions of the thickness, z results in the previous equations taking the
form of
11 12 16 11 12 16
12 22 26 12 22 26
16 26 66 16 26 66
ox x x
oy y y
oxy xy xy
N A A A B B BN A A A B B BN A A A B B B
ε κε κγ κ
⎛ ⎞⎛ ⎞ ⎛ ⎞⎡ ⎤ ⎡ ⎤⎜ ⎟⎜ ⎟ ⎜ ⎟⎢ ⎥ ⎢ ⎥= +⎜ ⎟⎜ ⎟ ⎜ ⎟⎢ ⎥ ⎢ ⎥
⎜ ⎟ ⎜ ⎟⎜ ⎟⎢ ⎥ ⎢ ⎥⎣ ⎦ ⎣ ⎦⎝ ⎠ ⎝ ⎠⎝ ⎠
11 12 16 11 12 16
12 22 26 12 22 26
16 26 66 16 26 66
ox x x
oy y y
oxy xy xy
M B B B D D DM B B B D D DM B B B D D D
ε κε κγ κ
⎛ ⎞⎛ ⎞ ⎛ ⎞⎡ ⎤ ⎡ ⎤⎜ ⎟⎜ ⎟ ⎜ ⎟⎢ ⎥ ⎢ ⎥= +⎜ ⎟⎜ ⎟ ⎜ ⎟⎢ ⎥ ⎢ ⎥
⎜ ⎟ ⎜ ⎟⎜ ⎟⎢ ⎥ ⎢ ⎥⎣ ⎦ ⎣ ⎦⎝ ⎠ ⎝ ⎠⎝ ⎠
where the extensional stiffness matrix ijA is defined as
11( ) ( )
N
ij ij k k kk
A Q z z −=
= −∑
the coupling stiffness matrix ijB is defined as
2 21
1
1 ( ) ( )2
N
ij ij k k kk
B Q z z −=
= −∑
and the bending stiffness matrix ijD is defined as
3 31
1
1 ( ) ( )3
N
ij ij k k kk
D Q z z −=
= −∑
The ijA , ijB , and ijD matrices are functions of the thickness, orientation, stacking
sequence, and material properties of the layers of the laminate [11]. The presence of the
ijB matrix indicates coupling between the bending and extension of a laminate loaded in
in-plane tension. Also, a laminate which experiences a moment when the ijB matrix is
present will also undergo extension of the middle surface.
A symmetric laminate, one that has identical orientation, thickness and material
properties about the middle surface, results in a zero ijB matrix. Therefore, when a

20
laminate is loaded with a set of in-plane forces only middle surface strains result. Also,
under a set of bending moments only curvatures will be produced in the laminate [12].
2.2.7 Stiffness Properties of a Sandwich Structure
A midplane symmetric sandwich structure can be analyzed in the same method as
a laminate but defining the bottom sheet as lamina 1, the core as lamina 2 and the top
sheet as lamina 3 [9]. Assuming that each layer is isotropic then [ ] [ ]lQ Q= and the ijA
matrix can be written as
( ) ( ) ( ) 2( ) ( )ij ij f f ij c c ij f f ij f f ij c cA Q t Q h Q t Q t Q h= + + = +
where the subscripts f and c reference the face and core, respectively. The height of the
core is defined by hc and the thickness of the face sheet is tf.
Similarly,
3 3 3 3 3 31 1 1( ) ( ) ( )
3 2 2 3 2 2 3 2 2c c c c c c
ij ij f f ij c ij f fh h h h h hD Q t Q Q t
⎡ ⎤ ⎡ ⎤ ⎡ ⎤⎛ ⎞ ⎛ ⎞ ⎛ ⎞ ⎛ ⎞ ⎛ ⎞ ⎛ ⎞= − − − − + − − + − + +⎢ ⎥ ⎢ ⎥ ⎢ ⎥⎜ ⎟ ⎜ ⎟ ⎜ ⎟ ⎜ ⎟ ⎜ ⎟ ⎜ ⎟⎝ ⎠ ⎝ ⎠ ⎝ ⎠ ⎝ ⎠ ⎝ ⎠ ⎝ ⎠⎢ ⎥ ⎢ ⎥ ⎢ ⎥⎣ ⎦ ⎣ ⎦ ⎣ ⎦
The Bij matrix is not studied in this section because the limit is a midplane symmetric
laminate and as discussed previous the Bij matrix is zero under this condition.
It is commonly assumed that the stiffness of the core is negligible compared to the
stiffness of the face sheet. This assumption is valid for traditional sandwich composites
which may have a foam, wood, or honeycomb core [13]. However, the research within
this work not only uses traditional composite core assumptions but is progressive in the
sense to introduce core structures that have respectable stiffness values alone.

21
2.3 Classical Theory of Laminate or Sandwich Plate Bending
2.3.1 Equilibrium Equations
This section follows the work of Vinson [9,14] and Zenkert [10] and others
contributing to the classical theory of laminates and sandwich panels.
The equilibrium equations for three-dimensional elasticity are written as
0 (1)
0 (2)
0 (3)
yxx zxx
xy y zyy
yzxz zz
Fx y z
Fx y z
Fx y z
σσ σ
σ σ σ
σσ σ
∂∂ ∂+ + + =
∂ ∂ ∂∂ ∂ ∂
+ + + =∂ ∂ ∂
∂∂ ∂+ + + =
∂ ∂ ∂
where forces Fx, Fy, and Fz are the body forces.
These three equations define a single layer or thin plate. For beam, plate, or shell
theory the stresses must be integrated across the thickness of the structure to acquire a
solution to the system.
As seen in the previous section the stress resultants and couples can be defined as
/ 2
/ 2
x x
y yh
xy xyh
x xz
y yz
NNN dzQQ
σσσσσ
−
⎛ ⎞ ⎛ ⎞⎜ ⎟ ⎜ ⎟⎜ ⎟ ⎜ ⎟⎜ ⎟ ⎜ ⎟=⎜ ⎟ ⎜ ⎟⎜ ⎟ ⎜ ⎟⎜ ⎟ ⎜ ⎟⎝ ⎠ ⎝ ⎠
∫ and / 2
/ 2
x xh
y yh
xy xy
MM zdzM
σσσ−
⎛ ⎞ ⎛ ⎞⎜ ⎟ ⎜ ⎟
=⎜ ⎟ ⎜ ⎟⎜ ⎟ ⎜ ⎟⎝ ⎠ ⎝ ⎠
∫
For laminated plates and sandwich structures it is necessary to account for the
stress discontinuities resulting from different layers, orientations, and material properties.
Therefore the stress resultants for laminates and sandwich structures are

22
1
1
k
k
x x
y yhN
xy xy kk h
x xz
y yz k
NNN dzQQ
σσσσσ
−=
⎛ ⎞ ⎛ ⎞⎜ ⎟ ⎜ ⎟⎜ ⎟ ⎜ ⎟⎜ ⎟ ⎜ ⎟=⎜ ⎟ ⎜ ⎟⎜ ⎟ ⎜ ⎟⎜ ⎟ ⎜ ⎟⎝ ⎠ ⎝ ⎠
∑ ∫ and 1
1
k
k
x xhN
y y k kk h
xy xy k
MM z dzM
σσσ−
=
⎛ ⎞ ⎛ ⎞⎜ ⎟ ⎜ ⎟
=⎜ ⎟ ⎜ ⎟⎜ ⎟ ⎜ ⎟⎝ ⎠ ⎝ ⎠
∑ ∫
Studying the equilibrium equation in the x-direction or equation (1) from above,
neglecting the Fx body force, integrating by term across each layer and summing yields
1 11
1 1 1
( ) ( ) 0 (4)k k
k kk k
N N Nh h
x yx zx k zx kh hk k k
dz dz h hx y
σ σ σ σ− −
−= = =
∂ ∂⎡ ⎤ ⎡ ⎤+ + − =⎢ ⎥ ⎢ ⎥∂ ∂⎣ ⎦ ⎣ ⎦∑ ∑ ∑∫ ∫
or
( ) ( ) 0 (5)yxxzx N zx o
NN h hx y
σ σ∂∂
+ + − =∂ ∂
hN and ho are the top and bottom surfaces, respectively. The third term in equation (4)
represents how the interlaminar shear stresses cancel each other out between plies and
and between the face and core material. Therefore the only remaining terms are the shear
stresses on the top and bottom layer are seen in the simplification in equation (5). The
equilibrium in the y-direction follows as
( ) ( ) 0 (6)xy yzy N zy o
N Nh h
x yσ σ
∂ ∂+ + − =
∂ ∂
and in the z-direction
1 2( ) ( ) 0 0 (7)y yx xz N z o
Q QQ Qh h or p px y x y
σ σ∂ ∂∂ ∂
+ + − = + + − =∂ ∂ ∂ ∂

23
Equations (5), (6), and (7) define the force equilibrium equations. The moment
equilibrium equations can be defined for the x-direction and the y-direction. For the x-
direction the moment equilibrium equation is
[ ]( ) ( ) 0 (8)2
xyxx zx N zx o
MM hQ h hx y
σ σ∂∂
+ − + + =∂ ∂
and in the y-direction
( ) ( ) 0 (9)2
xy yy zy N zy o
M M hQ h hx y
σ σ∂ ∂
⎡ ⎤+ − + + =⎣ ⎦∂ ∂
2.3.2 Bending Analysis Excluding Transverse Shear Deformation Effects
A mid-plane symmetric laminate with Bij = 0 reduces the plate bending
equilibrium equations (7), (8), and (9) to
1 2
0 (10)
0 (11)
( , ) ( , ) ( , ) (12)
xyxx
y xyy
yx
MM Qx y
M MQ
x yQQ p x y p x y p x y
x y
∂∂+ − =
∂ ∂∂ ∂
+ − =∂ ∂
∂∂+ = − + =
∂ ∂
Solving the system of equations for p(x,y) yields
2 22
2 22 ( , )xy yx M MM p x yx x y y
∂ ∂∂+ + = −
∂ ∂ ∂ ∂
Using the characteristics of a mid-plane symmetric laminate which are Bij = 0 and
uncoupling bending and twisting terms the equation
24
11 12 16 11 12 16
12 22 26 12 22 26
16 26 66 16 26 66
ox x x
oy y y
oxy xy xy
M B B B D D DM B B B D D DM B B B D D D
ε κε κγ κ
⎛ ⎞⎛ ⎞ ⎛ ⎞⎡ ⎤ ⎡ ⎤⎜ ⎟⎜ ⎟ ⎜ ⎟⎢ ⎥ ⎢ ⎥= +⎜ ⎟⎜ ⎟ ⎜ ⎟⎢ ⎥ ⎢ ⎥
⎜ ⎟ ⎜ ⎟⎜ ⎟⎢ ⎥ ⎢ ⎥⎣ ⎦ ⎣ ⎦⎝ ⎠ ⎝ ⎠⎝ ⎠
becomes
22
11 12 11 122
212 22 12 22
66 66 2
0 00 0
0 0 2 0 02
x x
y y
xy xy
wxM D D D D
wM D D D D yM D D
wx y
κκκ
⎛ ⎞∂−⎜ ⎟∂⎛ ⎞ ⎛ ⎞⎡ ⎤ ⎡ ⎤ ⎜ ⎟⎜ ⎟ ⎜ ⎟⎢ ⎥ ⎢ ⎥ ∂⎜ ⎟= = −⎜ ⎟ ⎜ ⎟⎢ ⎥ ⎢ ⎥ ∂⎜ ⎟⎜ ⎟ ⎜ ⎟⎢ ⎥ ⎢ ⎥⎣ ⎦ ⎣ ⎦ ⎜ ⎟⎝ ⎠ ⎝ ⎠ ∂−⎜ ⎟∂ ∂⎝ ⎠
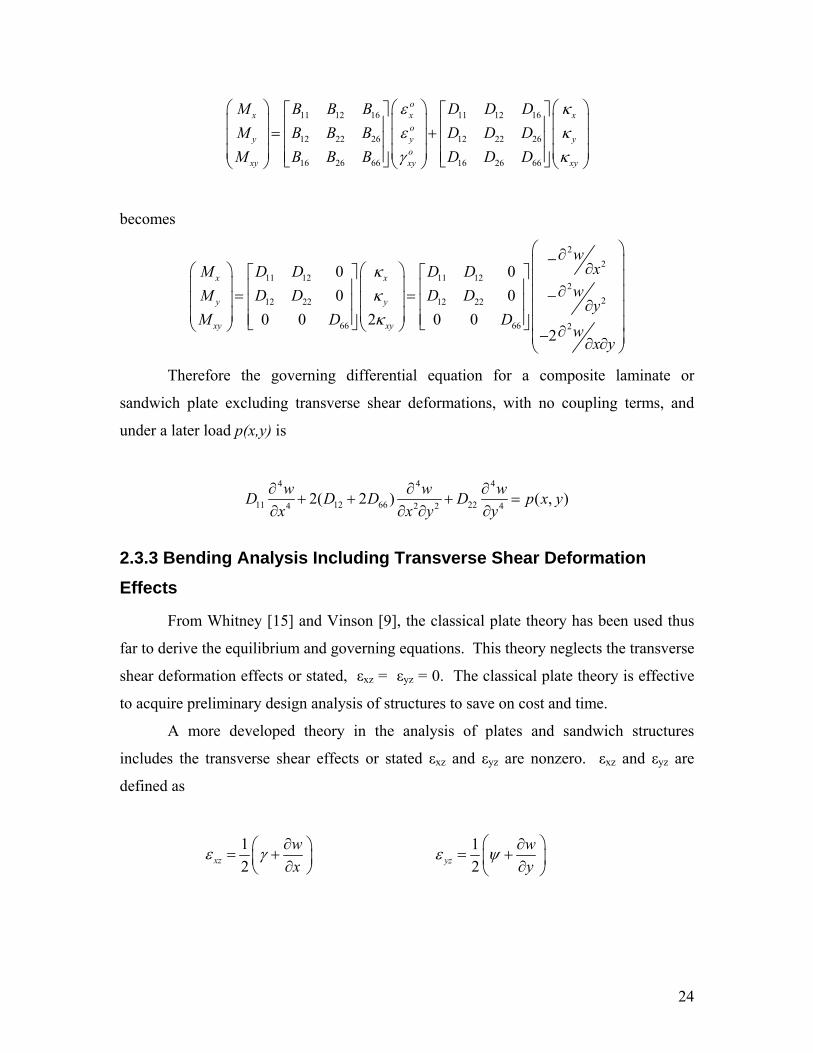
Therefore the governing differential equation for a composite laminate or
sandwich plate excluding transverse shear deformations, with no coupling terms, and
under a later load p(x,y) is
4 4 4
11 12 66 224 2 2 42( 2 ) ( , )w w wD D D D p x yx x y y
∂ ∂ ∂+ + + =
∂ ∂ ∂ ∂
2.3.3 Bending Analysis Including Transverse Shear Deformation Effects
From Whitney [15] and Vinson [9], the classical plate theory has been used thus
far to derive the equilibrium and governing equations. This theory neglects the transverse
shear deformation effects or stated, εxz = εyz = 0. The classical plate theory is effective
to acquire preliminary design analysis of structures to save on cost and time.
A more developed theory in the analysis of plates and sandwich structures
includes the transverse shear effects or stated εxz and εyz are nonzero. εxz and εyz are
defined as
12xz
wx
ε γ ∂⎛ ⎞= +⎜ ⎟∂⎝ ⎠ 1
2yzwy
ε ψ⎛ ⎞∂
= +⎜ ⎟∂⎝ ⎠

25
where γ and ψ are the rotations and are defined as uz∂∂
and vz∂∂
respectively. In classical
plate theory γ and ψ took the values of wx
∂−∂
and wy
∂−∂
which ultimately produced
εxz = εyz = 0. However, when accounting for transverse shear deformation affects γ and ψ
are unknown dependent variables which must be solved for yielding five unknowns to be
solved for uo, vo w, γ and ψ.
Taking into account the nonzero values for εxz and εyz and revisiting the
equilibrium equations from classical plate theory the governing differential equations for
a symmetric laminate composite plate subjected to a lateral load are
2 2 2
11 66 66 12 552 2
2 2 2
66 12 66 22 442 2
2 2
55 442 2
( ) 2 0
( ) 2 0
2 2 ( , ) 0
wD D D D Ax y x y x
wD D D D Ax y y y y
w wA A p x yx x y y
γ γ ψ γ
γ ψ ψ ψ
γ ψ
∂ ∂ ∂ ∂⎛ ⎞+ + + − + =⎜ ⎟∂ ∂ ∂ ∂ ∂⎝ ⎠
⎛ ⎞∂ ∂ ∂ ∂+ + + − + =⎜ ⎟∂ ∂ ∂ ∂ ∂⎝ ⎠
⎛ ⎞ ⎛ ⎞∂ ∂ ∂ ∂+ + + + =⎜ ⎟ ⎜ ⎟∂ ∂ ∂ ∂⎝ ⎠ ⎝ ⎠
The three partial differential equations that govern a laminate or sandwich panel
have three unknowns w, γ and ψ. As shown, the complexity of the laterally loaded
system increases from the classical plate theory to the refined theory with the inclusion of
transverse shear deformation effects.
2.3.4 Dynamic Loading of Laminates or Sandwich Panels
Dynamic loading is characterized by time dependent loads and the
implementation of a time variable into the governing equation does not require the
development of new theory.
The changes to the governing equation of the classical plate theory and the refined
theory which includes transverse shear deformation including acceleration terms or the
second derivative of the displacement term.

26
For the classical plate theory, Vinson [9] and Dobyns [16], the governing equation
of a homogenous plate becomes 4 4 4 2
11 12 66 224 2 2 4 22( 2 ) ( , , )mw w w wD D D D h p x y t
x x y y tρ∂ ∂ ∂ ∂
+ + + + =∂ ∂ ∂ ∂ ∂
where the introduction of the inertia term 2
2mwh
tρ ∂
∂ and the time dependent load, p(x,y,t)
are changes from the classical plate theory governing equation. The term ρm is the mass
density of the plate material and h is the thickness of the plate. For a composite laminate
with different material layers ρmh term must be summed throughout the laminate layers
resulting in the equation form
4 4 4 2
11 12 66 22 14 2 2 4 21
2( 2 ) ( ) ( , , )k
N
m k kk
w w w wD D D D h h p x y tx x y y t
ρ −=
∂ ∂ ∂ ∂+ + + + − =
∂ ∂ ∂ ∂ ∂ ∑
When including transverse shear deformation effects, the three governing
equations become
2 2 2 2
11 66 66 12 552 2 2
2 2 2 2
66 12 66 22 442 2 2
2 2 2
55 442 2 2
( ) 2 0
( ) 2 0
2 2 ( , , ) 0m
wD D D D A Ix y x y x t
wD D D D A Ix y y y y t
w w wA A h p x y tx x y y t
γ γ ψ γγ
γ ψ ψ ψψ
γ ψ ρ
∂ ∂ ∂ ∂ ∂⎛ ⎞+ + + − + − =⎜ ⎟∂ ∂ ∂ ∂ ∂ ∂⎝ ⎠
⎛ ⎞∂ ∂ ∂ ∂ ∂+ + + − + − =⎜ ⎟∂ ∂ ∂ ∂ ∂ ∂⎝ ⎠
⎛ ⎞ ⎛ ⎞∂ ∂ ∂ ∂ ∂+ + + − + =⎜ ⎟ ⎜ ⎟∂ ∂ ∂ ∂ ∂⎝ ⎠ ⎝ ⎠
where 3
12mhI ρ
= for a solid homogenous plate. Analysis of a composite laminate or
sandwich composite plate uses the summation of I through the laminate layers,
3 31
1
1 ( )3 k
N
m k kk
I h hρ −=
= −∑ . Therefore, the governing equations for a composite laminate or
sandwich structure under dynamic loading effects are

27
2 2 2 2
3 311 66 66 12 55 12 2 2
1
2 2 2 23 3
66 12 66 22 44 12 2 21
2 2
55 442
1( ) 2 ( ) 03
1( ) 2 ( ) 03
2 2
k
k
N
m k kk
N
m k kk
wD D D D A h hx y x y x t
wD D D D A h hx y y y y t
w wA Ax x y
γ γ ψ γγ ρ
γ ψ ψ ψψ ρ
γ ψ
−=
−=
∂ ∂ ∂ ∂ ∂⎛ ⎞+ + + − + − − =⎜ ⎟∂ ∂ ∂ ∂ ∂ ∂⎝ ⎠
⎛ ⎞∂ ∂ ∂ ∂ ∂+ + + − + − − =⎜ ⎟∂ ∂ ∂ ∂ ∂ ∂⎝ ⎠
⎛ ⎞∂ ∂ ∂ ∂+ + +⎜ ⎟∂ ∂ ∂⎝ ⎠
∑
∑
2
12 21
( ) ( , , ) 0k
N
m k kk
w h h p x y ty t
ρ −=
⎛ ⎞ ∂− − + =⎜ ⎟∂ ∂⎝ ⎠
∑
2.4 Solutions for Rectangular Sandwich Plates
The general plate theory and governing differential equations have been
previously discussed. Determining the solutions for rectangular sandwich plates may be
the result of increasingly complex problems, therefore, solution strategies and techniques
are provided for guidance.
It is best to use energy solutions for problems with discontinuous boundary
conditions, multiple discontinuous or concentrated loads, general anisotropy, or
thermoelastic problems. This section will be discussing the Navier solution for sandwich
plates under loading.
2.4.1 Navier Solution for Sandwich Plates with All Four Edges Simply Supported Solving by the Navier solution introduces a displacement function, w(x,y) and a
load function p(x,y) which serve as separable solutions to sandwich plate analysis
1 1
1 1
( , ) ( ) ( )
( , ) ( ) ( )
mn m nm n
mn m nm n
w x y A X x Y y
p x y B X x Y y
∞ ∞
= =
∞ ∞
= =
=
=
∑ ∑
∑ ∑ (4.2.1)
where, for a simply supported plate on all edges, ( )mX x and ( )nY y are defined as

28
( ) sin ( ) sinm nm x n yX x Y y
a bπ π⎛ ⎞ ⎛ ⎞= =⎜ ⎟ ⎜ ⎟
⎝ ⎠ ⎝ ⎠ (4.2.2)
The values a and b are the dimensions of the plate in the x-direction and y-direction,
respectively.
Solving for Bmn determines whether the load p(x,y) is continuous or discontinuous.
The Bmn value is used for isotropic or orthotropic plates, analysis including or excluding
transverse shear deformation, and is for single lamina, laminates and sandwich plates.
0 0
4 ( , )sin sina b
mnm x n yB p x y dydx
ab a bπ π⎛ ⎞ ⎛ ⎞= ⎜ ⎟ ⎜ ⎟
⎝ ⎠ ⎝ ⎠∫ ∫ (4.2.3)
Considering an orthotropic sandwich panel and ignoring transverse shear
deformation effects the governing differential equation for the plate is
4 4 4
11 12 66 224 2 2 42( 2 ) ( , )w w wD D D D p x yx x y y
∂ ∂ ∂+ + + =
∂ ∂ ∂ ∂ (4.2.4)
as derived in previous sections. Thus, Amn is solved for and becomes
4 2 4
11 12 66 222( 2 )
mnmn
BAm m n nD D D Da a b bπ π π π
=⎛ ⎞ ⎛ ⎞ ⎛ ⎞ ⎛ ⎞+ + +⎜ ⎟ ⎜ ⎟ ⎜ ⎟ ⎜ ⎟⎝ ⎠ ⎝ ⎠ ⎝ ⎠ ⎝ ⎠
(4.2.5)
A solution for the displacement function w(x,y) allows determination of the
magnitude and location of the maximum plate deflection. The derivatives of w(x,y) are
then used in the stress couple equations
22
11 12 11 122
212 22 12 22
66 66 2
0 00 0
0 0 2 0 02
x x
y y
xy xy
wxM D D D D
wM D D D D yM D D
wx y
κκκ
⎛ ⎞∂−⎜ ⎟∂⎛ ⎞ ⎛ ⎞⎡ ⎤ ⎡ ⎤ ⎜ ⎟⎜ ⎟ ⎜ ⎟⎢ ⎥ ⎢ ⎥ ∂⎜ ⎟= = −⎜ ⎟ ⎜ ⎟⎢ ⎥ ⎢ ⎥ ∂⎜ ⎟⎜ ⎟ ⎜ ⎟⎢ ⎥ ⎢ ⎥⎣ ⎦ ⎣ ⎦ ⎜ ⎟⎝ ⎠ ⎝ ⎠ ∂−⎜ ⎟∂ ∂⎝ ⎠
(4.2.6)
where the maximum values and location of Mx, My, and Mxy are determined. From the
stress couples, the maximum stresses in the lamina, laminate, or sandwich panel are
determined with the correct corresponding equations to the plate type.

29
2.4.2 Levy Solution for Plates with Two Edges Simply Supported
The Levy solution [17,9] is effective for a composite plate with no bending-
stretching coupling, having midplane symmetry, and simply supported opposing edges as
more clearly defined in Figure 2.5.
Figure 2.5: A simply supported composite plate used for Levy solution analysis.
Studying Figure 2.5, the boundary conditions for the plate are defined as
( ,0) ( , ) 0( ,0) ( , ) 0y y
w x w x bM x M x b
= == =
(1)
The steps following to the complete solution of the simply supported plate are
taken directly from Levy [17] as analyzed by Vinson [9,14]. Levy assumes a single
infinite half-range sine series satisfying the simply supported boundary conditions to be
1
( , ) ( )sinnn
n yw x y xbπφ
∞
=
⎛ ⎞= ⎜ ⎟⎝ ⎠
∑ (2)
where nφ (x) is currently an unknown function of x. The laterally distributed load p(x,y)
can be defined as
1( , ) ( ) ( ) ( ) sinn
n
n yp x y g x h y g x Abπ∞
=
⎛ ⎞= = ⎜ ⎟⎝ ⎠
∑ (3)
0
2 ( )sinb
nn yA h y dy
b bπ⎛ ⎞= ⎜ ⎟
⎝ ⎠∫ (4)
Now, substituting equations (2) and (3) into the governing differential equation of
the plate (4) and dividing by D1 yields

30
4 2
2 43 24 2
1 1 1
( ) 2 ( ) ( )( )n n n nn n n
d x D d x A g xD xdx D dx D Dφ φλ λ φ− + = (5)
where λn = nπ/b D1 = D11 D2 = D22 D3 = (D12 + 2D66) To acquire a homogenous solution to equation (5) the right hand side is set to zero
and nφ (x) = esx. The result is divided by esx and becomes
4 2 2 43 2
1 1
2 0n nD Ds sD D
λ λ− + = (6)
For an isotropic plate D1 = D2 = D3 and the roots of equation (6) are easily
determined as nλ± and nλ± . However, for an orthotropic plate, there are three sets of
roots and the depend upon the magnitude relation of (D2/D1)1/2 to D3/D1.
When 1/ 2
2 1 3 1( / ) ( / )D D D D< :
1 1 1 1 3 2 4 2( ) cosh( ) sinh( ) cosh( ) sinh( )nh n n n nx C s x C s x C s x C s xφ λ λ λ λ= + + + (7)
1/ 22 1 3 1( / ) ( / )D D D D= :
5 6 3 7 8 3( ) ( ) cosh( ) ( )sinh( )nh n nx C C x s x C C x s xφ λ λ= + + + (8)
1/ 2
2 1 3 1( / ) ( / )D D D D> :
9 5 10 5 4 11 5 12 5 4( ) ( cos sin )cosh( ) ( cos sin )sinh( )nh n n n n n nx C s x C s x s x C s x C s x s xφ λ λ λ λ λ λ= + + + (9) Which case is to be solved depends on the status of the design process. If the
material to be used and the orientation of fibers need to be determined for a particular
design, then multiple cases should be solved to satisfy the boundary conditions and
determine which parameters are best for the design. If material and orientation have
already been specified then the D values will be known and only one case needs to be
solved.

31
( )nh xφ refers to the relevant homogenous portion of the solution, the particular
solution, ( )np xφ , is summed with the relevant to satisfy any set of boundary conditions on
the x-edges of the plate. If the lateral load p(x,y) is linear at most in the x-direction the
particular solution is
42
( )( ) n nnp
n
A g xxD
φλ
= (10)
The boundary conditions will decide the homogenous and particular solutions and
then can be used to determine nφ (x) by
( ) ( ) ( )n nh npx x xφ φ φ= + (11)
From equation (2) the displacement function, w(x,y) can be determined which
yields the displacements results at any point on the plate. The partial derivatives of the
function w(x,y) result in the curvatures for a composite laminate or sandwich plate and
are calculated by
2 2 2
2 2x y xyw w w
x y x yκ κ κ∂ ∂ ∂
= − = − = −∂ ∂ ∂ ∂
(12)
The stresses in each of the k lamina layers can the be determined by
11 12
12 22
66
00
0 0
x x
y y
xy xykk
Q QQ Q z
Q
σ κσ κσ κ
⎡ ⎤ ⎡ ⎤⎡ ⎤⎢ ⎥ ⎢ ⎥⎢ ⎥=⎢ ⎥ ⎢ ⎥⎢ ⎥⎢ ⎥ ⎢ ⎥⎢ ⎥⎣ ⎦⎣ ⎦ ⎣ ⎦
(13)
The stress values resulting from equation (13) are relevant to the different layers
of the laminate or if studying a sandwich plate where, k = 1 is the top face, k = 2 is the
core material, and k = 3 is the bottom face sheet, analysis of the lamina in each layer must
first be analyzed then globalized to the sandwich layer and onto the whole sandwich
plate.

32
2.5 Structural Bonding Bonding and structural joining concepts are critical technologies for developing
innovative designs and structural configurations. Adhesive bonding is a supplementing
factor to aide a geometrically joined structural or can be used alone as the main joining
constituent. Numerous studies on structural bonding have been performed and reported
on and can be further studied in the works of Hart-Smith [18], John and Kinloch [19] and
Ojalvo [20] Tong and Steven [21] are a few contributing to the research of bonding
applications.
Within a structural part, there are commonly areas where the components that
comprise the structural part need to be connected to serve the design purpose. Depending
on the application, materials used, cost, manufacturing process, and other parameters the
type of connection is chosen. Common methods of connection include bolts, rivets,
welds, brazes, or adhesive bonding. Fiber-reinforced composite materials, which
undergo severe damage when using bolting and riveting joining methods making them
more susceptible to interlaminar shear with the substrate, are more suitable for adhesive
bonding methods and through joint innovation and proper adhesive bonding methods can
be as effective as traditional bolting or riveting.
Mechanically connected joints rely on the strength of the fastener (bolts, rivets,
screws, etc.) and the strength of the members being joined therefore, the loads are
transferred by two locked surfaces being joined. Bonded joints have load bearing
capabilities resulting from a surface attachment. The strength of the surface attachment is
a function of the surface energies of the adhesive and the bonding surface. In this type of
bonding, the loads are transferred from one member to another across an interface which
is controlled by the adhesive molecular attractions. The advantages and disadvantages of
adhesive bonded joints are duplicated from Tong and Steven [21].

33
Table 1 Advantages of Bonded Joints Limitations of Bonded Joints Ability to form light weight, stong and stiff structures
Can not be disassembled
Ability to join dissimilar materials; e.g. metal to composite materials
Residual stresses may be created due to difference in coefficients of thermal expansion
Ability to sufficiently join thin sheet materials
Limits to thickness joined with simple configurations
Improved stress distribution, no stress concentration in adherends, unlike mechanical fasteners which produce points of stress concentrations
Sensitive to peel or through thickness stress, i.e., a bonded joint is generally stronger under shear but weak in cleavage pull
Enhanced fatigue properties due to improved stress distribution
Poor resistance to elevated temperature and fire
Improved corrosion resistance e.g., minimizing galvanic corrosion by interposing a non-conducting barrier between the metallic adherends
Prone to environmental degradation, uncertain long term durability under severe service conditions
Smoother surface finishes, with an absence of fastener heads, weld heads, etc
Toxicity and flammability problems
Bonding process can be automated, most convenient and cost effective joining; e.g., complex castings may be produced in several pieces and bonded together
Inspection can be difficult, quality control becomes critical, i.e. the effectiveness of adhesive bonding can not fully be assessed by inspection techniques currently available
2.5.1 Composite Surface Preparation for Bonding Methods
There are many factors to consider when analyzing and designing structural
joints. The considerations are different when adhesively bonding metallic surfaces or
fiber-reinforced composite polymers (FRP). The most critical of these factors is the
preparation of the FRP composite during its manufacturing stages. If using an FRP
composite in a joining situation, the surface which will be bonded should be
manufactured and cured to accept secondary bonding after the initial FRP layup
procedure. Meaning, the use of a peel ply on the area where an adhesive bond is to be
made will leave a rough finish which allows stronger adherence to the mating surface or
one can forego using a peel ply on the bonded surface and later treat the bonding area by
sanding techniques for surface roughing [22].

34
Prior to bonding, the surface of the composite should be thoroughly cleaned of
any foreign material that will come between the interface of the bonded areas. Abrasion
of the bonded area or roughening the surface to increase surface and surface energy prior
to adhesive bonding is used to roughen the resin matrix and expose, but not rupture, the
reinforcing fibers. The surface roughening can be done by hand or machine sanding post
layup process or by incorporating a peel ply in the layup process [20], as mentioned
previously.

35
Chapter 3 – Joining Concepts
3.1 Innovative Structural Joining Configurations
3.1.1 Development of Model Joints and Prototype Designs
The preliminary lightweight design concepts for the flooring design of the trailer
are shown in Figures 3.1, 3.2, and 3.3 below. Figure 3.1 displays two types of sandwich
panel configurations, A and B, for the floor structure of a trailer. Type A consists of a
polymer composite top plate with an extruded ribbed composite bottom plate. The
combined structure formed by joining these plates provides both a lightweight and stiff
floor platform. Type B panel is composed of polymer composite top and bottom plates
with aluminum C-channels sandwiched between the plates as the core material. A major
advantage of the aluminum C-channel core is that it facilitates the joining of the bogey
and the kingpin sections to the floor structure of the trailer. The main disadvantage is the
need of bonding between the aluminum beams and the polymer matrix composite panels.
Figure 3.1: Alternative design concepts for the floor platform of a modified van trailer.
Type C floor construction as shown in Figure 3.2 below, is comprised of a top and
bottom extruded polymer composite plate with small ribbed sections. The small ribbed

36
sections apply a restraint to aluminum or titanium pipes of square cross section. The main
advantage of this design consists of the benefit that the top and bottom plate geometry
allows for easy joining of metal and polymer composite areas, without complicated and
expensive bonding methods. The metal core material provides good accessibility for
joining of the bogey and kingpin sections to the flooring structure.
Figure 3.2: Sandwich composite structure with aluminum tube core construction for flooring platform applications. Design concept C.
Type D floor construction, as shown in Figure 3.3, consists of fiberglass I-cross
beams connected through fiberglass bearing bars running along the trailer axis through
the web centers. The advantages of this type of construction is its good suitability to
forming connections at the bearing bar location between the floor panel and the structures
above or below the floor. The composite I-beam structure is beneficial as a lightweight
design. The addition of top and bottom plate coverings is needed to enclose the I-beam
sections which will create a solid flooring platform. The options for the plate coverings
will be discussed later in this work through advancements of the I-beam design.

37
Figure 3.3: Type D flooring alternative using composite I-beams as cross member supports and composite bearing bars.
The side panels of the scaled prototype trailer are segmented to allow for small
sliding and bending deflections throughout the surfaces of the side and top panels. The
fiberglass panels forming the sidewall of the trailer are connected by an H-joint that
houses two side panels and is reinforced by adhesive bonding in the final design
configuration.
Figure 3.4: Connection method between side panels by an H-joint configuration
The double corner joint configuration is utilized to connect the ceiling panel to the
side panels. It allows joining by an integrated fit between two sidewall panels and allows
for reinforcement by adhesive bonding.

38
Figure 3.5: Double corner joint.
Figure 3.6 shows a configuration for the corner joint connecting the flooring to
the side panels. The spacing between the composite top plate and bottom plate of the
sandwich flooring platform will house the insert from the joint. In order to allow such a
joint configuration, the core material of the sandwich floor panel will not run the full
width of the floor, so that sufficient room is available for the insert. Adhesive bonding
will aid the structure in this case and secure the integrity of the joint between the side and
bottom plates.

39
Figure 3.6: Corner joint for connecting the floor platform to the sidewall or side panels of a van trailer.
An alternative option for the corner joint involves two fiberglass angles that are
adhesively bonded to the I-cross beams of the floor and side panels. The legs of both the
interior and exterior angles are bonded to the floor and the vertical sections of the angles
are bonded to the side panels of the trailer.
Figure 3.7: Alternative option for the corner joint connecting the side panels to the flooring platform.

40
The trailer has been designed to be modular, which allows sections to be removed
and replaced. This design concept ultimately reduces the transportation weight of the
trailer. Three segments in the trailer are removable. In the model, the sections are each 1
foot sections. For a standard 48 ft. trailer, the three removable sections will be 4 ft in
length and allow for a resulting trailer ranging in length from 36 ft to 48 ft in increments
of 4 ft. More on the modular design will be discussed later.
The method of connecting the segments in the trailer will vary with the different
concepts for the flooring structure. The segment connection studied in this report and
used in the model is for the I-cross beams and bearing bars floor design (type D).
3.2 Prototyping of Innovative Structural and Joining Concepts A prototype of a van trailer was constructed at a 1 to 4 scale. The main purpose
of building a solid model is to investigate experimentally in simulated conditions the
potential benefits and drawbacks of various joining configurations and sandwich
composite implementation. The constructing and structural testing of such a model
provides reliable, extensive data for comparative assessments of alternative joining
methods and material selection, mostly through finite element modeling and analysis.
The primary design criteria guiding the fabrication of a scaled trailer prototype are
the achieving of optimal tradeoffs between structural weight and performance, based on
extensive use of lightweight, strong and durable components, connected by fastener-free
joints that allow easy assembly and maintenance. The construction of the prototype
model involves optimum tailoring of fiberglass composite panels, I-beams, and angles to
meet typical design specifications. A hybrid combination of aluminum and fiberglass
components has been used as a preliminary step towards designing and prototyping an
advanced trailer structure. This approach is cost effective and will provide the means to
implement high performance advanced sandwich structures into the model design after
the initial fabrication process has been completed and studied.

41
3.2.1 Manufacturing Process The building of the prototype model was performed in distinctive phases in order
to allow continual assessment of the feasibility, potential advantages and disadvantages
of different design configurations. Phasing of the fabrication process allowed
incremental improvements in the design and fabrication concepts. The first phase was
the construction of the rear section of the trailer model. The process of fabricating this
section progressed into the following trailer sections and provided an effective method to
culminate the full trailer model design
The following commercial parts and materials have been used thus far in the
construction of the trailer prototype:
• ¼” thick fiberglass panels • 1” Standard fiberglass I-beams • Fiberglass bearing bars • Fiberglass angles • Anodized aluminum H-channels • Anodized aluminum J-channels • Anodized aluminum U-channels • Anodized aluminum cornering channels
Custom carbide tipped tools were used to cut the fiberglass panels and the I-
beams in order to tailor each to the design specifications of the trailer. The fiberglass
panels are used to build the top and side walls of the trailer. Cross I-beams are the main
structural elements of the floor and are designed to carry the static and dynamic loads
applied on the trailer bed during its commercial operation. The assortment of fiberglass
I-beams is reinforced by fiberglass “bearing bars” which run the length of the trailer and
connect the I-beams through the web of each. Besides providing structural
reinforcement, the fiberglass bearing bars will provide connection points for the bogey,
landing gear and kingpin of a trailer. Aluminum H-channels and edge corners were
manufactured and tailored to provide strong connections between adjacent side panels, as
well as between the side and top panels. The H-channels are anodized aluminum with ¼”
openings to fit the thickness of the side panels. The H-channels had to be cut to the
proper height and trimmed properly to allow proper spacing and matching with the corner

42
edge trim. The U-channels and the J-channels are used as trim sections for the rear door
of the trailer.
The side panels have been bonded in order to secure the integrity of the H-channel
joints. Furthermore, the side panels of the trailer have been segmented to allow structural
flexibility and effectively absorb typical static, thermal, and dynamic forces associated
with typical loading scenarios. All the structural joints in the trailer will be secured by
adhesive bonding methods. The bonding process requires sanding or roughing of areas in
contact, following by thorough cleaning of the bonded areas. Araldite 2021 toughened
methacrylate adhesive was used to bond the fiberglass to metal components. The main
advantage in choosing Araldite 2021 is that it provides a bond that fills voids and gaps
between the mating parts and it also exhibits elastic characteristics in its cured state. The
bonding between fiberglass angles and fiberglass panels was done with epoxy for secure
adhesion.
3.2.2 Model Trailer
Figure 3.8 shows a section the trailer model and the different types of joints,
channels, and angles that comprise the trailer model as described previously. Figure 3.8
shows the model in early stages of development and only displays the front section of the
trailer. Bonding and joining of the structure was the final phase in the manufacturing
process. Once completed, the three sections of the trailer were complete and shown
figure 3.9 below.

43
Figure 3.9: Unassembled sections of the model trailer.
Figure 3.8: Scaled prototype of the replica 1 to 4 trailer model emphasizing the locations and types of joints.

44
3.2.3 Modular Design
The concept of creating a modular trailer design, in which sections of the trailer
could be removed if unused, must be facilitated with adequate mechanical joining
structures. The main area for connecting the middle segments and the front and rear
sections of the trailer are the flooring cross beams. The cross beams in each segment are
joined by “beam connectors” which are shown in figure 3.10. The connectors join the
segments by securing the flanges of three consecutive I-beams to a reverse U-channel.
A method to assist the beam connectors in joining the trailer segments is shown in
Figure 3.11. This concept involves an extension of the interior angles and the top edge
rails of the double corner joint. The angles and edge rails of one segment will extend
onto the flooring and side panels of the adjacent segment providing added stability and
rigidity to the modular design.
Figure 3.10: Method of joining the segments of the van trailer by connecting the I-beam cross members

45
Figure 3.11: A method to assist the joining of segments for the mudular application of the van trailer design.
3.3 Theoretical Analysis and Performance Comparisons The main focus for implementation of new design concepts is to reduce the
weight of a standard trailer while upholding or increasing the stiffness and structural
rigidity. The area which greatly contributes to the weight of the existing trailer is the
floor platform. Several alternative lightweight designs were analyzed in a comparative
study as possible sources to replace the structural floor and conclude with high strength
and weight saving characteristics.
The design criteria which had to be met by each design concept were:
• The factor of safety must be greater than 2.0.
• The mid-span deflection of a cross beam in an alternative floor design must not
exceed that of a similar steel beam used in the existing floor structure.
3.3.1 Design I The first alternative floor design consists of I-beam cross members with “bearing
bars” in the transverse direction and connected through the I-beam web. The specific
minimum dimensions needed to meet the design requirements stated above are listed for

46
various alternative materials in Table 3.1. The tables for each design in this section
display the edge deflection, factors of safety for the required dimensions, and the weight
of the unit floor area for each alternative material option.
Figure 3.12: Alternative floor design I consisting of I-beam cross members and “bearing bars”.
The results displayed in Table 3.1 show that using an alternative material for the
steel I-beams of a common van trailer floor can induce as much as a 69% weight
reduction. The carbon-carbon and the magnesium alloy respectively are 1.98 and 1.44
lb/ft2; this value correlates to a 69% and 78% weight reduction. However, the standard
alloy I-beam dimensions for the magnesium alternative material does not meet the factor
of safety requirement which is exceeding 2.0.
The weight reductions displayed in Table 3.1 are critical parameters for
implementing alternative materials as a weight reducing concept. Following research
will also continue analyzing alternative materials along with design changes to increase
structural performance as well.
Table 3.1 – Design I Analysis for Alternative Materials
d bf tw tfin in in in in3 lb/ft3 ksi ksi ksi in lb/ft2
STEEL 4 2.5 0.16 0.25 2.61 490 30500 80 18.23 4.39 0.57 6.47Aluminum 8 2.25 0.13 0.19 4.62 169 10300 35 10.30 3.40 0.47 6.50Glass-Epoxy 8 4 0.38 0.38 13.9 104 2800 30 3.42 8.77 0.58 4.61Carbon-Carbon 6 3 0.25 0.25 5.32 98.6 20595 155 8.94 17.34 0.28 1.98Nitronic 19D Stainless St. 4 2.5 0.16 0.25 2.61 482 30000 103.6 18.23 5.68 0.58 6.38Nitronic 30 Stainless Steel 4 2.5 0.16 0.25 2.61 491 28000 160 18.23 8.78 0.60 6.50Nitronic 60 Stainless Steel 4 2.5 0.16 0.25 2.61 490 26000 117 18.23 6.42 0.61 6.30Magnesium 4 2.5 0.16 0.25 2.61 490 6380 26.8 18.23 1.47 0.87 1.44
Alternative Material Ultimate Strength
Flexural Stress
Factor of Safety
Unit Weight
Young's Modulus
Mid Span Deflection
SIZESection Weight

47
3.3.2 Design II The next alternative design consists of a sandwich composite with top and bottom
fiberglass plates and core material comprised of C-channel cross beams as illustrated in
Figure 3.13. As stated earlier in this work, sandwich composite construction is an
effective means for developing a lightweight design and to maintain or increase bending
resistance. Composite sandwich technology is used in various design concepts
throughout the remaining part of this work as the method to create the desired weight
savings without compensating with a loss in structural rigidity.
Figure 3.13: Alternative floor design II consisting of top platform supported by C-channels.
Table 3.2 lists the resulting characteristics of the C-channel beams (Design II) for
each alternative material selection. Again, the carbon-carbon and magnesium selections
are clearly the best choice for weight saving capabilities. In this design, carbon-carbon
outputs a 67% weight reduction compared to the current steel design and magnesium
alloy creates a 61% reduction. The magnesium alloy now exceeds the required minimum
factor of safety of 2.0 and can be considered a possible alternative in Design II.

48
Table 3.2 - Design II Analysis for Alternative Materials
d bf tw tfin in in in in3 Lb/ft3 ksi ksi ksi in Lb/ft2
STEEL 5 1.70 0.19 0.32 3.00 490 30500 80 26.31 3.04 0.40 6.70Aluminum 6 3.30 0.20 0.35 7.01 169 10300 35 6.79 5.16 0.41 4.03Glass-Epoxy 10 2.80 0.50 0.50 18.49 104 2800 30 2.57 11.66 0.35 5.50Carbon-Carbon 6 1.70 0.37 0.37 4.85 98.6 20595 155 9.81 15.80 0.30 2.21Nitronic 19D Stainless St. 5 1.70 0.19 0.32 3.00 482 30000 103.6 15.86 6.53 0.40 6.59Nitronic 30 Stainless St. 5 1.70 0.19 0.32 3.00 491 28000 160 15.86 10.09 0.42 6.72Nitronic 60 Stainless St. 5 1.70 0.19 0.32 3.00 490 26000 117 15.86 7.38 0.43 6.51Magnesium 5.98 3.27 0.21 0.35 7.01 490 6380 26.8 11.26 2.38 0.66 2.59
WeightUnit
WeightUltimate Strength
Flexural Stress
Factor of Saftey
Mid Span DeflectioAlternative Material
SIZE Young's ModulusSection
3.3.3 Design III The third design is a sandwich panel composed of ribbed FRP faceplates and a
core material of hollow cross tubes as illustrated in Figure 3.14. Table 3.3 lists the
minimum dimensions of the hollow cross beams to meet the required standards stated
above for each material analyzed.
Figure 3.14: Alternative flooring design III consisting of a FRP top and bottom face plate and hollow cross tubes comprising the core structure.
The results of Table 3.3 display the highest weight reduction in the carbon-carbon
and magnesium material alternatives. However, the magnesium alloy contributes larger
deflection values and the lowest factor of safety value. The fiberglass and carbon fiber
contributions are appreciated in the weight reduction area but the required dimensions to
secure a reasonable factor of safety need to be adjusted. Specifically in this design, the
carbon-carbon configuration attains a 15.80 factor of safety. A large factor of safety
value gives insight that the design is over engineered and changes in material and design
parameters should be inspected with cost as an optimizing factor.

49
Table 3.3 - Design III Analysis for Alternative Materials
d bf twin in in in3 Lb/ft3 ksi ksi ksi in. Lb/ft2
STEEL 4.0 3.0 0.313 3.72 490 30500 80 12.79 6.26 0.08 12.70Aluminum 6.0 3.0 0.313 7.03 169 10300 35 6.77 5.17 0.08 5.83Glass-Epoxy 9.0 6.0 0.311 7.66 104 2800 30 6.21 4.83 0.16 6.99Carbon-Carbon 6.5 2.0 0.236 4.85 98.6 20595 155 9.81 15.80 0.06 6.00Nitronic 19D Stainless St. 4.0 3.0 0.313 3.72 482 30000 103.6 12.79 8.10 0.08 12.49Nitronic 30 Stainless St. 4.0 3.0 0.313 3.72 491 28000 160 12.79 12.51 0.09 12.72Nitronic 60 Stainless St. 4.0 3.0 0.313 3.72 490 26000 117 12.79 9.15 0.08 12.32Magnesium 6.0 3.0 0.313 3.72 490 6380 26.8 12.79 2.10 0.36 3.75
Alternative MaterialSIZE Young's
ModulusSectionWeight
Unit Weight
Ultimate Strength
Flexural Stress
Factor of Saftey
Edge Deflection
3.3.4 Summary After initial theoretical analysis, design III will be utilized as the specific design
structure with the highest potential as the best possible alternative for a van trailer floor.
This conclusion was based on the multiple facets of design III optimization which include
but is not limited to, tailoring and optimizing the faceplates structure, core structure,
material selection and dimensioning. Also, a crucial topic for this work and for design III
is the joining procedure between the faceplate FRP structure and an alloy core material.
This design provided the most encouragement for a successful method to combine
sandwich structure technology comprised of FRP faceplates and metallic core structures
in a heavy vehicle flooring system with beneficial weight saving capabilities.
The solution and study of this field is detailed later in the work and reverts back to
the geometrical matching between joining parts previously discussed. The next sections
show the study of optimizing the structure of design III to create the best possible
solution for a lightweight and effective flooring platform.

50
Chapter 4 – Analysis of Various Cross Sections for the Core Structure of Extruded Support Members
4.1 Introduction Various preliminary design concepts of the core material for the previously
discussed Design III, or for the best option for trailer floor platform, were compared on
the basis of a single section of the core structure. Six different designs were analyzed by
weight, maximum displacement and maximum stress under bending and torsion loads.
Each concept was kept uniform by length, thickness, loading and boundary conditions.
Finite element modeling of the alternative structures was performed in both ANSYS and
ADINA finite element programs.
4.2 Cross Sections
Figure 4.1: The six different cross sections of the core structure.
The cross sections being compared are shown in Figure 4.1. The cross sections
represent a single part of the core structure of the flooring sandwich plate. Any of these
sections will be repeated to form the core structure for the entire flooring platform.

51
Figure 4.2 displays a possible flooring arrangement using, for example, the X2 section
from Figure 4.1.
Figure 4.2: Representation of a sandwich composite structure using the X2 core cross section.
Figure 4.2 shows how a single cross section will be repeated to build the core
structure of the entire flooring. Therefore, to determine which arrangement is most
beneficial, a finite element analysis and a weight analysis were performed. For accuracy
and consistency, all loading, thicknesses, elements, element sizes, and boundary
conditions were kept constant during the analysis of the different sections.
4.3 Bending Analysis The parameters for the finite element bending analysis are given in this section.
Referencing Figure 4.3, the load direction is in the negative y direction and has a value of
10 psi. This load is distributed over shell elements with dimensions of 0.5 in., 0.5 in.,
0.02 in. in length, width, and thickness, respectively. The material properties correspond
to standard aluminum with a Young’s modulus value of 26x106 psi and a Poisson’s ratio
of 0.33.

52
Figure 4.3: Loading scenario, dimensions, and boundary conditions for bending analysis.
Material: Aluminum Elastic Modulus: 26x106 psi Poisson’s ratio: 0.33 Loading: 10 psi in the negative y direction Elements: Shell Element size: 0.5 in. Element thickness: 0.02 in. Section Dimensions: 4 x 4 x 12 x 0.02 in.
4.3.1 Bending Results The ANSYS generated results are displayed in the following figures. The results
display plots of maximum displacement distributions from an applied load of 10 psi. The
corresponding numerical values of maximum displacements are summarized in Table 4.1.
Figure 4.4: Tube displacement using ANSYS

53
Figure 4. 5: Slant displacement using ANSYS
Figure 4. 6: X1 displacement using ANSYS

54
Figure 4. 7: X2 displacement using ANSYS
Figure 4. 8: Box displacement using ANSYS

55
Figure 4. 9: Box2 displacement using ANSYS
Table 4.1 – ANSYS Bending Results
ANSYS Bending Results Cross Section Maximum Displacement (in.)
Tube 0.997103 Slant 0.854074 X1 0.648361 X2 0.671524
Box 1 0.041566 Box 2 0.045573
The ADINA generated results are displayed in the following figures. The same
loading and boundary conditions were applied to all the cross sections in both ADINA
and ANSYS models.

56
Figure 4.10: Tube displacement using ADINA
Figure 4.11: Slant displacement using ADINA
Figure 4.12: X1 displacement using ADINA

57
Figure 4.13: X2 displacement using ADINA
Figure 4.14: Box displacement using ADINA
Figure 4.15: Box2 displacement using ADINA

58
Table 4.2 – ADINA Bending Results
ADINA Bending Results Cross Section Maximum Displacement (in.)
Tube 0.9744 Slant 0.9304 X1 0.6199 X2 0.6463 Box 0.0355
Box 2 0.0395
4.3.2 Discussion of Finite Element Bending Results The most effective cross section in regards to bending stiffness is the Box section.
This section had a maximum displacement of 0.0355 inches. The least effective cross
section for bending resistance is the Tube section. This section experienced a maximum
displacement of 0.9744 inches. Comparing the two sections indicates that the Box
section is stiffer to bending because of its middle support section, and it reacts with
properties comparable to an I-beam. The Box section has a slight advantage over the Box
2 section because of the middle cross segment which restricts a large curvature of the
sidewalls in bending. It is important to note that the maximum displacements all occur at
the top, center-edge location farthest from the fixed support end.
The Tube section is a commonly extruded section and is easily available in
commercial sales. The engineering aspect in question is if using an uncommon section,
which requires special production costs, but has higher bending stiffness is worth the cost
compared to the tube section’s commercial availability and cost benefit? A valid option is
to experiment and modify the tube section extrusion by compensating for the higher
displacement values with face plates that will create a sandwich panel with bending
stiffness capabilities.
4.4 Torsion Analysis A torsional load was applied to the cross sections from Figure 4.1 and the results
were compared by the maximum shear stress reached in each section. Similar to the

59
procedure followed in the bending analysis, all the cross sections were modeled in
ANSYS and ADINA with all loading, geometry, and boundary conditions kept constant
throughout the analysis. The shell element divisions used in both the bending and
torsional analyses were sized at uniform dimensions of 0.5 inches. Uniform element
divisions were important in applying a uniform pressure for bending and an equal
torsional load distribution from element to element.
Figure 4.16: Loading scenario, dimensions and boundary conditions for torsional analysis.
Material: Aluminum Elastic Modulus: 26x106 psi Poisson’s ratio: 0.33 Loading: 50 lbs on each node Elements: Shell Element size: 0.5 in. Element thickness: 0.02 in. Section Dimensions: 4 x 4 x 12 x 0.02 in.
4.4.1 Torsion Results The ANSYS generated results are displayed in the following figures. The results
display plots of the maximum stress distributions from an applied load of 50 lbs.

60
Figure 4.17: Tube torsion results using ANSYS
Figure 4.18: Slant torsion results using ANSYS

61
Figure 4.19: X1 torsion results using ANSYS
Figure 4.20: X2 torsion results using ANSYS

62
Figure 4.21: Box torsion results using ANSYS
Figure 4.22: Box 2 torsion results using ANSYS
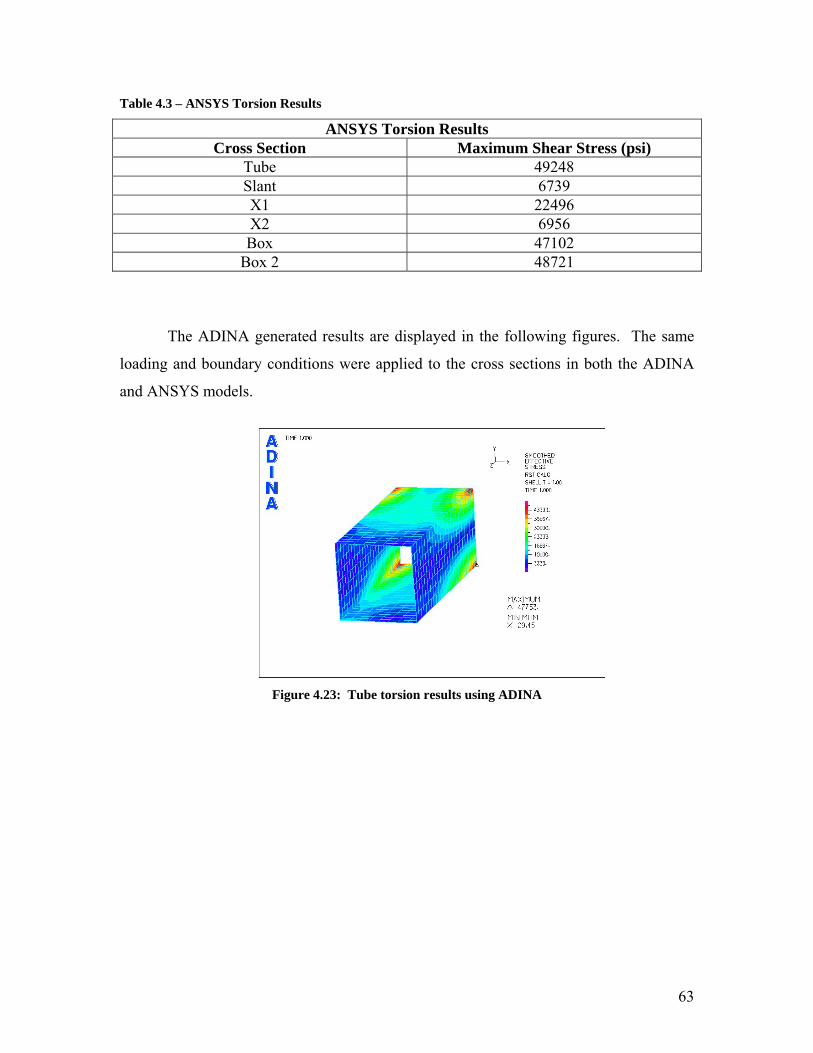
63
Table 4.3 – ANSYS Torsion Results
ANSYS Torsion Results Cross Section Maximum Shear Stress (psi)
Tube 49248 Slant 6739 X1 22496 X2 6956 Box 47102
Box 2 48721
The ADINA generated results are displayed in the following figures. The same
loading and boundary conditions were applied to the cross sections in both the ADINA
and ANSYS models.
Figure 4.23: Tube torsion results using ADINA

64
Figure 4.24: Slant torsion results using ADINA
Figure 4.25: X1 torsion results using ADINA

65
Figure 4.26: X2 torsion results using ADINA
Figure 4.27: Box 1 torsion results using ADINA

66
Figure 4.28: Box 2 torsion results using ADINA
Table 4.4 – ADINA Torsion Results
ADINA Torsion Results Cross Section Maximum Shear Stress (psi)
Tube 47753 Slant 6265 X1 28487 X2 6309 Box 44306
Box 2 47198
Comparison of Bending and Torsion Results Table 4.5 – Comparison of ANSYS and ADINA Bending and Torsion Results
Bending ADINA
Torsion ADINA
Bending ANSYS
Torsion ANSYS
Cross Section Max Deflection Max Stress
Max Deflection Max Stress
Tube 0.9744 47753 0.997103 49248 Slant 0.9304 6265 0.854074 6739 X1 0.6199 28487 0.648361 22496 X2 0.6463 6309 0.671524 6956
Box1 0.0355 44306 0.041566 47102 Box2 0.0395 47198 0.045573 48721

67
Maximum Deflection
0
0.2
0.4
0.6
0.8
1
1.2
Tube Slant X1 X2 Box1 Box2
Ben
ding
Def
lect
ion
(in)
Figure 4.29: Plot of maximum bending deflection for tube cross members.
Torsion Stress
0
10000
20000
30000
40000
50000
60000
Tube Slant X1 X2 Box1 Box2
Max
imum
Tor
sion
Stre
ss (p
si)
Figure 4.30: Plot of maximum torsional stress within the tube cross section members.

68
4.4.2 Discussion of Finite Element Torsion Results The results of the torsional loading in the cross section members show that the
Slant and the X2 configurations are the most effective designs for minimum stress values,
while the Box1, Box2, and Tube sections exhibit the highest stress levels. The diagonal
supports that connect to the inside corners of the Slant, X1, and X2 extrusions are
effective for resisting the applied torsion.
4.4.3 Weight Comparison
The structural weights of the different cross sections considered in this thesis are
compared on the basis of one-square foot section which would be implemented into the
trailer flooring. The existing trailer floor weight has also been determined as a baseline
for assessing the weight savings achievable by using the sandwich composite design with
the various cross sections described above as core materials.
The existing trailer floor is composed of 54 cross member (SI Beams) which are
spaced at 1 ft (0.305m), and the length of each is 8ft (2.44m). The cross members
contribute a total weight of 4,104 lbs (1861.5 kg). Adding to the cross member weight is
the oak floor which contributes 5,227 lbs (2370.9 kg) and covers 432 ft2.
Cross Beam Weight:
2
410454 4104 7654
769.5 9.5 1 9.5
8
lbs lbscross beams lbsbeams beam
lbslb lb beam lbbeam
ft ft ft ft ftbeam
= =
= × =
Oak Floor Weight:
2
2 2
4645 54 8 4325227 12.1432
oak floor lbs floor area ft ft ftlbs lbsft ft
= = × =
=
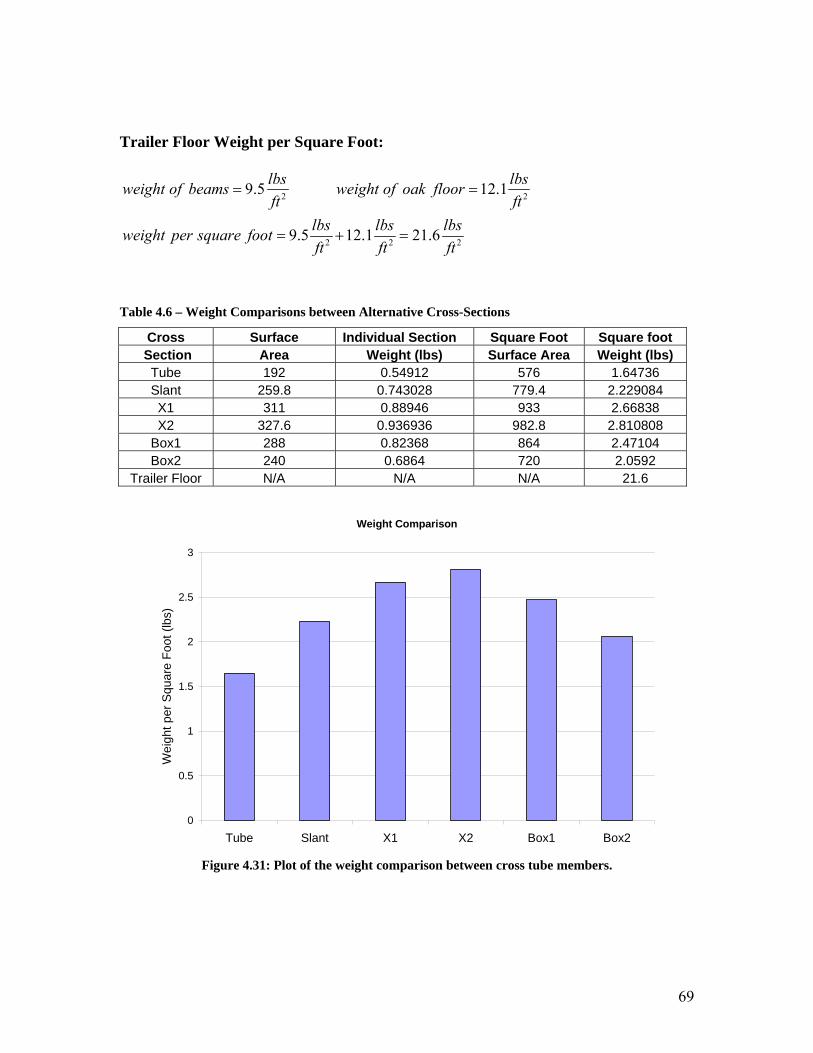
69
Trailer Floor Weight per Square Foot:
2 2
2 2 2
9.5 12.1
9.5 12.1 21.6
lbs lbsweight of beams weight of oak floorft ft
lbs lbs lbsweight per square footft ft ft
= =
= + =
Table 4.6 – Weight Comparisons between Alternative Cross-Sections
Cross Surface Individual Section Square Foot Square foot Section Area Weight (lbs) Surface Area Weight (lbs)
Tube 192 0.54912 576 1.64736 Slant 259.8 0.743028 779.4 2.229084 X1 311 0.88946 933 2.66838 X2 327.6 0.936936 982.8 2.810808
Box1 288 0.82368 864 2.47104 Box2 240 0.6864 720 2.0592
Trailer Floor N/A N/A N/A 21.6
Weight Comparison
0
0.5
1
1.5
2
2.5
3
Tube Slant X1 X2 Box1 Box2
Wei
ght p
er S
quar
e Fo
ot (l
bs)
Figure 4.31: Plot of the weight comparison between cross tube members.

70
4.5 Panels with Tube Section Cross Members The prior analysis of various cross section aluminum extrusions as a load bearing
component for heavy vehicle flooring, indicates that the concept of using this structural
design is promising, which initiated further study. To pursue such investigation, different
panel configurations were manufactured for use in experimental testing and finite
element modeling.
The objective of this phase of research is to find a design that incorporates the
bending resistance and weight saving capabilities of the extruded sections and also
produces a lightweight structural platform. The initial panel design consisted of a
repeated pattern of the different cross sections. However, to maximize weight savings
and still maintain loading resistance, different configurations of the cross members were
studied. The initial designs were the repeated cross section panel and a “grated” panel, as
shown in Figure 4.32 (a) and (b), respectively.
Figure 4.32: Schematic of the tubeplate (a) and the tubegrate (b) panel designs.
4.5.1 Tubeplate The fabrication process differed for each panel. The tubeplate design in Figure
4.32 (a), was manufactured by cutting 12 inch aluminum tube sections to compose a
square foot panel design. The cut edges were sanded to eliminate any burs, allowing the
tube edges to be butted closely together. Once the tubes were placed into position, the
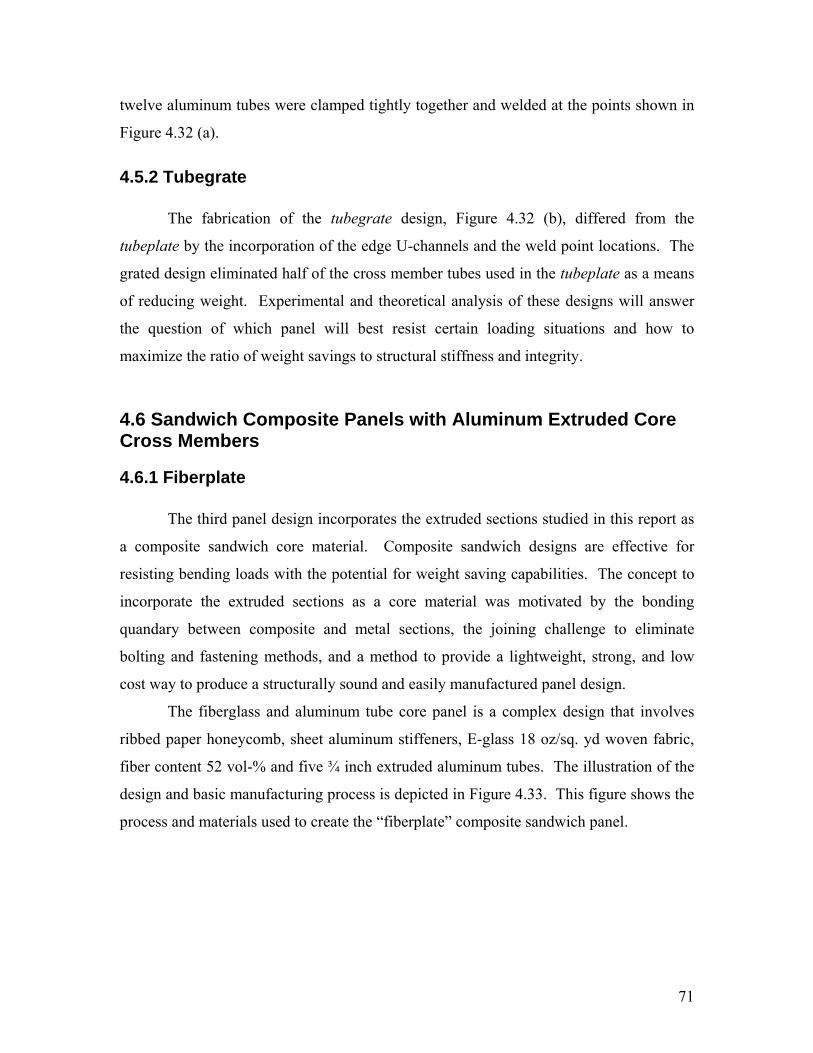
71
twelve aluminum tubes were clamped tightly together and welded at the points shown in
Figure 4.32 (a).
4.5.2 Tubegrate The fabrication of the tubegrate design, Figure 4.32 (b), differed from the
tubeplate by the incorporation of the edge U-channels and the weld point locations. The
grated design eliminated half of the cross member tubes used in the tubeplate as a means
of reducing weight. Experimental and theoretical analysis of these designs will answer
the question of which panel will best resist certain loading situations and how to
maximize the ratio of weight savings to structural stiffness and integrity.
4.6 Sandwich Composite Panels with Aluminum Extruded Core Cross Members
4.6.1 Fiberplate The third panel design incorporates the extruded sections studied in this report as
a composite sandwich core material. Composite sandwich designs are effective for
resisting bending loads with the potential for weight saving capabilities. The concept to
incorporate the extruded sections as a core material was motivated by the bonding
quandary between composite and metal sections, the joining challenge to eliminate
bolting and fastening methods, and a method to provide a lightweight, strong, and low
cost way to produce a structurally sound and easily manufactured panel design.
The fiberglass and aluminum tube core panel is a complex design that involves
ribbed paper honeycomb, sheet aluminum stiffeners, E-glass 18 oz/sq. yd woven fabric,
fiber content 52 vol-% and five ¾ inch extruded aluminum tubes. The illustration of the
design and basic manufacturing process is depicted in Figure 4.33. This figure shows the
process and materials used to create the “fiberplate” composite sandwich panel.

72
Figure 4.33: Manufacturing process of the fiberplate design. This design incorporates ribbed fiberglass face plates and extruded aluminum tubes as a core material.
The geometry of the ribbed top and bottom plates is an effective feature to
incorporate the extruded aluminum tubes in the core of the panel. The interface between
the epoxy core and the aluminum tubes does not provide a strong bond. Therefore, the
paper honeycomb ribs between the tubes will enclose and secure the positioning of the
core cross tube members. The bond or connection between the aluminum tubes and the
composite top plate is important for the overall panel bending resistance. The bonding
methodology researched in this work and used in the fabrication of the trailer model will
be applied to create an effective bond in this area.

73
Figure 4.34: The fiberplate design with five aluminum tube cross members, fiberglass top and bottom face plates, and paper honeycomb rib stiffeners.
The finished fiberplate panel is shown in Figure 4.34. This picture illustrates the
five aluminum tube cross members and the fiberglass top and bottom plates containing
the paper rib stiffeners and the aluminum strips. The method of manufacturing required
that the top and bottom plate be made separately for two reasons. First, the vacuum
bagging technique would not have applied pressure on the on the top surface of the paper
rib stiffeners if the plate was completely assembled and then pressurized. Second, the top
and bottom edges of the top plate would have not cured in a flat position but would take
on a curved shape from the pressurization.
4.6.2 Carbonplate The carbonplate was manufactured in the same manner as the fiberplate except
using carbon fiber sheets instead of fiberglass. Also, the carbonplate layup process was
done in one single step instead of manufacturing the top and bottom face plates

74
separately. A single phase manufacturing process was intensive and critical for proper
alignment of the cross members in relation to the top and bottom face plates. Reinforced
foam inserts were placed in the spacing between the core cross members. Pressure was
provided from the foam inserts onto the paper honeycomb ribbed sections when the entire
panel was vacuum bagged. A release agent was placed on the surfaces between the core
and face plates and also between the foam inserts and face plates so the parts could
removed after the curing procedure.
The carbon fiber alternative to fiberglass is effective for adding strength and
stiffness to the sandwich composite along with weight saving capabilities. The fatigue
life of the carbon fiber is superior to that of the fiberglass and is effective for cyclic
loading that may occur in structural use of the sandwich composite.
4.7 Finite Element Modeling (ADINA) After manufacturing the panel designs, finite element modeling was done to
theoretically determine the performance of the panel structures under simulated loading.
The procedure for the modeling of the panels follows the same comparative study as
previously performed for the six extruded cross sections. The loading, boundary
conditions, and elements used were held constant throughout the study. This enabled the
theoretical comparison to be consistent throughout the modeling process and to avoid
inaccuracies that could possibly be cause by the differences between the modeled panels.
ADINA version 8.2 finite element software was used for the numerical
comparison between alternate panel designs.
4.7.1 Tubeplate Material: 12, 1 inch aluminum tube extruded cross members Young’s Modulus = 10 Msi Poisson’s Ratio = 0.33 Tube Thickness: 2/32 inch Panel Dimensions: 1 ft x 1 ft x 1 inch Elements: Shell Boundary Conditions: All DOF fixed on plate edge perpendicular to cross members. Load: 2 inch x 3 inch pressurized load of 100 psi

75
The geometry of the tubeplate was created using the Pro Engineer CAD software.
The process in Pro Engineer was to create the tube cross section and extrude it to the
length of the plate. After one tube was created, the tube was patterned and spaced 0.001
inches apart to account for the natural gap between the adjacent surfaces. The pattern
resulted in a total of twelve, 1 inch tubes butted together which yielded a panel of 12
inches by 12 inches or 1 square foot.
The Pro Engineer geometry was imported into ADINA finite element software.
The material properties and dimensions for the tubeplate were defined in ADINA. All
surfaces in the geometry of the plate were divided into segments to create quadrilateral
elements of size 0.2” upon meshing. To simulate the weld points between tubes, rigid
links between adjacent nodes of butted tubes were connected. The rigid link option in
ADINA defines the motion/displacement of the selected nodes to be coupled together.
The geometry, mesh, and defining parameters of the model can be seen in Figure 4.35.
Figure 4.35: Tubeplate geometry, mesh, boundary conditions and applied load.
4.7.2 Tubegrate Material: 6, 1 inch aluminum tube extruded cross members 2, aluminum U-channels Young’s Modulus = 10 Msi Poisson’s Ratio = 0.33 Tube Thickness: 2/32 inch Panel Dimensions: 1 ft x 1 ft x 1 inch Elements: Shell

76
Boundary Conditions: All DOF fixed on U-channel edge perpendicular to cross members. Load: Modeling of the tubegrate was similar to the tubeplate model but differed by
incorporation of edge U-channels and spacing between tube cross members. The method
to model the interface between the U-channels and cross members was determined by the
manufacturing process. During manufacturing, the connection of the tubes into the U-
channel was made by an interference fit. This type of connection increased the stability
of the overall panel and reduces the emphasis of the weld connection between the cross
members and U-channel. To simulate this connection in ADINA the elements on the U-
channel and cross member interface shared common nodes and were defined in thickness
by shell elements. The tubegrate model created for theoretical analysis is depicted in
Figure 4.36.
Figure 4.36: Tubegrate geometry, mesh, boundary conditions, and applied load.
4.7.3 Fiberplate Material: 5, ¾ inch aluminum tube cross members 10 paper rib strips 6 aluminum sheet metal strips 12 layers of woven E-glass and epoxy fiberglass composite Aluminum Tubes Paper Ribs Tube Thickness: 2/32 inch Thickness: 5/32 inch

77
Dimensions: 1 ft x ¾ inch x ¾ inch Dimensions: 1 ft x 1¾ inch x 5/32 Young’s Modulus = 10 Msi Young’s Modulus = 652 ksi Poisson’s Ratio = 0.33 Poisson’s Ratio = 0.3 Elements: Shell Elements: Shell Aluminum Sheet Metal Strips Thickness: 0.02 inch Dimensions: 1 ft x 2 inch x 0.02 inch Young’s Modulus = 10 Msi Poisson’s Ratio = 0.33 Elements: Shell Fiberglass Glass/Epoxy Fabric F1t = 53 ksi Layer Thickness: 0.025 inch F1c = 79.6 ksi Vf = 0.50 F2t = 53.2 ksi rho = 0.06 lb/in3 F2c = 79.6 ksi E11 = 4.3 Msi E22 = 4.31 Msi G12 = 0.77 Msi ν12 = 0.17 Elements: Shell with layer definition
Figure 4.37: Fiberplate design with cross sectional view.
The fiberplate design required a detailed finite element modeling process. The
panel consists of four different materials and various sections which are separated by the
number and types of these materials used. Using the schematic shown in Figure 4.38, the
details of the panel are more visually defined.

78
Figure 4.38: Illustration of various surface configurations of the fiberplate design.
Figure 4.38 displays the complexity of the fiberplate panel. The schematic is a
representation of one of the two face sheets used in the sandwich composite panel. The
various surface configurations require a detailed finite element modeling process. There
are four different subdivisions of material configurations, 8 layers, 7 layers (2) and 6
layers. Because of the many divisions of surface configurations, special consideration
had to be taken during the finite element modeling process. It was important to group all
the different layer surface configurations. This was done by creating all the 8 layer
surfaces, next the 7 (two different types) and then the 6 layer. Having all the layers
defined sequentially allowed for manipulation of elements, material properties and
meshing purposes.
Modeling of this particular design followed the steps listed below:
• Created points of surface corners for both the top and bottom face sheet by
specifying x, y, and z coordinates. • Created surfaces for the 8 layer group (36 total) by referencing the corner points
previously defined. • Defined the remaining group surfaces and kept the order of the different groups in
sequence.

79
8 layer – Surfaces 1 to 36 7 layer – Surfaces 37 to 60 7 layer – Surfaces 61 to 80 6 layer – Surface 81 to 110
• Created the individual surfaces of the aluminum tubes by the points previously defined. Four surfaces were created for each tube.
Aluminum Tubes – Surfaces 111 to 130 • Divided all the surfaces by 0.5 inches. This defined the subdivisions for creating
0.5 inch quadrilateral shell elements. • Defined material properties, element type, and number of layers to be defined in
the different element groups. • Meshed the model geometry surface by surface and noted the division of elements
for each layer type notified in Figure 4.38. • Defined the elements by thickness, material properties, ply orientation, and
composite properties and assigned the parameters to the corresponding layer configuration.
• Contact surfaces between the core material (aluminum tube sections) and the face sheets were defined.
• All loading scenarios and boundary conditions were applied.
The intricacy and the variation of thickness within the fiberplate are shown in detail
in Figure 4.38. Figure 4.39 displays graphically the different thickness regions created by
various layup sections of the panel.
Figure 4.39: Contour plot showing the thickness of each surface segment for the fiberplate design.

80
4.7.4 Carbonplate Material: 5, ¾ inch aluminum tube cross members 10 paper rib strips 6 aluminum sheet metal strips 12 layers of 2x2 twill weave graphite fabric and epoxy carbon fiber composite Aluminum Tubes Paper Ribs Tube Thickness: 2/32 inch Thickness: 5/32 inch Dimensions: 1 ft x ¾ inch x ¾ inch Dimensions: 1 ft x 1¾ inch x 5/32 Young’s Modulus = 10 Msi Young’s Modulus = 652 ksi Poisson’s Ratio = 0.33 Poisson’s Ratio = 0.3 Elements: Shell Elements: Shell Aluminum Sheet Metal Strips Thickness: 0.02 inch Dimensions: 1 ft x 2 inch x 0.02 inch Young’s Modulus = 10 Msi Poisson’s Ratio = 0.33 Elements: Shell Carbon / Graphite Fabric Glass/Epoxy Fabric F1t = 80 ksi Layer Thickness: 0.012 inch F1c = 113.0 ksi Vf = 0.50 F2t = 82.5 ksi rho = 0.052 lb/in3 F2c = 98.6 ksi E11 = 7.9 Msi G12 = 0.59 Msi E22 = 7.83 Msi ν12 = 0.065 Modeling of the carbonplate was performed in the same manner as the fiberplate.
The properties of the material were changed to those listed previously for the 2x2 twill
weave graphite fabric sheets. The steps taken in the finite element process are listed in
the previous fiberplate section and should be referenced for clarity.

81
Chapter 5 - Instrumentation of Sandwich Panels for Experimental Testing
5.1 Introduction As a method to understand the actual performance of the manufactured
cross member panels and sandwich composite panels, experimental analysis was
performed. The experimental results provide a method to compare the theoretical finite
element models to the actual tested results. There are variables and minor differences in
the relation from the finite element models to the actual manufactured panels, but the
proper instrumentation is a focal point for creating a reliable comparison between the
theoretical and experimental work.
5.1.1 Tubegrate The four panel designs were instrumented with strain gages. The strain gage
types were uniaxial and rosette configurations. The uniaxial strain gages were placed on
the cross members to attain the maximum bending moment from the midspan deflection
of the cross member beams. The strain gage rosette arrangements were placed to
determine the shear strain next to the supports of each panel. Also, a rosette gage was
placed on the panel on the opposing side of the load and centered directly underneath the
load to determine if twisting or torsion effects should be considered.
Figure 5.1: Instrumentation of tubegrate panel with uniaxial and rosette gages.
Uniaxial Strain Gages
Strain Gage Rosettes

82
Figure 5.2: Rosette strain gage placement for the tubegrate panel.
5.1.2 Tubeplate Instrumentation of the tubeplate consisted of placing the uniaxial strain gages on
the top and bottom of the panel next to the load area. These placements are used to
determine the maximum bending moment and for comparison to the correlating finite
element locations. The panel and the strain gage placements are depicted in Figure 5.3.
The geometry of the panels made instrumentation difficult in some situations. For
the tubeplate it was very difficult to mount the strain gage rosettes on the inside of the
cross members as shown in Figure 5.4. The strain gages in this case were not equipped
with lead wires, therefore the lead wires had to be manually connected to the resistor
pads. The location of the gage placement made the process a difficult procedure.

83
Strain Gage Rosettes
Uniaxial Strain Gage
Figure 5.4: The rosette strain gage placement for the tubeplate panel.
Figure 5.3: Instrumentation of tubepanel with uniaxial and rosette strain gages.

84
5.1.3 Fiberplate The fiberplate was instrumented in the same manner as the tubegrate with the
addition of a strain gage rosette centered on the underneath of the plate to detect any
torsional or twisting deformation that may occur due to the nature of the fiber reinforced
polymer (FRP) composite top and bottom face plates. As stated earlier in this work,
when a composite laminate is symmetric about its midplane there is no coupling between
the bending and stretching due to loading, or theoretically, the Bij matrix or bending-
stretching coupling matrix is zero. The face plates of the fiberplate are not symmetric
about their midplane, however, when considering the entire sandwich panel, symmetry
about the midplane is upheld. Therefore, placement of the strain gage rosette on the
bottom surface will provide insight to the tendency of twisting within the loaded panel.
Perfect symmetry can not be expected due to many variables in the loading procedure,
support conditions, and the unlikely possibility that complete symmetry in a wet layup
manufacturing process was upheld.
The instrumentation of the fiberplate can be seen in Figure 5.4. The
instrumentation of the fiberplate was simplified by making the top face sheet removable
from the core structure. Otherwise, the instrumentation would have been performed
before construction of the plate and this would have risked inaccurate testing results if
epoxy would have contacted the top surface of the gages and hardened. This procedure
would have been more suitable if pre-impregnated lamina were used instead of the wet
layup process.

85
Uniaxial Strain Gages
Strain Gage Rosettes
5.1.4 Carbonplate The carbonplate instrumentation is the same as the fiberplate. There are two
uniaxial strain gages on the middle cross member of the core structure and are located
directly under the load to determine the maximum bending moment. Two strain gage
rosettes are placed on a ½ inch inset from the edge of the panel to determine the shear
strain. The instrumentation of the carbonplate is shown in Figure 5.6.
The top face plate was removed after manufacturing to apply the strain gages to
the panel. The ability to remove the top plate without damaging the panel was made
possible by waxing the top surface of each core cross member before the layup process to
prevent the epoxy from curing to the aluminum surface. The most accurate method
would have been to place the strain gages before fabricating the plate, however, with a
Figure 5.5: Instrumentation of the fiberplate panel with uniaxial strain gages centered on the middle cross member and strain gage rosettes along the cross member edges.
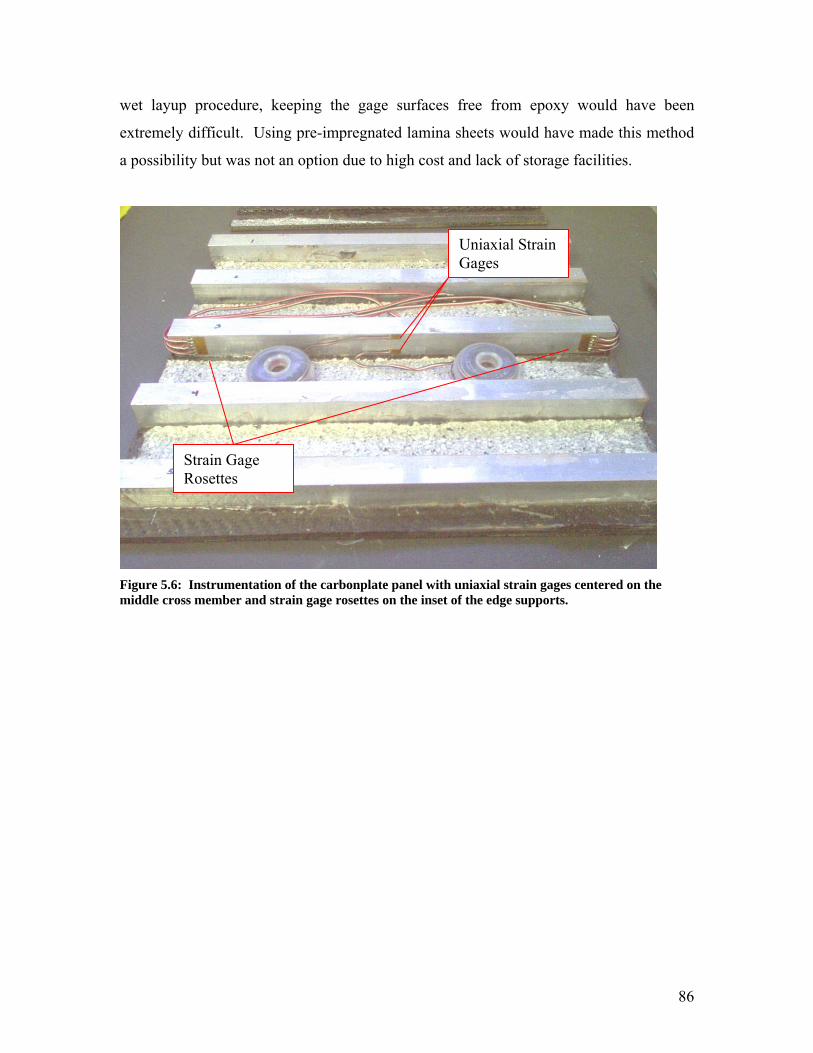
86
wet layup procedure, keeping the gage surfaces free from epoxy would have been
extremely difficult. Using pre-impregnated lamina sheets would have made this method
a possibility but was not an option due to high cost and lack of storage facilities.
Figure 5.6: Instrumentation of the carbonplate panel with uniaxial strain gages centered on the middle cross member and strain gage rosettes on the inset of the edge supports.
Uniaxial Strain Gages
Strain Gage Rosettes

87
Chapter 6 - Experimental Testing of Sandwich Panels
6.1 Introduction Static loading was performed on the four test panels to determine the strains
occurring at critical locations and the overall displacement that each panel will yield
under the testing procedure. Each panel was simply supported along its respective side
edges and loaded in the center of the panel under a 2” by 3” pressure area load. The
maximum load reached was 600 pounds.
6.1.1 Tubeplate All the panels in this study were designed with the intention of creating new,
lightweight and efficient flooring concepts for a trailer haul. The tubeplate was designed
specifically to provide a low-cost, lightweight, and manufacturing efficient alternative to
the existing flooring structure. The aluminum tubes are connected by a row of small
welds that butte the sides of the square cross section tubes together.
The concerns before experimentally testing the tubeplate were if the welds would
effectively sustain the applied load and if the overall panel would carry a concentrated
load as used in the testing procedure.

88
Figure 6.1 (a) – (d): The Load vs. Strain data plots of the tubeplate experimental test and reference figure of strain gage locations.
The strain values shown in Figure 6.1 depict the load bearing reaction of the
tubeplate design. The uniaxial gages in Figure 6.1 (a) show maximum bottom and top
strain values of approximately 1600 and -1600 μStrain. Figure 6.1 (b) and (d) display the
rosette strain values on both the left and right side of the load. The color of the plotted
data lines corresponds to the illustration at the bottom of Figure 6.1 showing the strain
gage placements on the cross member closest to the center of the load. Studying Figure
6.1 (b) and (d) we see that the bottom rosette gage (green) experiences tension throughout
the loading process and reaches a maximum strain value of 477 μStrain and the top
rosette strain gage (red) is in compression and attains a maximum strain value of -208
μStrain.

89
The strain values acquired from the strain gage rosette configurations were used
to calculate the shearing strain at this location. The right and left strain gage rosettes
were placed on the inset of the simply supported edges which is the location where
maximum shear will occur during loading.
To determine the shear strain data, the strain rosettes were analyzed by taking the
horizontal x-axis and the center of the middle (blue) gage to be the reference point from
which to calculate the gage alignment angles. The equations used for the calculation are
shown below.
2 2
2 2
2 2
cos sin sin cos
cos sin sin cos
cos sin sin cos
a x a y a xy a a
b x b y b xy b b
c x c y c xy c c
ε ε θ ε θ γ θ θ
ε ε θ ε θ γ θ θ
ε ε θ ε θ γ θ θ
= + +
= + +
= + +
Where:
The previously defined equations and MATLAB software were used to solve the
system of equations for each set of data points yielding the shearing strain values during
the testing procedure. The γxy shear strain values throughout the loading process are
shown in the following data plot.
θb θa
θc
a b c
a b c
x y xy
rosette strain values from test dataangles from x axis to corresponding rosetteaxis oriented strains
ε ε εθ θ θε ε γ
== −
=

90
Figure 6.2: Shearing strain values for the tubeplate configuration at the inset of the simply supported edges.
Studying Figure 6.2, one can verify that the shearing strain values increase
steadily as the load varies between 0 and 600 (lbs). The maximum strain value at this
location is 271 μStrain.
6.1.2 Tubegrate The tubegrate panel was specifically designed to be a cost and weight effective
variation of the tubeplate panel. The concept for cost and weight reduction is to reduce
the amount of cross members used in the design and add two U-channel edge rails to
secure the cross members by welds at their joints. This reduces the amount of material
used which in turn reduces the cost. Also, the configuration of the tubegrate setup
reduces the number of welds needed from 66 for the tubeplate to 24 for that of the
tubegrate. The structure of spaced aluminum tube cross members are the core structure
of the FRP sandwich panels and are tested without top and bottom faceplates to
understand their effectiveness as a core material.

91
A concern before testing was if the small welds will effectively sustain the
stresses and strains occurring during loading and how reducing the amount of cross
members and adding the edge channel connection will compare to the tubeplate design.
Figure 6.3 (a) – (d): The Load vs. Strain data plots of the tubeplate experimental test and reference figure of strain gage locations.
The uniaxial strain gage results shown in Figure 6.3 (a) have a maximum
compression value (top gage) of -4268 μStrain and tension value (bottom gage) of 5239
μStrain. These values are more than two times the magnitude of the previous uniaxial
results from the tubeplate, see Figure 6.3 (a). The higher strain values are a result of the
load being distributed over fewer cross members which increases the displacement at
these strain gage locations.
An interesting characteristic of the strain gage rosette data in Figure 6.3 (b) and
(d) is variation from tension to compression by the top (red) and bottom (green) rosette

92
gages. The change in strain direction is due to the U-channel edge supports of the
tubegrate. The panel first deforms against the simply supported edges of the test fixture
and once the load reaches a critical point, in this case 221 (lbs) the panel begins to deform
against the edge of the U-channel supports which changes the direction of the strain. The
maximum strain values for the top (red) and bottom (green) gages are 779 and -747
μStrain, respectively.
By the same process of calculating the shear strain for the tubeplate, the shear
strain on the inset of the simply supported cross member in the tubegrate can be
determined. The Load vs. μStrain plot occurring at the most critical location is pictured
in the plot below.
Figure 6.4: Shearing strain values for the tubegrate configuration at the inset of the simply supported U-channel edges.
The shear stain values in Figure 6.4 differ significantly from those of the
tubeplate in Figure 6.2. Figure 6.4 shows the change in direction corresponding to the
plots in Figure 6.3 (b) and (d), previously discussed and a fairly linear relation between
load and strain between load values of 150 (lbs) to 600 (lbs). The maximum shearing

93
strain reached is 587 μStrain. In comparison to the tubeplate, it can be postulated that the
tubegrate configuration attains higher strain values at the location of the strain gages.
The tubegrate design with the edge channel incorporated focuses the shearing strain
directly on the inset of this edge. Concluding that the amount of supporting cross
members in the tubegrate is half that of the tubeplate, reveals that the strain values are
twice as high in magnitude by comparison.
6.1.3 Fiberplate The fiberplate panel incorporates the tubegrate design as the core structure with
the addition of fiberglass top and bottom composite plates. The top and bottom plates
also contain ribbed sections (see Figure 4.34). It is important to note that the size of the
square tube cross sections in the fiberplate is ¾ inches compared to a 1 inch section in the
tubeplate and tubegrate designs. The difference in sizes allowed for a total 1 inch
thickness between all panels, therefore, the overall panel thickness was held constant
throughout the test procedures.

94
Figure 6.5 (a) – (d): The Load vs. Strain data plots of the fiberplate experimental test and reference figure of strain gage locations.
The uniaxial strain gages shown in Figure 6.5 (a) have a maximum compression
value (top gage) of -1003 μStrain and tension value (bottom gage) of 1069 μStrain.
These values are approximately five times lower than the strains at this location in the
tubegrate panel. Which means, the addition of the top and bottom fiberglass composite
plates were effective for increasing the panel stiffness and reducing the strains induced by
midplate bending.
The plots for the bottom rosette, Figure 6.5 (c) are not available because the panel
was tested on the opposite where the bottom strain gage was originally placed. The
rosette on the opposite had to be removed to apply the load to the center of the plate for
the test procedure. This did not hinder the analysis or test procedure.

95
The shear strain plot was determined in the same manner as the previous tests.
The results of the shear strain attained at the inset of the simply supported area can be
seen in the Figure 6.6 below.
Figure 6.6: Shear strain values for the fiberplate configuration at the inset of the simply supported edges.
The maximum shearing strain reached in the fiberplate design is 267 μStrain. In
comparison to the tubegrate, the shear stain values are significantly lower because of the
addition of fiberglass composite top and bottom plates. It should be remembered that the
square section core cross members are ¼ inch smaller in the fiberplate than those in the
tubegrate and tubeplate.
6.1.4 Carbonplate The carbonplate panel has the same geometry and design of the fiberplate but
uses carbon fiber layers instead of fiberglass. Carbon fiber is superior to fiberglass in

96
both weight and material properties; however, testing will determine if the benefits are
greater than the cost difference.
Figure 6.7 (a) - (d): The Load vs. Strain data plots of the carbonplate experimental test and reference figure of strain gage locations.
The uniaxial gages in Figure 6.7 (a) show strain values close to those of the
fiberplate. The carbonplate’s maximum compression value (top gage) is -1025 μStrain
and tension value (bottom gage) is 1056 μStrain. Plot (c) shows that the rosette placed
directly under the load has all three gages in tension. This means there is minimal twist
or curvature occurring during the loading process.
The carbonplate shear stain plot is shown in Figure 6.8 below.

97
Figure 6.8: The shear strain values for the carbonplate panel at the inset of the simply supported edges.
The shear strain in the carbonplate is shown in Figure 6.8. The maximum strain
occurring at the 600 lb load level is 120 μStrain. The maximum shear strain in the
carbonplate is approximately half the maximum shear strain in the fiberplate. From
these results, it can be stated that the carbon fiber panels which form a sandwich structure
with the aluminum tubing extrusion is the most effective design for bending resistance
and reduction of strain on the inset of the simply supported edges.

98
Chapter 7 - Finite Element Modeling
7.1 Introduction Finite element modeling of each panel design was performed to better understand
the performance of each structure. Experimental analysis of the designs most accurately
characterizes the performance of each design, however, experimental testing is timely
and expensive. Creating accurate finite element models will provide insight into the
benefits of a specific design concept or prototype before performing the manufacturing
process, instrumentation, and experimental test procedures.
7.1.1 Tubeplate Material: 12, 1 inch aluminum tube extruded cross members Young’s Modulus = 10 Msi Poisson’s Ratio = 0.33 Tube Thickness: 2/32 inch Panel Dimensions: 1 ft x 1 ft x 1 inch Elements: Shell Boundary Conditions: The degree of freedon (DOF) opposing the direction of the load was constrained on the plate edges perpendicular to the core cross members. Load: 2 inch x 3 inch steel plate with a defined displacement into the panel The geometry of the tubeplate was created using Pro Engineer. The process in
Pro Engineer was to create the tube cross section and extrude it to the length of the plate.
After one tube was created, the tube was patterned and spaced 0.001 inches apart to
account for the natural gap between the adjacent surfaces. The pattern resulted in a total
of twelve, 1 inch tubes butted together which yielded a panel of 12 inches by 12 inches or
1 square foot.
The Pro Engineer geometry was imported into ANSYS finite element software.
The material properties and dimensions for the tubeplate were defined. In order to create
the desired element size, the element size definition was set to 0.2” before meshing.
Simulation of the weld points between tubes was done by “coupling the degrees of
freedom” between adjacent nodes where the butted tubes were connected. The Couple
DOFs command in ANSYS defines the motion/displacement of the selected nodes to be

99
coupled together. The geometry, mesh, and defining parameters of the model can be seen
in Figure 7.1.
Figure 7.1: Tubeplate finite element model displaying the boundary conditions, load, and coupled degrees of freedom as weld connections.
The results from the finite element modeling are used as a comparison to the
displacement and recorded strain gage values from the experimental analysis. The
uniaxial measurements are taken next to the load on the top and bottom of the panel.
This corresponds to the x-direction strain measurement in the finite element model. Also,
the shear strain is analyzed by comparing the nodal and element solutions in the location
of the rosette arrangements.
The uniaxial strain from the tubeplate finite element model is shown in Figures
7.2 and 7.3. Studying the contour plots, the uniaxial strain at the location of the strain
gage placements is averaged over the elements. The averaged value from the finite
element model is -2033 μStrain. The average strain values discussed in this section are
attained by collecting the strain values in the elements where the strain gage has been
placed for experimental analysis and averaging the results. The result for the uniaxial
strain attained experimentally was -1600 μStrain (see Figure 6.1 (a)).

100
Figure 7.2: Strain in the uniaxial direction corresponding to the strain gage placement in the experimental analysis.
Figure 7.3: Magnified view of the uniaxial strain next to the load area. Notice the stress concentration next to the weld point.

101
The shear strain contour plots for the tubeplate are displayed in Figures 7.4 and
7.5. The strain gage rosette arrangements were placed on the inset of the centered cross
member. The calculated value from the experimental analysis is 271 μStrain, Figure 6.2.
The averaged shear strain value in the vicinity of the strain gage rosette is 853 μStrain.
There are two points of interest when studying the shear strain of the tubeplate. First, the
theoretical shear strain value is approximately three times greater than the experimental
value. Second, the adjacent web in the core structure experiences a stress concentration
as seen by the dark blue and light blue areas in Figure 7.5. This area is the on the first
web offset from the center location. These two points of interest can be explained by the
boundary conditions along the edge of the panel. In the theoretical model, the supports
are perfect with each node being fixed in the transverse direction. However, in the
experimental analysis, it is likely to have a distribution along the simple supports which
is not equal throughout the support and edge length of the panel.
Figure 7.4: Shear strain plot of the tubeplate design.

102
Figure 7.5: Magnification of shear strain contour plot at the rosette gage location.
7.1.2 Tubegrate Material: 6, 1 inch aluminum tube extruded cross members 2, aluminum U-channels Young’s Modulus = 10 Msi Poisson’s Ratio = 0.33 Tube Thickness: 1/16 inch Panel Dimensions: 1 ft x 1 ft x 1 inch Elements: Shell Boundary Conditions: Simply supported on U-channel edge perpendicular to cross members. Load: 2 inch x 3 inch steel plate with a defined displacement into the panel creating contact. Modeling of the tubegrate was similar to the tubeplate model but differed by
incorporation of edge U-channels and spacing between tube cross members. The method
to model the interface between the U-channels and cross members was determined by the
manufacturing process. During manufacturing, the connection of the tubes into the U-
channel was made by an interference fit. This type of connection increased the stability
of the overall panel and reduces the emphasis of the weld connection between the cross
members and U-channel. To simulate this connection in ANSYS, the elements on the U-

103
channel and cross member interface shared coincident nodes and were defined by the
Coincident Nodes command in the ANSYS preprocessing interface. The tubegrate model
created for theoretical analysis is depicted in Figure 7.6.
Figure 7.6: Tubegrate finite element model showing the contact load, edge restraints, and coincident nodes.
The uniaxial strain plots are depicted in Figures 7.7 and 7.8. Collecting the strain
data from the location of the uniaxial gages, the uniaxial strain is averaged as 5445
μStrain. The comparative experimental value at this location is 5239 μStrain. The top
uniaxial gage, located directly under the load, experiences an experimental strain value of
-4268 μStrain. The finite element strain value at this location is -6176 μStrain.
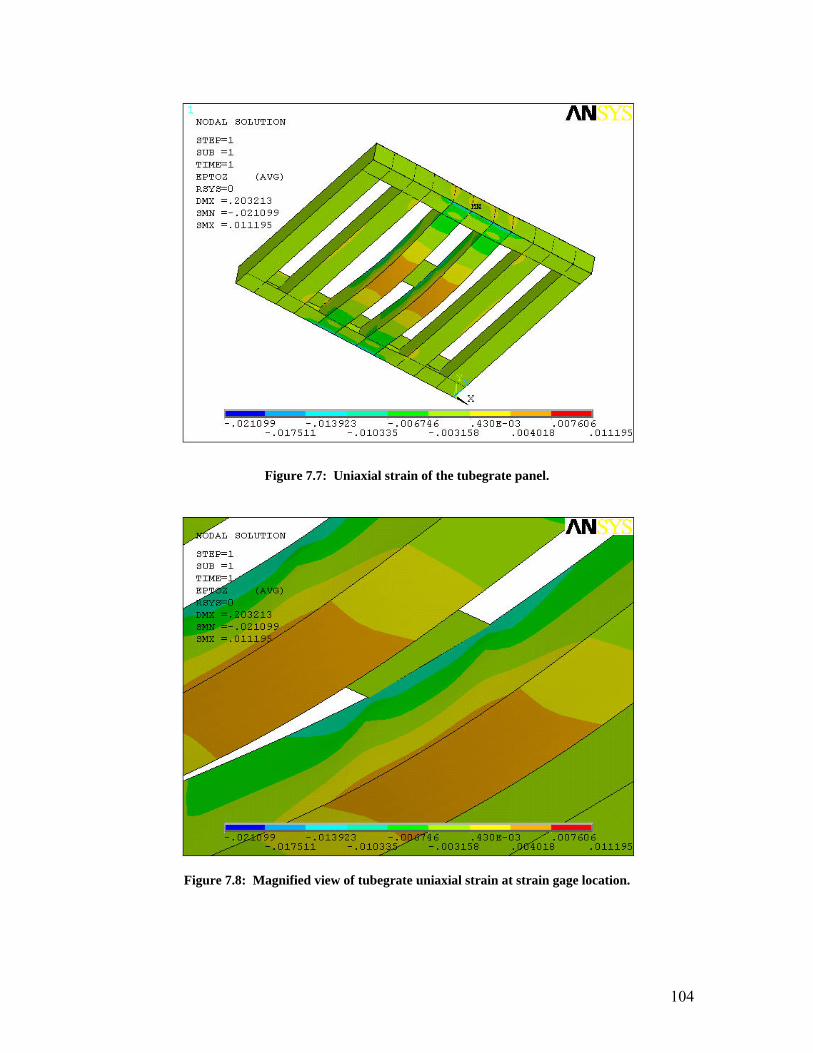
104
Figure 7.7: Uniaxial strain of the tubegrate panel.
Figure 7.8: Magnified view of tubegrate uniaxial strain at strain gage location.
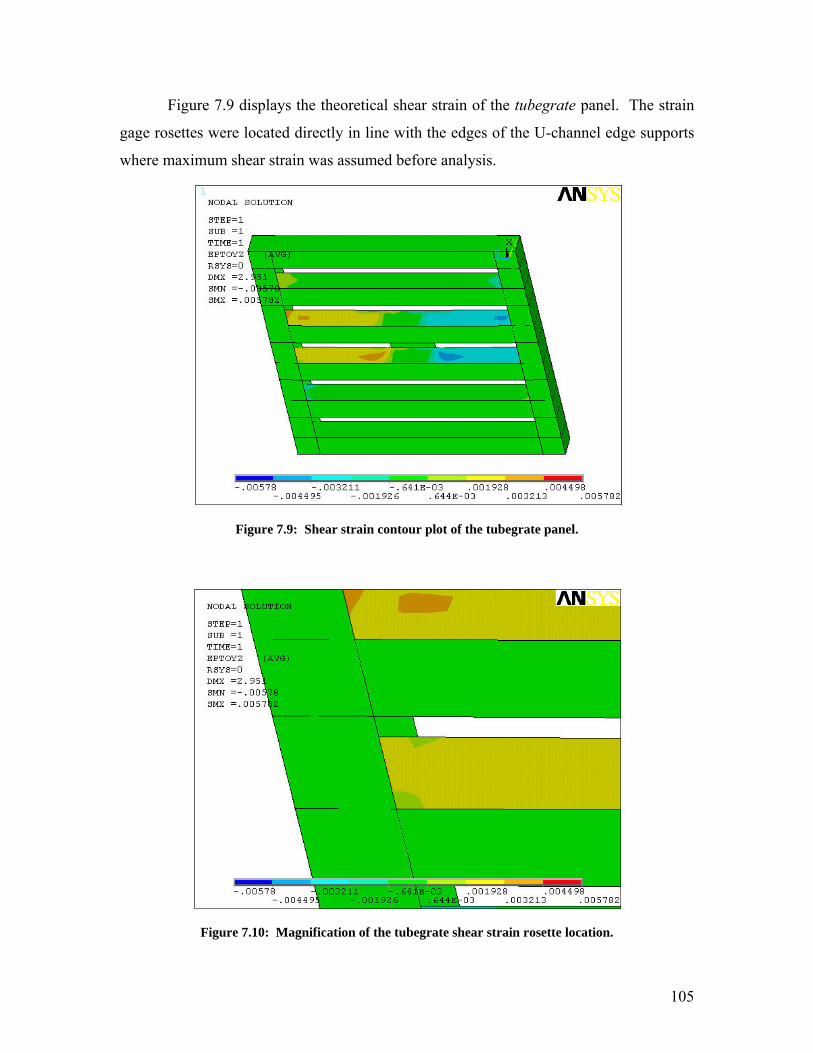
105
Figure 7.9 displays the theoretical shear strain of the tubegrate panel. The strain
gage rosettes were located directly in line with the edges of the U-channel edge supports
where maximum shear strain was assumed before analysis.
Figure 7.9: Shear strain contour plot of the tubegrate panel.
Figure 7.10: Magnification of the tubegrate shear strain rosette location.

106
The results shown in Figures 7.9 and 7.10 yield an averaged shear strain of 2160
μStrain. The maximum experimental shear strain experienced in the same region is 587
μStrain. The theoretical shear strain is 3.68 times greater than the experimental value. A
large portion of this difference is due to the boundary conditions established for the
tubegrate model. Therefore, modeling the connection of the nodes between the cross
members and the U-channel edge rails with coupled degrees freedom effects, ultimately
increases the shear strain magnitude by limiting sliding effects between surfaces.
7.1.3 Fiberplate Material: 5, ¾ inch aluminum tube cross members 10 paper rib strips 6 aluminum sheet metal strips 12 layers of woven E-glass and epoxy fiberglass composite Tube Thickness: 1/16 inch Panel Dimensions: 1 ft x 1 ft x 1 inch Elements: Shell Boundary Conditions: Simply supported on U-channel edge perpendicular to cross members. Load: 2 inch x 3 inch steel plate with a defined displacement into the panel creating contact. The fiberplate model involved detailed finite element modeling procedures to
most accurately define the panel geometry, materials, and contact characteristics.
Modeling was done with shell elements containing layer definition options. Within the
fiberplate structure, there are four different layer configurations (reference Figure 4.38).
The layer configurations were each defined by the shell element layer definitions in
ANSYS. The parameters defined per layer were thickness, material properties, and fiber
orientation.
The fiberplate ANSYS finite element model with boundary conditions and load
application is displayed in Figure 7.11.

107
Figure 7.11: The fiberplate finite element model showing the simply supported edges and load.
The uniaxial strains in the fiberplate were predicted to be lower than those of the
tubegrate because of the addition of the top and bottom fiberglass face sheets and the
reduction in the aluminum tube cross member size. It is important to remember that each
design is based on a cross section thickness of 1 inch. Therefore, in order to compensate
for the face plate thickness, the cross member cross section height was reduced from 1
inch in the tubeplate and tubegrate design to 0.75 inches in the fiberplate and
carbonplate.
Figure 7.12 shows the fiberplate uniaxial strain contour plot. The averaged value
of the finite element model in the region of the top uniaxial strain gage is -1732 μStrain.
The experimental value at this location is -1003 μStrain. The bottom uniaxial gage
averaged value is 1656 μStrain and the corresponding experimental value is 1069 μStrain.

108
Figure 7.12: Uniaxial strain of the fiberplate panel.
Figure 7.13: Shear strain contour plot of the fiberplate panel.
The fiberplate shear strain contour plot is displayed in Figure 7.13. Following the
trend of comparison between theoretical and experimental values, the strains again are
calculated to be of higher magnitude than the experimental results. The averaged

109
theoretical strain is 2749 μStrain and the corresponding experimental value is 267
μStrain. The theoretical value is greater than the experimental by a magnitude of ten.
The large difference is values can be attributed to the contact connection between the
core cross members and the top and bottom face sheets. A “bonded” connection is
established in the finite element model which coincides the movement of the surfaces in
contact between the face sheets and the core cross members. Therefore, the compression
action of the top face sheet and tension of the bottom face sheet by flexure is directly
transported to the cross member creating a higher shear resultant load. These same
actions are produced in the experimental procedure but slippage and ductility in the bond
will lessen the magnitude of the shear strain transmitted to the core cross members.
7.1.4 Carbonplate Material: 5, ¾ inch aluminum tube cross members 10 paper rib strips 6 aluminum sheet metal strips 12 layers of 2x2 twill weave graphite fabric and epoxy carbon fiber composite Tube Thickness: 1/16 inch Panel Dimensions: 1 ft x 1 ft x 1 inch Elements: Shell Boundary Conditions: Simply supported on U-channel edge perpendicular to cross members. Load: 2 inch x 3 inch steel plate with a defined displacement into the panel creating contact.
The carbonplate design is identical to the fiberplate layup except carbon fiber is
used in the faceplates instead of fiberglass. The impetus to use carbon as the fiber
material was for maximizing the fiber material properties and weight saving
characteristics. As seen in the material properties, carbon fiber is superior to fiberglass
producing higher stiffness values and ultimately increasing the load carrying capabilities
[11].
The finite element uniaxial strain contour plate of the carbonplate is displayed in
Figure 7.14.

110
Figure 7.14: Uniaxial strain distribution of the carbonplate
The shear strain contour plot of the carbonplate is displayed in Figure 7.15.
Figure 7.15: Shear strain distribution of the carbonplate.
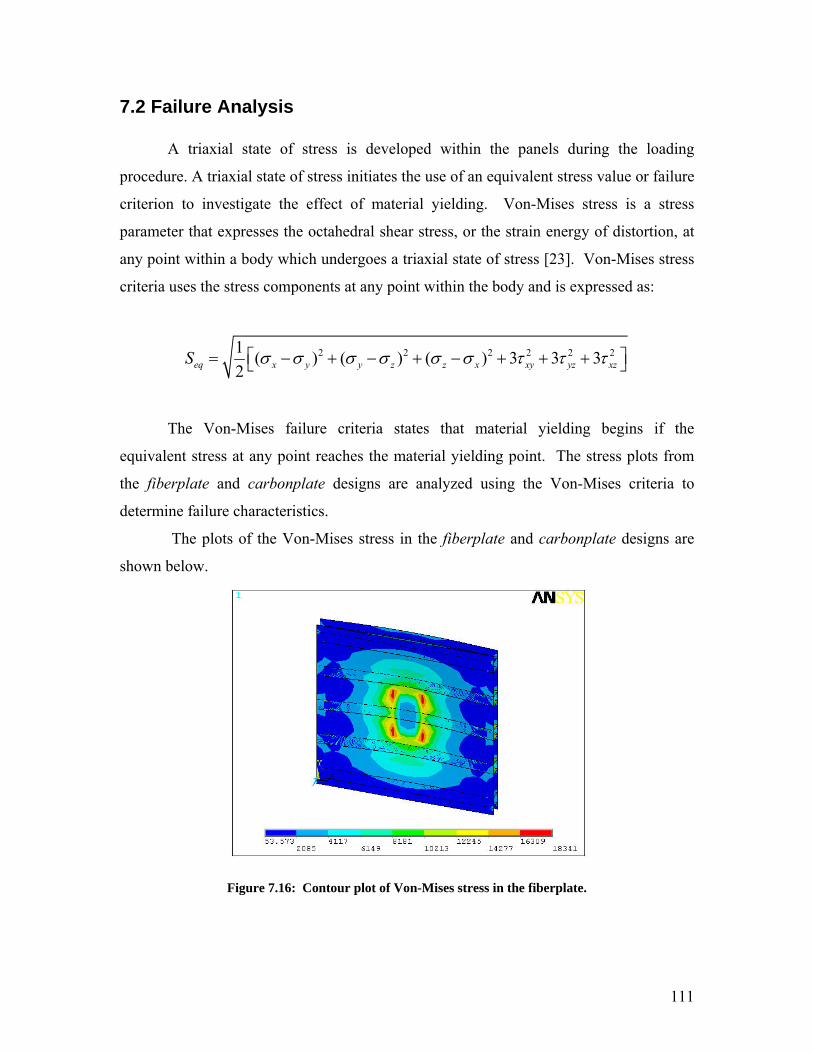
111
7.2 Failure Analysis A triaxial state of stress is developed within the panels during the loading
procedure. A triaxial state of stress initiates the use of an equivalent stress value or failure
criterion to investigate the effect of material yielding. Von-Mises stress is a stress
parameter that expresses the octahedral shear stress, or the strain energy of distortion, at
any point within a body which undergoes a triaxial state of stress [23]. Von-Mises stress
criteria uses the stress components at any point within the body and is expressed as:
2 2 2 2 2 21 ( ) ( ) ( ) 3 3 32eq x y y z z x xy yz xzS σ σ σ σ σ σ τ τ τ⎡ ⎤= − + − + − + + +⎣ ⎦
The Von-Mises failure criteria states that material yielding begins if the
equivalent stress at any point reaches the material yielding point. The stress plots from
the fiberplate and carbonplate designs are analyzed using the Von-Mises criteria to
determine failure characteristics.
The plots of the Von-Mises stress in the fiberplate and carbonplate designs are
shown below.
Figure 7.16: Contour plot of Von-Mises stress in the fiberplate.

112
Figure 7.17: Contour plot of the Von-Mises stress in the core of the fiberplate.
Figure 7.18: Contour plot of the Von-Mises stress in the carbonplate.

113
Figure 7.19: Contour plot of the Von-Mises stress in the core of the carbonplate.
The Von-Mises stress values from the finite element contour plots are used to
determine if there is failure in the panel core. As previously described, failure according
to the Von-Mises criteria occurs when the energy of distortion (plotted values) reaches
the same energy for yield/failure under uniaxial tension. The value in which yielding
occurs in the aluminum core structure is 60 ksi [24]. The maximum values attained in the
fiberplate and carbonplate designs are listed in Table 7.1.
Table 7.1 – Failure Criteria for the Fiberplate and Carbonplate Core Structure
Panel Configuration Strength of the Core
Structure (ksi)
Maximum Von-Mises
Stress in the Core (ksi)
Factor Of
Safety
Fiberplate 60 15.3 3.92 Carbonplate 60 12.7 4.72
From Table 7.1, it is shown that the maximum Von-Mises stress values attained in
the fiberplate and carbonplate designs are almost four times less than the tensile yield
strength of 60 (ksi) for the aluminum core structure. Therefore, it is determined that
applying a load of 600 lbs to a square foot section of the fiberplate or carbonplate design
will not cause yielding within the core structure.

114
Composite Failure Failure in composite structures is often complex and involves various modes of
failure. Methods of fracture of composite materials include the following.
• Fiber breaking • Matrix Crazing • Matrix Cracking • Fiber Debonding • Delamination
It is difficult to apply all the failure modes into the design and analysis of the part.
The basic approach involves using an empirical failure criterion, similar to the Von-
Mises criteria previously discussed. The maximum stress criterion [2] will most
efficiently provide an understanding into the failure prediction of the fiberplate and
carbonplate designs.
The maximum stress criterion for composite material analysis involves comparing
the stress values attained by theoretical or experimental analysis to the strength values of
a single laminate layer within the composite structure. The criterion predicts failure of a
layer when one of the stresses in material coordinates 1 2 6 4 5( , , , , )σ σ σ σ σ exceeds the
layer strength. The criterion states that failure will occur if any of the following
parameters are true
1 1 1
1 1 1
2 2 2
2 2 2
4 4
5 5
6 6
0000
t
c
t
c
F ifF ifF ifF if
F
F
F
σ σσ σσ σσ σ
σ
σ
σ
> >
> <
> >
> >
>
>
>
where
F1t – tensile strength in the fiber direction F1c – compressive strength in the fiber direction F2t – tensile strength in the transverse direction F2c – compressive strength in the transverse direction F6 – inplane shear strength F4, F5 – interlaminar shear strength values

115
The comparison of the determined stress values to the strength values of single
laminate layer with determine if failure is reached in the composite structure. Tables 7.2
and 7.3 display the maximum stress criterion for the fiberplate and carbonplate
composite structures.
Table 7.2 – Fiberplate Maximum Stress Criterion
Strength Parameter
Fiberplate Strength Values (ksi)
CorrespondingStress Values
(ksi)
Factor Of
Safety
F1t 53.0 14.7 3.61 F1c 79.6 21.0 3.80 F2t 53.2 11.0 4.84 F2c 79.6 14.7 5.41 F6 14.1 1.65 8.55
Table 7.3 – Carbonplate Maximum Stress Criterion
Strength Parameter
Carbonplate Strength Values (ksi)
CorrespondingStress Values
(ksi)
Factor Of
Safety
F1t 80 11.4 7.01 F1c 113 12.9 8.76 F2t 82.5 8.0 10.3 F2c 98.6 10.3 9.57 F6 14.2 1.52 9.34
The previous tables show that the lowest factor of safety attained for the
fiberplate composite structure is 3.61 and the carbonplate structure is 7.01. The
determined factors of safety determine that the composite structure within each design
will not fail when loaded with a 600 lb load per square foot section.
It should also be stated that if a 600 lb/ft2 load is applied as the load on the floor
of a 54 ft. trailer platform, the overall trailer cargo load would equal 129,600 lbs or
approximately 65 ton. The average payload capacity is 25 ton per cargo load. Therefore,
a 2.5 factor of safety is in included in the applied load.

116
7.3 Discussion As shown in the four panel comparative study, there are four options of
progressive design, meaning, each design was upgraded or altered from the previous. The
designs progressed to efficient load bearing platforms with weight saving properties. The
objective of thise study was to create weight efficient platform to initiate in heavy vehicle
applications or any application in which lightweight and strength characteristics are
desired and mandatory. Table 7.4 lists the four panel designs and their respective weights
versus the square foot section of an existing trailer section.
Table 7.4 – Weight of Panel Designs Compared to an Existing Trailer Section
Panel Design Weight of Square Foot Section (lbs) Tubeplate 3.4 Tubegrate 2.6 Fiberplate 2.4
Carbonplate 2.2 Existing Trailer Section 21.6
In Table 7.4, the cross section thickness of the sandwich panel designs is one inch
and the highest weight savings is exhibited in the carbonplate design, with a weight
saving capability of approximately 10 times less than the existing current trailer section.
The other panel designs also display promising weight saving abilities. The least
efficient design is the tubeplate, which has a weight per square foot value of 3.4 lbs. Even
as the heaviest panel design, the tubeplate contributes a weight savings of 18.2 lbs per
square foot versus the existing trailer section.
The weight comparison of Table 7.4 presents extraordinary weight efficient
characteristics of the panel designs. However, the existing trailer section is composed of
four inch steel I-beams and a 1 3/8 inch solid oak platform connected to the top flange. It
is not expected that the one inch panel sections will compare to the current trailer section
on the basis on bending resistance and load carrying capabilities. Increasing the panel
dimensions to attain a four inch cross section thickness and comparing to the existing
trailer section will reveal if the designs are beneficial in comparison to a trailer platform.

117
A final comparative finite element study was performed. The study involves the
carbonplate design and a model of the existing trailer section. The carbonplate thickness
and dimensions have been increased to create a four inch cross section thickness and will
be noted as carbonplate-4. The goal is to determine if the maximum displacement and
strain values of the carbonplate-4 panel will be less than the existing trailer design of
four inch steel I-beams and 1 3/8 inch solid oak platform. The following finite element
models of the carbonplate-4 and existing trailer section are shown in Figure 7.20.
Figure 7.20: Finite element models of the trailer section and the carbonplate.
After applying the same distributed load to each model the displacements were
analyzed. Figures 7.21 and 7.22 illustrate the displacement contour plots for the trailer
section and the comparative carbonplate-4 model, respectively. It is seen that the
maximum displacement of trailer section is 0.737e-3 inches. The maximum
displacement in the carbonplate-4 is 0.104e-3 inches, this value is more than seven times
less than the maximum displacement of the existing trailer section.

118
Figure 7.21: Displacement contour plot of the trailer section model.
Figure 7.22: Displacement contour plot of the carbonplate-4 section.
The shear strains of each model can also be studied and compared. The
maximum shear strain occurring in the trailer section is 37 μStrain and is shown in the
contour shear strain plot of Figure 7.23.

119
Figure 7.23: Shear strain contour plot of the trailer section model.
Figure 7.24: Shear strain contour plot of the carbonplate-4 model.
In comparison to Figure 7.23, the maximum shearing strain in the carbonplate-4
is 19 μStrain. As seen in Figure 7.24, the bottom corners of the center core cross member
are the location of the maximum shear strain. Comparing the maximum strain values of

120
each model reveals the trailer section has a shear strain value of approximately two times
the carbonplate-4 model.
The square foot weight of the carbonplate-4 panel is 7.0 lbs. If the I-beams and
oak floor were replaced with the carbonplate-4 design, the weight savings per square foot
would be 14.6 lbs which correlates to a total of 6,307.2 lbs saved for a 54 ft. trailer haul.
This figure can be maximized by creating the panel thickness which exactly matches the
displacements and strains of the current existing trailer. The thickness of this structure
would occur in the range between one and four inches. Also, an option to lower the cost
of outfitting a 54 or 48 ft. trailer floor with the carbonplate-4 would be to use fiberglass
as the faceplate material.
A fiberglass model with a four inch cross section, fiberplate-4, was created to
determine if the load bearing capabilities are also superior to the existing trailer design
and comparable to the carbonplate-4 panel. The reaction contour plots for the fiberglass-
4 panel are shown in the following figures.
Figure 7.25: Displacement contour plot of the fiberglass-4 model.

121
Figure 7.26: Shear strain contour plot of the fiberglass-4 model.
The displacement and shear strain of the fiberplate-4 model are shown in Figures
7.25 and 7.26, respectively. The displacement and strain values are both superior to those
of the trailer section, Figures 7.21 and 7.23. The maximum displacement is 0.127e-3
inches and the maximum shear strain is 20 μStrain. Therefore, the fiberglass design is
also an option to replace the existing current floor structure of steel I-beams and solid oak
covering. The weight of the fiberplate-4 panel per square foot is 7.206 lbs and is slightly
heavier than the carbonplate-4 design. The total weight savings for a 54 ft. trailer floor
using the fiberplate-4 design is 6,218.2 lbs. The weight savings for both the carbon fiber
and fiberglass designs are extremely significant. The carbon fiber design is superior for
weight savings and load bearing capabilities, however, taking into account the slight
margin of difference in performance and the cost of carbon fiber to fiberglass, equipping
the trailer floors with a lower cost fiberglass design and sacrificing small weight and
stiffness penalties may result in the most practical alternative.

122
7.4 Conclusion The carbonplate and fiberplate design is a technology geared toward flooring
applications in large trailer systems but can be applied to platforms or load carrying
structures. In applications such as the aerospace industry and shipping industry where
weight saving is crucial to the performance of the structure, composite sandwich
technology with a load-bearing core structure, as shown in this work, is a promising
solution. The particular composite sandwich structure studied in this work is
revolutionary because it combines a core material which contributes to the bending
stiffness as compared to a common sandwich structure with a core material of
honeycomb, wood, or foam which do not which do not contribute to bending resistance
alone.. The bonding and joining issues of a metallic core and fiber reinforced polymer
faceplates has been solved by the combination of panel geometry and adhesive bonding.
The application of applying composite material technology to the entire trailer structure
has been tested by the manufacturing of a scaled trailer model.
Additional conclusions which can be drawn from this work are as follows:
• Joining concepts between composite parts within a trailer system have been
addressed by the construction of a trailer model and study of various joint designs.
Adhesive bonding assisted by mating geometry is a method to join structures without
the use of mechanical joints such as bolts or rivets.
• If replacement of the steel I-beams and oak flooring in an existing trailer is not
acceptable within the trucking industry, an alternative arrangement of replacing the
oak flooring alone with the fiberplate or carbonplate designs will also create
respectable weight savings. The one-inch thick cross section panels will serve this
design purpose.
• The fiberplate and carbonplate designs were created with the objective of designing
and manufacturing a sandwich composite structure with a core material that
contributes to the bending stiffnes. In theory, a sandwich composite is generally
composed of a honeycomb, foam, or wood core. These core materials do not
contribute to bending resistance. To create this type of design, issues of bonding

123
between the faceplates and core had to be addressed. Developing an interlocking
geometry between the core and faceplates assists the adhesive bonding and ultimately
strengthens the design. The top and bottom faceplate structures implement a
sandwich design between the core cross members by means of paper honeycomb
ribbed sections. The ribbed sections serve to provide stiffness at the spaced intervals
between the core cross member extrusions.
• The composite structures within this work were produced by hand layup techniques.
More advanced manufacturing processes can significantly increase the performance
of the part and also further increase weight saving capabilities.
• Several options for optimizing the design of the fiberplate and carbonplate are
available if needed. The comparison of the cross section core members revealed that
the tube extrusion is not the most effective for loading applications and replacing this
extrusion with a more beneficial design will also increase the performance.
Optimization of the carbon fiber and fiberglass layups can also be performed to
strengthen the laminate.

124
REFERENCES [1] WVU and DOE Heavy Vehicle Systems Project, Statement of Work, 2003 [2] Barbero, Ever J., Introduction to Composite Material Design, Edwards Brothers, Ann Arbor, MI, pp. 43-58 1998 [3] Slobodzinsky, A., Bag Molding Processes, Handbook of Composites. PLASTEC, Picatinni Arsenal, Dover, NJ. pp 368-390, 1982. [4] Meade, L.E., “Fabrication of Advanced Composites,” Handbook of Composites. Lockheed Aircraft, Marietta, GA. pp 491-513, 1982. [5] Young, Robert P., “Thermoset Matched Die Molding,” Handbook of Composites. P. Robert Young Associates, Brooklyn, NY. pp 391-448, 1982. [6] Starr, T.F. Structural Applications for Pultruded Profiles, Composite Structures 2, Applied Science Publishers, London, pp. 192-211 [7] Composites / Plastics. http://composite.about.com/library/glossary/f/bldef-f2218.htm About, Inc., 2006. [8] Nicholls, Robert. Composite Construction Materials Handbook, Prentice Hall Inc.,
Englewood Cliffs, NJ, 1976.
[9] Vinson, Jack R., The Behavior of Sandwich Structures of Isotropic and Composite
Materials, Technomic, Lancaster, PA, 1999.
[10] Zenkert, D. The Handbook of Sandwich Construction. Chameleon Press Ltd.,
London, United Kingdom. 1997.
[11] Jones R.M., Mechanics of Composite Materials, Scripta Book Company,
Washington D.C. 1975.
[12] Hull, Derek, An Introduction to Composite Materials, Cambridge University Press,
Cambridge, Great Britain. 1981.
[13] Elzey, Dana, Sofla, A. Haydn, W., “A Shape Memory-based Multifunctional
Structural Actuator Panel,” Journal of Solids and Structures, Vol. 42, pp 1943-1955,
2004.
[14] Vinson, Jack R. and Sierakowski, R. L., The Behavior of Structures Composed of Composite Materials. Martinus-Nijhoff Publishers, Dordrecht, The Netherlands, 1986.

125
[10] Zenkert, D. The Handbook of Sandwich Construction. Chameleon Press Ltd., London, United Kingdom. 1997. [15] Whitney, J.M, Structural Analysis of Laminated Anisotropic Plates,Technomic Publishing Co. Inc., Lancaster, PA, 1987. [16] Dobyns, A.L., “The Analysis of Simply-Supported Orthotropic Plates Subjected to Static and Dynamic Loads,” AIAA Journal, pp. 642-650, May 1981. [17] Levy, M., “Sur L’equilibrie Elastique d’une Plaque Rectangulaire,” Compt. Rend 129, pp 535-539, 1899. [18] Hart-Smith, L.J., Joining Fibre-Reinforced Plastics. Ed. By Mathews F.L., Elsevier Applied Science, Chapter 7, 282-299 [19] John and Kinloch, Measuring and Predicting the Durability of Bonded Carbon Fibre/Epoxy Composite Joints. Composites. 1991 [20] Ojalvo, I.U., Optimization of Bonded Joints. AIAA Journa, Vol. 23, No. 10, pp. 1578-1582, 1985. [21] Tong and Steven, Analysis and Design of Structural Bonded Joints. Kluwer Academic Publishers, Norwell, MA. 1999. [22] Slobodzinksy, A., “Bag Molding Processes,” Handbook of Composites. P. Robert Young Associates, Brooklyn, NY. pp 368-390, 1982. [23] Chen, W.F. and D.J. Han (1987), “Plasticity for Structural Engineers,” Gau Liu Book Co., Taiwan. [24] Hibbeler, R.C., “Mechanics of Materials, 6th Edition,” Pearson Prentice Hall, Upper Saddle River, NJ, 2005.