Embed Size (px)
Citation preview

Design of a near-optimal generalized ABC classificationfor a multi-item inventory control problemvan Wingerden, E.; Tan, T.; van Houtum, G.J.J.A.N.
Published: 15/02/2016
Document VersionPublisher’s PDF, also known as Version of Record (includes final page, issue and volume numbers)
Please check the document version of this publication:
• A submitted manuscript is the author's version of the article upon submission and before peer-review. There can be important differencesbetween the submitted version and the official published version of record. People interested in the research are advised to contact theauthor for the final version of the publication, or visit the DOI to the publisher's website.• The final author version and the galley proof are versions of the publication after peer review.• The final published version features the final layout of the paper including the volume, issue and page numbers.
Link to publication
General rightsCopyright and moral rights for the publications made accessible in the public portal are retained by the authors and/or other copyright ownersand it is a condition of accessing publications that users recognise and abide by the legal requirements associated with these rights.
• Users may download and print one copy of any publication from the public portal for the purpose of private study or research. • You may not further distribute the material or use it for any profit-making activity or commercial gain • You may freely distribute the URL identifying the publication in the public portal ?
Take down policyIf you believe that this document breaches copyright please contact us providing details, and we will remove access to the work immediatelyand investigate your claim.
Download date: 29. Jul. 2018

Design of a near-optimal generalized ABC classification for a multi-item inventory control problem
E. van Wingerden, T. Tan, G.J. Van Houtum,
Beta Working Paper series 494
BETA publicatie WP 494 (working paper) ISBN ISSN NUR
Eindhoven February 2016

Design of a near-optimal generalized ABC classification for a
multi-item inventory control problem
E. van Wingerden, T. Tan∗, G.J. Van Houtum,
Eindhoven University of Technology, School of Industrial Engineering, the Netherlands
Abstract
In this paper we consider a multi-item, single-location inventory control problem. We lookat how to design a generalized ABC classification scheme to minimize the inventory investmentcosts while satisfying an aggregate fill rate constraint by considering four different aspects ofa classification: the classification criteria, the number of classes, the class sizes, and the targetfill rate per class. Using multiple alternatives per aspect and considering all combinations,we determine the best combination of those four aspects. The results are measured againstthe system approach, which specifies a separate target fill rate for each SKU and therefore isoptimal but more difficult to manage. We find near-optimal results by applying our approachon empirical data. The most important insight that we generate is that the best class sizes -which need to be carefully decided - depend on the target aggregate fill rate whereas commonused rule of thumbs to determine class sizes may lead to large inventory investment costs.
Keywords: Inventory control, classification, SKUs, system-oriented service constraints, greedy heuristics
1. Introduction
A proper management of the inventory is of great importance for many companies as they have
service contracts or want to provide a certain service to their customers, often measured by the
aggregate fill rate (see Thonemann et al., 2002). For many practical cases, the number of stock
keeping units (SKUs) is too large to apply SKU-specific inventory control methods (Buxey, 2006).
Although some companies implement SKU-specific inventory control methods, there are many
companies for which this is not possible due to limited functionality of their ERP system or due to
a lack of knowledge about this topic within the company. As a practical solution, many companies
follow an approach known as an ABC classification (see e.g. Ramanathan, 2006; Hatefi and Torabi,
2015; Flores and Whybark, 1987; Chu et al., 2008; Eilon and Mallya, 1985; Liu et al., 2015): They
often categorize their inventory into three classes and manage the SKUs within a class in the same
way, Class A being the most important category receiving the closest attention and Class C being
the least important one. In this way they are basically able to differentiate between different SKUs
while still having a simple inventory control policy. Nevertheless, the classification of SKUs is done
by rules of thumb: E.g. 20% of SKUs that have the highest annual dollar volume are grouped
∗Corresponding author, Tel.: +31 40 247 3950, E-mail: [email protected]
1

under Class A. Such oversimplification is prone to significant sub optimization. In this paper
we investigate whether this can be improved by a -still simple- ”generalized” ABC classification
approach, in which the classification is made more carefully. In particular, we attempt to provide
an answer to our main research question by making use of two different spare parts data sets of a
maintenance company: How should one design a generalized ABC classification in order to obtain
the lowest inventory investment costs while ensuring a target aggregate fill rate?
When looking at various ABC classifications, there are four aspects that together determine
the performance of the generalized ABC classification. First of all, as different SKUs have different
characteristics, and can be of different importance to the company, SKUs can be ranked based on one
or more criteria. There have been many authors that propose different criteria to rank the SKUs.
The most common criterion is the annual dollar volume (see e.g. Silver et al., 1998; Stevenson,
2007; Nahmias, 1997). However, this criterion does not set the relation with the resulting inventory
costs. As inventory costs can be a large fraction of the total costs, Ramanathan (2006), Bacchetti
and Saccani (2012), Bacchetti et al. (2013), Zhou and Fan (2007), Teunter et al. (2010), Ng (2005),
Babai et al. (2015), Hollier and Vrat (1978), Zhang et al. (2001) and Ernst and Cohen (1990)
propose classifications for SKUs where inventory costs are taken into consideration. Multicriteria
classifications, where SKUs are classified into three classes based on multiple criteria, have also been
proposed (see e.g. Flores et al., 1992). Moreover, in practice we commonly observe two-dimensional
classifications where each SKU is classified twice based on each criterion and the final classification
is obtained by taking the combination of the previous two classifications. In this way, often nine
classes are being used (see e.g. Duchessi et al., 1988; Flores and Whybark, 1987). See Figure 1 for
an example of a two-dimensional classification.
Figure 1: Example of Price and Demand classification
The second aspect we consider is the number of classes used to classify the SKUs. Although
most of the previously mentioned literature considers three classes only, it is possible to extend this
to a larger number of classes. A larger number of classes would lead to a reduction of inventory
investment costs and increase in performance as three classes may not capture the differences
between SKUs sufficiently well (Lee, 2002). However, an increase of the number of classes also
2
makes it more difficult to manage the SKUs. Based on empirical data, we show that having three
classes already gives significant improvement compared to two classes, and that four classes is a
good choice to balance the costs and difficulty of implementing. A further increase in the number
of classes only results in limited cost decreases.
Thirdly, one needs to decide on the class sizes and thus in which class each SKU needs to be
placed. For ABC classifications with three classes, a common rule of thumb (see e.g. Jacobs et al.,
2009; Slack et al., 2007; Stevenson, 2007; Nahmias, 1997) is to have about 20% of the SKUs in class
A, 30% in class B and 50% in class C. However, when the classes are managed by setting different
service levels per class, there are no clear guidelines on how to rank items. There are authors that
argue that class A SKUs should have the highest service target to avoid frequent backlogs (see
e.g. Armstrong, 1985; Stock and Lambert, 2001), whereas other authors claim that class C SKUs
should have the highest service as dealing with stockouts is not worth the effort (see e.g. Knod
and Schonberger, 2001). Nevertheless, these suggestions are not considering the relative size of
each class and the link with the desired service or classification criteria used. To the best of our
knowledge, besides this rule of thumb, there is no literature on this topic. We show that for the
class consisting of the most expensive SKUs, which gets the lowest service level due to their large
impact on the inventory investment costs, the best class size depends on the aggregate fill rate
target. Large cost differences of around 290% are possible by only varying the size of each class.
Finally, one needs to decide on how to manage each class of parts. In this paper this is done by
setting a target fill rate for each class. Although most literature only considers the classification
criteria used to classify the SKUs and does not relate to the resulting inventory costs, there are
a few authors that do consider the resulting inventory costs (see e.g. Teunter et al., 2010; Babai
et al., 2015). The first authors to combine target setting with a classification are Teunter et al.
(2010). However, they stock all SKUs as they only consider strictly positive target fill rates. As we
are interested in the overall performance, it is not always desired to stock all SKUs (meaning that
some SKUs might have zero fill rate), especially when there are large cost differences between the
SKUs (Sherbrooke, 1968).
As these four aspects cannot be considered independently of the others (e.g. the target service
level of a class depends on how many classes there are), we examine each combination of these four
aspects, which to the best of our knowledge has not been done before. We consider four possible
classification criteria, vary the number of classes, use enumeration over possible class sizes, and
set the optimal target fill rate per class given all other aspects. This approach is applied on two
different data sets consisting of real life spare parts data of a maintenance company responsible for
the maintenance of ground support equipment. We use this data to compare the resulting inventory
investment costs to the result of a system approach, which stands for having a separate class for
each SKU (see e.g Sherbrooke, 1968; Van Houtum and Kranenburg, 2015).
The main contribution of this paper is that we propose a generalized ABC classification scheme
that takes the above four aspects jointly into account, and provide a structured approach to design a
classification to minimize inventory investment costs while meeting the aggregate fill rate constraint.
Using real life spare parts data and by comparing multiple classification criteria, we show that when
3

these four aspects are combined, the resulting inventory investment costs can be within one percent
of the result of a system approach, which is shown to give (near) optimal results at the expense of
more complicated inventory control. This approach can also be applied to other criteria, demand
distributions, and inventory policies. Moreover, we show that having the right class sizes, which to
the best of our knowledge has not been discussed in the literature before, can have a big impact
on the performance. We compared the best class sizes with class sizes determined by the common
rule of thumb where about 20% of the SKUs are in class A, 30% in class B and 50% in class C (cf.
Teunter et al., 2010). Cost differences up to 290% are possible and more likely to occur for higher
aggregate fill rate targets. Because we use enumeration to determine the optimal target per class,
our approach can become time consuming when the number of classes increases. Therefore, we also
propose an algorithm that significantly decreases the calculation time for our classification scheme,
whereas the cost increase on average is below 2%.
The remainder of the paper is organized as follows: In Section 2 we introduce the model de-
scription. In Section 3 we give our approach on how to design a generalized ABC classification
scheme that considers all of the four aspects jointly. In Section 4 we first explain our real life data
set of spare parts, which we use for our numerical experiment. We then present the optimality gap
of the alternatives that we consider and we conduct some analysis to obtain more insights regarding
how to set the right class sizes and propose an algorithm to set the target fill rates per class in
a fast way. We conclude our paper and give some recommendations for future research in Section 5.
2. Model
We consider a single warehouse in which several SKUs are kept on stock. Whenever a SKU is
requested, it is immediately delivered from stock on hand, and backordered and delivered as soon
as possible when there is no stock on hand. The set of SKUs is denoted by I; the number of SKUs
is |I| ∈ N := {1, 2, . . .}. For notational convenience, the SKUs are numbered as 1, . . . , |I|. For
each SKU the stock is controlled by a continuous-review basestock policy, with basestock level Si
for SKU i. For each SKU i ∈ I, we assume that demand follows an independent Poisson process
with a constant rate λi (≥ 0), which is particularly plausible in the maintenance and spare parts
environment, but also in some retail environments. The total demand rate for all SKUs is denoted
by Λ =∑
i∈I λi. The replenishment lead time Li (> 0) is assumed to be constant. Each SKU has
a price of ci, and the total inventory investment costs are given by
C(S) =∑i∈I
ciSi, (1)
where S = (S1, . . . , S|I|) denote the vector consisting of all basestock levels. The fill rate for item
i, in steady state, is denoted by βi(Si). The (aggregate) fill rate in steady state is as follows:
β(S) =∑i∈I
λiΛβi(Si). (2)
4

Note that the calculation for the fill rate is as follows (see also Van Houtum and Kranenburg, 2015)
βi(Si) =
Si−1∑x=0
P {Xi = x} ,
P {Xi = x} =(λiLi)
x
x!e−λiLi , x ∈ N0.
The target aggregate fill rate for β(S) is given by βo. The objective is to minimize the total costs
subject to an aggregate fill rate constraint. In mathematical terms the optimization problem is as
follows:(P) min C(S)
subject to β (S) ≥ βo
Si ∈ N0, ∀ i ∈ I
As managing each SKU individually can be very complex, especially for a large number of
SKUs, companies often resort to the use of ABC classifications. In the next section, we show how
we design a generalized ABC classification to obtain minimum inventory investment costs against
the aggregate fill rate target.
Although we made some assumptions on the demand process and the inventory control policy
our approach can be easily applied with other demand processes and/or inventory control policies
as this merely changes the evaluation of the fill rate and costs. The same steps of our approach
can still be applied to design the ABC classification.
3. Design aspects of a generalized ABC classification
In this section we propose a design of a generalized ABC classification scheme. As the four different
aspects cannot be considered separately, we consider each combination and their resulting inventory
investment costs. We first describe the different classification criteria we consider in this research.
Then we explain the number of classes we consider for each of the four different classification
criteria. Thirdly, we explain how we set the class sizes. Finally, we describe how we set the target
service level for each class. Willen we hier verwijzing naar de secties toevoegen?
3.1 Classification criteria
When considering a classification for SKUs, we first need to define the classification criteria that
enable us to rank the SKUs. Once we have ranked the SKUs we can take the other three aspects
into consideration. There has been extensive studies on how to classify SKUs, and recently there
were also authors that relate the classification with the inventory control (see e.g. Babai et al.,
2015; Teunter et al., 2010; Ng, 2005). The annual dollar volume - i.e. annual demand times price
- (ADV) criterion, is the traditional criterion for ABC classifications and found in many textbooks
(see e.g. Silver et al., 1998; Nahmias, 1997). However, if we follow the idea of a system approach
(Sherbrooke, 1986), parts with a high price end up with a lower service level, whereas parts with a
5
high demand end up with a higher service level. Therefore, ADV is a poor construction in terms
of inventory investment costs as demand and price work in opposite directions as under the system
approach. This was also observed by Teunter et al. (2010) and they proposed a classification based
on Demand/Price (D/P), which captures the idea of a higher service for cheap and fast moving
SKUs. They found that this classification criterion was the best performing criterion among the
criteria they considered.
In practice, two-dimensional classifications based on price and demand are often seen to manage
the inventory (see e.g Duchessi et al., 1988; Flores and Whybark, 1987), but they have not been
compared before. This two-dimensional classification classifies SKUs based on both price and
demand and therefore does not have similar problems as the ADV criterion. We compare this
two-dimensional classification to the previous mentioned methods. Note that we also compared
some other classification criteria as a ranking based on demand, leadtime demand, and price only,
but we omit them in our exposition as they did not give better results. Therefore, we only present
the results and findings of the following three criteria:
1. Annual Dollar volume (ADV) (one-dimensional)
This single criterion classification is the most common criterion. The demand rate of each
SKU is multiplied with the price of each SKU and then ordered based on this annual dollar
volume. The SKUs are ranked in descending order, where SKUs with the largest ADV are
considered class A SKUs.
2. Demand/Price (D/P) (one-dimensional)
This classification is proposed by Teunter et al. (2010), and shown to give the best performance
related to inventory costs. The SKUs are classified based on their demand rate divided by their
price. They are then ranked in descending order, where the top group of SKUs, consisting
of fast moving and cheap SKUs, are considered class A SKUs which should get the highest
service level.
3. Price and Demand (P&D) (two-dimensional)
This classification is often found in practice: Each SKU is classified based on both price
and demand. In practice, often nine classes are used, see Figure 1 for an example of this
classification.
3.2 Number of classes
When considering ABC classifications, often three classes per dimension are considered: Class A,
class B, and class C. However, it is also possible to consider different numbers of classes when
classifying SKUs. As less classes will most likely end up with higher investment costs, it makes the
problem less complex. Increasing the number will most likely give better results because there are
more options available, but this will increase the complexity of the problem. Therefore, there is a
trade-off between performance and manageability. Graham (1987) and Silver et al. (1998) mention
that up to six classes can be used as more classes increases the complexity. Using six classes,
6
Teunter et al. (2010) showed that good results can already be obtained. For the two-dimensional
classification, a matrix approach is common with 9 classes Duchessi et al. (1988). Having a 4 by 4
matrix would lead to 16 classes which becomes too difficult and costly to manage.
In our numerical experiment we vary the number of classes between 2 and 6 for the one-
dimensional classifications. For the two-dimensional classification we consider a 2 by 2 matrix and
a 3 by 3 matrix. Moreover, we add the results of the system approach, where each SKU is put in
a separate class. By considering these different class sizes, we obtain in total 14 combinations of
ABC classification criteria and number of classes. Given the number of classes, we introduce a set
of classes K where classes are numbered (1, . . . , |K|).
3.3 Class sizes
For each of the above mentioned combinations, we need to decide on the size of each class, which in
turn determines the class each SKU will be placed in. There has not been much research about the
best class sizes for ABC classifications. Typically a rule of thumb for the ADV classification is used
(see e.g. Jacobs et al., 2009), in which 20% of the SKUs are class A, 30% class B, and 50% class
C. Later on, Teunter et al. (2010) also used this rule of thumb for the D/P classification. One of
our goals in this paper is to find out whether different class sizes have an impact on the inventory
investment costs.
Therefore, we use treshold values to determine which class each SKU is placed into. For example,
in the case we have three classes and SKUs are ranked based on their price and the price of a SKU is
larger than all treshold values, it will be placed in class C (unlike the logic of the ADV classification).
If the price is smaller than the smallest treshold value it will be placed in class A. When there are
more than three classes, or multiple dimensions, there are also more treshold values but the logic
remains the same.
We then use enumeration over the treshold values, which we set equal to the x−th percentile.
With x ∈ {∆, 2∆, . . . , d100/∆e∆}, for each treshold value. Based on the treshold values, we
determine ki, i ∈ I, representing the class to which SKU i belongs.
Note that the treshold values are sorted in ascending order as they must be increasing in size,
and that if two treshold values are equal, this is the same as having fewer classes.
3.4 Target setting
Given the set of classes K and the class to which each SKU i ∈ I belongs, noted by ki, , we need
to decide on how to manage each class of SKUs. It is common to set different service targets for
each class, θk, to manage each class (Teunter et al., 2010). Although there are also other ways to
manage the inventory of each SKU in a class, for instance by choosing Si such that the distance to
the service level target of that SKU’s class, θki , is minimized, we follow the more common approach
of Teunter et al. (2010), where the fill rate has to be greater than or equal to the target for each
SKU in that class. We thus need to decide on θk, k ∈ K, the target fill rate per class. We set the
value of Si, i ∈ I, equal to the lowest integer that satisfies this fill rate target, θki , for SKU i.
7
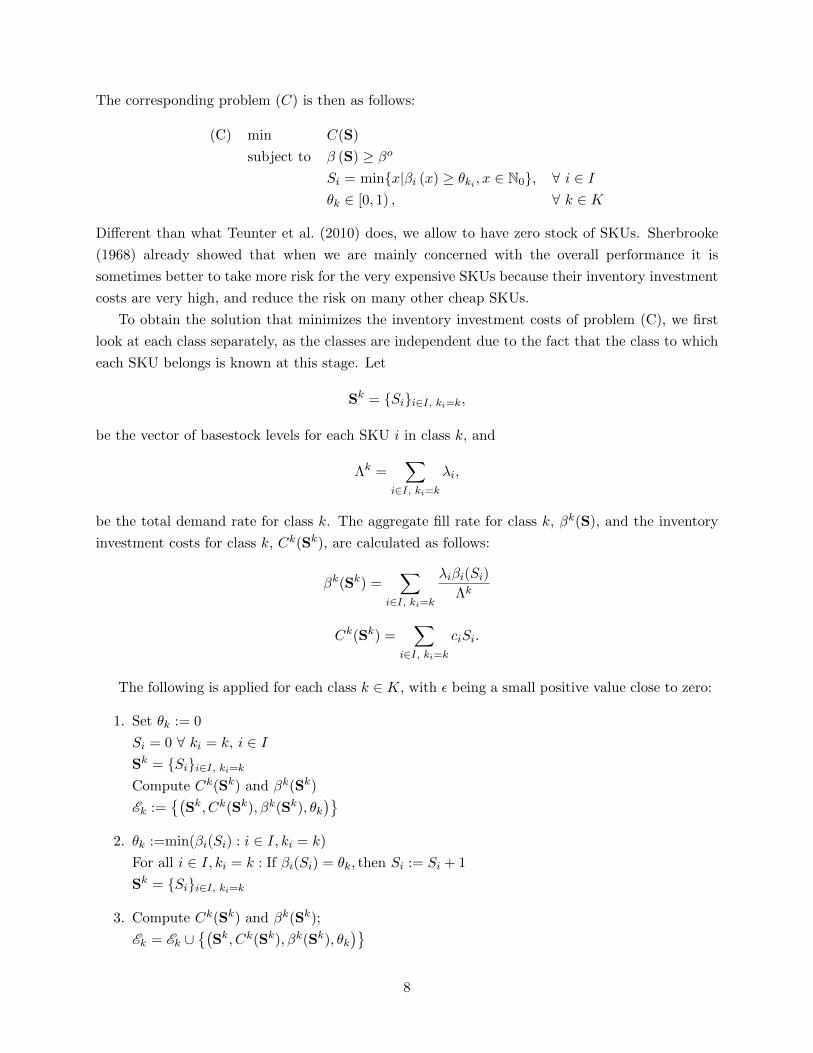
The corresponding problem (C) is then as follows:
(C) min C(S)
subject to β (S) ≥ βo
Si = min{x|βi (x) ≥ θki , x ∈ N0}, ∀ i ∈ Iθk ∈ [0, 1) , ∀ k ∈ K
Different than what Teunter et al. (2010) does, we allow to have zero stock of SKUs. Sherbrooke
(1968) already showed that when we are mainly concerned with the overall performance it is
sometimes better to take more risk for the very expensive SKUs because their inventory investment
costs are very high, and reduce the risk on many other cheap SKUs.
To obtain the solution that minimizes the inventory investment costs of problem (C), we first
look at each class separately, as the classes are independent due to the fact that the class to which
each SKU belongs is known at this stage. Let
Sk = {Si}i∈I, ki=k,
be the vector of basestock levels for each SKU i in class k, and
Λk =∑
i∈I, ki=kλi,
be the total demand rate for class k. The aggregate fill rate for class k, βk(S), and the inventory
investment costs for class k, Ck(Sk), are calculated as follows:
βk(Sk) =∑
i∈I, ki=k
λiβi(Si)
Λk
Ck(Sk) =∑
i∈I, ki=kciSi.
The following is applied for each class k ∈ K, with ε being a small positive value close to zero:
1. Set θk := 0
Si = 0 ∀ ki = k, i ∈ ISk = {Si}i∈I, ki=kCompute Ck(Sk) and βk(Sk)
Ek :={(
Sk, Ck(Sk), βk(Sk), θk)}
2. θk :=min(βi(Si) : i ∈ I, ki = k)
For all i ∈ I, ki = k : If βi(Si) = θk, then Si := Si + 1
Sk = {Si}i∈I, ki=k
3. Compute Ck(Sk) and βk(Sk);
Ek = Ek ∪{(
Sk, Ck(Sk), βk(Sk), θk)}
8

4. If βk(Sk) ≥ 1− ε, then stop, else go to 2
After this procedure, we have a solution vector per class, Ek, consisting of the base-stock levels,
costs, fill rate, and target fill rate. We then enumerate over all different combinations of solutions
per class, θk, and look for the combination that gives the lowest inventory investment costs while
satisfying the aggregate fill rate target.
4. Numerical experiment
In order to find which classification gives the best result for problem (P), we apply our approach
and perform a numerical experiment using empirical data. In Section 4.1 we give an overview of
the data we use for our numerical experiment. We show that the D/P classifications gives near-
optimal results with only a few classes in Section 4.2. Then in Section 4.3 we show the impact of
the class sizes on the performance. Finally we introduce a greedy ABC algorithm that reduces the
calculation time significantly in Section 4.4.
4.1 Data
To apply our approach to design a generalized ABC classification we use data of spare parts for
the maintenance of Ground Support Equipment (GSE) at an airport. The GSE consists of a wide
range of vehicles consisting of passenger cars up to specialised equipment such as de-ice vehicles
used to remove ice off the wings of airplanes. Because of the large variety of GSE, the maintenance
is split up over multiple groups. For our numerical experiment we use two different data sets, where
each data set consists of spare parts usage for a different group of GSE, named set 1 and set 2
from now on. Set 1 consists of 5988 SKUs, whereas set 2 consists of 1092 SKUs. Table 1 gives an
overview of the characteristics of both data sets.
The ratio between slow, medium and fast moving SKUs is quite similar for both data sets. There
Table 1: Data characteristics
Data set 1 Data set 2
Demand Price (e ) Leadtime Demand Price (e ) Leadtime
per year (days) per year (days)
per SKU per SKU
Min 0.10 0.01 1.00 0.02 0.06 1.00
Average 8.53 78.61 5.97 6.97 201.32 4.82
Max 610.50 10,950.00 111.00 566.50 9,500.00 7.00
are many SKUs that are requested only up to three times, and the top 5% of most frequently used
SKUs contribute to over more than 60% of the total demand. For data set 1, over 90% of all SKUs
are delivered within 3 weeks, and for data set 2 about 40% of all SKUs have a lead time of 1 or 2
9

days, based on contracts with suppliers. For all the other SKUs of data set 2 the lead times are set
at 7 days.
4.2 Choosing the best classification criteria
In Table 2 we present our finding regarding the inventory investment costs for the different classifi-
cations for data set 1. To calculate the inventory investment for the system approach we applied the
algorithm as described in Section 2.4.2 of Van Houtum and Kranenburg (2015). Similar findings as
in Table 2 are also obtained for data set 2; see Appendix A. The costs shown are the costs when we
choose the best class sizes and target fill rates. The outcome of the system approach is the optimal
solution where each SKU has its own class and target fill rate. The results regarding the ADV are
in line with the results of Teunter et al. (2010): We clearly see that the ADV classification gives
very poor results. We did not show the findings for the ADV classification for 5 and 6 classes as
they do not give more insights. Even increasing the number of classes in the ADV classification
does not lead to large cost reduction. An explanation for this is that both fast moving SKUs as
well as expensive SKUs can be put in the same class of SKUs according to this criterion. However,
from the inventory investment cost perspective, we prefer to stock less expensive SKUs over expen-
sive SKUs, because expensive SKUs bring higher inventory investment costs. Moreover, it is more
interesting to stock fast moving SKUs over slow moving SKUs because the contribution to the the
aggregate fill rate of fast moving SKUs is larger.
The classification that leads to the lowest inventory investment costs is the D/P classification.
In the system approach, a “biggest bang for the buck” approach is applied (see Section 2.4.2 of
Van Houtum and Kranenburg, 2015); the stock of SKUs that give the largest contribution to the
aggregate fill rate (which is mainly influenced by the demand rate of each SKU) relative to the price
is increased until the aggregate fill rate target is met. The D/P classification captures this trade-off
between the contribution to the aggregate fill rate and costs very well, therefore the SKUs in the
same class will end up with similar fill rate targets as if we would apply a system approach. We find
that by applying the D/P classification with four classes, and setting the best class sizes and target
fill rates, the resulting inventory investment costs are within a few percent of the optimal solution.
The P&D classification is also able to capture this trade-off, although it does not directly capture
this trade-off for each SKU and that explains the slightly higher inventory investment costs.
When we look at the number of classes used for the D/P classifications, we clearly see that
when only three classes are considered, already a significant gain with respect to two classes can
be obtained. Whenever the number of classes is increased, the performance can only increase as
well because the same solution as with less classes is always possible. However, after four classes,
the increase in performance is only limited. As an increase in the number of classes makes it more
difficult and costly to control the inventory policy of each of the four classes, for our data sets having
four classes is sufficient to get most of the gains, while avoiding difficult and costly management of
the SKUs.
10

Table 2: Overall inventory investment costs for data set 1
Inventory investment costs Target aggregate fill rate
Classification Number of classes 80% 90% 97%
Annual Dollar Volume
2 e 36,905 e 39,891 e 42,472
3 e 32,926 e 38,128 e 42,346
4 e 32,887 e 38,073 e 42,159
Demand/Price
2 e 1,369 e 3,993 e 14,534
3 e 1,295 e 3,000 e 10,487
4 e 1,255 e 2,945 e 10,138
5 e 1,254 e 2,937 e 10,017
6 e 1,239 e 2,937 e 9,958
Price and Demand4 (2x2) e 1,618 e 3,632 e 12,441
9 (3x3) e 1,424 e 3,255 e 12,084
One class e 39,242 e 40,346 e 43,583
System approach e 1,154 e 2,894 e 9,871
4.3 The impact of class sizes on performance
When considering the size of each class, we would like to gain insights in the importance of choosing
the best sizes. As the D/P criterion gives the best overall results, we consider the impact of the
class sizes for this criterion only. There has not been much literature about the proper class sizes.
A common proposal is to have around 20% of the SKUs in class A, 30% in class B and 50% in class
C (Teunter et al., 2010). Based on our numerical experiment, our first key observation is that there
are large inventory investment costs differences when only changing the percentage of demand in
each class. In the best solutions found, there is always at least one class for which SKUs are not
stocked. This is always the class for which the value of D/P is the smallest, thus consisting of
very expensive slow moving SKUs. These SKUs have a very large impact on the total inventory
costs. Given the aggregate fill rate target, we know the fraction of demand that does not have to be
satisfied directly from stock on hand. Whenever the fraction of total demand in this class is larger
than the fraction of total demand that does not have to be satisfied from stock on hand directly,
it is impossible to find a feasible solution without stocking all SKUs in that class. We call this a
“forced presence” of stock for these SKUs. Therefore, we expect that the commonly used rule of
thumb, where the fraction of demand of this class of SKUs is set to 50% (see e.g. Teunter et al.,
2010), may lead to a forced presence of stock for these SKUs and thus a poor solution. Moreover,
we find that the fraction of demand in this class is always close to the maximum allowed fraction
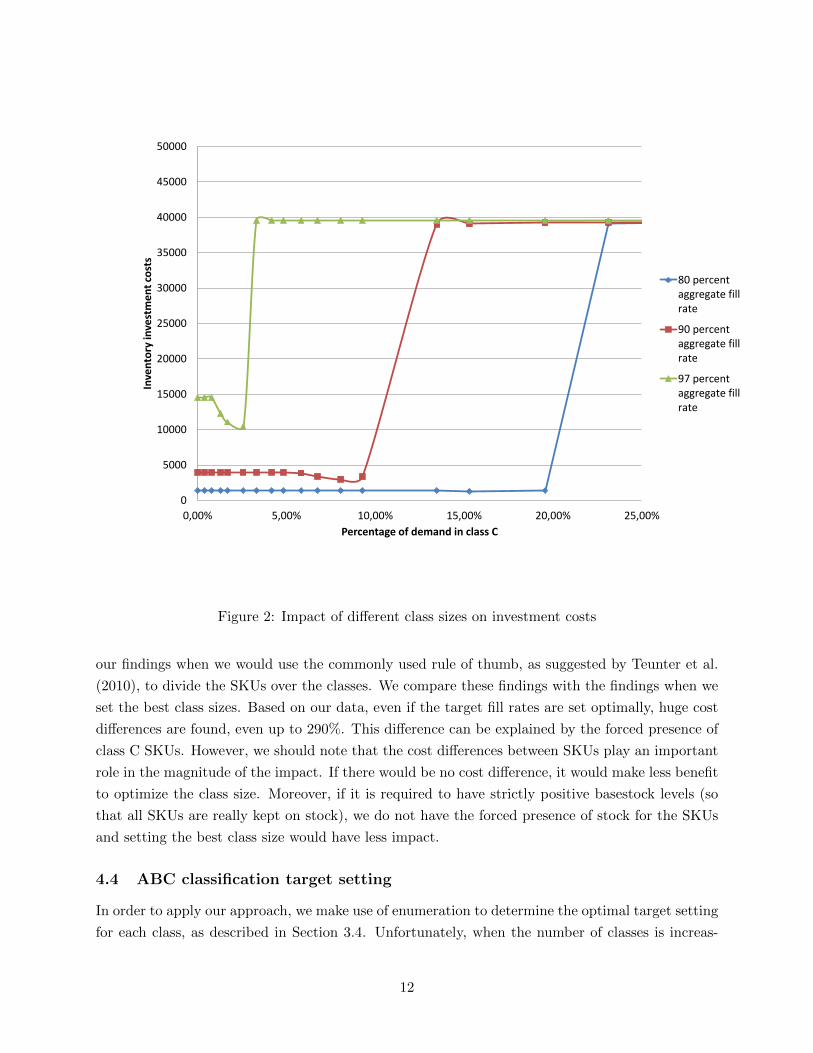
of demand that does not result in a forced presence of the SKUs. Figure 2 shows the fraction of
total demand in this class for the best solution, against the inventory investment costs for different
aggregate fill rate targets when there are three classes. Thus, for higher aggregate fill rate targets,
the total fraction of demand in this class is smaller than for lower targets. In Table 3 we present
11
0
5000
10000
15000
20000
25000
30000
35000
40000
45000
50000
0,00% 5,00% 10,00% 15,00% 20,00% 25,00%
Inve
nto
ry in
vest
me
nt
cost
s
Percentage of demand in class C
80 percentaggregate fillrate
90 percentaggregate fillrate
97 percentaggregate fillrate
Figure 2: Impact of different class sizes on investment costs
our findings when we would use the commonly used rule of thumb, as suggested by Teunter et al.
(2010), to divide the SKUs over the classes. We compare these findings with the findings when we
set the best class sizes. Based on our data, even if the target fill rates are set optimally, huge cost
differences are found, even up to 290%. This difference can be explained by the forced presence of
class C SKUs. However, we should note that the cost differences between SKUs play an important
role in the magnitude of the impact. If there would be no cost difference, it would make less benefit
to optimize the class size. Moreover, if it is required to have strictly positive basestock levels (so
that all SKUs are really kept on stock), we do not have the forced presence of stock for the SKUs
and setting the best class size would have less impact.
4.4 ABC classification target setting
In order to apply our approach, we make use of enumeration to determine the optimal target setting
for each class, as described in Section 3.4. Unfortunately, when the number of classes is increas-
12

Table 3: Inventory investment costs for data set 1 based on D/P classification
Number of classesTarget aggregate fill rate
80% 90% 97%
3 best e 1,295 e 3,000 e 10,487
3 rule of thumb e 3,234 e 3,532 e 39,691
4 best e 1,255 e 2,945 e 10,138
4 rule of thumb e 1,314 e 4,620 e 39,591
ing, the run time is increasing exponentially; for the D/P classification with five classes and an
aggregate fill rate target of 90% the run times are around 45 minutes. Although these calculations
are not done on a regular basis, companies may be interested in sensitivity analysis to see how
the total inventory investment costs change with respect to the aggregate fill rate in order to set
their goals. Therefore, we propose a greedy ABC algorithm to set the target fill rates for each class
based on getting the “biggest bang for the buck”. We increase θk with a small step size, θstep, for
the class where we get the biggest increase in aggregate fill rate per euro invested. This ratio, Γk,
is defined as the difference in aggregate fill rate after increasing θk, divided by the difference in
inventory investment costs. Because we do not have to calculate all solutions for each class and use
enumeration, this results in significantly reduced run times. The greedy ABC algorithm is as follows:
1. Set θk := 0 for all k ∈ KSi = 0 for all i ∈ IS = (S1, S2, . . . , S|I|)
Compute C(S) and β(S)
2. For all k ∈ K:
(a) For all i ∈ I:
If ki = k: vi = min{x|βi (x) ≥ θki + θstep, x ∈ N0
}− Si
else, vi = 0
(b) vk = (v1, v2, . . . , v|I|)
Γk := (β(S + vk))− β(Sk))/(C(S + vk)− C(S))
3. m :=arg max{Γk : k ∈ K}S := S + vk
θk :=min{βi(S) : i ∈ I, ki = k} for all k ∈ K
4. Compute C(S) and β(S);
If βk(S) ≥ βo, then stop, else go to 2
The run-times using this algorithm are around 0.15 seconds when there are two classes up to around
980 seconds for six classes on a Pentium Intel(R) Core(TM) i5-2520M CPU with 4GB memory. We
13

find that savings in calculation time of around factor 20 are obtained for five classes, and increasing
for larger numbers of classes. The increase in costs compared to the optimal target setting, over
all different targets per class with more than three classes, is less than two percent on average.
Thus for a larger number of classes or a larger number of SKUs, the greedy ABC algorithm can
significantly speed up the calculation time of our approach whereas the cost increase is limited,
especially compared to the cost savings when coming from no classification at all.
5. Conclusions and suggestions for further research
In this paper we looked at how to design a generalized ABC classification to minimize the inventory
investment costs by combining four different aspects: Classification criteria, number of classes, class
sizes, target fill rates per class.
We use a structured approach to combine these four aspects, and using empirical data we
show that it is possible to obtain a solution within a few percent of the optimal solution by using
D/P as classification criterion with only four classes. Having proper class sizes turns out to be
of great importance; using the rule of thumb as proposed by Teunter et al. (2010), may lead to
up to around 290% higher inventory investment costs. This difference is explained by the forced
presence of stock of expensive and slow moving SKUs. We propose a greedy ABC algorithm which
significantly reduces run times, whereas the cost increase of using this algorithm is only limited to
a few percent on average.
For further research it may be interesting to find simple rules to determine proper class sizes
instead of enumeration, which may further reduce the run time of our approach. Moreover, we used
a basestock policy for each class to manage the inventory, whereas it might be interesting to apply
different policies for different classes. Especially if transport costs are involved for each order. By
including these costs and batching for one or more of the classes, it would be interesting to see
whether the D/P classification would still perform best. Note that although we did not investigate
this problem, our methodology can still be applied as the difference lies only in the evaluation of
the performance and costs. Another interesting point for further research is the target setting.
We assumed that each SKU at least has to meet the target for its class. However, it might be
interesting to see how the performance of the different classifications would change if we would set
the basestock levels such that the difference with the target is minimized instead. This may also
reduce the impact of forced presence of stock.
Acknowledgements
The authors gratefully acknowledge the support of the Netherlands Organisation for Scientific
Research.
14
References
D.J. Armstrong. Sharpening inventory management. Harvard Business Review (December), pages 42–43,46–48,50–51,54,58, 1985.
M.Z. Babai, T. Ladhari, and I. Lajili. On the inventory performance of multi-criteria classification methods: empiricalinvestigation. International Journal of Production Research, 53:1:279–290, 2015.
A. Bacchetti and N. Saccani. Spare parts classification and demand forecasting for stock control: Investigating thegap between research and practice. Omega, 40:722–737, 2012.
A. Bacchetti, F. Plebani, N. Saccani, and A.A. Syntetos. Empirically-driven hierarchical classification of stock keepingunits. International Journal of Production Economics, 143:263–274, 2013.
G. Buxey. Reconstructing inventory management theory. International Journal of Operations and Production Man-agement, 26(9):996–1012, 2006.
C.W. Chu, G.S. Liang, and C.T. Liao. Controlling inventory by combining ABC analysis and fuzzy classification.Computers and Industrial Engineering, 55:841–851, 2008.
P. Duchessi, G.K. Tayi, and J.B. Levy. A conceptual approach for managing of spare parts. International Journal ofPhysical Distribution and Materials Management, 18(5):8–15, 1988.
S Eilon and R V Mallya. An extension of the classical ABC inventory control system. Omega, 13(5), 1985.
R. Ernst and M.A. Cohen. Operations related groups (orgs): A clustering procedure for production/inventory systems.Journal of Operations Management, 9(4):574–598, 1990.
B.E. Flores and D.C. Whybark. Implementing multiple criteria ABC analysis. Journal of Operations Management,7(1-2):79–85, 1987.
B.E. Flores, D.L. Olson, and V.K. Dorai. Management of multicriteria inventory classification. Mathematical andComputer Modelling, 16:71–82, 1992.
G. Graham. Distribution Inventory Management for the 1990s. Inventory Management Press, Richardson, Texas,1987.
S.M. Hatefi and S.A. Torabi. A common weight linear optimization approach for multicriteria abc inventory classifi-cation. Advances in Decision Sciences, 2015, 2015.
R.H. Hollier and P Vrat. A proposal for classification of inventory systems. Omega, 6:277–279, 1978.
F.R. Jacobs, R.B. Chase, and N.J. Aquilano. Operations and Supply Management. McGraw-Hill, New York, 2009.
E. Knod and R. Schonberger. Operations Management: Meeting Customer Demands. 7th ed. McGraw-Hill, NewYork, 2001.
C.B. Lee. Demand chain optimization: Pitfalls and key principles. NONSTOP’s “supply chain management seminar”,White Paper Series http://www.idii.com/wp/nonstop dco.pdf, 2002.
J Liu, X Liao, W Zhao, and N Yang. A classification approach based on the outranking model for multiple criteriaabc analysis. Omega, 2015.
S. Nahmias. Production and operations analysis. Irwin, Boston, 1997.
W.L. Ng. A simple classifier for multiple criteria abc analysis. European Journal of Operational Research, 177:344–353, 2005.
R. Ramanathan. ABC inventory classification with multiple-criteria using weighted linear optimization. Computersand Operations Research, 33(3):695–700, 2006.
C.C. Sherbrooke. METRIC: A multi-echelon technique for recoverable item control. Operations Research, 16(1):122–141, 1968.
15

C.C. Sherbrooke. VARI-METRIC: Improved approximations for multi-indenture, multi-echelon availability models.Operations Research, 34(2):311–319, 1986.
E.A. Silver, D.F. Pyke, and R. Peterson. Inventory management and production planning and scheduling. 3rd ed.John Wiley & Sons, 1998.
N. Slack, S. Chambers, and R. Johnston. Operations Management. Prentice Hall, Harlow, 2007.
W.J. Stevenson. Operations Management. McGraw-Hill, New York, 2007.
J.R. Stock and D. M. Lambert. Strategic Logistics Management. 4th ed. Irwin-McGraw Hill, New York, 2001.
R. Teunter, M.Z. Babai, and A.A. Syntetos. ABC Classification: Service levels and inventory costs. Production andOperations Management, 19:343–352, 2010.
U.W. Thonemann, A.O. Brown, and W.H. Hausmann. Easy quantification of improved spare parts inventory policies.Management Science, 48:1213–1225, 2002.
G. J. Van Houtum and A. A. Kranenburg. Spare Parts Inventory Control under System Availability Constraints.Springer, New York, 2015.
R.Q. Zhang, W.J. Hopp, and C. Supatgiat. Spreadsheet implementable inventory control for a distribution centre.Journal of Heuristics, 7(2):185–203, 2001.
P. Zhou and L. Fan. A note on multi-criteria ABC inventory classification using weighted linear optimization.European Journal of Operational Research, 182(3):1488 – 1491, 2007.
16

A. Inventory investment costs for data set 2
In this Section, we show the inventory investment costs as a result of our approach for data set 2,
for the different classification criteria. See Table 4 for the results.
Table 4: Overall inventory investment costs for data set 2
Inventory investment costs Target aggregate fillrate
Classification Number of classes 80% 90% 97%
Annual Dollar Volume
2 e 69,566 e 76,777 e 84,606
3 e 66,796 e 75,270 e 83,595
4 e 49,387 e 66,336 e 82,266
Demand/Price
2 e 1,457 e 5,393 e 27,082
3 e 1,062 e 3,684 e 17,152
4 e 1,062 e 3,499 e 16,576
5 e 1,062 e 3,475 e 16,489
6 e 1,062 e 3,473 e 16,479
Price and Demand4 (2x2) e 1,538 e 4,776 e 22,058
9 (3x3) e 1,266 e 4,243 e 19,493
One class e 76,052 e 76,810 e 84,612
System approach e 947 e 3,469 e 16,205
17

B. Percentage of total demand per class for data set 2
In Figure 3 the percentage of total demand per class for data set 2 is given in the case of four classes
with D/P as classification criteria. Class A consists of the SKUs which have the biggest value for
D/P.
Figure 3: Percentage of demand in each class for best settings with four classes
18

Nr. Year Title Author(s)494 2016 Design of a near-optimal generalized ABC classi�cation for a
multi-item inventory control problemE. Van WingerdenT. TanG.J. Van Houtum
493 2015 multi-item inventory control problem W.J.A. van HeeswijkM.R.K. MesJ.M.J Schutten
492 2015 Anticipatory Freight Selection in IntermodalLong-haul Round-trips
A.E. Pérez RiveraM.R.K. Mes
491 2015 Base-stock policies for lost-sales models: Aggregation and asymptotics
Joachim ArtsRetsef Levi Geert-Jan van HoutumBert Zwart
490 2015 The Time-Dependent Pro_table Pickup and DeliveryTraveling Salesman Problem with Time Windows
Peng SunSaid DabiaLucas P. VeelenturfTom Van Woensel
489 2015 A survey of maintenance and service logistics management: Classification and research agenda from a maritime sector perspective
Ayse Sena Eruguz, Tarkan Tan, Geert-Jan van Houtum
488 2015 Structuring AHP-based maintenance policy selection A.J.M. Goossens, R.J.I. Basten, J.M. Hummel, L.L.M. van der Wegen
487 2015 Pooling of critical, low-utilization resources with unavailability
Loe Schlicher, Marco Slikker, Geert-Jan van Houtum
486 2015 Business Process Management Technology for Discrete Manufacturing
Irene Vanderfeesten, Paul Grefen
485 2015 Towards an Architecture for Cooperative-Intelligent Transport System (C-ITS) Applications in the Netherlands
Marcel van Sambeek, Frank Ophelders, Tjerk Bijlsma, Borgert van der Kluit, Oktay Türetken, Rik Eshuis, Kostas Traganos, Paul Grefen
484 2015 Reasoning About Property Preservation in Adaptive Case Management
Rik Eshuis, Richard Hull, Mengfei Yi
483 2015 An Adaptive Large Neighborhood Search Heuristic for the Pickup and Delivery Problem with Time Windows and Scheduled Lines
Veaceslav Ghilas, Emrah Demir, Tom Van Woensel
482 2015 Inventory Dynamics in the Financial Crisis: An Empirical Analysis of Firm Responsiveness and its Effect on Financial Performance
Kai Hoberg, Maximiliano Udenio, Jan C. Fransoo
481 2015 The extended gate problem: Intermodal hub location with multiple actors
Yann Bouchery, Jan Fransoo, Marco Slikker
480 2015 Inventory Management with Two Demand Streams: A Maintenance Application
Rob J.I. Basten, Jennifer K. Ryan
479 2015 Optimal Design of Uptime-Guarantee Contracts Behzad Hezarkhani478 2015 Collaborative Replenishment in the Presence of
IntermediariesBehzad Hezarkhani, Marco Slikker, Tom Van Woensel
477 2015 Reference Architecture for Mobility-Related Services A reference architecture based on GET Service and SIMPLI-CITY Project architectures
A. Husak, M. Politis, V. Shah, R. Eshuis, P. Grefen
476 2015 A Multi-Item Approach to Repairable Stocking andExpediting in a Fluctuating Demand Environment
Joachim Arts
475 2015 An Adaptive Large Neighborhood Search Heuristic for the Share-a-Ride Problem
Baoxiang Li, Dmitry Krushinsky, Tom Van Woensel, Hajo A. Reijers
474 2015 An approximate dynamic programming approach to urban freight distribution with batch arrivals
Wouter van Heeswijk, Martijn Mes, Marco Schutten
473 2015 Dynamic Multi-period Freight Consolidation Arturo Pérez Rivera, Martijn Mes
Nr. Year Title Author(s)472 2015 Maintenance policy selection for ships: finding the most
important criteria and considerationsA.J.M. Goossens, R.J.I. Basten
471 2015 Using Twitter to Predict Sales: A Case Study Remco Dijkman, Panagiotis Ipeirotis, Freek Aertsen, Roy van Helden
470 2015 The Effect of Exceptions in Business Processes Remco Dijkman, Geoffrey van IJzendoorn, Oktay Türetken, Meint de Vries
469 2015 Business Model Prototyping for Intelligent Transport Systems. A Service-Dominant Approach
Konstantinos Traganos, Paul Grefen, Aafke den Hollander, Oktay Türetken, Rik Eshuis
468 2015 How suitable is the RePro technique for rethinking care processes?
Rob J.B. Vanwersch, Luise Pufahl, Irene Vanderfeesten, Jan Mendling, Hajo A. Reijers
467 2014 Where to exert abatement effort for sustainable operations considering supply chain interactions?
Tarkan Tan, Astrid Koomen
466 2014 An Exact Algorithm for the Vehicle Routing Problem with Time Windows and Shifts
Said Dabia, Stefan Ropke, Tom Van Woensel
465 2014 The RePro technique: a new, systematic technique for rethinking care processes
Rob J.B. Vanwersch, Luise Pufahl, Irene Vanderfeesten, Hajo A. Reijers
464 2014 Exploring maintenance policy selection using the Analytic Hierarchy Process: an application for naval ships
A.J.M. Goossens, R.J.I. Basten
463 2014 Allocating service parts in two-echelon networks at a utility company
D. van den Berg, M.C. van der Heijden, P.C. Schuur
462 2014 Freight consolidation in networks with transshipments W.J.A. van Heeswijk, M.R.K. Mes, J.M.J. Schutten, W.H.M. Zijm
461 2014 A Software Architecture for a Transportation Control Tower Anne Baumgrass, Remco Dijkman, Paul Grefen, Shaya Pourmirza, Hagen Völzer, Mathias Weske
460 2014 Small traditional retailers in emerging markets Youssef Boulaksil, Jan C. Fransoo, Edgar E. Blanco, Sallem Koubida
459 2014 Defining line replaceable units J.E. Parada Puig, R.J.I. Basten458 2014 Inventories and the Credit Crisis: A Chicken and Egg Situation Maximiliano Udenio, Vishal Gaur, Jan C.
Fransoo457 2014 An Exact Approach for the Pollution-Routing Problem Said Dabia, Emrah Demir, Tom Van
Woensel456 2014 Fleet readiness: stocking spare parts and high-tech assets Rob J.I. Basten, Joachim J. Arts
455 2014 Competitive Solutions for Cooperating Logistics Providers Behzad Hezarkhani, Marco Slikker, Tom Van Woensel
454 2014 Simulation Framework to Analyse Operating Room Release Mechanisms
Rimmert van der Kooij, Martijn Mes, Erwin Hans
453 2014 A Unified Race Algorithm for Offline Parameter Tuning Tim van Dijk, Martijn Mes, Marco Schutten, Joaquim Gromicho
452 2014 Cost, carbon emissions and modal shift in intermodal network design decisions
Yann Bouchery, Jan Fransoo
451 2014 Transportation Cost and CO2 Emissions in Location Decision Models
Josue C. Vélazquez-Martínez, Jan C. Fransoo, Edgar E. Blanco, Jaime Mora-Vargas
450 2014 Tracebook: A Dynamic Checklist Support System Shan Nan, Pieter Van Gorp, Hendrikus H.M. Korsten, Richard Vdovjak, Uzay Kaymak
449 2014 Intermodal hinterland network design with multiple actors Yann Bouchery, Jan Fransoo

Nr. Year Title Author(s)448 2014 The Share-a-Ride Problem: People and Parcels Sharing Taxis Baoxiang Li, Dmitry Krushinsky, Hajo
A. Reijers, Tom Van Woensel
447 2014 Stochastic inventory models for a single item at a single location
K.H. van Donselaar, R.A.C.M. Broekmeulen
446 2014 Optimal and heuristic repairable stocking and expediting in a fluctuating demand environment
Joachim Arts, Rob Basten, Geert-Jan van Houtum
445 2014 Connecting inventory control and repair shop control: a differentiated control structure for repairable spare parts
M.A. Driessen, W.D. Rustenburg, G.J. van Houtum, V.C.S. Wiers
444 2014 A survey on design and usage of Software Reference Architectures
Samuil Angelov, Jos Trienekens, Rob Kusters
443 2014 Extending and Adapting the Architecture Tradeoff Analysis Method for the Evaluation of Software Reference Architectures
Samuil Angelov, Jos J.M. Trienekens, Paul Grefen
442 2014 A multimodal network flow problem with product quality preservation, transshipment, and asset management
Maryam SteadieSeifi, Nico Dellaert, Tom Van Woensel
441 2013 Integrating passenger and freight transportation: Model formulation and insights
Veaceslav Ghilas, Emrah Demir, Tom Van Woensel
440 2013 The Price of Payment Delay K. van der Vliet, M.J. Reindorp, J.C. Fransoo
439 2013 On Characterization of the Core of Lane Covering Games via Dual Solutions
Behzad Hezarkhani, Marco Slikker, Tom van Woensel
438 2013 Destocking, the Bullwhip Effect, and the Credit Crisis: Empirical Modeling of Supply Chain Dynamics
Maximiliano Udenio, Jan C. Fransoo, Robert Peels
437 2013 Methodological support for business process redesign in healthcare: a systematic literature review
Rob J.B. Vanwersch, Khurram Shahzad, Irene Vanderfeesten, Kris Vanhaecht, Paul Grefen, Liliane Pintelon, Jan Mendling, Geofridus G. van Merode, Hajo A. Reijers
436 2013 Dynamics and equilibria under incremental horizontal differentiation on the Salop circle
B. Vermeulen, J.A. La Poutré, A.G. de Kok
435 2013 Analyzing Conformance to Clinical Protocols Involving Advanced Synchronizations
Hui Yan, Pieter Van Gorp, Uzay Kaymak, Xudong Lu, Richard Vdovjak, Hendriks H.M. Korsten, Huilong Duan
434 2013 Models for Ambulance Planning on the Strategic and the Tactical Level
J. Theresia van Essen, Johann L. Hurink, Stefan Nickel, Melanie Reuter
433 2013 Mode Allocation and Scheduling of Inland Container Transportation: A Case-Study in the Netherlands
Stefano Fazi, Tom Van Woensel, Jan C. Fransoo
432 2013 Socially responsible transportation and lot sizing: Insights from multiobjective optimization
Yann Bouchery, Asma Ghaffari, Zied Jemai, Jan Fransoo
431 2013 Inventory routing for dynamic waste collection Martijn Mes, Marco Schutten, Arturo Pérez Rivera
430 2013 Simulation and Logistics Optimization of an Integrated Emergency Post
N.J. Borgman, M.R.K. Mes, I.M.H. Vliegen, E.W. Hans
429 2013 Last Time Buy and Repair Decisions for Spare Parts S. Behfard, M.C. van der Heijden, A. Al Hanbali, W.H.M. Zijm
428 2013 A Review of Recent Research on Green Road Freight Transportation
Emrah Demir, Tolga Bektas, Gilbert Laporte
427 2013 Typology of Repair Shops for Maintenance Spare Parts M.A. Driessen, V.C.S. Wiers, G.J. van Houtum, W.D. Rustenburg
426 2013 A value network development model and implications for innovation and production network management
B. Vermeulen, A.G. de Kok
425 2013 Single Vehicle Routing with Stochastic Demands: Approximate Dynamic Programming
C. Zhang, N.P. Dellaert, L. Zhao, T. Van Woensel, D. Sever
424 2013 Influence of Spillback Effect on Dynamic Shortest Path Problems with Travel-Time-Dependent Network Disruptions
Derya Sever, Nico Dellaert, Tom Van Woensel, Ton de Kok

Nr. Year Title Author(s)423 2013 Dynamic Shortest Path Problem with Travel-Time-Dependent
Stochastic Disruptions: Hybrid Approximate Dynamic Programming Algorithms with a Clustering Approach
Derya Sever, Lei Zhao, Nico Dellaert, Tom Van Woensel, Ton de Kok
422 2013 System-oriented inventory models for spare parts R.J.I. Basten, G.J. van Houtum421 2013 Lost Sales Inventory Models with Batch Ordering and
Handling CostsT. Van Woensel, N. Erkip, A. Curseu, J.C. Fransoo
420 2013 Response speed and the bullwhip Maximiliano Udenio, Jan C. Fransoo, Eleni Vatamidou, Nico Dellaert
419 2013 Anticipatory Routing of Police Helicopters Rick van Urk, Martijn R.K. Mes, Erwin W. Hans
418 2013 Supply Chain Finance: research challenges ahead Kasper van der Vliet, Matthew J. Reindorp, Jan C. Fransoo
417 2013 Improving the Performance of Sorter Systems by Scheduling Inbound Containers
S.W.A. Haneyah, J.M.J. Schutten, K. Fikse
416 2013 Regional logistics land allocation policies: Stimulating spatial concentration of logistics firms
Frank P. van den Heuvel, Peter W. de Langen, Karel H. van Donselaar, Jan C. Fransoo
415 2013 The development of measures of process harmonization Heidi L. Romero, Remco M. Dijkman, Paul W.P.J. Grefen, Arjan van Weele
414 2013 BASE/X. Business Agility through Cross-Organizational Service Engineering. The Business and Service Design Approach developed in the CoProFind Project
Paul Grefen, Egon Lüftenegger, Eric van der Linden, Caren Weisleder
413 2013 The Time-Dependent Vehicle Routing Problem with Soft Time Windows and Stochastic Travel Times
Duygu Tas, Nico Dellaert, Tom van Woensel, Ton de Kok
412 2013 Clearing the Sky - Understanding SLA Elements in Cloud Computing
Marco Comuzzi, Guus Jacobs, Paul Grefen
411 2013 Approximations for the waiting time distribution in an M/G/c priority queue
A. Al Hanbali, E.M. Alvarez, M.C. van der Heijden
410 2013 To co-locate or not? Location decisions and logistics concentration areas
Frank P. van den Heuvel, Karel H. van Donselaar, Rob A.C.M. Broekmeulen, Jan C. Fransoo, Peter W. de Langen
409 2013 The Time-Dependent Pollution-Routing Problem Anna Franceschetti, Dorothée Honhon, Tom van Woensel, Tolga Bektas, Gilbert Laporte
408 2013 Scheduling the scheduling task: A time management perspective on scheduling
J.A. Larco, V. Wiers, J. Fransoo
407 2013 Clustering Clinical Departments for Wards to Achieve a Prespecified Blocking Probability
J. Theresia van Essen, Mark van Houdenhoven, Johann L. Hurink
406 2013 MyPHRMachines: Personal Health Desktops in the Cloud Pieter Van Gorp, Marco Comuzzi
405 2013 Maximising the Value of Supply Chain Finance Kasper van der Vliet, Matthew J. Reindorp, Jan C. Fransoo
404 2013 Reaching 50 million nanostores: retail distribution in emerging megacities
Edgar E. Blanco, Jan C. Fransoo
403 2013 A Vehicle Routing Problem with Flexible Time Windows Duygu Tas, Ola Jabali, Tom van Woensel
402 2013 The Service Dominant Business Model: A Service Focused Conceptualization
Egon Lüftenegger, Marco Comuzzi, Paul Grefen, Caren Weisleder
401 2013 Relationship between freight accessibility and logistics employment in US counties
Frank P. van den Heuvel, Liliana Rivera, Karel H. van Donselaar, Ad de Jong, Yossi Sheffi, Peter W. de Langen, Jan C. Fransoo

Nr. Year Title Author(s)400 2012 A Condition-Based Maintenance Policy for Multi-Component
Systems with a High Maintenance Setup CostQiushi Zhu, Hao Peng, Geert-Jan van Houtum
399 2012 A flexible iterative improvement heuristic to support creation of feasible shift rosters in self-rostering
E. van der Veen, J.L. Hurink, J.M.J. Schutten, S.T. Uijland
398 2012 Scheduled Service Network Design with Synchronization and Transshipment Constraints for Intermodal Container Transportation Networks
K. Sharypova, T.G. Crainic, T. van Woensel, J.C. Fransoo
397 2012 Destocking, the bullwhip effect, and the credit crisis: empirical modeling of supply chain dynamics
Maximiliano Udenio, Jan C. Fransoo, Robert Peels
396 2012 Vehicle routing with restricted loading capacities J. Gromicho, J.J. van Hoorn, A.L. Kok, J.M.J. Schutten
395 2012 Service differentiation through selective lateral transshipments
E.M. Alvarez, M.C. van der Heijden, I.M.H. Vliegen, W.H.M. Zijm
394 2012 A Generalized Simulation Model of an Integrated Emergency Post
Martijn Mes, Manon Bruens
393 2012 Business Process Technology and the Cloud: defining a Business Process Cloud Platform
Vassil Stoitsev, Paul Grefen
392 2012 Vehicle Routing with Soft Time Windows and Stochastic Travel Times: A Column Generation and Branch-and-Price Solution Approach
D. Tas, M. Gendreau, N. Dellaert, T. van Woensel, A.G. de Kok
391 2012 Improve OR-Schedule to Reduce Number of Required Beds J. Theresia van Essen, Joël M. Bosch, Erwin W. Hans, Mark van Houdenhoven, Johann L. Hurink
390 2012 How does development lead time affect performance over the ramp-up lifecycle? Evidence from the consumer electronics industry
Andreas Pufall, Jan C. Fransoo, Ad de Jong, A.G. (Ton) de Kok
389 2012 The Impact of Product Complexity on Ramp-Up Performance Andreas Pufall, Jan C. Fransoo, Ad de Jong, A.G. (Ton) de Kok
388 2012 Co-location synergies: specialized versus diverse logistics concentration areas
Frank P. van den Heuvel, Peter W. de Langen, Karel H. van Donselaar, Jan C. Fransoo
387 2012 Proximity matters: Synergies through co-location of logistics establishments
Frank P. van den Heuvel, Peter W. de Langen, Karel H. van Donselaar, Jan C. Fransoo
386 2012 Spatial concentration and location dynamics in logistics: the case of a Dutch province
Frank P. van den Heuvel, Peter W. de Langen, Karel H. van Donselaar, Jan C. Fransoo
385 2012 FNet: An Index for Advanced Business Process Querying Zhiqiang Yan, Remco Dijkman, Paul Grefen
384 2012 Defining Various Pathway Terms W.R. Dalinghaus, P.M.E. Van Gorp383 2012 The Service Dominant Strategy Canvas: Defining and
Visualizing a Service Dominant Strategy through the Traditional Strategic Lens
Egon Lüftenegger, Paul Grefen, Caren Weisleder
382 2012 A Stochastic Variable Size Bin Packing Problem with Time Constraints
Stefano Fazi, Tom van Woensel, Jan C. Fransoo
381 2012 Coordination and Analysis of Barge Container Hinterland Networks
K. Sharypova, T. van Woensel, J.C. Fransoo
380 2012 Proximity matters: Synergies through co-location of logistics establishments
Frank P. van den Heuvel, Peter W. de Langen, Karel H. van Donselaar, Jan C. Fransoo
379 2012 A literature review in process harmonization: a conceptual framework
Heidi Romero, Remco Dijkman, Paul Grefen, Arjan van Weele
378 2012 A Generic Material Flow Control Model for Two Different Industries
S.W.A. Haneyah, J.M.J. Schutten, P.C. Schuur, W.H.M. Zijm
Nr. Year Title Author(s)377 2012 Dynamic demand fulfillment in spare parts networks with
multiple customer classesH.G.H. Tiemessen, M. Fleischmann, G.J. van Houtum, J.A.E.E. van Nunen, E. Pratsini
376 2012 Paper has been replaced by wp 417 K. Fikse, S.W.A. Haneyah, J.M.J. Schutten
375 2012 Strategies for dynamic appointment making by container terminals
Albert Douma, Martijn Mes
374 2012 MyPHRMachines: Lifelong Personal Health Records in the Cloud
Pieter van Gorp, Marco Comuzzi
373 2012 Service differentiation in spare parts supply through dedicated stocks
E.M. Alvarez, M.C. van der Heijden, W.H.M. Zijm
372 2012 Spare parts inventory pooling: how to share the benefits? Frank Karsten, Rob Basten
371 2012 Condition based spare parts supply X. Lin, R.J.I. Basten, A.A. Kranenburg, G.J. van Houtum
370 2012 Using Simulation to Assess the Opportunities of Dynamic Waste Collection
Martijn Mes
369 2012 Aggregate overhaul and supply chain planning for rotables J. Arts, S.D. Flapper, K. Vernooij
368 2012 Operating Room Rescheduling J.T. van Essen, J.L. Hurink, W. Hartholt, B.J. van den Akker
367 2011 Switching Transport Modes to Meet Voluntary Carbon Emission Targets
Kristel M.R. Hoen, Tarkan Tan, Jan C. Fransoo, Geert-Jan van Houtum
366 2011 On two-echelon inventory systems with Poisson demand and lost sales
Elisa Alvarez, Matthieu van der Heijden
365 2011 Minimizing the Waiting Time for Emergency Surgery J.T. van Essen, E.W. Hans, J.L. Hurink, A. Oversberg
364 2012 Vehicle Routing Problem with Stochastic Travel Times Including Soft Time Windows and Service Costs
Duygu Tas, Nico Dellaert, Tom van Woensel, Ton de Kok
363 2011 A New Approximate Evaluation Method for Two-Echelon Inventory Systems with Emergency Shipments
Erhun Özkan, Geert-Jan van Houtum, Yasemin Serin
362 2011 Approximating Multi-Objective Time-Dependent Optimization Problems
Said Dabia, El-Ghazali Talbi, Tom Van Woensel, Ton de Kok
361 2011 Branch and Cut and Price for the Time Dependent Vehicle Routing Problem with Time Windows
Said Dabia, Stefan Röpke, Tom Van Woensel, Ton de Kok
360 2011 Analysis of an Assemble-to-Order System with Different Review Periods
A.G. Karaarslan, G.P. Kiesmüller, A.G. de Kok
359 2011 Interval Availability Analysis of a Two-Echelon, Multi-Item System
Ahmad Al Hanbali, Matthieu van der Heijden
358 2011 Carbon-Optimal and Carbon-Neutral Supply Chains Felipe Caro, Charles J. Corbett, Tarkan Tan, Rob Zuidwijk
357 2011 Generic Planning and Control of Automated Material Handling Systems: Practical Requirements Versus Existing Theory
Sameh Haneyah, Henk Zijm, Marco Schutten, Peter Schuur
356 2011 Last time buy decisions for products sold under warranty Matthieu van der Heijden, Bermawi Iskandar
355 2011 Spatial concentration and location dynamics in logistics: the case of a Dutch province
Frank P. van den Heuvel, Peter W. de Langen, Karel H. van Donselaar, Jan C. Fransoo
354 2011 Identification of Employment Concentration Areas Frank P. van den Heuvel, Peter W. de Langen, Karel H. van Donselaar, Jan C. Fransoo
353 2011 BPMN 2.0 Execution Semantics Formalized as Graph Rewrite Rules: extended version
Pieter van Gorp, Remco Dijkman
352 2011 Resource pooling and cost allocation among independent service providers
Frank Karsten, Marco Slikker, Geert-Jan van Houtum
Nr. Year Title Author(s)351 2011 A Framework for Business Innovation Directions E. Lüftenegger, S. Angelov, P. Grefen
350 2011 The Road to a Business Process Architecture: An Overview of Approaches and their Use
Remco Dijkman, Irene Vanderfeesten, Hajo A. Reijers
349 2011 Effect of carbon emission regulations on transport mode selection under stochastic demand
K.M.R. Hoen, T. Tan, J.C. Fransoo, G.J. van Houtum
348 2011 An improved MIP-based combinatorial approach for a multi-skill workforce scheduling problem
Murat Firat, Cor Hurkens
347 2011 An approximate approach for the joint problem of level of repair analysis and spare parts stocking
R.J.I. Basten, M.C. van der Heijden, J.M.J. Schutten
346 2011 Joint optimization of level of repair analysis and spare parts stocks
R.J.I. Basten, M.C. van der Heijden, J.M.J. Schutten
345 2011 Inventory control with manufacturing lead time flexibility Ton G. de Kok
344 2011 Analysis of resource pooling games via a new extension of the Erlang loss function
Frank Karsten, Marco Slikker, Geert-Jan van Houtum
343 2011 Vehicle refueling with limited resources Murat Firat, C.A.J. Hurkens, Gerhard J. Woeginger
342 2011 Optimal Inventory Policies with Non-stationary Supply Disruptions and Advance Supply Information
Bilge Atasoy, Refik Güllü, Tarkan Tan
341 2011 Redundancy Optimization for Critical Components in High-Availability Capital Goods
Kurtulus Baris Öner, Alan Scheller-Wolf, Geert-Jan van Houtum
340 2011 Making Decision Process Knowledge Explicit Using the Product Data Model
Razvan Petrusel, Irene Vanderfeesten, Cristina Claudia Dolean, Daniel Mican
339 2010 Analysis of a two-echelon inventory system with two supply modes
Joachim Arts, Gudrun Kiesmüller
338 2010 Analysis of the dial-a-ride problem of Hunsaker and Savelsbergh
Murat Firat, Gerhard J. Woeginger
335 2010 Attaining stability in multi-skill workforce scheduling Murat Firat, Cor Hurkens334 2010 Flexible Heuristics Miner (FHM) A.J.M.M. Weijters, J.T.S. Ribeiro333 2010 An exact approach for relating recovering surgical patient
workload to the master surgical scheduleP.T. Vanberkel, R.J. Boucherie, E.W. Hans, J.L. Hurink, W.A.M. van Lent, W.H. van Harten
332 2010 Efficiency evaluation for pooling resources in health care Peter T. Vanberkel, Richard J. Boucherie, Erwin W. Hans, Johann L. Hurink, Nelly Litvak
331 2010 The Effect of Workload Constraints in Mathematical Programming Models for Production Planning
M.M. Jansen, A.G. de Kok, I.J.B.F. Adan
330 2010 Using pipeline information in a multi-echelon spare parts inventory system
Christian Howard, Ingrid Reijnen, Johan Marklund, Tarkan Tan
329 2010 Reducing costs of repairable spare parts supply systems via dynamic scheduling
H.G.H. Tiemessen, G.J. van Houtum
328 2010 Identification of Employment Concentration and Specialization Areas: Theory and Application
Frank P. van den Heuvel, Peter W. de Langen, Karel H. van Donselaar, Jan C. Fransoo
327 2010 A combinatorial approach to multi-skill workforce scheduling M. Firat, C. Hurkens
326 2010 Stability in multi-skill workforce scheduling M. Firat, C. Hurkens, A. Laugier325 2010 Maintenance spare parts planning and control: A framework
for control and agenda for future researchM.A. Driessen, J.J. Arts, G.J. van Houtum, W.D. Rustenburg, B. Huisman
324 2010 Near-optimal heuristics to set base stock levels in a two-echelon distribution network
R.J.I. Basten, G.J. van Houtum
323 2010 Inventory reduction in spare part networks by selective throughput time reduction
M.C. van der Heijden, E.M. Alvarez, J.M.J. Schutten

Nr. Year Title Author(s)322 2010 The selective use of emergency shipments for service-
contract differentiationE.M. Alvarez, M.C. van der Heijden, W.H.M. Zijm
321 2010 Heuristics for Multi-Item Two-Echelon Spare Parts Inventory Control Problem with Batch Ordering in the Central Warehouse
Engin Topan, Z. Pelin Bayindir, Tarkan Tan
320 2010 Preventing or escaping the suppression mechanism: intervention conditions
Bob Walrave, Kim E. van Oorschot, A. Georges L. Romme
319 2010 Hospital admission planning to optimize major resources utilization under uncertainty
Nico Dellaert, Jully Jeunet
318 2010 Minimal Protocol Adaptors for Interacting Services R. Seguel, R. Eshuis, P. Grefen317 2010 Teaching Retail Operations in Business and Engineering
SchoolsTom Van Woensel, Marshall L. Fisher, Jan C. Fransoo
316 2010 Design for Availability: Creating Value for Manufacturers and Customers
Lydie P.M. Smets, Geert-Jan van Houtum, Fred Langerak
315 2010 Transforming Process Models: executable rewrite rules versus a formalized Java program
Pieter van Gorp, Rik Eshuis
314 2010 Working paper 314 is no longer available ----313 2010 A Dynamic Programming Approach to Multi-Objective Time-
Dependent Capacitated Single Vehicle Routing Problems with Time Windows
S. Dabia, T. van Woensel, A.G. de Kok
312 2010 Tales of a So(u)rcerer: Optimal Sourcing Decisions Under Alternative Capacitated Suppliers and General Cost Structures
Osman Alp, Tarkan Tan
311 2010 In-store replenishment procedures for perishable inventory in a retail environment with handling costs and storage constraints
R.A.C.M. Broekmeulen, C.H.M. Bakx
310 2010 The state of the art of innovation-driven business models in the financial services industry
E. Lüftenegger, S. Angelov, E. van der Linden, P. Grefen
309 2010 Design of Complex Architectures Using a Three Dimension Approach: the CrossWork Case
R. Seguel, P. Grefen, R. Eshuis
308 2010 Effect of carbon emission regulations on transport mode selection in supply chains
K.M.R. Hoen, T. Tan, J.C. Fransoo, G.J. van Houtum
307 2010 Interaction between intelligent agent strategies for real-time transportation planning
Martijn Mes, Matthieu van der Heijden, Peter Schuur
306 2010 Internal Slackening Scoring Methods Marco Slikker, Peter Borm, René van den Brink
305 2010 Vehicle Routing with Traffic Congestion and Drivers' Driving and Working Rules
A.L. Kok, E.W. Hans, J.M.J. Schutten, W.H.M. Zijm
304 2010 Practical extensions to the level of repair analysis R.J.I. Basten, M.C. van der Heijden, J.M.J. Schutten
303 2010 Ocean Container Transport: An Underestimated and Critical Link in Global Supply Chain Performance
Jan C. Fransoo, Chung-Yee Lee
302 2010 Capacity reservation and utilization for a manufacturer with uncertain capacity and demand
Y. Boulaksil; J.C. Fransoo; T. Tan
300 2009 Spare parts inventory pooling games F.J.P. Karsten; M. Slikker; G.J. van Houtum
299 2009 Capacity flexibility allocation in an outsourced supply chain with reservation
Y. Boulaksil, M. Grunow, J.C. Fransoo
298 2010 An optimal approach for the joint problem of level of repair analysis and spare parts stocking
R.J.I. Basten, M.C. van der Heijden, J.M.J. Schutten
297 2009 Responding to the Lehman Wave: Sales Forecasting and Supply Management during the Credit Crisis
Robert Peels, Maximiliano Udenio, Jan C. Fransoo, Marcel Wolfs, Tom Hendrikx
296 2009 An exact approach for relating recovering surgical patient workload to the master surgical schedule
Peter T. Vanberkel, Richard J. Boucherie, Erwin W. Hans, Johann L. Hurink, Wineke A.M. van Lent, Wim H. van Harten

Nr. Year Title Author(s)295 2009 An iterative method for the simultaneous optimization of
repair decisions and spare parts stocksR.J.I. Basten, M.C. van der Heijden, J.M.J. Schutten
294 2009 Fujaba hits the Wall(-e) Pieter van Gorp, Ruben Jubeh, Bernhard Grusie, Anne Keller
293 2009 Implementation of a Healthcare Process in Four Different Workflow Systems
R.S. Mans, W.M.P. van der Aalst, N.C. Russell, P.J.M. Bakker
292 2009 Business Process Model Repositories - Framework and Survey
Zhiqiang Yan, Remco Dijkman, Paul Grefen
291 2009 Efficient Optimization of the Dual-Index Policy Using Markov Chains
Joachim Arts, Marcel van Vuuren, Gudrun Kiesmuller
290 2009 Hierarchical Knowledge-Gradient for Sequential Sampling Martijn R.K. Mes; Warren B. Powell; Peter I. Frazier
289 2009 Analyzing combined vehicle routing and break scheduling from a distributed decision making perspective
C.M. Meyer; A.L. Kok; H. Kopfer; J.M.J. Schutten
288 2010 Lead time anticipation in Supply Chain Operations Planning Michiel Jansen; Ton G. de Kok; Jan C. Fransoo
287 2009 Inventory Models with Lateral Transshipments: A Review Colin Paterson; Gudrun Kiesmuller; Ruud Teunter; Kevin Glazebrook
286 2009 Efficiency evaluation for pooling resources in health care P.T. Vanberkel; R.J. Boucherie; E.W. Hans; J.L. Hurink; N. Litvak
285 2009 A Survey of Health Care Models that Encompass Multiple Departments
P.T. Vanberkel; R.J. Boucherie; E.W. Hans; J.L. Hurink; N. Litvak
284 2009 Supporting Process Control in Business Collaborations S. Angelov; K. Vidyasankar; J. Vonk; P. Grefen
283 2009 Inventory Control with Partial Batch Ordering O. Alp; W.T. Huh; T. Tan282 2009 Translating Safe Petri Nets to Statecharts in a Structure-
Preserving WayR. Eshuis
281 2009 The link between product data model and process model J.J.C.L. Vogelaar; H.A. Reijers
280 2009 Inventory planning for spare parts networks with delivery time requirements
I.C. Reijnen; T. Tan; G.J. van Houtum
279 2009 Co-Evolution of Demand and Supply under Competition B. Vermeulen; A.G. de Kok
278 2010 Toward Meso-level Product-Market Network Indices for Strategic Product Selection and (Re)Design Guidelines over the Product Life-Cycle
B. Vermeulen, A.G. de Kok
277 2009 An Efficient Method to Construct Minimal Protocol Adaptors R. Seguel, R. Eshuis, P. Grefen
276 2009 Coordinating Supply Chains: a Bilevel Programming Approach Ton G. de Kok, Gabriella Muratore
275 2009 Inventory redistribution for fashion products under demand parameter update
G.P. Kiesmuller, S. Minner
274 2009 Comparing Markov chains: Combining aggregation and precedence relations applied to sets of states
A. Busic, I.M.H. Vliegen, A. Scheller-Wolf
273 2009 Separate tools or tool kits: an exploratory study of engineers' preferences
I.M.H. Vliegen, P.A.M. Kleingeld, G.J. van Houtum
272 2009 An Exact Solution Procedure for Multi-Item Two-Echelon Spare Parts Inventory Control Problem with Batch Ordering
271 2009 Distributed Decision Making in Combined Vehicle Routing and Break Scheduling
C.M. Meyer, H. Kopfer, A.L. Kok, M. Schutten
270 2009 Dynamic Programming Algorithm for the Vehicle Routing Problem with Time Windows and EC Social Legislation
A.L. Kok, C.M. Meyer, H. Kopfer, J.M.J. Schutten

Nr. Year Title Author(s)269 2009 Similarity of Business Process Models: Metics and Evaluation Remco Dijkman, Marlon Dumas,
Boudewijn van Dongen, Reina Kaarik, Jan Mendling
267 2009 Vehicle routing under time-dependent travel times: the impact of congestion avoidance
A.L. Kok, E.W. Hans, J.M.J. Schutten
266 2009 Restricted dynamic programming: a flexible framework for solving realistic VRPs
J. Gromicho; J.J. van Hoorn; A.L. Kok; J.M.J. Schutten;
Working Papers published before 2009 see: http://beta.ieis.tue.nl