Embed Size (px)
Citation preview

University of IowaIowa Research Online
Theses and Dissertations
Spring 2011
Design of a bioinformatics system for insertionalmutagenesis analysis and its application to theSleeping Beauty transposon systemKishore NannapaneniUniversity of Iowa
Copyright 2011 Kishore Nannapaneni
This dissertation is available at Iowa Research Online: https://ir.uiowa.edu/etd/1039
Follow this and additional works at: https://ir.uiowa.edu/etd
Part of the Biomedical Engineering and Bioengineering Commons
Recommended CitationNannapaneni, Kishore. "Design of a bioinformatics system for insertional mutagenesis analysis and its application to the SleepingBeauty transposon system." PhD (Doctor of Philosophy) thesis, University of Iowa, 2011.https://doi.org/10.17077/etd.y1yjxbwl.

DESIGN OF A BIOINFORMATICS SYSTEM FOR INSERTIONAL MUTAGENESIS
ANALYSIS AND ITS APPLICATION TO THE SLEEPING BEAUTY TRANSPOSON
SYSTEM
by
Kishore Nannapaneni
An Abstract
Of a thesis submitted in partial fulfillment of the requirements for the Doctor of
Philosophy degree in Biomedical Engineering in the Graduate College of
The University of Iowa
May 2011
Thesis Supervisor: Associate Professor Todd E. Scheetz

1
ABSTRACT
Cancer is one of the leading causes of death in the world. Approximately one fifth
of deaths in the western industrial nations are caused by cancer. Every year several
hundreds of thousands of new patients are diagnosed with cancer and several thousands
die of cancer. Scientists have been conducting research from different angles for effective
prevention, diagnosis and cure of Cancer.
Ever since the genetic basis of cancer has been demonstrated, a race has been
ignited globally in the scientific community to identify potential oncogenes and tumor
suppressor genes. The genetics of the tumors are complex in nature where combinations
of loss of function mutations in tumor suppressor genes and gain of function mutations in
oncogenes cause cancers. The identification of these genes is extremely important to
devise effective therapies to treat cancer. Insertional mutagenesis systems such as
sleeping beauty provide an elegant way to identify genes involved in cancers. More and
more researchers are adopting the Sleeping Beauty system for their insertional
mutagenesis experiments to identify potential cancer causing genes. Given next
generation sequence technologies and the vast amount of data they generate requires
novel bioinformatics techniques to process, analyze and meaningfully interpret the data.
The goal of this project is to develop a publicly available system for researchers
worldwide to analyze the sequence data resulting from insertional mutagenesis
experiments.
This system will identify and annotate all the insertion sites resulting from the
sequencing of the experiment. It will also identify the Common Insertion sites (CIS) and
genes with Common Insertion Sites (gCIS). The Common Insertion Sites being the

2
regions in the genome that are targeted more often than by chance. The whole system is
accessible as a web application for use by researchers worldwide performing insertional
mutagenesis experiments.
Abstract Approved: __________________________________ Thesis Supervisor
___________________________________ Title and Department
___________________________________ Date

1
DESIGN OF A BIOINFORMATICS SYSTEM FOR INSERTIONAL MUTAGENESIS
ANALYSIS AND ITS APPLICATION TO THE SLEEPING BEAUTY TRANSPOSON
SYSTEM
by
Kishore Nannapaneni
A thesis submitted in partial fulfillment of the requirements for the Doctor of
Philosophy degree in Biomedical Engineering in the Graduate College of
The University of Iowa
May 2011
Thesis Supervisor: Associate Professor Todd E. Scheetz

2
Copyright by
KISHORE NANNAPANENI
2011
All Rights Reserved

Graduate College The University of Iowa
Iowa City, Iowa
CERTIFICATE OF APPROVAL
_______________________
PH.D THESIS
_______________
This is to certify that the Ph.D. thesis of
Kishore Nannapaneni
has been approved by the Examining Committee for the thesis requirement for the Doctor of Philosophy degree in Biomedical Engineering at the May 2011 graduation.
Thesis Committee: ___________________________________ Todd E. Scheetz, Thesis Supervisor
___________________________________ Thomas L. Casavant
___________________________________ Terry A. Braun
___________________________________ Adam J. Dupuy
___________________________________ Paul B. McCray

ii
2
ABSTRACT
Cancer is one of the leading causes of death in the world. Approximately one fifth
of deaths in the western industrial nations are caused by cancer. Every year several
hundreds of thousands of new patients are diagnosed with cancer and several thousands
die of cancer. Scientists have been conducting research from different angles for effective
prevention, diagnosis and cure of Cancer.
Ever since the genetic basis of cancer has been demonstrated, a race has been
ignited globally in the scientific community to identify potential oncogenes and tumor
suppressor genes. The genetics of the tumors are complex in nature where combinations
of loss of function mutations in tumor suppressor genes and gain of function mutations in
oncogenes cause cancers. The identification of these genes is extremely important to
devise effective therapies to treat cancer. Insertional mutagenesis systems such as
sleeping beauty provide an elegant way to identify genes involved in cancers. More and
more researchers are adopting the Sleeping Beauty system for their insertional
mutagenesis experiments to identify potential cancer causing genes. Given next
generation sequence technologies and the vast amount of data they generate requires
novel bioinformatics techniques to process, analyze and meaningfully interpret the data.
The goal of this project is to develop a publicly available system for researchers
worldwide to analyze the sequence data resulting from insertional mutagenesis
experiments.
This system will identify and annotate all the insertion sites resulting from the
sequencing of the experiment. It will also identify the Common Insertion sites (CIS) and
genes with Common Insertion Sites (gCIS). The Common Insertion Sites being the

iii
3
regions in the genome that are targeted more often than by chance. The whole system is
accessible as a web application for use by researchers worldwide performing insertional
mutagenesis experiments.

iv
4
TABLE OF CONTENTS
LIST OF TABLES ...…………….……………………………………………………….vi
LIST OF FIGURES ……………………………………………………………………..vii
CHAPTER 1 INTRODUCTION...................................................................................... 1
CHAPTER 2 BACKGROUND........................................................................................ 3
Cancer and its complexity ................................................................................ 3 Cancer development......................................................................................... 3 Classification of cancer-associated genes ........................................................ 5 Complexity of cancer ....................................................................................... 6 Current research in cancer genetics.................................................................. 7 Experimental models of cancer ........................................................................ 8 Sleeping Beauty mediated mutagenesis ......................................................... 11 Analysis of insertional mutagenesis experiments .......................................... 14
Specificity ............................................................................................... 14 Local hopping ......................................................................................... 14 Clonality.................................................................................................. 15 Common Insertion Sites (CISs) .............................................................. 15 gene centric Common Insertion Sites(gCIS): ......................................... 16 Need for sequencing depth...................................................................... 16
CHAPTER 3 APPROACH ............................................................................................ 17
System design................................................................................................. 17
CHAPTER 4 METHODS .............................................................................................. 19
Input data........................................................................................................ 19 Sequence analysis........................................................................................... 21 Annotation...................................................................................................... 24 Donor chromosomes ...................................................................................... 25 Clonality ......................................................................................................... 26 Common Insertion Sites (CIS) ....................................................................... 27 gene centric Common Insertion Sites (gCIS)................................................. 27 IAS Website ................................................................................................... 28
CHAPTER 5 RESULTS ................................................................................................ 29
Resulting output files of an analysis by IAS.................................................. 31
Annotation file ........................................................................................ 32

v
5
Common Insertion Sites (CIS) file.......................................................... 33 gene-centric Common Insertion Sites (gCIS) file................................... 33
Support for analyzing SB experiments from multiple species....................... 33 Experimental results....................................................................................... 33
Detailed analysis of the lymphoma dataset............................................. 34 Colorectal cancers ................................................................................... 39 Medulloblastomas and associated metastatic spine tumors .................... 40 Skin and Liver tumors............................................................................. 41
CHAPTER 6 DISCUSSION .......................................................................................... 43
Barcode design ............................................................................................... 43 Removing the flanking sequences of the genomic junction fragment ........... 44 Local hopping................................................................................................. 45 Standard annotations ...................................................................................... 46 Comparison of CIS identification strategies .................................................. 47 General utility................................................................................................. 47 Beyond 2nd generations sequencing technologies .......................................... 48
CHAPTER 7 FUTURE WORK ..................................................................................... 52
APPENDIX ...................................................................................................................... 56
REFERENCES.................................................................................................................. 85

vi
6
LIST OF TABLES
Table 1. Summary of experiments analyzed using IAS .................................................... 34
Table 2. The summary of results from the analysis of Vav, Lck and CD4 models of Lymphoma at different stages of the analysis..................................................... 35
Table 3. Comparison of different sequencing platforms based on the read length and the number of sequences they generate and the run costs............................ 48
Table A1. Common Insertion Sites (CIS) resulting from the Vav model of Lymhoma in mice............................................................................................. 56
Table A2. Common Insertion Sites (CIS) resulting from the Lck model of Lymphoma in mice. .......................................................................................... 57
Table A3. Common Insertion Sites (CIS) resulting from the CD4 model of Lymphoma in mice. .......................................................................................... 58
Table A4. gene centric Common Insertion Sites (gCIS) resulting from the Vav model of Lymphoma in mice............................................................................ 60
Table A5. gene centric Common Insertion Sites (gCIS) resulting from the Lck model of Lymphoma in mice............................................................................ 62
Table A6. gene centric Common Insertion Sites (gCIS) resulting from the CD4 model of Lymphoma in mice............................................................................ 64
Table A7. The table below illustrates the gene pair and the p-value of the significance of the interaction for the Vav model of lymphoma in mice ......... 69
Table A8. The table below illustrates the gene pair and the p-value of the significance of the interaction for the Lck model of lymphoma in mice ......... 69
Table A9. The table below illustrates the gene pair and the p-value of the significance of the interaction for the CD4 model of lymphoma in mice ........ 69
Table A10. Common Insertion Sites (CIS) resulting from the Colorectal cancer dataset (Starr et al).......................................................................................... 70
Table A11. gene centric Common Insertion Sites (gCIS) resulting from the Colorectal cancer dataset(Starr et al) ............................................................. 73
Table A12. Common Insertion Sites (CIS) resulting from the Liver tumor dataset. ........ 83
Table A13. gene centric Common Insertion Sites (gCIS) resulting from the Liver tumor dataset .................................................................................................. 83
Table A14. Common Insertion Sites (CIS) resulting from the Skin cancer dataset.......... 84
Table A15. gene centric Common Insertion Sites (gCIS) resulting from the Skin cancer dataset. ................................................................................................ 84

vii
7
LIST OF FIGURES
Figure 1. Structure of Sleeping Beauty Transposon System adapted from Dupuy et al ....................................................................................................................... 12
Figure 2. In the first two transcripts Sleeping Beauty drives the expression of the gene and in the last two transcripts it disrupts the transcript. This figure is adapted from Dupuy et al (Dupuy et al., 2006). ........................................... 13
Figure 3. System diagram.................................................................................................. 18
Figure 4. Sample sequence file.......................................................................................... 19
Figure 5. Example barcode file ......................................................................................... 20
Figure 6. Sequence structure ............................................................................................. 21
Figure 7. Sequence associated with tumor 472-4T ........................................................... 22
Figure 8. Sequences associated with tumor 472-4T after removing the inverted repeat sequence and the adaptor sequence ....................................................... 23
Figure 9. The annotation of genomic junction fragments from Figure 8 .......................... 25
Figure 10. IAS login Page ................................................................................................. 29
Figure 11. IAS page where the title of the Experiment, the host organism and the barcode and the sequence file are uploaded to the IAS server....................... 30
Figure 12. Screen shot of the listing of all the input and the results on the My Integrations page on the IAS website............................................................. 32
Figure 13. Pathway observed in Vav models of Lymphomas in mice.............................. 36
Figure 14. Pathway observed in Lck models of Lymphomas in mice .............................. 37
Figure 15. Pathway observed in CD4 models of Lymphomas in mice ............................. 40
Figure 16. The extent of overlap between CIS. gCIS identified by IAS and CIS’s identified by method specified in Starr et al .................................................. 41

1
CHAPTER 1
INTRODUCTION
Insertional mutagenesis has been increasingly being used as a platform to identify
potential disease causing genes. Researchers use insertional mutagens such as
retroviruses and transposable elements to cause mutations. An essential feature of
insertional mutagenesis, is that the inserted elements provide sufficient unique sequence
to allow them to be molecularly isolated – allowing identification of the affected loci
(Collier, Carlson, Ravimohan, Dupuy, & Largaespada, 2005). Biospecimens are selected
based upon phenotype, and the genomic locus of the insertion is extracted and sequenced.
Such experiments provide an association between the selected phenotype and the
locus/gene at which the insertion occurred. Insertional mutagenesis is increasingly
popular in the cancer research community, in which researchers are using them for
forward genetic screens to identify cancer-causing genes (Dupuy, Jenkins, & Copeland,
2006).
The Sleeping Beauty transposon system is one such platform for insertional
mutagenesis, and is the foundation upon which this thesis was developed. Sleeping
Beauty can be activated in a tissue specific manner in the somatic cells of the host
organism (Dupuy et al., 2006). Tumors are harvested, from which genomic DNA is
extracted and sequenced. Insertional mutagenesis experiments typically result in
hundreds of thousands to millions of sequences, and therefore require efficient
computational techniques for their analysis. With the advances in next generation
sequencing technologies the number of reads per run is expected to reach billions in the
future.
Investigators want to know the location of these integrations in the host genome.
Integrations required for tumor development and progression (driver mutations) will be
clonally selected throughout all of the cells in the tumor (Vrieze et al, In preparation).

2
However, random integrations (passenger mutations) will also be frequently observed, as
these are independently accumulating in the cells. Thus thousands of integrations may be
observed from each tumor, requiring differentiation between the (causative) driver
mutations and the (random) passenger mutations.
The scientific community using transposon-based insertional mutagenesis screens
to identify cancer-causing genes is growing and is expected to continue to grow. The
Sleeping Beauty system is especially appealing given its various advantages over
retroviruses and other transposons, which are described in detail in the “Background”
chapter of this dissertation.
Given the rising number of researchers using the Sleeping Beauty system as
forward genetic screens to identify cancer causing genes, and the enormous amounts of
sequence data the experiments generate, necessitates the design and development of
efficient computational algorithms and techniques for their analysis. Such a bioinformatic
system must be able to identify the location of insertions in the host organism and
subsequently identify the region(s) or gene(s) that are causally involved. The system
should be available to researchers worldwide for the analysis of their insertional
mutagenesis sequence data.
Integration analysis system (IAS) is a bioinformatics system that is designed,
developed and made available to the research community using insertional mutagenesis
to identify cancer-causing genes via a web application. IAS not only identifies the
location of the integration events in the host genome but also analyzes these integration
sites for potential interesting loci and genes that could play a causal role in cancer.
Results of some the analyses using IAS are presented in the “Results” section, and
enhancements to the design of the system given changes in the experimental design or
sequencing platform are presented in the “Discussion” and “Future work” of this thesis.

3
CHAPTER 2
BACKGROUND
Cancer and its complexity
Cancer is a term for diseases in which abnormal cells divide without control.
Cancer cells often invade nearby tissues and can spread via the bloodstream and
lymphatic system to other parts of the body. Cancers are classified according to the tissue
and cell type from which they arise (Schulz, 2007). The abnormal growth, invasiveness
and metastasis are the primary characteristics of cancer (Hanahan & Weinberg, 2000).
Since the genetic makeup varies only moderately between individuals from
different parts of the world, the varying incidences of cancer over time and geographical
locations can largely be attributed to environmental factors. These exogenous factors are
typically assorted into the following three classes: chemical, physical and biological
carcinogens. An individual’s risk of cancer also depends on an individuals tolerance to
these environmental factors based on their genetic makeup. Endogenous processes such
as DNA replication, chronic inflammation and metabolic processes involving the creation
of reactive oxygen species can also increase the likelihood of cancer progression by
acting in cooperation with the exogenous carcinogens (Schulz, 2007).
Cancer development
Mutations in either oncogenes or tumor suppressor genes are believed to be
essential for cancer initiation. Oncogenes operate in a dominant fashion, where a
mutation in a single copy of the gene is sufficient for cancer initiation. In contrast, tumor
suppressor genes typically operate in a recessive fashion in which both the copies of the
gene must be inactivated for cancer initiation (Schulz, 2007). Studies indicate that
mutations in a single oncogene or tumor suppressor are insufficient to cause a cancer.

4
Instead, cancer initiation thought to require at least 4 or 5 successive mutations in a
significantly important pathway (Pedraza-Farina, 2006).
Initiation is followed by tumor progression. Some tumors grow rapidly, and some
slowly. Tumor initiation involves dysregulation of the natural processes that regulate cell
growth (Pedraza-Farina, 2006). In contrast, the process of tumor progression modifies the
cell and its environment to allow continued tumor growth. One such example for solid
tumors is the need to increase blood-flow to the local environment, often involving the
growth of new blood vessels. In addition, different tumors may have radically differing
lethality. They are classified into various grades from low to high based on a set of
physical markers. High-grade tumors are more malignant in nature and therefore tend to
have more detrimental outcomes in terms of cancer progression. In contrast, low-grade
tumors are early lesions, which may progress to more malignant and invasive high-grade
tumors. Understanding the set of sequential mutations and/or disruptions of pathways that
can transform a low grade tumor to a high grade tumor is extremely crucial for cancer
containment and therapy(Pedraza-Farina, 2006).
Tumors often metastasize. In metastasis the cancerous cells not only grow
uninhibited in the tissue of origin but also invade and proliferate to other tissues. Some
normal physiological processes (e.g., wound healing) involve cell proliferation. These
regulatory processes are either deactivated or lose function during invasion and
metastasis (Pedraza-Farina, 2006). Several families of genes are involved in cell
proliferation, including: integrins, intracellular matrix degrading enzymes, cell-cell
adhesion molecules and signaling pathways. Loss of intended function of these genes or
their involved pathways can lead to invasion and metastasis. Studies suggest that at least
four genes in such critical pathways have to be disturbed for cancer metastasis (Pedraza-
Farina, 2006).

5
Classification of cancer-associated genes
Genes may have differing effects within the development and progression of
cancer. The first are oncogenes - these are genes that perform normal activities in the cell.
In their pre-cancerous form, they are referred to as proto-oncogenes, and when mutated
become oncogenes (Schulz, 2007). If a mutation is acquired by the proto-oncogene by
any of the above stated carcinogens the gene may be turned on or off in a way that’s
harmful to the cell and causes cancer. Many oncogenes result from a dominant negative
action – either through the acquisition of a new function, or through inappropriate
expression. Thus, often only a single copy of the oncogene must be mutated (rather than
both copies) (Schulz, 2007). Although there are known cases of inherited mutations in
oncogenes, they are mostly acquired via de novo mutations (http://www.cancer.org).
The other category of cancer-associated genes is the tumor suppressor genes.
These are genes that usually oversee activities like DNA repair, cell division and
programmed cell death. Commonly, the functions of these genes are such that a single
copy is sufficient for proper function. Thus, both copies are typically mutated in cancers
(Schulz, 2007). As with the oncogenes, there are cases of inherited mutations in these
genes but most are acquired (http://www.cancer.org).
The mutations may also be classified as “driver” or “passenger”. Driver mutations
are mutations that have a causative role in cancer. These may occur in both oncogenes
and tumor suppressors. In contrast, passenger mutations do not have a role in the
initiation of cancer. Instead these are the mutations that occur by chance, are in the same
cell(s) serving as the initial cancer progenitor. These mutations have no selective
advantage, are obtained by chance, and are present through subsequent cell division and
expansion (Wood et al., 2008).

6
Complexity of cancer
Cancer is a multi-factorial and complex condition in which multiple genetic and
environmental factors jointly cause cancer. Cancers typically involves multiple
aberrations in a cell’s genome. These aberrations may take many forms from changes in a
single nucleotide to copy number changes that alter the structure or number of one or
many genes, to structural abnormalities that result in the reorganization of a region of a
chromosome (inversions) or even the rearrangements of entire chromosomes
(translocations). Extreme cases of cancerous cells often have increased copy number of
multiple chromosomes. Most cancer-causing mutations are somatic (i.e. not found in the
parents) although there can be inherited mutations which increase the risk of cancer
susceptibility. Inherited mutations are rare and a person’s genotype only slightly affects
the initiation or progression of cancer. Other factors such as epigenetics and mutations
during fetal development can also cause cancer (Schulz, 2007).
The single base changes, insertions and deletions chromosomal translocations and
inversions give rise faulty proteins by either reducing the function of a tumor suppressor
gene or adding functionality to the proto-oncogene. Both oncogenes and tumor
suppressor genes are observed consistently in cancer cells. The varying number of
chromosomes: if there multiple copies of a chromosome it over expresses some of its
genes like wise if there are few or no copies of the chromosome some of genes are lost or
under expressed (Schulz, 2007).
These genetic alterations occur in varying magnitudes in various types of cancers.
Some cancer might have just point mutations while others may have extreme
chromosomal abnormalities. The complexity of cancer is further increased by epigenetic
changes that also may alter the risk of developing a tumor (Schulz, 2007).

7
Current research in cancer genetics
Research has been conducted from various fronts to understand the processes
involved in cancer initiation and progression, and to distinguish different categories of
tumors. Two primary goals underlie these efforts: to understand the cause of cancer and
eventually cure/prevent it from occurring, and to better treat those patients that are
already victims of cancer. Multiple, genome-wide approaches have been employed
including assessment of gene expression, high-density genotyping, genome sequencing,
screens for epigenetic patterns of methylation, copy number changes. As an example,
expression microarrays provide a quantitative snapshot of expression on a genomic scale
(Slonim & Yanai, 2009). A common strategy with this data is to utilize unsupervised
learning methods (such as Class Discovery) to determine the patterns of gene expression
that are associated with subclasses or a particular class of cancer. All the samples are
used without any prejudiced assumptions. The unsupervised clustering algorithms
generate dendrograms in which the samples are clustered in a hierarchical fashion on one
axis and the genes themselves on the other axis. Such unsupervised learning can also be
used to discover new classes of cancer based on the expression signature. Examples of
unsupervised learning algorithms used in analysis of microarrays include Hierarchical
clustering, Self Organizing maps, k-means clustering and principal component analysis
(Matros, Wang, Richardson, & Iglehart, 2004).
Supervised learning is used for class prediction where the underlying algorithms
identifies unique pattern of gene expression from known tissue samples (e.g. tumor,
normal or metastasis or response to stimuli or drugs) and then can predict the class of the
unknown tissue sample based on its expression signature. Examples of supervised
learning algorithms used in the analysis of microarrays include artificial neural networks,
support vector machines, k-nearest neighbors and decision trees (Matros et al., 2004).
Cancer tissues often exhibit aneuploidy – an abnormal number of chromosomes.
High copy number for gene EFGR was observed in non-small cell lung cancer and is

8
associated to efficacy of drug getfitinib in treating those tumors (Cappuzzo et al., 2005).
The most common technology used to detect copy number changes are genome-wide,
high-density arrays. These work based upon hybridization intensity of locus-specific
probes, such as in comparative genome hybridization (CGH). Easton et al used arrays
interrogating 227876 SNP’s to identify risk-associated genes in breast cancer. They have
identified four potentially causal genes in this study (Easton et al., 2007). Li et al used
ArrayCGH to assess the role of miRNA’s in diffuse large B-cell lymphoma (DLBCL).
They used Array CGH to obtain miRNA copy number data and used a permutation
analysis to identify statistically significant altered miRNA’s (C. Li et al., 2009).
Vogelstein et al sequenced 20857 transcripts from 18,191 genes and identified genes that
are mutated in 11 breast and 11 colorectal tumors. A gene that had a mutation in a tumor
and not in the normal tissue is further sequenced. These genes were further analyzed vis-
à-vis their involvement in pathways and protein interaction. The study concluded that
there are approximately 15 genes that harbor driver mutations responsible for initiation,
progression and maintenance of a tumor (Wood et al., 2008).
Experimental models of cancer
Various models have been used to understand the initiation and progression of
cancer to eventually identify drugs or therapies. These include naturally occurring models
(e.g., cell lines and strains/sub-species of animals) and induced models (e.g. via chemical
exposure, radiation or biological vectors).
Immortalized cancer cells have long been used in molecular experimentation to
understand cancer. These cell lines provide a virtually unlimited supply of cancer cells
for experimentation. The principal drawback of cell lines is that they represent a
subgroup of cancer classes and are often contaminated by other cell lines.
Mice have long been used as a model of human disease mainly because they are
mammals (i.e. “human-like”), easy to handle and have a rapid life cycle. The high tumor

9
incidence and rapid tumor growth make them specially suited for cancer models. They
are very well studied and characterized amongst all mammals. Mouse models have been
extremely critical in understanding cancer initiation and progression. They can be used to
study cancer progression by a carcinogen, and may also be used to study the effect of a
therapeutic agent.
ENU, shorthand for N-ethyl-N-nitrosaurea, is a very powerful mutagen, causing a
loss of function mutation usually targeting the spermatogonial stem cells inducing one
point mutation every 1-2Mb of the genome (Kile & Hilton, 2005). Enu is so potently
mutagenic that it overcomes the cell’s inherent DNA proofreading and repair
mechanisms (Russell et al., 1979) Thus ENU makes a potent forward genetic screen in
mice, in which mice are mutated first, and those that develop a desired phenotype are
selected for follow-up. Although ENU is an efficient mutagen, the process of identifying
the causative mutations requires cloning and/or mapping of the genes based upon
multiple generations of backcrosses. Thus cloning the gene(s) responsible for a given
phenotype is a difficult and a laborious process (Amsterdam et al., 1999).
Insertional mutagenesis is the process of mutating the genomic DNA by adding
one or more bases. Insertional mutagens are usually viruses or transposable elements
(transposons). These insertional mutagens integrate within the genome of the host
organism, potentially disrupting (or inducing) one or more nearby genes. The host
organism develops a phenotype due to a loss or gain of function mutation in its cells. The
insertion events in the whole genome of the organism can be sequenced by identifying
the location of transposon or a virus and associate a particular locus to the resulting
phenotype.
Insertional mutagenesis can be used as a potent forward genetic screen to model
cancer in organisms like mice. This may require screening many individual mice given
the complexity of cancer to obtain significant results. Forward genetic screens using
insertional mutagenesis can be very rewarding in understand disease. One example of an

10
insertional mutagen is the P-element, a transposon, commonly used in Drosophila
melanogaster to understand the function of a gene based on the phenotype it produces
when inserted (and hence deactivated) with the P-element. Similarly the Ti plasmid is
used to study gene function in plants. Although insertional mutagenesis is not as potent as
ENU or other chemical carcinogen the inserted sequence is sufficiently long to allow for
molecular isolation, making it comparatively easy to sequence the region surrounding the
insertion.
One class of commonly used insertional mutagens is viral mutagens including
MuLV and MMTV. MuLV is a popular insertional mutagen in mice. New-born mice are
infected with MuLV before they have developed a immune system. The viraemia spreads
in the mice unabatedly mostly proliferating particularly through the cells of the immune
system. The viral insertions are spread throughout the genome activating oncogenes are
deactivating tumor suppressor genes causing tumors. These tumors can be retrieved and
the genomic junctions fragments sequenced and thus identify the location of the insertion
in the host genome. The MuLV maily causes Hematopoietic malignancies (Kool &
Berns, 2009). Jonkers et. al. have used M-MuLV insertional mutagenesis in mice to
implicate Frat1 gene to be collaborating with Myc and Pim1 in Lymphomas (Jonkers,
Korswagen, Acton, Breuer, & Berns, 1997).
MMTV is another popular insertional mutagen in mice and primarily causes
breast tumors. Theodorou et. al. have used the MMTV to identify novel genes involved in
mammary tumors. They have identified 13 new genes that have not been previously
implicated in breast cancer and 17 novel genes that have never been associated with
cancer (Theodorou et al., 2007).
Retroviruses have significant limitations with regards understanding cancer. They
appear to be able to only induce hematopoietic and breast tumors. Most of the human
cancers are solid originating in somatic cells. Also viruses appear to have hot spots for
integrations targeting only particular regions in the genome due to several factors, which
11
include the cell type, organism and multiplicity of the infection and design of the vector
(Moressi, 2007) . For example HIV prefers to integrate within active genes and MuLV
has a bias towards the 5’ end of the genes.
A second class of insertional mutagens are based upon transposable elements
(Transposons). These are chunks of DNA that move within the genome and also between
species. There are two types of transposons, retrotransposons and DNA transposons. The
retrotransposons are transcribed into RNA and subsequently reverse transcribed to be
integrated into the genome. The DNA transposons are ones where the DNA moves from
one part of the genome to another in a cut and paste fashion with the help of transposase
(Griffiths, Miller, Suzuki, Lewontin, & Gelbart, 2000). The transposon requires
assistance in the form of a protein coding gene (transposase) to perform the cut-and-paste
process of transposition.
Transposons contain unique sequences, which help in identifying the location of
the integrations sites. This ability of the transposons to migrate within the genome and
being able to identify the site of integration renders them a powerful tool in insertional
mutagenesis experiments (Weaver, 1998). Some examples of transposons widely used in
insertional mutagenesis experiments are the Sleeping Beauty (SB) and P-elements.
Both SB and P-elements are isolated from naturally occurring organisms. In the
case of SB, substantial modifications have been incorporated to enhance its ability to
cause the development of cancer.
Sleeping Beauty mediated mutagenesis
The Sleeping Beauty is a DNA transposon which migrates from one part of the
genome to the other by a cut and paste mechanism. The system primarily comprises two
parts - the transposon itself and a transposase to drive the transposition. The initial
Sleeping Beauty system consisted of a transposase source RosaSB knock in allele and the
transposon T2/Onc2. The SB is engineered to contain two splice acceptors and bi-

12
directional poly adenylation signals. It also contains a retroviral LTR a splice donor. The
T2/Onc2 transposon with the help of transposase randomly integrates at a TA
dinucleotide junction in the genome (Dupuy, Akagi, Largaespada, Copeland, & Jenkins,
2005). Since the transposons are tagged the location of the insertion in the genome can be
subsequently identified thus identifying the cancer causing genes. Substantial number of
mice died during embryogenesis and the surviving ones ended up having aggressive
tumors. Although the system generated tumors, they were mostly hematopoietic. Most of
the tumors prevalent in humans are solid tumors (Dupuy et al., 2006).
Figure 1. Structure of Sleeping Beauty Transposon System adapted from Dupuy et al
A new T2/Onc3, RosaSBLSL was designed to overcome the existing limitations
of the T2/Onc2, RosaSB system. The T2/Onc2 is modified by replacing the retroviral
LTR with a CAG promoter to give T2/Onc3. T2/Onc3 transposes ubiquitously as
opposed to transposition only in the hematopoietic cells. The RosaSB is placed under the
control of a lox-stop-lox cassette to drive its expression in a Cre dependent manner giving
the capability of being expressed only in tissues of interest (Dupuy et al., 2005). Sleeping
Beauty can induce insertional mutagenesis in germ line as well as somatic cells. The
structure of the Sleeping Beauty transposon system is shown in Figure 1.
There are multiple ways in which the Sleeping Beauty mutagenesis can occur as
shown in Figure 2. Since the transposon carries a promoter and a splice site the

13
transposon can drive the expression of a subsequent oncogene given it integrates
upstream of the gene. If the transposon integrates within a gene it can drive the
expression of the truncated oncogene. Likewise the transposon can also disrupt the
expression of the gene and produce a truncated transcript when it integrates within in a
gene because of the presence of the bidirectional polyadenylation signals as shown in
Figure 1. These features of the Sleeping Beauty system renders it a powerful tool in
identifying genes involved in cancers thus aid in identifying potential new therapies.
Figure 2. In the first two transcripts Sleeping Beauty drives the expression of the gene and in the last two transcripts it disrupts the transcript. This figure is adapted from Dupuy et al (Dupuy et al., 2006).
In contrast to the P-elements in Drosophila, Sleeping Beauty does not seem to
show such affinity for hot or cold spots in the genome. Instead, Sleeping Beauty appears

14
to randomly integrate at a TA dinucleotide junction anywhere in the genome.
Retroviruses have significant limitations with regards understanding cancer. They appear
to be able to induce hematopoietic and breast tumors. Most of the human cancers are
solid originating in somatic cells. Also viruses appear to have hot spots for integrations
targeting only particular regions in the genome due to several factors which include the
cell type, organism and multiplicity of the infection and design of the vector (Moressi,
2007). Finally Sleeping Beauty is autonomous meaning it does not need any extracellular
substances for its transposition activity.
Analysis of insertional mutagenesis experiments
The focus of this thesis is the analysis of experiments based upon the Sleeping
Beauty insertional mutagenesis system. Several issues are of critical importance in the
analysis of insertional mutagenesis experiments using the Sleeping Beauty system. These
include specificity, local hopping of the transposon, identification of the clonally
expanded integration sites and determination of loci at which integrations commonly
occur. These issues are described below.
Specificity
The SB junctions are retrieved using LM-PCR and are sequenced. The location of
the genomic junction fragment thus obtained needs to be ascertained. The retrieved
genomic junction fragments have to be of sufficient length in order to be unambiguously
aligned to the genome.
Local hopping
In general, SB transposase allows SB transposons to be excised and re-integrated
at a random position. However, a small fraction of the re-integrations occur locally
(within 20 Mb of the site of excision). This yields a biased integration pattern in which
loci near the donor cassette have an increased likelihood of SB integration, leading to a

15
different prior probability of integration than the rest of the genome. This phenomenon is
termed as Local Hopping and can contribute to the identification of insertions that are
false positives.
Clonality
While insertions that were repeatedly identified across tumors are probably driver
mutations, the insertions that are identified infrequently are more likely to be passenger
mutations caused by the continued transposition events not positively selected in
tumorigenesis. An estimate for the extent of clonality needs to be developed to eliminate
the background transposition events and identify driver mutations.
Common Insertion Sites (CISs)
Most of the SB screens generate thousands of insertions. For example Starr et al
have recovered approximately 17000 insertion sites from a SB screen of colorectal
cancers (Starr et al., 2009). While a few insertions legitimately cause cancer other are
probably acquired by continued SB insertions. These passenger mutations are usually
dormant and have no effect in tumor initiation and development. It is important to
identify the genes or regions that are positively selected for tumor initiation, development
and metastasis. Distinguishing these driver mutations from passenger mutations in
necessary in devising subsequent therapies. Common insertions sites are the regions in
the genome that repeatedly harbor insertions across multiple tumors at higher frequencies
than expected by chance. If these regions are observed to have insertions frequently
across independent tumors they are more likely to be responsible for the tumor initiation
and development by applying guilt by association approach.

16
gene centric Common Insertion Sites(gCIS):
While CIS identify regions in the genome, genes are the functional regions in the
genome that serve as a blue print for proteins. Identifying the genes having insertions
higher than expected by chance is a better approach towards identifying genes involved
in cancer rather than computing the CIS and identify the genes in its neighborhood. The
end goal of most insertional mutagenesis studies is to identify the gene involved in cancer
and have a gene centric approach is more rewarding than the traditional approach of
identifying the CISs.
Need for sequencing depth
Identifying a few insertions per tumor will reduce the capabilities to Identify CIS,
gCISs and genes cooperating in cancer accurately. More the number of insertions
sequenced and aligned to the host genome per tumor better is the statistical power.
The sequencing depth is essential for identifying genes cooperating in
tumorigenesis. Since the CISs and gCISs are defined as loci in the genome that have
more insertions than expected the number of tumors sequenced is important for
identifying CISs and gCISs. It important to sequence adequate number of tumors as well
as adequate number of insertions per tumor to effectively identify CISs, gCISs and
cooperating genes. All these issues have to be taken into consideration before the design
of a insertional mutagenesis experiment.
17
CHAPTER 3
APPROACH
The primary focus of this thesis is the development of an analysis pipeline for
insertional mutagenesis experiments using the Sleeping Beauty transposon system or
simply the SB system. The analysis pipeline is the computational engine behind IAS –
the Integration Analysis System. The acronyms SB and IAS are used throughout this
document interchangeably for Sleeping Beauty and Integration Analysis System. This
chapter describes the strategy developed to analyze the genomic fragments adjoining SB
integration events. This section also explains the algorithms developed, techniques used
and the methods adopted to evaluate everything from identifying the location of the
inserts in the genome to identifying the CISs and gCISs.
System design
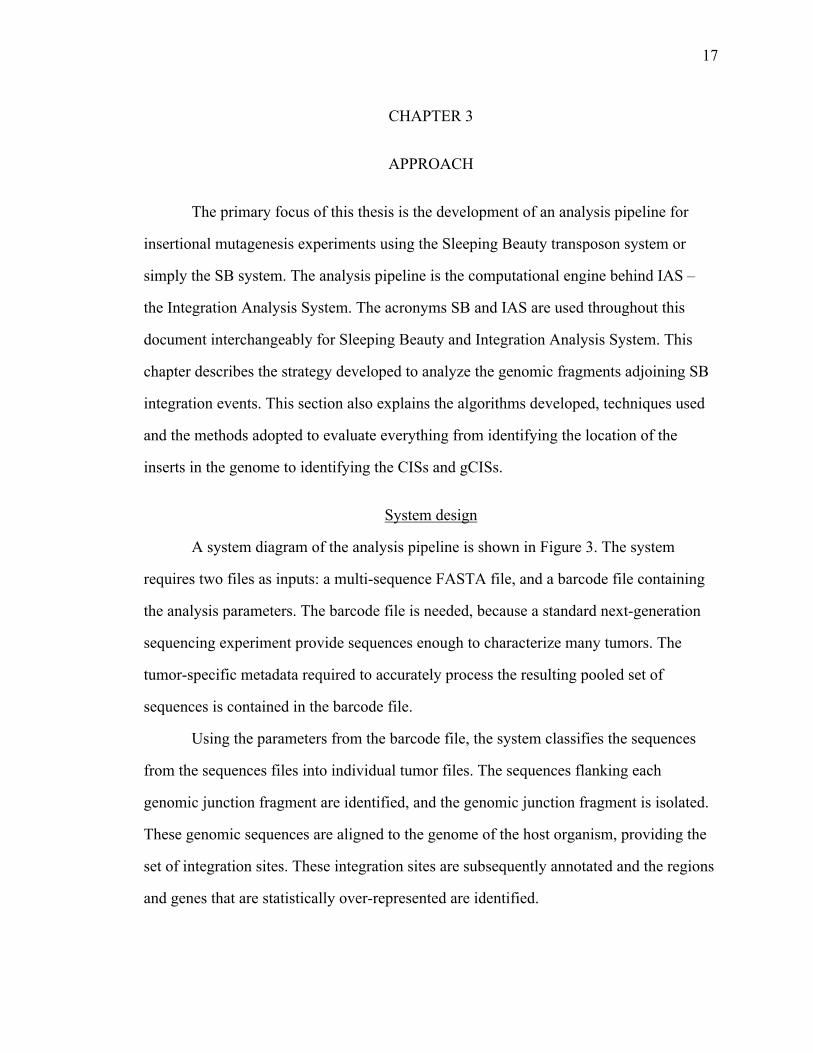
A system diagram of the analysis pipeline is shown in Figure 3. The system
requires two files as inputs: a multi-sequence FASTA file, and a barcode file containing
the analysis parameters. The barcode file is needed, because a standard next-generation
sequencing experiment provide sequences enough to characterize many tumors. The
tumor-specific metadata required to accurately process the resulting pooled set of
sequences is contained in the barcode file.
Using the parameters from the barcode file, the system classifies the sequences
from the sequences files into individual tumor files. The sequences flanking each
genomic junction fragment are identified, and the genomic junction fragment is isolated.
These genomic sequences are aligned to the genome of the host organism, providing the
set of integration sites. These integration sites are subsequently annotated and the regions
and genes that are statistically over-represented are identified.

18
Figure 3. System diagram

19
CHAPTER 4
METHODS
Input data
The sequences generated from a SB insertional mutagenesis experiment with the
specification of certain parameters are primary inputs to the IAS system. The IAS system
requires two files as input. The first file contains the sequences, and the second contains
the per-tumor metadata required for analysis.
The sequence file is a multiple-sequence FASTA format file containing the
sequences from a SB mutagenesis experiment. Figure 4, below, provides a listing of
several FASTA-formatted sequences. Sequence files typically contain hundreds of
thousands to millions of sequences. Each sequence is represented by a header line, in
which a leading ‘>’ (greater than symbol) is followed by the sequence name and
(optionally) descriptive information is presented. In Figure 4, a partial sequence file is
presented with descriptive data from a Roche/454 sequencing experiment.
>FZMARUM01ASN6F rank=0490328 x=209.0 y=1749.0 length=97 CAAGACTGTCGACTCCAACTTAAGTGTATGTAAACTTCCGACTTCAACTGTATGTCACCGTTCTGAAGTCTCCAACTAGTCCCTTAAGCGGAGCCCT >FZMARUM01B5PB5 rank=0010687 x=767.0 y=3827.0 length=89 GAAGTGCTCCGACTCCAACTTAAGTGTATGTAAACTTCCGACTTCAACTGTATAAAGCAAATCCATACCTAGTCCCTTAAGCGGAGCCC >FZMARUM01CL4BT rank=0431354 x=954.0 y=3799.0 length=101 CAAGACTGTCGACTCCAACTTAAGTGTATGTAAACTTCCGACTTCAACTGTACATGGCACTGTACCTCATTATCTGACACTAGTCCCTTAAGCGGAGCCCT >FZMARUM01D17W9 rank=0010731 x=1548.0 y=1547.0 length=86 GAAGTGCTCCGACTCCAACTTAAGTGTATGTAAACTTCCGACTTCAACTGTAATTAGCCTGTTACCTAGTCCCTTAAGCGGAGCCC >FZMARUM01AU68Z rank=0432580 x=238.0 y=993.0 length=106 CAAGACTGTCGACTCCAACTTAAGTGTATGTAAACTTCCGACTTCAACTGTATGTACTTGTAATAGACACAAATGAATCAATGCCTAGTCCCTTAAGCGGAGCCCT
Figure 4. Sample sequence file

20
The barcode file contains the tumor-specific metadata required for the accurate
analysis of the sequences. The barcode file is provided as an Excel-compatible, tab-
delimited text file. Each row of the file represents a unique combination of tumor and
IRR/IRL. For each barcoded sample, this files contains: * oligonucleotide barcode,
* tumor ID,
* orientation of the cloning sequence (IRR/IRL),
* flanking sequences (SB inverted repeat and 3’ adaptor), and
* the donor chromosome (location of the SB cassette).
The barcode sequence is used to uniquely associate each sequence with a tumor.
The flanking sequences describe the specific sequences that all SB insertion derived
sequences should contain – both an SB subsequence in front and an adaptor sequence
after. These sequences are used to identify and remove the non-genomic portions of the
experimental sequences. The donor chromosome specifies, for that particular tumor, the
chromosome within which the SB cassette is located. This is critical in removing
background integrations present due to the “local hopping” process of SB. Removal of
these “local hops” is needed for the accurate identification of common integration sites. A
sample barcode file is shown in Figure 5. As shown in Figure 3, the barcode file and the
sequence file are the primary inputs to the system.
CAAGACTGTC 472-4T IRL GACTCCAACTTAAGTGTATGTAAACTTCCGACTTCAACTG GTCCCTTAAGCGGAGCCC chr4 GAAGTGCTCC 3437-1T IRL GACTCCAACTTAAGTGTATGTAAACTTCCGACTTCAACTG GTCCCTTAAGCGGAGCCC chr4 AGTCCAATCG 472-3T IRL GACTCCAACTTAAGTGTATGTAAACTTCCGACTTCAACTG GTCCCTTAAGCGGAGCCC chr4 GAGCCTGACT 471-1T IRL GACTCCAACTTAAGTGTATGTAAACTTCCGACTTCAACTG GTCCCTTAAGCGGAGCCC chr4
Figure 5. Example barcode file.
This shows a sample barcode file providing the metadata for four tumors: 472-4T,
3437-1T, 472-3T and 471-1T. As expected, for an analysis based upon a single

21
experiment, all of the adaptor sequences are identical, as is the flanking sequence from
the IR portion of the SB element.
The structure of the experimental sequences from SB-derived tumors is shown in
Figure 6.
Figure 6. Sequence structure
The first part of the sequence in Figure 6 is a barcode, which uniquely associates a
sequence to a particular tumor. IRL/IRR is a partial sequence from the left or right
inverted repeat of the transposon, based on its orientation. The genomic sequence is the
genomic junction of the host organism that is adjacent to the SB integration. The
sequences may be followed by an adaptor sequence, depending on the length of the
sequence and the length of the genomic fragment.
Sequence analysis
As shown in Figure 8, the sequence structure has four parts, the first part being
the barcode. The barcode is typically a 6-12 nt oligonucleotide sequence at the beginning
of each read in the sequence. This allows next generation sequencing runs to be
performed using pools of tumors simultaneously, while still enabling the unique
association of each sequence with a specific tumor. The barcode-based tumor
identification process splits the input sequence file into per-tumor FASTA files. The
barcode comparison utilizes the first N nts of every sequence in the input sequence file to
the set of per-tumor barcodes, where N is the length of the barcodes utilized in the pooled
tumors. The comparison is performed using the Levenshtein distance metric, often
22
referred to as the edit distance (Levenshtein, ). The Levenshtein distance metric is a more
robust metric than the Hamming distance, as it allows for both nucleotide mis-matches
and insertions/deletions. If the Levenshtein’s distance between the first N nts and a given
barcode is less than two, the sequence is classified as the tumor associated with that
barcode and included in the per-tumor file with the barcode removed from the sequence.
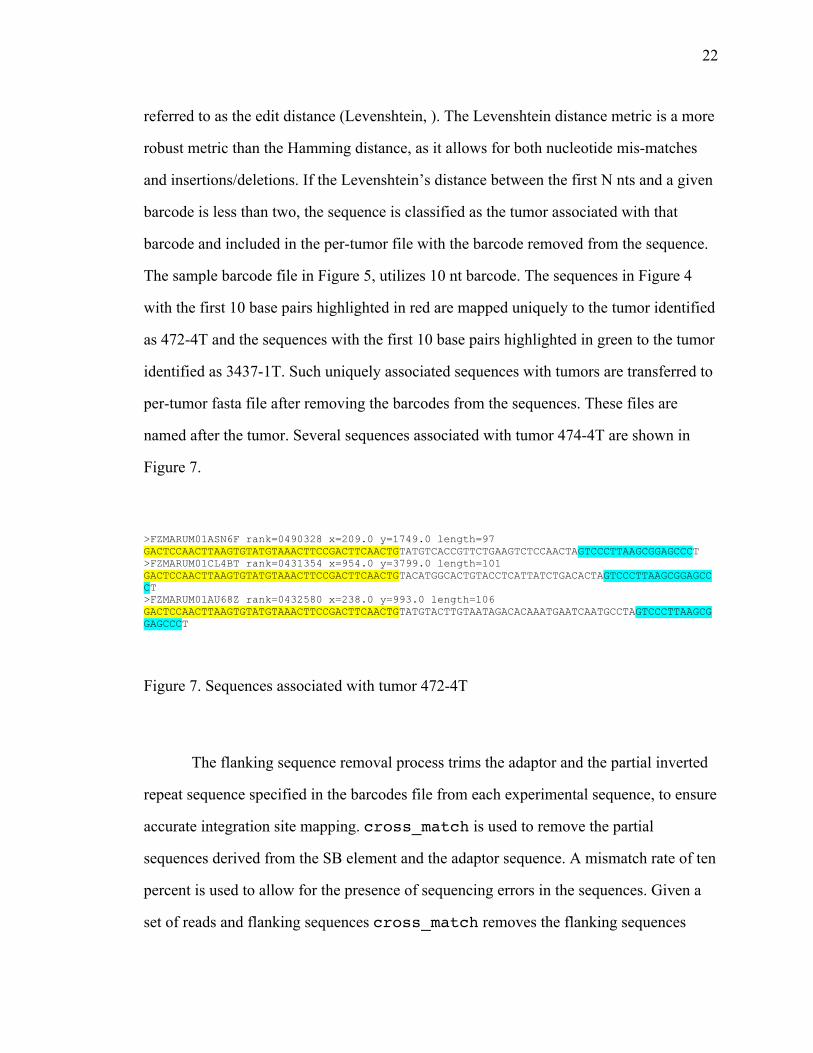
The sample barcode file in Figure 5, utilizes 10 nt barcode. The sequences in Figure 4
with the first 10 base pairs highlighted in red are mapped uniquely to the tumor identified
as 472-4T and the sequences with the first 10 base pairs highlighted in green to the tumor
identified as 3437-1T. Such uniquely associated sequences with tumors are transferred to
per-tumor fasta file after removing the barcodes from the sequences. These files are
named after the tumor. Several sequences associated with tumor 474-4T are shown in
Figure 7.
>FZMARUM01ASN6F rank=0490328 x=209.0 y=1749.0 length=97 GACTCCAACTTAAGTGTATGTAAACTTCCGACTTCAACTGTATGTCACCGTTCTGAAGTCTCCAACTAGTCCCTTAAGCGGAGCCCT >FZMARUM01CL4BT rank=0431354 x=954.0 y=3799.0 length=101 GACTCCAACTTAAGTGTATGTAAACTTCCGACTTCAACTGTACATGGCACTGTACCTCATTATCTGACACTAGTCCCTTAAGCGGAGCCCT >FZMARUM01AU68Z rank=0432580 x=238.0 y=993.0 length=106 GACTCCAACTTAAGTGTATGTAAACTTCCGACTTCAACTGTATGTACTTGTAATAGACACAAATGAATCAATGCCTAGTCCCTTAAGCGGAGCCCT
Figure 7. Sequences associated with tumor 472-4T
The flanking sequence removal process trims the adaptor and the partial inverted
repeat sequence specified in the barcodes file from each experimental sequence, to ensure
accurate integration site mapping. cross_match is used to remove the partial
sequences derived from the SB element and the adaptor sequence. A mismatch rate of ten
percent is used to allow for the presence of sequencing errors in the sequences. Given a
set of reads and flanking sequences cross_match removes the flanking sequences

23
from the reads leaving an unadulterated set of genomic junction fragments. The
cross_match program is used to align a nucleotide sequence or sequences against a
database of sequences (Gordon, 2003) (Ewing & Green, 1998). Primarily designed to
identify vector sequences in a set of reads. This can be used to removed the IRL/IRR and
the Adaptor sequences from the reads obtained by transposon based insertional
mutagenesis screens. At this point the tumor files have just the genomic DNA in them as
shown in Figure 8. The inverted repeat sequence highlighted in yellow and adaptor
sequence highlighted in blue in Figure 7 for tumor 472-4T are removed using
cross_match and the remaining genomic junction fragment is presented in Figure 8.
>FZMARUM01ASN6F rank=0490328 x=209.0 y=1749.0 length=97 TATGTCACCGTTCTGAAGTCTCCAACTA >FZMARUM01CL4BT rank=0431354 x=954.0 y=3799.0 length=101 TACATGGCACTGTACCTCATTATCTGACACTA >FZMARUM01AU68Z rank=0432580 x=238.0 y=993.0 length=106 TATGTACTTGTAATAGACACAAATGAATCAATGCCTA
Figure 8. Sequences associated with tumor 472-4T after removing the inverted repeat sequence and the adaptor sequence.
The classification of the sequences into individual tumor files combined with
cross_match allows IAS to perform the analysis on a per tumor basis instead on a per
sequence basis. The trimmed sequences are aligned to the host organism’s reference
genome using BLAT. BLAT (Blast Like Alignment Tool) is used for rapid alignment of
sequences against the genome. BLAT achieves this by storing the index of the genome in
the memory (Kent, 2002). The eventual of goal of a insertional mutagenesis screen is to
identify the location of the insertions. The genomic junction fragments present as a part
of the reads obtained from an insertional mutagenesis screen can be aligned to the
genome using BLAT. All alignments with at least a 90 percent match to the genome are

24
considered. In the event of multiple, the unique best alignment is selected, such that the
best alignment is at least five percent better than the second best alignment. IAS uses a
dedicated BLAT server for this purpose. Sleeping Beauty screens are no longer limited to
mice. Researchers have been using other species like zebrafish, rat and human cell
cultures to study cancer using SB screens. In keeping with the demand for multi species
functionality, the BLAT server has been loaded with genome databases of human, mouse,
rat and zebra fish. At this stage of the analysis we have a list of all the best Sleeping
Beauty insertions sites in the host genome.
Annotation
Finally, the aligned sequences are annotated using the UCSC genome annotation
databases. Specifically, the refFlat table is used to annotate the integrations with respect
to gene, position within the gene, and expected effect given the orientation with respect to
the gene. Similar to the BLAT genome databases the annotation databases include refFlat
tables for human, mouse, rat and zebrafish and a dedicated server is used to host these
databases. Annotations for the genomic fragments from Figure 8 are shown in Figure 9.
The annotation file is a tab delimited Excel file containing the listing of all the insertions
sites. The first column in the annotation file lists the tumor id followed by the gene name
provided the insertion is in a gene. The third column specifies the region of insertion
within a gene. The fourth column describes the nature of effect of the insertion. The fifth
and the sixth column are the chromosome and the location of the insert on the
chromosome in base pairs. The seventh column indicates the number of integrations at
this particular position and finally followed by the orientation of the integration in the
eighth column. In the annotation files the T() function was used for the gene names. The
T() function refers to the text of the value in a field. Some gene names resemble date of
the year e.g. Sep1. When excel encounters a gene name like Sep1, it is automatically

25
converted to 1-Sep as excel assumes it being a date. The T() function leaves the gene
name as is in the excel spread sheet to avoid any confusion for the user.
472-4T.parsed chr7 122388307 6 472-4T.parsed Ccr7 3 prime 13.757 kb chr11 99002634 177 SAME 472-4T.parsed Bach2 intron 2 not disrupt CDS chr4 32421757 6 OPPOSITE
Figure 9. The annotations of the genomic junction fragments from Figure 8
Donor chromosomes
The chromosome harboring the original SB cassette is referred to as the donor
chromosome. As noted in the Background Chapter, while Sleeping Beauty can transpose
to any site (with a TA) in the genome, a substantial proportion of transposition events
occur over relatively short distances. This process is termed local hopping. The effect of
this process is an abundance of sites on the same chromosome as the donor cassette.
These are problematic, as they increase the background number of integrations and will
frequently cause multiple CISs and gCISs to be spuriously identified on the donor
chromosome. In order to remove the false positives that arise in later analyses (CIS and
gCIS) all of the insertions on the donor chromosome are excluded from further analysis.
This conservative approach aids in minimizing the false predictions due to local hopping
events. Detailed modeling and analysis of local hopping across multiple experiments may
eventually allow a more limited set of exclusions on the donor chromosome. The barcode
file from Figure 5 indicates that chromosome 4 is the donor chromosome for that
particular set of tumors. Therefore, all integrations on chromosome 4 for those tumors are
excluded from further analysis.

26
Clonality
Driver mutations are those mutations that are responsible for tumor initiation and
growth. These are expected to be the most prevalently observed integrations within a
tumor, as they are clonally selected for during tumor development. The remaining
infrequently observed insertions most likely correspond to continued transposition events
in the tumor or normal cells that contaminate the tumor samples and were not clonally
expanded correspond to passenger mutations. Removing these infrequent insertions will
increase the chance of identifying the causal driver mutations (Vrieze et al, In
preparation). We have adopted and integrated the technique developed by Vrieze et al (In
Preparation) based on the premise that driver mutations will be present across various
tumors throughout the animal. They compared the insertion events in thymus and lymph
node tumors derived from the same animal. The method defines a metric called the
clonality score which is the number of sequences mapped to a particular insertion site
from a sample divided by the number of sequences mapped to the insertion site in the
same sample with the maximum number of sequences. For a given sample, the
integration event with the greatest number of mapped sequences is assigned a clonality
score of 1. Vrieze et al (In preparation) observed that integration sites having a clonality
score less than 0.1 do not have strong positive selection and therefore defined them as
noisy events and eliminated this class of integrations. We have adopted the technique of
eliminating the integration events having a clonality score less than 0.1 in the IAS system
to eliminate background integration events. Clonality metrics are focused on individual
tumors, which make distinguishing passenger mutations from driver mutations a
challenge. Such a determination requires an assessment across multiple tumors. The key
is that driver mutations, while derived from a diverse population of genes, will be
selected for during tumor development. In contrast, passenger mutations are randomly
selected in each independent tumor. Thus driver mutations should be observed in

27
multiple independent tumors. Several methods are discussed that address this important
issue.
Common Insertion Sites (CIS)
Common insertion sites (CISs) are defined as regions in which insertions are
observed across multiple tumors more often than expected. This is assessed using a
Monte Carlo simulation in which the set of integrations, per tumor, are randomly
simulated. The set of simulated integrations are restricted to the positions of TA
dinucleotides within the reference genome, in keeping with the biology of the SB
element. In each iteration, the shortest regions containing integrations (I) from 3, 4, 5 6
and 7 integrations are identified. These regions are limited to a maximum size of 150 kb,
based on transcript length (only 5% of transcripts are longer than 150 kb), to reduce the
number of false CISs based upon integrations in disparate, adjacent genes. This set of
minimal regions for I ∈ {3, 4, 5, 6, 7} is used to determine the smallest region such that
one or fewer CISs would be identified by chance (E=1). These definitions are then
applied to the experimental data to determine the CISs identified within the experiment.
An annotated list of CISs is provided in an Excel-compatible format, including the locus
definition, the gene(s) encompassed by the CIS, and the number and identities of tumors
in which the CIS was observed.
gene centric Common Insertion Sites (gCIS)
Gene-centric CISs were calculated based upon the number of TA dinucleotides
within the transcribed region for each gene in the RefSeq collection (Pruitt, Tatusova, &
Maglott, 2006). The gene-associated transcribed region was defined as the union of all
RefSeq transcripts including a 10 kbp promoter. A Chi-squared test statistic was
calculated based upon the number of TAs within each gene-associated region and the
number of tumors with integrations within the gene. This test statistic is used to
determine the p-value, with a single degree of freedom. An Excel compatible tab-

28
delimited file is generated detailing the results. For each RefSeq gene, this file includes
the gCIS p-value, number of tumors in which integrations were found, and a list of the
tumors in which integrations were observed. Significance was assessed using the
Bonferroni method, yielding a threshold of 2.63x10⁻⁶ to determine which gCISs are
significant after correction for multiple hypothesis testing.
In summary, the IAS system takes as input a barcode file containing the necessary
parameters and the sequence file itself and returns three files: (i) an annotation file
containing the location of all the insertions and their UCSC annotations, (ii) a file
containing the data on Common Insertions Sites (CIS), and (iii) a file containing the data
on gene centric Common Insertion Sites (gCIS).
IAS Website
To make IAS available to researchers worldwide, it was developed and deployed
as a web application to aid in the analysis of insertional mutagenesis experiments. The
Drupal content management system was used as the underlying platform upon which the
IAS pipeline was deployed as a web application (http://drupal.org/). All of the
experiment-specific descriptions (metadata) are stored within a MySQL database, with
the sequence and barcode files stored within a filesystem hierarchy based upon
investigator and experiment name. To enhance the scalability of IAS, the computational
analysis is performed on a local compute cluster. The compute cluster is a sixteen node
2GHz AMD Athlon dual processors with 2GB of RAM on each node. All necessary files
and commands are transmitted to the compute cluster for execution of the IAS analysis
pipeline. Once the analysis is complete the resulting output files are transferred back to
the IAS server for access by the investigator. An email is sent to the investigator
informing him or her that the analysis is complete.

29
CHAPTER 5
RESULTS
The IAS website (http://ias.eng.uiowa.edu/IAS) provides access to all of the
functionality of IAS. This enables SB researchers to rapidly upload and analyze entire
experimental datasets. Each researcher’s experiments are categorized by name, and are
accessible to the researchers individually. The creation of a new project is a
straightforward process of uploading the required experimental parameters, and
launching the computation. Inputs include: a multi-sequence FASTA file, and a barcode
file containing the parameters. The barcode file shown in Figure 5 provides the per-tumor
information required to identify the integration junction sites. For each tumor, this
information includes the associated barcode, cloning orientation (IRR or IRL), expected
flanking sequences and donor chromosome are specified. Template barcode files are
available to ensure proper exchange of information.
Figure 10. IAS login page

30
The users are first required to request a login and the administrator approves the
registration. The users can then login to create an experiment as shown in Figure 10.
Every dataset that needs to be analyzed is considered an experiment and the users are
required to give an experiment name and specify the location of the barcode file and the
sequence file to be uploaded on the “Add Experiment” page as shown in Figure 11. The
users are also required to specify the host organism in which the SB screen was
performed.
Figure 11. IAS page where the title of the experiment, the host organism are specified and the barcode file and the sequence file are uploaded to the IAS server.
IAS supports the analysis of SB experiments in mouse, human, rat and zebra fish.
Pressing the Save button on the “Create Experiment” page initiates the analysis. Because
insertional mutagenesis experiments involve large datasets, the complete analysis
requires from a few minutes to several hours depending on the size of the dataset. The
users can choose to leave the browser open or quit. Regardless the analysis will continue
to run. Once complete the users will be notified by email of its completion and the user

31
can view the results on the “My Integrations” page on the website as shown in the Figure
12. The My Integrations page lists all the experiments of a particular user along with the
Inputs Barcodes file, Sequence file and the results of the analysis being the Annotation
file, CIS and gCIS files. The webpage also has a delete link to delete a particular
experiment. Finally the users can exit IAS by logging out of the website.
As shown in Figure 3, sequences are first classified into tumor of origin based
upon the oligo-nucleotide barcode incorporated within the sequences. Non-genomic
flanking sequences are then removed. These include the inverted repeat from the SB
element at the 5’ end and any adaptor sequence found at the 3’ end of the read. The
remaining sequence now represents the genomic sequence immediately adjacent to the
SB integration, including the TA site. This sequence is then mapped to the reference
genome assembly. The set of integrations for each tumor are then annotated to include
any gene in which it integrated, and the expected effect of the integration on the gene
given the relative orientation of the gene and SB element. The annotation file also
includes the number of integrations observed at a given position. This information is used
to identify Commonly Integrated Sites (CISs) and gene-centric Commonly Integrated
Sites (gCISs).
Resulting output files of an analysis by IAS
The outputs of the IAS analysis are several files, all available from the web-site.
These files include the annotation for every integration, as well as descriptions on the
common integrations sites and gene-centric common integration sites. The files are
provided in a tab-delimited, Excel-compatible format to maximize their utility to the
users of IAS.

32
Figure 12. Screen shot of the listing of all the input and results on the My Integrations page on the IAS website
Annotation file
The annotation file is a tab delimited, Excel-compatible file containing the listing
of all insertions sites. The first column in the annotation file lists the tumor id followed
by the gene name if the insertion is in a gene. The third column specifies the region of
insertion within a gene. The fourth column describes the nature of effect of the insertion.
The fifth and the sixth column are the chromosome and the location of the insert on the
chromosome in base pairs. The seventh column indicates the number of integrations at
this particular position and finally followed by the orientation of the integration in the
eighth column. In the annotation files the T() function was used for the gene names. The
T() function refers to the text of the value in a field. Some gene names resemble date of
the year e.g. Sep1. When Excel encounters a gene name like Sep1, it is automatically
converted to 1-Sep as Excel assumes it being a date. The T() function leaves the gene
name as is in the Excel spread sheet to avoid any confusion for the user.

33
Common Insertion Sites (CIS) file
Every entry in the CIS file starts with the CIS definition, which the chromosome
number and the beginning and the end of CIS on the chromosome followed by the
number of independent insertions, genes in the neighborhood of the CIS and finally the
tumors with insertions in this neighborhood.
gene-centric Common Insertion Sites (gCIS) file
The gCIS file includes the listing of all the genes in the genome with the P-values
indicating the significance of the number of tumors with insertions in that gene plus a
10000bp promoter and the listing of the tumors. Just like the annotation file and the CIS
file the gCISs are also presented as a tab delimited excel spreadsheet. Since the gCISs are
gene centric the first column in the gCIS file is a gene name followed by the Chi-Squared
value Degrees of Freedom in the second column. The third and the fourth columns in the
gCIS file are the q-value and p-value. The fifth, sixth and the seventh columns are
number of tumors with insertion in this gene, number of integrations per tumor and the
tumor ID’s respectively.
Support for analyzing SB experiments from multiple species
IAS includes analysis for multiple species like mouse, human, rat and zebrafish
using SB system for insertional Mutagenesis.
Experimental results
The IAS system has been used in the analysis of multiple experiments ranging
from lymphoma, and colorectal cancer to medulloblastoma. The following is a summary
of the IAS analysis from those experiments. Table 1 summarizes each experiment
analyzed using IAS. It lists the tumor type, number of sequences and tumors analyzed,
and the CISs and gCISs identified.

34
Experiments Sequences Tumors CIS gCIS
Medulloblastoma 635015* 125 219 191
Metastatic Tumor 635015* 170 197 159
Colorectal 196619 135 84 324
Lymphoma 625286 161 71 221
Total 1456920 591
*The Medulloblastomas and the Metastatic tumors are paired
Table 1. Summary of experiments analyzed using IAS
We have analyzed a total of approximately 591 tumors from three different types
of experiments involving approximately 1.4 million sequences.
Detailed analysis of the lymphoma dataset
Sequence data from three models of thymic lymphomas in mice from Vrieze et al
(In preparation) has been analyzed by the IAS system. The goal of this project was to
identify distinct genetic signatures of various cells of origin for T-cell lymphomas. The
T-cells have their origin in hematopoietic stem cells in the bone marrow. These T-cells
reside in the thymus and by subsequent cell divisions become immature thymocytes with
no expression of either CD4 or CD8 antigen. These thymocytes in the later stages of
development become mature by the expression of CD4 and CD8. The SB system in each
of these models is engineered to be triggered in specific cells during these various stages

35
Vav Lck CD4
Number of Tumors 36 28 48
Sequences Mapped 56,926 56,926 105,366
Unique Integration sites 837 922 1830
Sites observed in 2+ tumors 8 2 6
Sites Observed in 3+ tumors 4 0 2
Number of CISs 17 19 35
Number of gCISs 28 52 141
Table 2. The summary of results from the analysis of Vav, Lck and CD4 models of lymphoma at different stages of the analysis
in differentiation of the T-cell. In the Vav model, transposase is expressed using a
promoter specific to hematopoietic stem cells. Similarly, in the Lck model SB
transposase is expressed in thymocytes lacking the CD4/CD8 antigen. Finally, the CD4
model of lymphoma uses a promoter, which expresses SB transposase in late stage
CD4/CD8 double positive thymocytes (Vrieze et al. In preparation). The identification of
the underlying genetic signature of the cell of origin is important to distinguish the
normal cells from the malignant ones. This experiment is an attempt to identify the
genetic events in cell of origin by using SB mediated insertional mutagenesis activated at
different stages of the development and differentiation of the T-cells that eventually
become cancerous. Identifying the genetic events and the stage of cancer initiation is
necessary for effective drugs and therapy.
The dataset involved a total of 112 tumors. The complete description of the
dataset and its analysis is shown in Table 2. In summary, there were 36 tumors from the
Vav model, 28 tumors from the Lck model, and 48 tumors from the CD4 model. IAS
successfully mapped a total of 56,926 reads from the Vav model, 56,926 reads from the

36
Lck and 105366 reads from the CD4 model to the mouse genome corresponding to 837,
922 and 1830 independent integrations sites. These independent integrations from the
annotation files of each of the Vav, Lck and CD4 models are used to calculate the CIS
and gCIS for each of the models. The IAS system Identified 17, 19 and 35 CIS for Vav,
Lck and CD4 tumors respectively. The listing of the CISs for Vav, Lck and CD4 tumors
is listed in Tables 4, 5, 6 of APPENDIX A. Table 2 also gives the number of integrations
sites observed in at least 2 and 3 tumors.
Figure 13. Pathway observed in Vav model of Lymphomas in mice
The set of gCISs for each of the lymphoma models was analyzed, as described in
the Methods. Overall, 31, 54 and 142 gCISs were identified from the Vav, Lck and CD4
tumor models, respectively. The significance of this analysis was adjusted for multiple
hypothesis testing using a Bonferroni correction. The top twenty gCISs ranked based on

37
the unadjusted p-value from the χ-square test for the SB mediated lymphoma models of
Vav, Lck and CD4 are listed in Tables 7, 8, 9 of APPENDIX A. Several analyses were
performed on the sets of identified CISs and gCISs to assess their relevance and correlate
them with the biology of lymphoma. The first analysis was a comparison between the
CISs and gCISs to databases of known cancer genes. This analysis identified a significant
overlap. Vrieze et al, (In Preparation) performed a genome wide analysis of Human T-
ALL samples in dentifying 31 copy-number abnormalities (CNAs) of which 10 were
amplification events spanning 4850 genes and 21 deletion events affecting 513 genes.
Mouse orthologs for the genes within the CNAs were identified and were compared
against the set of genes within the CISs and gCISs from the three models. Vrieze et al (In
Preparation) observed a statistically significant overlap between the two. Thus indicating
that SB mediated screens in mice can be a potential system to simulate and understand
human cancer.
Figure 14. Pathway observed in Lck model of Lymphomas in mice

38
As described in the Background chapter of this thesis, cancer is caused by
mutations in multiple genes in critically important pathways. Cooperatively, these genes
are responsible for tumor initiation and progression. These genes are hereafter referred to
as cooperating genes. So an effort was made identify these cooperating genes. A Fisher’s
exact test was performed on the CIS/gCISs pairs from each of the three models (Vav, Lck
and CD4) of SB to identify possible cooperating pair of genes. The results of the Fisher’s
exact test for the Vav, Lck and CD4 tumors are furnished in Tables 10, 11, and 12
respectively in APPENDIX A. There are 3, 8 and 4 gene pairs that show significant
interaction from Vav, Lck and CD4 models respectively. The relatively low numbers of
identified cooperating gene pairs can be attributed to a limited number of tumors for each
model. An effort was made to identify cooperating gene networks beyond gene pairs. A
software application called Cytoscape (Shannon et al., 2003) was used to study
cooperating genes in the three lymphoma models. The gene networks for each of the
models are shown in Figures 13, 14, 15. In each of these figures, each node represents a
gene, a node’s diameter is proportional to the number of tumors in which the gene had
observed integrations, and edge thickness is proportional to number of tumors that have
an insertion in both genes connected by the edge. It evident from Figures 13,14,15 that
the mutation profiles are different for the three different models of Vav, Lck and CD4,
suggesting the cell of origin is an important factor in the genetic selection of tumors
(Vrieze et al, In Preparation). The mutation patterns of CD4 and Vav models differ the
most. Notch1, Ikzf1, Foxp1, Erg and Rasgrf1 harbor insertions in Vav model but are
absent in the CD4 model, Whereas Whsc1, Jak1 and Gfi1 harbored mutations in the CD4
model (Vrieze et al, In Preparation). Specifically, the gene-interaction network from the
Vav-derived tumors in Figure 13 exhibits the least complexity and the most robust roles
for specific genes. Clearly, given the size of the node representing Notch1, integrations
therein are observed more frequently than any other gene in the Vav model. Many of the
other most frequently integrated genes are found in combination with Notch1 (Rasgrf1,

39
Rasgrp1, Zmiz1, Pik3r5). These genes possibly cooperate with Notch1 to develop
Lymphomas triggered by Notch1. Recent studies have shown that the Notch and Ras
(Rasgrp1 and Rasgrf1) pathways cooperate to induce T-cell Lymphomas in mice (Vrieze
et al, In Preparation). This set of genes is a minor constituent within the gene-interaction
network for Lck, shown in Figure 14. In this network, the number of significant genes is
approximately equal, however there is no evidence of a “hub” node such as Notch1 in the
Vav-derived network. Although Notch1 is present in the Lck-derived network, it is
relegated to a significantly smaller role.
Finally, the CD4-derived network is substantially larger than the Vav- and Lck-
derived networks. Similar to the Vav network, it appears to have several “hub” nodes –
Myc, Gfi1, Whsc1, Akt2. However, many of the hub-interacting genes appear to interact
with a single hub. These different hubs possibly indicate different mutation profiles in the
CD4 model. Tumors in the Vav model initiated in the Hematopoietic stem cell are less
complex then their more differentiated counterparts in the CD4 model. The tumors in
Vav appear to primarily driven by Notch1 where are the tumors in CD4 model are
increasingly heterogeneous (Vrieze et al, In Preparation).
Colorectal cancers
The previous analysis demonstrated the application of IAS in analyzing SB
mediated models of Lymphomas in mice. The goal of this analysis is to compare our CIS
method with the one from Starr et al (Starr et al., 2009). This experiment utilized SB
induced insertional mutagenesis in mice to identify genes involved in colorectal cancers.
In all, Starr et al. sequenced 135 tumors, identifying 77 CISs involved in colorectal
cancer. There are 106 genes total within these 77 CISs identified by Starr et al. In
contrast, IAS identified 84 CISs having 116 genes within these CISs listed in Table.13.
and 324 gCISs shown in Table 14 of APPENDIX A. There are 74 genes in common

40
Figure 15. Pathway observed in CD4 model of Lymphomas in mice
between the lists of genes within the CISs Identified by our method and Starr et al. From
Figure 16, overall there is an overlap of 54 genes between the CISs, gCISs of our method
and CISs method by Starr et al.
Medulloblastomas and associated metastatic spine tumors
A set of 125 medulloblastoma tumors along with 170 of their metastatic spine tumors,
comprising a total of approximately 600,000 have been analyzed using IAS. IAS
identified 219 CIS and 191 gCIS for the medulloblastoma and 197 and 159 for their
associated metastatic tumors. An analysis to identify cooperating gene pairs using fishers
exact test was also performed.
Various other analyses were also performed using IAS involving SB mutagenesis
human cell lines, zebra fish and rat.

41
Figure 16. The extent of overlap between CIS, gCIS identified by IAS and CIS identified by method specified in Starr et al.
Skin and Liver tumors
An experiment to test the efficacy of Sleeping Beauty transposon system in mice
to induce Skin and Liver tumors was conducted. The SB system was successful in
generating HCC and SCC tumors in mice. The sequences resulting from 12 liver tumors
and 18 skin tumors were analyzed. The sequences resulting from 12 liver and 18 skin
tumors were mapped to 1821 and 3129 unique integration sites. Further analysis of the
1821 integration sites from liver tumors resulted in 5 CIS and 13 gCIS listed in Tables

42
15 & 16 of APPENDIX A. Similarly the analysis of 3129 integration sites from skin
tumors resulted in 5 CIS and 3 gCIS listed in Tables 17 and 18 of APPENDIX A.

43
CHAPTER 6
DISCUSSION
Some issues, concerns encountered during the design and implementation of IAS
along with possible enhancements are detailed in this section. This section addresses the
pros and cons of barcode design with respect to the experiment at hand and the
sequencing platform. An evaluation of the software packages for removal of flanking
sequences is also presented. The effect on IAS from changing genomic builds and
annotation is discussed. A comparison of IAS’s CIS method is compared with other
existing CIS algorithms. Finally the effect of existing and future sequencing technologies
vis-à-vis the design of IAS has been detailed in this section.
Barcode design
The barcode design strategy utilizes oligonucleotide barcodes to uniquely identify
each tumor from within a heterogeneous mixture of sequences. This allows large-scale
pooling of tumors within a single high-throughput sequencing experiment. Such pooling
enables efficient utilization of the underlying sequencing platform. The barcodes
themselves may be re-used across experiments, such that each barcode uniquely identifies
a single tumor in any single experiment. Although many of the next-generation
sequencing platforms incorporate the ability to pool samples, their ability is typically
limited to a modest number and have not been rigorously designed to exhibit robust
barcode identification in the presence of sequencing errors. In contrast, the current set of
barcodes utilized in our experiments contains 288 barcodes. This set of barcodes was
designed using UITagCreator (Gavin et al., 2002) such that all barcodes are at least edit
distance 3 and Hamming distance 5 apart. This allows the detection and correction of a
single indel or up to two substitution errors within the barcode. Because different
sequencing platforms have different error models, it may be beneficial to develop

44
barcode sets specific to each platform. For example, the likelihood of an insertion of
deletion on the 454 model is high in comparison to the Illumina and Solid platforms,
particularly when runs of the same nucleotide is present. Therefore, a 454-specific design
criteria might incorporate the requirement that mononucleotide runs are limited to two (or
even one) nucleotides.
The barcodes currently utilized are ten nucleotides long. Multiple experiment
parameters affect the optimal barcode length. Longer barcodes can allow larger numbers
of samples to be simultaneously pooled. Similarly, increasing the length of barcodes may
also enable more robust error correction properties. The downside of increasing barcode
length is two-fold: (i) decreasing sequence length after removal of the barcode sequence,
and (ii) an increase in the cost of the primers needed to create the library. The primer cost
difference is minimal, however the number of net (i.e., mappable) nucleotides per
sequence can be an issue when utilizing short-read platforms such as the Illumina and
SOLiD™ platforms.
Removing the flanking sequences of the genomic junction
fragment
A variety of alternatives were carefully considered before cross_match was
selected as the program of choice to remove the flanking sequences of the genomic
junction fragment. The previous version of IAS used BLAST (Kent, 2002) as a
means to remove the flanking sequences. Using BLAST to remove flanking sequence
required aligning the reads against the database of the flanking sequences and
subsequently parsing the results. This process involved dealing with a large number files
as the sequence file was split into individual FASTA files, each containing a single
sequence. Each of these files was aligned to the possible flanking sequences and based on

45
the match they were removed from the original sequence. This approach was not
particularly feasible with next-generation sequencing technologies as they generate
numbers of reads in the order of hundreds of thousands to millions.
An alternative option was vectorstrip, another popular program for
removing vector sequences surrounding sequence of interest. It is a part of the EMBOSS
suite of software (Rice, Longden, & Bleasby, 2000). Given a list of input sequences and
list of vector sequences vectorstrip searches the input sequences for contaminating
vector sequences and removes them. The flanking sequences of the genomic junction
fragments resulting from SB screens are analogous to the vector sequences intended for
removal using vectorstrip. Initially vectorstrip was seriously considered to be
used to remove the genomic junction flanks but was later dropped. While
vectorstrip efficiently removes the flanking sequences, even in the presence of
substitution errors, it fails completely in the face of insertion and deletion errors. This
resulted in discarding some genuine genomic fragments in the presence of single
insertion or deletion errors.
cross_match was considered the ultimate fit for the task as it takes care of
both the nucleotide mismatches as well as insertions and deletions caused due to errors in
sequencing. In addition, newer versions of cross_match have been updated to
accomodate the millions of reads resulting from next-generation sequencing platforms.
Local hopping
IAS requires that users specify the donor chromosome as a parameter in the
barcode file and removes all the integration events on the donor chromosome from the
annotation file when identifying CISs and gCISs. Since there are no established
techniques to estimate the extent of local hopping in SB mediated mutagenesis, we rely
on removing all integration events on the donor chromosome even though it is extremely
conservative.

46
While this is extremely conservative, it ensures that no inappropriate CISs or
gCISs are identified. To compensate for the lack of an entire chromosome, experiments
typically use organisms (mice) derived from one of two donor chromosomes. Thus, the
power to detect events on the donor chromosomes is reduced, but not entirely absent.
Standard annotations
IAS addresses two of the most common challenges in genomic science. The need
to accurately, rapidly and consistently annotate the resulting data, and the need to migrate
such results from one genome build to another. Providing the resulting annotation in a
standardized format, regardless of genome build or annotation source, is absolutely
required to utilize the data in further analyses (e.g. determining CISs and gCISs).
Similarly, providing annotations based upon consistent and up-to-date genome builds is a
recurring challenge in many experiments, in which the underlying reference sequence and
therefore it’s associated annotation (e.g. genes) change from build to build over the
course of years. Because of this issue, data sets predicated upon position data are not
reliable for inter-build comparison. Even gene-based datasets may not provide an
accurate basis for comparison, due to the fluid definitions of the reference genome and of
the transcripts themselves.
As increasing amounts of data are made available, the reference genome and
reference transcriptome improve. This is a good thing. But the dynamic nature of these
references makes comparisons between different experiments challenging. It is critical
that all analyses within a given analysis must be analyzed relative to the same annotation
set (set of genes and the reference sequence).

47
Comparison of CIS identification strategies
Several groups have developed methods for identifying CISs (De Ridder, Uren,
Kool, Reinders, & Wessels, 2006). These vary depending upon the assumed distribution
to be sampled, the underlying statistical method (or lack thereof).
The CIS method requires integrations from a minimum of three tumors. This
requirement safeguards from a potentially large number of false CISs due to a low level
of inter-sample contamination. We have noted that a significant preponderance of CISs
derived from two tumors derive from integrations at the exact same position, but with
radically altered prevalence between the tumors.
This datum raises the concept that not all integrations sites should be considered
equally. In fact, given a reasonable sequencing depth (say several hundred sequences per
tumor), integrations that are observed a single time are virtually guaranteed to be present
in only a small percentage of tumor cells. Such integrations are thus unlikely to represent
initiating or progression events (i.e. are not clonally expanded). Statistical methods are
needed to robustly categorize integrations as clonal or non-clonal. Such methods would
allow the incorporation of CISs supported by two tumors, increasing the genetic
complexity supported by such methods.
General utility
While the IAS system has been motivated primarily by the need to analyze
Sleeping Beauty experiments, it is capable of analyzing data many other experiment
types. Specifically, the computational pipeline within IAS can be used to map and
annotate any sequences that are tagged and flanked by known sequence on both ends.
These include PCR generated products, or sequences isolated from a variety of other
molecular protocols. The only limitations are those imposed by the alignment algorithm
and the length of genomic sequence available. These factors are primarily an issue when
the genomic sequence (after removing the flanking sequence) is short. Unsurprisingly,

48
shorter sequences are less likely to have unique best alignments to the genome. In
addition, BLAT is designed to identify sequences with 95% similarity or more with the
length of the sequences being at 40 base pairs.
Thus IAS may be used to map sequences from other transposon and vector-based
integration systems. Of note, however, the CIS and gCIS methods would produce
inaccurate results, as the TA-integration assumption would not be valid for those systems.
IAS could also be used to perform a preliminary analysis of mRNA-based sequencing
(i.e. ESTs) to perform preliminary expression level and gene classification. Such results
would require additional processing of the annotation file to identify transcript structures.
Beyond 2nd generations sequencing technologies
Technology Roche 454 Illumina Solexa ABI Solid Capillary
Run Cost $10,000 $4,000 $8,000 $144
Read Length 300-400 75-100 50 400-800
Number of Sequences 400,000 40,000,000 80,000,000 96
Table 3. Comparison of different sequencing platforms based on their read length the number of sequences they generate and the run costs
Availability of third generation sequencing technology will further benefit
Sleeping Beauty research, but carries with it additional challenges. The challenges
associated with these platforms relate to sequence length and the number of sequences
available from a given experiment.

49
As shown in Table 3 the currently available “short-read” sequencing platforms
such as the Genome Analyzer IIx (Illumina) and SOLID (ABI) both are capable of
generating extremely large numbers of sequences. Experiments utilizing these platforms
can result in hundreds of millions of sequence reads of 50-100 nt in length as show in the
Table 3.
Sequencing technologies are evolving at a rapid rate. The initial implementation
of IAS was developed for capillary-based sequencing experiments involving hundreds of
sequences, and has been extended to accommodate analysis of next-generation
sequencing (e.g., the Roche/454 FLX) technologies resulting in hundreds of thousands of
reads. Most recently investigators have begun using the Illumina platform, generating
tens of millions of reads for each experiment. Efficiently mapping such reads requires a
different strategy. Although BLAT suffices for experiments with millions of sequences, it
becomes a bottleneck when analyzing orders of magnitude greater number of reads.
Given a nominal throughput of 1M mapped reads for two hours for BLAT, the expected
time to map 1 billion reads is 2000 hours. For this reason such experiments require next-
generation sequence alignment software. Many programs exist for these purposes,
including Bowtie (Langmead, Trapnell, Pop, & Salzberg, 2009), Maq (H. Li, Ruan, &
Durbin, 2008) and Mosaik (Hillier et al., 2008).
The other challenge with migrating to these next-generation sequencing platforms
is the limitation imposed by the read-length. Between the oligonucleotide barcode used to
identify the tumor, and the partial sequence of the inverted repeat necessary for molecular
isolation of the genomic junction fragments, at least 30 nucleotides of any sequence does
not represent the desired sequence. After these pieces have been removed the remaining
sequence may be too short to unequivocally/uniquely map to the genome. This is

50
particularly true, as the error rate typically increases as the read length increases. In fact,
this particular experimental reality effectively excludes the current generation of ABI
SOLiD sequences for SB experiments. With a current limit of 50 nt, the resulting 20 nt
fragments (maximum) are far too short to yield unambiguous mapping locations for the
majority of integration sites.
These technologies will allow unprecedented sequencing depth of SB induced
tumors. This is important, as the population of integrations within a tumor are not all
clonal. In fact, given the heterogeneous mix of cells within a tumor, it is often
challenging to determine whether a given integration site is biologically relevant to the
development of the tumor (i.e., clonally expanded within the tumor) or merely a random
event in a small population of cells.
Improved determination of clonality is expected to allow insight into the
processes underlying tumor development. For example, genes that fall into the sub-clonal
category may be those that aid in tumor growth but are not required for tumor initiation.
The number of tumors to be sequenced may also be increased, as the sequencing depth
will no longer be limiting with these newer platforms. This increase in number of tumors
and sequences will help in inferring the complex genetics underlying tumor formation,
development and metastasis. While a dozen (11-17) genes must be mutated, they are
derived from an estimated population of dozens to hundreds of genes (71 colorectal; 122
breast; Wood et al. 2007). Not all combinations of mutations will be sufficient to cause
tumors, but the investigation of the complex genetics is likely to require several dozen, if
not hundreds, of independent tumors.
Given sufficient depth of sequencing, future experiments should be able to predict
the order in which mutations have occurred. More recent mutations will be present in a

51
sub-population of the tumor and thus should be observed less prevalently than initiating
or driving mutations.
52
CHAPTER 7
FUTURE WORK
Future work on IAS will focus on making the system more accessible and useful
to investigators. Included in this effort is improved reporting of QC metrics for each step
of the analytic pipeline (e.g. number of sequences per tumor, number of sequences per
tumor that align to the genome). This data will be presented for entire experiments and
for individual tumors. Such metrics enable investigators to evaluate the preparation of
specific tumors, or with their overall protocol.
Although the majority of Sleeping Beauty research to date has utilized the
laboratory mouse, nothing prohibits utilizing this system to study cancer in other
organisms. The only requirements are a donor site with a cassette of SB elements and a
SB transposase under the transcriptional control of a functional promoter. To date, the SB
system has been utilized in mouse, rat (Lu et al., 2007) and zebrafish (Davidson et al.,
2003), and is likely to be utilized in other organisms – including human tissue cultures.
IAS has been extended to include the analysis of insertional mutagenesis experiments
using the SB system in mouse, rat, zebra fish and human tissue cultures. Extending IAS
to allow analysis versus multiple organisms is virtually identical to supporting multiple
reference genomes within a single organism. This capacity will allow comparison to
previously reported results that may be difficult, or even impossible to replicate/validate
among different reference genomes.
SB elements transpose both globally (i.e., between chromosomes) and locally.
The prevalence of local re-integration (local hopping) makes identification of CISs and
gCISs near the SB cassette challenging. The current implementation of IAS addresses
this challenge by excluding the entire donor chromosome from further analysis (for each
tumor). While effective, this method is overly conservative. Another piece of future work
is to develop a strategy based upon the known properties of SB transposons –

53
specifically, their propensity for “local hopping”. One strategy to account for an observed
bias of integrations near the donor cassette is to empirically determine the overabundance
of integrations. With such a strategy, the significance of integration clusters (CISs or
gCISs) are determined based upon deviation from the expected distribution away from
the site of the SB cassette.
A value-added annotation that will be incorporated into IAS is the prediction of
gene effect – is the gene likely to be an oncogene or a tumor suppressor? Previous results
have shown that SB integrates throughout tumor suppressor genes in both orientations. In
contrast, the pattern of SB integration within oncogenes is often restricted to a limited
number of sites/regions within the transcript all with the same orientation. In this way, the
exogenous promoter within the SB element can drive expression of the gene (or a
fragment thereof).
The main concentration of IAS has been to identify genes involved in cancer.
New research points to the involvement of ncRNA as well. Some micro RNA have been
associated with various types of cancer (Meltzer, 2005). A cluster of mir-17-92 micro
RNA have been observed to be substantially amplified in B-cell lymphomas when
compared to normal cells (He et al., 2005). To realize the full potential of SB mediated
insertional mutagenesis there is a need to look beyond protein-coding genes and their
promoters.
Although Sleeping Beauty overcomes various limitations of viral-mediated
insertional mutagenesis it has its share of limitations. The most significant of which is
local hopping - the tendency of transposons to re-integrate in the proximity of the donor
site. This phenomenon can results in false CISs on the donor chromosome. To alleviate
such local-hopping-derived false CISs, IAS removes all the integrations from the donor
chromosome when analyzing integrations for CISs and gCISs. Removing the entire donor
chromosome in identifying CISs and gCISs may be extremely conservative. As more and

54
more researchers look toward SB for their insertional mutagenesis there is a necessity to
develop method to estimate the effect of local hopping and include it into the IAS system.
Future extensions to IAS should include the ability for the user of IAS to be able
to access data across experiments. The annotation file currently is stored on IAS server in
a tab delimited text format. A database has to optimally designed to hold all the
annotation data on IAS and give the user of IAS the ability to query across their
experiments on the basis of gene, locus, experiment or position etc. This will give the
user an opportunity to take a holistic approach across experiments in understanding
cancer. This type of meta-analysis can lead to identification of significant cancer gene
networks and mutation profiles of the particular tumor under study.
With the advent of new genome sequence technologies and the staggering
amounts of data they generate there is a need to look beyond identifying CIS/gCISs and
more towards genetic networks. The systems approach as in Vrieze et al. 2010 (In
Preparation) elucidate the distinct genetic signatures of the tumors based on the cell of
origin, thus facilitating an appropriate therapy, drugs or a combination of both in future.
Although there is significant work before we can actually customize drugs and therapy
based on the cell of origin or genetic makeup of the individual, careful design of
experiments and databases now can facilitate such a possibility in the future. The
identification and graphical representation of the genetic networks based on SB data
should be made a part of the analysis pipeline.
As mention in the earlier chapters of this thesis cancer is caused by an initiating
mutation followed by clonal expansion and one of those cells acquiring another mutation
and so on. Understanding the order of these mutations is important to understand the
cause, progression and possible cure for cancer. Vrieze et al. 2010 (In Preparation) is a
right step in that direction and answers a tiny part of the question, more needs to done in
terms careful design of the experiments by experiments biologists and computational
techniques by computational biologists.

55
Sleeping Beauty mediated mutagenesis can both drive the expression of genes as
well as truncate the transcript based on its location vis-à-vis the gene. IAS needs to
incorporate this particular piece of information for every insertion in the annotation files
based on the location and orientation of SB integration.
In summary, Sleeping Beauty mediated mutagenesis is a very potent tool in the
realm of insertional mutagenesis. SB screens coupled with next-gen sequencing
technologies provide a unique opportunity for researchers to better understand cancer
initiation, progression and metastasis. IAS provides the necessary analysis for
experimental biologists to analyze the data from their SB screens and more and more
analysis are yet to be included into IAS. IAS caters and continues to cater to the
analytical needs of the scientific SB community and aid them in understanding cancer.

56
APPENDIX
Table A1. Common Insertion Sites (CIS) resulting from the Vav model of Lymhoma in mice.
Locus Gene
chr15:61815526-61816594
chr7:28389685-28390957 Akt2
chr8:93822801-93824413 Rpgrip1l
chr11:11656565-11664512 Ikzf1
chr11:100663088-100668697 Stat5b
chr14:26272755-26359791
chr15:10120038-10184431 Prlr
chr16:92701558-92784852 Runx1
chr16:95614472-95706278 Erg
chr2:26321396-26352976 Notch1
chr2:98502691-98502693
chr2:117164773-117179489
chr2:163028649-163099637
chr5:28496409-28496608 En2
chr6:98974529-99018171 Foxp1
chr9:58431692-58566776
chr9:89864784-89869039 Rasgrf1
Note: The table has two columns one indication the genomic coordinates of the CIS and the second shows any gene within the CIS.

57
Table A2. Common Insertion Sites (CIS) resulting from the Lck model of Lymphoma in mice.
Locus Genes
chr1:13283909-13285197 Ncoa2
chr11:45715454-45717555 Clint1
chr11:51094639-51097156
chr11:117102602-117104929 9-Sep
chr12:113914333-113916396
chr14:119360457-119361372 Dnajc3
chr11:11603112-11761529
chr11:100672169-100715001
chr13:20286545-20344544 Elmo1
chr15:61815527-61914293
chr16:11080419-11172597
chr17:51953094-51993825
chr19:32857358-32876621 Pten
chr2:26321378-26321567 Notch1
chr4:32361368-32515521 Bach2
chr5:28496383-28594034
chr5:34169482-34192039 Whsc1
chr5:108156691-108171723
chr6:99116028-99208018
Note: The table has two columns one indication the genomic coordinates of the CIS and the second shows any gene within the CIS.

58
Table A3. Common Insertion Sites (CIS) resulting from the CD4 model of Lymphoma in mice.
Locus Genes
chr13:52037239-52037272
chr15:97660441-97660441 Hdac7
chr2:92185537-92185676 Phf21a
chr10:66667178-66678128 Jmjd1c
chr11:100668852-100744229
chr12:113906157-113937487
chr12:117530220-117531696 Esyt2
chr14:26242047-26266436
chr14:32599105-32612971 Ankrd28
chr15:61807662-61816592
chr17:5257408-5281984 Arid1b
chr17:32336596-32360817 Brd4
chr17:47683518-47730095 Ccnd3
chr17:51966211-51989407
chr17:74967487-74989453 Birc6
chr17:80839505-80848431 Sos1
chr18:7910054-7925447 Wac
chr2:37557045-37569531
chr2:72776167-72782502 Sp3
chr2:91709387-91755213 Ambra1
chr3:60344064-60410040 Mbnl1
chr3:89853594-89895348
chr3:103681864-103712615 Ptpn22
chr4:88923521-88935959 Cdkn2a
chr4:100876516-100935515 Jak1
chr4:136040738-136081775 Luzp1
chr5:28496413-28496493 En2
chr5:34143897-34197790
chr5:100384165-100401722

59
Table A3. Contd
chr5:105963241-105979455 Lrrc8c
chr5:108134001-108166022
chr6:115556842-115621151
chr7:28367953-28391539
chr8:26716621-26746241 Whsc1l1
chr8:109996124-110025131 Wwp2
chr9:31110185-31142324
Note: The table has two columns one indication the genomic coordinates of the CIS and the second shows any gene within the CIS.
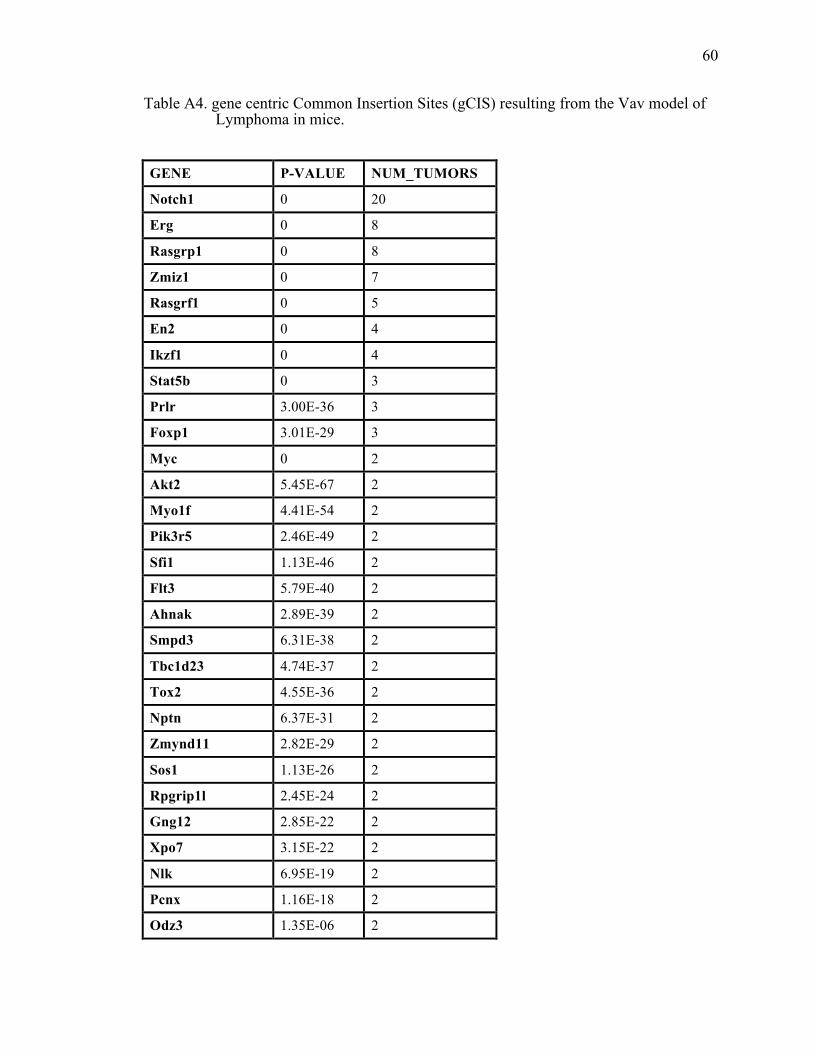
60
Table A4. gene centric Common Insertion Sites (gCIS) resulting from the Vav model of Lymphoma in mice.
GENE P-VALUE NUM_TUMORS
Notch1 0 20
Erg 0 8
Rasgrp1 0 8
Zmiz1 0 7
Rasgrf1 0 5
En2 0 4
Ikzf1 0 4
Stat5b 0 3
Prlr 3.00E-36 3
Foxp1 3.01E-29 3
Myc 0 2
Akt2 5.45E-67 2
Myo1f 4.41E-54 2
Pik3r5 2.46E-49 2
Sfi1 1.13E-46 2
Flt3 5.79E-40 2
Ahnak 2.89E-39 2
Smpd3 6.31E-38 2
Tbc1d23 4.74E-37 2
Tox2 4.55E-36 2
Nptn 6.37E-31 2
Zmynd11 2.82E-29 2
Sos1 1.13E-26 2
Rpgrip1l 2.45E-24 2
Gng12 2.85E-22 2
Xpo7 3.15E-22 2
Nlk 6.95E-19 2
Pcnx 1.16E-18 2
Odz3 1.35E-06 2

61
Table A4. Contd Arhgap6 4.00E-05 2
930007M17Rik 4.02E-05 2
Note: The first column indicates the Gene the second is the P-value of the significance of insertions within that particular gene and finally the third column indicates the number of tumors with integration within that particular gene

62
Table A5. gene centric Common Insertion Sites (gCIS) resulting from the Lck model of Lymphoma in mice.
GENE P-VALUE NUM_TUMORS
Stat5b 0 6
Bach2 1.21E-69 6
Whsc1 0 5
Pten 0 4
Myc 0 3
Notch1 0 3
Stat5a 0 3
Ikzf1 3.51E-64 3
Elmo1 1.18E-13 3
Pard3 1.30E-10 3
Akt1 0 2
D10Bwg1364e 0 2
En2 0 2
Samd4b 2.04E-66 2
Spsb1 6.42E-58 2
Dnajc3a 1.97E-50 2
Orc2l 1.72E-45 2
Sfi1 1.84E-42 2
Clint1 3.05E-38 2
Txndc11 4.84E-37 2
2700078E11Rik 6.21E-35 2
2610024E20Rik 4.19E-32 2
Map3k4 1.72E-31 2
1190002A17Rik 1.73E-30 2
Arhgap17 1.73E-30 2
Whsc1l1 1.24E-29 2
Dyrk1a 9.00E-27 2
Herc3 2.36E-25 2
Satb1 7.42E-24 2

63
Table A5. Contd Rasgrf1 1.09E-22 2
Clpb 3.56E-22 2
Jak1 4.22E-22 2
Gng12 2.70E-20 2
Upf2 2.35E-19 2
Ash1l 3.58E-19 2
0910001A06Rik 3.11E-18 2
Pds5b 9.92E-16 2
Tbl1x 1.16E-15 2
Fyn 1.43E-15 2
Prkch 1.43E-15 2
Trerf1 1.46E-15 2
Mllt10 3.31E-14 2
Map3k5 8.75E-13 2
Birc6 2.00E-12 2
Foxp1 2.13E-12 2
Zcchc7 2.19E-12 2
Pitpnc1 5.36E-12 2
Ncoa2 1.07E-11 2
Col23a1 1.32E-11 2
Ext1 1.14E-09 2
Mllt3 4.13E-09 2
Ghr 9.50E-09 2
Adam12 1.29E-08 2
Note: The first column indicates the Gene the second is the P-value of the significance of insertions within that particular gene and finally the third column indicates the number of tumors with integration within that particular gene

64
Table A6. gene centric Common Insertion Sites (gCIS) resulting from the CD4 model of Lymphoma in mice.
GENE P-VALUE NUM_TUMORS
Myc 0 12
Akt2 0 10
En2 0 10
Gfi1 0 9
Whsc1 0 8
Ccnd3 0 6
Jak1 0 6
Phf21a 7.98E-57 6
D030051N19Rik 1.41E-53 6
Cdkn2a 0 5
Brd4 2.32E-83 5
Akt1 0 4
Stat5b 0 4
Raf1 5.08E-75 4
Sos1 2.87E-47 4
Mbnl1 5.19E-30 4
Ankrd28 1.48E-28 4
Birc6 1.66E-23 4
Stk39 1.02E-19 4
Arid1b 1.80E-16 4
Bach2 9.25E-16 4
Lpp 5.48E-08 4
Sp3 4.12E-45 3
Ptpn22 3.19E-42 3
Ncoa3 4.04E-35 3
Lrrc8c 4.63E-32 3
Wac 7.71E-32 3
Luzp1 1.64E-29 3
Wwp2 5.92E-28 3

65
Table A6. Contd Satb1 1.62E-26 3
D12Ertd551e 1.78E-25 3
Ttc3 5.54E-24 3
Nsd1 6.32E-23 3
Adam10 1.01E-21 3
Crebbp 4.15E-20 3
Osbpl8 1.13E-18 3
Tbl1xr1 1.78E-18 3
Prlr 8.92E-17 3
Exoc2 9.61E-16 3
Nipbl 2.08E-13 3
Gfi1b 0 2
Gpx3 0 2
Lck 0 2
Letm2 1.68E-86 2
Upf1 3.43E-68 2
4933434E20Rik 1.09E-59 2
BC005537 2.94E-57 2
Stat5a 6.68E-56 2
Il21r 3.33E-45 2
Hdac7a 5.70E-43 2
Rbpms2 1.85E-39 2
Ppp1r2 5.93E-34 2
Rnf170 7.44E-34 2
Hnrpd 3.50E-33 2
Pacsin1 8.36E-32 2
Slc26a8 2.94E-31 2
Son 5.15E-30 2
BC037393 5.46E-29 2
Mtfr1 2.32E-28 2
Ahcyl1 3.17E-28 2

66
Table A6. Contd Ddx6 3.96E-28 2
Fnbp4 2.95E-27 2
Ppm1a 5.04E-27 2
Gse1 2.77E-25 2
Inpp5b 1.80E-24 2
Zfp592 1.19E-23 2
Pik3r5 5.11E-23 2
Zcchc6 8.61E-23 2
Kif5b 2.00E-22 2
Rassf3 3.76E-22 2
Paqr5 5.55E-22 2
Vrk1 8.63E-20 2
Sh3pxd2b 1.03E-19 2
Ugp2 2.15E-19 2
Prdm10 3.68E-19 2
Nup153 5.16E-19 2
Ncoa6 9.79E-19 2
Ubap2l 2.25E-18 2
Rai1 5.83E-18 2
Pdpk1 7.38E-18 2
Nfatc1 9.88E-18 2
Wasl 1.39E-17 2
Ryk 2.43E-17 2
BC037112 8.26E-17 2
Narg1 3.95E-16 2
Fip1l1 5.91E-16 2
Spred1 6.16E-16 2
Jak2 1.19E-15 2
Nfyc 3.10E-15 2
Setd2 8.36E-15 2
Uimc1 9.13E-15 2

67
Table A6. Contd Fkbp5 9.24E-15 2
Traf3 1.71E-14 2
Rbm26 2.65E-14 2
Epc1 3.55E-14 2
Bcar3 6.74E-14 2
Eya3 9.25E-14 2
Eif3h 1.12E-13 2
Rreb1 3.45E-13 2
Fbxl11 3.73E-13 2
Pctk2 5.36E-13 2
Col13a1 5.43E-13 2
Nfkb1 1.25E-12 2
Vav2 2.55E-12 2
Pum2 3.06E-12 2
Hook3 3.47E-12 2
2600010E01Rik 4.55E-12 2
Rasgrf1 9.15E-12 2
Cox10 1.68E-11 2
Memo1 1.83E-11 2
Prr8 3.96E-11 2
Spnb2 1.98E-10 2
Zmiz1 2.29E-10 2
Pi4ka 2.35E-10 2
Cnot2 2.43E-10 2
Galnt7 2.73E-10 2
Eftud1 8.52E-10 2
Ate1 4.21E-09 2
Cbara1 5.54E-09 2
Nlk 5.60E-09 2
Scmh1 6.85E-09 2
Eml4 6.93E-09 2

68
Table A6. Contd Epb4.1 7.43E-09 2
Wnk1 1.33E-08 2
A130090K04Rik 1.36E-08 2
Strbp 1.58E-08 2
Rftn1 1.62E-08 2
Ppp2r5e 2.45E-08 2
Arhgap18 2.91E-08 2
Tbl1x 3.48E-08 2
Egfr 3.74E-08 2
Fyn 3.87E-08 2
Utx 8.91E-08 2
Mef2a 1.14E-07 2
Ankrd17 2.01E-07 2
Tle4 2.23E-07 2
1700025G04Rik 2.72E-07 2
Hivep2 4.46E-07 2
Jarid2 6.46E-07 2
Zfand3 9.44E-07 2
Map3k5 1.03E-06 2
Cdyl 1.41E-06 2
Note: The first column indicates the Gene the second is the P-value of the significance of insertions within that particular gene and finally the third column indicates the number of tumors with integration within that particular gene

69
Table A7. The table below illustrates the gene pair and the p-value of the significance of the interaction for the Vav model of lymphoma in mice
Gene Pair P-Value
Smpd3-Nlk 0.001587302
Myc-Pcnx 0.001587302
Foxp1-Ahnak 0.004761905
Table A8. The table below illustrates the gene pair and the p-value of the significance of the interaction for the Lck model of lymphoma in mice
Gene Pair P-Value
Foxp1-Gfi1 0.001221001
Ash1l-Ext1 0.002645503
Sfi1-Tbl1x 0.002645503
Gng12-1190002A17Rik 0.002645503
Birc6-Jak1 0.002645503
Birc6-Spsb1 0.002645503
Jak1-Spsb1 0.002645503
Ghr-Pten 0.004737485
Table A9. The table below illustrates the gene pair and the p-value of the significance of the interaction for the CD4 model of lymphoma in mice
Gene Pair P-Value
Ddx6-Prr8 0.000886525
Rai1-Map3k5 0.000886525
Hnrpd-Ttc3 0.002659574
Ncoa3-A130090K04Rik 0.002659574

70
Table A10. Common Insertion Sites (CIS) resulting from the Colorectal cancer dataset (Starr et al).
Locus Gene
chr10:27754043-27961056 Ptprk
chr10:107581818-107796983 Pawr, Ppp1r12a
chr11:3034435-3091599 Sfi1
chr11:86472785-86618762 Cltc, Dhx40, Ptrh2
chr12:16856748-16994458 Rock2
chr12:53545183-53660649 Arhgap5
chr12:83296372-83512790 Sipa1l1
chr13:32253943-32428762 Gmds
chr13:37950816-38025994 Rreb1
chr13:55328902-55422384 Nsd1, Rab24
chr13:99507105-99714277 Fcho2, Tnpo1
chr13:102458227-102543614 Pik3r1
chr13:112221644-112277879 Gpbp1
chr14:79912079-79998101 Elf1, Sugt1
chr14:122485525-122593351 A330035P11Rik, Clybl, Tm9sf2
chr15:42871883-43094231 Eif3e
chr16:38076150-38231623 Gsk3b
chr16:96216709-96345221 Brwd1, Hmgn1
chr17:29090379-29206838 Kctd20, Sfrs3, Stk38
chr17:74935046-75065052 Birc6
chr18:7874331-7972740 Wac
chr18:34271958-34571672 Apc, Pkd2l2, Reep5, Srp19
chr18:35629270-35825208 2010001M09Rik, 5133400G04Rik, Matr3, Paip2, Sil1, Slc23a1, Snora74a
chr18:50050865-50110350 Dmxl1
chr18:73820770-73946223 Elac1, Me2
chr19:32194482-32324193 Sgms1
chr2:20822454-20905542 Arhgap21
chr2:38609630-38728576 Mir181a-2, Mir181b-2, Nr6a1
chr2:90783716-90927503 Cugbp1, Psmc3, Rapsn, Slc39a13
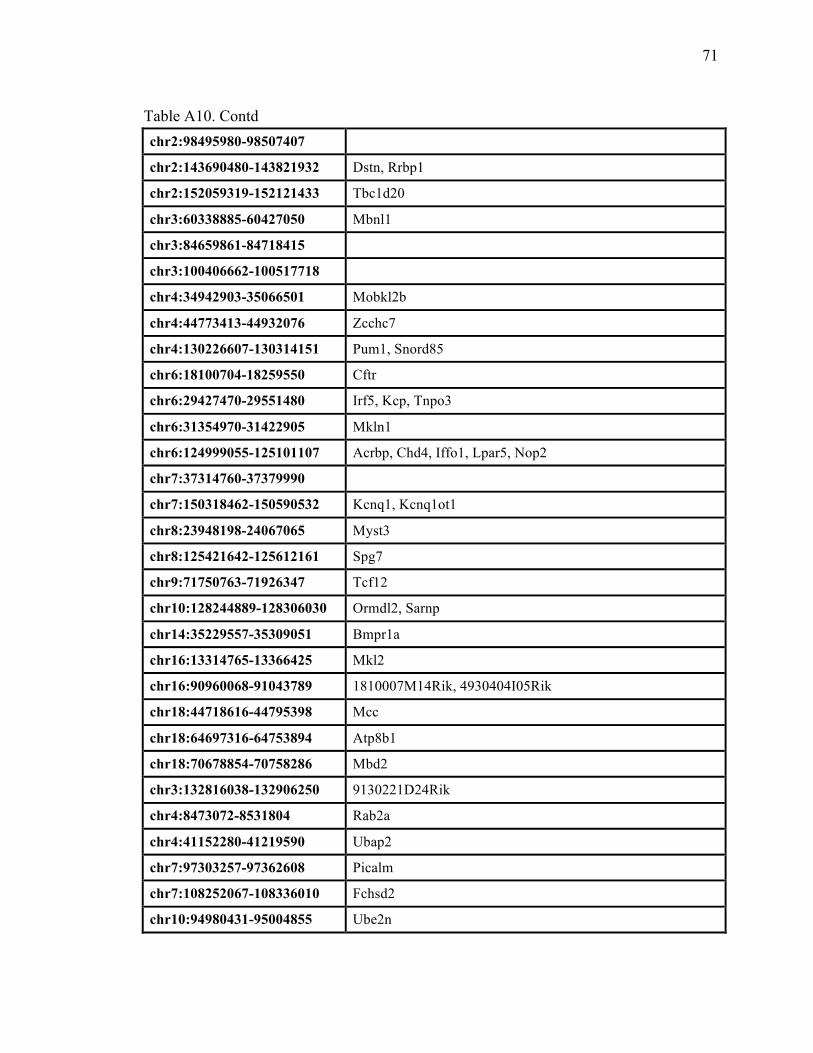
71
Table A10. Contd chr2:98495980-98507407
chr2:143690480-143821932 Dstn, Rrbp1
chr2:152059319-152121433 Tbc1d20
chr3:60338885-60427050 Mbnl1
chr3:84659861-84718415
chr3:100406662-100517718
chr4:34942903-35066501 Mobkl2b
chr4:44773413-44932076 Zcchc7
chr4:130226607-130314151 Pum1, Snord85
chr6:18100704-18259550 Cftr
chr6:29427470-29551480 Irf5, Kcp, Tnpo3
chr6:31354970-31422905 Mkln1
chr6:124999055-125101107 Acrbp, Chd4, Iffo1, Lpar5, Nop2
chr7:37314760-37379990
chr7:150318462-150590532 Kcnq1, Kcnq1ot1
chr8:23948198-24067065 Myst3
chr8:125421642-125612161 Spg7
chr9:71750763-71926347 Tcf12
chr10:128244889-128306030 Ormdl2, Sarnp
chr14:35229557-35309051 Bmpr1a
chr16:13314765-13366425 Mkl2
chr16:90960068-91043789 1810007M14Rik, 4930404I05Rik
chr18:44718616-44795398 Mcc
chr18:64697316-64753894 Atp8b1
chr18:70678854-70758286 Mbd2
chr3:132816038-132906250 9130221D24Rik
chr4:8473072-8531804 Rab2a
chr4:41152280-41219590 Ubap2
chr7:97303257-97362608 Picalm
chr7:108252067-108336010 Fchsd2
chr10:94980431-95004855 Ube2n

72
Table A10. Contd chr12:85511413-85559027 C130039O16Rik
chr12:113067677-113103959 Ppp1r13b
chr13:95562479-95603515 Tbca
chr14:98238561-98271393 Dach1
chr5:147054052-147104435 Cdk8
chr6:28521726-28574191 Snd1
chr8:4273103-4315776 Elavl1, Timm44
chr18:34762777-34782440 Brd8
chr2:121863618-121884143 Eif3j, Spg11
chr10:115930162-115935919 Cnot2
chr15:96122423-96132009
chr3:29908133-29915041 Mecom
chr4:32429626-32429626 Bach2
chr5:99436726-99442501 Prkg2
chr9:59727162-59737526 Myo9a
chr14:71455022-71455022
chr16:95611851-95612545 Erg
chr18:66678376-66679326
chr4:43240000-43240000 Unc13b
chr4:73380842-73382240 Rasef
chr5:34928558-34928997 Add1
chr6:103599140-103599204 Chl1
chr9:14125938-14127333 Sesn3
chr9:121505886-121505886 Lyzl4
Note: The table has two columns one indication the genomic coordinates of the CIS and the second shows any gene within the CIS.

73
Table A11. gene centric Common Insertion Sites (gCIS) resulting from the Colorectal cancer dataset(Starr et al).
GENE P-VALUE NUM_TUMORS
Apc 0 36
Wac 7.49E-52 12
Sfi1 1.67E-44 9
Rspo2 1.19E-41 16
Cugbp1 4.18E-35 10
Kcnq1 2.09E-30 17
Ube2n 3.50E-29 6
Cldn15 5.69E-27 3
Brd8 3.35E-24 5
Csnk2a1 1.45E-23 7
Tm9sf2 3.27E-23 7
Gpbp1 2.16E-22 8
Rab24 1.88E-20 2
B430203M17Rik 3.02E-20 3
Rreb1 3.53E-20 8
Tssk2 9.46E-20 2
Nol1 2.23E-19 3
Tcf12 8.89E-19 15
Cltc 1.87E-18 7
Kif20a 5.60E-18 3
Reep6 1.04E-17 2
Pik3r1 1.34E-17 7
Kif1c 1.64E-17 4
Ubap2 1.65E-17 7
Matr3 1.70E-17 5
Notch1 3.17E-17 4
Elavl1 4.18E-17 5
Rab2 4.71E-17 7
Ankrd11 9.27E-17 9
Kctd20 9.36E-17 3
Zcchc7 1.10E-16 11

74
Table A11. Contd Ihpk2 1.25E-16 3
Surf2 1.32E-16 2
Tbca 1.48E-16 6
Tssk1 1.51E-16 2
Prelid1 2.26E-16 2
Sipa1l1 2.49E-16 10
Gsk3b 4.41E-16 10
Nip7 6.71E-16 2
Tigd3 6.71E-16 2
Rspo1 7.09E-16 3
Tnpo1 9.31E-16 7
Trip6 1.10E-15 2
Ndufv2 1.26E-15 4
Pcsk4 2.23E-15 2
Ldhd 2.65E-15 2
Myst3 2.67E-15 7
Rasl11a 3.73E-15 2
Sar1a 4.26E-15 3
Med22 5.81E-15 2
Timm8b 6.84E-15 2
Cdk8 9.03E-15 6
Dstn 1.05E-14 4
4833436C18Rik 1.59E-14 2
Wdr6 1.96E-14 2
Ppp1r13b 2.07E-14 6
Clps 3.23E-14 2
Arhgap21 6.60E-14 7
2310065K24Rik 1.06E-13 3
Eif3j 1.29E-13 4
Mkln1 1.39E-13 8
Stag3 1.39E-13 4
Trim25 1.49E-13 3
Orai3 1.51E-13 2

75
Table A11. Contd Elf1 1.66E-13 7
1700001O22Rik 1.73E-13 2
Tceb2 1.73E-13 2
Tnpo3 1.82E-13 6
Bmpr1a 1.84E-13 7
Suv420h2 1.89E-13 2
Arhgap5 2.50E-13 6
Dctn4 2.81E-13 4
Cish 4.08E-13 2
Cbx2 4.25E-13 2
Gtf2h4 4.43E-13 2
Foxd4 4.81E-13 2
Ugcg 1.07E-12 4
Trib1 1.16E-12 2
Wasf2 1.17E-12 5
Rab5b 1.20E-12 3
Arf3 1.31E-12 3
Slc9a1 1.35E-12 4
Metap2 1.77E-12 4
Mobkl2b 1.85E-12 9
Gpr175 2.55E-12 2
Polr2c 2.55E-12 2
Sesn3 2.62E-12 5
Sipa1 2.65E-12 2
Pum1 2.67E-12 7
Taf9 3.28E-12 3
1700040I03Rik 3.53E-12 2
Rock2 4.91E-12 7
Nr6a1 6.22E-12 10
Ghrl 6.61E-12 2
Tesk1 6.61E-12 2
4930570C03Rik 7.07E-12 2
Ccdc47 9.25E-12 3

76
Table A11. Contd 1110005A23Rik 1.05E-11 5
Cnot2 1.12E-11 7
Cdkn1b 1.13E-11 2
Tkt 1.30E-11 3
Atp8b1 1.48E-11 7
Otoa 1.48E-11 5
Mbnl1 1.49E-11 8
Sp6 1.56E-11 2
Gmds 1.71E-11 17
B4galt1 2.39E-11 4
8030462N17Rik 2.83E-11 6
Med1 2.83E-11 4
Ralgds 3.38E-11 3
Olfr1263 3.91E-11 2
Supt16h 4.54E-11 4
Grin2d 5.09E-11 3
BC018242 5.23E-11 2
Lass6 9.50E-11 10
Dlg1 9.60E-11 10
Ddb1 1.03E-10 3
Rragc 1.12E-10 3
Ormdl2 1.38E-10 2
Stt3b 1.57E-10 5
Plcb3 1.62E-10 2
Olfr390 2.04E-10 2
Hsd17b12 2.36E-10 7
Gpr21 2.38E-10 2
Olfr389 2.64E-10 2
Cyp1b1 3.46E-10 2
Lmtk2 3.77E-10 5
Spg7 3.82E-10 3
Atp5j2 3.91E-10 2
Narg1 4.88E-10 5

77
Table A11. Contd Nckipsd 6.90E-10 2
Pml 7.09E-10 3
Gga1 7.40E-10 2
Picalm 7.69E-10 6
Ipo7 7.72E-10 4
Cst9 7.92E-10 2
Hpcal4 8.29E-10 2
Ephb2 8.32E-10 6
Abcf1 8.67E-10 2
Rhbdd3 9.49E-10 2
Atp2a2 1.03E-09 4
Ppa1 1.05E-09 3
Surf6 1.06E-09 2
2900010J23Rik 1.08E-09 2
A930037G23Rik 1.11E-09 2
Csad 1.38E-09 2
Cep57 1.54E-09 3
Cog8 1.60E-09 2
Chchd3 1.74E-09 10
Mrpl32 1.74E-09 2
AA673488 1.76E-09 3
Gpc2 2.11E-09 2
Hmox2 2.47E-09 3
6332401O19Rik 2.59E-09 2
Nfkbil1 3.04E-09 2
Polr2d 3.10E-09 2
Prdm16 3.40E-09 8
Nsd1 5.13E-09 6
Slc27a5 5.24E-09 2
Arid1b 5.42E-09 10
Rbm35a 5.62E-09 4
Ttc9 5.62E-09 3
2610205E22Rik 5.87E-09 2

78
Table A11. Contd Il20rb 6.44E-09 3
Fbn2 6.71E-09 8
Zfp90 7.74E-09 2
9130221D24Rik 7.76E-09 5
Svil 8.02E-09 6
Birc6 1.03E-08 8
Sec63 1.08E-08 5
Med21 1.15E-08 2
Zfp191 1.17E-08 2
Acrbp 1.27E-08 2
Sgms1 1.36E-08 6
Mgat3 1.39E-08 3
Sdhd 1.41E-08 2
1810037C20Rik 1.43E-08 2
Rere 1.53E-08 10
Rcc2 1.67E-08 2
Actr2 1.68E-08 4
Mum1 1.73E-08 2
BC017647 1.89E-08 4
Usp6nl 1.95E-08 6
Myt1 2.02E-08 4
Fchsd2 2.30E-08 8
Brd7 2.36E-08 3
Znrf3 2.44E-08 7
Dhdh 2.64E-08 2
Irf8 2.64E-08 2
Wdr4 2.86E-08 2
Itgb1 3.12E-08 4
Inadl 3.54E-08 10
Sfrs3 3.67E-08 2
Wdr21 3.96E-08 2
Slc19a1 4.48E-08 2
Sltm 4.60E-08 4

79
Table A11. Contd Eif2s1 5.23E-08 3
Aldh18a1 5.75E-08 3
Blnk 5.94E-08 4
Ppm2c 6.10E-08 2
Tbc1d13 6.19E-08 2
Fkbp7 7.25E-08 2
Lrrc8d 7.38E-08 5
Psd3 7.93E-08 10
Fhod1 8.12E-08 2
Arid1a 8.32E-08 4
Atxn2 8.76E-08 5
Ptcd3 9.14E-08 3
Prss23 9.34E-08 2
Ddi2 9.79E-08 3
Diap1 1.01E-07 5
Erlin2 1.28E-07 2
Ogdh 1.44E-07 4
Lrrc8b 1.46E-07 4
Dmxl1 1.57E-07 7
Tox3 1.58E-07 5
Rbm22 1.62E-07 2
Leng4 1.64E-07 2
Ap1m2 1.72E-07 2
Cxcl15 1.72E-07 2
Atg12 1.79E-07 2
Pcbp2 1.79E-07 3
AW554918 1.83E-07 6
Dsc2 1.94E-07 3
2700078E11Rik 2.03E-07 4
Bop1 2.16E-07 2
1700021C14Rik 2.22E-07 2
Pum2 2.25E-07 5
Spsb1 2.26E-07 3
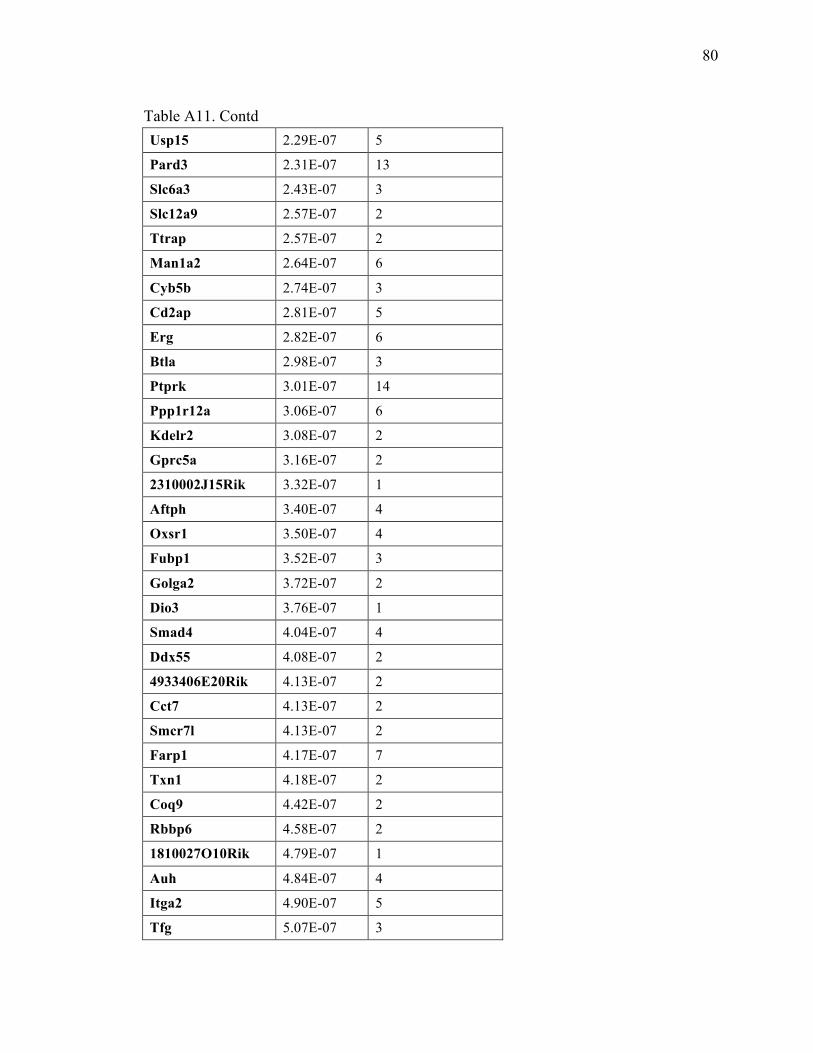
80
Table A11. Contd Usp15 2.29E-07 5
Pard3 2.31E-07 13
Slc6a3 2.43E-07 3
Slc12a9 2.57E-07 2
Ttrap 2.57E-07 2
Man1a2 2.64E-07 6
Cyb5b 2.74E-07 3
Cd2ap 2.81E-07 5
Erg 2.82E-07 6
Btla 2.98E-07 3
Ptprk 3.01E-07 14
Ppp1r12a 3.06E-07 6
Kdelr2 3.08E-07 2
Gprc5a 3.16E-07 2
2310002J15Rik 3.32E-07 1
Aftph 3.40E-07 4
Oxsr1 3.50E-07 4
Fubp1 3.52E-07 3
Golga2 3.72E-07 2
Dio3 3.76E-07 1
Smad4 4.04E-07 4
Ddx55 4.08E-07 2
4933406E20Rik 4.13E-07 2
Cct7 4.13E-07 2
Smcr7l 4.13E-07 2
Farp1 4.17E-07 7
Txn1 4.18E-07 2
Coq9 4.42E-07 2
Rbbp6 4.58E-07 2
1810027O10Rik 4.79E-07 1
Auh 4.84E-07 4
Itga2 4.90E-07 5
Tfg 5.07E-07 3

81
Table A11. Contd Centb2 5.28E-07 5
Wnk1 6.29E-07 6
Ubr2 6.34E-07 4
Ndufab1 6.59E-07 2
B3gnt4 7.31E-07 1
Lims1 7.63E-07 5
Memo1 7.63E-07 5
2310011J03Rik 8.16E-07 1
Cdc42 8.75E-07 3
Hip2 8.88E-07 4
Sstr2 9.11E-07 1
Ppp1r16a 9.15E-07 2
Coil 9.25E-07 2
Acly 9.66E-07 3
A730036I17Rik 1.00E-06 2
Dio2 1.01E-06 2
Edc3 1.02E-06 3
Slc9a5 1.02E-06 2
Polk 1.03E-06 4
Pisd 1.07E-06 3
Ankmy2 1.08E-06 3
Fndc3b 1.08E-06 8
Tmprss6 1.08E-06 2
Ppp2r5e 1.14E-06 6
Stau1 1.15E-06 3
Tdrd3 1.25E-06 6
Eif4g1 1.26E-06 2
0610010O12Rik 1.31E-06 3
Them2 1.34E-06 2
BC048651 1.40E-06 2
Fcho2 1.41E-06 5
Ptch1 1.41E-06 3
H1fx 1.43E-06 1

82
Table A11. Contd BC051227 1.48E-06 1
Pdxk 1.48E-06 2
Eif3eip 1.51E-06 2
6330569M22Rik 1.52E-06 2
Eif4ebp2 1.52E-06 2
Setd1a 1.52E-06 2
Chuk 1.57E-06 3
Dgcr2 1.67E-06 3
4833409A17Rik 1.69E-06 2
Gm757 1.69E-06 1
Rfc1 1.70E-06 4
Tsc22d2 1.84E-06 4
Pspn 1.87E-06 1
Smarcc1 1.91E-06 5
Ndufs4 1.96E-06 5
Pdxdc1 2.00E-06 4
Stx7 2.01E-06 3
Mbp 2.21E-06 4
Lyzl4 2.22E-06 3
Zfp207 2.24E-06 2
Rad17 2.29E-06 3
Vcl 2.30E-06 5
Phf12 2.31E-06 3
Bace2 2.32E-06 4
Itpkc 2.45E-06 2
Rfxdc2 2.45E-06 5
1110020G09Rik 2.52E-06 3
Snd1 2.59E-06 10
Rnf145 2.62E-06 3
Note: The first column indicates the Gene the second is the P-value of the significance of insertions within that particular gene and finally the third column indicates the number of tumors with integration within that particular gene.

83
Table A12. Common Insertion Sites (CIS) resulting from the Liver tumor dataset The table has two columns one indication the genomic coordinates of the CIS and the second shows any gene within the CIS.
Locus Gene
chr4:43405247-43405438 Rusc2
chr12:110838022-110848589
chr19:3461083-3574380 Saps3
chr5:28496413-28496604 En2
chr8:70492568-70640778
Note: The table has two columns one indication the genomic coordinates of the CIS and the second shows any gene within the CIS.
Table A13. gene centric Common Insertion Sites (gCIS) resulting from the Liver tumor dataset.
GENE P-VALUE NUM_TUMORS
En2 0 6
Saps3 1.77E-69 3
Rusc2 1.80E-88 2
Ptk2b 3.49E-34 2
Rasa2 4.51E-33 2
Zmiz1 1.50E-29 2
Iqgap2 1.25E-15 2
Pip5k1b 2.00E-15 2
Pde3a 4.94E-14 2
Faf1 1.26E-10 2
Stag1 9.20E-10 2
Dip2c 2.97E-09 2
Rabgap1l 2.39E-06 2
Note: The first column indicates the Gene the second is the P-value of the significance of insertions within that particular gene and finally the third column indicates the number of tumors with integration within that particular gene.

84
Table A14. Common Insertion Sites (CIS) resulting from the Skin cancer dataset.
Locus Gene
chr19:32838991-32854236 Pten
chr4:77035987-77082221
chrX:142107713-142135531
chr14:26463292-26463869 Zmiz1
chr5:28496409-28496604 En2
Note: The table has two columns one indication the genomic coordinates of the CIS and the second shows any gene within the CIS.
Table A15. gene centric Common Insertion Sites (gCIS) resulting from the Skin cancer dataset.
GENE P-VALUE NUM_TUMORS
Zmiz1 0 14
En2 0 4
Pten 0 2
Note: The first column indicates the Gene the second is the P-value of the significance of insertions within that particular gene and finally the third column indicates the number of tumors with integration within that particular gene

85
REFERENCES
Amsterdam, A., Burgess, S., Golling, G., Chen, W., Sun, Z., Townsend, K., Farrington, S., Haldi, M., & Hopkins, N. (1999). A large-scale insertional mutagenesis screen in zebrafish. Genes & Development, 13(20), 2713. Cappuzzo, F., Hirsch, F. R., Rossi, E., Bartolini, S., Ceresoli, G. L., Bemis, L., Haney, J., Witta, S., Danenberg, K., & Domenichini, I. (2005). Epidermal growth factor receptor gene and protein and gefitinib sensitivity in non-small-cell lung cancer. JNCI Journal of the National Cancer Institute, 97(9), 643. Collier, L. S., Carlson, C. M., Ravimohan, S., Dupuy, A. J., & Largaespada, D. A. (2005). Cancer gene discovery in solid tumours using transposon-based somatic mutagenesis in the mouse. Nature, 436(7048), 272-276. Davidson, A. E., Balciunas, D., Mohn, D., Shaffer, J., Hermanson, S., Sivasubbu, S., Cliff, M. P., Hackett, P. B., & Ekker, S. C. (2003). Efficient gene delivery and gene expression in zebrafish using the Sleeping Beauty transposon. Developmental Biology, 263(2), 191-202. De Ridder, J., Uren, A., Kool, J., Reinders, M., & Wessels, L. (2006). Detecting statistically significant common insertion sites in retroviral insertional mutagenesis screens. PLoS Comput Biol, 2(12), e166. Dupuy, A. J., Akagi, K., Largaespada, D. A., Copeland, N. G., & Jenkins, N. A. (2005). Mammalian mutagenesis using a highly mobile somatic Sleeping Beauty transposon system. Nature, 436, 221-226. Dupuy, A. J., Jenkins, N. A., & Copeland, N. G. (2006). Sleeping beauty: a novel cancer gene discovery tool. Human Molecular Genetics, 15, R75. Easton, D. F., Pooley, K. A., Dunning, A. M., Pharoah, P. D. P., Thompson, D., Ballinger, D. G., Struewing, J. P., Morrison, J., Field, H., & Luben, R. (2007). Genome wide association study identifies novel breast cancer susceptibility loci. Nature, 447(7148), 1087-1093. Ewing, B., & Green, P. (1998). Base-calling of automated sequencer traces usingPhred. II. error probabilities. Genome Research, 8(3), 186. Gavin, A., Scheetz, T., Roberts, C., O'Leary, B., Braun, T., Sheffield, V., Soares, M., Robinson, J., & Casavant, T. (2002). Pooled library tissue tags for EST-based gene discovery. Bioinformatics, 18(9), 1162.

86
Gordon, D. (2003). Viewing and editing assembled sequences using Consed. Current Protocols in Bioinformatics / Editoral Board, Andreas D.Baxevanis ...[Et Al.], Chapter 11, Unit11.2. doi:10.1002/0471250953.bi1102s02 Griffiths, A. J. F., Miller, J. H., Suzuki, D. T., Lewontin, R. C., & Gelbart, W. M. (2000). An introduction to genetic analysis WH Freeman New York:. Hanahan, D., & Weinberg, R. A. (2000). The hallmarks of cancer. Cell, 100(1), 57-70. He, L., Thomson, J. M., Hemann, M. T., Hernando-Monge, E., Mu, D., Goodson, S., Powers, S., Cordon-Cardo, C., Lowe, S. W., & Hannon, G. J. (2005). A microRNA polycistron as a potential human oncogene. Nature, 435(7043), 828-833. Hillier, L. D. W., Marth, G. T., Quinlan, A. R., Dooling, D., Fewell, G., Barnett, D., Fox, P., Glasscock, J. I., Hickenbotham, M., & Huang, W. (2008). Whole-genome sequencing and variant discovery in C. elegans. Nature Methods, 5(2), 183-188. Jonkers, J., Korswagen, H. C., Acton, D., Breuer, M., & Berns, A. (1997). Activation of a novel proto-oncogene, Frat1, contributes to progression of mouse T-cell lymphomas. The EMBO Journal, 16(3), 441-450. Kent, W. J. (2002). BLAT-The BLAST-Like Alignment Tool. Genome Research, 12(4), 656-664. Kile, B. T., & Hilton, D. J. (2005). The art and design of genetic screens: mouse. Nature Reviews Genetics, 6(7), 557-567. Kool, J., & Berns, A. (2009). High-throughput insertional mutagenesis screens in mice to identify oncogenic networks. Nature Reviews Cancer, 9(6), 389-399. Langmead, B., Trapnell, C., Pop, M., & Salzberg, S. (2009). Ultrafast and memory efficient alignment of short DNA sequences to the human genome. Genome Biology, 10(3), R25. Levenshtein, V. I. Binary Codes Capable of Correcting Deletions, Insertions, Li, C., Kim, S. W., Rai, D., Bolla, A. R., Adhvaryu, S., Kinney, M. C., Robetorye, R. S., & Aguiar, R. C. T. (2009). Copy number abnormalities, MYC activity, and the genetic fingerprint of normal B cells mechanistically define the microRNA profile of diffuse large B-cell lymphoma. Blood, 113(26), 6681. Li, H., Ruan, J., & Durbin, R. (2008). Mapping short DNA sequencing reads and calling variants using mapping quality scores. Genome Research, 18(11), 1851. Lu, B., Geurts, A. M., Poirier, C., Petit, D. C., Harrison, W., Overbeek, P. A., & Bishop, C. E. (2007). Generation of rat mutants using a coat color-tagged Sleeping Beauty transposon system. Mammalian Genome, 18(5), 338-346.

87
Matros, E., Wang, Z. C., Richardson, A. L., & Iglehart, J. D. (2004). Genomic approaches in cancer biology. Surgery, 136(3), 511-518. Meltzer, P. S. (2005). Small RNAs with big impacts. Nature, 435, 9. Moressi, C. J. (2007). Integration analysis system to computationally and functionally characterize integration sites Pedraza-Farina, L. G. (2006). Mechanisms of oncogenic cooperation in cancer initiation and metastasis. The Yale Journal of Biology and Medicine, 79(3-4), 95-103. Pruitt, K. D., Tatusova, T., & Maglott, D. R. (2006). NCBI reference sequences (RefSeq): a curated non-redundant sequence database of genomes, transcripts and proteins. Nucleic Acids Research, Rice, P., Longden, I., & Bleasby, A. (2000). EMBOSS: the European molecular biology open software suite. Trends in Genetics, 16(6), 276-277. Russell, W., Kelly, E., Hunsicker, P., Bangham, J., Maddux, S., & Phipps, E. (1979). Specific-locus test shows ethylnitrosourea to be the most potent mutagen in the mouse. Proceedings of the National Academy of Sciences of the United States of America, 76(11), 5818-5819. Schulz, W. A. (2007). Molecular biology of human cancers: an advanced student's textbook Springer Verlag. Shannon, P., Markiel, A., Ozier, O., Baliga, N. S., Wang, J. T., Ramage, D., Amin, N., Schwikowski, B., & Ideker, T. (2003). Cytoscape: a software environment for integrated models of biomolecular interaction networks. Genome Research, 13(11), 2498. Slonim, D. K., & Yanai, I. (2009). Getting started in gene expression microarray analysis. PLoS Computational Biology, 5(10) Spradling, A. C., Stern, D., Beaton, A., Rehm, E. J., Laverty, T., Mozden, N., Misra, S., & Rubin, G. M. (1999). The Berkeley Drosophila Genome Project Gene Disruption Project Single P-Element Insertions Mutating 25% of Vital Drosophila Genes. Genetics, 153(1), 135-177. Starr, T. K., Allaei, R., Silverstein, K. A. T., Staggs, R. A., Sarver, A. L., Bergemann, T. L., Gupta, M., O'Sullivan, M. G., Matise, I., & Dupuy, A. J. (2009). A transposon-based genetic screen in mice identifies genes altered in colorectal cancer. Science, 323(5922), 1747. Theodorou, V., Kimm, M. A., Boer, M., Wessels, L., Theelen, W., Jonkers, J., & Hilkens, J. (2007). MMTV insertional mutagenesis identifies genes, gene families and pathways involved in mammary cancer. Nature Genetics, 39(6), 759-769.

88
Weaver, R. F. (1998). Molecular Biology, WCB. Wood, L. D., Parsons, W. D., Jones, S., Lin, J., Sjoblom, T., Barber, T., Parmigiani, G., Velculescu, V., Kinzler, K. W., & Vogelstein, B. (2008). Genomic Landscapes of Human Breast and Colorectal Cancers,


![Chitosans for delivery of nucleic acids · insertional mutagenesis [2, 3]. Non-viral nucleic acid (NA) delivery systems are also generally endowed with inherent formulation flexibility](https://img.dokumen.tips/doc/110x75/5e384741a1433631584eed94/chitosans-for-delivery-of-nucleic-insertional-mutagenesis-2-3-non-viral-nucleic.jpg)