Embed Size (px)
Citation preview
This document is downloaded from DR‑NTU (https://dr.ntu.edu.sg)Nanyang Technological University, Singapore.
Design, modeling and performance optimizationof active air terminal system
Ke, Ji
2019
Ke, J. (2019). Design, modeling and performance optimization of active air terminal system.Doctoral thesis, Nanyang Technological University, Singapore.
https://hdl.handle.net/10356/90114
https://doi.org/10.32657/10220/48446
Downloaded on 15 Mar 2022 17:23:58 SGT

DESIGN, MODELING AND PERFORMANCE OPTIMIZATION
OF ACTIVE AIR TERMINAL SYSTEM
JI KE
School of Electrical & Electronic Engineering
Nanyang Technological University
2018


DESIGN, MODELING AND PERFORMANCE OPTIMIZATION
OF
ACTIVE AIR TERMINAL SYSTEM
JI KE
School of Electrical & Electronic Engineering
A thesis submitted to the Nanyang Technological University
in partial fulfillment of the requirement for the degree of
Doctor of Philosophy
2018


I
Statement of Originality
I hereby certify that the work embodied in this thesis is the result of original
research, is free of plagiarised materials, and has not been submitted for a higher
degree to any other University or Institution.
[Date Here] [Student’s Signature Here]
11-Mar-2019
. . . . . . . . . . . . . . . . . . . . . . . . . . . . . . . . . . . . . . . . . . . .
Date [Student’s Name Here]
Ji Ke
. . . . . . . . . . . . . . . . . . . . . . .

II

III
Supervisor Declaration Statement
I have reviewed the content and presentation style of this thesis and declare it is free
of plagiarism and of sufficient grammatical clarity to be examined. To the best of
my knowledge, the research and writing are those of the candidate except as
acknowledged in the Author Attribution Statement. I confirm that the investigations
were conducted in accord with the ethics policies and integrity standards of Nanyang
Technological University and that the research data are presented honestly and
without prejudice.
[Date Here] [Supervisor’s Signature Here]
11-Mar-2019
. . . . . . . . . . . . . . . . . . . . . . . . . . . . . . . . . . . . . . . . . . . .
Date [Supervisor’s Name Here]
Cai Wenjian
. . . . . . . . . . . . . . . . . . . . . .

IV

V
Authorship Attribution Statement
This thesis contains material from 2 papers published in the following peer-reviewed
journals where I was the first author.
Chapter 4 is published as Ji Ke, Cai Wenjian, Zhang Xin, Wu Bingjie and Ou Xianhua.
‘Modeling and validation of an active chilled beam terminal unit’. Journal of Building
Engineering 22, 161-170 (2019). DOI: 10.1016/j.jobe.2018.12.009.
The contributions of the co-authors are as follows:
Prof Cai provided the initial project direction and edited the manuscript drafts.
I prepared the manuscript drafts. The manuscript was revised by Prof Zhang, Dr
Wu and Dr. Ou.
I co-designed the study with Prof Cai and performed all the laboratory work at the
School of Electrical and Electronic Engineering. I also analyzed the data.
All the model derivation and simulation were conducted by me in the ACMV lab.
Dr Wu and Dr Ou assisted in the collection of the real-time ACB performance data.
Chapter 5 is published as Ji Ke, Cai Wenjian, Wu Bingjie and Ou Xianhua.
‘Mechanical design and performance evaluation of active thermosiphon beam terminal
units’. Building and Environment (2019). DOI:10.1016/j.buildenv.2019.02.033.
The contributions of the co-authors are as follows:
Prof Cai provided the initial project direction and edited the manuscript drafts.
I wrote the drafts of the manuscript. The manuscript was revised together with Dr
Wu and Dr Ou.
I performed all the experiments, adjust the indoor conditions, conducted data
evaluation and analyze the experimental results.
Dr Wu assisted in the setting up of ACMV pilot plant.
VI
Dr Ou suggested the experimental procedures to investigate the performance of the
ATB terminal unit.
[Date Here] [Student’s Signature Here]
03-11-2019
. . . . . . . . . . . . . . . . . . . . . . . . . . . . . . . . . . . . . . . . . . . .
Date [Student’s Name Here]
Ji Ke
. . . . . . . . . . . . . . . . . . . . . . .

VII
Acknowledgements
First and foremost, I would like to express my sincere gratitude to my supervisor
Professor Cai Wenjian for all the guidance and advice throughout the course of my
research work. Without their encouragement and advice, I would not have been able to
ensure the smooth completion of the research.
Also, I really deeply appreciate all the help from my friends Dr. Chen Can, Dr. Lin Chen,
Dr Wang Xinli, Dr. Wu Bingjie, Dr. Zhai Deqing, Dr. Ou Xianhua, Dr. Chen Haoran, Dr.
Shen Suping in Process Instrumentation Laboratory, their extensive knowledge and kind
offer supported me in many ways. There were so many good memories within and
without the laboratory.
My sincere thanks would be given to School of Electrical and Electronic Engineering
NTU and SinBerBEST for providing the financial support for my study.
Last but not least, I thank my parents who have concerned and encouraged me to this day
and my friends who have made me full confidence to complete my research.

VIII

IX
Table of Contents
Statement of Originality .................................................................................................... I
Supervisor Declaration Statement................................................................................. III
Authorship Attribution Statement .................................................................................. V
Acknowledgements ........................................................................................................VII
Table of Contents ............................................................................................................ IX
Summary ....................................................................................................................... XIII
List of Figures ................................................................................................................. XV
List of Tables ............................................................................................................. XVIII
Nomenclatures .............................................................................................................. XIX
Introduction......................................................................................................1
Background ....................................................................................................................1
Overview of active air terminal systems ........................................................................2
Motivations and objectives ............................................................................................9
Major contribution .......................................................................................................10
Organization of the thesis ............................................................................................11
Literature review ...........................................................................................13
Introduction ..................................................................................................................13
Active air terminal unit ................................................................................................13
Air flow patterns and thermal comfort.........................................................................16
System modeling and optimization ..............................................................................20
Terminal unit applications ...........................................................................................21
Summary ......................................................................................................................24
Terminal unit design and experimental setup ............................................25

X
Introduction ..................................................................................................................25
The experimental active chilled beam .........................................................................25
The experimental active thermosiphon beam ..............................................................26
Chiller plant and dedicated outdoor air system ............................................................29
Summary ......................................................................................................................33
Modeling and validation of an active chilled beam terminal unit .............35
Introduction ..................................................................................................................35
Modeling development of ACB ...................................................................................37
Air entrainment model ...................................................................................... 38
Heat transfer model ........................................................................................... 40
Parameter identification .................................................................................... 43
Experimental procedure ...............................................................................................44
Model validation ..........................................................................................................46
Summary ......................................................................................................................53
Mechanical design and performance evaluation of active thermosiphon
beam terminal units .........................................................................................................55
Introduction ..................................................................................................................55
The ATB working principle .........................................................................................57
Experimental study ......................................................................................................59
The experimental setup ..................................................................................... 59
The experimental procedures ............................................................................ 61
Theoretical analysis .......................................................................................... 62
Assessment criteria ........................................................................................... 63
Experimental results.....................................................................................................65
Primary air plenum pressure ............................................................................. 65
XI
Chilled water flow rate ..................................................................................... 67
Average temperature difference ....................................................................... 69
Full duct length ................................................................................................. 72
Performance comparison with ACB and PDV ................................................. 74
Summary ......................................................................................................................75
Model-based optimization for ATB system .................................................77
Introduction ..................................................................................................................77
Model development of ATB system ............................................................................78
Chiller energy model ........................................................................................ 78
Fan and water pump energy model ................................................................... 79
The air flow model ............................................................................................ 80
The cooling coil model ..................................................................................... 81
The indoor built model ..................................................................................... 83
Experimental setup and model validation ....................................................................83
Experimental setup ........................................................................................... 83
Model validation ............................................................................................... 85
Global optimization formulation..................................................................................89
Objective function ............................................................................................ 89
Constrains ......................................................................................................... 90
Optimization strategy of ATB system .............................................................. 92
Optimization results .....................................................................................................96
Summary ....................................................................................................................102
Conclusions and future work ......................................................................103
Conclusions ................................................................................................................103
Future work ................................................................................................................104

XII
References .......................................................................................................................107
Author’s publications ....................................................................................................119

XIII
Summary
Air conditioning and mechanical ventilation (ACMV) system, which determines the
indoor environment quality and energy efficiency of buildings, attracts increasing
attentions throughout the world. In modern society, a series of problems such as the
sensation of draught, energy waste arising with the massive usage of air conditioning and
sick building syndrome (SBS). Prioritizing green building techniques in ACMV system
can improve occupants’ fitness level and deliver dramatic energy saving. Among various
ACMV schemes, the active air terminals (active chilled beam and active thermosiphon
beam) have outstanding performance on energy saving, indoor environment quality
improvement and space saving. However, the existing research is still inadequate and
some technical difficulties stand as major obstacles for application of the air terminals
especially in tropical regions. To fulfil the gaps, this thesis focuses on the performance
analysis, terminal unit modeling and operating optimization of the active air terminal
based systems. The contributions of this thesis include:
1. A simple yet accurate hybrid model of active chilled beam (ACB) is developed
with respect to air buoyancy. The model demonstrates the air entrainment
characteristics in the air chamber and the heat transfer process in the cooling
coil. Compared with the existing ACB terminal unit model, the proposed
model captures the effects of air buoyancy and further reduces the complexity
of the cooling coil model. The ACB model includes only two equations with
nine unknown model parameters that can be identified through Levenberg-
Marquardt method based on experimental measurements. Experimental
validation in a mock up room proves that the models can predict the supply air
flow rate and heat transfer process in a wide range of operating conditions.
The proposed ACB model can be further utilized in optimization and
performance evaluation for the ACB system.
2. To eliminate the condensation problem and improve the heat transfer
efficiency of the traditional ACB, the mechanical design of the terminal unit is
optimized. Combining air entrainment effect and displacement ventilation, the

XIV
active thermosiphon beam (ATB) is developed with innovative nozzle
arrangement, cooling coil placement and air chamber configuration. The
experimental comparisons of ATB and ACB are conducted under various
operating conditions to estimate its thermodynamic and hydrodynamic
performances. The comparison results indicate that 1) the cooling capacity of
ATB is around 40% higher than ACB and passive displacement ventilation
(PDV); 2) the ATB has better dehumidification ability with the sensible heat
ratio of 0.42; 3) the initial cost of ATB system is the lowest under same
cooling load requirement. More importantly, the experimental findings provide
a guideline for the operation and optimization of ATB systems.
3. A model-based optimization strategy for the ATB system is developed to
reduce the energy consumption and maintain indoor environment quality. The
thermal models of the terminal unit and the energy consumption models of
different components are established based on the experimental results.
Accordingly, the global optimization strategy is formulated to search the
optimal operating points of the ATB system with regard to total energy
consumption under operating constraints. The experimental results indicate
that the optimized operating parameters obtained by the genetic algorithm (GA)
can significantly reduce the total energy consumption. The obtained findings
indicate that the ATB system is a promising ACMV system in terms of initial
cost, thermal comfort and energy saving for a variety of applications.

XV
List of Figures
Figure 1.1 Schematic diagram of ACB terminal unit ......................................................... 3
Figure 1.2 3D mechanical design of ATB terminal unit ..................................................... 4
Figure 1.3 The installation of ATB ..................................................................................... 5
Figure 1.4 Performance simulation of the ATB system ...................................................... 6
Figure 1.5 Schematic diagram of ACB system ................................................................... 7
Figure 1.6 Water loop of the ATB system .......................................................................... 8
Figure 2.1 System Layout for Passive Displacement Ventilation .................................... 15
Figure 2.2 Typical air distribution of ACB system........................................................... 17
Figure 2.3 The PDV system installed in NTU .................................................................. 24
Figure 3.1 The experimental ACB terminal unit .............................................................. 26
Figure 3.2 The schematic drawing of ATB ...................................................................... 27
Figure 3.3 Different models of induction nozzles ............................................................ 27
Figure 3.4 Prototype of the heat exchanger ...................................................................... 28
Figure 3.5 Prototypes of full ducts .................................................................................... 29
Figure 3.6 Front view of the chiller plant ......................................................................... 30
Figure 3.7 Back view of the chiller plant .......................................................................... 31
Figure 3.8 The air handling unit ....................................................................................... 32
Figure 3.9 The liquid desiccant dehumidification system ................................................ 32
Figure 4.1 The interaction of the ACB sub-models .......................................................... 37
Figure 4.2 Experimental fitting for the primary air volume flow rate .............................. 47
Figure 4.3 Model validation for primary air volume flow rate ......................................... 48

XVI
Figure 4.4 Model validation for secondary air volume flow rate ..................................... 49
Figure 4.5 Model validation for secondary air volume flow rate without air buoyancy .. 49
Figure 4.6 Model validation for secondary air volume flow rate under various chilled
water inlet temperatures .................................................................................................... 50
Figure 4.7 Model validation for secondary air volume flow rate under various room
temperatures ...................................................................................................................... 50
Figure 4.8 Secondary air volume flow rate under various average temperature differences
........................................................................................................................................... 51
Figure 4.9 Secondary air volume flow rate under various chilled water flow rates ......... 52
Figure 4.10 Model validation for heat transfer rate .......................................................... 53
Figure 5.1 The air flow patterns of the ATB system ........................................................ 57
Figure 5.2 The temperature distribution of the ATB system ............................................ 58
Figure 5.3 The NTU Eugenia Room ................................................................................. 60
Figure 5.4 The influence of primary air plenum pressure on heat transfer rate................ 66
Figure 5.5 The influence of primary air plenum pressure on SHR ................................... 66
Figure 5.6 The influence of primary air plenum pressure on ER ..................................... 67
Figure 5.7 The influence of chilled water flow rate on heat transfer rate ......................... 68
Figure 5.8 The influence of chilled water flow rate on SHR ............................................ 68
Figure 5.9 The influence of chilled water flow rate on ER .............................................. 69
Figure 5.10 The influence of chilled water flow rate on supply air temperature .............. 69
Figure 5.11 The influence of average temperature difference on heat transfer rate ......... 70
Figure 5.12 The influence of average temperature difference on SHR ............................ 71

XVII
Figure 5.13 The influence of average temperature difference on ER ............................... 71
Figure 5.14 The influence of average temperature difference on supply air temperature 72
Figure 5.15 The influence of fall duct on heat transfer rate .............................................. 73
Figure 5.16 The influence of fall duct on sensible and latent cooling capacity ................ 73
Figure 5.17 The influence of fall duct on SHR ................................................................. 74
Figure 5.18 The influence of fall duct on ER ................................................................... 74
Figure 6.1 The schematic diagram of the experimental ATB system ............................... 84
Figure 6.2 Model validation of fan energy consumption .................................................. 85
Figure 6.3 Model validation of pump energy consumption .............................................. 86
Figure 6.4 Model validation of chiller energy consumption ............................................. 86
Figure 6.5 Model validation of the primary air flow rate ................................................. 87
Figure 6.6 Model validation of the secondary air flow rate .............................................. 87
Figure 6.7 Model validation of the cooling capacity ........................................................ 88
Figure 6.8 Scheme of the optimization strategy ............................................................... 93
Figure 6.9 Flow chart of the optimization strategy ........................................................... 95
Figure 6.10 The indoor heat condition and number of occupants .................................... 97
Figure 6.11 The original and optimized primary air flow rate ......................................... 99
Figure 6.12 The original and optimized chilled water flow rate....................................... 99
Figure 6.13 The original and optimized energy consumption of the ATB system ......... 100
Figure 6.14 Comparison of fan, pump, chiller and total energy consumption ............... 101

XVIII
List of Tables
Table 4.1 The operating ranges of ACB system ............................................................... 45
Table 4.2 Sensor specification .......................................................................................... 46
Table 4.3 Summary of identified parameters .................................................................... 46
Table 4.4 Summary of the assessment criteria.................................................................. 53
Table 5.1 Summary of sensor specification ...................................................................... 60
Table 5.2 Summary of system setting points ................................................................ 61
Table 5.3 Performance criteria of the terminal units ........................................................ 75
Table 6.1 Components rated capacities ............................................................................ 84
Table 6.2 Prediction accuracy of the models .................................................................... 88
Table 6.3 Classification of state variables ........................................................................ 92
Table 6.4 The upper and lower bound of constraints........................................................ 97
Table 6.5 The parameter setting of GA ............................................................................ 98
Table 6.6 Summary of the energy consumption between both operation strategies ...... 101

XIX
Nomenclatures
A section area
a unknown parameters
b unknown parameters
C specific heat capacity at constant pressure (J/kg°C)
c unknown parameters
D characteristic length (m)
d unknown parameters
dT local temperature difference (°C)
dw local carbon dioxide content difference (g/kg)
E Energy consumption (W)
e constant coefficient
f constant coefficient
g gravitational acceleration (m/s2)
H enthalpy (kJ/kg)
h heat transfer coefficient (W/ m2°C)
i constant coefficient
k constant coefficient
M mass (kg)
m mass flow rate (kg/s)
n constant coefficient
P pressure (Pa)
PLR part ratio
Pr Prandtl number
Q heat transfer rate (W)
R thermal resistance
ReD Reynold number
T temperature (°C)
V volume flow rate (m3/h)

XX
W moisture content (g/kg)
w carbon dioxide content (g/kg)
x constant coefficient
T average temperature difference (°C)
Subscripts
a air or air side
am mix air
asoc secondary air off the cooling coil
c water or water side
ch chiller plant
chw chilled water
chwa air around the cooling coil
cur current
f fan
h
in inlet
l load
lat latent
min minimum
max maximum
out outlet
p water pump
pri primary air
r real value
rated rated
req required
sec secondary air
XXI
0sec secondary air without air buoyancy
sen sensible
sup Supply air
total total
z zone
Greek symbols
density (kg/m3)
thermal conductivity
flow velocity
fluid absolute viscosity
efficiency
Abbreviations
ACMV Air conditioning and mechanical ventilation
ASHRAE
American Society of Heating, Refrigeration and Air-Conditioning
Engineer
ER Entrainment ratio
GA Genetic algorithm
HVAC Heating ventilation and air conditioning
IAQ Indoor air quality
PDV Passive displacement ventilation
PID Proportion integration differentiation
RE Relative error
RMSRE Root mean square of relative error
SBS Sick building syndrome
SHR Sensible heat ratio

XXII
VAV Variable air volume
VSD Variable speed drive

1
Introduction
Background
Air conditioning and mechanical ventilation (ACMV) system, which provides desired
thermal comfort and satisfied indoor air quality (IAQ), is an essential part of people’s
daily life. Since ACMV system first designed in 1902 by Alfred Wolff [1], it has been
widely used in individual residences and commercial buildings. As urban citizens spend
more than 80% of time in indoor environment, the proper operation of ACMV is critical
to occupants’ performance and productivity. Additionally, people’s fitness level is
positively correlated with the indoor air quality, especially in tropical countries where
ACMV system is running all year around. Currently, indoor air cooling, heating and
ventilation applications account for 30% (5.35 Quads) of energy consumption in
commercial buildings in the mild regions [2]. In Singapore, where the annual average
temperature is 28.4°C [3], the proportion of building energy consumption attributes to
cooling and mechanical ventilation applications can reach up to 70% [4]. As a
consequence, optimizing the ACMV system is promising for optimizing the energy
efficiency and improving the indoor environment quality.
Energy saving, thermal comfort and IAQ are the core objectives in green buildings which
determine the orientation of ACMV development. Novel mechanical design, sub-systems,
optimization algorithm and machine learning are introduced into ACMV applications. To
improve energy efficiency and IAQ, the energy recovery ventilator (ERV) has been
developed to utilize the energy contained in the exhaust air to treat the fresh air. The ERV
can reduce the energy consumed to pretreat the outdoor ventilation air [5]. Besides, air-
water ACMV system and demand-controlled ventilation can separately handle
latent/sensible loads and optimize the supply of ventilation air based on the occupants’
demands [6]. The technologies of the next generation in ACMV system, which aim at
high performance and high efficiency, have gained increasing interests. Among the
technology innovation, great efforts have been put on mechanical design and optimal
operation of air terminal units. As the ultimate components to treat and deliver air,

2
terminal units have defining influence on indoor thermal comfort and structure of the
ACMV central equipment.
The active air terminal (active chilled beam and active thermosiphon beam) is a potential
alternative to the conventional variable air volume (VAV) and fan coil (FCU) system.
Active air terminal based systems are typical air-water configuration ACMV systems
which have outstanding performance on energy saving, IAQ improvement and space
saving etc. The active chilled beam (ACB) terminal units have evolved in Europe for
twenty years and become very popular in North America and Asia nowadays. But its
limitations of chilled water temperature control and condensation stand as major
obstacles for application in tropical regions. The active thermosiphon beam (ATB)
system, which combines the advantages of ACB and PDV, can ensure the fresh air supply
and meet the heat load in wide operation ranges. Consequently, the ATB has the potential
to become the standard equipment for ACMV systems in modern buildings with complex
layout and multiple functions. The scope of the thesis focuses on performance evaluation,
modeling, and optimization of active air terminal systems.
Overview of active air terminal systems
The active air terminals technology began with Willis Carrier who invented the first
induction system [7]. The induction system named perimeter induction terminal was the
ACMV system choice from 1930’s to 1970’s. The induction units fell into disfavor for
some unique negative aspects include: (1) high fan energy consumption issues due to
higher pressure primary air requirement; (2) condensation issues during cooling operation;
(3) difficult rezoning issues due to building profiles change. Hence, the induction units
were gradually replaced by FCU and VAV during the 1970’s.
The ACBs used today share the same core innovation with the induction unit. The
terminal units discharge high speed primary air through nozzles to create a vacuum
region and induce room air across the cooling coil where the secondary air is conditioned.
The ACBs with mature technology improve the mechanical design of nozzles and
3
terminal unit which increase the induction ratio with 80% lower primary air pressure. In
addition, the latest central components (dedicated outdoor air system, LDDS, etc.)
improve the stability and accuracy of the ACMV system which insure the dry operation
of the cooling coil. With these changes, the ACB is particularly beneficial to be used in
office environment in terms of energy efficiency, virtually noiseless and space saving.
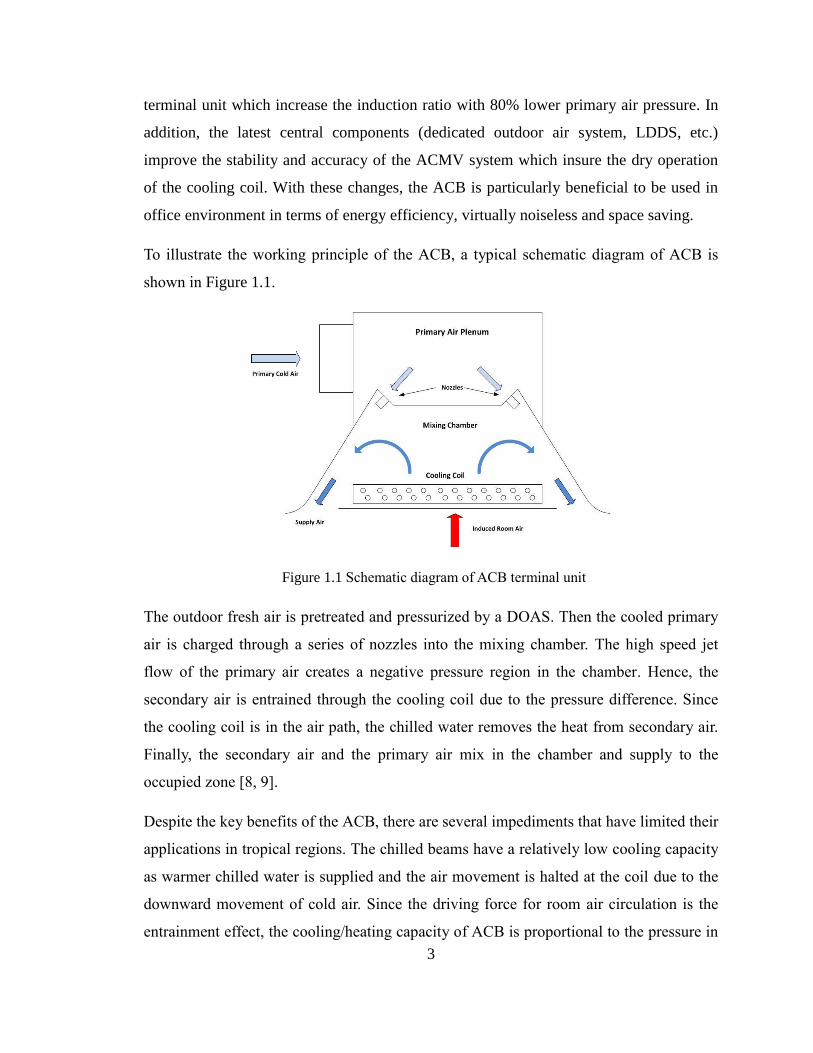
To illustrate the working principle of the ACB, a typical schematic diagram of ACB is
shown in Figure 1.1.
Figure 1.1 Schematic diagram of ACB terminal unit
The outdoor fresh air is pretreated and pressurized by a DOAS. Then the cooled primary
air is charged through a series of nozzles into the mixing chamber. The high speed jet
flow of the primary air creates a negative pressure region in the chamber. Hence, the
secondary air is entrained through the cooling coil due to the pressure difference. Since
the cooling coil is in the air path, the chilled water removes the heat from secondary air.
Finally, the secondary air and the primary air mix in the chamber and supply to the
occupied zone [8, 9].
Despite the key benefits of the ACB, there are several impediments that have limited their
applications in tropical regions. The chilled beams have a relatively low cooling capacity
as warmer chilled water is supplied and the air movement is halted at the coil due to the
downward movement of cold air. Since the driving force for room air circulation is the
entrainment effect, the cooling/heating capacity of ACB is proportional to the pressure in

4
the primary chamber. For the situations where either ventilation or cooling/heating
requirement is large, the system has to be operated to meet the larger demand.
The ATB is an innovative solution to ACMV system which overcomes all the
disadvantages of conventional ACBs. Based on the ACB technology, the ATBs have
rearranged nozzles, vertically installed heat exchanger and novel air chamber design. The
mechanical design and performance simulation of the ATB system are shown in Figure
1.2 and Figure 1.4 respectively.
Figure 1.2 3D mechanical design of ATB terminal unit
The ATB is designed to be suspended from the ceiling or mounted on the wall where the
stratification of high temperature return air is formed. In general, the fall duct is installed
at the air outlet of ATB which restricts the diffusion of supply air and enhance the
ventilation. Moreover, the ATB is recommended to be installed opposite the window for
better indoor air circulation as shown in Figure 1.3.

5
Figure 1.3 The installation of ATB
Comparing with ACB, the utilization of the thermosiphon effect and the additional water
drainage system are the core innovation of ATB. Similar to ACB system, the ATB system
needs DOAS to continuously supply treated ventilation air to build up the primary
chamber pressure. The warm air in the ceiling height will be induced through the heat
exchanger due to air entrainment and fluid thermosiphon effects. Due to the gravitational
force generated by the high density cooled air, the mix air in the chamber will drop along
the air straightener to the floor level and gradually diffuse the occupied zone. During the
operation, the condensate water formed on the surface of heat exchangers drains out via
gravity.

6
Figure 1.4 Performance simulation of the ATB system
The active air terminals introduced above adopt the same air handling and distribution
structure as illustrated in Figure 1.5, but additional primary air treatment is required in the
ACB systems. The fresh air flow rates are controlled by dampers based on feedback from
occupants counting or air quality sensor. In the ACB system, the primary air handles the
whole latent load and part of the sensible load which constrains the primary air
temperature and moisture content. As a consequence, the fresh air is treated by the AHU
first. Then, the cooled air needs to be supplied to the Liquid Desiccant Dehumidification
System (LDDS) where moisture content of primary air can be reduced as low as 3g/kg
and a precise indoor humidity control can be realized. For the ATB system, the primary
air is directly treated by conventional AHU which is more feasible and practical in
tropical countries with high humidity. In some cases, the additional supply air fan is
required in to keep the pressure in terminal unit. Dampers are installed at each branch of
ductwork which have two functions: 1) maintain partial operation situations during
overtime or weekend usage; 2) control the ventilation rate to the occupied zones. In
summary, the primary air system in ACB is relatively complex but with the capability to
satisfy 40% of sensible load and entire latent load. In ATB systems, the ventilation air
accounts for a fraction of the total cooling capacity, generally around 20%. The control of
fresh air supply and cooling capacity are largely decoupled and it enhances the system
reliability.

7
Figure 1.5 Schematic diagram of ACB system
As demonstrated in Figure 1.6, the chilled water loop of the ATB system is with relative
simple structure. As condensation is strictly prevented during the operation of ACB
system, there should be a preheating system to reheat the overcooled chilled water to 14-
18°C before deliver to the ACB. The typically chilled water inlet temperature for ATB is
8-10°C. Hence, the chilled water can be directly supplied to the DOAS and the terminal
unit which simplify the water loop structure and reduce the water pressure drop.
Dedicated booster pump system regulates the chilled water supply and ensures adequate
water pressure. At the entrance of the occupied zones, the motorized valves are installed
to regulate chilled water flow rate and maintain indoor environment quality.
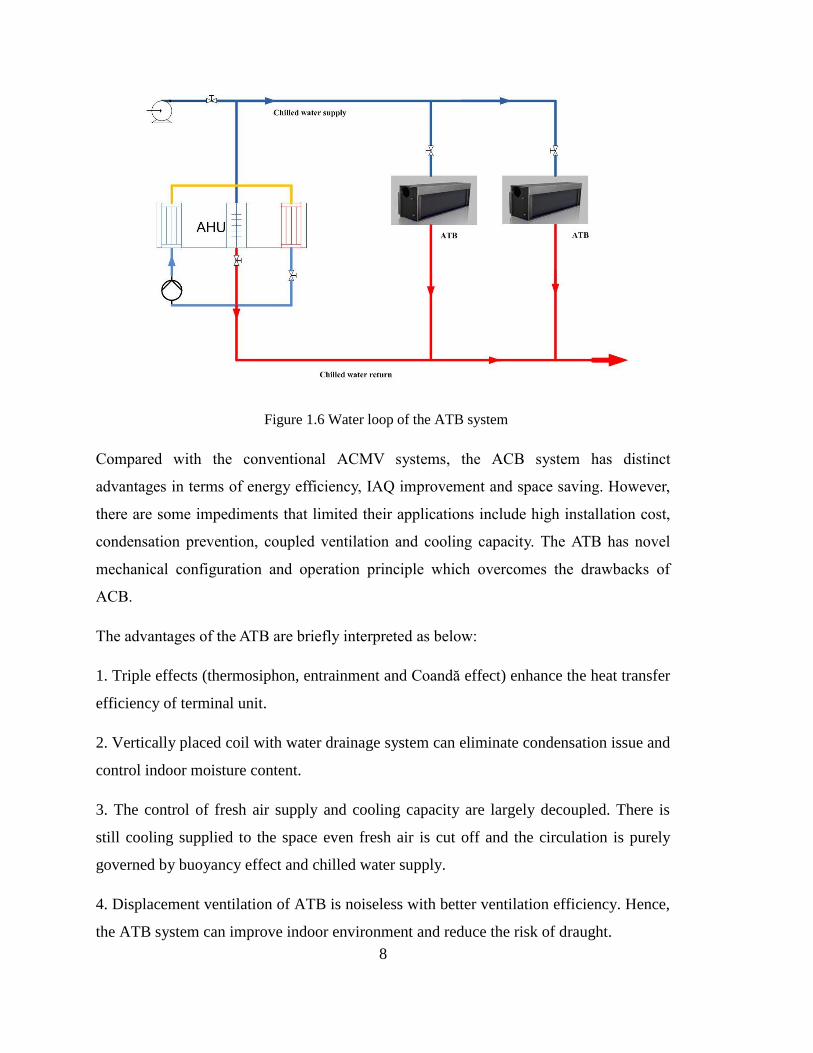
8
Figure 1.6 Water loop of the ATB system
Compared with the conventional ACMV systems, the ACB system has distinct
advantages in terms of energy efficiency, IAQ improvement and space saving. However,
there are some impediments that limited their applications include high installation cost,
condensation prevention, coupled ventilation and cooling capacity. The ATB has novel
mechanical configuration and operation principle which overcomes the drawbacks of
ACB.
The advantages of the ATB are briefly interpreted as below:
1. Triple effects (thermosiphon, entrainment and Coandă effect) enhance the heat transfer
efficiency of terminal unit.
2. Vertically placed coil with water drainage system can eliminate condensation issue and
control indoor moisture content.
3. The control of fresh air supply and cooling capacity are largely decoupled. There is
still cooling supplied to the space even fresh air is cut off and the circulation is purely
governed by buoyancy effect and chilled water supply.
4. Displacement ventilation of ATB is noiseless with better ventilation efficiency. Hence,
the ATB system can improve indoor environment and reduce the risk of draught.

9
Motivations and objectives
In Singapore, the central-air conditioning systems have been widely used in commercial
buildings, hospitals and campus which account for more than 50% of the total power
consumption. The optimal design and operation of ACMV system have significant
energy conservation and cost reduction potential. The ACB system has just been applied
for twenty years and great efforts are put on the system design and unit structure
optimization. In real application, model free on-off control is widely used which lead to
considerable degeneration in the IAQ and energy efficiency. In addition, the ACB
systems are originated and widely utilized in Europe countries where the operating
conditions of the ACMV system is different from that in tropical regions. Some general
technical issues remain which affect the application of ACB. Considering the ATB is a
new designed air terminal unit which is sensitive to the mechanical structure and
operation condition. Yet, no research work can be found that investigates the ATB
system. Therefore, the active air terminals still have some urgent issues to be resolved:
The existing ACB model is of great complex and failed to evaluate the effect of
air buoyancy on the entrainment effect. The horizontally placed heat exchanger
halts the secondary air movement. These factors delay the progression of ACB
application and the development of advanced control scheme.
The ATB is an innovation terminal unit which is sensitive to the operation
condition. No performance evaluation or operation characteristic is available in
the literature. As a result, the cooling performance and energy efficiency haven’t
been optimized to suit various working conditions.
The fresh air supply and cooling capacity of active air terminal systems are
severely interacted. The appropriate design and optimization operation of active
air terminal system are essential for maintain the indoor environment quality and
minimize the energy consumption.
The goals of this thesis are to fully analyze the operating characteristics of active air
terminal based systems and develop efficient system optimization strategies. More
specifically, the thesis holds whole length tightness between topics and resolves the
10
aforementioned issues which hinder the improvements and applications of active air
terminal systems:
Develop a hybrid model with brief structure and high precision which quantifies
the system coupling and evaluates the air conditioning performance.
Demonstrate the mechanical design of ATB and estimate the cooling performance
as a guideline for practical application.
Develop a model-based optimization strategy for the ATB system to minimize the
energy consumption and maintain indoor thermal comfort.
Major contribution
The major contributions of this thesis include:
A simplified hybrid model is developed for the ACB terminal unit based on the
conservation of energy and mass. Considering the effect of buoyancy force
generated by the temperature gradients, the model demonstrates the air mixing in
the air plenum and the heat transfer process in the terminal unit. Experimental
validation in the thermal room proved that the model is effective in predicting the
supply air flow rate and heat transfer rate with high accuracy. The proposed
models can be further examined in the optimization and performance evaluation
for ACB systems.
The performance comparison of ATB and ACB systems under various operating
conditions are conducted. The main factors (primary air plenum pressure, average
temperature difference, fall duct length, chilled water flow rate) that influence the
ATB heat transfer efficiency are tested separately to determine the optimal
operation settings. Based on the experimental results, the cooling capacity and
energy efficiency of ATB terminal unit can be improved by optimizing the system
design. Meanwhile, the findings provide a guideline for the real application of
ATB.
A model-based control strategy is presented to reduce the ATB system energy

11
consumption and maintain the indoor thermal comfort. The optimal working
condition is tracked through genetic algorithm. The simulation results indicate
that the optimization scheme can significantly reduce the energy consumption and
satisfy the indoor environment quality.
Organization of the thesis
The thesis is organized as follows:
Chapter 2 reviews some essential knowledge related to the active air terminal systems.
Chapter 3 presents the mechanical design of an ACB and a self-designed ATB terminal
unit. The experimental setup is demonstrated as the fundamental of the subsequent
experimental research.
Chapter 4 develops a hybrid model for ACB terminal unit. The air entrainment model and
heat transfer model are introduced respectively. The validation results demonstrate the
effectiveness of the ACB model in predicting the induced air flow rate and heat transfer
rate.
Due to the negative influence of air buoyancy on the ACB performance, chapter 5
optimizes the mechanical design of ATB to enhance the unit cooling performance and
eliminate the pre-exist drawbacks. A series of tests are done to evaluate the ATB overall
performance.
With respect to the experimental results in chapter 5, chapter 6 develops a model-based
optimization scheme for the ATB system. The total energy consumption is minimized
and the indoor thermal comfort is maintained.
Chapter 7 summarizes the conclusions and presents the foreseeable research orientations.

12

13
Literature review
Introduction
To achieve the objective as discussed in Chapter 1, a comprehensive review of active air
terminal related technology is necessary. As active air terminal technology is still in
development phase, some technical difficulties emerge in the practical application. The
previous research should be scrutinized to figure out the problem property and provide
the potential solutions.
In this chapter, the state of art active air terminal literatures and available sources are
summarized as follow. The air terminal unit aerodynamic and thermodynamic
optimization designs are introduced in section 2.2. The system air flow patterns and
indoor environment quality with active air terminal systems are explained in section 2.3.
The active air terminal system modeling and control strategies are investigated in section
2.4. In section 2.5, the terminal unit applications and effectiveness evaluation are
examined. The summary is demonstrated in section 2.6.
Active air terminal unit
The terminal unit is the key component in the ACMV system which determines the
system overall cooling capacity and energy efficiency. The air entrainment and heat
transfer process within the unit are highly depend on the mechanical design. Hence, the
designs of casing, air mix chamber, nozzles and heat exchanger require depth
investigation to optimal the unit performance. At present, some studies have been carried
out in this area.
Inducing the secondary air across the cooling coil without fan energy requirement
(entrainment effect) is the core innovation of active air terminal technology. The
effectiveness of the entrainment effect is quantified by the entrainment ratio (the flow
rate of secondary air to primary air). Ruponen et al. [10] simplified measurement
methods of entrainment ratio for the ACB system. The proposed method used one
14
velocity transmitter, one venturi and primary air flow rate which showed robust and
consistent results. Filipsson et al. [11] presented three acquisition methods to obtain the
entrainment ratio. Comparison studies of air velocity, modified capacity and tracer gas
methods were conducted under various operation conditions. The experimental validation
indicated the modified capacity method is more accuracy.
The air jet flow release from the primary air plenum is coupled with the induction nozzle
design. Freitag et al. [12-14] conducted simulations and experiments to investigate the
internal and external air flow of ACB. The flow patterns and velocities in the unit were
obtained under various air plenum pressures. The results indicated that the entrainment
effect could be reinforced through adjusting the nozzle width and bending. In real
application, Dadanco [15] provided a series of specially shaped nozzles to strengthen the
entrainment efficiency.
To optimal the design of induction nozzles, Guan et al. [16, 17] took advantage of
computational fluid dynamic (CFD) technique to optimize nozzle radius and separate
distance for the induction process. The simulation results revealed that the nozzle radius
had a negative correlation to entrainment ratio while small separate distance could
promote air entrainment. Wu et al. [18] conducted CFD simulations to comprehensively
exam the effects of nozzle diameter and inlet pressure on the ACB performance. It
showed that supply air un-uniformity was severe when the nozzle diameter was large.
And the rise of the inlet pressure could aggravate the un-uniformity.
Furthermore, Guan et al. [19] optimized the geometric design of ACB to achieve
sufficient entrainment efficiency. The nozzles and negative pressure kernel were
relocated at the center of the terminal unit which made the chamber more effectively for
air entrainment process. The modified terminal unit structure with 7 mm nozzle could
increase the entrainment ratio by 30%.
Active air terminal system is a typical air-water structure ACMV system. The heat
exchanger inside unit has some distinctive features compared to conventional cooling
coils. Chen et al. [20, 21] systematically studied the cooling coil heat transfer
performance with different circuitry arrangements and tube connecting sequences.

15
Compared the operation characteristics between conventional 1-circuit and multiple-
circuits coil design, the refined 2-circuits arrangement achieved significant improvement
with respect to heat transfer rate and pressure drop. Dominguez et al. [22] summarized
the ongoing research on cooling coil of terminal units and conducted tests for fin-and-
tube cooling coil from several configurations of ACB. The results correlated the heat
exchanger design and air thermal resistance which offer additional energy saving
potential to the terminal unit. An experimental study [23] on the function of 2-pipe ACB
revealed that the 2-pipe system can reduce the energy consumption up to 18% less than
the conventional 4-pipe one.
In addition, the air outlets of the active air terminal have impacts on the air flow patterns
and occupants’ comfort level. Bertheussen et al. [24, 25] evaluated the performance of
radial swirl jet structure ACB and investigated the influence of internal load distribution.
The results showed the CSW chilled beam generated a satisfied thermal environment
with higher ventilation effectiveness than the diffuse ceiling system. A practical issue
also occurred that additional fresh air was required to safeguard the IAQ as the system is
highly correlated with the heat sources.
Figure 2.1 System Layout for Passive Displacement Ventilation

16
Passive displacement ventilation is an emerging technology which gets increasing
attention in Singapore. The buoyance driven displacement ventilation process highly
depends on the terminal unit mechanical design and indoor heat source distribution.
Experimental studies were made [26-29] to analyze the terminal unit air conditioning
efficiency and energy saving potential which pointed out design guidelines and
application issues. Betz et al. [30] reviewed several softwares that gave approaches to the
simulation of terminal units which was classified as one of the pivotal study requirements
by ASHRAE [31].
Air flow patterns and thermal comfort
The IEQ is positively related to the occupants’ health and productivity. The air flow
patterns and thermal comfort, which receive increasing concerns of researchers, are key
indicators of IEQ. The temperature distribution and air flow patterns in the active air
terminal system are more complex for the terminal unit unique working principle.
Specific experiment and simulation are required to estimate the terminal unit operation
characteristics and provide optimal indoor thermal comfort.
17
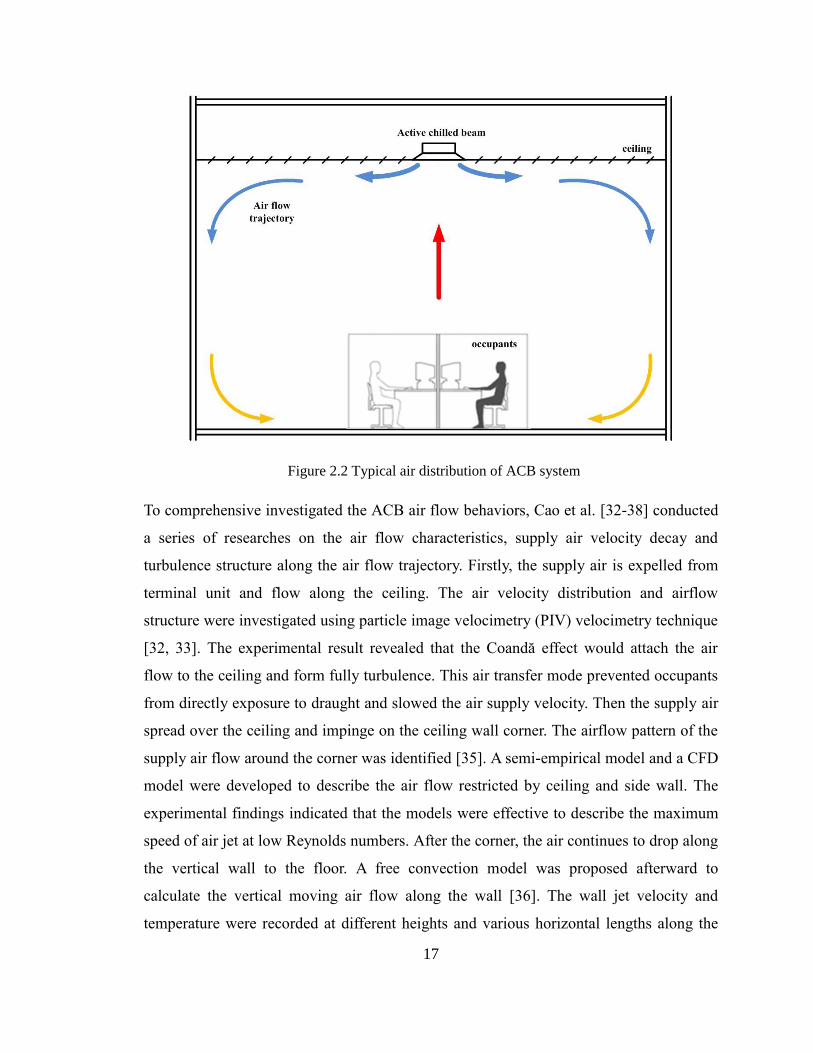
Figure 2.2 Typical air distribution of ACB system
To comprehensive investigated the ACB air flow behaviors, Cao et al. [32-38] conducted
a series of researches on the air flow characteristics, supply air velocity decay and
turbulence structure along the air flow trajectory. Firstly, the supply air is expelled from
terminal unit and flow along the ceiling. The air velocity distribution and airflow
structure were investigated using particle image velocimetry (PIV) velocimetry technique
[32, 33]. The experimental result revealed that the Coandă effect would attach the air
flow to the ceiling and form fully turbulence. This air transfer mode prevented occupants
from directly exposure to draught and slowed the air supply velocity. Then the supply air
spread over the ceiling and impinge on the ceiling wall corner. The airflow pattern of the
supply air flow around the corner was identified [35]. A semi-empirical model and a CFD
model were developed to describe the air flow restricted by ceiling and side wall. The
experimental findings indicated that the models were effective to describe the maximum
speed of air jet at low Reynolds numbers. After the corner, the air continues to drop along
the vertical wall to the floor. A free convection model was proposed afterward to
calculate the vertical moving air flow along the wall [36]. The wall jet velocity and
temperature were recorded at different heights and various horizontal lengths along the

18
wall. The introduced model and experimental result showed that the velocities got
maximum values close to the wall between 25mm to 50mm and decreased quasilinear
under the height of 1.7 m. Finally, the cooled air collides the floor corner and spreads
around the room. To avoid risk of draught, the velocity of corner airflow was modelled
[37]. The returning corner airflow entrained the ambient air and reached maximum
velocity at the floor surface. The proposed model could predict the corner region air flow
patterns and evaluate the sensation of draught.
The air flow patterns of the ATB and passive displacement ventilation systems have many
in common. The primary difference is that the ATB system utilizes the entrainment effect
to enhance the ventilation process and improve the heat transfer rate. The air flow
behaviors had been investigated [39] with respect to air velocity, thermal load distribution
and air temperature. Rees et al. [40] conducted a series of test to investigate the air
surface temperature and flow under various conditions. The results revealed that the
behaviors of such ventilation systems depend on the operating conditions. Greater
internal heat gain and higher ceiling surface temperature provided sufficient momentum
to drive the ventilation air flow. Chen et al. [41] presented a methodology for the
calculation of passive displacement ventilation system indoor airflow patterns and energy
consumption. The turbulence model was developed for indoor airflow computation which
showed that the displacement system gave better IAQ with significant energy saving.
Further researches were done to analyze the passive air flow characteristics and the
energy saving approach of the system [42]. The experiments showed that the
displacement airflow pattern was fully satisfied when the internal load equaled to the
cooling capacity. And excess heat load might cause thermal discomfort at low levels in
the occupied zone.
In addition, the IEQ, which significantly influences the occupants’ health and
productivity, is desired to be investigated. The main factors that determine the active air
terminal system thermal comfort, including heat load distribution and strength, air
temperature, air velocity and relative humidity were evaluated. Wu et al. [43] measured
the active chilled beam system air velocity and turbulence intensity under isothermal and
non-isothermal environments. The air velocity would increase then decrease and detach
19
from the ceiling from transverse direction. Besides, higher pressure drop could enhance
the strength of Coandă effect, while the larger temperature difference between supply air
and room air hindered this effect. As a consequence, in the operation of active chilled
beam systems, the pressure selection and temperature gradients should be optimal
designed to guarantee a satisfied thermal performance. Fredriksson et al. [44] conducted
some experiments to build up the temperature field below the chilled beam and visualized
the transient velocity patterns of the airflow. The results showed that the air convection
generated by heat source might reverse the chilled beam supply air flow pattern and
produced strong oscillations through the chilled beam and on the sideways. The
oscillations could cause a sensation of draught. Wu et al. [45] evaluated the effect of
indoor heat sources configuration and strength on the thermal comfort in a thermal
isolated room. Some common thermal comfort indices such as Air Diffusion Performance
Index (ADPI), Predicted Mean Vote (PMV), Draft Rate (DR) and Vertical Air
Temperature Difference (VATD) were adopted based on the test results. The analysis
results showed that symmetrically distributed heat sources could provide better thermal
comfort while high indoor thermal load might cause draft risk due to excessive air speed.
In addition, Melikov et al. [46-52] comprehensively investigated the air flow patterns and
indoor environment quality in the active chilled beam system. Based on the research,
some design guidelines, including terminal units install location and considerable heat
sources distribution were provided. The conclusion was made that the active chilled
beams offered good indoor climate conditions and high level of flexibility with proper
system configuration.
The indoor environment quality in the room with passive displacement ventilation was
also studied and compared with the ACB system [27, 53, 54]. The environmental
variables were measured from different positions near the subjects and thermal comfort
sensations were compared. The passive displacement ventilation system had advantages
in terms of uniformity gradients of temperature and air velocity distribution. Meanwhile,
the displacement ventilation system was not sufficient to satisfy the thermal comfort with
high heat load and could raise the pollutant concentration into the breath zone.

20
System modeling and optimization
Modeling and optimization of ACMV systems have long been investigated in research.
Many advanced modeling methods and air conditioning system simulation tools are
available in the literature [55-59]. Active air terminal is both air diffusion device and air
conditioning component, the range of modeling and optimization for active air terminal
system is quite different from other environments. Up to now, a few researches have been
involved in this region.
To predict the entrainment process, Filipsson et al. [11] measured the quantity of the
supply air for ACB system in three methods. Based on the experimental measurements,
the air loop model was developed considering the primary air flow rate, chilled water
temperature and heat source radiation. The proposed model was adopted to improve the
self-regulating characteristics of ACB terminal units. In addition, the water side heat
transfer process was also described [22]. Fernando et al. derived a generic numerical
model of plate fin-and-tube cooling coil for ACB terminal unit. Steady state experimental
data was used along with the coil model to determine the correlation for the air-side heat
transfer. Model validation showed that the coil model was with reasonable accuracy and
could be used for water circuit design. Filipsson et al. [60] proposed an ACB thermal
model based on NTU analysis. The model captured the influence of air buoyance forces
and minimized the extensive measurements. The thermal model predicted the cooling coil
heat transfer rate with high accuracy in various operating conditions. Furthermore, the
air-loop and water-loop operation characteristics of active chilled beam system were
summarized. Chen et al. [61] developed an ACB model which coordinated the
experimental results and first principles in hybrid manner. The model combined the unit
configuration and thermodynamic of the entrainment process and cooling coil in the
terminal unit. Showing robustness and high accuracy, the model could be applied to wide
control and optimization applications.
The passive ventilation system is characterized by thermal stratification which is quite
different from the overhead air conditioning system. Mateus et al. [62] presented an
approach to model the thermal stratification in the displacement ventilation system using

21
three air temperature nodes. The simplified model could predict the indoor temperature
gradient with significantly improved accuracy. Limit system inputs to height, size of heat
sources, the model was easy to implement. Carrilho et al. [63] developed models for
vertical temperature variations and heat transfer prediction in the passive displacement
ventilation system. The model gave insights into mechanisms and system parameters that
determine the airflow pattern and vertical temperature profile. The modelling of chilled
ceilings and passive chilled beam were also available in the references [64-68]. The
modeling approaches and performance could be utilized to comprehensively understand
the features of active air terminal system.
To fully develop the energy saving and indoor thermal comfort potential of active air
terminals, application of advanced control and optimization methods are required. Chen
et al. [69] was the first one developed the fuzzy controller for ACB systems. The strong
nonlinearities of the system were relaxed by T-S fuzzy method. Simulations were
conducted to test the LQR methodology performance based on the mock up room and
verified terminal unit. The fuzzy controller could achieve good closed-loop performance
and adjust the room temperature under various operating conditions.
In real application of ACB systems, the control strategies have been greatly simplified.
Trox technic [70] developed a flow limiter to adjust primary air flow rate while the room
temperature was maintained through on-off control of water supply. Dadanco [71] kept
primary air flow constant volume while varied the primary air temperature and humidity
for cooling applications. FlaktWoods [72] installed the Pi Function accessory to modify
the flow rate of fresh air which in turn affect the cooling capacity while the chilled water
were kept constant at the predetermined setting points.
Terminal unit applications
Active air terminal system is not a panacea. The system design subjects to many
requirements: 1) the fresh air requirement, 2) the ceiling space, 3) the cooling capacity, 4)
the climate influence, 5) the application scenarios and etc. Some studies have been done
22
to provide the design guidelines and evaluate the practical effectiveness of active air
terminal system.
Loudermilk et al. [73, 74] presented the design guidelines for the ACB system,
considering thermal comfort, sizing and locating of terminal units based on the
ANSI/ASHERAE standard. The case study was done to evaluate the indoor air velocity
and moisture content. The results indicated that active chilled beam systems could
significantly improve the IEQ in terms of the noise, draft conditions, and temperature
inconsistency. In addition, Alexander et al. [75] introduced the active chilled beam
systems and gave some design considerations in various conditions. The main concerns
of application, including duct design and air supply static pressure, air distribution and
beam placement, installation and air/water side control, were presented respectively. The
energy saving potential and suitability for different spaces were also discussed. Rumsey
et al. [76] expounded the application of ACB upon successful installations. Accordingly,
some commissioning, operations, and maintenance issues were given. The initial costs of
chilled beam system and conventional system were also compared, chilled beam system
costed more on equipment level while reduced ducting and piping costs. To further
minimize the operation cost of active chilled beam system, Livchark et al. [77] put
forward that the design objective of the system was to minimize primary airflow and
maximize use of water coil for cooling and heating. The mathematical description proved
that the cooling energy produced by per volume primary air significantly influenced the
active chilled beam energy efficiency.
The buoyance driven passive displacement ventilation system was used in high thermal
load condition for many years. Nowadays, the system has gain increasing interests to
provide comfort ventilation in low thermal load conditions. Nielsen et al. [26] presented
the passive displacement ventilation system practical design procedure. Some design
calculations were provided to optimal the selection of room stratification height and
concentration distribution which would influence indoor temperature and velocity
distribution. Emmerich et al. [78] evaluated the potential benefits and limitations of
displacement ventilation system based on simulation study of energy impacts in an office
building. The experimental findings indicated that stable thermal stratification depended

23
on the comprehensive design of internal loads, room configurations and temperatures.
Naydenov et al. [28] illustrated experiments in mock up rooms with passive displacement
ventilation which comprised thermal condition measurements and occupants’ response
collection. The results showed that the displacement ventilation required detailed design
and consideration to satisfy the thermal comfort.
In the real application, certain spaces are appropriate for active air terminal use while
others are not suitable for the technology [79]. Accordingly, the usage of active air
terminals is largely confined to commercial buildings, offices and school. Rumsey et al.
[80] investigated how to apply active chilled beam in laboratories. Based on initial cost
and energy consumption calculation, the active chilled beam was proved to lower both
construction costs and operation costs with refined system design. Barnet et al. [81]
illustrated the energy efficiency of active chilled beam usage in cooling and heating
laboratory. Energy simulations were conducted through an hourly analysis program
which showed active chilled beam could save about 50% energy with roughly same first
cost. Devlin et al. [82] used full scale prototype tests and simulations to verify the
selection of ACB in hospitals. The results showed active chilled beam was an appropriate
solution for the hospital as the system could promote a uniform temperature distribution
and reduce the airborne cross-infection risk.
In addition, the passive displacement ventilation is widely utilized to regulate the indoor
environment. Some literatures are available which investigate the effectiveness of the
system. Shan et al. [83] conducted a field experiment to evaluate human subjects’ thermal
comfort in the passive displacement ventilation system. The PDV system provided
satisfactory IEQ in terms of draft sensation and temperature profile. Li et al. [84]
investigated the application of displacement ventilation in hospital environments. The
experimental findings indicated the displacement ventilation performed better than
mixing ventilation in certain conditions, especially in office, classrooms, theaters and
non-critical rooms in the hospital. In practice, the passive displacement ventilation
system is widely used in Nanyang Technological University as a green design approach
in Figure 2.3 The PDV system installed in NTU. The tutorial rooms and sports hall use
displacement ventilation system which can save 30% energy consumption.

24
Figure 2.3 The PDV system installed in NTU
Summary
In this chapter, the current state of the art research progress in active air terminal systems
is introduced. The existing studies focus on the mechanical design of the terminal unit,
indoor air flow pattern and thermal comfort, system modeling and application analysis.
Based on the literatures, the researches into control and optimization of active air
terminal system are still inadequate. Since active air terminal systems have just evolved
for more than twenty years, researchers devote great effort on the terminal unit
optimization and system design. In real applications, the control schemes have been
simplified. Model-free control and optimization strategies in the active air terminal
systems inevitably lead to considerable degeneration in the energy efficiency as well as
the indoor environment quality. Thus, there is still a long way for the researchers to go to
compensate the study and improve the system overall efficiency.

25
Terminal unit design and experimental setup
Introduction
In practice, there are multiple designs of ACB terminal units to apply for different
application environments. The distinct designs, such as heat exchanger location, nozzle
dimension and etc., lead to crucial difference in air conditioning performance. In this
thesis, a typical 2-way discharge ACB is investigated. Besides, as the ATB is an
innovation ACMV solution, the terminal unit mechanical structure and working principle
need to be clarified.
The air flow patterns and operation characteristics of ACB and ATB systems are quite
different. The ACBs are usually installed at the central part of the ceiling to produce
uniform air supply. The ATBs are recommended to mount on the wall to enhance the
displacement ventilation process. In order to verify the active air terminals performance
under various working conditions, two different experimental platforms are set up.
In this chapter, a two-way discharge ACB and an independent developed ATB are
introduced. Besides, the thermal room and the ACMV system are specified.
The experimental active chilled beam
The ACBs are manufactured as shown in Figure 3.1. The terminal unit has a dimension
of 0.6 m× 1.2 m×0.3m. For the air side, the diameter is the primary air inlet is 150mm.
Twenty-nine induction nozzles are installed evenly on both sides of the ACB primary air
outlets. In the experiments, leak proof rubber nozzles with 7mm inner diameter are
adopted to strength the entrainment effect. In the water loop, the plain fin and copper tube
cooling coil consists of total 16 tubes. Besides, the coil’s fin thickness and distance are
0.5 mm and 4.35 mm respectively.
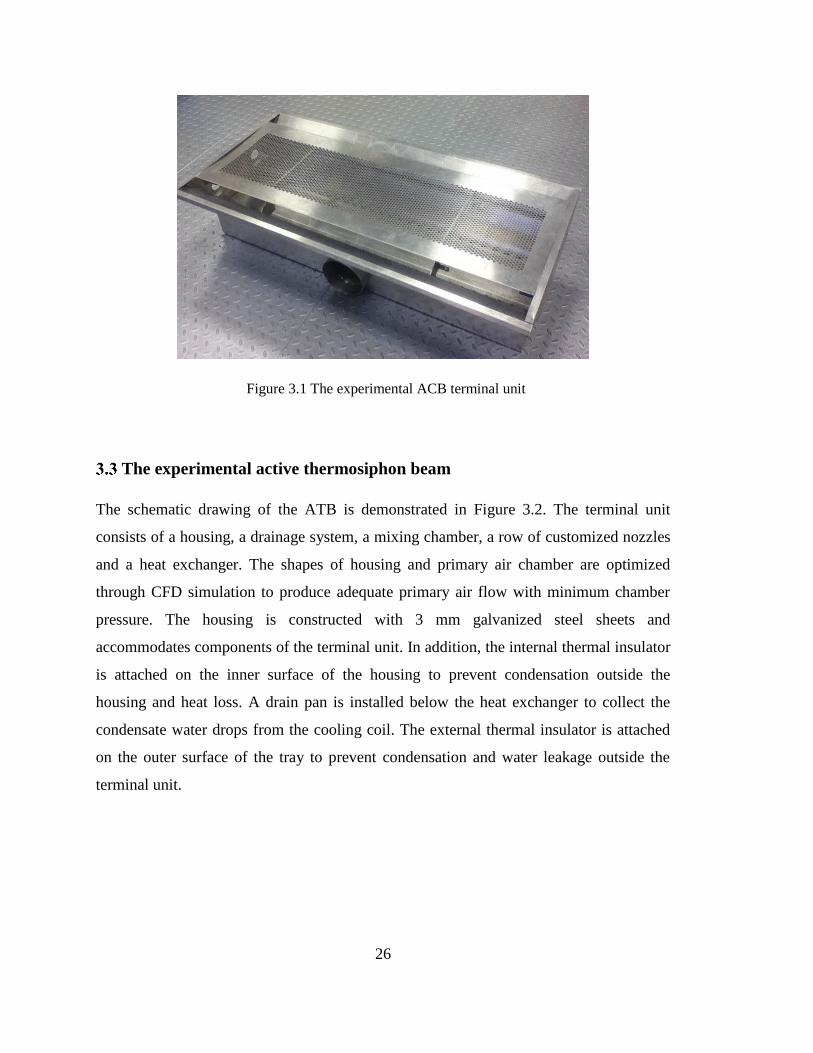
26
Figure 3.1 The experimental ACB terminal unit
The experimental active thermosiphon beam
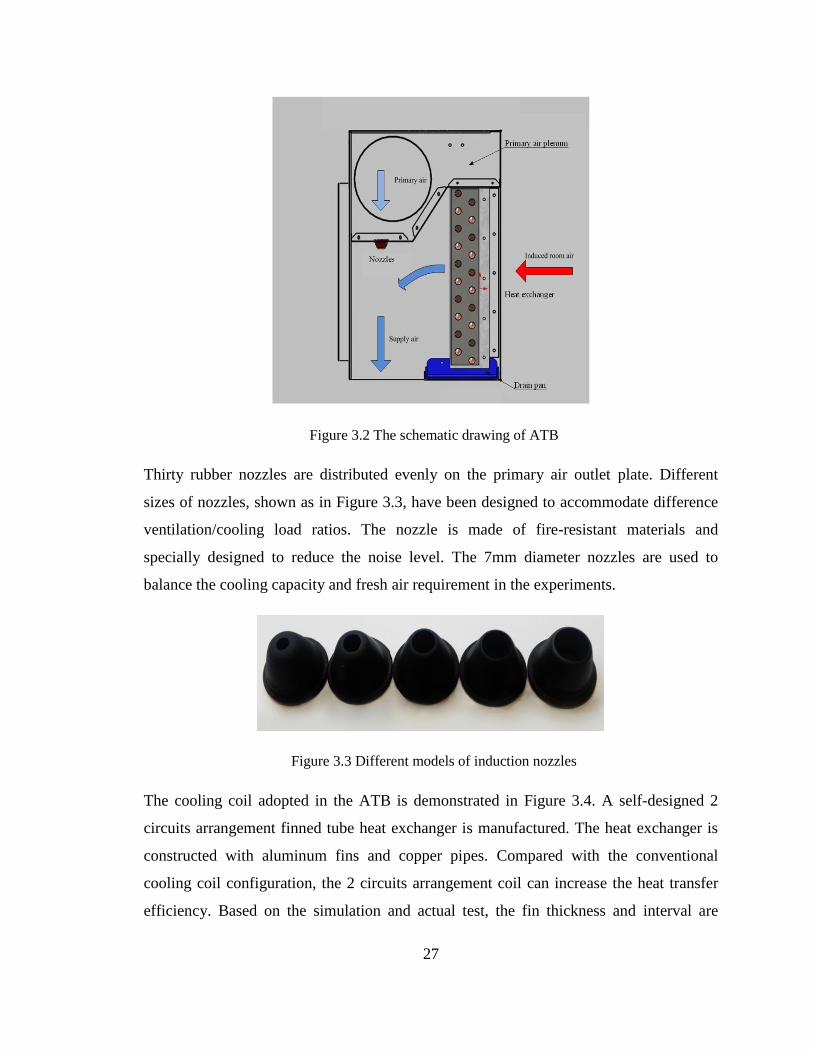
The schematic drawing of the ATB is demonstrated in Figure 3.2. The terminal unit
consists of a housing, a drainage system, a mixing chamber, a row of customized nozzles
and a heat exchanger. The shapes of housing and primary air chamber are optimized
through CFD simulation to produce adequate primary air flow with minimum chamber
pressure. The housing is constructed with 3 mm galvanized steel sheets and
accommodates components of the terminal unit. In addition, the internal thermal insulator
is attached on the inner surface of the housing to prevent condensation outside the
housing and heat loss. A drain pan is installed below the heat exchanger to collect the
condensate water drops from the cooling coil. The external thermal insulator is attached
on the outer surface of the tray to prevent condensation and water leakage outside the
terminal unit.
27
Figure 3.2 The schematic drawing of ATB
Thirty rubber nozzles are distributed evenly on the primary air outlet plate. Different
sizes of nozzles, shown as in Figure 3.3, have been designed to accommodate difference
ventilation/cooling load ratios. The nozzle is made of fire-resistant materials and
specially designed to reduce the noise level. The 7mm diameter nozzles are used to
balance the cooling capacity and fresh air requirement in the experiments.
Figure 3.3 Different models of induction nozzles
The cooling coil adopted in the ATB is demonstrated in Figure 3.4. A self-designed 2
circuits arrangement finned tube heat exchanger is manufactured. The heat exchanger is
constructed with aluminum fins and copper pipes. Compared with the conventional
cooling coil configuration, the 2 circuits arrangement coil can increase the heat transfer
efficiency. Based on the simulation and actual test, the fin thickness and interval are

28
chosen as 0.5mm and 4.16 mm to enhance the heat transfer process. Total twenty copper
tubes, which have an external diameter of 12.7mm, are distributed evenly with 2-rows
staggered layout. The performance of the nozzles and the heat exchanger have been
tested to validate the effectiveness.
Figure 3.4 Prototype of the heat exchanger
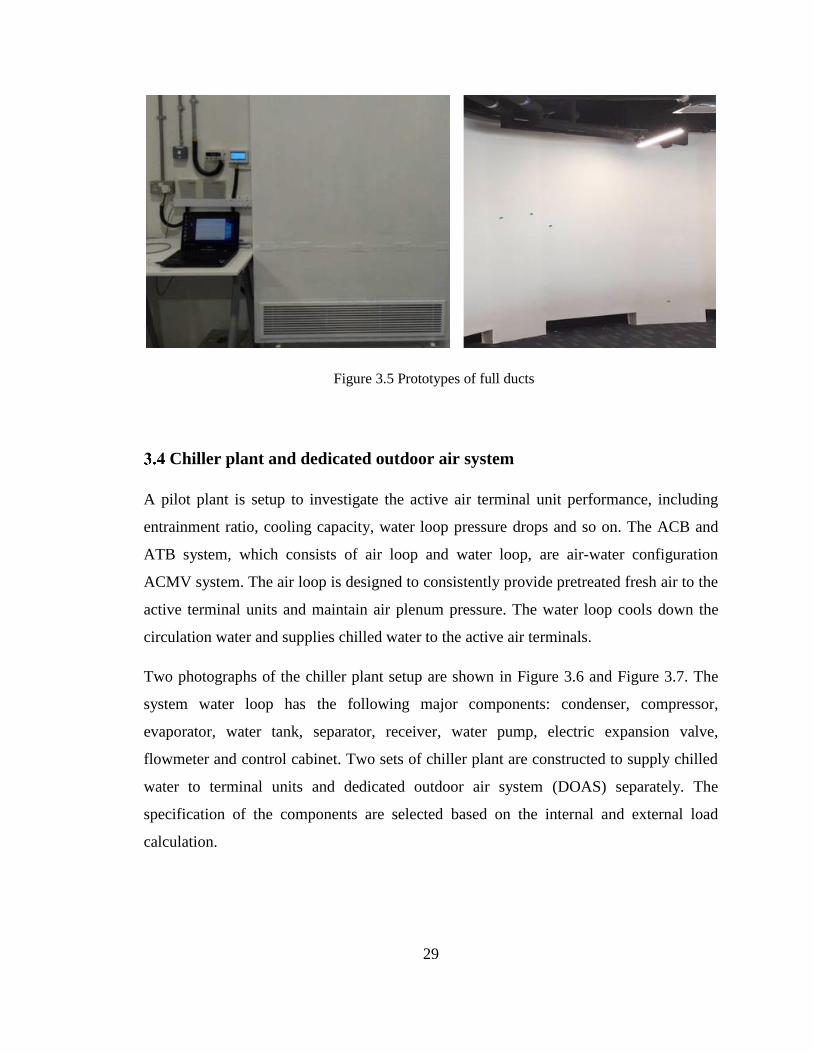
The prototype of various kind of full duct is shown in Figure 3.5. Various constructional
conditions need to be taken into consideration when estimating the cooling capacity of
terminal units. The utilization of fall duct can improve the ATB overall performance. The
fall duct is made of fireproof and heat insulating phenolic foam board. To reduce air
resistance, the fall duct is covered with smooth aluminum foil. The depth and width of
the fall duct are 200mm and 1200mm respectively while the height can be adjusted
according to the space condition. Meanwhile, the air outlet on the fall duct is of
dimension 1000mm×150mm.
29
Figure 3.5 Prototypes of full ducts
Chiller plant and dedicated outdoor air system
A pilot plant is setup to investigate the active air terminal unit performance, including
entrainment ratio, cooling capacity, water loop pressure drops and so on. The ACB and
ATB system, which consists of air loop and water loop, are air-water configuration
ACMV system. The air loop is designed to consistently provide pretreated fresh air to the
active terminal units and maintain air plenum pressure. The water loop cools down the
circulation water and supplies chilled water to the active air terminals.
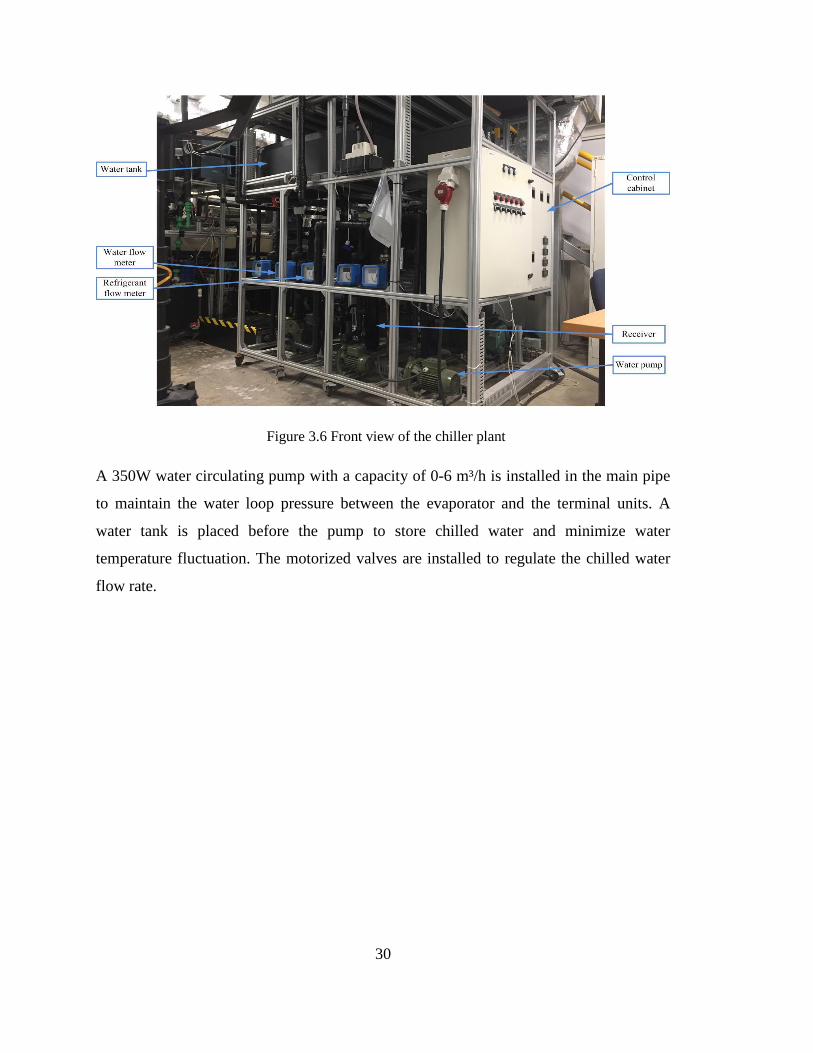
Two photographs of the chiller plant setup are shown in Figure 3.6 and Figure 3.7. The
system water loop has the following major components: condenser, compressor,
evaporator, water tank, separator, receiver, water pump, electric expansion valve,
flowmeter and control cabinet. Two sets of chiller plant are constructed to supply chilled
water to terminal units and dedicated outdoor air system (DOAS) separately. The
specification of the components are selected based on the internal and external load
calculation.
30
Figure 3.6 Front view of the chiller plant
A 350W water circulating pump with a capacity of 0-6 m³/h is installed in the main pipe
to maintain the water loop pressure between the evaporator and the terminal units. A
water tank is placed before the pump to store chilled water and minimize water
temperature fluctuation. The motorized valves are installed to regulate the chilled water
flow rate.
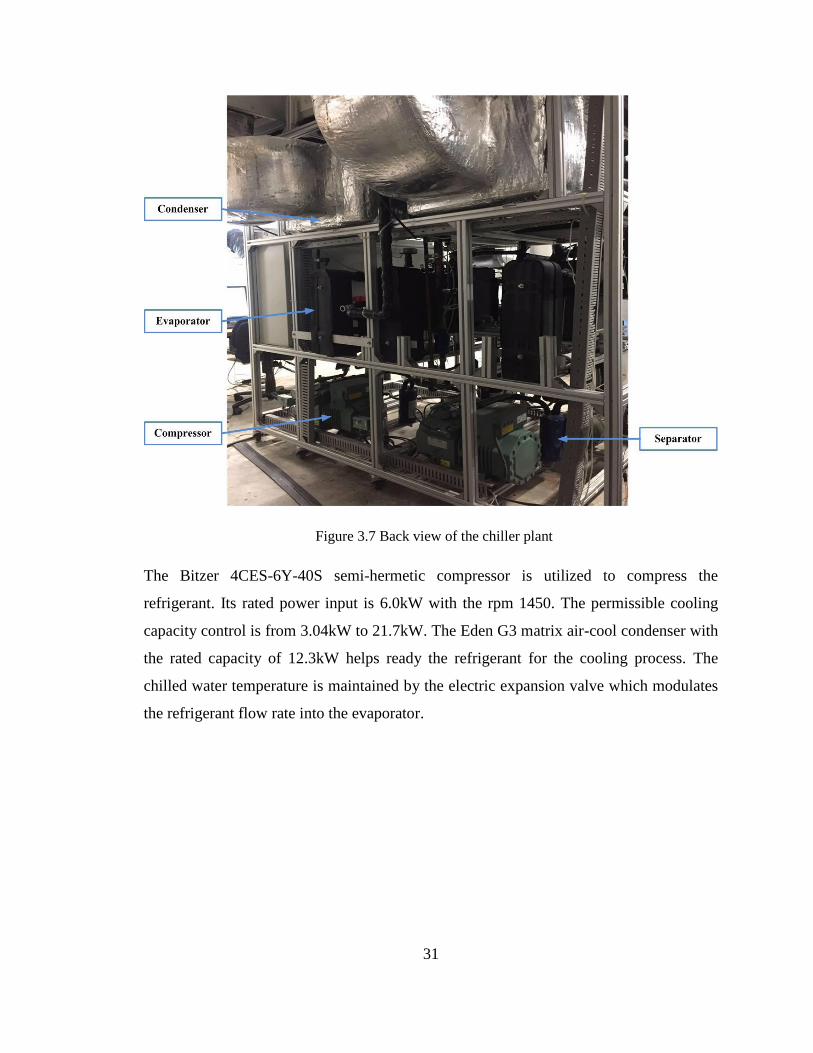
31
Figure 3.7 Back view of the chiller plant
The Bitzer 4CES-6Y-40S semi-hermetic compressor is utilized to compress the
refrigerant. Its rated power input is 6.0kW with the rpm 1450. The permissible cooling
capacity control is from 3.04kW to 21.7kW. The Eden G3 matrix air-cool condenser with
the rated capacity of 12.3kW helps ready the refrigerant for the cooling process. The
chilled water temperature is maintained by the electric expansion valve which modulates
the refrigerant flow rate into the evaporator.
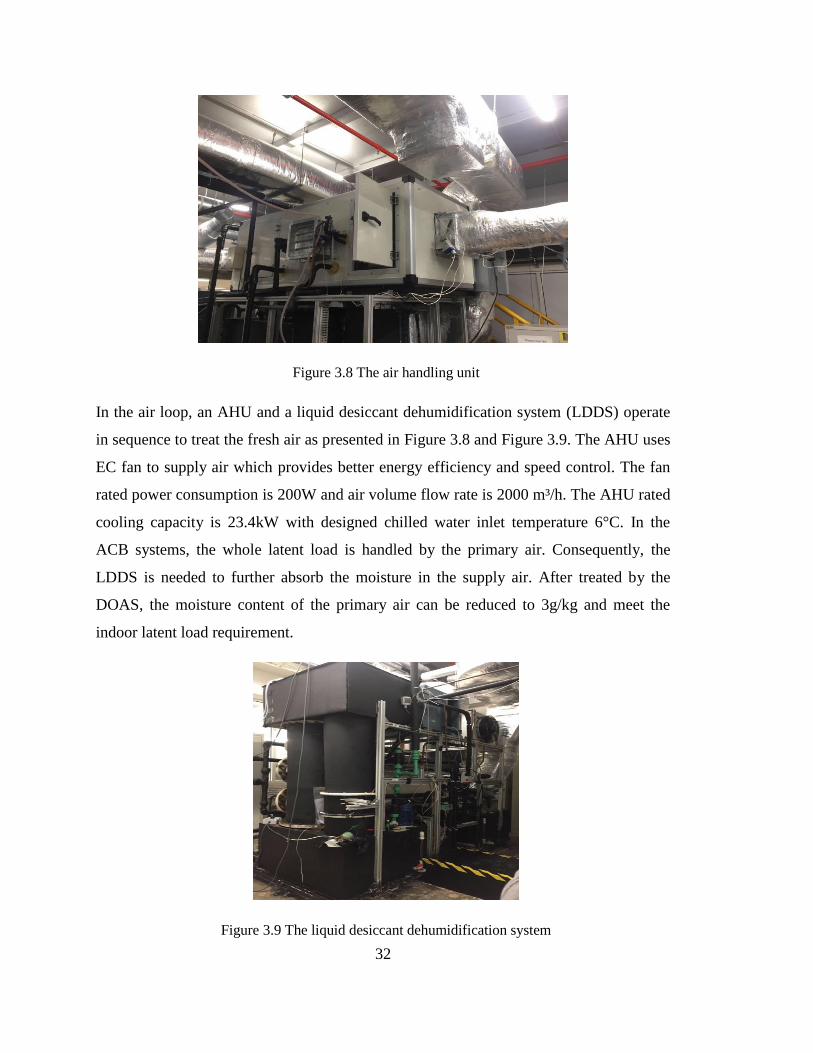
32
Figure 3.8 The air handling unit
In the air loop, an AHU and a liquid desiccant dehumidification system (LDDS) operate
in sequence to treat the fresh air as presented in Figure 3.8 and Figure 3.9. The AHU uses
EC fan to supply air which provides better energy efficiency and speed control. The fan
rated power consumption is 200W and air volume flow rate is 2000 m³/h. The AHU rated
cooling capacity is 23.4kW with designed chilled water inlet temperature 6°C. In the
ACB systems, the whole latent load is handled by the primary air. Consequently, the
LDDS is needed to further absorb the moisture in the supply air. After treated by the
DOAS, the moisture content of the primary air can be reduced to 3g/kg and meet the
indoor latent load requirement.
Figure 3.9 The liquid desiccant dehumidification system

33
Summary
This chapter presents the experimental setup of chiller plant and DOAS. Besides, the
mechanical design of the ACB and ATB terminal units are described. The pilot plant was
setup based on the load calculation and the HVAC system layout. As the proposed air
conditioning system has a high degree of freedom in adjusting the operation parameters.
The aerodynamic and thermodynamic performance of the terminal units can be
comprehensively investigated. In the following chapters, the research into active air
terminal system will be presented.

34
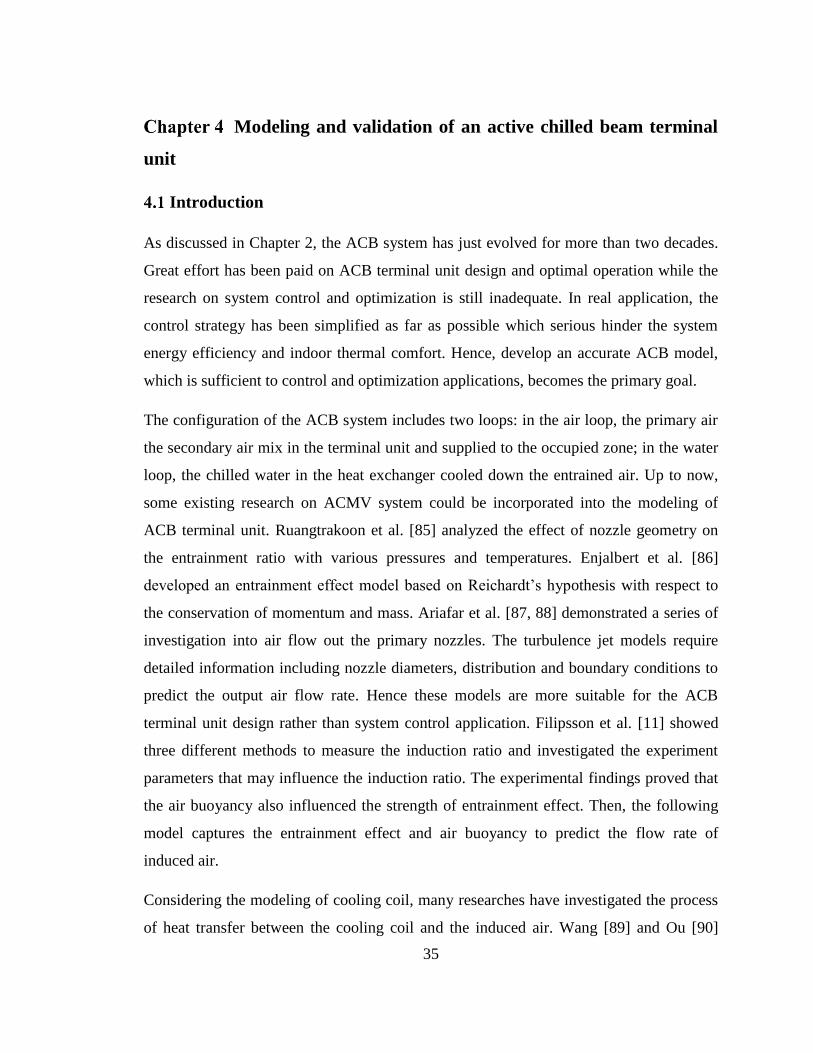
35
Modeling and validation of an active chilled beam terminal
unit
Introduction
As discussed in Chapter 2, the ACB system has just evolved for more than two decades.
Great effort has been paid on ACB terminal unit design and optimal operation while the
research on system control and optimization is still inadequate. In real application, the
control strategy has been simplified as far as possible which serious hinder the system
energy efficiency and indoor thermal comfort. Hence, develop an accurate ACB model,
which is sufficient to control and optimization applications, becomes the primary goal.
The configuration of the ACB system includes two loops: in the air loop, the primary air
the secondary air mix in the terminal unit and supplied to the occupied zone; in the water
loop, the chilled water in the heat exchanger cooled down the entrained air. Up to now,
some existing research on ACMV system could be incorporated into the modeling of
ACB terminal unit. Ruangtrakoon et al. [85] analyzed the effect of nozzle geometry on
the entrainment ratio with various pressures and temperatures. Enjalbert et al. [86]
developed an entrainment effect model based on Reichardt’s hypothesis with respect to
the conservation of momentum and mass. Ariafar et al. [87, 88] demonstrated a series of
investigation into air flow out the primary nozzles. The turbulence jet models require
detailed information including nozzle diameters, distribution and boundary conditions to
predict the output air flow rate. Hence these models are more suitable for the ACB
terminal unit design rather than system control application. Filipsson et al. [11] showed
three different methods to measure the induction ratio and investigated the experiment
parameters that may influence the induction ratio. The experimental findings proved that
the air buoyancy also influenced the strength of entrainment effect. Then, the following
model captures the entrainment effect and air buoyancy to predict the flow rate of
induced air.
Considering the modeling of cooling coil, many researches have investigated the process
of heat transfer between the cooling coil and the induced air. Wang [89] and Ou [90]
36
developed cooling coil models and analyzed the heat and mass transfer characteristics
inside the LDDS based on the hybrid modeling approach to monitor the system
performance. Lee [91] adopted the multi node approach and developed a simplified
explicit model which can estimate the heat transfer rate of the chilled water cooling coil
under both dry and wet condition. Li et al. [92] and Afram [93] integrated first principles,
real time experimental results and system constructions in order to develop a cooling coil
model in the AHU based on hybrid method which could detect system operation fault and
efficiency. Constrained by the unique working principle of ACB, the induced air off coil
temperature is difficult to measure. Hence, the modeling approach should reduce the
assistant information and maintain the model accuracy. Chen et al. [61] firstly developed
a hybrid model for ACB terminal unit which catched the thermodynamic and mechanical
aspects of the heat exchanger and air jet. Although the air jet model was simple, the
proposed model failed to evaluate the influence of air buoyancy force and the complexity
of the heat exchanger model undermined its practicability. Hence, the cooling coil model
requires further simplification for the monitoring, control and optimization of ACB
system.
In this chapter, a hybrid model of ACB terminal unit is developed to predict the induced
air flow rate and heat transfer process in the terminal unit. The model is derived based on
physical and thermodynamic principles using hybrid modeling approach. The models are
derived from heat transfer mechanism and the energy balance principle, while the
parameters are identified by experimental data. The ACB model is combined with two
sub models, namely the air entrainment model and heat transfer model. The air
entrainment model captures the entrainment effect and the air buoyance force. The
simplified cooling coil model describes the heat transfer process with no more than three
lumped parameters. The air side and chilled water side information has been encapsulated
to expand the model application range. The unknown characteristics parameters are
identified using Levenberg Marquardt method with respect to the experimental results.
The model validation is conducted to verify the model effectiveness.

37
This chapter is structured as follows: the model development and experimental
procedures are presented in Section 4.2 and 4.3; the validation results are illustrated in
Section 4.4; and the summary is given in Section 4.5.
Modeling development of ACB
The interactions of the sub-models of the ACB system is demonstrated in Figure 4.1 The
interaction of the ACB sub-models.
Figure 4.1 The interaction of the ACB sub-models
The following assumptions are adopted to simplify the mathematical derivation of the
model:
1. Condensation is avoided during the test.
2. The air is homogeneously mixed in the air chamber.
3. The chilled water temperature field distributes evenly in the heat exchanger.
4. The heat storage is neglected in the tube of cooling coil.

38
5. The joints of the cooling coil and tubes of the temperature sensor are adiabatic.
Air entrainment model
In ACMV systems, the air flow rate is generally described by flow resistance and
pressure in the duct. The plenum pressure is more accessible compared with the air side
flow rate. The total flow resistance in the ACB terminal unit is affected by the dimension
of the air chamber, the shape of the nozzles and so on. During the test, the flow resistance
is considered as a constant and the chamber pressure is the unique variable in the
entrainment process. As a consequence, it is suitable to reflect the entrainment effect via
the air plenum pressure.
PV
R (4.1)
where V is the air volume flow rate, P is the pressure in the primary air plenum, R is the
flow resistance of the total air passage.
To avoid sophisticated air entrainment theories, empirical relationship is utilized to
describe how the air flow rates vary with the plenum pressure.
b
priV aP (4.2)
0sec
dV cP (4.3)
where priV is the primary air volume flow rate, 0secV is the second air volume flow rate
without air buoyance, , , and a b c d are the unknown constant coefficients.
The induced secondary air with low ventilation velocity is sensitive to operation
environment. The air through the coiling coil and the air in the conditioned zone are of
different temperatures which would drive the air flow due to air buoyancy. To describe
the air movement, the Boussinesq approximation is adopted.
The equation of air motion based on acceleration due to gravity:

39
' chwa z
chwa
g g
(4.4)
where 'g is the air effective gravity, g is the acceleration of gravity, z is the zone air
density, chwa is the air density around the ACB cooling coil.
Refer to the ideal gas law PV nRT , under ideal condition nT
V RP
,pM
RT , the
effective gravity is described by:
' z chwa
z z
T T Tg g g
T T
(4.5)
where zT is the room temperature, chwaT is the average chilled water supply temperature,
T is the average temperature difference between the room chilled water.
Adopt empirical relationship, the constants including the dimension of the room, size of
the coil inlet grille, the resistance of air flow and etc. are lumped into the constant of
proportionality. Combined with Eq. (4.3) the room temperature and average temperature
difference are the additional manipulated parameters. The secondary air flow rate can be
described by:
sec ( )d n
z
TV cP k
T
(4.6)
where secV is the second air volume flow rate under air buoyance, k and n are unknown
constant coefficients.
The entrainment effect of the ACB terminal unit is described by entrainment ratio. The
relation between the primary air flow rate, the second air flow rate, the supply air flow
rate and the ER can be obtained as follows:
supsec 1
pri pri
VVER
V V (4.7)

40
sup sec ( )b d n
pri
z
TV V V aP cP k
T
(4.8)
( ) +
nd b
b n
z
c k TER P
a a P T
(4.9)
where ER is the entrainment ratio, supV is the supply air flow rate.
As mentioned in the assumptions, the air is homogeneously mixed in the air chamber.
The supply air temperature and second air off coil temperature can be calculated as:
sec sec
sup
sec
pri pri
pri
T V T VT
V V
(4.10)
sup sup sec sup sup
sec
sec
( ) ( ) *pri pri priT T V T V T T T ERT
V ER
(4.11)
where secT , priT and supT are induced air off coil temperature, primary air temperature,
supply air temperature.
Heat transfer model
The condensation is strictly avoided during the heat transfer process in the ACB. Hence,
only sensible heat transfer exists between the cooling coil and the induced secondary air.
The amount of heat transfer from hot secondary air to chilled water due to temperature
difference can be expressed as:
. .a in c in
h
T TQ
R
(4.12)
where . ., ,a in c inQ T T and hR are the heat transfer rate, the secondary air inlet temperature,
the chilled water inlet temperature and the overall thermal resistance respectively.

41
The overall resistance is composed of three parts: the thermal resistance of the air
convection, the thermal resistance of the cooling coil conduction and the thermal
resistance of the chilled water convection. However, the wall of the cooling coil is made
of copper which has good thermal conduct. Therefore, the thermal resistance of the
cooling coil can be neglected. Then the overall thermal resistance can be expressed as:
h a cR R R (4.13)
where aR and cR are the thermal resistance of secondary air convection and chilled water
convection.
The chilled water and primary air are driven mechanically by pump and fan. So, the heat
transfer between the air and the chilled water is forced convection heat transfer. The heat
transfer coefficient influenced by the cooling coil diameter and the fluid thermal
conductivity which can be calculated by the Reynold number ReD and Prandtl number
Pr [94]:
Re Pr ( ) ( )
pe f e f
D
ChD DC C
(4.14)
where , and C e f are constant coefficients, D is the characteristic length, h is the heat
transfer coefficient, is the thermal conductivity, is the fluid density, is the fluid
flow velocity, is the fluid absolute viscosity, pC is the fluid specific heat.
The assumption is made that the temperature and fluid in the cooling coil are evenly
distributed. Accordingly, the chilled water density and velocity remain unchanged when
steady state is obtained. Then the heat transfer coefficient can be rewritten as:
4( ) ( ) ( ) ( )
p pe f e f eC CD V m
h C C xmD A D D
(4.15)
where 4
( ) ( )pe f
Cx C
D D
, A is the fluid section area, V is the fluid volume flow
rate, m is the fluid mass flow rate.

42
The total heat resistance can be rewritten as:
1 1h
a c ca
Rh A h A
(4.16)
For eh xm
1 1e e
a a a c c ch e e
a a c c a a a c c c
x A m x A mR
h A h A x A m x A m
(4.17)
where , , , ,a c a c ah h A A m and cm are the heat transfer coefficients, the mass flow rates, the
heat transfer areas of induced air and chilled water respectively. ax and cx are constant
parameters need to be identified.
Combining Eqs. (4.12) and (4.17), the heat transfer rate in the cooling coil can be
expressed as:
. . . .( ) ( )
1
e e e
a a a c c c c c ca in chw in a in chw inee e
c c ca a a c c c
e
a a a
x A m x A m x A mQ T T T T
x A mx A m x A m
x A m
(4.18)
Based on the conservation of energy, the heat incremental of secondary air is equal to the
heat transfer rate in the cooling coil as the heat specific of cooling coil is neglected. Then
we obtained:
. . . .
1. .
2
( ) ( )
1
( )
1 ( )
e
c c ca a a in a out a in chw ine
c c c
e
a a a
e
ca in chw in
ec
a
x A mQ C m T T T T
x A m
x A m
b mT T
mb
m
(4.19)
where 1 2, /c c c c a ab x A b x A x A , aC is the heat specific capacity of air, aM is the mass
flow rate of secondary air. .a inT and .a outT are secondary air on and off coil temperature.

43
Then, the heat transfer rate of the cooling coil is rewritten as:
1
. .
2
( )( )
[ ]
( )
e
a ca in chw in
e eca
d n
z
b mQ T T
mb
TcP k
T
(4.20)
where a is the air density.
The proposed ACB model is of brief structure and characterized by fewer parameters
which can be identified through experimental results using nonlinear least square method.
Parameter identification
To estimate the model parameters, the nonlinear least square method is adopted.
2
2
1 1 .
2
1 .2
. . . ..1 1
2
.
( ) ( ) ( ( ) )
( ) ( ) ( ( ) )
1 ( )
N Nb d ni
i i i i
i i z i
eN Nc j
j a in j chw in j jc j ej j
a j
Tf u r u aP cP k V
T
b mf c r c T T Q
mb
m
(4.21)
where f is the sum of the squares of the residuals between identified results and
experimental results; ir is the residuals between identified results and experimental
results; [ ]Tu k n and 1 2[ ]Tc b b e are the parameter vectors to be identified; iV is the
experimental supply air flow rate; jQ is the experimental heat transfer rate.
The Levenberg-Marquardt method is adopted to search for the optimal solution for the
unidentified parameters. The descent direction is obtained as follows:
( ) ( ) ( ) ( ) ( ) ( )( ( ) ( ) ) ( ) ( ) ( )T Tk k k k k kJ c J c I P c J c r c (4.22)
44
where 1 2( ) [ ( ) ( ) ( )]T
Nr c r c r c r c , ( ) 0k is a scalar, I is the identity matrix, ( )kP is in
a descent direction.
The Jacobian matric is defined as:
1 1 1
1 2
2 2 2
1 2
1 2
N N N
r r r
b b e
r r r
u b eJ
r r r
u b e
(4.23)
In each iteration, suitable value should be given to ( )k which can be expressed as:
( ) ( 1) ( )
( 1)
( ) ( 1) ( )
/ =
k k k
k
k k k
if f f
if f f
(4.24)
And
( 1) ( ) ( )k k kc c P (4.25)
The iteration ends if ( 1) ( )k kc c , where is the tolerance set as
51 10 .
Experimental procedure
To develop an accuracy and feasible model for ACB terminal unit, experiment are
conducted under a wide operation range. Both the air loop and water loop parameters are
varied during the experiments. Fans and pumps are equipped with VSD to modulate the
primary air and chilled water volume flow rate. In addition, the heating panels and
chillers can provide various thermal load and cooling capacity to meet different cooling
demands. The steady state data sets are recorded in the data acquisition system. 3 cases of
experiments are conducted to comprehensively evaluate the ACB terminal unit
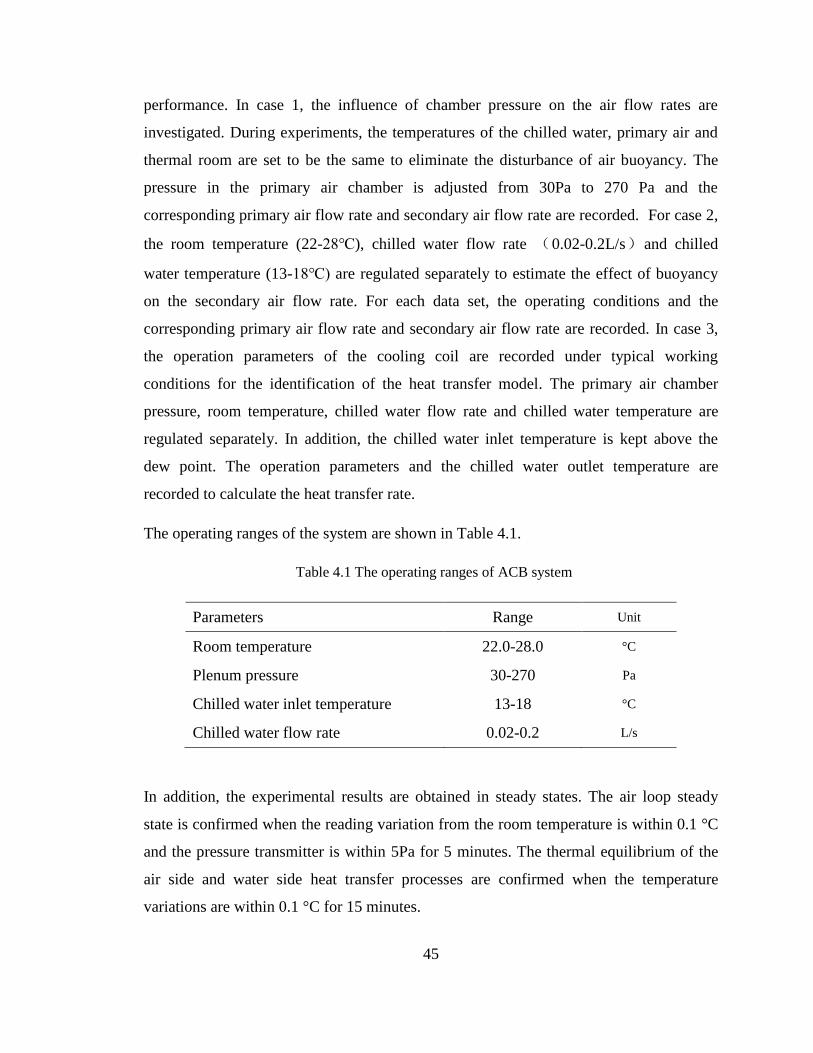
45
performance. In case 1, the influence of chamber pressure on the air flow rates are
investigated. During experiments, the temperatures of the chilled water, primary air and
thermal room are set to be the same to eliminate the disturbance of air buoyancy. The
pressure in the primary air chamber is adjusted from 30Pa to 270 Pa and the
corresponding primary air flow rate and secondary air flow rate are recorded. For case 2,
the room temperature (22-28℃), chilled water flow rate (0.02-0.2L/s)and chilled
water temperature (13-18℃) are regulated separately to estimate the effect of buoyancy
on the secondary air flow rate. For each data set, the operating conditions and the
corresponding primary air flow rate and secondary air flow rate are recorded. In case 3,
the operation parameters of the cooling coil are recorded under typical working
conditions for the identification of the heat transfer model. The primary air chamber
pressure, room temperature, chilled water flow rate and chilled water temperature are
regulated separately. In addition, the chilled water inlet temperature is kept above the
dew point. The operation parameters and the chilled water outlet temperature are
recorded to calculate the heat transfer rate.
The operating ranges of the system are shown in Table 4.1.
Table 4.1 The operating ranges of ACB system
Parameters Range Unit
Room temperature 22.0-28.0 °C
Plenum pressure 30-270 Pa
Chilled water inlet temperature 13-18 °C
Chilled water flow rate 0.02-0.2 L/s
In addition, the experimental results are obtained in steady states. The air loop steady
state is confirmed when the reading variation from the room temperature is within 0.1 °C
and the pressure transmitter is within 5Pa for 5 minutes. The thermal equilibrium of the
air side and water side heat transfer processes are confirmed when the temperature
variations are within 0.1 °C for 15 minutes.

46
The specifications of all the sensors installed in the duct and water pipes are depicted in
Table 4.2.
Table 4.2 Sensor specification
Sensors Product Model Accuracy Measuring Range
Air temperature EE21 ±0.2 °C -40~60°C
Air humidity EE21 ±2% RH 0~100%RH
Differential pressure Dwyer MS-111 2% 0~250Pa
Air flowmeter 8710 DP-CALC ±3% 42~4250 m3/h
Water temperature Siemens QAE21 ±0.3°C -30~130°C
Water pressure difference EJA110A ±0.065% of Span 1~100kPa
Water flow rate LWGY-A 1% 100~600L/h
Model validation
The effectiveness of the proposed model is evaluated through relative error and root
mean square of relative error, which is expressed as follow:
100%
c r
r
V VRE
V
(4.26)
2
1
N
iiRE
RMSREN
(4.27)
where cV is the calculated value, rV is the actual measured value, N is the number of
fitted points.
Table 4.3 Summary of identified parameters
Model Identified model parameters
Air entrainment a =10.1770, b =0.5173, c =22.4322, d =0.5474, k =-54.4590, n =1.1099
Heat transfer 1b =1383.5998, 2b =2.4672, e =0.8125
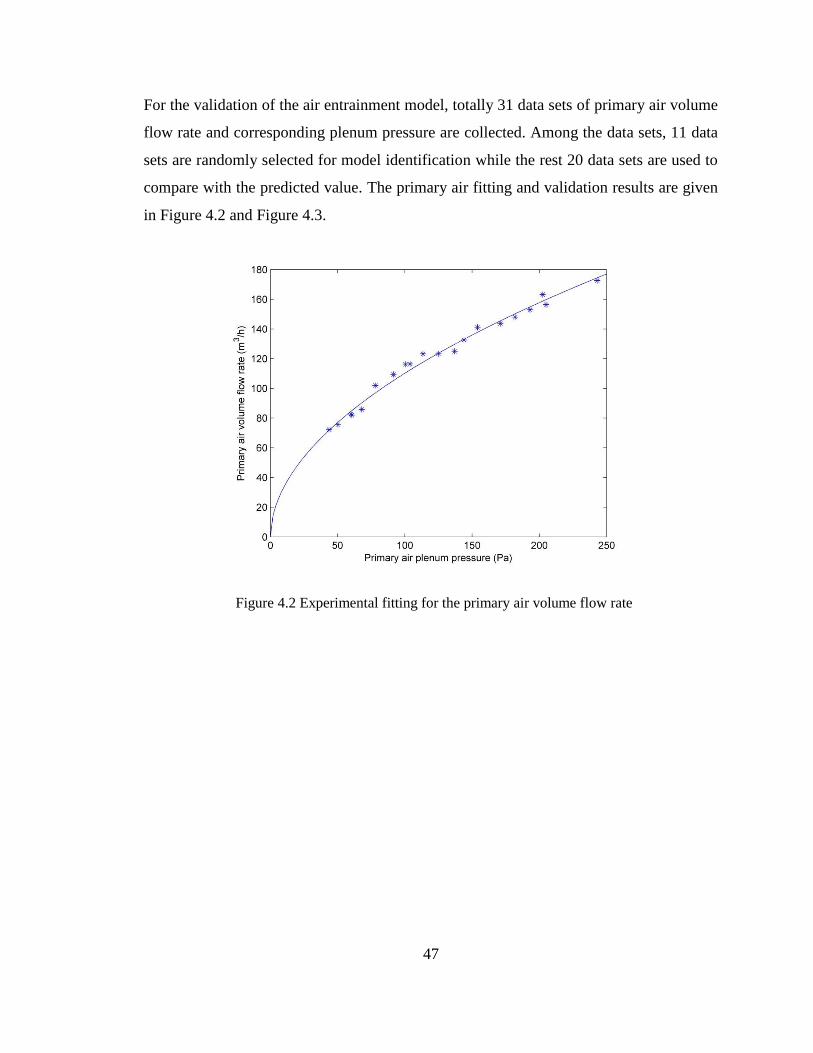
47
For the validation of the air entrainment model, totally 31 data sets of primary air volume
flow rate and corresponding plenum pressure are collected. Among the data sets, 11 data
sets are randomly selected for model identification while the rest 20 data sets are used to
compare with the predicted value. The primary air fitting and validation results are given
in Figure 4.2 and Figure 4.3.
Figure 4.2 Experimental fitting for the primary air volume flow rate

48
Figure 4.3 Model validation for primary air volume flow rate
As the entrainment process is more susceptible to interference, repeat tests are conducted
to minimize the experimental error. Meanwhile, to estimate the influence of air buoyancy
on entrainment effect, the air loop and water loop parameters are adjusted within a large
range. Totally 165 data sets are collected in respect to secondary air flow rate, chamber
pressure difference, room temperature and chilled water inlet temperature. 45 data sets
are randomly selected to identify the model coefficients and the rest 120 data sets are
used for model validation. The model validation is illustrated in Figure 4.4.
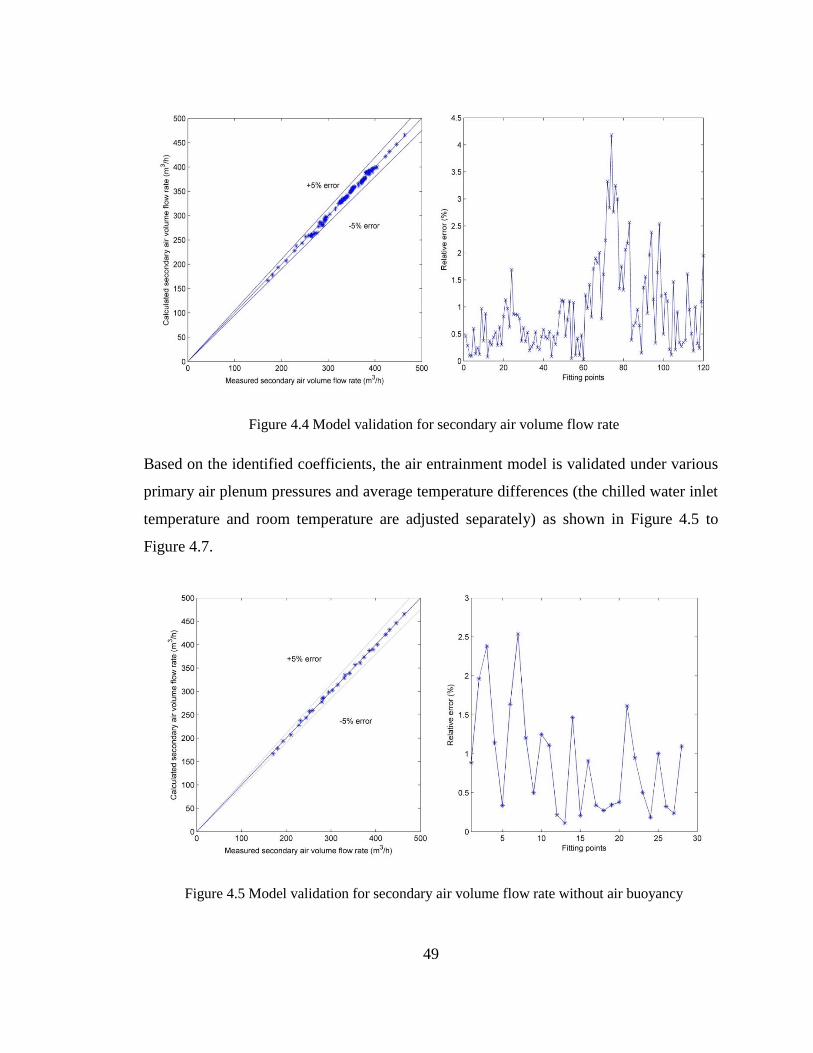
49
Figure 4.4 Model validation for secondary air volume flow rate
Based on the identified coefficients, the air entrainment model is validated under various
primary air plenum pressures and average temperature differences (the chilled water inlet
temperature and room temperature are adjusted separately) as shown in Figure 4.5 to
Figure 4.7.
Figure 4.5 Model validation for secondary air volume flow rate without air buoyancy

50
Figure 4.6 Model validation for secondary air volume flow rate under various chilled water inlet
temperatures
Figure 4.7 Model validation for secondary air volume flow rate under various room temperatures
The influence of the chilled water on the entrainment effect is investigated. The test
results indicate that the average temperature differences have adverse impact on the
entrainment effect. As shown in Figure 4.8, the entrained secondary air is negatively
correlated with the average temperature difference. The secondary air flow rate is
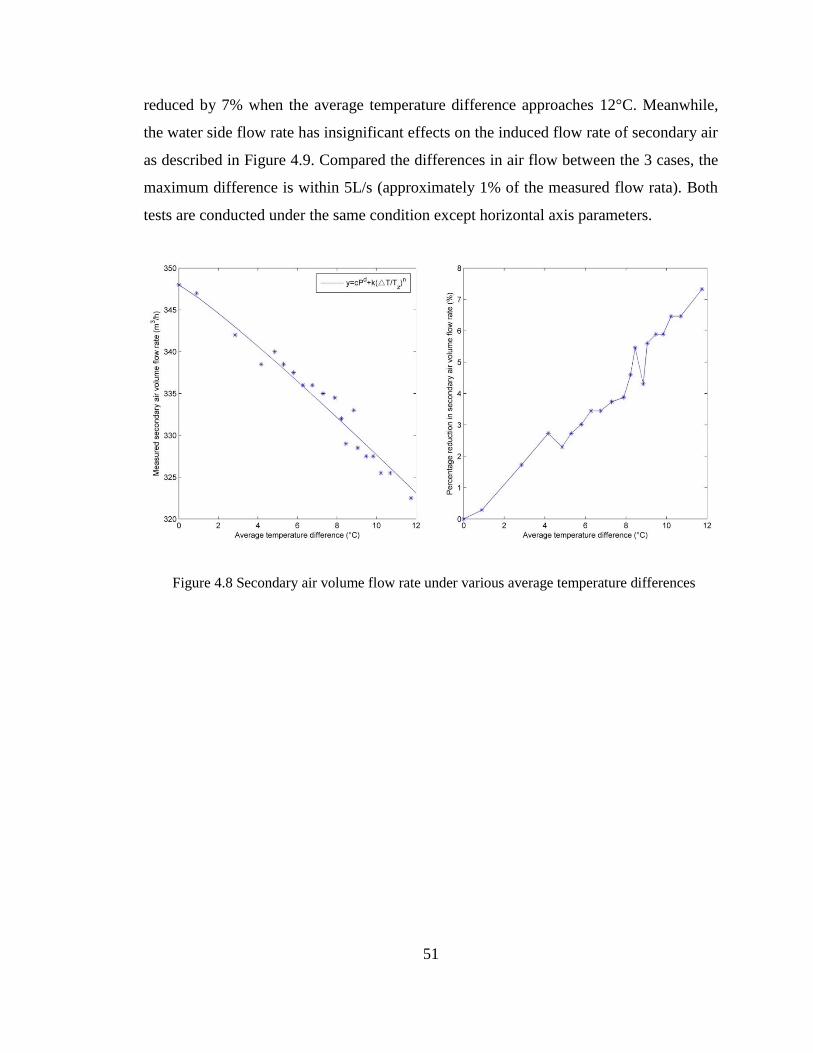
51
reduced by 7% when the average temperature difference approaches 12°C. Meanwhile,
the water side flow rate has insignificant effects on the induced flow rate of secondary air
as described in Figure 4.9. Compared the differences in air flow between the 3 cases, the
maximum difference is within 5L/s (approximately 1% of the measured flow rata). Both
tests are conducted under the same condition except horizontal axis parameters.
Figure 4.8 Secondary air volume flow rate under various average temperature differences
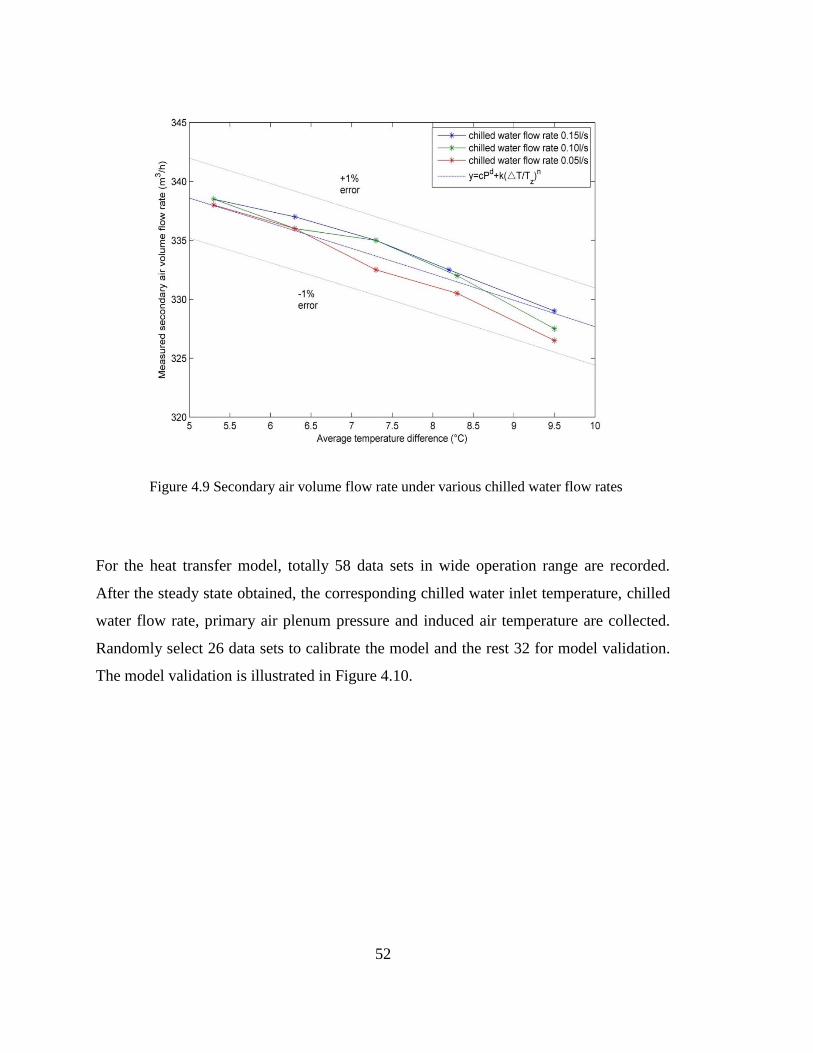
52
Figure 4.9 Secondary air volume flow rate under various chilled water flow rates
For the heat transfer model, totally 58 data sets in wide operation range are recorded.
After the steady state obtained, the corresponding chilled water inlet temperature, chilled
water flow rate, primary air plenum pressure and induced air temperature are collected.
Randomly select 26 data sets to calibrate the model and the rest 32 for model validation.
The model validation is illustrated in Figure 4.10.
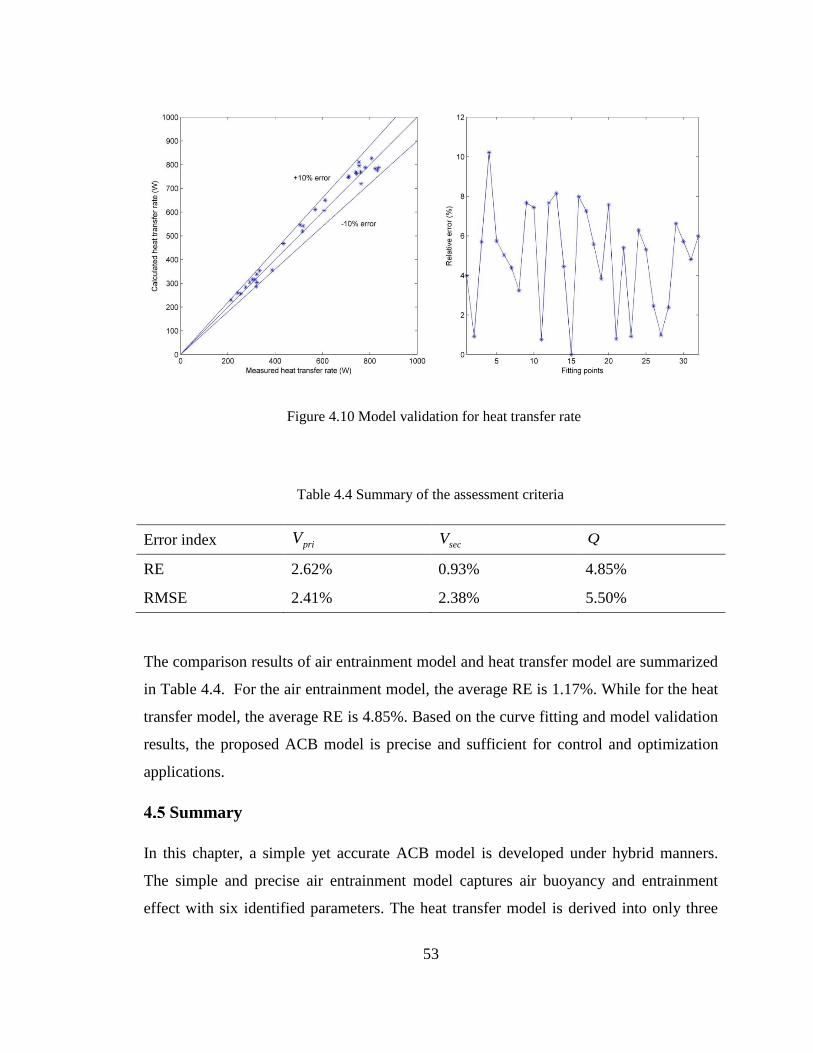
53
Figure 4.10 Model validation for heat transfer rate
Table 4.4 Summary of the assessment criteria
Error index priV secV
Q
RE 2.62% 0.93% 4.85%
RMSE 2.41% 2.38% 5.50%
The comparison results of air entrainment model and heat transfer model are summarized
in Table 4.4. For the air entrainment model, the average RE is 1.17%. While for the heat
transfer model, the average RE is 4.85%. Based on the curve fitting and model validation
results, the proposed ACB model is precise and sufficient for control and optimization
applications.
Summary
In this chapter, a simple yet accurate ACB model is developed under hybrid manners.
The simple and precise air entrainment model captures air buoyancy and entrainment
effect with six identified parameters. The heat transfer model is derived into only three

54
lumped parameters by analyzing first principles and experimental results. On the basis of
experimental findings, the conclusions are summarized below:
1. The primary air plenum pressure and the average temperature difference are the
main variables that determine the flow rates of primary air and secondary air.
While the chilled water flow rate has insignificant effects on the induced air flow
rate.
2. The air buoyancy generated by temperature difference impedes the entrainment
process which reduces the flow rate of secondary air by 7% in the cooling mode.
Both the room temperature and chilled water inlet temperature are correlated with
the entrainment ratio.
3. The ACB sub-models have good agreements with the experimental results under
different operation conditions (average RE<5%). The proposed ACB model
simplifies the calculations and processes for real engineering applications.
The proposed ACB model can be further applied to real time performance evaluations
and optimizations. The parameters, which affect the entrainment ratio, are analyzed and
they can improve the ACB performances including avoiding condensation and increasing
the operation efficiency. However, there are more researches to be noted, such as
modifying the ACB structures to take advantage of air buoyancy and optimizing the
system performance using the proposed ACB model.

55
Mechanical design and performance evaluation of active
thermosiphon beam terminal units
Introduction
In the last chapter, a model of ACB terminal unit is developed with respect to air
buoyancy. The experimental results indicate that the air buoyancy dramatically hinders
the operation efficiency of ACB. Hence, it is necessary to improve the mechanical design
of the terminal units to achieve better operation efficiency. Combining air entrainment
effect and displacement ventilation, the ATB is developed as an innovation solution to
ACMV system. As there is no dedicated study on the ATB until now, some references on
the ACB and passive displacement ventilation systems are incorporated into the research
of ATB.
The PDV is an emerging terminal unit which gains incremental interests in America and
Asian countries [95, 96]. The design and performance of PDV system have been
investigated to further improve the system energy efficiency and IAQ. Chen et al. [97]
provided design guidelines and calculation standard for the PDV system. The results
indicated that the PDV system could provide high quality indoor environment and save
energy under high cooling load conditions if designed properly. Novoselac et al. [27, 53,
98] studied the combined PDV-cooled ceiling system and compared the performance to
the VAV system. The combined system had advantages in terms of IAQ and thermal
distribution but required certain temperature gradient to remove air contaminant. Shen et
al. [83] compared the performances of PDV system and mixing ventilation with respect
to indoor thermal comfort, short term performance and SBS in two tutorial rooms. The
results revealed that PDV had less overall draft sensation and satisfactory short term
performance with proper system control. In reality, many theoretical researches had
optimized the overall performance of the PDV system. Hunt et al. [99] analyzed the
ventilation driven by buoyance force. A theoretical model was built which can be applied
to predict natural ventilation in the building. Fredriksson and Nelson [100, 101]
investigated the effect of thermal load configuration and false ceiling on the efficiency of
displacement ventilation. Koskela et al. [102, 103] characterized the ACB operating

56
performance under summer, winter and midseason. Li [104] and Xu [105] investigated
the SHR and total cooling capacity of direct expansion ACMV system under various
working conditions.
Based on the above research, the mechanical design and working principles of ATB are
demonstrated in this chapter. Meanwhile, the ATB system, which captures the advantages
of PDV and ACB systems, is sensitive to the operation condition and internal load
distribution. Experiments are conducted under various working condition to investigate
the hydrodynamic and thermodynamic characteristics of the terminal unit. Based on the
experimental results, the ATB system has outstanding performances in regulating the
indoor environment with respect to energy saving, IAQ improvement and thermal
comfort. In addition, the ATB overcome all the drawbacks of the ACB system including
condensation, high initial cost and poor chilled water temperature control.
In this chapter, the mechanical design and working principle of ATB are introduced in
Section 5.2; the experimental setup and theoretical analysis are proposed in Section 5.3;
the experimental results are illustrated in Section 5.4; a brief summary is given in Section
5.5.

57
The ATB working principle
Figure 5.1 The air flow patterns of the ATB system
The air flow patterns of the ATB system are demonstrated in Figure 5.1. Comparing with
ACB, the utilization of the thermosiphon effect (passive heat exchange based on natural
convection across air temperature gradients) and the additional water drainage system are
the core innovation of ATB. The ATB terminal units are installed in the layer of warm air
formed above the occupied zone. And the terminal units can operate in two models:
active mode ad passive mode. For the active mode, the DOAS is needed to continuously
deliver fresh air to build up primary chamber pressure. The primary air is then discharged
through the nozzles with high velocity which generates the negative pressure kernel
behind the cooling coil. The warm air in the ceiling height will be induced through the
heat exchanger due to air entrainment and fluid thermosiphon effects. The primary air
and induced air combine in the chamber. The cooled air moves to the floor level along
the fall duct and delivers slowly across the room. During the operation, the condensate
water formed on the surface of the cooling coil drops into the tray and drained out via
gravity.

58
When the primary air is cut off, the ATB can operate in passive mode. A fully-stratified
displacement air distribution system is demonstrated in Figure 5.2. Due to the
gravitational force caused by the high density cooled air, the primary air in the chamber
will drop along the air straightener to the floor level and then spread over the occupied
zone. Once the high density supply air encounters the heat source, it absorbs the internal
heat and rises towards the ceiling. As a consequence, the low density warm air forms
above the ceiling and induced to the cooling coil. The internal load is removed by this
ventilation process.
Figure 5.2 The temperature distribution of the ATB system
The typical chilled water inlet temperature of ATB is 8°C, the condensate water forms on
the heat exchanger will drop to the drain pan and discharge through the water drainage
system. This process can remove the indoor moisture content and maintain the relative
humidity in the occupied zone. Consequently, the supply air volume flow rate from the
DOAS is reduced to meet the basic fresh air requirement without considering the latent
load.

59
Experimental study
The experimental setup
An ATB system is setup at NTU Eugenia Room (a meeting room at N2.1-B2-17). The
Eugenia room can accommodate up to 20 people with the diameter of 7m×5m×2.8m
(+1m above the ceiling). The ATB terminal unit (external diameter 450mm*1200mm)
used in the test adopts plain fin-and-tube cooling coil with a dimension of
1062mm×325mm×78mm. Total thirty nozzles with 7mm inner diameter are evenly
distributed inside the unit. To optimize the ventilation process, the ATB is mounted on
the wall above the ceiling and 20 pieces of false ceiling are replaced by return air grille.
In addition, one chiller plant is equipped with the capability to adjust the water pressure
and control the water temperature. A booster fan with VSD is installed in the fresh air
duct to keep sufficient static pressure of primary air system. The indoor temperature and
moisture content are monitored by a thermostat. The primary air plenum pressure is
obtained by a pressure difference sensor. The pitot tube is adopted to record the primary
air flow rate. The water side temperatures are evaluated by PT-100 platinum resistance
temperature transmitters. And a turbine flowmeter is installed to measure the chilled
water flow rate. The data acquisition system is set up to collect experimental results with
a sampling rate of 1s. All the water loop sensors and pipes are covered with insulation
foam to minimize the uncertainty of measurements.

60
Figure 5.3 The NTU Eugenia Room
The sensors installed are depicted in Table 5.1.
Table 5.1 Summary of sensor specification
Sensors Product Model Accuracy Measuring Range
Air temperature EE21 ±0.2 °C -40~60°C
Air humidity EE21 ±2% RH 0~100%RH
Air velocity TSI 8475 ±3% 0~2.5m/s
Air flow rate KIMO-C310 ±5% 0-600m3/h
Water temperature Siemens QAE21 ±0.3℃ -30~130°C
Water flow rate LWGY-A 0.5% 1~600L/h
Differential pressure Dwyer MS-111 2% 0~250Pa
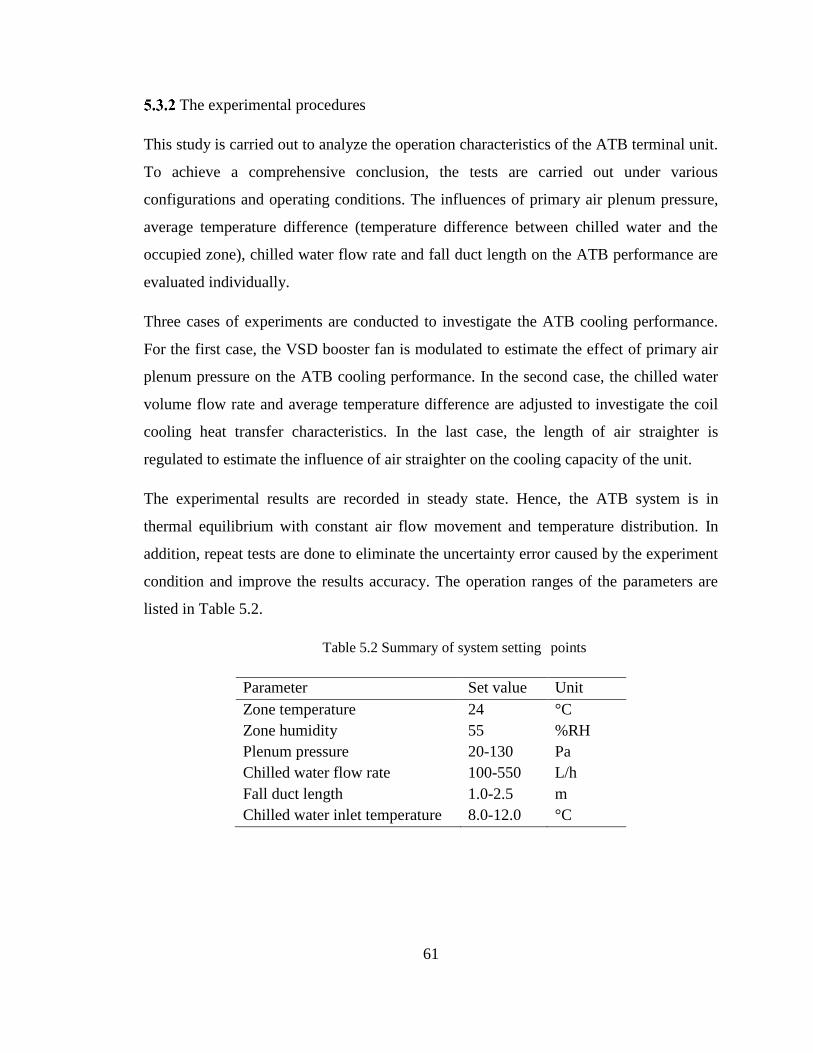
61
The experimental procedures
This study is carried out to analyze the operation characteristics of the ATB terminal unit.
To achieve a comprehensive conclusion, the tests are carried out under various
configurations and operating conditions. The influences of primary air plenum pressure,
average temperature difference (temperature difference between chilled water and the
occupied zone), chilled water flow rate and fall duct length on the ATB performance are
evaluated individually.
Three cases of experiments are conducted to investigate the ATB cooling performance.
For the first case, the VSD booster fan is modulated to estimate the effect of primary air
plenum pressure on the ATB cooling performance. In the second case, the chilled water
volume flow rate and average temperature difference are adjusted to investigate the coil
cooling heat transfer characteristics. In the last case, the length of air straighter is
regulated to estimate the influence of air straighter on the cooling capacity of the unit.
The experimental results are recorded in steady state. Hence, the ATB system is in
thermal equilibrium with constant air flow movement and temperature distribution. In
addition, repeat tests are done to eliminate the uncertainty error caused by the experiment
condition and improve the results accuracy. The operation ranges of the parameters are
listed in Table 5.2.
Table 5.2 Summary of system setting points
Parameter Set value Unit
Zone temperature 24 °C
Zone humidity 55 %RH
Plenum pressure 20-130 Pa
Chilled water flow rate 100-550 L/h
Fall duct length 1.0-2.5 m
Chilled water inlet temperature 8.0-12.0 °C

62
Theoretical analysis
The heat transfer rate between the secondary air and chilled water under steady state can
be calculated by the water side information.
. .( )total chw chw chw chw out chw inQ C V T T (5.1)
where totalQ is the cooling coil heat transfer rate, chwC is the water specific heat capacity,
chw is the chilled water density, chwV is the chilled water flow rate, .chw outT and .chw inT are
the chilled water outlet and inlet temperature.
With a known function introduced previously, the flow rate of primary air can be derived
from primary chamber gauge pressure.
( )pri aV f P (5.2)
As the nominal chilled water inlet temperature for the ATB system is 8°C, the
condensation would occur during the ATB operation. Hence, the ATB can meet both
sensible and latent load requirement. The secondary air volume flow rate can be
calculated via the law of conservation of energy:
sec sec sec( )pri a pri a total am a priH V H V Q H V V (5.3)
( )H g T RH (5.4)
sec
sec
( )
( )
am pri a pri total
am a
H H V QV
H H
(5.5)
where a is the air density, priV is the primary air flow rate, priH is the primary air
enthalpy, secV is the second air flow rate, secH is the second air enthalpy and amH is the
mix air enthalpy.
Combine with Eq. (5.5), the secondary air off-coil temperature and relative humidity can
be calculated by inverting the air mixing process.
63
sec sec
sec
sec
( )pri pri asoc am pri
am pri pri pri am
asoc
T V T V T V V
T V T V T VT
V
(5.6)
sec sec
sec
sec
( )pri a pri asoc a am a pri
am a pri pri a pri am a
asoc
a
W V W V W V V
W V W V W VW
V
(5.7)
where priT is the primary air temperature, asocT the secondary air off-coil temperature,
amT is the mix air temperature. priW is primary air moisture content, amW is mix air
moisture content and asocW is secondary air off-coil moisture content.
Then, the sensible and latent cooling capacity of the heat exchanger can be calculated
separately
sec ( )sen a a as asocQ V C T T (5.8)
lat total senQ Q Q (5.9)
where senQ is the sensible cooling capacity and latQ is the latent cooling capacity.
The overall cooling capacity of ATB terminal unit is the sum of cooling from primary air
and heat exchanger.
. . sec( ) ( )sum pri chw chw chw chw out chw in pri a priQ Q Q C V T T H H V (5.10)
where sumQ is the total cooling capacity of ATB terminal unit.
Assessment criteria
The entrainment ratio, sensible heat ratio and heat transfer efficiency are used as the
performance indexes to evaluate heat transfer performance of the ATB.

64
Inducing the secondary air across the cooling coil without fan energy requirement
(entrainment effect) is one of the core innovations of ATB technology. Entrainment ratio
is used to evaluate the entrainment effect.
sec
pri
VER
V (5.11)
where secV is the secondary air volume flow rate, ER is the entrainment ratio and priV is
the primary air volume flow rate.
The ATB takes advantage of chilled water to handle the indoor latent load and sensible
load. In the ATB system, the primary volume flow rate is minimized to satisfy the fresh
air requirement without considering the indoor latent load. The sensible heat ratio is
applied to estimate the terminal unit latent cooling capacity.
sen
total
QSHR
Q (5.12)
where SHR is the sensible heat ratio
Under the same operation condition, the heat transfer effectiveness of ATB is also
influenced by the unit configuration, nozzle design and etc. As a consequence, the heat
transfer effectiveness is used to evaluate the terminal unit mechanical design and cooling
performance. It is defined as the ratio of the water side heat transfer rate to the primary
air volume flow rate.
totalh
pri
Q
V (5.13)
where h is the heat transfer effectiveness.

65
Experimental results
The influences of primary air plenum pressure, average temperature difference, fall duct
length and chilled water flow rate on the performance of ATB are investigated with
respect to total cooling capacity, ER, SHR, and heat transfer effectiveness.
Primary air plenum pressure
Figure 5.4 - Figure 5.6 illustrate the variations of heat transfer rate, SHR and secondary
air volume flow rate under different plenum pressures. The primary air plenum pressure
has a significant influence on the ATB cooling performance which determines the
entrainment ratio and affects the flow rate of secondary air. Based on the experimental
results, the secondary air volume flow rate and heat transfer rate grow exponentially with
the increase of primary air plenum pressure. As the increment of secondary air flow rate
facilitates the heat exchange between the induced air and the cooling coil. From Figure
5.5 and 5.6, the SHR and ER decrease with the plenum pressure which reverses the
tendency of secondary air flow rate. For the ATB system, the fluid thermosiphon effect
induces the majority of secondary air when the plenum pressure is low. Meanwhile, the
thermosiphon process is susceptible to the indoor conditions and the fluctuation of the
SHR is larger. The variations of the thermosiphon process in turn influence the sensible
and latent cooling capacity of the ATB. When the plenum pressure increases, the
entrainment effect becomes stronger and more secondary air is induced. However, the
entrainment process has a coupling effect on the thermosiphon process which hinders the
increment of secondary air and drives a drop in entrainment ratio.
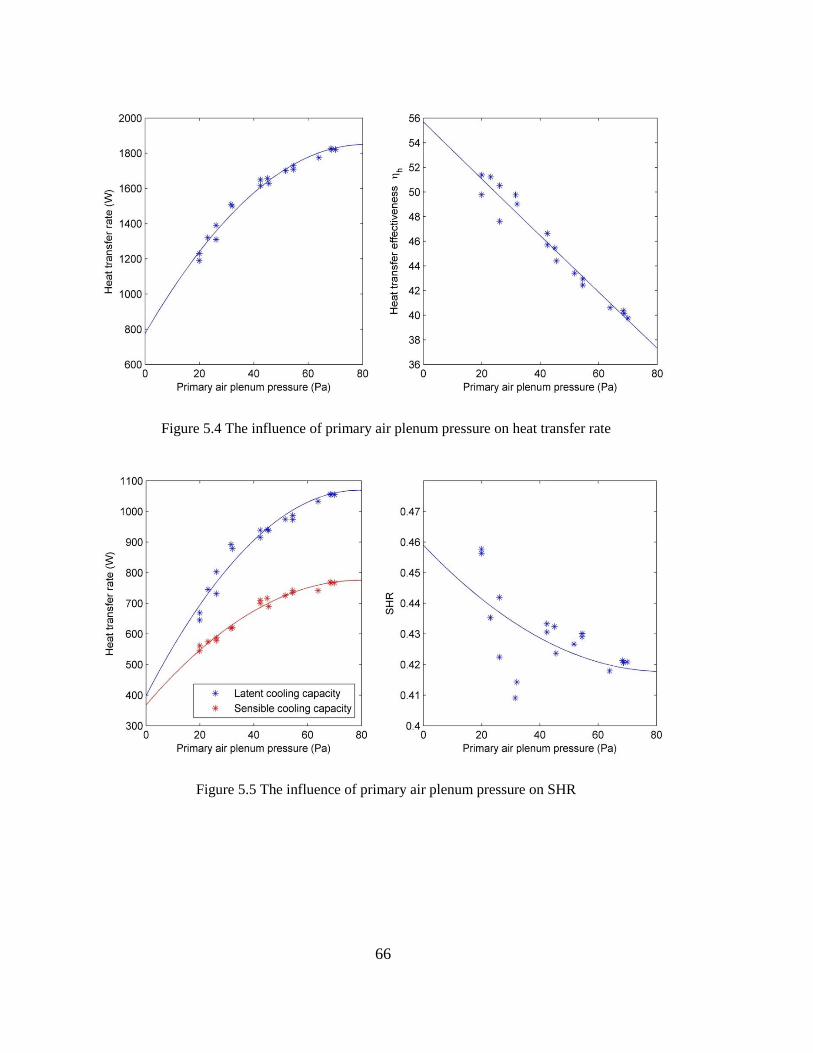
66
Figure 5.4 The influence of primary air plenum pressure on heat transfer rate
Figure 5.5 The influence of primary air plenum pressure on SHR
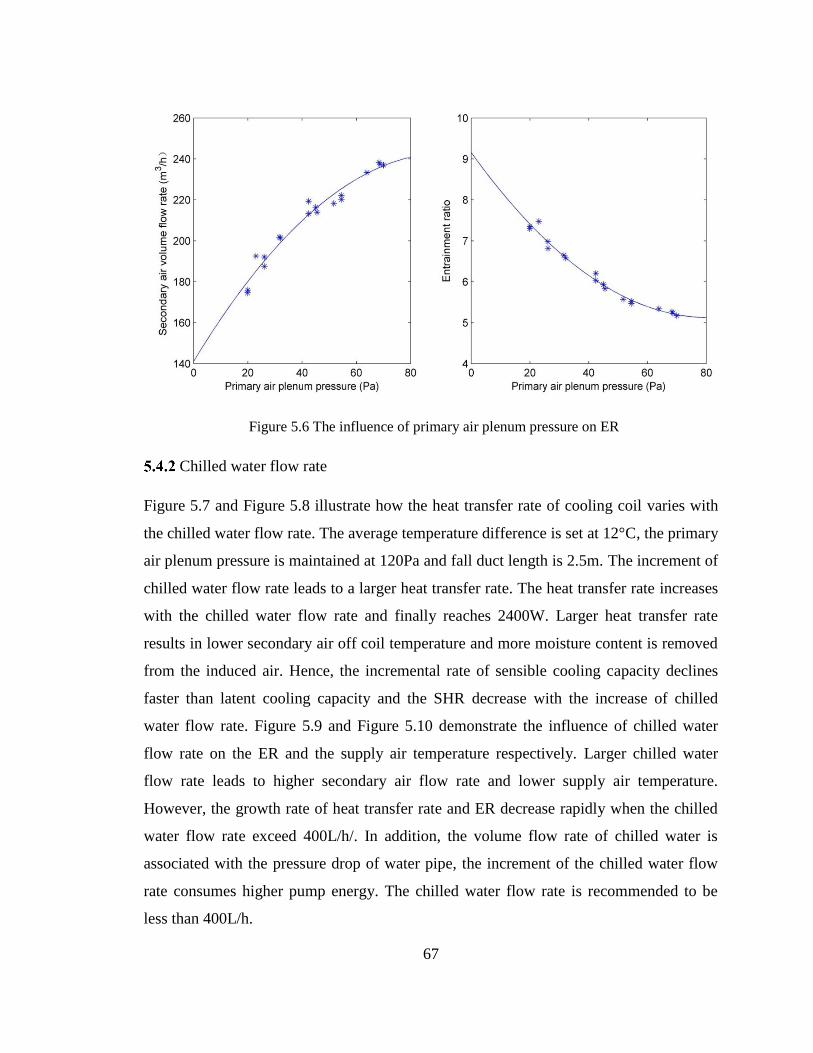
67
Figure 5.6 The influence of primary air plenum pressure on ER
Chilled water flow rate
Figure 5.7 and Figure 5.8 illustrate how the heat transfer rate of cooling coil varies with
the chilled water flow rate. The average temperature difference is set at 12°C, the primary
air plenum pressure is maintained at 120Pa and fall duct length is 2.5m. The increment of
chilled water flow rate leads to a larger heat transfer rate. The heat transfer rate increases
with the chilled water flow rate and finally reaches 2400W. Larger heat transfer rate
results in lower secondary air off coil temperature and more moisture content is removed
from the induced air. Hence, the incremental rate of sensible cooling capacity declines
faster than latent cooling capacity and the SHR decrease with the increase of chilled
water flow rate. Figure 5.9 and Figure 5.10 demonstrate the influence of chilled water
flow rate on the ER and the supply air temperature respectively. Larger chilled water
flow rate leads to higher secondary air flow rate and lower supply air temperature.
However, the growth rate of heat transfer rate and ER decrease rapidly when the chilled
water flow rate exceed 400L/h/. In addition, the volume flow rate of chilled water is
associated with the pressure drop of water pipe, the increment of the chilled water flow
rate consumes higher pump energy. The chilled water flow rate is recommended to be
less than 400L/h.

68
Figure 5.7 The influence of chilled water flow rate on heat transfer rate
Figure 5.8 The influence of chilled water flow rate on SHR

69
Figure 5.9 The influence of chilled water flow rate on ER
Figure 5.10 The influence of chilled water flow rate on supply air temperature
Average temperature difference
Figure 5.11 reveals the variations of heat transfer rate under different average
temperature differences. In the test, the primary air plenum pressure is constant at 120 Pa,
the chilled water flow rate is set at 400L/h and fall duct is modified to 2.5m. The fluid

70
thermosiphon effects mainly depend on the air buoyancy across temperature gradients.
As shown in Figure 5.13, the average temperature difference between chilled water and
displacement ventilation air can reinforce the ventilation process which in turn enhances
the cooling capacity. The experimental results indicate that the changes of heat exchange
rate and heat transfer effectiveness follows the variation of the average temperature
difference. As shown in Figures 5.12 and 5.14, the secondary air off coil temperature
drops with the increase of average temperature difference and stabilizes at 15°C.
Meanwhile, the latent cooling capacity of ATB increases and finally reaches 1300W.
Hence, there is a U-type curve of the SHR and the minimum value locates between 12 -
12.5°C. According to Figure 5.14, the supply air temperature drops below 15°C when the
average temperature difference exceeds 13°C. As the supply air temperature significantly
influences the indoor thermal comfort, the supply air temperature is recommended to be
higher than 15°C. Otherwise, the occupants may have the sensation of draught at floor
level.
Figure 5.11 The influence of average temperature difference on heat transfer rate
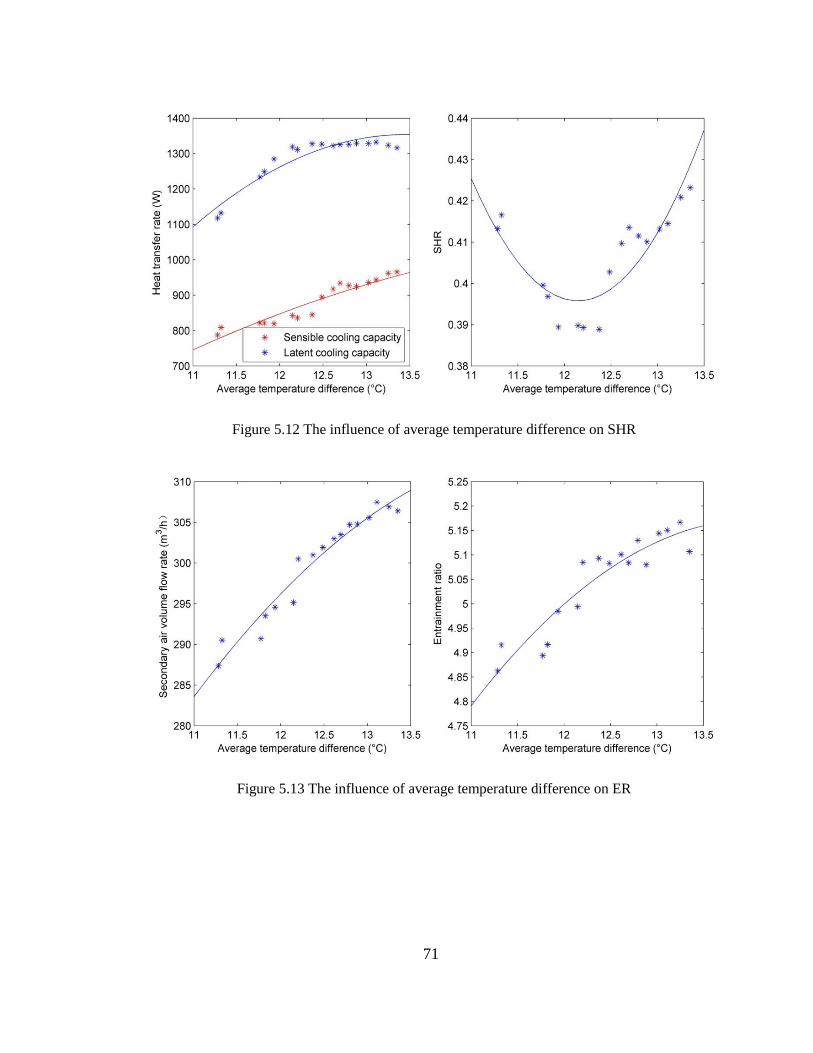
71
Figure 5.12 The influence of average temperature difference on SHR
Figure 5.13 The influence of average temperature difference on ER

72
Figure 5.14 The influence of average temperature difference on supply air temperature
Full duct length
Figure 5.15-Figure 5.17 demonstrate the influence of the fall duct on the ATB cooling
performance. To emphasize the influence of fall duct, the chilled water flow rate is set at
500L/h while the primary air plenum pressure is 120Pa and the average temperature
difference is 12.5°C. The ATB operates under the same condition except for the length of
air straightener and the corresponding data sets are recorded in one hour. The heat
transfer rate of the ATB with 2.5m fall duct is almost 450W larger on average than that
with 1.0m fall duct. In the ATB system, the off-coil air is cooled and quickly drops
through the fall duct. As illustrated in Figure 5.18, the fall duct can restrict the air mass to
descend to the floor level without spreading at half height. Hence, the air straightener can
promote the ventilation air flow rate which improves the heat transfer rate between the
chilled water and secondary air. However, higher ventilation rate leads to higher
secondary air off coil temperature and the SHR of the 2.5m fall duct is slightly higher
than that of the 1m fall duct as shown in Figure 5.17. In addition, the length of fall duct
determines the ceiling height and the cooling space. Based on the air flow pattern within
the ATB system, the warm air above the terminal unit will remain untreated which can
reduce the internal load and minimize energy consumption. Consequently, the

73
interactions between cooling capacity and energy efficiency need to be considered when
choosing the length of fall duct.
Figure 5.15 The influence of fall duct on heat transfer rate
Figure 5.16 The influence of fall duct on sensible and latent cooling capacity

74
Figure 5.17 The influence of fall duct on SHR
Figure 5.18 The influence of fall duct on ER
Performance comparison with ACB and PDV
The performance comparisons of ATB, ACB and PDV are analyzed to investigate the
system operation characteristics. The comparison tests of the ATB, ACB and PDV are
conducted under the same room conditions including the indoor temperature (24°C) and

75
indoor relative humidity (60%). For the ATB and PDV system, the chilled water flow
rate and chilled water inlet temperature are set at 360L/h and 8°C respectively. As
condensation is strictly avoided during the operation of ACB, the chilled water inlet
temperature of the system is set at 14°C and the flow rate is 360L/h. In addition, the
dimensions of the heat exchangers of the three terminal units are the same. During the
test, there is no obstacle that block the air circulation.
Table 5.3 Performance criteria of the terminal units
Terminal unit Cooling capacity (W) ER SHR h ATB 2150 3.66 0.42 27.3
ACB 1400 2.63 0.73 7.78
PDV 1520 NA 0.52 NA
As shown in Table 5.3, the ATB has distinct advantages in terms of cooling capacity and
heat transfer effectiveness. In addition, the ATB and PDV have better dehumidification
ability as the most of indoor moisture content is removed by condensation process on the
surface of the cooling coil. For the ACB system, the entire latent load is handled by the
primary air which impairs the energy efficiency as excess fresh air is pretreated and
supplied to the occupied zone. In addition, the number of ATB terminal units is the
lowest under same heat load requirement which significantly reduces the initial cost.
Summary
In this work, a primary study of ATB was conducted under various operation conditions
to investigate the influences of relevant parameters on the performance of the terminal
unit. On the basis of experimental findings, the conclusions are summarized below:
The plenum pressure is associated with the flow rate of secondary air and heat
transfer rate of the cooling coil. Higher primary air plenum pressure gives higher
cooling capacity and lower entrainment ratio. In the real application, the plenum
pressure can be modulated based on indoor heat load and the number of occupants.
76
The ATB heat transfer rate increases with chilled water volume flow rate.
However, larger chilled water flow rate leads to slower growth rate of heat
transfer rate and higher energy consumption. The chilled water flow rate is
recommended to be less than 400L/h.
The temperature difference between the chilled water and the secondary air can
improve the displacement ventilation and the heat transfer efficiency. Meanwhile,
large average temperature difference may lead to the sensation of draught. The
results from the experiments indicate that the average temperature difference
should be maintained around 12°C to provide considerable heat transfer capacity
and thermal comfort
The fall duct enhances the displacement ventilation by forming the temperature
gradients and straightening the air mass towards the floor level. It is reasonable to
set the fall duct length around 3m to balance the heat transfer rate and cooling
space.
The ATB can handle both sensible load and latent load. In the experiments, the
sensible heat ratio (SHR) can reach below 50% which proved that the ATB is
adequate to meet extreme load conditions (the test is conducted in the tropical
region and the Eugenia Room is occupied in general).
Based on the experimental results and the theoretical analysis, the ATB can provide
sufficient sensible and latent cooling capacity with high energy efficiency. The
experimental evaluation provides a guideline for the applications of ATB systems. The
performance and energy efficiency of the ATB system can be further improved by
adjusting system design and optimizing the operation parameters. Consequently, the
active thermosiphon beam has the potential to become the standard equipment for ACMV
systems in modern buildings with complex layout and multiple functions. As the
proposed ATB is still in the preliminary stage, there is more research work can to be done.
For example, the air flow patterns in the occupied zone can be investigated and the model
of ATB terminal unit can be developed for real-time control and optimization.
77
Model-based optimization for ATB system
Introduction
The performance of ATB is evaluated in the last chapter which shows that the terminal
unit can provide adequate cooling capacity and satisfied thermal comfort. Moreover, the
performance and energy efficiency of the ATB system can be further improved by
optimizing system design and operation parameters. It is of great essence to develop a
model-based optimization strategy for the ATB system to maintain the indoor air quality
and reduce the energy consumption.
In order to precisely predict the system performance and formulate the optimization
strategy, it is necessary to review some existing research works on the optimization of
ACMV system. Henrique et al. [106] proposed an optimization scheme to search for the
optimal setting points of the ACMV system. Three models were developed to simulate
the indoor thermal comfort and energy usage of the ACMV system while GA was used to
maximize the occupant's comfort level and minimize the electricity usage. Congradac et
al. [107] used GA to optimize the indoor CO2 concentration control with regard to power
saving. The GA was proved to be a robust and efficient stochastic optimization method to
search the optimal setting points among the appropriate scope of solutions. Huang et al.
[108] proposed an adaptive learning algorithm based on GA for the automatic tuning of
the PID controller in the ACMV system to achieve optimal performance. The simulation
results showed that the GA was valid for tuning of PID parameters, yielding minimum
overshoot and setting time. Seo et al. [109] adopted multi-island GA to optimize the
design and minimize the energy conservation of the ACMV system. The experimental
results revealed that the optimization method was capable of reducing the primary energy
demand in the apartment house. Ge et al. [68] proposed a model-based control strategy
for a liquid desiccant-chilled ceiling system with the objective of optimizing the indoor
thermal comfort and reducing the power consumption. The GA could resolve the multi-
objective optimization problem in terms of maintaining the indoor environment and
minimizing the energy consumption. The GA is widely used as an approach to

78
complicated problem and global optimization for air conditioning and mechanical
ventilation system.
This chapter is structured as follows: the model development of each component in the
ATB system is proposed in Section 6.2; the global optimization formulation and
optimization strategy of ATB system are presented in Section 6.3; the model validation
results are illustrated in Section 6.4; in Section 6.5 the optimization results are illustrated;
Section 6.6 draws the summary.
Model development of ATB system
Predicting the system performance and energy consumption with high accuracy is the
basic of real-time optimization procedures. The mathematics and physical models can
accurately forecast the air conditioning system cooling and ventilation performance, but
the additional complexities of the models outweigh the advantage. Therefore, the models
of each component in the ATB system are developed under hybrid manners which can
attain higher model accuracy while reducing the model complexity. In addition, the
energy consumption models of the chiller, fans and water pumps are deduced based on
conservation equations of energy and mass. The hybrid models are expressed as follows.
Chiller energy model
The chiller plant is a complicated system which mainly consists of compressor,
evaporator and condenser. The energy consumption of chiller plant is associated with the
rotation speed of compressor, the heat transfer rate between evaporator and condenser,
the flow rate of the refrigerant and etc. [110]. From Chang’s study, the energy
consumption of the chiller plant could be described by part load ratio which is defined as
the ratio of current cooling capacity and the rated refrigerating capacity of the chiller
[111]. Then, the part ratio of chiller plant can be calculated as follows:

79
.
.
ch curch
ch rated
QPLR
Q (6.1)
where chPLR is the part ratio of the chiller plant, .ch curQ is the current cooling capacity of
the chiller and .ch ratedQ is the rated cooling capacity of the chiller.
The cooling requirements from the air handling unit and the indoor air terminal units
determine the current load of the chiller plant. Therefore, the real time cooling load is
calculated based on the water side information:
, . .( )ch cur chw chw chw in chw outQ C m T T (6.2)
where chwC is the specific heat of water, chwm is the chilled water mass flow rate, .chw inT
is the chilled water inlet temperature and .chw outT is the chilled water outlet temperature.
In the steady state operating conditions, the power consumption of chiller can be
expressed as:
3 2
,3 ,2 ,1 ,0ch ch ch ch ch ch ch chE a PLR a PLR a PLR a (6.3)
where cE is the chiller power consumption, ,0cha , ,1cha , ,2cha and ,3cha are unknown
constant coefficients.
Fan and water pump energy model
A booster fan is utilized to maintain the air flow to the ATB. The real time energy
consumption of fan can be calculated as a cubic function of the ratio of the fluid volume
flow rate to the rated volume flow rate [112].
.
af
a rated
mPLR
m (6.4)
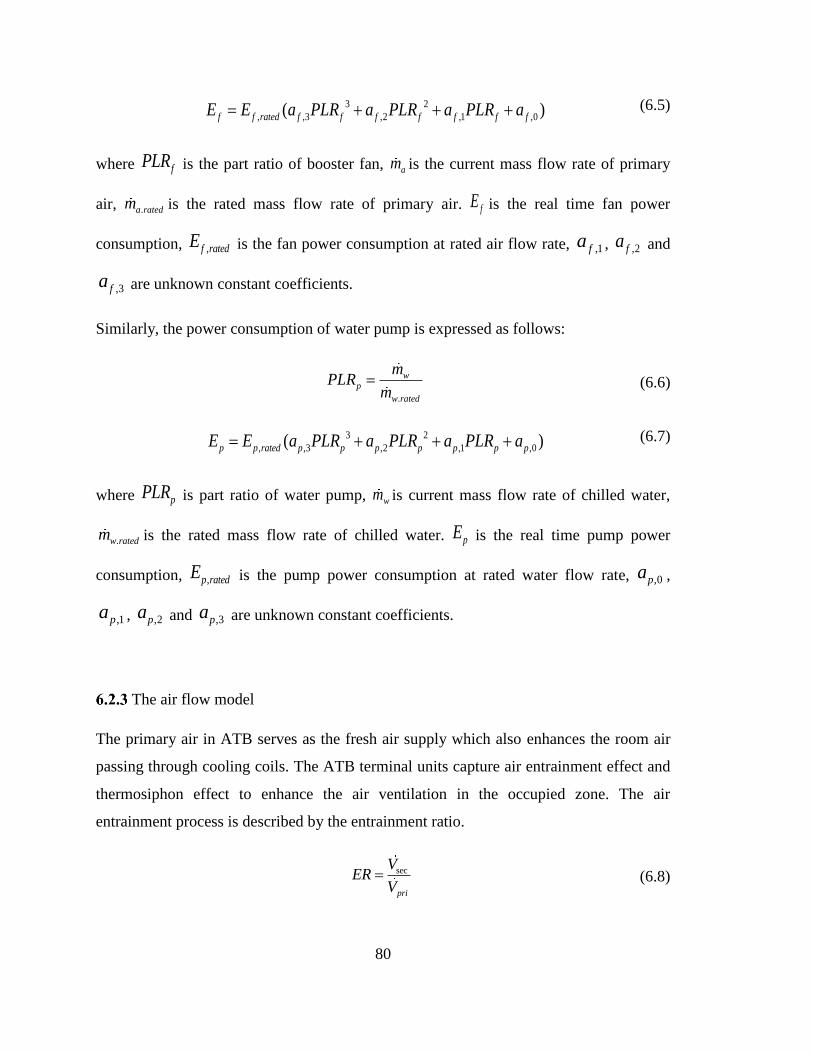
80
3 2
, ,3 ,2 ,1 ,0( )f f rated f f f f f f fE E a PLR a PLR a PLR a (6.5)
where fPLR is the part ratio of booster fan, am is the current mass flow rate of primary
air, .a ratedm is the rated mass flow rate of primary air. fE is the real time fan power
consumption, ,f ratedE is the fan power consumption at rated air flow rate, ,1fa , ,2fa and
,3fa are unknown constant coefficients.
Similarly, the power consumption of water pump is expressed as follows:
.
wp
w rated
mPLR
m (6.6)
3 2
, ,3 ,2 ,1 ,0( )p p rated p p p p p p pE E a PLR a PLR a PLR a (6.7)
where pPLR is part ratio of water pump, wm is current mass flow rate of chilled water,
.w ratedm is the rated mass flow rate of chilled water. pE is the real time pump power
consumption, ,p ratedE is the pump power consumption at rated water flow rate, ,0pa ,
,1pa , ,2pa and ,3pa are unknown constant coefficients.
The air flow model
The primary air in ATB serves as the fresh air supply which also enhances the room air
passing through cooling coils. The ATB terminal units capture air entrainment effect and
thermosiphon effect to enhance the air ventilation in the occupied zone. The air
entrainment process is described by the entrainment ratio.
sec
pri
VER
V (6.8)

81
where secV is the secondary air flow rate and priV is the primary air flow rate.
Adopt empirical relationship, the parameters including configuration of the terminal unit,
size of the full duct, resistance of air flow and etc. are lumped into the constant of
proportionality. The primary air plenum pressure, room temperature and average
temperature difference are the manipulated parameters. The flow rates of primary air
flow rate and secondary air can be described as follows:
prib
pri priV a P (6.9)
1
sec 3
2sec sec sec ( )
nb nchw
n
z
m TV a P k
P T
(6.10)
where P is the primary air plenum pressure, seca , secb , seck , 1n , 2n and 3n are unknown
constant coefficients, T is the average temperature difference, zT is the room
temperature.
In the tests, the chilled water inlet temperature and room temperature are maintained at
the set points. Hence the secondary air flow rate can be simplified as:
1
sec
2sec sec sec
nb chw
n
mV a P k
P (6.11)
The cooling coil model
The cooling coil of the ATB is operating under wet condition, thus both sensible load and
latent load can be eliminated by the terminal unit. Given the air side and water side
measurements, the cooling coil model can predict the heat transfer rate and the secondary
air off coil temperature under various working conditions. The hybrid model of cooling
coil is given as follows:

82
1
sec. .
2
sec
( )
1 ( )
e
chwin chw in
echw
b mQ T T
mb
m
(6.12)
where 1b , 2b and e are unknown constant coefficients, secm is the secondary air mass
flow rate, sec.inT is the secondary air inlet temperature, .chw inT is the chilled water inlet
temperature.
Based on the conservation of energy, the heat incremental of secondary air is equal to
heat transfer rate in the cooling coil as the heat specific of the cooling coil is neglected.
Then we obtained:
. .( )chw chw chw out chw inQ C m T T (6.13)
sec sec. sec.( )out inQ m H H (6.14)
where sec.outH is secondary air off coil enthalpy and sec.inH is the secondary air on coil
enthalpy.
With reference to ASHRAE data [113], the saturation air enthalpy can be expressed as
the cubic function of air temperature within the range of 0°C to 50°C.
2 39.3839 1.71137 0.0222 0.00063a a a ah T T T (6.15)
where ah is the saturation air enthalpy and aT is the saturation air temperature.
Based on Eq. (6.11) the secondary air off coil temperature can be calculated. The sensible
cooling capacity is expressed as follows:
sec sec. sec.( )sen a in outQ m c T T (6.16)
where senQ is the sensible cooling capacity, ac is the specific heat of air, sec.inT is the
secondary air on coil temperature, sec.outT is the secondary air off coil temperature.

83
The indoor built model
As analyzed in Chapter 5, the sensible heat ratio of ATB approximates 0.45. Therefore,
the flow rate of primary air is regulated to maintain the indoor CO2 level while leaving
the indoor moisture content reach the steady state. In the occupied room, the room
temperature and CO2 level can be expressed with respect to the heat balance and mass
balance equations:
.( )r
a a a a r pri sen l sen
dTM C m c T T Q Q
dt (6.17)
( )r
a a r pri l
dwM m w w D
dt
(6.18)
where aM is he indoor air mass, t is time, priT is the primary air temperature, .l senQ is
the sensible load, rw is the indoor carbon dioxide content, priw is the primary air carbon
dioxide content, lD is the CO2 production rate.
Experimental setup and model validation
Experimental setup
The configuration of the ATB system is illustrated in Figure 6.1. The pilot plant consists
of an air-cool chiller, an air handling unit, a water pump, a booster fan and 2 ATB
terminal units. As analyzed in Chapter 5, the SHR of the ATB system can reach 50%
which indicates that the terminal units have efficient dehumidification ability. Hence, the
room temperature and CO2 concentration are regulated according to the pre-set value
while the moisture content is left to reach the steady value. The room temperature is
controlled by modulating the chilled water volume flow rate while the CO2 level is
modulated through adjusting the primary air volume flow rate.
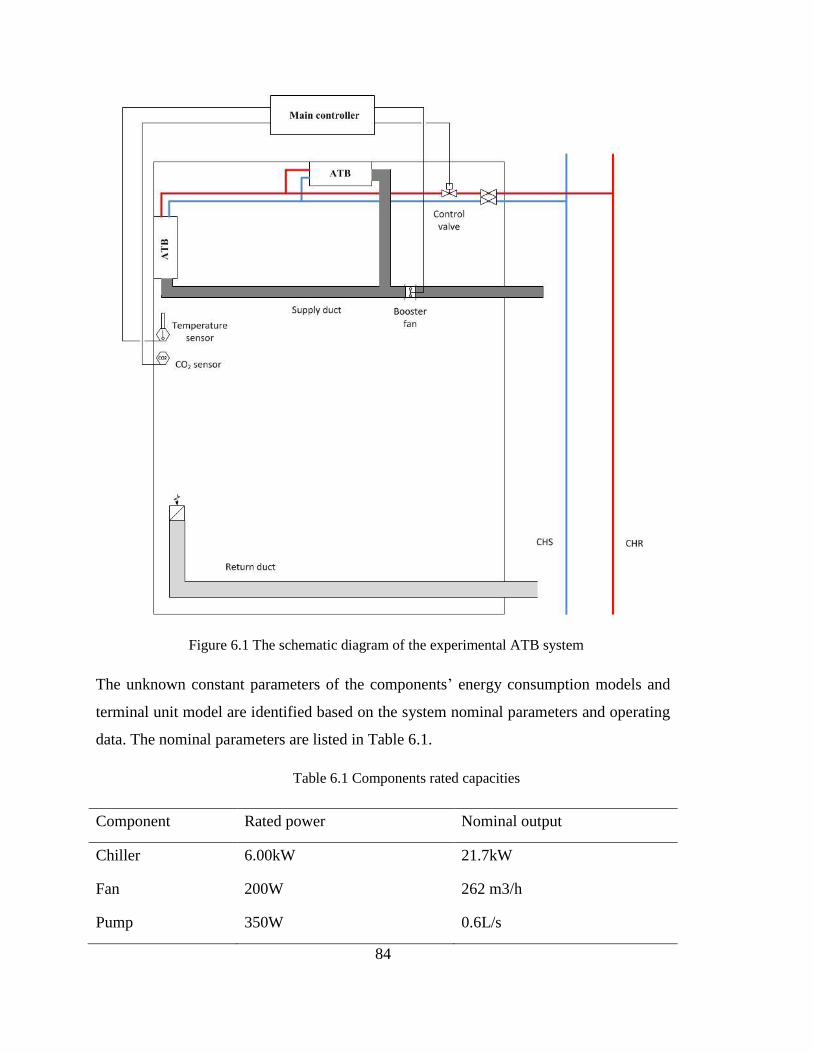
84
Figure 6.1 The schematic diagram of the experimental ATB system
The unknown constant parameters of the components’ energy consumption models and
terminal unit model are identified based on the system nominal parameters and operating
data. The nominal parameters are listed in Table 6.1.
Table 6.1 Components rated capacities
Component Rated power Nominal output
Chiller 6.00kW 21.7kW
Fan 200W 262 m3/h
Pump 350W 0.6L/s

85
Model validation
The effectiveness of the energy consumption models and ATB models are evaluated
through relative error and root mean square of relative error. To comprehensively
validate the accuracy of the proposed model, the testing data of each conponents of the
ATB system is recorded over a wide operating range. The predicted energy consumptions
of each component are compared with the measured values respectively as illstrated from
Figure 6.2 to Figure 6.4. From the comparsion results, the proposed models of energy
consumptions are well corresponding to the measured values with the margin of RE less
than 5%.
Figure 6.2 Model validation of fan energy consumption

86
Figure 6.3 Model validation of pump energy consumption
Figure 6.4 Model validation of chiller energy consumption
To estimate the effectiveness of the proposed models, the air loop and water loop
parameters are adjusted within a large scale. Totally 60 data sets are collected in respect
to secondary air volume flow rate, primary air volume flow rate, room temperature,
chilled water inlet/outlet temperature and chilled water flow rate. The model validation

87
results are illustrated from Figure 6.5 to Figure 6.7. The validation results of the energy
models and ATB models are summarized in Table 6.2.
Figure 6.5 Model validation of the primary air flow rate
Figure 6.6 Model validation of the secondary air flow rate

88
Figure 6.7 Model validation of the cooling capacity
Table 6.2 Prediction accuracy of the models
Model RE RMSE
Fan energy consumption 2.12% 2.64%
Pump energy consumption 1.37% 1.69%
Chiller energy consumption 1.81% 2.11%
Primary air model 1.93% 2.68%
Secondary air model 3.04% 3.36%
Cooling coil model 2.46% 2.87%
Based on the curve fitting and model validation results, the energy consumption models
and ATB terminal unit models have good consistency with experimental results. The
proposed models are precise and sufficient for control and optimization applications.
89
Global optimization formulation
The global optimization strategy is formulated to find the optimal set points of the ATB
system. The total energy consumption of the system is minimized while the indoor
environment quality is maintained based on the proposed strategy. The following
assumptions are adopted to simplify mathematical calculation of optimization:
The primary air and secondary are homogeneously mixed in the terminal unit.
The chilled water temperature field distributes evenly in the heat exchanger.
The heat storage in the cooling coil tube is neglected.
The joints of the cooling coil and sensor are adiabatic.
The air mass in the room is constant.
The primary air supply is constant during the test,
The chilled water inlet temperature is constant during the optimization process.
Then the optimization strategy is developed in terms of energy consumption and the
system constraints.
Objective function
By analyzing the energy models in Eqs. (6.3), (6.5) and (6.7), the energy consumption of
the ATB system is composed of three parts: chiller, pump and fan. The objective function
is to minimize the total energy consumption as shown below:
total f ch pE E E E (6.19)
where totalE is the total energy consumption of the ATB system.

90
Constrains
In the practical ATB systems, certain constrains must be satisfied to meet the air
conditioning and ventilation requirements. The constraints concentrate on the operation
range of different components and the coupling of the system parameters.
Chiller cooling capacity
The chiller plant regulates the cooling capacity through a frequency converter. The
operation frequency of the chiller has a lower bound to prevent overheat of the motor.
Hence, the constraints of the chiller plant are set as below:
.min .maxch ch chQ Q Q (6.20)
where .minchQ is the lower bound of chiller cooling capacity and .maxchQ is the upper
bound of chiller cooling capacity.
The primary air flow rate
The primary air flow rate is adjusted to satisfy the ventilation requirement and maintain
positive pressure in the room [114]. Meanwhile, the primary air flow rate is restricted by
the physical limitation of the fan.
.min .maxpri pri prim m m (6.21)
where .minprim is the lower bound of the primary air mass flow rate and .maxprim is the
upper bound of the primary air mass flow rate.
Chilled water flow rate
The chilled water flow rate is limited by the operation frequency of the motor:
.min .maxchw chw chwm m m (6.22)
where .minchwm and .maxchwm are the limits of the chilled water mass flow rate.
91
Meanwhile, there are interactives between the system parameters which should be
disposed in the optimization procedures. To maintain the indoor thermal comfort, the
room temperature and CO2 level are regulated to satisfy the requirements.
r reqT T (6.23)
r reqw w (6.24)
where reqT is the room temperature set point and reqw is the indoor carbon dioxide
content requirement.
Moreover, the indoor sensible load and carbon dioxide load can be expressed as
sec sec.( ) ( )req a req out pri a req priQ m C T T m C T T (6.25)
( )req pri req priD m w w (6.26)
where reqQ is the indoor sensible load and reqD is the indoor carbon dioxide load.
Consequently, the optimization formulation of the ATB system can be summarized as
follow:
.min .max
.min .max
.min
min
:
total f ch p
r req
r req
ch ch ch
pri pri pri
chw chw
E E E E
subject to T T
w w
Q Q Q
m m m
m m
.maxchwm
(6.27)
To reduce the dimension of optimization variables and simplify the computation
complexity, the variables are classified into three categories:
Uncontrollable variables ( priT , priw , .chw inT , reqT , reqw , reqQ , reqD ,): the primary
air supply temperature and chilled water inlet temperature ( priT and .chw inT ) are
determined by the building management system. The primary air CO2 content
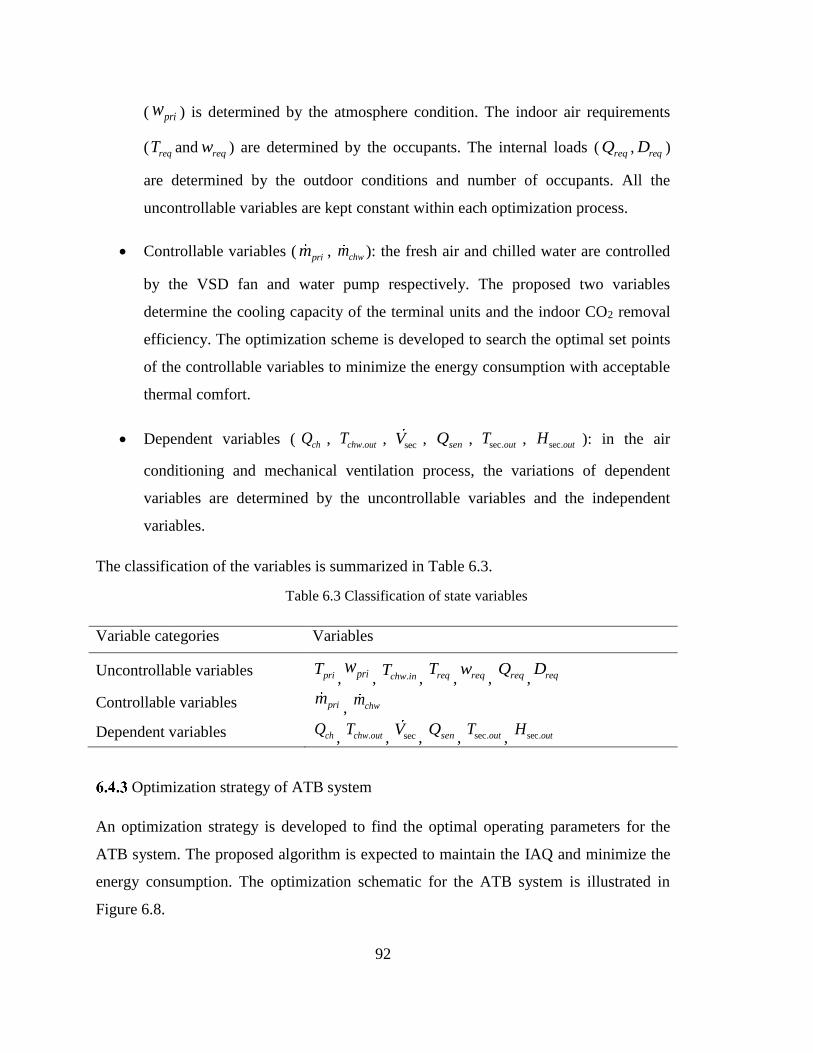
92
( priw ) is determined by the atmosphere condition. The indoor air requirements
( reqT and reqw ) are determined by the occupants. The internal loads ( reqQ , reqD )
are determined by the outdoor conditions and number of occupants. All the
uncontrollable variables are kept constant within each optimization process.
Controllable variables ( prim , chwm ): the fresh air and chilled water are controlled
by the VSD fan and water pump respectively. The proposed two variables
determine the cooling capacity of the terminal units and the indoor CO2 removal
efficiency. The optimization scheme is developed to search the optimal set points
of the controllable variables to minimize the energy consumption with acceptable
thermal comfort.
Dependent variables ( chQ , .chw outT , secV , senQ , sec.outT , sec.outH ): in the air
conditioning and mechanical ventilation process, the variations of dependent
variables are determined by the uncontrollable variables and the independent
variables.
The classification of the variables is summarized in Table 6.3.
Table 6.3 Classification of state variables
Variable categories Variables
Uncontrollable variables priT, priw
, .chw inT, reqT
, reqw, reqQ
, reqD
Controllable variables prim, chwm
Dependent variables chQ, .chw outT
, secV, senQ
, sec.outT, sec.outH
Optimization strategy of ATB system
An optimization strategy is developed to find the optimal operating parameters for the
ATB system. The proposed algorithm is expected to maintain the IAQ and minimize the
energy consumption. The optimization schematic for the ATB system is illustrated in
Figure 6.8.
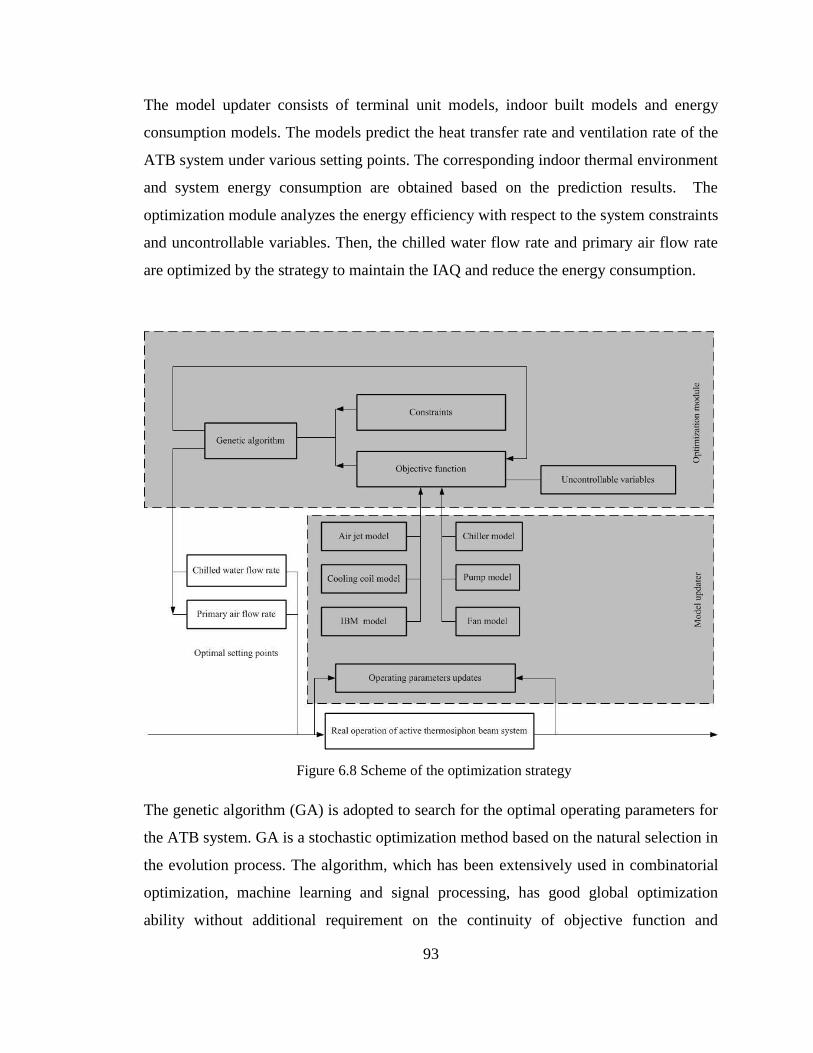
93
The model updater consists of terminal unit models, indoor built models and energy
consumption models. The models predict the heat transfer rate and ventilation rate of the
ATB system under various setting points. The corresponding indoor thermal environment
and system energy consumption are obtained based on the prediction results. The
optimization module analyzes the energy efficiency with respect to the system constraints
and uncontrollable variables. Then, the chilled water flow rate and primary air flow rate
are optimized by the strategy to maintain the IAQ and reduce the energy consumption.
Figure 6.8 Scheme of the optimization strategy
The genetic algorithm (GA) is adopted to search for the optimal operating parameters for
the ATB system. GA is a stochastic optimization method based on the natural selection in
the evolution process. The algorithm, which has been extensively used in combinatorial
optimization, machine learning and signal processing, has good global optimization
ability without additional requirement on the continuity of objective function and

94
derivation calculation. The process of GA starts with a potential population (candidate
solutions). The offspring is generated through selection, crossover, and mutation while
the fittest individuals will be chosen on the biases of elimination of inferior. After
multiple genetic iterations, the most adaptive population is selected as the optimal
solution of optimization problems. The optimization processes for the ATB system is
illustrated in Figure 6.9.

95
Figure 6.9 Flow chart of the optimization strategy
96
Step 1: Identify the parameters of the ATB terminal unit model and the energy
consumption models and determine the uncontrollable and controllable variables based
on the outdoor condition and IAQ requirement.
Step 2: Evaluate the operational limits of the components in the ACMV system and
analyze the interactions between the parameters. Load the constraints to the optimization
module.
Step 3: Initialize the parameters for genetic algorithm and set the initial population. Then
the initial population will be coded into binary strings for optimization.
Step 4: Calculate the fitness value of each individual in the initialized population based
on the objective function with respect to the energy consumption.
Step 5: Generate the offspring by performing selection, crossover and mutation for the
chromosome. Selection is to choose the individuals with the higher fitness values through
the method of roulette wheel as the next generation. Crossover is to exchange parts of the
binary strings in the chromosomes to generate new individuals. Mutation is to randomly
select individuals to mutate a digit of certain chromosomes.
Step 6: Repeat the iteration steps 4-5 until the maximum generation is achieved or the
fluctuation of fitness value is within the termination criterion. The maximum fitness
value is recorded. Then the chromosomes with maximum fitness value are decoded and
the optimal setting points are identified.
Optimization results
To verify the energy-saving performance of the optimization scheme, experiments are
demonstrated to compare the energy consumption of the ATB system under the original
control logic and the optimized strategy. The test is conducted throughout a whole day
from 8:30 am to 19:30 pm while the number of occupants and the indoor cooling load are
recorded as shown in Figure 6.10. According to the ASHRAE standard, the setting points
of temperature and CO2 concentration are 24.5℃ and 800ppm respectively. In addition,
the upper and lower bound of the components in the ATB system are listed in Table 6.4.

97
Figure 6.10 The indoor heat condition and number of occupants
Table 6.4 The upper and lower bound of constraints
Constraints Lower bound Upper bound Unit
priV 37.8 262 m3/h
chwm 0.1 0.6 L/s
chE 2 6 kW
The primary air flow rate and chilled water flow rate of the ATB system are optimized by
the GA for each instance (1 hour) to maintain the indoor air quality and reduce the total
energy consumption. The main parameters of the generic algorithm are summarized in
Table 6.5.
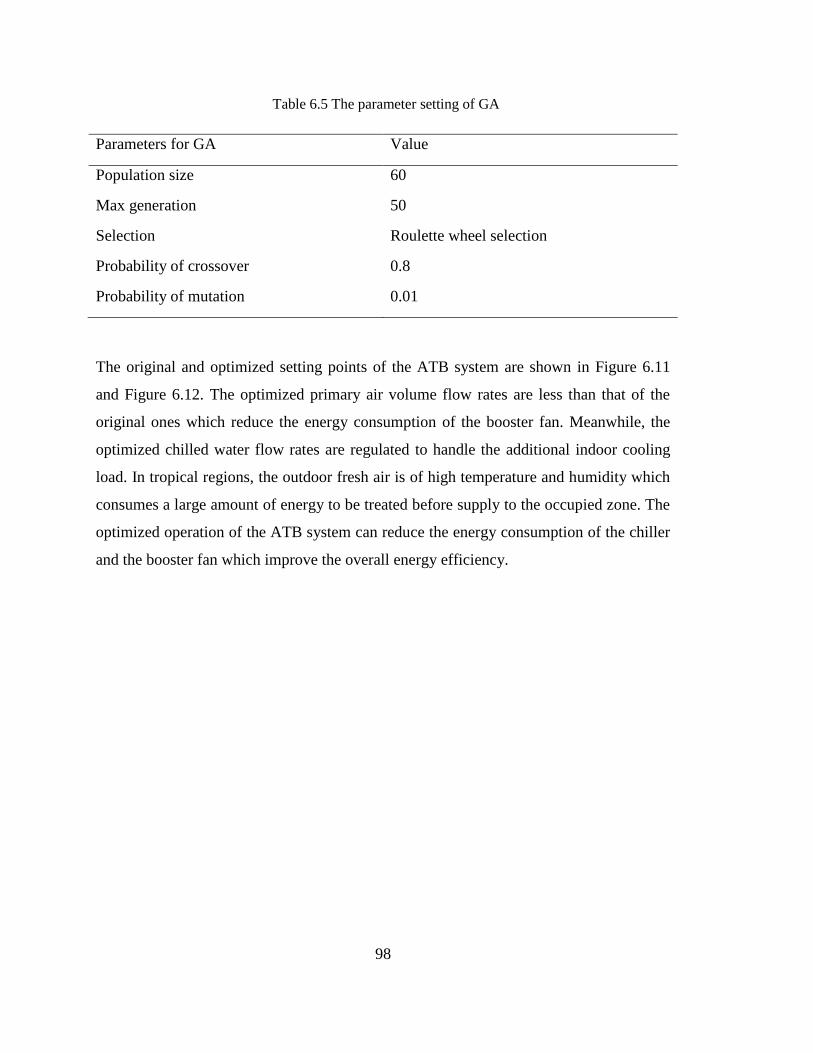
98
Table 6.5 The parameter setting of GA
Parameters for GA Value
Population size 60
Max generation 50
Selection Roulette wheel selection
Probability of crossover 0.8
Probability of mutation 0.01
The original and optimized setting points of the ATB system are shown in Figure 6.11
and Figure 6.12. The optimized primary air volume flow rates are less than that of the
original ones which reduce the energy consumption of the booster fan. Meanwhile, the
optimized chilled water flow rates are regulated to handle the additional indoor cooling
load. In tropical regions, the outdoor fresh air is of high temperature and humidity which
consumes a large amount of energy to be treated before supply to the occupied zone. The
optimized operation of the ATB system can reduce the energy consumption of the chiller
and the booster fan which improve the overall energy efficiency.
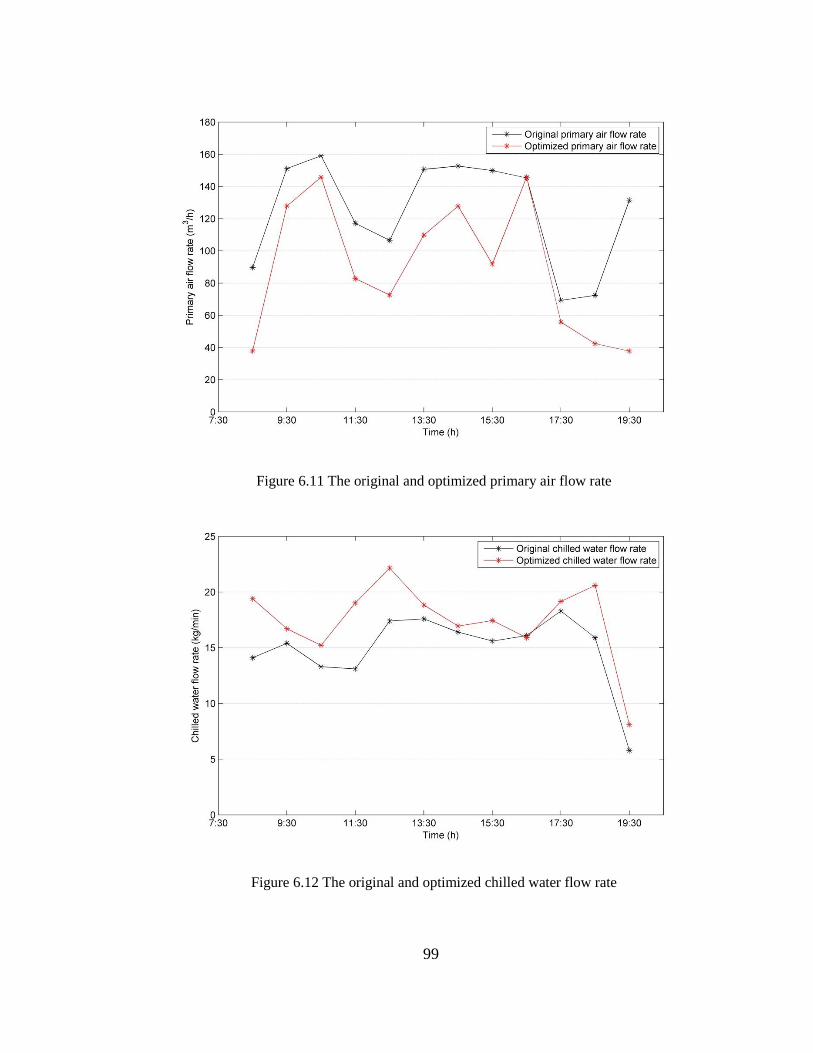
99
Figure 6.11 The original and optimized primary air flow rate
Figure 6.12 The original and optimized chilled water flow rate
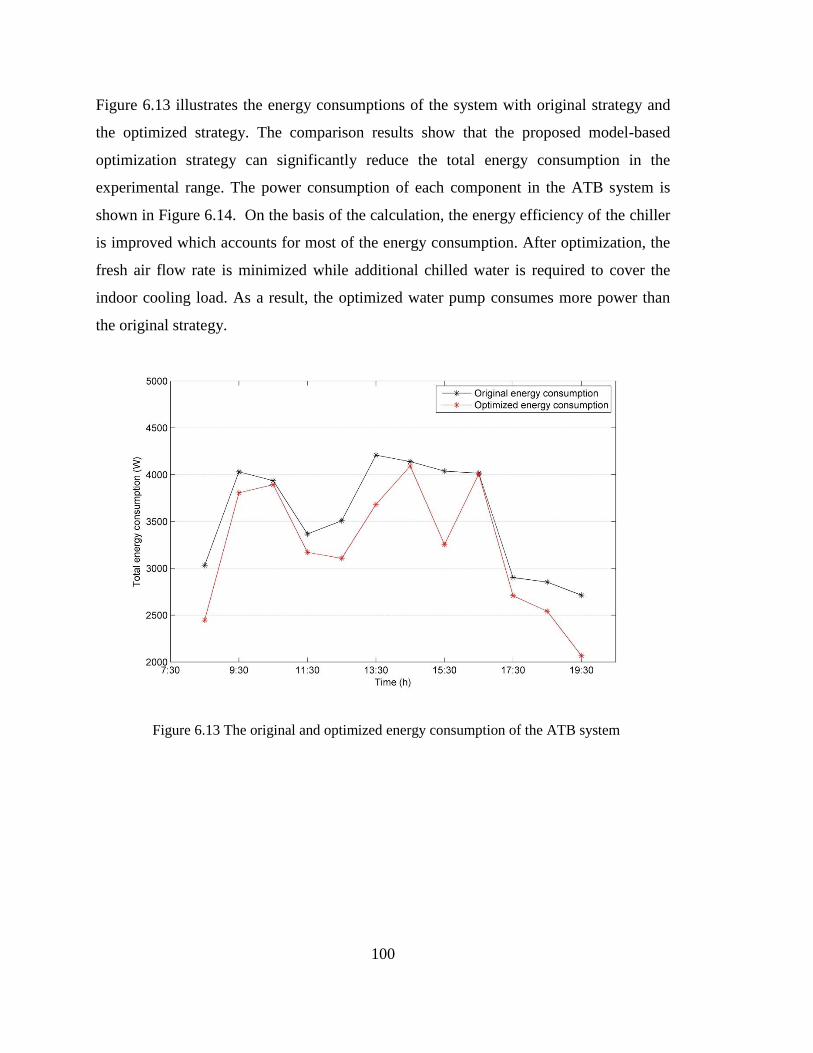
100
Figure 6.13 illustrates the energy consumptions of the system with original strategy and
the optimized strategy. The comparison results show that the proposed model-based
optimization strategy can significantly reduce the total energy consumption in the
experimental range. The power consumption of each component in the ATB system is
shown in Figure 6.14. On the basis of the calculation, the energy efficiency of the chiller
is improved which accounts for most of the energy consumption. After optimization, the
fresh air flow rate is minimized while additional chilled water is required to cover the
indoor cooling load. As a result, the optimized water pump consumes more power than
the original strategy.
Figure 6.13 The original and optimized energy consumption of the ATB system

101
Figure 6.14 Comparison of fan, pump, chiller and total energy consumption
The comparison results of energy consumption within the test period are summarized in
Table 6.6. The proposed optimization strategy provides a total energy saving of 9.3%
which proves that the strategy is sufficient for real time optimization applications.
Table 6.6 Summary of the energy consumption between both operation strategies
Components Energy consumption (kWh)
Energy saving (%) Original strategy Genetic algorithm
Fan 1.73 1.41 18.5
Pump 1.32 1.56 -18.2
Chiller 39.69 35.80 9.8
Total 42.74 38.77 9.3

102
Summary
In this chapter, a model-based optimization approach is proposed to optimize the
performance of the ATB system. The energy consumption models of each component
and thermal models of terminal unit are developed with hybrid manner. Based on the
experimental validation, the proposed models show good agreement with the
measurement results. The global optimization strategy is formulated to find the optimal
set points of the ATB system with respect to the total energy consumption. The
experimental results indicate that the optimized operating parameters obtained by the GA
can significantly reduce the total energy consumption by 9.3% and maintain indoor
thermal comfort when compared with the original strategy. Moreover, the simulation and
experimental results show that the ATB system can provide satisfied indoor thermal
comfort with high energy efficiency and reduced initial cost.

103
Conclusions and future work
Conclusions
If the active air terminal units are properly designed and operated, the ACMV system can
have significant improvements on the indoor environment quality and energy
consumption. Hence, it is desired to optimize the mechanical design of the active air
terminals and investigate the system operation characteristics to fulfill the energy
conservation potential. The main contributions of the thesis are as follows.
Considering the influence of air buoyancy, a simple yet accurate ACB model was
developed by adopting hybrid manner. For the air side, the influences of the primary air
and the chilled water on the entrainment effect had been investigated. Meanwhile, by
analyzing first principles and experimental results, the cooling coil model was derived
which contained only three lumped parameters. The proposed model could accurately
predict the air side volume flow rate and water side heat transfer rate in a wide operating
range. In the model validation, the final accuracy was within ±5%. It was found that the
air buoyancy impeded the air entrainment process and reduced the secondary air flow rate
up to 10% in the cooling mode.
Based on the performance analysis of the ACB, the ATB was developed with an
innovative mechanical design. Combined with basic theoretical analysis, the
experimental comparisons of ATB and ACB were conducted under various operation
conditions to estimate the terminal unit thermodynamic and hydrodynamic performances.
The main operation parameters that influence the ATB heat transfer rate were tested
separately to determine the optimal operation settings. In the air side, increasing the
primary air plenum pressure and extending the length of air straighter could effectively
improve the heat transfer rate. As higher plenum pressure would reduce the entrainment
ratio and lead to extra booster fan energy consumption, the pressure was recommended to
be less than 120Pa to balance the cooling capacity and the heat transfer efficiency. In the
water loop, the chilled water supply could enhance the heat transfer rate, but
simultaneously it might lead to overcooled supply air. The average temperature
difference between chilled water and occupied zone should be higher than 13℃ to avoid

104
the sensation of draught. The performance of ATB could be substantially improved with
appropriate system settings.
Based on the ACB and ATB tests, the main components of the ACMV system were
modeled to predict the system ventilation rate, cooling capacity and energy consumption.
Accordingly, a model-based optimization approach was developed to minimize the
system energy consumption and maintain the indoor thermal comfort. Genetic algorithm
was used to search for the optimal set points of the chilled water flow rate and the fresh
air flow rate. The simulation results showed that the optimization strategy could provide
the desired indoor temperature and CO2 concentration and achieve significant energy
saving.
Future work
Based on the conclusions, the proposed active air terminal units have outstanding
performance in terms of indoor environment quality, energy efficiency and cost saving.
In addition, the model-based control strategy is sufficient to minimize the system energy
consumption and maintain the desired indoor environment quality. Despite all the
achievements in the thesis, there still remains a lot of foreseeable works to fulfill the
development of active air terminal based system.
The researches on ACB system indoor air flow patterns, operation characteristics
and modeling methods are confined to the system cooling mode. And the air
buoyancy is proved to hinder the inducing of secondary air. In the heating mode,
the secondary air is of higher temperature and the air buoyancy acts vertically
which significantly change the indoor air flow patterns and temperature gradients.
It is necessary to figure out ACB system operation characteristic and heating
performance in frigid regions.
The cooling performance and air flow patterns of ATB system are highly depend
on the displacement ventilation. Driven by the density difference between cold air
and warm air, the ventilation process is sensitive to the configuration and strength
105
of indoor heat sources. Therefore, it could be beneficial to evaluate the effect of
thermal load distribution and strength on the indoor thermal comfort and terminal
unit performance. The experimental results could give insights on the design and
operation of the ATB systems.
The development of the ATB model is the foundation of precision control and
optimization for the ACMV system. In the ATB system, there is tight coupling
between the displacement ventilation and the air entrainment process. Besides, the
thermosiphon effect is influenced by the internal load which increase the
difficulties to develop an ideal model to predict the supply air flow rate. In
addition, the chilled water inlet temperature is below the dew point and
condensation will occur on the surface of the cooling coil. Consequently, the
terminal unit can handle both sensible load and latent load which increases the
system complexity. Hence, it is highly desired to develop a model of the terminal
unit so that the system control and optimization could be more effective and
accurate.
In general, the ATB system fresh air flow rate is regulated to maintain the indoor
CO2 level while the chilled water flow rate and temperature is adjusted to control
the indoor temperature. However, no humidity control strategy has been
developed so far. In the ATB system, the indoor moisture is removed by
condensation process on the surface of the cooling coil. The dehumidification
efficiency is linked with the secondary air flow rate, chilled water flow rate,
secondary air temperature and chilled water temperature. Thus, the ATB
dehumidifying capacity should be evaluated experimentally to promote the
practical application.
In principle, the operation characteristics of ATB is similar to PTB except the
additional primary air supply. The system test methods, modeling approaches and
optimization algorithms of the ATB systems can be transferred to PTB systems
with few adjustments. As the system configuration of the passive displacement
ventilation system is simple and reliable which reduce the complexity of system
control and cost of maintenance. It is reasonable to extend the current research to

106
the PTB system to achieve desired indoor environment quality and energy
efficiency.

107
References
[1] S. D. Swenson, HVAC: heating, ventilating, and air conditioning. American
Technical Publishers, 2004.
[2] W. Goetzler, R. Shandross, J. Young, O. Petritchenko, D. Ringo, and S. McClive,
"Energy Savings Potential and RD&D Opportunities for Commercial Building
HVAC Systems," Navigant Consulting, Burlington, MA (United States)2017.
[3] (2016). ANNUAL CLIMATE ASSESSMENT 2016 SINGAPORE. Available:
http://www.weather.gov.sg/wp-content/uploads/2017/07/Annual-Climate-
Assessment-Report-2016.pdf
[4] B. Z. A.P. Boranian, J.N. Sarvaiya, N.Y. Jadhav, P. Pawar, Z. Zhang. (2014).
Building energy efficiency R&D roadmap. Available: http://www.nrf,.gov.sg
[5] N. K. Huynh, H. Li, Y. C. Soh, and W. Cai, "Numerical analysis and model-based
control of energy recovery ventilator in HVAC system," in Sustainable
Technologies (WCST), 2016 World Congress on, 2016, pp. 76-77: IEEE.
[6] H. E. Feustel and C. Stetiu, "Hydronic radiant cooling—preliminary assessment,"
Energy and buildings, vol. 22, no. 3, pp. 193-205, 1995.
[7] M. Ackermann, Cool comfort: America's romance with air-conditioning.
Smithsonian Institution, 2013.
[8] K. Roth, J. Dieckmann, R. Zogg, and J. Brodrick, "Chilled beam cooling," Ashrae
journal, vol. 49, no. 9, p. 84, 2007.
[9] G. F. Hundy, A. R. Trott, and T. C. Welch, in Refrigeration and Air-Conditioning
(Fourth Edition)Oxford: Butterworth-Heinemann, 2008, p. vii.
[10] M. Ruponen and J. A. Tinker, "A novel method to measure the air entrainment
ratio of an active chilled beam," International Journal of Ventilation, vol. 7, no. 4,
pp. 299-308, 2009.
[11] P. Filipsson, A. Trüschel, J. Gräslund, and J.-O. Dalenbäck, "Induction ratio of
active chilled beams− Measurement methods and influencing parameters," Energy
and Buildings, vol. 129, pp. 445-451, 2016.

108
[12] H. Freitag and D. Müller, "Modeling the internal airflow in active chilled beams,"
in Ventilation 2012: 10th International Conference on Industrial Ventilation,
2012.
[13] H. Freitag, M. Schmidt, D. Müller, H. Koskela, and P. Mustakallio, "Particle
image velocimetry measurements of the internal air flow in active chilled beams,"
in Roomvent 2014: 13th SCANVAC International Conference on Air Distribution
in Rooms, 2014, pp. 566-573.
[14] H. Koskela, P. Saarinen, H. Freitag, M. Schmidt, D. Müller, and P. Mustakallio,
"LES simulation of the active chilled beam flow pattern," in Roomvent 2014: 13th
SCANVAC International Conference on Air Distribution in Rooms, 2014, pp. 582-
589.
[15] Dadanco. Active chilled beams. Available: http://dadanco.com/
[16] Z. Guan and C. Wen, "Numerical investigation of geometry parameters for
designing efficient terminal units in active chilled beam," in Industrial Electronics
and Applications (ICIEA), 2014 IEEE 9th Conference on, 2014, pp. 1114-1118:
IEEE.
[17] Z. Guan and C. Wen, "Further optimization on Type II terminal unit in active
chilled beam system," in Industrial Electronics (ISIE), 2017 IEEE 26th
International Symposium on, 2017, pp. 1513-1520: IEEE.
[18] B. Wu, W. Cai, Q. Wang, C. Chen, C. Lin, and H. Chen, "The Air Distribution
Around Nozzles Based On Active Chilled Beam System," 2016.
[19] Z. Guan and C. Wen, "Geometric optimization on active chilled beam terminal
unit to achieve high entrainment efficiency," Applied Thermal Engineering, vol.
98, pp. 816-826, 2016.
[20] C. Chen, W. Cai, Y. Wang, and C. Lin, "Performance comparison of heat
exchangers with different circuitry arrangements for active chilled beam
applications," Energy and Buildings, vol. 79, pp. 164-172, 2014.
[21] C. Chen, W. Cai, Y. Wang, and C. Lin, "Further study on the heat exchanger
circuitry arrangement for an active chilled beam terminal unit," Energy and
Buildings, vol. 103, pp. 352-364, 2015.

109
[22] F. Dominguez-Muñoz, "Analysis of the thermal performance of heat exchangers
for active chilled beam units," 2018.
[23] A. Afshari, R. G. Norouzi, G. Hultmark, and C. Niels, "Two-pipe chilled beam
system for both cooling and heating of office buildings," in 11th REHVA World
Congress and 8th International Conference on Indoor Air Quality, Ventilation
and Energy Conservation in Buildings, 2013, pp. 16-19.
[24] B. Bertheussen, P. Mustakallio, R. Kosonen, and A. K. Melikov, "Comparison of
the Performance of Chilled Beam with Swirl Jet and Diffuse Ceiling Air Supply:
Impact of Heat Load Distribution," in Clima 2013Indoor Air Quality, Ventilation
& Energy Conservation in Buildings, 2013.
[25] B. Bertheussen, P. Mustakallio, A. K. Melikov, and R. Kosonen, "Performance of
Chilled Beam with Radial Swirl Jet and Diffuse Ceiling Air Supply in Heating
Mode," in Clima 2013Indoor Air Quality, Ventilation & Energy Conservation in
Buildings, 2013.
[26] P. V. Nielsen, "Displacement ventilation," Aalborg University, 1993.
[27] D. Loveday, K. Parsons, A. Taki, and S. Hodder, "Displacement ventilation
environments with chilled ceilings: thermal comfort design within the context of
the BS EN ISO7730 versus adaptive debate," Energy and Buildings, vol. 34, no. 6,
pp. 573-579, 2002.
[28] K. Naydenov, G. Pitchurov, G. Langkilde, and A. K. Melikov, "Performance of
displacement ventilation in practice," in Proceedings of Roomvent, 2002, pp. 483-
486.
[29] S. Riffat, X. Zhao, and P. Doherty, "Review of research into and application of
chilled ceilings and displacement ventilation systems in Europe," International
Journal of Energy Research, vol. 28, no. 3, pp. 257-286, 2004.
[30] F. Betz, J. McNeill, B. Talbert, H. Thimmanna, and N. Repka, "Issues arising
from the use of chilled beams in energy models," proceedings of SimBuild, vol. 5,
no. 1, pp. 655-667, 2012.
[31] M. Vaughn, "ASHRAE Research Report," 2014.
[32] G. Cao, M. Sivukari, J. Kurnitski, M. Ruponen, and O. Seppänen, "Particle Image
Velocimetry (PIV) application in the measurement of indoor air distribution by an
110
active chilled beam," Building and Environment, vol. 45, no. 9, pp. 1932-1940,
2010.
[33] G. Cao, M. Sivukari, J. Kurnitski, and M. Ruponen, "PIV measurement of the
attached plane jet velocity field at a high turbulence intensity level in a room,"
International Journal of Heat and Fluid Flow, vol. 31, no. 5, pp. 897-908, 2010.
[34] G. Cao, M. Ruponen, R. Paavilainen, and J. Kurnitski, "Modelling and simulation
of the near-wall velocity of a turbulent ceiling attached plane jet after its
impingement with the corner," Building and Environment, vol. 46, no. 2, pp. 489-
500, 2011.
[35] G. Cao, M. Ruponen, and J. Kurnitski, "Experimental investigation of the velocity
distribution of the attached plane jet after impingement with the corner in a high
room," Energy and Buildings, vol. 42, no. 6, pp. 935-944, 2010.
[36] G. Cao, J. Kurnitski, P. Mustakallio, and O. Seppänen, "Active chilled beam wall
jet prediction by the free convection model," International Journal of Ventilation,
vol. 7, no. 2, pp. 169-178, 2008.
[37] G. Cao, J. Kurnitski, M. Ruponen, P. Mustakallio, and O. Seppänen, "Plane-air-jet
corner zone modelling in a room ventilated by an active chilled beam,"
International Journal of Ventilation, vol. 7, no. 4, pp. 287-297, 2009.
[38] G. Cao, "Modelling the attached plane jet in a room," 2009.
[39] F. Alamdari, "Displacement ventilation and cooled ceilings," in Proceedings of
ROOMVENT, 1998, vol. 98, no. 1, pp. 197-204.
[40] S. J. Rees and P. Haves, "An experimental study of air flow and temperature
distribution in a room with displacement ventilation and a chilled ceiling,"
Building and Environment, vol. 59, pp. 358-368, 2013.
[41] Q. Chen and J. Van Der Kooi, "A methodology for indoor airflow computations
and energy analysis for a displacement ventilation system," Energy and Buildings,
vol. 14, no. 4, pp. 259-271, 1990.
[42] B. J. Wachenfeldt, M. Mysen, and P. G. Schild, "Air flow rates and energy saving
potential in schools with demand-controlled displacement ventilation," Energy
and buildings, vol. 39, no. 10, pp. 1073-1079, 2007.

111
[43] B. Wu, W. Cai, H. Chen, and K. Ji, "Experimental investigation on airflow pattern
for active chilled beam system," Energy and Buildings, vol. 166, pp. 438-449,
2018.
[44] J. Fredriksson, M. Sandberg, and B. Moshfegh, "Experimental investigation of the
velocity field and airflow pattern generated by cooling ceiling beams," Building
and environment, vol. 36, no. 7, pp. 891-899, 2001.
[45] B. Wu, W. Cai, and K. Ji, "Heat source effects on thermal comfort for active
chilled beam systems," Building and Environment, vol. 141, pp. 91-102, 2018.
[46] V. Zbořil, A. Melikov, B. Yordanova, L. Bozhkov, and R. Kosonen, "Airflow
distribution in rooms with active chilled beams," in Proceedings of the 10th
International Conference on Air Distribution in Rooms–Roomvent 2007, 2007, pp.
1-7.
[47] R. Kosonen, A. Melikov, L. Bozkhov, and B. Yordanova, "Impact of heat load
distribution and strength on airflow pattern in rooms with exposed chilled beams,"
in Proceedings of ROOMVENT, 2007.
[48] R. Kosonen, M. Virta, and A. Melikov, "The impact of thermal loads on indoor
air flow," in Proceedings of CLIMA, 2007.
[49] A. Melikov, B. Yordanova, L. Bozkhov, V. Zboril, and R. Kosonen, "Impact of
the airflow interaction on occupants’ thermal comfort in rooms with active chilled
beams," in The 6th International Conference on Indoor Air Quality, Ventilation
and Energy Conservation in Buildings, 2007: Citeseer.
[50] A. Melikov, B. Yordanova, L. Bozkhov, V. Zboril, and R. Kosonen, "Human
response to thermal environment in rooms with chilled beams," in Proceedings of
CLIMA, 2007: Citeseer.
[51] J. True, V. Zboril, R. Kosonen, and A. Melikov, "Consideration for minimising
draught discomfort in Rooms with Active Chilled Beams," in Proceedings of
Clima, Wellbeing Indoors, 2007.
[52] P. Mustakallio, Z. Bolashikov, K. Kostov, A. Melikov, and R. Kosonen, "Thermal
Conditions in a Simulated Office Environment with Convective and Radiant
Cooling Systems," in Proceedings of Clima, 2013.
112
[53] A. Novoselac and J. Srebric, "A critical review on the performance and design of
combined cooled ceiling and displacement ventilation systems," Energy and
buildings, vol. 34, no. 5, pp. 497-509, 2002.
[54] M. Behne, "Indoor air quality in rooms with cooled ceilings.: Mixing ventilation
or rather displacement ventilation?," Energy and Buildings, vol. 30, no. 2, pp.
155-166, 1999.
[55] M. Trčka and J. L. Hensen, "Overview of HVAC system simulation," Automation
in Construction, vol. 19, no. 2, pp. 93-99, 2010.
[56] D. B. Crawley, J. W. Hand, M. Kummert, and B. T. Griffith, "Contrasting the
capabilities of building energy performance simulation programs," Building and
environment, vol. 43, no. 4, pp. 661-673, 2008.
[57] P. Jacobs and H. Henderson, "State-of-the-art review of whole building, building
envelope, and HVAC component and system simulation and design tools,"
Architectural Energy Corporation, 2002.
[58] T. Hong, S. Chou, and T. Bong, "Building simulation: an overview of
developments and information sources," Building and environment, vol. 35, no. 4,
pp. 347-361, 2000.
[59] J. L. Hensen, "Application of modelling and simulation to HVAC systems," in
Proc. 30th Int. Conf. MOSIS, 1996, vol. 96.
[60] P. Filipsson, A. Trüschel, J. Gräslund, and J.-O. Dalenbäck, "A thermal model of
an active chilled beam," Energy and Buildings, vol. 149, pp. 83-90, 2017.
[61] C. Chen, W. Cai, K. Giridharan, and Y. Wang, "A hybrid dynamic modeling of
active chilled beam terminal unit," Applied Energy, vol. 128, pp. 133-143, 2014.
[62] N. M. Mateus and G. C. da Graça, "A validated three-node model for
displacement ventilation," Building and Environment, vol. 84, pp. 50-59, 2015.
[63] G. C. da Graça and P. Linden, "A simple model for heat transfer in displacement-
ventilation," in Proceedings of ROOMVENT, 2004.
[64] J. Kim, "Characterizing the in-situ performance of passive chilled beams,"
ASHRAE Transactions, vol. 121, p. 1N, 2015.

113
[65] J. Kim, A. Tzempelikos, and J. E. Braun, "Review of modelling approaches for
passive ceiling cooling systems," Journal of Building Performance Simulation,
vol. 8, no. 3, pp. 145-172, 2015.
[66] S. J. Rees, "Modelling of displacement ventilation and chilled ceiling systems
using nodal models," © Simon John Rees, 1998.
[67] S. J. Rees and P. Haves, "A nodal model for displacement ventilation and chilled
ceiling systems in office spaces," Building and Environment, vol. 36, no. 6, pp.
753-762, 2001.
[68] G. Ge, F. Xiao, and X. Xu, "Model-based optimal control of a dedicated outdoor
air-chilled ceiling system using liquid desiccant and membrane-based total heat
recovery," Applied energy, vol. 88, no. 11, pp. 4180-4190, 2011.
[69] C. Chen, W. Cai, Y. Wang, and Z. Liu, "Design of a fuzzy controller for the
active chilled beam system," in Industrial Electronics and Applications (ICIEA),
2014 IEEE 9th Conference on, 2014, pp. 723-728: IEEE.
[70] T. technix, "Chilled beam design guide," ed: TB012309.
[71] DADANCO, "Considerations for Active Chilled Beam Designs," ed: Design
Bulletin, 2009.
[72] F. Woods, "Chilled beam iQ Star WEGA II," ed: Product manual, 2015.
[73] P. Ken Loudermilk, "Chilled Beams Thermal Comfort FOR," 2009.
[74] K. J. Loudermilk and D. S. Alexander, "Efficient space humidity control with
active chilled beam systems," ASHRAE Journal, vol. 54, no. 1, pp. 28-35, 2012.
[75] D. Alexander and M. O’Rourke, "Design considerations for active chilled beams,"
ASHRAE Journal, vol. 50, no. 9, pp. 50-58, 2008.
[76] P. RUMSEY and R. Engineers, "Chilled Beams," Heating/Piping/Air
Conditioning Engineering, vol. 82, no. 1, pp. 46-49, 2010.
[77] A. Livchak and C. Lowell, "Don’t turn active air terminals into expensive
diffusers," ASHRAE Journal, vol. 54, no. 4, pp. 52-60, 2012.
[78] S. J. Emmerich and T. P. McDowell, Initial evaluation of displacement ventilation
and dedicated outdoor air systems for US commercial buildings. US Department
of Commerce, Technology Administration, National Institute of Standards and
Technology, 2005.
114
[79] A. K. Darwich, "Holistic HVAC design," ASHRAE Journal, vol. 55, no. 4, pp. 40-
45, 2013.
[80] P. Rumsey and J. Weale, "Chilled beams in labs: eliminating reheat & saving
energy on a budget," Ashrae Journal, vol. 49, no. 1, p. 18, 2007.
[81] B. M. Barnet, "Chilled beams for labs: using dual energy recovery," ASHRAE
Journal, vol. 50, no. 12, pp. 28-36, 2008.
[82] N. Devlin, "Validation of an active chilled beam design for a healthcare facility,"
People, vol. 190, p. 133, 2011.
[83] X. Shan, J. Zhou, V. W.-C. Chang, and E.-H. Yang, "Comparing mixing and
displacement ventilation in tutorial rooms: Students' thermal comfort, sick
building syndromes, and short-term performance," Building and Environment, vol.
102, pp. 128-137, 2016.
[84] Y. Li, P. V. Nielsen, and M. Sandberg, "Displacement ventilation in hospital
environments," ASHRAE J, vol. 53, pp. 86-88, 2011.
[85] N. Ruangtrakoon, T. Thongtip, S. Aphornratana, and T. Sriveerakul, "CFD
simulation on the effect of primary nozzle geometries for a steam ejector in
refrigeration cycle," International Journal of Thermal Sciences, vol. 63, pp. 133-
145, 2013.
[86] N. Enjalbert, D. Galley, and L. Pierrot, "An entrainment model for the turbulent
jet in a coflow," Comptes Rendus Mecanique, vol. 337, no. 9-10, pp. 639-644,
2009.
[87] K. Ariafar, D. Buttsworth, N. Sharifi, and R. Malpress, "Ejector primary nozzle
steam condensation: area ratio effects and mixing layer development," Applied
Thermal Engineering, vol. 71, no. 1, pp. 519-527, 2014.
[88] K. Ariafar, D. Buttsworth, G. Al-Doori, and N. Sharifi, "Mixing layer effects on
the entrainment ratio in steam ejectors through ideal gas computational
simulations," Energy, vol. 95, pp. 380-392, 2016.
[89] X. Wang, W. Cai, J. Lu, Y. Sun, and X. Ding, "A hybrid dehumidifier model for
real-time performance monitoring, control and optimization in liquid desiccant
dehumidification system," Applied energy, vol. 111, pp. 449-455, 2013.
115
[90] X. Ou, W. Cai, X. He, D. Zhai, and X. Wang, "Dynamic modeling and validation
of a liquid desiccant cooling and dehumidification system," Energy and Buildings,
vol. 163, pp. 44-57, 2018.
[91] C. Lee, "A simplified explicit model for determining the performance of a chilled
water cooling coil," International Journal of Refrigeration, vol. 43, pp. 167-175,
2014.
[92] L. Song and G. Wang, "Using a hybrid method to construct a computational
efficient cooling coil model for an automated single-duct variable air volume
system fault detection and diagnosis," Energy and Buildings, vol. 92, pp. 363-373,
2015.
[93] A. Afram and F. Janabi-Sharifi, "Black-box modeling of residential HVAC
system and comparison of gray-box and black-box modeling methods," Energy
and Buildings, vol. 94, pp. 121-149, 2015.
[94] G.-Y. Jin, W.-J. Cai, Y.-W. Wang, and Y. Yao, "A simple dynamic model of
cooling coil unit," Energy Conversion and Management, vol. 47, no. 15-16, pp.
2659-2672, 2006.
[95] X. Yuan, Q. Chen, and L. R. Glicksman, "A critical review of displacement
ventilation," ASHRAE transactions, vol. 104, p. 78, 1998.
[96] A. Svensson, "Nordic experience of displacement ventilation system," ASHRAE
Transaction., vol. 95, no. 2, pp. 1013-1017, 1989.
[97] X. Yuan, Q. Chen, and L. R. Glicksman, "Performance evaluation and design
guidelines for displacement ventilation," ASHRAE Transactions, vol. 105, p. 298,
1999.
[98] W. Shan and D. Rim, "Thermal and ventilation performance of combined passive
chilled beam and displacement ventilation systems," Energy and Buildings, vol.
158, pp. 466-475, 2018.
[99] G. Hunt and P. Linden, "Steady-state flows in an enclosure ventilated by
buoyancy forces assisted by wind," Journal of Fluid Mechanics, vol. 426, pp.
355-386, 2001.

116
[100] J. Fredriksson and M. Sandberg, "The effect of false ceiling on the cooling
capacity of passive chilled beams," Building and Environment, vol. 44, no. 7, pp.
1426-1430, 2009.
[101] I. C. Nelson, C. H. Culp, J. Rimmer, and B. Tully, "The effect of thermal load
configuration on the performance of passive chilled beams," Building and
Environment, vol. 96, pp. 188-197, 2016.
[102] H. Koskela, H. Häggblom, R. Kosonen, and M. Ruponen, "Air distribution in
office environment with asymmetric workstation layout using chilled beams,"
Building and Environment, vol. 45, no. 9, pp. 1923-1931, 2010.
[103] H. Koskela, H. Häggblom, R. Kosonen, and M. Ruponen, "Flow pattern and
thermal comfort in office environment with active chilled beams," HVAC&R
Research, vol. 18, no. 4, pp. 723-736, 2012.
[104] Z. Li and S. Deng, "An experimental study on the inherent operational
characteristics of a direct expansion (DX) air conditioning (A/C) unit," Building
and Environment, vol. 42, no. 1, pp. 1-10, 2007.
[105] X. Xu, L. Xia, M. Chan, and S. Deng, "Inherent correlation between the total
output cooling capacity and equipment sensible heat ratio of a direct expansion air
conditioning system under variable-speed operation (XXG SMD SHR DX AC
unit)," Applied thermal engineering, vol. 30, no. 13, pp. 1601-1607, 2010.
[106] H. Pombeiro, M. J. Machado, and C. Silva, "Dynamic programming and genetic
algorithms to control an HVAC system: Maximizing thermal comfort and
minimizing cost with PV production and storage," Sustainable Cities and Society,
vol. 34, pp. 228-238, 2017.
[107] V. Congradac and F. Kulic, "HVAC system optimization with CO2 concentration
control using genetic algorithms," Energy and Buildings, vol. 41, no. 5, pp. 571-
577, 2009.
[108] W. Huang and H. Lam, "Using genetic algorithms to optimize controller
parameters for HVAC systems," Energy and Buildings, vol. 26, no. 3, pp. 277-
282, 1997.
117
[109] J. Seo, R. Ooka, J. T. Kim, and Y. Nam, "Optimization of the HVAC system
design to minimize primary energy demand," Energy and Buildings, vol. 76, pp.
102-108, 2014.
[110] F. Yu and K. Chan, "Modelling of the coefficient of performance of an air-cooled
screw chiller with variable speed condenser fans," Building and environment, vol.
41, no. 4, pp. 407-417, 2006.
[111] Y.-C. Chang, J.-K. Lin, and M.-H. Chuang, "Optimal chiller loading by genetic
algorithm for reducing energy consumption," Energy and Buildings, vol. 37, no. 2,
pp. 147-155, 2005.
[112] L. Lu, W. Cai, Y. S. Chai, and L. Xie, "Global optimization for overall HVAC
systems––Part I problem formulation and analysis," Energy conversion and
management, vol. 46, no. 7-8, pp. 999-1014, 2005.
[113] ASHRAE., ASHRAE handbook of fundamentals. Mar Lin Book Company, 1985.
[114] ASHRAE., Thermal environmental conditions for human occupancy (no. 2004).
American Society of Heating, Refrigerating and Air-Conditioning Engineers,
2004.

118

119
Author’s publications
1. Ke Ji, Wenjian Cai, Bingjie Wu, Xianhua Ou, Mechanical design and
performance evaluation of active thermosiphon beam terminal units, Building and
Environment, 153 (2019), 241-252.
2. Ke Ji, Wenjian Cai, Bingjie Wu, Xin Zhang, Modelling and validation of an
active chilled beam terminal unit, Journal of Building Engineering, 22 (2019),
161-170.
3. Ke Ji, Wenjian Cai, Fuzzy model based predictive control for active chilled beam
systems, in 12th IEEE Conference on Industrial Electronics and Applications
(ICIEA), 2017, pp.807-812.
4. Ke Ji, Wenjian Cai, Bingjie Wu, Performance analysis of heat transfer rate and
negative air ion application for passive thermosiphon beam system, in 13th IEEE
Conference on Industrial Electronics and Applications (ICIEA), 2018, pp.1609-
1614.