Embed Size (px)
Citation preview

© 2017 IJRTI | Volume 2, Issue 8 | ISSN: 2456-3315
IJRTI1708034 International Journal for Research Trends and Innovation (www.ijrti.org) 186
Design by Analysis According To ASME Section VIII
Division 2 for Pump Trap
1Mohie Suraj S.,
2Prof. Dr. Kotwal Girish N.
1M.Tech Research scholar, 2Professor
Mechanical Engineering Department
Vishwakarma Institute of Technology, Pune, India.
Abstract-Pump traps are the extension of the steam traps. Steam Traps can discharge condensate only when there is a
positive differential pressure across the trap. Pump traps ensures an optimum discharge of condensate that is reliable for
all load case i.e. stall or vacuum. It is necessary to check product with ASME Section VIII Div.2 Part 5.
This paper describes the design assessment for the pump trap as per ASME Section VIII Division 2 Design by Analysis.
The goal of this work was to analyze the Pump trap body and compare the results to ASME pressure vessel criteria and
where necessary modify the design to meet the code criteria. Cast Pump Trap is non-standard shape pressure vessel type
product. For validating this product according to ASME we need to satisfy criteria of the Design by Analysis.
Keywords: Steam, Steam Trap, Pump Trap, ASME, Design by Analysis,
1. INTRODUCTION
I. STEAM TRAP
In most of the process industries, high pressure steam is utilized for many applications. The steam is produced in the boilers and
carried through steam pipe lines to the process plants. During their travel through these pipelines, loss may occur due to loss of
pressure, pipe line insulation failures and loss of temperature. These are known as losses in steam network. This reduces steam efficiency, thus the quality of steam becomes low at the receiving end. Steam Traps are automatic valves designed to trap steam
and remove condensate from the steam lines. Thus a perfect steam trap can minimize steam loss and thus maximize the steam
efficiency and quality. (1)
Steam trap is the most important link in the condensate loop because it connects steam usage with condensate return. The function
of steam trap is to discharge condensate while not permitting the escape of live steam. For the efficient usage of steam inside the
process equipment, the steam should be kept inside the device until the complete steam is transformed into condensate. For this to
be happen the steam trap functioning will be in perfect condition. (2)
Steam trap users range from laundries and tailor shops (with a few traps) to huge refineries and chemical complexes (with 10,000
to 15,000 units). Paper mills, textile plants, steel mills and food processors are all large users of steam and steam traps. Colleges,
hospitals, prisons, government agencies, and similar large building complexes with central steam heating systems are also users of
steam traps. This wide range of users creates an equally wide range of steam trap applications. In turn this wide variety of
applications is matched by a seemingly bewildering array of steam trap types and sizes. (3)
A steam trap can be defined as a self-contained valve which automatically drains condensate and discharges air and non-
condensable gases from a steam-containing pipe or vessel. It remains closed in the presence of steam. In some designs, however,
it will allow steam to flow at a controlled or adjusted rate.
Types of Steam Traps
Over the years, three basic trap types have evolved and have been classified according to their mode of operation. Certain types of
traps may combine two working principles in their operation. The predominant condensate discharge principle shall designate the
trap type. (1) The three types are:
Thermodynamic traps-Traps that are actuated by the principles of thermodynamics and fluid dynamics.
Mechanical traps-Traps that are actuated by a float, responding to changes in condensate level.
Thermostatic traps-Traps that are actuated by temperature sensitive devices, responding to changes in condensate temperature.
II. PUMP TRAPS
Steam Traps can discharge condensate only when the inlet pressure is higher than the outlet pressure i.e. when there is a positive
differential pressure across the trap. In certain applications which are temperature controlled, there is a possibility of the process
side pressure becoming either equal to or less than the back pressure on the trap, this phenomenon is called as stall or vacuum.
Normal steam traps are unable to discharge condensate under stall conditions which results in water logging and leads to
increased batch timings, damage to the process equipment and rejections. The easiest way of avoiding stall is to ensure that the
pressure at the trap inlet is always higher than the back pressure. Many times, this cannot be achieved due to practical considerations.(8)

© 2017 IJRTI | Volume 2, Issue 8 | ISSN: 2456-3315
IJRTI1708034 International Journal for Research Trends and Innovation (www.ijrti.org) 187
Using a new generation of extremely compact pump traps ensures an optimum discharge of condensate that is reliable for all load
cases. These devices unite a drain function with a demand-dependent pump function. In comparison to normal float traps, they
have two additional connections for the motive steam and for a vent line as well as integrated solenoid valves and non-return
elements. In addition to a time proven rolling ball regulator, there is a mechanism which automatically injects high pressure steam
into the body when the pressure is too low. This motive steam, the condensate is actively transported into the condensate system.
If the pressure in the heat exchanger is sufficiently high, the rolling ball regulator acts as a conventional float trap without employing any additional motive steam.
2. ANALYSIS REQUIREMENTS
The ASME Division 2 rules call out the required procedures and define the allowable yield strength, ultimate strength, strain
limit, buckling load, and collapse load that must be satisfied. These procedures are based on protection against failure modes.
They are; protection against Plastic Collapse, protection against Local Failure, protection against Collapse from Buckling and
protection against Failure From Cyclic Loading. The procedures called out may only be used if the allowable stress evaluated at
the design temperature is governed by time independent properties unless the specific design procedure allows it. The Pump trap
was analyzed following these step by step requirements, the analysis and results of the analysis procedures is presented here. At
the time of this analysis set the pressure limits in the trap is 14 bar. This pressure is the maximum allowable working pressure,
MAWP, for all analyses. Vacuum pressure for buckling criteria is 1 bar vacuum pressure. The load case combination are given in
figures, 5.3 of the 2010 Section VIII, Division 2 code. Design by Analysis, in which designer performs stress analysis and
evaluates results against code limits, was intended for configurations not covered by the Design By Formula.(5)
I. DESIGN BY ANALYSIS
Design-by-analysis method assumes a numerical analysis technique will be used, and either elastic or elastic-plastic analysis is
permitted. In the case of the trap, ANSYS structural analysis software was used to perform the finite element analyses and
provide protection against four modes of failure: plastic collapse, buckling, cyclic loading and local fracture. (5)
Materials of Construction
Material of Cast PUMP TRAP cover and base body is Ductile steel (60-40-18). Material properties of steel are taken from ASME
Section VIII Div.1 Table No. UCD 23. All the material properties described in below Table 1
Material Properties
Ultimate tensile strength = Sut = 414 MPa
Design Temperature (°
C)
Elastic Modulus
(MPa)
Allowable Stress (MPa)
Yield Strength
(MPa)
Density (Kg/m3)
Poisson's Ratio
room temp 2.00E+05 82.7 276 7100 0.3
204 2.00E+05 82.7 276 7100 0.3
316 2.00E+05 82.7 276 7100 0.3
Table 1:- Material properties of ductile cast steel
FEA Analysis of Cast PUMP TRAP is calculated for the following load case as per design data
1. LC1 – Internal Design Pressure (Load Controlled)
2. LC2 – Hydro Test Pressure
Wind Load, Snow Load, Earthquake Load and live load is not applicable for this product so only following Load case combinations are applicable.
1) LC1 – INTERNAL DESIGN PRESSURE (LOAD CONTROLLED)
A. PROTECTION FROM PLASTIC COLLAPSE
Three alternative analysis methods are acceptable for evaluating the structure for protection against plastic collapse. The first is
the elastic stress analysis method, the second is the Limit-Load Method and the third is the Elastic-Plastic Stress Analysis
Method.
i. ELASTIC STRESS ANALYSIS METHOD
To evaluate protection against plastic collapse, the results from an elastic stress analysis of the component subject to defined loading conditions are categorized and compared to an associated limiting value.
© 2017 IJRTI | Volume 2, Issue 8 | ISSN: 2456-3315
IJRTI1708034 International Journal for Research Trends and Innovation (www.ijrti.org) 188
Load controlled Load case combination only consider the pressure and mechanical load not thermal effect. So that Structural
Analysis is perform for all above load case combination. For the above load case wind load, earthquake load, and live load are
zero. Structural analysis is perform for all the above load case combination in load controlled load case.
Geometry and FE Modeling
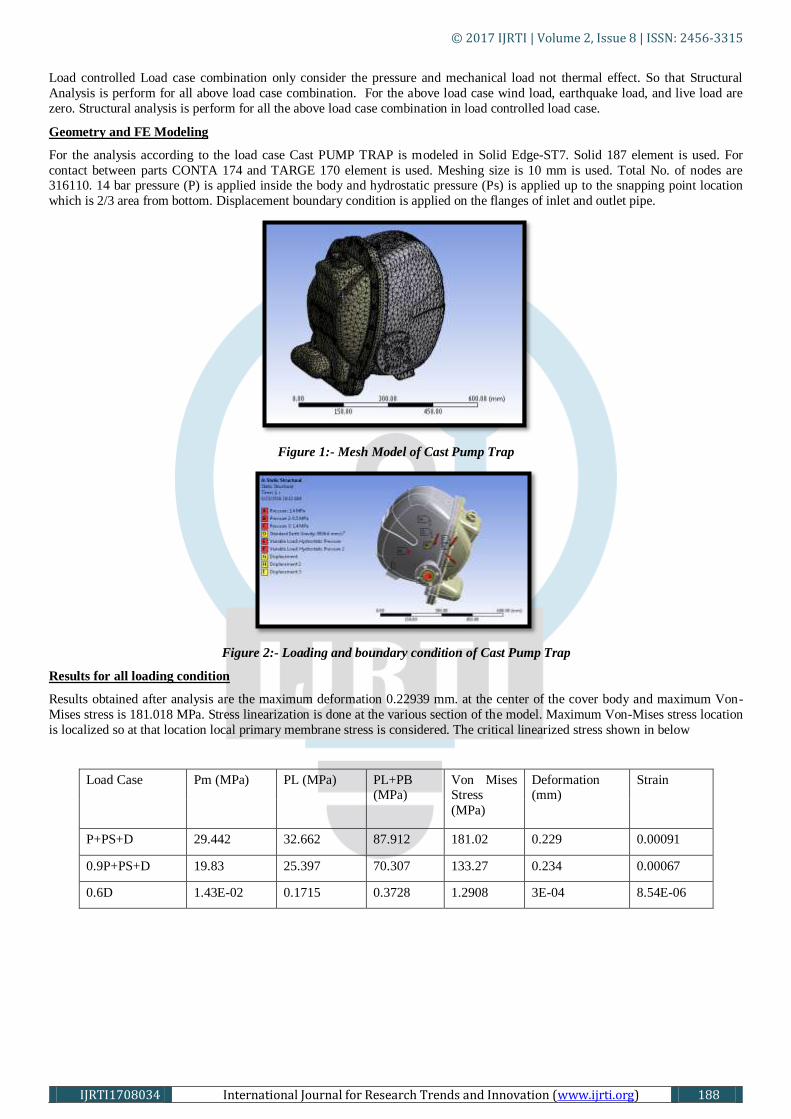
For the analysis according to the load case Cast PUMP TRAP is modeled in Solid Edge-ST7. Solid 187 element is used. For
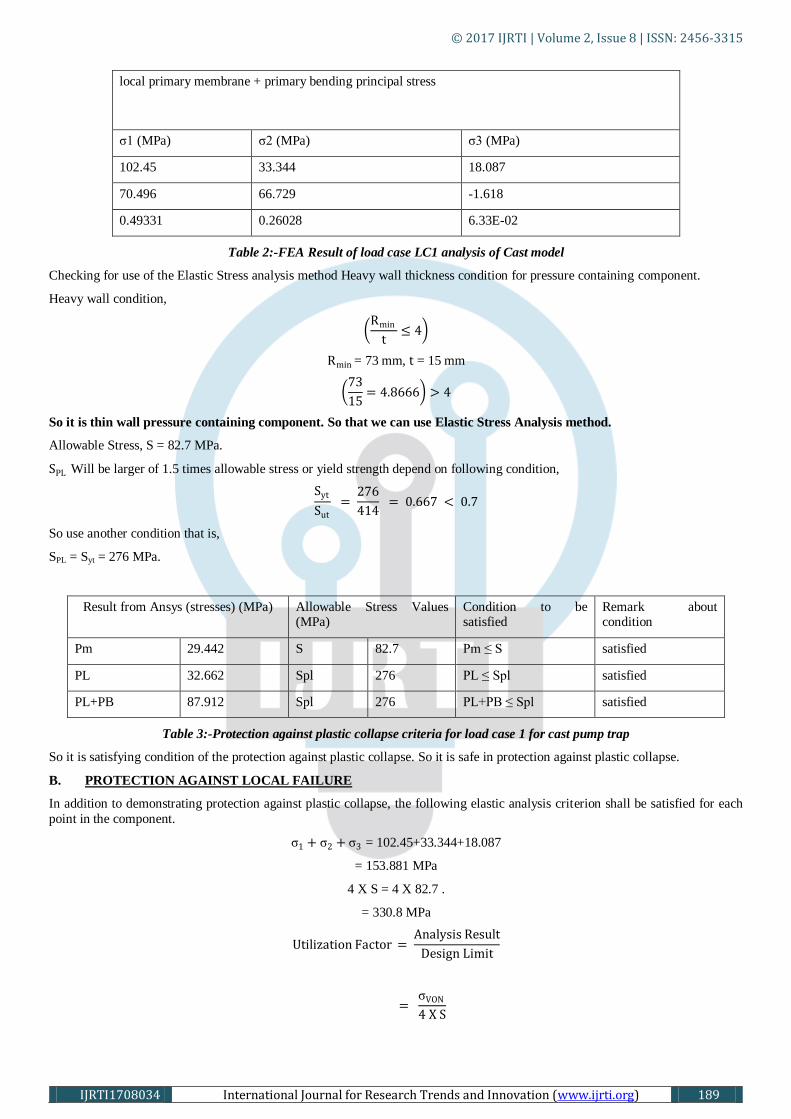
contact between parts CONTA 174 and TARGE 170 element is used. Meshing size is 10 mm is used. Total No. of nodes are 316110. 14 bar pressure (P) is applied inside the body and hydrostatic pressure (Ps) is applied up to the snapping point location
which is 2/3 area from bottom. Displacement boundary condition is applied on the flanges of inlet and outlet pipe.
Figure 1:- Mesh Model of Cast Pump Trap
Figure 2:- Loading and boundary condition of Cast Pump Trap
Results for all loading condition
Results obtained after analysis are the maximum deformation 0.22939 mm. at the center of the cover body and maximum Von-
Mises stress is 181.018 MPa. Stress linearization is done at the various section of the model. Maximum Von-Mises stress location
is localized so at that location local primary membrane stress is considered. The critical linearized stress shown in below
Load Case Pm (MPa) PL (MPa) PL+PB (MPa)
Von Mises Stress
(MPa)
Deformation (mm)
Strain
P+PS+D 29.442 32.662 87.912 181.02 0.229 0.00091
0.9P+PS+D 19.83 25.397 70.307 133.27 0.234 0.00067
0.6D 1.43E-02 0.1715 0.3728 1.2908 3E-04 8.54E-06
© 2017 IJRTI | Volume 2, Issue 8 | ISSN: 2456-3315
IJRTI1708034 International Journal for Research Trends and Innovation (www.ijrti.org) 189
local primary membrane + primary bending principal stress
σ1 (MPa) σ2 (MPa) σ3 (MPa)
102.45 33.344 18.087
70.496 66.729 -1.618
0.49331 0.26028 6.33E-02
Table 2:-FEA Result of load case LC1 analysis of Cast model
Checking for use of the Elastic Stress analysis method Heavy wall thickness condition for pressure containing component.
Heavy wall condition,
Rmin
t≤ 4
Rmin = 73 mm, t = 15 mm
73
15= 4.8666 > 4
So it is thin wall pressure containing component. So that we can use Elastic Stress Analysis method.
Allowable Stress, S = 82.7 MPa.
SPL Will be larger of 1.5 times allowable stress or yield strength depend on following condition,
Syt
Sut
= 276
414 = 0.667 < 0.7
So use another condition that is,
SPL = Syt = 276 MPa.
Result from Ansys (stresses) (MPa) Allowable Stress Values (MPa)
Condition to be satisfied
Remark about condition
Pm 29.442 S 82.7 Pm ≤ S satisfied
PL 32.662 Spl 276 PL ≤ Spl satisfied
PL+PB 87.912 Spl 276 PL+PB ≤ Spl satisfied
Table 3:-Protection against plastic collapse criteria for load case 1 for cast pump trap
So it is satisfying condition of the protection against plastic collapse. So it is safe in protection against plastic collapse.
B. PROTECTION AGAINST LOCAL FAILURE
In addition to demonstrating protection against plastic collapse, the following elastic analysis criterion shall be satisfied for each
point in the component.
σ1 + σ2 + σ3 = 102.45+33.344+18.087
= 153.881 MPa
4 X S = 4 X 82.7 .
= 330.8 MPa
Utilization Factor = Analysis Result
Design Limit
= σVON
4 X S
© 2017 IJRTI | Volume 2, Issue 8 | ISSN: 2456-3315
IJRTI1708034 International Journal for Research Trends and Innovation (www.ijrti.org) 190
= 181.08
330.8
= 0.5474
Result from Ansys (Stress in MPa)
Allowable Stress Values (MPa)
Condition to be satisfied Remark about condition
σ1+σ2+σ3 4S σ1+σ2+σ3≤ 4 S
153.881 330.8 153.881≤ 330.8 satisfied
Table 4:- Protection against local failure criteria for load case 1 cast pump trap
So it is satisfying condition of the protection against Local Failure and also Utilization Factor is Less than one. So it is safe in protection against Local Failure.
2) HYDRO TEST PRESSURE
Load Case: - LC 2 (Hydro-Test Pressure)
Load Case combination
1. P +Ps +D
2. 0.9P +Ps +D +(0.6W or 0.7 E)
In the testing load case only above Load case combination are consider, according to the ASME Section VIII Div. 2 Table 5.1. So
that Structural Analysis is perform for all above load case combination. For the above load case wind load, earthquake load, and
live load are zero.
Hydrostatic test pressure = 1.5 times design pressure
= 1.5 X 16
= 24 Bar
Structural analysis according to Hydro-Test Pressure Condition
Geometry and FE Modeling:-
Geometry and FE modeling is as same as the Load case 1 (LC-1). But in the loading condition are
P = 24 bar.
Ps = hydrostatic (Water) pressure,
D =dead (self) weight of cast model,
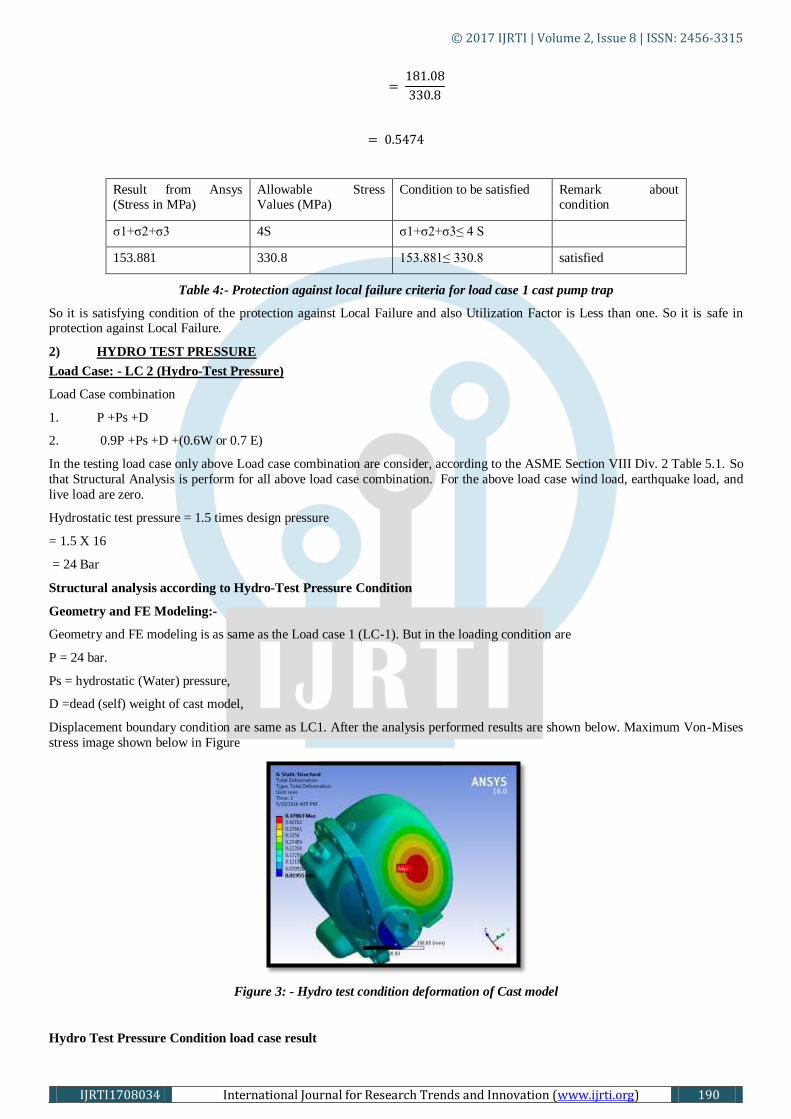
Displacement boundary condition are same as LC1. After the analysis performed results are shown below. Maximum Von-Mises
stress image shown below in Figure
Figure 3: - Hydro test condition deformation of Cast model
Hydro Test Pressure Condition load case result

© 2017 IJRTI | Volume 2, Issue 8 | ISSN: 2456-3315
IJRTI1708034 International Journal for Research Trends and Innovation (www.ijrti.org) 191
For both load case structural stress analysis is performed. Then stress linearization at various section of the model is done. From
available stress linearization maximum linearized value consider for each case which are shown in below Table 5
Load Case Pm (MPa) PL (MPa) PL+PB (MPa)
Stress (MPa)
Deformation (mm)
Strain
P+PS+D 37.799 40.23 133.97 240.1 0.4786 0.001201
0.9P+PS+D 34.018 36.209 120.57 216.1 0.4308 0.001081
local primary membrane + primary bending principal stress
σ1 (MPa) σ2 (MPa) σ3 (MPa)
134.34 127.14 -3.0827
120.9 114.43 -2.774
Table 5:-FEA Result of hydro testing load case analysis of Cast model
From the result of above load case P +Ps +D Load case combination is critical, so it is consider for the Protection against plastic
collapse and protection against local failure. Maximum stress location is in the inside cover body near inlet pipe. Location is same
as the load case LC1.
Figure 4:-Equivalent Von-Mises stress for Hydro test load case
Ansys Results Interpreted with ASME section VIII Division 2 Part 5
A. PROTECTION AGAINST PLASTIC COLLAPSE:-
Condition is checked in Load controlled load case and component is also not changed so from the result calculated for thin wall
condition in above load case is considered. So it is thin wall pressure containing component. So that we can use Elastic Stress
Analysis method.
Allowable Stress, S = 82.7 MPa
SPL = Syt =276 MPa
From the result table 6 and as discussed in the literature of the ASME Sec VIII Div. 2 check all the result as per condition of the
Elastic Stress Analysis Method
Result from Ansys (stresses in
MPa)
Allowable Stress Values
(MPa)
Condition to be
satisfied
Remark about
condition

© 2017 IJRTI | Volume 2, Issue 8 | ISSN: 2456-3315
IJRTI1708034 International Journal for Research Trends and Innovation (www.ijrti.org) 192
Pm 37.799 S 82.7 Pm ≤ S satisfied
PL 40.23 SPL 276 PL ≤ SPL satisfied
PL+PB 133.97 SPL 276 PL+PB ≤ SPL satisfied
Table 6:-Protection against plastic collapse criteria for load case 3 for cast pump trap
So it is satisfying condition of the protection against plastic collapse. So it is safe in protection against plastic collapse.
B. PROTECTION AGAINST LOCAL FAILURE
In addition to demonstrating protection against plastic collapse, the following elastic analysis criterion shall be satisfied for each
point in the component.
σ1 + σ2 + σ3 = 134.4 + 127.14 + (-3.0827)
= 258.3973 MPa
4 X S = 4 X 82.7
= 330.8 MPa.
𝑈𝑡𝑖𝑙𝑖𝑧𝑎𝑡𝑖𝑜𝑛 𝐹𝑎𝑐𝑡𝑜𝑟 = 𝐴𝑛𝑎𝑙𝑦𝑠𝑖𝑠 𝑅𝑒𝑠𝑢𝑙𝑡
𝐷𝑒𝑠𝑖𝑔𝑛 𝐿𝑖𝑚𝑖𝑡
= σVON
4 X S
= 240.1
330.8
= 0.725816
Result from Ansys (Stresses in MPa)
Allowable Values Condition to be satisfied Remark about condition
σ1+σ2+σ3 4S σ1+σ2+σ3≤ 4 S
258.397 330.8 258.3973≤ 330.8 satisfied
Table 7:-Protection against local failure criteria for load case 3 for cast pump trap
So it is satisfying condition of the protection against Local Failure and also Utilization Factor is Less than one. So it is safe in
protection against Local Failure.
C. PROTECTION AGAINST COLLAPSE FROM BUCKLING
The design factor to be used in a structural stability assessment is based on the type of buckling analysis performed. Bifurcation
buckling analysis is performed using an elastic stress analysis without geometric nonlinearities in the solution to determine the
pre-stress in the component. Cast pump trap is working under vacuum condition so that it produces compressive stress field. So
cast pump trap also needed to be satisfy protection against collapse from buckling criteria.
Capacity Reduction Factor (βCR
) for spherical shell and spherical tori-spherical elliptical heads under external pressure,
βCR
= 0.124
Minimum design factor = ∅B = 2
βCR
= 2
0.124
= 16.129
This is the minimum design factor for buckling analysis.
Buckling analysis according to buckling load condition

© 2017 IJRTI | Volume 2, Issue 8 | ISSN: 2456-3315
IJRTI1708034 International Journal for Research Trends and Innovation (www.ijrti.org) 193
Vacuum load= P = -1 bar.
For the buckling analysis firstly structural analysis is perform with 1 bar vacuum pressure, hydrostatic water pressure, self-weight
and displacement boundary condition is applied inlet and outlet flange. Structural analysis result is import in buckling simulation.
Pre-stress load pattern is static structural. Buckling analysis shows the load multiplier which is similar to the safety factor for that
particular load case. Load multiplier must be greater than min. design factor as per ASME Section VIII Div. 2 for satisfying
buckling criteria.
Results of buckling analysis
Figure 5:-Buckling mode shape
From FEA result it is found that first buckling mode has a load factor of 180.91and is significantly above the load factor of
minimum design factor of 16.129. So it is safe in Protection against collapse from buckling.
3. EXPERIMENTATION
I. STRAIN MEASUREMENT
Experimental stress analysis is perform using strain gauges with Wheatstone bridge circuit. Then Experimental results are
compared with FEA. The product surface is not in one plane so that delta rosette configuration strain gauges are required for the
stress measurement. We selected the region where maximum deformation is seen in FEA for stress measurement. For this three Wheatstone bridge circuit are used on the circuit panel. Wheatstone bridge circuit panel shown in Figure below,
Figure 6:- three Wheatstone bridge circuit panel
Wheatstone bridge circuit used component specification,
Resistor, R = 330 Ω
Battery = 0 − 9 volt
Strain gauge = 350 Ω
Capacitor = 100𝜇𝐹
IC 7805
Digital Multi-Meter

© 2017 IJRTI | Volume 2, Issue 8 | ISSN: 2456-3315
IJRTI1708034 International Journal for Research Trends and Innovation (www.ijrti.org) 194
Strain gauge installation method
1. Clean surface
Use a solvent (such as acetone or alcohol) to remove any grease or oils from the surface to which the stain gage will be bonded. This is to prevent any contaminants from being driven into the surface while performing subsequent steps. Clean an area
significantly larger than the gage (4 to 6 inches on all sides) to prevent any contaminants from the surrounding area from being
introduced into the gage area.
2. Abrade surface
Remove any oxidation, paint or coating from the surface finishing the abrading with a 400 grit silicone-carbide paper to ensure a proper texture for adhesion.
3. Mark layout lines
Use a clean rule and a hard pencil or pen to mark the desired position of the gage.
4. Transferring gage
Use a proper length, about 15 cm (6 in), of cellophane tape to pick up the strain gage and transfer it to the gaging area of the specimen. Align the gage with the layout lines. Press one end of the tape to the specimen, then smoothly and gently apply the
whole tape and gage into position.
5. Applying adhesive
Apply enough adhesive to provide sufficient coverage under the gage for proper adhesion.
6. Removing tape
Leave the tape in place at least two more minutes after the thumb was removed. Peel the tape from the specimen slowly and smoothly from one end to the other end.
Figure 7:- strain gauges on the product
After installing strain gauges on the product, Wheatstone bridge circuit lead wire connected to strain gauges. Then for testing
water pressure is applied inside the product and strain measured across Wheatstone bridge output using digital multi-meter.
Reading taken on Digital Multi-meter across each strain gauge connected Wheatstone bridge circuit are in millivolt. Wheatstone
bridge setup with product shown below
Figure 8:-product with strain measurement setup
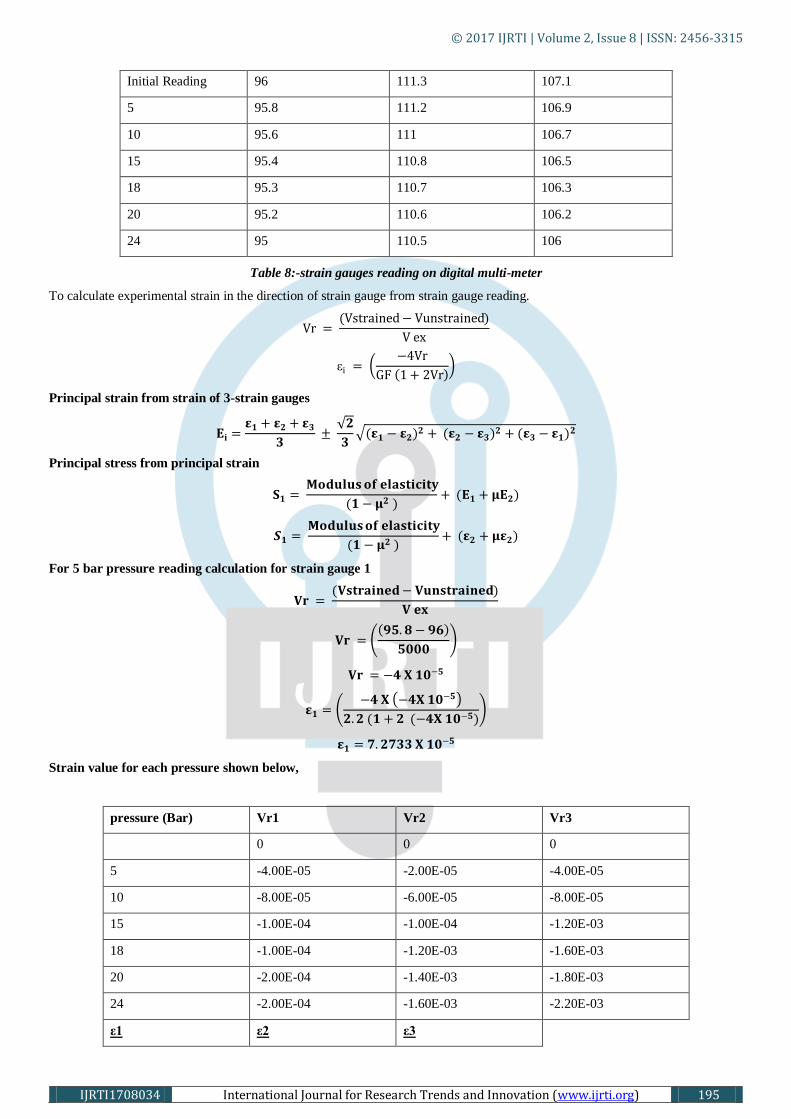
Strain gauges reading on multi meter shown in below Table 8,
Pressure (Bar) Strain Gauge 1 (mV) Strain Gauge 2 (mV) Strain Gauge 3 (mV)
© 2017 IJRTI | Volume 2, Issue 8 | ISSN: 2456-3315
IJRTI1708034 International Journal for Research Trends and Innovation (www.ijrti.org) 195
Initial Reading 96 111.3 107.1
5 95.8 111.2 106.9
10 95.6 111 106.7
15 95.4 110.8 106.5
18 95.3 110.7 106.3
20 95.2 110.6 106.2
24 95 110.5 106
Table 8:-strain gauges reading on digital multi-meter
To calculate experimental strain in the direction of strain gauge from strain gauge reading.
Vr = (Vstrained− Vunstrained)
V ex
εi = −4Vr
GF 1 + 2Vr
Principal strain from strain of 3-strain gauges
𝐄𝐢 =𝛆𝟏 + 𝛆𝟐 + 𝛆𝟑
𝟑 ±
𝟐
𝟑 (𝛆𝟏 − 𝛆𝟐)𝟐 + (𝛆𝟐 − 𝛆𝟑)𝟐 + (𝛆𝟑 − 𝛆𝟏)𝟐
Principal stress from principal strain
𝐒𝟏 = 𝐌𝐨𝐝𝐮𝐥𝐮𝐬 𝐨𝐟 𝐞𝐥𝐚𝐬𝐭𝐢𝐜𝐢𝐭𝐲
(𝟏 − 𝛍𝟐 )+ (𝐄𝟏 + 𝛍𝐄𝟐)
𝑺𝟏 = 𝐌𝐨𝐝𝐮𝐥𝐮𝐬 𝐨𝐟 𝐞𝐥𝐚𝐬𝐭𝐢𝐜𝐢𝐭𝐲
(𝟏 − 𝛍𝟐 )+ (𝛆𝟐 + 𝛍𝛆𝟐)
For 5 bar pressure reading calculation for strain gauge 1
𝐕𝐫 = (𝐕𝐬𝐭𝐫𝐚𝐢𝐧𝐞𝐝− 𝐕𝐮𝐧𝐬𝐭𝐫𝐚𝐢𝐧𝐞𝐝)
𝐕 𝐞𝐱
𝐕𝐫 = 𝟗𝟓.𝟖 − 𝟗𝟔
𝟓𝟎𝟎𝟎
𝐕𝐫 = −𝟒 𝐗 𝟏𝟎−𝟓
𝛆𝟏 = −𝟒 𝐗 −𝟒𝐗 𝟏𝟎−𝟓
𝟐.𝟐 (𝟏 + 𝟐 (−𝟒𝐗 𝟏𝟎−𝟓)
𝛆𝟏 = 𝟕.𝟐𝟕𝟑𝟑 𝐗 𝟏𝟎−𝟓
Strain value for each pressure shown below,
pressure (Bar) Vr1 Vr2 Vr3
0 0 0
5 -4.00E-05 -2.00E-05 -4.00E-05
10 -8.00E-05 -6.00E-05 -8.00E-05
15 -1.00E-04 -1.00E-04 -1.20E-03
18 -1.00E-04 -1.20E-03 -1.60E-03
20 -2.00E-04 -1.40E-03 -1.80E-03
24 -2.00E-04 -1.60E-03 -2.20E-03
ε1 ε2 ε3

© 2017 IJRTI | Volume 2, Issue 8 | ISSN: 2456-3315
IJRTI1708034 International Journal for Research Trends and Innovation (www.ijrti.org) 196
0 0 0
7.27E-05 3.64E-05 7.27E-05
1.45E-04 1.09E-04 1.45E-04
2.18E-04 1.82E-04 2.18E-04
2.55E-04 2.18E-04 2.91E-04
2.91E-04 2.55E-04 3.27E-04
3.64E-04 2.91E-04 4.00E-04
Table 9:-calculated strain value for each strain gauge result
From strain value calculate principal strain (E), principal stress(S) and von-Mises stresses (Svm) as follow
Principal strain from strain of 3-strain gauges for 5 bar pressure
𝐄𝐢 =𝛆𝟏 + 𝛆𝟐 + 𝛆𝟑
𝟑 ±
𝟐
𝟑 (𝛆𝟏 − 𝛆𝟐)𝟐 + (𝛆𝟐 − 𝛆𝟑)𝟐 + (𝛆𝟑 − 𝛆𝟏)𝟐
𝐄𝟏,𝟐 =𝟕.𝟐𝟕𝟑𝟑𝟏𝐄− 𝟎𝟓 + 𝟑.𝟔𝟑𝟔𝟓𝟏𝐄− 𝟎𝟓 + 𝟕.𝟐𝟕𝟑𝟑𝟏𝐄− 𝟎𝟓
𝟑
± 𝟐
𝟑 (𝟕.𝟐𝟕𝟑𝟑𝟏𝐄− 𝟎𝟓 − 𝟑.𝟔𝟑𝟔𝟓𝟏𝐄− 𝟎𝟓)𝟐 + (𝟑.𝟔𝟑𝟔𝟓𝟏𝐄− 𝟎𝟓 − 𝟕.𝟐𝟕𝟑𝟑𝟏𝐄− 𝟎𝟓)𝟐 + (𝟕.𝟐𝟕𝟑𝟑𝟏𝐄− 𝟎𝟓 − 𝟕.𝟐𝟕𝟑𝟑𝟏𝐄− 𝟎𝟓)𝟐
𝐄𝟏 = 𝟖.𝟓 𝐗 𝟏𝟎−𝟓 ,𝐄𝟐 = 𝟑.𝟔𝟒 𝐗 𝟏𝟎−𝟓
Principal stress from principal strain
𝐒𝟏 = 𝐌𝐨𝐝𝐮𝐥𝐮𝐬 𝐨𝐟 𝐞𝐥𝐚𝐬𝐭𝐢𝐜𝐢𝐭𝐲
(𝟏 − 𝛍𝟐 )+ (𝐄𝟏 + 𝛍𝐄𝟐)
𝐒𝟏 = 𝟐 𝐗 𝟏𝟎𝟓
(𝟏 − 𝟎.𝟐𝟖𝟐 )+ (𝟖.𝟓𝐗 𝟏𝟎−𝟓 + 𝟎.𝟐𝟖 𝐗 𝟑.𝟔𝟒𝐗 𝟏𝟎−𝟓)
S1 =26.4 MPa.
𝐒𝟐 =𝐌𝐨𝐝𝐮𝐥𝐮𝐬 𝐨𝐟 𝐞𝐥𝐚𝐬𝐭𝐢𝐜𝐢𝐭𝐲
(𝟏 − 𝛍𝟐 )+ (𝛆𝟐 + 𝛍𝛆𝟐)
𝐒𝟐 =𝟐 𝐗 𝟏𝟎𝟓
(𝟏 − 𝟎.𝟐𝟖𝟐 )+ ( 𝟑.𝟔𝟒 𝐗 𝟏𝟎−𝟓 + 𝟎.𝟐𝟖 𝐗 𝟖.𝟓𝐗 𝟏𝟎−𝟓)
S2 = 16.7 MPa.
Von Mises Stress Calculated,
𝐒𝐯𝐦 = (𝐒𝟏𝟐 − 𝐒𝟏 𝐗 𝐒𝟐 + 𝐒𝟐
𝟐)
𝐒𝐯𝐦 = (𝟐𝟔.𝟒𝟐 − 𝟐𝟔.𝟒 𝐗 𝟏𝟔.𝟕 + 𝟏𝟔.𝟕)
Svm= 23.331 MPa
pressure (Bar) E1 E2 S1 (MPa)
0 0 0

© 2017 IJRTI | Volume 2, Issue 8 | ISSN: 2456-3315
IJRTI1708034 International Journal for Research Trends and Innovation (www.ijrti.org) 197
5 8.50E-05 3.64E-05 26.4
10 1.60E-04 1.09E-04 52.26
15 2.30E-04 1.82E-04 78.13
18 3.00E-04 2.13E-04 98.93
20 3.30E-04 2.49E-04 111.9
24 4.20E-04 2.87E-04 137.9
S2 (MPa) experimental von-mises stress
(Svm) (MPa)
FEA von mises stress
(Svm) (MPa)
gap between FEA and
expt. in %
0 0 0 0
16.7 23.129 23.331 0.865033
42.56 48.153 46.662 -3.194966
68.43 73.763 69.993 -5.385887
82.13 91.693 83.992 -9.169359
95.06 104.49 93.33 -11.95381
112.2 126.99 112 -13.38755
Table 10:-principal strain (E), principal stress(S) and von-Mises stresses (Svm), and % gap between experimental and
FEA
For the finding out gap between experimental and FEA Result, I had taken the region on which strain gauges installed at the time
of experimentation. This region shown in below Figure,
Figure 9:- Strain Gauges Region for the 20 bar pressure
4. CONCLUSION
ASME DESIGN ASSESSMENT
1. After doing Design Assessment as per ASME Section VIII Div.2 cast pump trap satisfy all the design criteria. 2. In Cast pump trap utilization factor is 0.7258 as per local failure criteria.
3. For buckling criteria it is seen that for Cast pump trap Load factor is 180.91
4. So from the above both result it is found that model can be optimized.
5. Maximum gap between FEA and Experimental von Mises stresses is 13.387%.Relation between FEA and Experimental
stress with pressure shown in below graph.

© 2017 IJRTI | Volume 2, Issue 8 | ISSN: 2456-3315
IJRTI1708034 International Journal for Research Trends and Innovation (www.ijrti.org) 198
REFFERNCES
[1] Federal energy management program, “steam trap performance assessment Advanced technologies for evaluating the
performance of steam traps”,July 1999
[2] Iranian Ministry of Petroleum, “Engineering standard for process design of steam traps”
[3] V. V. Sobolev, I. G. Proskunov, “Design of standard steam traps” Chemical and Petroleum Engineering, 1973, Volume 9
[4] Sreedevi. K.P. “Analysis of steam traps at process plants”,International journal of engineering sciences & research
technology, Augusts, 2015
[5] BPVC ASME Section VIII Div.2,2013
[6] BPVC ASME Section VIII Div.1,2015
[7] BPVC ASME Section II Part D,2008
[8] John S. Brader, David N. Rocheleau, “Failure analysis and redesign of a pressure powered pump mechanism”, Proceedings of 2001 ASME International Mechanical Engineering Congress and Exposition, New York, NY, November 2001
[9] W. Payten, M. Law, “Estimating the Plastic Collapse of Pressure Vessels Using Plasticity Contours”, International
Journal of Pressure Vessels and Piping, 1998, Pg. No. 529–536
[10] James William Becker Burns &Mcdonnell, “Investigation into the Benefits of Using ASME USA Section VIII Division
2 In Lieu of Division 1 for Pressure Vessel Design”, ASME District F - Early Career Technical Conference Proceedings,
Alabama USA, 2013, Vol. 12
[11] Miguel MattarNeto, “Stress Categorization In Nozzle To Pressure Vessel Connection Finite Element Models”, Pressure
Vessel And Piping Codes And Standards, 2000, Vol. 40.
[12] Hongjun Li, Qiang Ding, “A New Method of Stress Linearization for Design by Analysis in Pressure Vessel Design”,
Applied Mechanics and Materials Publication, 2014, Pg. No. 194-197, Vol. 598
[13] Donald Mackenzie, “A Plastic Load Criterion for Inelastic Design by Analysis”, Journal of Pressure Vessel Technology ASME, February 2006, Vol. 128
[14] Devang Desai, Pruthvish Patel, “A Study on Design by Analysis Approach Accordance to ASME Code”, 5th
International Congress on Computational Mechanics and Simulation, India, December 2014.
[15] A.Th. Diamantoudis, Th. Kermanidis, “Design By Analysis versus Design by Formula of High Strength Steel Pressure
Vessels: A Comparative Study”, International Journal of Pressure Vessels and Piping, 2005, Pg. No. 43–50
[16] Peng-Fei Liu, Jin-Yang Zheng, “Calculations of Plastic Collapse Load Of Pressure Vessel Using FEA”, Journal of
Zhejiang University Science, 2008.
[17] DonatoPassarelli , Robert H. Wands, “Design Of Superconducting Cavities For Linear Particle Accelerators Using
ASME Section Viii, Division 2”, Design-By-Analysis Requirements, Fermi National Accelerator Laboratory, 60510 Batavia, Il,
USA
[18] Y. P. Shah, M.N. Pradhan, “Design of Obround Flange for Pressure Vessel Application by Analytical Method and FEA to Comply With ASME Code”, IJARIIE, 2015, Vol-1
[19] Usman Tariq Murtaza, Mohammad JavedHyder, “Design by Analysis versus Design by Formula of A PWR Reactor
Pressure Vessel”, Proceedings of the International Multiconference of Engineers and Computer Scientists, Hong Kong, 2015, Vol
1
[20] P. B. Gujarati1, D. P. Vakharia, “Implementation of ASME Section VIII Division 2 Edition 2007”, Proc. Of The
International Conference on Advances in Mechanical Engineering, Gujarat, India, August 2009.
[21] Lijing Wen, Chao Guo, “Stress Analysis for Reactor Coolant Pump Nozzle of Nuclear Reactor Pressure Vessel”, Journal
of Applied Mathematics and Physics, 2013, Pg. No. 62-64.
[22] FrodeTjeltaAskestrand, Ove Tobias Gudmestad, “A Comparison Study Of Pressure Vessel Design Using Different
Standards”, OMAE, 2013.
0
20
40
60
80
100
120
140
0 5 10 15 20 25 30
stre
ss (
MP
a)
Pressure (MPa)
experimental von-mises stress (Svm) (MPa)
Pressure Vs FEA stress

© 2017 IJRTI | Volume 2, Issue 8 | ISSN: 2456-3315
IJRTI1708034 International Journal for Research Trends and Innovation (www.ijrti.org) 199
[23] Donald Mackenzie, Duncan Camilleri, “Design by Analysis of Ductile Failure and Buckling In Torispherical Pressure
Vessel Heads”, Thin-Walled Structures Publication, 2008, Pg. No.963–974
[24] T. Schultheiss, J. Rathke, “CESR-Type SRF Cavity - Meeting The ASME Pressure Vessel Criteria By Analysis”,
Proceedings Of 2011 Particle Accelerator Conference, New York, USA.
[25] AhmetErklig and M. AkifKütük, “Experimental Finite Element Approach for Stress Analysis”, Hindawi Publishing
Corporation Journal of Engineering, 22014. [26] Dr. M. M. Patil, Dr. LokeshBajpai, “Design, Analysis and Experimental Verification of Torispherical Head and
Toriconical Bottom Pressure Vessel”, - International Journal of Innovative Science, Engineering & Technology, December 2014.
[27] Dilip M. Patel, “Experimental Analysis of Pressure Vessel”, International Journal of Engineering Research &
Technology, September- 2014,
[28] Ahmed Ibrahim, YeongRyu, “Stress Analysis of Thin-Walled Pressure Vessels”, Modern Mechanical Engineering, 2015.