Embed Size (px)
Citation preview

Graduate Theses, Dissertations, and Problem Reports
2008
Design and testing of an independently controlled urea-SCR Design and testing of an independently controlled urea-SCR
system for marine diesel applications system for marine diesel applications
Derek Johnson West Virginia University
Follow this and additional works at: https://researchrepository.wvu.edu/etd
Recommended Citation Recommended Citation Johnson, Derek, "Design and testing of an independently controlled urea-SCR system for marine diesel applications" (2008). Graduate Theses, Dissertations, and Problem Reports. 1909. https://researchrepository.wvu.edu/etd/1909
This Thesis is protected by copyright and/or related rights. It has been brought to you by the The Research Repository @ WVU with permission from the rights-holder(s). You are free to use this Thesis in any way that is permitted by the copyright and related rights legislation that applies to your use. For other uses you must obtain permission from the rights-holder(s) directly, unless additional rights are indicated by a Creative Commons license in the record and/ or on the work itself. This Thesis has been accepted for inclusion in WVU Graduate Theses, Dissertations, and Problem Reports collection by an authorized administrator of The Research Repository @ WVU. For more information, please contact [email protected].

i
Design and Testing of an Independently Controlled Urea-SCR System for Marine
Diesel Applications
by
Derek Johnson
Thesis submitted to the College of Engineering and Mineral Resources at West Virginia University
in partial fulfillment of the requirements for the degree of
Master of Science in
Mechanical Engineering
Approved by
Dr. Nigel Clark, Committee Chairperson Dr. Scott Wayne Dr. Hailin Li
Mechanical and Aerospace Engineering Department
Morgantown, West Virginia 2008
Keywords: Urea-SCR, NOx Reduction, Marine Diesel Copyright 2008 Derek Johnson

ii
Abstract
Design and Testing of an Independently Controlled Urea-SCR System for Marine
Diesel Applications
Derek Johnson
Diesel engine emissions for on-road, stationary and marine applications are regulated through new EPA standards. The most difficult species of exhaust gas constituents to reduce are oxides of nitrogen, NOx. The use of urea selective catalytic reduction (SCR) is promising for NOx abatement as a retrofit application. This work focused on the reduction of NOx by use of a stand alone urea injection system, applicable to marine diesel engines. Most current systems communicate with engine controls to predict NOx emissions based on signals such as torque and engine speed. Many marine engines employ mechanical injection technology and lack communication abilities. This system estimated NOx and measured exhaust flow independent of engine parameters. The system used independent exhaust sensor inputs to estimate NOx levels and exhaust gas flow rate. These sensor inputs were used in an independent controller and an open loop model to estimate the necessary amount of urea needed. The controller then used pulse width modulation (PWM) to power an automotive style injector for urea delivery. The goal of this work was to reduce the engine out NOx levels by 50 percent. Emissions tests were conducted at the West Virginia University’s Engine Research Center. The data were analyzed to determine the NOx reduction ability of the system. NOx reduction capabilities of 41-67% were shown on the Non Road Transient Cycle (NRTC) and ICOMIA E5 Steady State cycles. The system was optimized during testing to minimize the dilute ammonia slip to cycle averages of 5-7 ppm. The goal of 50% reduction of NOx can be achieved dependent upon cycle. Further research with control optimization and possible use of oxidation catalysts is recommended to further improve the systems NOx reduction capabilities while minimizing ammonia slip.

iii
Dedication
This thesis is dedicated to my parents, my family, my friends and my girlfriend; they
have all supported me and told me I could do whatever I sought to do in life. It may be
odd but I would lastly like to dedicate this to the old family dog Frannie. Even though she
is no longer with us, she will always be in our hearts. She had the ability to bring people
together and show everyone that what mattered most were the small things in life.

iv
Acknowledgements
I thank my advisor, Dr. Nigel Clark, for his support from my days in Challenge X
to accepting me as a graduate student for this research. I would also like to thank my
other committee members, Dr. Scott Wayne and Dr. Hailin Li for their time.
I would like to thank the staff of the MAE machine shop for their assistance, as
well as Dave McKain for his assistance and input during testing at the laboratory. I would
also like to thank everyone at MJ Bradley & Associates for funding this research. I am
also grateful for the support, donated materials and knowledge of companies which
allowed me to use their products. The preparation of this thesis is based on work
supported by the State of Texas through a Grant from the Texas Environmental Research
Consortium and the Texas Commission on Environmental Quality and I thank them for
their support.
I would like to thank my parents, Clark and Brenda Johnson for always being
supportive of my engineering endeavors. They have always had words of encouragement
throughout the past six years. Thank you for dealing with me through all of the reports
and finals.
I would like to thank all of those friends that I have had the chance to know along
this road of life, and Jared Moore, whose road ended too soon.
I never participated in sports in my youth, but I finally found my team in
engineering. I am grateful for my undergraduate and graduate experiences, both good and
bad, with the Challenge X team. I would like to mention those who have walked the road
with me the past six years: Ben Smith, Howard Mearns, DJ Lenhart, Colin Hultengren,

v
Clint Beddick, Josh Lantz, Jim Davis and the 2006/2007 team members. I have grown
with these friends over the past few years to become the person I am today.
I would also like to thank Jeremy Sigley for the past 12 years. From working on
cars in our yards during high school to becoming the best engineers of tomorrow. The
stories we have could have filled this thesis alone. It has been one hell of ride the past 12
years and I hope that we continue to ride life for all its worth in the years to come.
I would finally like to thank my newest engineering peer friend, Melissa. She has
stroked my ego like no other, and I think that’s what allows me to continue on this path
today. I am so thankful that you were there through all of these graduate years. I wouldn’t
have had it any other way. I love you. If I could stop time, I would stop it now and share
forever with you and everyone mentioned in this thesis. I am so thankful to have
everyone walking along side me down the road of life.

vi
Table of Contents
Design and Testing of An Independently Controlled Urea-SCR in Marine Applications .. i
Abstract ............................................................................................................................... ii
Dedication...........................................................................................................................iii Acknowledgements.............................................................................................................iv
Table of Contents................................................................................................................vi
Table of Figures...................................................................................................................x Table of Tables.................................................................................................................xiii Nomenclature................................................................................................................. xivv
1 Introduction...................................................................................................................... 1
1.1 Objectives ......................................................................................................... 1
1.2 Diesel Engines and Emissions .......................................................................... 2
1.3 Health and Environmental Effects .................................................................... 2
1.4 Diesel Engine Regulations................................................................................ 3
1.5 Emissions Reduction Technologies .................................................................. 4
1.6 LNT................................................................................................................... 5
1.7 Hydrocarbon SCR............................................................................................. 6
1.8 Urea SCR .......................................................................................................... 7
1.9 Fundamental Hardware..................................................................................... 8
1.10 Advantages and Disadvantages..................................................................... 12
2 Literature Review........................................................................................................... 14
2.1 Improved SCR Systems for Heavy Duty Diesel Engine Applications ........... 14
2.2 Development of Urea DeNOx Catalyst Concept for European Ultra-Low
Emission Heavy-Duty Diesel Engines..............................................................................14

vii
2.3 Urea-SCR Catalyst System Selection for Fuel and PM Optimized Engines and
Demonstration of a Novel Urea Injection System ............................................................ 15
2.4 RJM Corporation (Production Systems)......................................................... 16
2.5 Off-Highway Exhaust Gas After-Treatment: Combining Urea-SCR, Oxidation
Catalysis and Traps ........................................................................................................... 17
2.6 Thick Film ZrO2 NOx Sensor for the Measurement of Low NOx
Concentration.................................................................................................................... 17
2.7 Development of Urea-SCR for Heavy-Duty Trucks Demonstration Update .. 18
2.8 The Development and Performance of the Compact SCR-Trap System: A 4-
Way Diesel Emission Control System.............................................................................. 18
2.9 Development of Urea-SCR System for Heavy-Duty Commercial Vehicles .. 19
2.10 Simulation on the Optimum Shape and Location of Urea Injector for Urea-
SCR System of Heavy-duty Diesel Engine to Prevent NH3 Slip...................................... 20
2.11 Diesel Emission Control Technology –2003 in Review............................... 20
3 System Configurations and Hardware ........................................................................... 22
3.1 System Controller ........................................................................................... 22
3.2 Urea............................................................................................................... 244
3.3 Urea Storage Tank, Lines and Fittings............................................................25
3.4 Injector and Fuel Pump................................................................................... 26
3.5 Thermocouple and Transmitter....................................................................... 27
3.6 Pressure Sensors.............................................................................................. 28
3.7 Pitot Tubes ...................................................................................................... 29
3.8 Injector Mount and Standoff Tube.................................................................. 30

viii
3.9 NOx Sensor..................................................................................................... 32
3.10 Flow Section ................................................................................................. 33
3.11 Catalyst ......................................................................................................... 35
3.12 Complete Bench System............................................................................... 37
4 System Model and Control Logic ..................................................................................39 4.1 Inputs........................................................................................................................... 42
4.1.1 CAN/NOx Sensor ........................................................................................ 42
4.1.2 Differential Pressure Sensor ........................................................................ 43
4.1.3 Absolute Pressure Sensor............................................................................. 44
4.1.4 Temperature Sensor ..................................................................................... 45
4.2 Other Subsystems........................................................................................................ 45
4.2.1 Main Power Relay........................................................................................ 45
4.2.2 Temperature Conversion for Ideal Gas Law................................................ 46
4.2.3 Calculation of NOx...................................................................................... 47
4.2.4 Urea Rate Calculation .................................................................................. 50
4.2.5 Boolean Switch Logic.................................................................................. 51
4.2.6 Secondary Subsystem for Temperature Estimation..................................... 52
4.3 Output ......................................................................................................................... 54
4.3.1 Duty Cycle for Urea Injector ....................................................................... 54
5 System Testing................................................................................................................55 5.1 Test Engine Information..................................................................................55 5.2 Test Cell Information.......................................................................................56 5.3 Test Cycles.......................................................................................................57

ix
6 Test Results.....................................................................................................................61 6.1 System Correlation Results..............................................................................61 6.2 NRTC with varied Duty Cycle........................................................................70 6.3 ICOMIA E5 with 50% Duty Cycle..................................................................76 7 Conclusion and Recommendations.................................................................................81 References..........................................................................................................................84 Appendix A........................................................................................................................87

x
Table of Figures
Figure 1.1 Typical Diesel Exhaust System..........................................................................9
Figure 1.2 Possible Exhaust System Components.............................................................10
Figure 1.3 Project Design Components.............................................................................12
Figure 3.1 MotoHawk 80-Pin Controller and Wiring Harness..........................................24
Figure 3.2 Automotive SCR Grade Urea...........................................................................25
Figure 3.3 Urea Storage Tank with Fuel Line and Pressure Gauges.................................26
Figure 3.4 Injector with Upper and Lower Mounts Attached to Stainless Steel Standoff
Tube...................................................................................................................................31
Figure 3.5 Differential Pressure for Various Diameter Flow Tubes.................................35
Figure 3.6 Flow and pressure drop across the catalyst......................................................37
Figure 3.7 System for Bench Test......................................................................................38
Figure 4.1 Complete System Model as Viewed in Simulink.............................................40
Figure 4.2 100ms Foreground Model Layout....................................................................41
Figure 4.3 Standard MotoHawk CAN Read and Send Message Blocks...........................42
Figure 4.4 Differential Pressure Subsystem with Analog Input and PSI Output...............44
Figure 4.5 Absolute Pressure Subsystem in the Simulink Environment...........................45
Figure 4.6 Temperature Subsystem in Simulink...............................................................45
Figure 4.7 Main Power Relay Subsystem for Software Control of System......................46
Figure 4.8 Conversion From Celsius to Rankine and Gas Constant for Air......................47
Figure 4.9 NOx Mass Flow Rate Estimation Subsystem...................................................50
Figure 4.10 Subsystem to Convert NOx Rate into Injector Duty Cycle............................51
Figure 4.11 Software Switch for Lower Temperature Limit for Urea Injection...............52

xi
Figure 4.12 Temperature Estimation Subsystem to Account for Thermal Inertia...........53
Figure 4.13 Motohawk PWM Output for Urea Injector...................................................54 Figure 5.1 Engine Map for John Deere engine..................................................................55 Figure 5.2 Test Cell Set Up Showing, Urea Injection System, SCR catalyst, John Deere Engine and Test Cell Dynamometer..................................................................................57 Figure 5.3 NRTC Engine Speed and Torque Set Points....................................................58 Figure 5.4 Engine Speed for ICOMIA E5 Cycle...............................................................59 Figure 6.1 EcoPhysics and Siemens NOx Sensor Comparison for NRTC cycle..............62 Figure 6.2 Correlation of Siemens NOx Data with Respect to EcoPhysics NOx Data.....63 Figure 6.3 9-Pt Average of NOx Readings from EcoPhysics and Siemens NOx Sensor..64 Figure 6.4 Correlations of the Two Data Sets with a 9-Pt Average..................................65 Figure 6.5 Comparison of Flow Tube and LFE for NRTC................................................66 Figure 6.6 Correlation of Flow Tube Against Intake LFE.................................................66 Figure 6.7 Temperature Plot for EERL and UIS Thermocouple Outputs.........................67 Figure 6.8 NOx Comparisons for the EcoPhysics and Siemens Sensor During the ICOMIA E5 Cycle.............................................................................................................68 Figure 6.9 Flow Comparison of LFE and UIS Flow Tube for ICOMIA E5 Cycle...........69 Figure 6.10 Temperature Plot for EERL and UIS Thermocouple Outputs for ICOMIA E5 Cycle..................................................................................................................................69 Figure 6.11 Run to Run Reduction in NOx (ppm) Based on Varied Duty Cycle..............71 Figure 6.12 Urea Injection Rate Based on DC Requested and Flow Tube Temperature..72 Figure 6.13 NRTC CO Emissions for Various Cycles with and Without Urea Injection.............................................................................................................................73 Figure 6.14 Dilute Ammonia Levels for NRTC 100% DC...............................................74 Figure 6.15 NRTC with 50% DC NOx Results and Continuous Reduction Percentage...75

xii
Figure 6.16 Dilute Ammonia Results for NRTC with 50% DC........................................75 Figure 6.17 ICOMIA E5 Test Results with NOx Reduction Percentage for 50% DC......77 Figure 6.18 Dilute Ammonia Slip Results for E5 50% DC...............................................78 Figure 6.19 E5 Carbon Monoxide Results.........................................................................79

xiii
Table of Tables
Table 1.1: Tier 2 Standards for Marine Diesel Engines ..................................................... 4 Table 3.1: Typical Physical Properties of 32.5% Aqueous Urea Solution: DeNOx Grade Meets Specifications of DIN 70070:2005 and ISO 22242-1:2005 for NOx Abatement Technologies……………………………………………………………………...……...24 Table 3.2: Pressure Ranges for Maximum Flow of 2000 CFM and Minimum Flow of 150 CFM. ................................................................................................................................. 34 Table 5.1: ICOMIA E5 Cycle Mode Data and Set Points.................................................59
Table 6.1: ICOMIA E5 Mode by Mode Data....................................................................80

xiv
Nomenclature
ARIS Advanced Reagent Injection System
CAN Controller Area Network
CARB California Air Resource Board
CO Carbon Monoxide
CO2 Carbon Dioxide
cpi cells per square inch
CR-DPF Continuously Regenerating Diesel Particulate Filter
ºC Degrees Celsius
DOC Diesel Oxidation Catalyst
DPF Diesel Particulate Filter
ECU Engine Control Unit
EGR Exhaust Gas Recirculation
EPA Environmental Protection Agency
ESC European Stationary Cycle
FTP Federal Test Procedure
g/bhp-hr grams per brake horsepower hour
g/kWh grams per kilowatt hour
HC Hydrocarbons
HCNO Isocyanic Acid
HDDE Heavy Duty Diesel Engine
hp horsepower
H-SCR Hydrocarbon Selective Catalytic Reduction
H2O Water

xv
ICCT International Council On Clean Transportation
K Temperature in Kelvin
kW kilowatt
L liters of displacement
LNT Lean NOx Trap
NH3 Ammonia
NOx Oxides of Nitrogen
NO Nitrogen Monoxide
NO2 Nitrogen Dioxide
N2 Diatomic Nitrogen
O2 Diatomic Oxygen
PM Particulate Matter
ppm parts per million
SCR Selective Catalytic Reduction
TDC Top Dead Center
WVU West Virginia University
ZrO2 Zirconium Oxide

1
1 Introduction
Diesel engines are known for their durability and high fuel economy. They are
used in small displacement generators and light duty automotive applications all the way
up to heavy duty trucks, machinery and marine applications. Their longevity and power
makes them perfect for marine applications where the vessels may be in service for thirty
years or more. Diesel engines, especially older diesel engines, produce substantial
regulated pollutants. These include oxides of nitrogen (NOx), particulate matter (PM),
hydrocarbons (HC) and carbon monoxide (CO). This research focused on the reduction
of NOx from diesel engines in marine applications. The vessels targeted were in the
Environmental Protection Agency’s (EPA) C1 marine class. The displacement of C1
engines was up to 5 liters per cylinder. Engines indicative of C1 class were used for
testing. However, the technology developed may be adapted for use in all arenas of diesel
engine applications. The emission reduction system of this project was a urea SCR
exhaust after treatment system. Following is a review of technologies that reduce the
regulated emissions from diesel engines as well as an in depth review of the current state
of SCR applications.
1.1 Objectives
The objective of this research was to design, implement and test a urea injection
system applicable to marine diesel applications. The goal was to reduce the NOx levels at
the stack by 50% while minimizing or preventing ammonia slip. The system was to be
stand-alone, in that it was not to communicate with the engine. The system was also to be
independently controlled, so as to be applicable to any marine engine without intensive
engineering per application.

2
1.2 Diesel Engines and Emissions
Diesel engines may be found in a variety of applications and various states of
technology due to their longevity. The engines are powered by diesel fuel that is injected
electronically or mechanically into the cylinder near top dead center (TDC). The high
compression ratio of the engines, on the order of 15:1 or greater, auto ignites the fuel
charge. These engines may be naturally aspirated or turbocharged. Diesel engines may be
on the order of 35-50% more efficient than gasoline engines of similar sizes due to
throttling at part load operation (1). This high efficiency comes from their high thermal
efficiencies, constant pressure heat addition and the complete combustion of diesel.
However, these engine characteristics lead to unwanted and harmful emissions. The high
compression leads to combustion temperatures above 2000K. Above this level,
dissociation of diatomic nitrogen into monatomic nitrogen occurs. This monatomic
nitrogen combines with oxygen to form NOx. The lean burn also leads to excess oxygen
and with localized incomplete combustion still occurring, carbon monoxide forms.
Partially oxidized hydrocarbons from the fuel and from engine lubricants lead to
hydrocarbon and PM emissions (2).
1.3 Health and Environmental Effects
Health and environmental effects of diesel exhausts have been studied for
decades. Health problems range from acute responses to chronic effects from long term
exposure. Acute exposure to diesel exhaust may cause irritation of the eyes, nose, throat
and neurological effects such as lightheadedness: while, long term exposure may cause
chronic lung inflammation. Studies have shown that some exhaust constituents may be
carcinogenic (3). Diesel emissions also negatively influence the environment. Oxides of

3
nitrogen contribute to smog and acid rain (4). Due to these negative health and
environmental effects, regulations have decreased the allowable production of regulated
emissions.
1.4 Diesel Engine Regulations
Due to the effects on health and ambient air quality, diesel emission regulations
continue to become stringent. New standards have been enacted in America to meet
various Environmental Protection Agency (EPA) Tier and Bin levels. Similar systems of
regulations occur in Europe with Euro emissions standards. On-road diesel regulations
decreased emissions in 2007 and will do so again in 2010. Stringent marine regulations
have also followed suite. The currently regulated emissions from diesel engines are NOx,
PM, CO and HC. The marine emissions levels for C1 engines with displacements of 0.9
to 1.2 liters per cylinder were lowered to 7.2 g/kW-hr for HC+NOx in 2004. The
California Air Resources Board (CARB) has projected that without new regulations for
marine diesel engines, their emissions would account for 9% of NOx and 25% of PM
statewide for California (5). The International Council on Clean Transportation (ICCT)
has released reports stating that air pollution from ships has overtaken all produced by
road traffic. Ocean going ships produce 17% of the total NOx, which can jump to 25% in
most port cities (6). While it may be difficult to lower emissions from international ships
in port cities, offsetting the emissions levels by using new technologies on passenger
ferries and local tugboats would help. Table 1 shows the Tier 2 emissions standards for
engines covering the marine applications of ferries and tugboats. These standards applied
to new engines only and the research conducted was to apply to older engines as retrofit
applications.

4
Table 1.1: Tier 2 Standards for Marine Diesel Engines (7)
Category
Displacement (liter/cylinder)
Power (kW)
Tier 2 Model Year
HC+NOx (g/kW-hr)
PM (g/kW-hr)
CO (g/kW-hr)
Small
- - -
<8 kW 8≤kW≤19 8≤kW≤19
2005 2005 2004
7.5 7.5 7.5
0.80 0.80 0.60
8.0 6.6 5.5
Commercial C1
disp. <0.9 0.9≤disp.<1.2 1.2≤disp.<2.5 2.5≤disp.<5.0
≥37kW - - -
2005 2004 2004 2007
7.5 7.2 7.2 7.2
0.40 0.30 0.20 0.20
5.0 5.0 5.0 5.0
C2 5.0≤disp.<15 15≤disp.<20 15≤disp.<20 20≤disp.<25 25≤disp.<30
- <3300kW ≥3300kW - -
2007 2007 2007 2007 2007
7.8 8.7 9.8 9.8 11.0
0.27 0.50 0.50 0.50 0.50
5.0 5.0 5.0 5.0 5.0
Recreation C1 disp. <0.9 0.9≤disp.<1.2 1.2≤disp.<2.5 2.5≤disp.<5.0
≥37kW ≥37kW ≥37kW ≥37kW
2007 2006 2006 2009
7.5 7.5 7.2 7.2
0.40 0.30 0.20 0.20
5.0 5.0 5.0 5.0
1.5 Emissions Reduction Technologies
There are many options in emissions reduction technologies to apply to marine
diesel engines. Many engines have been in service for 30 years; EPA modeling reports
show the estimated engine life for marine engines of testing size to be 7,000 hours at
maximum power (8). Depending upon service, the engine life before rebuild can become
substantial. West Virginia University previously tested emissions reduction systems on
the Alice Austen Ferry in New York. With a commission date of 1986, the vessel and its
Caterpillar engines have been in service for over 20 years (9). Engines of this era and
older do not use many of the new technologies that allow for lower emissions.
Electronically controlled fuel injection, exhaust gas recirculation (EGR), lower fuel sulfur
content and water injection systems are technologies that may be implemented to reduce
NOx emissions significantly. These methods are difficult to employ because of the

5
necessary down time of the engines. These systems also have large cost penalties
associated with physical engine rebuild or retrofit. The Carl Moyer Program is a financial
assistance program in California that helps owners of older diesel engines to rebuild or
replace them with Tier 2 engines (10). This program has helped to make 190 vessels
cleaner burning using a variety of technologies but is only applicable to California.
Similar incentives have also been implemented else where such as the Texas Emissions
Reduction Plan (TERP) (11).
Without large scale assistance programs and the need to minimize downtime,
stand-alone exhaust after treatment systems are a more attractive technology. NOx
reduction after-treatment methods include, but are not limited to, the following: lean NOx
traps (LNT), hydrocarbon selective catalytic reduction (H-SCR) and urea selective
catalytic reduction (urea-SCR). Each of these systems may be used in conjunction with
other emissions control devices such as diesel oxidation catalysts (DOCs) or diesel
particulate filters (DPFs). Urea SCR was chosen for the reduction system for this
research. A brief discussion follows on LNT and H-SCR systems including their
downfalls.
1.6 LNT
Lean NOx traps are made of a honeycomb system that contains a precious metal
such as platinum. The function of the precious metal is to oxidize the engine out NO to
NOx. Another pivotal component of the LNT is an alkali metal salt that is used to form
and store a nitrate during the common lean burn scenario of the diesel cycle. NOx is not
easily oxidized in the O2 rich environment. If the engine is run in a rich burn mode or
secondary injection of fuel into the exhaust occurs, the nitrate releases the NOx that is

6
then reduced to N2 and H2O (2). Diesel engines run lean to produce their power, torque
and efficiency. Therefore, in order for the LNT to work, an engine ECU or other
controller must inject more fuel for a given time to create rich burn conditions allowing
the oxidation of NO2. This condition creates a fuel penalty. A study done on a 1.7L A170
engine at Argonne National Laboratory showed NOx conversion efficiency
approximately 89 percent with a fuel penalty of just over 11 percent (1). These numbers
are promising for LNT technology but mainly for light duty applications as tested. A fuel
penalty on the order of 10 percent would be too costly to implement in marine
applications. LNTs are highly sensitive to the sulfur content of fuels. Conversion
efficiency drops with both catalyst aging and increasing sulfur content (12).
1.7 Hydrocarbon SCR
Hydrocarbon SCR (H-SCR) systems use a hydrocarbon fuel such as ethanol to
reduce NOx emissions. This system requires a secondary injection system for the ethanol
injection into the exhaust system. The catalyst is alumina supported, highly loaded with
silver. At temperatures in the range from 350-400 ºC, the ethanol quickly converts to
acetaldehyde for NOx reduction. Conversion efficiencies for such systems have been as
high as 80-90 percent. This system’s fuel penalty is approximated at about two to three
percent, significantly lower than the penalty for a LNT. A disadvantage of an H-SCR
system is the increased HC emissions slipping past the catalyst. This problem is
addressed with the use of catalyzed diesel particulate traps. Oakridge National
Laboratories and Caterpillar conducted tests on a Cummins ISB 5.9 liter engine used in
light duty trucks. The test showed NOx conversion efficiency as high as 95 percent.
However, as catalyst core temperatures dropped to 250ºC the converter efficiency fell to

7
25 percent. Further research must be done in the area of HC-SCR before it can reach the
wide range of efficiencies achieved by urea SCR (13).
1.8 Urea SCR
Selective catalytic reduction systems utilizing urea as a reducing agent are one of
the most promising means of meeting the new stringent diesel emissions standards. When
compared to other reduction methods, urea-SCR shows substantial NOx reduction and a
wider operational temperature range (14). Urea SCR systems have been used on
stationary power plant applications for years. This stationary technology now faces the
challenge of becoming a mobile, transient application.
The main goal of the system is to reduce NOx by ammonia injection. SCR
catalyst cores are made of mainly metal zeolite compounds. Research is also being done
with combined catalysts. These compounds react with ammonia to convert NOx into N2
and H2O. The reducing agent solution is eutectic with 32.5 percent urea in water (15).
The ammonia needed for the reaction comes from the high temperature hydrolysis of urea
with the exhaust flow. The equation for hydrolysis is given below and yields both
ammonia (NH3) and isocyanic acid (HCNO). The second equation shows the further
reduction of HCNO with water vapor in the exhaust.
( )NH CO NH HCNO2 2 3→ + Equation 1
232 CONHOHHNCO +→+ Equation 2
The majority of these systems utilize an upstream oxidation catalyst to optimize
the NO2 /NO ratios. Once this ratio is optimized, three main equations describe how the
urea SCR works to reduce NOx. They are:

8
OHNNHNO 2232 12786 +→+ Equation 3
OHNONONH 2223 6444 +→++ Equation 4
OHNNONONH 2223 64224 +→++ Equation 5
As can be seen from the last equation, the NO2/NO ratio is pivotal because this reaction
occurs at a rate ten times faster than the second, converting as much NO as NO2 (16).
Typically NO constitutes 90% of the NOx level while NO2 is 10% or less. When
hardware and control are properly sized and optimized urea SCR systems can achieve
NOx reduction efficiencies greater than 90 percent. Therefore the physical design and
implementation are important to ensure that the fundamental chemistry dominating a urea
SCR system can occur.
1.9 Fundamental Hardware
The exhaust systems of heavy duty diesel applications are usually similar when
not equipped with after treatment devices. The components of a simple diesel exhaust
system are show in Figure 1.1. The exhaust exits the cylinders into the exhaust manifold.
From the manifold it flows through the exhaust-gas turbine and then exits into an exhaust
piping system. The main component post turbocharger is the sound attenuator. After the
sound attenuators, there may be more exhaust piping used to direct exhaust flow from the
vehicle or into the water for marine applications.

9
Figure 1.1 Typical Diesel Exhaust System
The hardware that forms the after-treatment system for a typical urea SCR system
is complex. Most urea SCR systems utilize a DOC before the injection plane, an injector,
urea storage and delivery system, air supply for system purging, catalyst, sensors, post
oxidation catalyst for ammonia slip, and a controller that typically communicates with the
ECU. The controller of these systems often looks at broadcast engine speed, load, or
mass air flow to help determine a NOx map. With these parameters the system should be
able to inject the proper amount of urea into the exhaust flow. A downfall of this system
is the inability to apply it to retrofit applications where mechanical injection occurs and
intensive engineering per application would be necessary. Figure 1.2 shows the
components of a urea SCR system. The sensors block may contain temperature sensors
and pressure sensors for flow and system fail safes.
The exhaust flows from the turbocharger through the first diesel oxidation catalyst
(DOC). This catalyst can reduce both HC and CO emissions as well as help to optimize
the NOx ratio. The exhaust then flows past sensors which are typically temperature
sensors used to detect when the exhaust is hot enough for urea injection. Other sensors
may be used to monitor pressure in case of plugging of components by particulate matter.
Once the system temperature is above the threshold, the urea control unit initializes the
injection algorithm. The amount of urea injected corresponds to internal maps that are

10
based on communication with the engine control unit. The urea is delivered into the
exhaust by a dosing pump or injector. The urea has a separate storage and pumping
system. It is also common that an air supply is plumbed to help purge the system. This
purging helps remove urea crystals and liquid urea from the system. After urea is injected
it becomes ammonia and flows to the main catalyst of the urea-SCR. This is where most
of the NOx reduction occurs. However, if the system becomes saturated from over dosing
and surpasses the catalyst storage capacity then ammonia may slip through the catalyst.
In this case, another clean-up catalyst oxidizes any of the slipped ammonia. Clean-up
catalysts may use platinum (Pt) to yield high conversion (99%) of any slipped NH3 to N2
at low exhaust temperatures (17). Then the “cleaner” exhaust typically flows to the
atmosphere.
Figure 1.2 Possible Exhaust System Components
The design below is for a novel stand alone system. The design is a broad
overview of the system that was developed in this research. The design was chosen for

11
simplicity and ease of retrofit applications. This research was done to examine the
effectiveness of such a system and make conclusions on its design and function. Many
designs for urea SCR systems can be made that fall between this system and the
previously discussed system.
The system under consideration will not communicate with an ECU. The exhaust
flows from the turbine into the exhaust pipe. The system tested eliminated the DOC
before and after the main catalyst. The benefit of their exclusion saved cost and volume.
The sensors for this system included a thermocouple and pressure transducers. These
were used to calculate the exhaust flow since intake flow will not be used from the ECU.
The design also included a NOx sensor placed in the exhaust to measure the NOx levels.
Once the urea SCR system temperature threshold has been met, the urea control unit
would initialize the injection algorithm. This system utilized corrosive resistant tubes,
tanks and pumps. A continuous pump system was used to supply the injector with urea at
all times. This system did not utilize an air purging system. In tugboat and ferry class
marine vessels air supplies are sparse at best. After the exhaust flowed from the injection
plane, it traveled through the main catalyst where NOx reduction occurred. The flow then
exited the exhaust system as previously described.
The project hoped to demonstrate 50% or greater NOx reduction. Fully integrated
and highly controlled systems have shown 70-90% or greater NOx reduction. The goal of
50% was introduced because to achieve this amount of reduction; the system can be
smaller in volume, lowering cost, applied to a wide range of applications and prevent
ammonia overflow. Because of the low reduction goal, the likelihood for ammonia slip
decreased due to the lower ammonia concentration. The cost could also be decreased

12
significantly if pre-oxidation and post-oxidation catalysts were not needed to achieve the
target goals.
Figure 1.3 Project Design Components
1.10 Advantages and Disadvantages
The goal of this research was to verify that the system would work properly and
examine the NOx reduction efficiency. The system was to reduce NOx levels by 50%
while minimizing ammonia slip. The system would also need to be easily implemented
and calibrated for broad applications. These applications included the ability to endure
sustained cycles at temperatures at or greater than 400º C, measure raw NOx levels of
greater than 500 ppm, operate over indicative marine cycles without injection failure and
measure exhaust mass flow accurately. The system tested had both advantages and
disadvantages. The main advantages were ease of installation, fewer parts to fail, low cost
and ruggedness. However, the main disadvantage was lower NOx reduction ability, due
to lack of ECU communication and conservative dosing strategy. High NOx reduction
was not the goal of the research or project. The goal was to design and test a rugged

13
system that provided substantial NOx reduction while minimizing ammonia slip. The
system was to be novel in design and stand alone. It was to possess the ability to be
scaled to a variety of common applications without the various wiring or communications
problems. The system above was tested in West Virginia University’s (WVU’s) Engines
and Emissions Research Laboratory. The subsequent sections provide details on the
design, set up and testing. It also contains the test results, comments and conclusions.

14
2 Literature Review
This section contains a review of literature from various sources in the area of
mobile urea SCR applications. The work discussed was found in technical papers from
independent companies, research universities and national laboratories.
2.1 Improved SCR Systems for Heavy Duty Diesel Engine Applications
Engineers at Degussa-Huls AG performed both gas bench and engine bench tests
on a urea SCR system (18). Variables such as catalyst type, size, temperature and gas
compositions were examined as well as their effects on NOx conversion. The results
showed that NOx conversion was increased below 300ºC when a pre-oxidation catalyst
was used. This was due to a higher NO2/NO ratio. Gas bench tests also showed that with
a controlled increase in hydrocarbons showed no effect on the NOx reduction of the
given catalyst. Engine bench tests were run using a 4.0L heavy duty turbo-charged direct
injection diesel engine as well as a 2.5L DI TCI passenger vehicle. Results of these tests
showed no negative impact on SCR catalyst aging; however, some deactivation was
noted on the pre-oxidation catalyst. The diesel used in engine tests contained 230 ppm of
sulfur. The best NOx conversions occurred in stages where catalyst temperatures were
above 300ºC. Overall, it was found that with a “rude” constant urea injection system NOx
conversion of above 70% could be obtained. It is also important to note that it was found
that a decrease in catalyst volume of 50% resulted in only a 10% NOx reduction penalty.
2.2 Development of Urea DeNOx Catalyst Concept for European Ultra-Low
Emission Heavy-Duty Diesel Engines
TNO Road-Vehicles Research Institute from the Netherlands designed and tested
a DeNOx catalyst on a 12 liter Euro 2 engine and reported their results in 1995 (19).

15
Catalysts were provided by Johnson Matthey. Both the oxidation and SCR catalysts were
400 cells per square inch (cpi). For their testing the oxidation catalyst was placed post
SCR to ensure the oxidation of any slipped ammonia. This system utilized engine speed
and load to form NOx engine maps. The highest conversion efficiencies occurred
between 300 and 400ºC. In this region 85-90% reductions occurred. Transient tests were
performed and the thermal inertia of the catalyst system was examined. It was found that
it took significant time for the catalyst to reach the 300ºC light off temperature after
temperature sensors showed 300ºC exhaust temperature. However, it was shown that this
could also be used as an advantage since urea injection could occur longer as the catalyst
cools to below 300ºC, allowing for buffer. The most significant conclusion was that the
DeNOx system was capable of reducing steady state NOx emissions from 7.5g/kWh to
2.5 g/kWh and transient levels from 6.5 g/kWh to 2.6 g/kWh with average tailpipe
ammonia emissions on the order of 3 parts per million (ppm).
2.3 Urea-SCR Catalyst System Selection for Fuel and PM Optimized Engines and
Demonstration of a Novel Urea Injection System
This paper focused on the testing of various catalysts configurations and sizes in
order to meet Euro V levels (20). The tests included configurations with pre- or post-
oxidation catalysts. The SCR catalyst volume was varied between 15, 30 and 45 liters.
The SCR system was applied to the exhaust from a 12 liter 400 hp HDDE that was
certified to meet Euro II standards without any after treatment. The system utilized a
digital dosing pump and control unit. The control unit collected data from NOx sensors,
O2 sensors, temperature sensors and engine intake air flow sensors. This was similar to
the current design in that it did not rely on engine speed or load. The tests showed high

16
conversion efficiency when using oxidation catalysts and a 45 liter SCR catalyst.
However, the combination of 15 liter pre-oxidation catalyst with 15 liter DeNOx catalyst
achieved 83.5% reduction with an ammonia slip of only 3 ppm. It was decided that the
best scenario would be to increase the cell density from 130 cpi to 300 cpi so that catalyst
volume may be reduced by 2/3. Therefore, the optimal size DeNOx catalyst for a 12L
400hp engine would be nearly 20 liters. The SCR system also showed reduction of HC
and CO on the order of 90 percent.
2.4 RJM Corporation (Production Systems)
RJM ARIS Technology offered urea injection systems that achieved 75-90% NOx
reduction for diesel and natural gas engines, both stationary and marine (21). The
company’s Advanced Reagent Injection System (ARIS) utilized eutectic urea in
conjunction with a pulse width modulated injection system. They offered both
vanadium/titanium and zeolite based catalysts. Systems offered cover engines from 100-
3000 hp and a temperature range from 250-650ºC. The system utilizes an ECU to
formulate NOx maps for urea injection. The system communicated to the engine and used
one or more of the following parameters: engine speed, load or NOx signal. The system
did not need an air supply, as the pump for the injection system is constant flow from
tank to injector and back to the tank. The company claimed that its system is the most
cost effective and highly effective NOx reduction system.

17
2.5 Off-Highway Exhaust Gas After-Treatment: Combining Urea-SCR, Oxidation
Catalysis and Traps
Earlier studies were found to produce promising results in the early 1990’s (22).
That research focused on testing of the HUG urea SCR catalyst system that was
implemented in marine applications in the early 90’s. This system utilized a dual phase
injection system that injected the aqueous urea solution along with air through the same
nozzle. The system also utilized a post-oxidation catalyst to reduce the amount of
ammonia slip. The catalysts that were used had a low cell density of 40 cpi. The control
algorithm used engine load and stored NOx maps for injection. Application on a ferry
between Sweden and Denmark yielded highly promising results. The system showed 96.5
and 95.3% reductions in NOx for full load and part load conditions, respectively.
Ammonia slip was limited to less than 10 ppm for both cases. The paper also discussed
the advantages of amorphous chromia converters for low temperature scenarios. Work
showed conversion rates on the order of 80% for temperatures as low as 100ºC.
2.6 Thick Film ZrO2 NOx Sensor for the Measurement of Low NOx Concentration
A significant factor in the reliability and precision of urea SCR systems lied in the
ability to accurately measure NOx. Improved NOx sensors have an error of +/- 2% full
range. Older NOx sensors were higher with a range of +/- 10% (23). Researchers at NGK
Insulators, Ltd. tested the new sensor on a Toyota D-4 engine and found the sensor could
monitor less than 100 ppm of NOx behind after treatment catalysts. It was found that
through new control of the first internal cavity the sensor offset could be minimized to
counteract the presence of residual oxygen. Benefits of these sensors allowed for better

18
control and higher conversion efficiencies of urea SCR systems. These sensors also
functioned well for on-board diagnostics to detect catalyst or system failure.
2.7 Development of Urea-SCR for Heavy-Duty Trucks Demonstration Update
As part of Mack Trucks’ Consent Decrees, (24) they have investigated and
implemented urea SCR systems in a portion of their heavy-duty truck fleet (25). Their
paper discussed some of the over-the-road test results. The engine used for the study was
a 12 liter 350 hp I-6. The catalyst was Vanadium-Titanium with a total volume of 45
liters. The system utilized engine data and a controller to properly dose the correct
amount of urea. Thick film Zr02 sensors were used to monitor NOx. For this study neither
a pre- nor post- oxidation catalyst were used. Standard 500 ppm sulfur diesel fuel was
used and the oxidation catalysts were not used due to sulfate formation. For the first year
the cell density of the catalyst was 100 cpi. It was upgraded to 200 cpi for year two. The
average NOx reductions from over the road measurements for each year were 63% and
71%, respectively. The urea consumption rate was on the order of five percent or less of
the diesel fuel consumption rate. It was valuable to note, with minimal ammonia slip and
no oxidation catalysts, that such high conversion efficiencies were feasible.
2.8 The Development and Performance of the Compact SCR-Trap System: A 4-Way
Diesel Emission Control System
Their paper examined a four-way pollution control system that included a
Continuously Regenerating Diesel Particulate Filter (CR-DPF) and annular SCR system
with ammonia slip catalyst (26). This urea SCR system directly communicated with the
CAN bus of the Volvo 12L 465 hp engine. The SCR catalyst volume was 1.6 times that
of the engine displacement. The cell density of the catalyst was 350 cpi. The system did

19
utilize the on-board air compressor to assist urea injection and mixing. The lower limit
for injection of this system approached minimum temperatures of 160ºC. The NOx
conversion during cold starts near this temperature was only 55%. However, the weighted
average of the hot and cold starts show and average NOx conversion of 79%. The
original engine-out certification was 5 g/bhp-hr. After the SCR installation, the NOx fell
to 1.2 g/bhp-hr, which was under the 2007 EPA limit. The previous results were obtained
from the US Heavy Duty Transient test cycle. NOx conversions of up to 92% were
achieved on the European Stationary Cycle (ESC). The average ammonia slip during
testing was 9 ppm with maximum values of up to 60 ppm.
2.9 Development of Urea-SCR System for Heavy-Duty Commercial Vehicles
This reviewed paper looked at various components of a urea SCR system for use
with large commercial vehicles in Japan (27). The given engine had a displacement of
13L. The studies were performed using the Japanese transient cycle. This cycle had
average lower speeds and lower engine temperatures as with marine diesel applications.
This study also used the Bosch urea injector system. The engines were modified with
higher injection pressures and EGR to reduce PM emissions so the system would be PM
compliant without DPF after treatment. With this measure, the fuel penalty was
decreased by 6.5%. The study estimated that the cost of urea would be equivalent to 2.5%
of the fuel. In this case, the overall fuel efficiency increase was 4% while reducing NOx
emissions by 70%. Long term results of the study showed only a slight decrease in
conversion efficiency. Their research also looked at the basic compatibility of materials
used within the system. It was found that the urea solution had little corrosive effects on
stainless steel, aluminum, cast iron and galvanized steel. More noticeable effects were

20
found on bronze and copper. The system also showed promise with freeze prevention
systems utilizing engine coolant heat exchangers within the urea tank.
2.10 Simulation on the Optimum Shape and Location of Urea Injector for Urea-
SCR System of Heavy-duty Diesel Engine to Prevent NH3 Slip
Simulations and research were conducted at Hanyang University on the shape and
location of various urea injectors modeled in conjunction with an SCR catalyst (28). The
research looked at varying the number of holes between 1, 2, 4, 6 and 8; the distance
from injector plane to brick face in the intervals of 1.5, 3, 5, and 7 diameters in length;
and various injection pressures from 1 to 2 bar. Modeling was completed to optimize the
previously mentioned characteristics so as to minimize mal-distribution of the multiphase
flow on the brick face. The result of the modeling showed that after placing the injector 5
diameters up stream of the catalyst that little could be gained by moving it to a location of
7 diameters upstream. It was also found that best distribution results were from a 4 hole
injector. The second best was 2 holes with 6 and 8 holes being next. A 1 hole injector
provided a large injection velocity, which increased the chance for wall impingement.
The 6 and 8 hole injectors were found to provide a small injection velocity, the effect of
which did not assist in the turbulent mixing. Higher pressures were also found to assist in
the mixing process. It was also noted that in the case of perpendicular injection wall
impingement occurred in the axial direction, but also that when injection was parallel
with flow that some radial wall impingement occurred as well.
2.11 Diesel Emission Control Technology –2003 in Review
Control of diesel emissions evolves rapidly as research areas continue to grow.
Timothy Johnson of Corning Inc. annually writes “year in review” papers summarizing

21
the state diesel emission technologies (29). He reviewed various SCR research results
that showed promise for use in heavy duty and light duty NOx reduction. Much research
focused on the application of pre-oxidation catalysts in combination with urea SCR
systems in order to optimize the NO2/NO ratio. As reported in the literature, an increase
in NO2 content from 13% to 30% yielded a NOx reduction increase from 35 to 50%.
Reviewed research also showed promise with zeolite catalyst at low temperatures and the
use of NOx sensor for the control of mobile urea SCR systems. NOx reductions of near
40% were also reported at temperatures as low was 200º C. All of these results showed
promise for a stand alone system with a NOx reduction target of 50%.

22
3 System Configurations and Hardware
The original design of the system was to be simple and robust. The following
specifications drove system design and each subsequent section describes the approach
taken to fulfill the necessary specification. The system needed to be self-contained and
function properly without communicating with the specified engine. The basic
parameters needed for the urea SCR system included exhaust flow rate, pressure,
temperature and estimated NOx content. To measure these parameters, a flow tube was
designed that would house the necessary sensors. The sensors included a differential
pressure sensor attached to a pitot tube, an absolute pressure sensor and a temperature
sensor. Sensor signals and software were implemented in a system controller. Hardware
needed for the system included a urea storage system, urea supply pump, injector and
mount, flow tube and catalyst. The flow tube was standard aluminized exhaust pipe. The
sensors were installed to this section of pipe and placed upstream of the catalyst. The
flow tube sensors performed all necessary measurements and the system controller
calculated urea demand and determined the state of urea injection. This was determined
to be the necessary set up for a basic stand-alone urea SCR system.
3.1 System Controller
Since the system was to be stand-alone, all of the necessary parameters needed for
control would have to be read, stored and used by the system itself. Therefore, the system
needed an independent controller. The controller would need to take in various analog,
digital or CAN signals and use those signals within the software to run the system. The
controller would need to calculate the NOx level and the corresponding amount of urea

23
needed for NOx reduction. Its self-contained software would then deliver the correct
metered amount of urea to the exhaust via an injector.
The controller chosen was the Mototron 80-Pin Motohawk. This controller was
previously used by WVU’s Challenge X team to control various subsystems of a hybrid
vehicle (30). It was powered by Motorola MPC555 microprocessor with 448Kb of Flash
Memory. The operating voltage was 9-16VDC, which was ideal for such automotive
applications. The 80-pin had 15 analog inputs, injector driver outputs, PWM outputs, and
the ability to communicate via CAN or RS485. The Motohawk software was based in the
Simulink environment, which allowed for model-based programming. Programs were
saved and built on a PC and then programmed via a KVASER module and Greenhill
Software to the 80-pin unit. Also available with this controller was the MotoTune
software. This software allowed for monitoring of the system in real time as well as
calibration and data collection capabilities. Figure 3.1 below shows the controller and its
wiring harness. It can be connected to the necessary sensor inputs and outputs.

24
Figure 3.1 MotoHawk 80-Pin Controller and Wiring Harness
3.2 Urea
The urea used for this system was TerraCair SCR grade urea. It was a eutectic
solution of 32.5% in water. The liquor was formaldehyde free because of Terra
Industries’ urea production processes (31). Table 3.1 below shows the basic properties of
the provided 5-gallon sample. Figure 3.2 shows a picture of the automotive grade urea.
An MSDS was provided in Appendix A.
Table 3.1: Typical Physical Properties of 32.5% Aqueous Urea Solution: DeNOx
Grade Meets Specifications of DIN 70070:2005 and ISO 22242-1:2005 for NOx
Abatement Technologies.
Parameter Typical
Urea Concentration 32.5+/-0.7%
Specific Gravity at 20 ºC 1.087-1.093 kg/m^3
Refractive Index at 20 ºC 1.3814-1.3843
Free Ammonia (alkalinity) 0.2% max
Biuret 0.3% max
Formaldehyde Formaldehyde Free
Insoluble Matter 20 ppm max

25
Figure 3.2 Automotive SCR Grade Urea
3.3 Urea Storage Tank, Lines and Fittings
As discussed earlier and described in the literature, most metals showed minor
amounts of surface corrosion when used as wetted parts with urea. Brass and bronze
materials were incompatible with urea and were not used in system construction. Figure
3.3 below shows the custom fabricated urea storage tank. The tank had a 4-gallon
capacity. It was designed to hold the necessary fuel pump unit, discussed the next section.
The overall dimensions of the tank were 9x9x13 inches. The tank was fabricated and tig
welded from eighth inch aluminum sheet metal. The exact tank, pump and plumbing
designs were not essential to system functionality. Lines used on this system were
standard 5/16” high-pressure automotive fuel lines. The flexible lines worked well for the
short-term duration of these tests. All hard line fittings to connect the flexible lines were
standard Swagelok stainless steel fittings.

26
Figure 3.3 Urea Storage Tank with Fuel Line and Pressure Gauge
3.4 Injector and Fuel Pump
The fuel injector and pump from a 5.3L GM Flex Fuel engine were used in this
research. Both urea and ethanol are slightly corrosive and these parts were thought to be
more durable and compatible than standard gasoline injectors and pumps. The fuel pump
was installed in the top of the urea tank and sealed with a rubber o-ring. The fuel pump
was powered by 12VDC with a 20-amp circuit fuse. The pump unit did not contain a
return line. The fuel pump was internally regulated to 58 psi when power was applied. A
mechanical pressure gauge was installed for visual inspection during testing. Software
control applied power to the pump at all times. Problems during testing from urea heating
were not observed. For extended use, cooling precautions may prove necessary. The
pump would not need to run at all times. Two suggested alternative control methods
would be; to power the pump only as the system neared the threshold temperature for
injection or to monitor line pressure based on an electronic pressure sensor.

27
Custom mounts were fabricated to hold the fuel injector and allow the pressurized
o-rings to seal properly. The top mount was machined from aluminum, with an inlet port
for urea. An internal channel allowed the urea to flow to the back side of the injector. The
injector fit into the bored hole of the piece tightly in order for the upper o-ring to seal
properly. The fuel-injector flow capacity was rated at 28 pounds per hour. This
characteristic may not have been the same for urea as the working fluid. Injection
strategies for needle lift and duration were also different for the control of this system.
Typical demand from this injector based on urea system control logic was on the order of
25% of its maximum injection flow rate.
3.5 Thermocouple and Transmitter
Exhaust temperature was one of the main parameters used by the system. A
standard Type K Chromel/Alumel thermocouple was used to measure the temperature.
The thermocouple was 1/8” in diameter and 6 inches long. The probe was inserted to the
centerline of the flow tube and held in place with a stainless steel compression fitting.
The operating temperature range for the thermocouple was -200 to 1250 ºC. The
thermocouple output was scaled to a 5 volt analog input for the controller. An Omega
STCTX-K2 series thermocouple transmitter was used to generate the necessary signal.
The measurable temperature range for this transmitter ranged from -18 to 538 ºC. The
input voltage was from 9-30 volts and was set to 12 volt. The accuracy of the transmitter
is +/-5% of the full-scale range. The transmitter was to be kept below 85 ºC. The sensor
output was 4-20 mA. A 250 ohm resistor was placed between signal and ground in order
to produce a measurable 1-5 volt input. Each degree increment was represented by 7.3
mV. This 1-5 volt signal was read by the MotoHawk to determine the temperature for use

28
within the program. The input for this block was 16 bit analog to digital converter. With
the available 1023 bits, the system measured temperature changes of approximately one
half degrees.
3.6 Pressure Sensors
Both absolute and differential pressures were needed by the system to calculate
the properties of the exhaust gas as well as the volumetric flow rate. The absolute
pressure signal was generated by a cost efficient, easily available automotive MAP
sensor. The sensor is made by MSD Ignition and used for aftermarket applications. The
sensor input was 5 volts, which was supplied by an analog output of the MotoHawk. The
sensor output was 1-5V volts over a 2 bar range. The accuracy of this sensor was not
known. It was chosen because of its automotive applications and cost.
The differential pressure (DP) was more important due to its large varying range.
The DP sensor would also need durability against the corrosiveness and heat of the
exhaust. Differential pressure sensors that were capable of measuring the induced
pressure differences and withstanding exhaust gases were sparse. Common available
ranges were 0-1 in. w.g., 0-10 in. w.g., 0-1 psi and larger. The 0-1 psi was equivalent to a
range of 0-27.7 inches of water. This easily covered most flows of C1 class engines. The
Omega Model PX2300 was selected; it was rated for high temperature, “wet” flows. The
excitation voltage was 9-30 volts and was set by the system at 12 volts. The output of the
sensor was 4-20mA corresponding to a 1 psi range. The accuracy was 2% of the full scale
range when used for 1.0 psig. The operating temperature was from -18 to 80 ºC. The
inner wetted surfaces were made of stainless steel to protect from corrosion. The signal
output wire was connected to ground through a 250 ohm resistor to induce a 1-5 volt

29
signal for MotoHawk use. The input block was a 16 bit analog to digital converter block.
The smallest measured differential pressure increment was 0.03 inches of water. The
output signal was found to be sensitive to input voltage. Large fluctuations due to high
current draw of the continuously running pump and corresponding battery charger caused
large steady state error. The error was minimized but not completely removed by the use
of an inline voltage regulator and use of a separate battery for pump use.
3.7 Pitot Tubes
The differential pressure sensor used to calculate flow needed both a high
pressure and low pressure port in the exhaust to measure the pressure difference. Many
possibilities existed for the flow measurement. WVU previously used Annubars in
conjunction with differential pressure sensors for exhaust flow measurements. These
acted like averaging pitot tubes with multiple ports along the flow profile. These and
other similar devices cost over $1500. A custom Pitot tube probe was designed this
specific application. The material chosen was stainless steel tubing for its robust
mechanical properties. The line size was ¼” inner diameter, which would prevent any
blocking by particulate matter. Larger tubes would have induced more dead volume
which may have caused error in sensor reading while smaller tubes may plug with
particulate. Most Pitot tubes measured total pressure at the stagnation point of the probe
against the flow. The static pressure was typically measured in a plane perpendicular to
the total pressure port. Available Pitot tubes achieved these two measurements in the
same probe by using a dual wall collinear tube. This design was not used for the custom
Pitot tube because of the bending procedure and probe mounting. Instead, the static
pressure probe would mimic the total pressure probe but be place behind and rotated 180

30
degrees. Due to the nature of the layout of the pressure probes, the typical coefficients
used to evaluate velocity based on velocity pressure were different. A 1/8 inch PFA tube
was used to connect the Pitot tubes and the pressure sensor. This reduced the dead
volume of the measurement system. These and all other necessary ports were attached to
the flow section.
3.8 Injector Mount and Standoff Tube
The previously described injector was typically used in lower temperature
environments, on the intake system of flexible fuel engines. For this application, it
needed to deliver the urea directly into the exhaust flow. The mounting system and
standoff tube were specially designed so to protect the seals of the injector from hot
exhaust gases and to reduce the injector temperature to avoid problems with urea
clogging. The lower mount that accepted the bottom o-ring of the injector was originally
made of stainless steel, but it was decided that a more insulating material should have
been used. The next choice was a machined ceramic tube. This piece was not used
because it cracked during machining due to its brittle nature. The final design utilized a
drilled rod of Teflon with a rated temperature limit of 260 ºC. As seen in Figure 3.4, the
Teflon accepted the bottom of the injector and is sandwiched together with three ¼” bolts
and lock washers. Under the stainless plate is the standoff tube.

31
Figure 3.4 Injector with Upper and Lower Mounts Attached to Stainless Steel
Standoff Tube
The standoff tube was made of stainless steel because of its low heat transfer
coefficient for conduction and its ability to be attached to the flow tube. It was welded to
the exhaust pipe at an angle of 45 degrees and injected with the flow. The spray pattern
from this injector was highly atomized at low flow but more stream-like at higher
demands. The larger demands occurred when the pulse width was over 25% duty cycle
and larger mass amounts were delivered per injection event. This led to the initial
decision of the angle. It was most likely that urea impingement occurred on the opposite
wall at larger angles and at smaller angles with low urea flow conditions, the urea would
be swept against the upper wall.
The shortest length of the standoff tube was 2.5 inches in length. It was assumed
that the thin-wall tubing would behave like a fin. The length L was calculated from the
following equation.
T T
T T L
L e
b e
−
−
=
1
cosh( )β Where: β =
hP
kA
0 5.
Equation 6

32
Te was set to ambient conditions of 20°C. Tb was estimated to be the maximum
temperature seen in the exhaust flow, 450°C. TL was set to 200°C; this would provide a
safety factor as the Teflon could be exposed to temperatures up to 260 °C. P was found to
the outer perimeter of the tube, 0.0798 meters. The area A, was found to be 9.63x10⁻⁵
square meters. The heat transfer coefficient of stainless steel, K, was set to 15 W/mK. An
estimated coefficient for h, was set to 12 W/m2K. The estimated was taken from similar
examples from a heat transfer book, along with the fin equation (32). With these values,
the length L was found to be 0.059 meters or 2.32 inches. This was rounded up to 2.5
inches allowing room for error. After testing it was decided to also use a heat shield
below the injector mount to decrease heat transfer to the injector via convection currents
from the hot exhaust. The heat shield was made from 1/64 inch aluminum. Exhaust
gasket material was used below and above the heat shield to seal the system.
3.9 NOx Sensor
The system needed a sensor that would measure the raw NOx content of the
exhaust gas flow. The sensor that was chosen for this project was the Smart NOx Sensor
from Siemens VDO Automotive. The sensor was of the zirconia oxide type. The sensor
had two cavities; the first contained platinum to oxidize HC, CO, H2. The second cavity
eliminated all of the oxygen content and chemically reduced all NO to N2 and O2. The
oxygen generated from this secondary reduction process was measured as an electrical
current and represented the amount of NO. The sensor was calibrated at the factory and
was used in conjunction with its proprietary controller. The controller was powered via a
12 volt source. The only output of the sensor controller was communication via CAN

33
protocol. This application worked well with the MotoHawk controller as it had two
available CAN buses.
3.10 Flow Section
The flow section refers to the section of exhaust that housed the necessary sensors
and urea injector. Aluminized steel was selected because of its availability and common
use in exhaust systems. The size of the flow tube was important for a number of reasons.
Typical pipe sizes ranged from 4-6 inches in diameter for engines indicative of the C1
marine class. Decreased pipe diameters below 4 inches would result in increased
backpressure. The pressure drop across the system was proportional to the square of
velocity; therefore it was also proportional to the square of the area. Pressure drops could
increase by 50% or more by a system that was sized to small. A custom diameter would
have required custom transitions, fittings, and clamps. The exhaust section out of the
turbine for this engine was 5 inches in diameter. This was the most likely candidate;
however, the flow rate in this section needed to be in the correct range to retrieve good
resolution from the differential pressure sensor. Engine intake flows for this system were
on the order of a maximum of 800-1000 standard cubic feet per minute. The following
equations were used to solve for the necessary parameters.
AreaVelocityQ ×= Equation 7
2
2
=D
Area π Equation 8
2VkP ρ=∆ k calibrated near = 1.5 x ½ for this setup Equation 9

34
If the standard flow was converted to actual flow at low density and high temperature of
the exhaust, the maximum flow rate was above 2000 cubic feet per minute. Table 3.2
below shows the induced velocity pressures for the 4”, 5” and 6” pipe sizes.
Table 3.2: Pressure Ranges for Maximum Flow of 2000 CFM and Minimum Flow of
150 CFM.
Pipe Diameter (Inches) 4 5 6
Area (Square Feet) 0.087 0.136 0.196
Maximum Differential Pressure (Inches of Water) 26.29 10.77 5.19
Minimum Pressure (Inches of Water) 0.15 0.06 0.03
Figure 3.5 represents the estimated pressures in the exhaust system for a test cycle
during original testing of the flow device. The first iteration was tested on a 1992 Detroit
Diesel Corporation engine. This engine produced similar intake flow rates as compared
with the John Deere engine used for final testing. The results from actual test data were
similar to those calculated.

35
-1
4
9
14
19
24
0 200 400 600 800 1000 1200
Time (sec)
Delta P (in. w.g.)
4" Diameter
5" Diameter
6" Diameter
Figure 3.5 Differential Pressure for Various Diameter Flow Tubes
From the results above, the measurable range of differential pressures was directly
related to pipe diameter. A 5-inch flow tube was chosen for this design. Higher resolution
could be achieved with a 4-inch pipe but this may have led to over ranging the sensor and
undesirable backpressure. It would have also limited the variation of testable engine sizes
and flows. It was clear that for a 6-inch pipe, the flow would need to be much larger in
order to retrieve better low flow events, however; larger turbine outlet ports would be
indicative of larger engines with possible larger flows.
3.11 Catalyst
The last major component of the system was the urea SCR system catalyst. Eight
catalyst bricks were received by WVU. The catalysts were extruded ceramic titanium-
vanadium bricks. Their outer dimensions were 150x150x450 mm. The wall thickness was

36
on the order 0.25 mm. The cell density was approximately 130 cpi. Engineers from the
supplier suggested that 4 bricks be utilized for our catalyst based on gas content,
temperature and flow rate of exhaust. The 4 bricks were arranged in a 2x2 configuration
as suggested. The catalyst bricks were wrapped with fibrous matting that held the
components in place within the catalyst can. The mat was supplied as a sample from
Unifrax Corporation. The canning was made from stainless steel with 45º tapered
takeoffs on both the inlet and outlet. Turbo-flanges were welded on both sides for
attachment to the exhaust system via 5 inch turbo-clamps. The distance between the
injector and brick face was maintained at no less than 5 diameters or approximately 25
inches. The system was calibrated with an LFE calibration system at WVU’s EERL.
During calibration, data was collected on the pressure drop across the catalyst as a
function of flow. Figure 3.6 shows an example of the data collected. The maximum
pressure drop from testing was less than 9 inches of water with flows less than 900
SCFM.

37
-100
0
100
200
300
400
500
600
700
800
900
1000
0 50 100 150 200 250 300 350 400 450
Time (sec)
Flow (SCFM)
-1
0
1
2
3
4
5
6
7
8
9
10
Pressure Drop (in w.g.)
Flow
PressureDrop
Figure 3.6 Flow and Pressure Drop Across the Catalyst
3.12 Complete Bench System
Figure 3.7 below shows the complete system during bench testing. All of the
sensors were mounted to an aluminum plate and attached to a cart. The cart contained 12
volt batteries, controller, and urea and tank system. The flow section was attached to the
catalyst. This setup allowed for the system to be easily transported into place and the flow
section installed into the exhaust. Flexible lines were utilized during testing for
convenience.

38
Figure 3.7 System for Bench Test

39
4 System Model and Control Logic
The following section describes the model-based control of the urea injection
system. The MotoHawk programs were designed in the Simulink environment of Matlab.
The MotoHawk software added libraries of various MotoHawk blocks to the standard
Simulink libraries. The MotoHawk blocks used in the program included input blocks for
analog inputs, pulse width modulation blocks for control of relays and injector, display
blocks for use in MotoTune data collection, calibration blocks for sensor calibration,
CAN ‘Send and Receive’ blocks for communication, and override blocks for default
values. All other blocks and logic were available in the normal Simulink libraries. The
following sections describe the logic of the system and all subsystems.
Figure 4.1 below shows the complete system model. The inputs and outputs
occurred in the triggered subsystem named 100ms Foreground. This designation allowed
the system functions and calculations to occur at 10 Hz. The CAN blocks were necessary
to establish CAN communications on the controller as well as set parameters such as the
baud rate. The main power relay set both power on and off conditions.

40
Figure 4.1 Complete System Model as Viewed in Simulink
Figure 4.2 shows the 100ms Foreground subsystem. This was the main subsystem
that contained all of the input subsystems, calculations and the injector output. The inputs
are shown on the left side of the figure and the information flowed from left to right
through various calculations and logic conditions until it flowed to the output of the
system at the right side.

41
Figure 4.2 100ms Foreground M
odel Layout

42
4.1 Inputs
4.1.1 CAN/NOx Sensor
The first input was the CAN block. Inside of this subsystem were the CAN read
and send message blocks. The send block transmitted the proprietary start message every
50 ms to the NOx sensor. The read block received the NOx sensor’s proprietary
transmitted messages at the same interval. This message contained both the NOx level in
ppm, Oxygen level in percent and other status messages. The only output of this
subsystem was the NOx level that will be used to calculate NOx mass flow rates. All
other messages were sent to display blocks, which were monitored. Figure 4.3 shows a
MotoHawk CAN subsystem with read and write blocks.
Figure 4.3 Standard MotoHawk CAN Read and Send Message Blocks

43
4.1.2 Differential Pressure Sensor
The second input was for the differential pressure subsystem. This subsystem was
described in detail as all other subsystems were similar and will not be covered in detail.
This subsystem contained an input block. The input block parameters were set to match
the previously determined input pin into the MotoHawk. The input signal voltage was
read by the Motohawk and converted to a digital signal. From this block, the signal went
through a data type conversion block. The digital signal was then converted back to the
sensor voltage range via the first triangular gain block. For this input, the signal was
divided by 1023 bits and multiplied by the maximum voltage of 5 volts.
The signal was then calibrated using a MotoHawk calibration block. The
calibration blocks connected to two separate summing blocks. The output of the sensor
was 1-5 volts, with 1 volt representing sensor zero. The 5 volts corresponded to the
sensor at maximum output. This calibration value was subtracted from both the input and
constant 5 volts to set the correct range of approximately 0-4 volts. This allowed for
calibration, as the zero output did not always correspond to a direct value of 1. This value
of 1.1 was changed real time in MotoTune to calibrate and zero the sensor.
The constant value of 27.77 referred to the 0-27.77 in. w.g. (0-1 psi) range of the
system. Two display blocks showed both the differential pressure in in.w.g. as well as its
corresponding digital value. The value then passed through the saturation block. This
saturation block was used due to the accuracy of the system from analog to digital
conversion. The output of the sensor was sensitive to small disturbances and when the
system was zeroed, the value fluctuated around zero but included negative numbers. The
saturation block was used to keep the value between the sensor limits of 0 and 27.77 in.
w.g. The value was then fed into another gain block to convert the value to psi for use in

44
later calculations. This final output of this subsystem was the differential pressure in psi.
Figure 4.4 shows the differential pressure subsystem.
Figure 4.4 Differential Pressure Subsystem with Analog Input and PSI Output
4.1.3 Absolute Pressure Sensor
The next input occurred within the absolute pressure subsystem. The
corresponding signal was received from the sensor and converted to the digital value.
This value was converted to engineering units and calibrated via a calibration block. The
sensor had a complete range of 0-2 bar or 0-29 psi. A saturation block was included but
not needed and served only as a default pass band. The output was in units of psi and was
used in later calculations. Figure 4.5 shows the absolute pressure subsystem.

45
Figure 4.5 Absolute Pressure Subsystem in the Simulink Environment
4.1.4 Temperature Sensor
The last sensor input occurred in the temperature subsystem. The analog signal
was converted to digital data and then back to engineering units. The range input on the
Motohawk again accepted 0-5 volts but the sensor output was between 1 and 5 volts. This
difference was corrected by scaling the data to the full range from 0-4 corresponding to
-18 to 538 °C. The output of this system was in degrees Celsius and was later used by
multiple parts of the program. Figure 4.6 shows the temperature subsystem.
Figure 4.6 Temperature Subsystem in Simulink
4.2 Other Subsystems
4.2.1 Main Power Relay
The main power relay subsystem was located at the left of Figure 4.2, next to the
input subsystems. This subsystem was utilized to control a relay that powered everything
in the system except for the controller. The subsystem utilized an if/else block to control
an output pin of the MotoHawk. If the ‘Display’ value was 1, then the ‘System On’ route
was followed and the action subsystem sent a value of 4095 through to the analog output
block. This corresponded to grounding that pin. If the display value was 0 then the else

46
route was followed to the ‘System Off’ action subsystem which sent a value of zero
through to the analog output block. This corresponded to 5 volts. The output was the
injector duty cycle or pulse width modulation (PWM); with an input of duty cycle 0 for
positive voltage 4095 for ground. The PWM also required an input frequency; the
minimum value of 1.19 Hz was used. The system allowed the sensors and pump to shut
down separately from the controller during testing. The software switch also allowed for
control of the system from a different location via USB and Mototune. Figure 4.7 shows
the main power relay subsystem.
Figure 4.7 Main Power Relay Subsystem for Software Control of System
4.2.2 Temperature Conversion for Ideal Gas Law
The temperature conversion subsystem changed the temperature in degrees
Celsius to absolute Rankine. Calculations used the inch pound system. Equation 10
shows the conversion from Celsius to Rankine.
( )T TRankine Celsius= + +95 32 460 Equation 10
The absolute temperature was multiplied by the gas constant for air, 53.29 ft·lbf/lbm·R.
This final value was the denominator of the right hand side of the ideal gas law shown in

47
the form of Equation 11. The output was the denominator and was used in the next
subsystem. Figure 4.8 shows the temperature conversion subsystem.
ρ =
P
RT Equation 11
Figure 4.8 Conversion From Celsius to Rankine and Gas Constant for Air
4.2.3 Calculation of NOx
The next subsystem calculated the mass flow rate of NOx. The inputs included
absolute pressure in psi, differential pressure in psi, NOx concentration in ppm and
temperature/gas constant of the flow. The final output value was estimated in grams per
unit time of NOx. The mass of NOx was representative of equivalent grams of NO, as
found to be the convention in emissions literature.
Constants were contained within the subsystem and labeled in Figure 4.8. There
were five fundamental calculations that occurred within this subsystem and correspond to
the equations discussed below.

48
• Absolute Pressure and Temperature/Gas Constant inputs were used with the
aforementioned Equation 11 and are shown below for completeness. These inputs
allowed for the calculation of the exhaust gas density.
ρ =
P
RT Equation 11
• The Differential Pressure input was used along with necessary constants and
previously determined density to find the velocity of the exhaust gas flow. This
calculation was previously discussed in Section 3.10, but Equation 4 is again
shown for completeness. The equation was from the simplified form of the
Bernoulli equation for incompressible flow. The equation yielded valid results for
flows with a Mach number less than 0.3. The maximum Mach number within the
exhaust system was 0.124 (33).
2VkP ρ=∆ k calibrated near = 1.5 x ½ for this setup Equation 9
• Once the velocity had been found from above, the volumetric flow Q, of the
exhaust gas was calculated from the previously discussed Equation 7.
AreaVelocityQ ×= Equation 7
• The volumetric flow was then used to find NOx concentration. However, for
calibration and trouble shooting purposes the volumetric flow rate was converted
to a standard flow rate for comparison with separate intake data. Equation 12 was
used to convert the flow from CFM to SCFM.
=
std
act
act
std
actstdP
P
T
TQQ Equation 12

49
• The last step utilized all of the previously calculated data to solve for the mass
flow rate of NOx in the exhaust. The following equation was similar to the NOx
calculation equation found in the Code of Federal Regulations 40 Part 86. The
second part of the equation was omitted because it did not apply to the total NOx
that was measured within the exhaust. Vmix refers to the volumetric flow rate
previously calculated as Q. KH and DensityNOx were constants. The time step was
divided on both sides so the output was NOx in g/hr. The density used in the
equation was for NO2, as stated in the CFR.
( ) ( ) ( )
∆×××
×= TDensityV
NOxKNOx NOxmix
ppm
H 610 Equation 13
The subsystem containing these calculations is shown below in Figure 4.9. The
default values for constants and flow factors that were not previously discussed in detail
can be found in the figure. The output was the NOx flow rate in grams per hour.

50
Figure 4.9 NOx Mass Flow Rate Estimation Subsystem
4.2.4 Urea Rate Calculation
The next subsystem determined the duty cycle of the injector based on the
previously discussed input. This system used multiple gain blocks for unit conversions.
The system is described by Equation 14. NOx in g/hr was a measure of NO2 in g/hr.

51
( ) ( ) ( ) ( )
( ) ( )
( ) orPWMDutyCycleF
NOx
DutyCycleBits
hrlbsCycle
Duty
gramslbs
gramsUreaiongramsSolut
gramsNHgramsUrea
gramsNOgramsNH
gramsNOgramsNO
hrg
=
×
××
××××
4095
251
4541077.3
3460
9034
4428
/
%100
3
3
2
Equation 14
There were also display blocks that were used to validate and perform system
diagnostics. The injector duty cycle from Equation 9 fed into a multiplication block.
Another display value for ‘UreaCorrection’ was the second input. This allowed for the
overall requested amount to be scaled up or down, regardless of calculation. The output
of this system traveled to the PWM output block. Figure 4.10 shows the Urea Rate
Calculation subsystem.
Figure 4.10 Subsystem to Convert NOx Rate into Injector Duty Cycle
4.2.5 Boolean Switch Logic
Figure 4.11 shows the software switch that turned the injector on and off. The
urea injection was limited by low exhaust temperatures. If the temperature of the system
was not adequate, the urea solution would not evaporate and decompose into ammonia by
the time it traveled to the catalyst. In that case the system would have urea/ammonia slip.
The if/else switch below controlled the injection process based on the thermocouple input
and a set point temperature. The set point was a constant display value which meant it
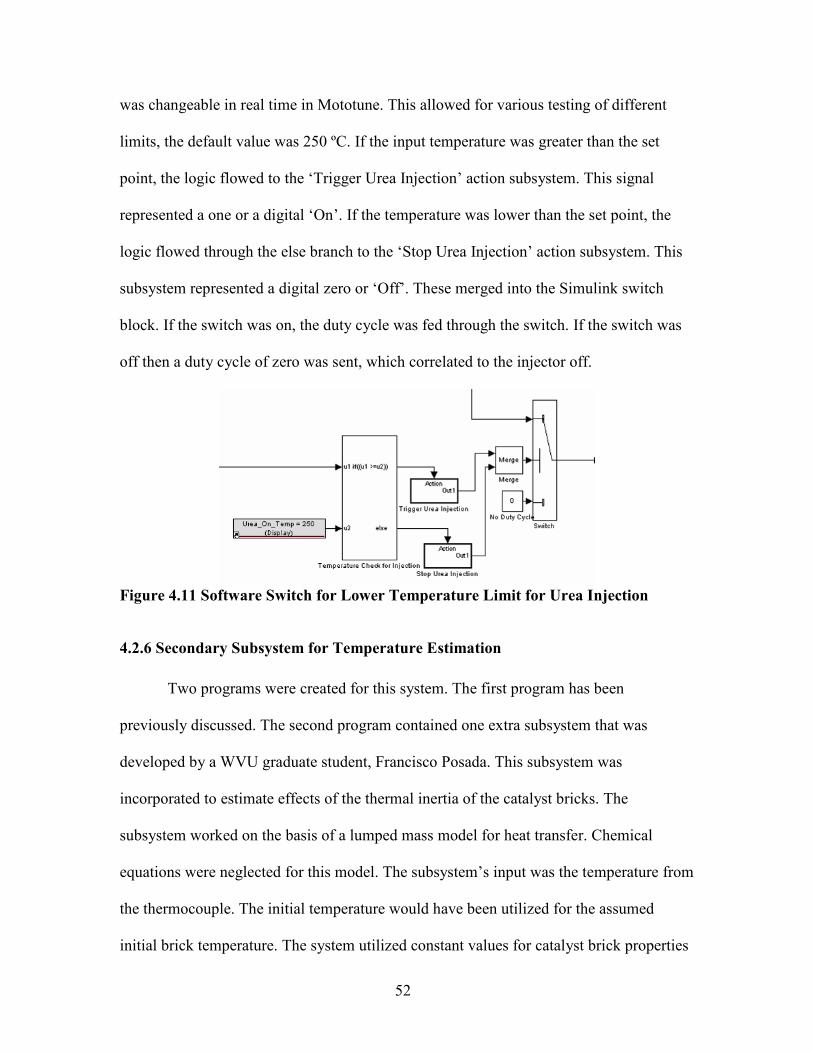
52
was changeable in real time in Mototune. This allowed for various testing of different
limits, the default value was 250 ºC. If the input temperature was greater than the set
point, the logic flowed to the ‘Trigger Urea Injection’ action subsystem. This signal
represented a one or a digital ‘On’. If the temperature was lower than the set point, the
logic flowed through the else branch to the ‘Stop Urea Injection’ action subsystem. This
subsystem represented a digital zero or ‘Off’. These merged into the Simulink switch
block. If the switch was on, the duty cycle was fed through the switch. If the switch was
off then a duty cycle of zero was sent, which correlated to the injector off.
Figure 4.11 Software Switch for Lower Temperature Limit for Urea Injection
4.2.6 Secondary Subsystem for Temperature Estimation
Two programs were created for this system. The first program has been
previously discussed. The second program contained one extra subsystem that was
developed by a WVU graduate student, Francisco Posada. This subsystem was
incorporated to estimate effects of the thermal inertia of the catalyst bricks. The
subsystem worked on the basis of a lumped mass model for heat transfer. Chemical
equations were neglected for this model. The subsystem’s input was the temperature from
the thermocouple. The initial temperature would have been utilized for the assumed
initial brick temperature. The system utilized constant values for catalyst brick properties

53
and necessary calculations to account for heating and cooling of the catalyst brick mass.
The output of the subsystem was the new temperature to be checked against the set point
value for the injector switch. Figure 4.12 shows the catalyst temperature subsystem. Due
to lack of testing time, this alternative control has not been tested at this time.
Figure 4.12 Temperature Estimation Subsystem to Account for Thermal Inertia

54
4.3 Output
4.3.1 Duty Cycle for Urea Injector
Previously discussed outputs were in the form of display values that could be
viewed and recorded using the Mototune software. The only physical output of the
system was the injector duty cycle. Figure 4.13 below shows the PWM output block for
the injector. The two inputs to the block were the injector frequency and duty cycle. For
this system, the frequency was set to be a constant value. The frequency input had a value
of 700 but the units are 0.01 Hz. The actual injector frequency was therefore 7 Hz. The
duty cycle input was the top input and was received from the ‘Urea Rate Calculation’
subsystem. As the amount of urea needed increased, the duty cycle increased allowing
the injector to remain open longer, for a greater amount time for urea delivery, increasing
the mass flow of urea.
Figure 4.13 Motohawk PWM Output for Urea Injector

55
5 System Testing
5.1 Test Engine Information
The stand-alone urea injection system was tested at WVU’s EERL in April of
2008. A narrow test window of three days was available for system setup and testing. The
system was installed into the exhaust of an 8.1 liter, 6-cylinder John Deere engine. The
engine idle speed was 1192 rpm with a rated speed of 2200 rpm and a high idle speed of
2363 rpm. The engine had been previously involved in other testing and was used
because of the available background data. The engine-out NOx level was certified at 4
g/bhp-hr. The engine map is shown in Figure 5.1 below. The maximum torque was 976
ft-lb and the maximum power was 346 hp.
0
200
400
600
800
1000
1200
0 500 1000 1500 2000 2500
Speed (rpm)
Torque (ft-lb)
Figure 5.1 Engine Map for John Deere engine

56
5.2 Test Cell Information
The engine was connected to EERL’s GE 800 hp AC Dynamometer for transient
and steady state testing. Figure 5.2 shows the engine and system setup within the test cell.
The exhaust was piped from the engine through the urea injection system and catalyst.
After leaving the catalyst the exhaust pipe was connected to the full scale dilution tunnel.
The dilution tunnel utilized a subsonic venturi system in compliance with CFR 40 Part 86
for 2007 emissions measurement systems. The tunnel flow rate was set at 2300 CFM.
Gaseous samples were taken with laboratory grade analyzers and recorded at a rate of
1Hz. PM data was not collected during these tests.
The dilute exhaust gas was continuously sampled for the measurement of HC,
CO, CO2, NOx, and ammonia. HC was measured with a Horiba FIA 236 heated flame
ionization detector. CO and CO2 were measured with a Horiba AIA 220 infrared
analyzer. NOx and ammonia data were collected with an EcoPhysics CLD 822 CM-h
chemiluminescent analyzer. The NOx analyzer used typical zero and span gases of zero
grade air and NO/N2 for calibration, respectively. The analyzer was able to measure NOx
on one channel with a value of NOxAM on the second channel. NOxAM was the value
representative of both the NOx and ammonia reading. Ammonia was found from the
difference between the two readings. Error was introduced when the differencing method
was applied to similar numbers. A secondary ammonia analyzer was also used; the
Advanced Optima AO2020 was capable of measuring NO, NO2 and NH3. However, an
ammonia span gas was unavailable for analyzer calibration at the time of testing.

57
Figure 5.2 Test Cell Setup Showing Urea Injection System, SCR Catalyst, John
Deere Engine and Test Cell Dynamometer
5.3 Test Cycles
Two test cycles were used for initial system testing. The first test cycle was the
Non Road Transient Cycle (NRTC). This cycle is a certification cycle for mobile non-
road diesel engines. John Deere engine used for testing was typical of off road farm
equipment, so it was well suited for NRTC testing. Previous testing on the NRTC also
allowed for the comparison of emissions values to ensure the installation of the system
did not yield different baseline emissions, increase fuel consumption or affect engine
performance. Figure 5.3 shows the NRTC cycle based on engine speed.

58
1000
1200
1400
1600
1800
2000
2200
2400
0 200 400 600 800 1000 1200
Time (sec)
Engine Setpoint Speed (rpm)
0
100
200
300
400
500
600
700
800
900
1000
Engine Setpoint Torque (ft-lbs)
Speed
Torque
Figure 5.3 NRTC Engine Speed and Torque Set Points
The second cycle utilized was the ICOMIA E5 steady state test cycle typical for
marine vessels. Figure 5.4 shows the ICOMIA cycle based on engine speed. The engine
and system were allowed to stabilize at the beginning of each mode for 60 seconds.
Figure 5.4 represents only the period when gaseous samples were taken (after the settling
time of 60 seconds). Table 5.1 includes data for each mode of the steady state test cycle.

59
0
500
1000
1500
2000
2500
0 200 400 600 800 1000 1200 1400
Time (sec)
Engine Speed (rpm)
Figure 5.4 Engine Speed for ICOMIA E5 Cycle
Table 5.1 ICOMIA E5 Cycle Mode Data and Set Points
Mode 1 2 3 4 5 6
Speed % Low idle 100 90.58 79.46 62.54 Low idle
Torque % 0 100 78.91 57.20 29.55 0
Time of
collection (sec) 60 120 195 255 480 450
Background runs were performed for each test cycle with the catalyst in place but
without injection, for baseline emissions comparisons. All urea injection system changes
were made during the multiple NRTC runs. A hot soak period of 20 minutes was used
between each cycle for zero/spanning of analyzers, charging of urea system batteries, file
renaming and other data reduction tasks. Once the system changes yielded lower
ammonia slip and approached the NOx reduction threshold of 50% on the NRTC, the

60
system settings were applied to a final ICOMIA E5 cycle. Complete results are discussed
in the following section.

61
6 Test Results
6.1 System Correlation Results
The two main input variables into the urea control system were exhaust flow and
NOx concentration. Both inputs were measured by the stand alone urea injection system
(UIS) independently of engine parameters or EERL equipment. These two variables were
time aligned and compared to EERL data from a laminar flow element (LFE) placed
within the engine intake and the EcoPhysics NOx analyzer output. All time alignments
were based on the highest coefficients of variation between data sets. These and all other
data were collected at a sampling frequency of 1 Hz.
The LFE data was output from the data reduction system in standard cubic feet
per minute (SCFM). Therefore, the output data from the urea injection system was
compared on a standard level. These two measurements were time aligned for
comparison. The NOx level measured by the EcoPhysics was the dilute concentration
from the sampling plane of the dilution tunnel. The NOx concentration measured by the
Siemens NOx sensor within the urea injection system was a raw measurement. To
compare and correlate these two measurements, both were converted into g/sec values.
Both the EERL data and UIS data were calculated based on standard volume flow rates.
Similar results could be shown for the volume flows that were uncorrected for
temperature and pressure.
Figures 6.1 and 6.2 show the comparison and correlation of the EcoPhysics NOx
and Siemens NOx on a g/sec basis. The Siemens time delay was originally stated to be up
to 1 second. When correlations were compared between Siemens NOx and EERL engine
power, a delay of 1 second was found between the two data sets. However, these data

62
were previously aligned with flow and data collection at only 1 Hz. The NOx in g/sec
data sets were time aligned based on correlation to eliminate time delay between the
measurement near the engine and measurement at the dilution tunnel sampling plane. As
shown in Figure 6.2, the correlation coefficient was found to be 0.943 for a direct
comparison of this un-averaged data.
-0.05
0
0.05
0.1
0.15
0.2
0.25
0.3
0.35
0.4
0.45
0 200 400 600 800 1000 1200
Time (sec)
NOx (g/sec)
Ecophysics
Siemens
Figure 6.1 EcoPhysics and Siemens NOx Sensor Comparison for NRTC Cycle

63
Figure 6.2 Correlation of Siemens NOx Data with Respect to EcoPhysics NOx Data
y = 1.101x - 0.0094
R 2 = 0.943
-0.05
0
0.05
0.1
0.15
0.2
0.25
0.3
0.35
0.4
0.45
-0.05 0 0.05 0.1 0.15 0.2 0.25 0.3 0.35 0.4
Ecophysics NOx (g/sec)
Siemens NOx (g/sec)
Series1
Linear (Series1)

64
A nine point average was applied to the previous data set to smooth variations due
to the highly transient nature of the cycle and sensor measurement. Figures 6.3 and 6.4
show the comparison and correlation of the data based on the nine point average. The
correlation coefficient increased to 0.9849. Averaging the data eliminated error at low
measurement values where UIS sensors experienced dropout. The UIS control model did
not contain any real time averaging methods at the time of testing.
Figure 6.3 9-Pt Average of NOx Readings From EcoPhysics and Siemens NOx
Sensor
-0.05
0
0.05
0.1
0.15
0.2
0.25
0.3
0.35
0 200 400 600 800 1000 1200 1400
Time (sec)
NOx (g/sec)
Ecophysics
Siemens

65
y = 1.0467x - 0.0022
R2 = 0.9849
-0.05
0
0.05
0.1
0.15
0.2
0.25
0.3
0.35
-0.05 0 0.05 0.1 0.15 0.2 0.25 0.3 0.35
Ecophysics (NOx g/sec)
Siemens (NOx g/sec)
Ave
Figure 6.4 Correlation of the Two Data Sets with a 9-Pt Average
The NOx levels for the UIS were determined based on the exhaust flow
measurement within the flow tube. Figures 6.5 and 6.6 show the comparison to the LFE
and correlation with the LFE. These data sets were not averaged. It was seen that at low
flow conditions the Pitot tube/differential pressure measurement dropped out, causing
UIS flow to be zero. This error carried through the system calculation and was seen in the
low level NOx measurement error of the previous figures. As shown in Figure 6.6 the
correlation coefficient of the UIS flow tube with the LFE was found to be 0.9588.

66
-100
0
100
200
300
400
500
600
700
800
900
0 200 400 600 800 1000 1200 1400
Time (sec)
Flow (SCFM)
LFE
Flow Tube
Figure 6.5 Comparison of Flow Tube and LFE for NRTC
y = 0.9737x - 6.7354
R2 = 0.9588
0
100
200
300
400
500
600
700
800
900
0 100 200 300 400 500 600 700 800 900
LFE (SCFM)
Flow Tube (SCFM)
Figure 6.6 Correlation of Flow Tube Against Intake LFE

67
Exhaust temperature was a major input variable utilized by the UIS. The UIS flow
tube temperature was used within the program and recorded during testing. Two
thermocouples were placed in the exhaust system and recorded by the EERL system. The
first was placed directly after the exhaust turbine outlet; the second was placed after the
SCR catalyst. Figure 6.7 shows all three sensor values for the NRTC. The outputs show a
similar trend. The effect of the thermal inertia of the catalyst was seen by the lag in the
post SCR temperature. The thermal inertia model discussed in section 4.2.6 was not
utilized during the first round of testing. Figure 6.7 shows that it would not have proved
advantageous to incorporate this model for the NRTC because of the lack of extended
idle conditions, but may prove useful for other transient cycles such as an FTP cycle.
0
50
100
150
200
250
300
350
400
450
0 200 400 600 800 1000 1200
Time (sec)
Temperature C
Exhaust Temperature Post Turbo
Exhaust Temperature Post SCR
Flow System Temperature
Figure 6.7 Temperature Plot for EERL and UIS Thermocouple Outputs
Data was also recorded for comparisons over the ICOMIA E5 cycle. It was seen
from Figure 6.8 that NOx levels were comparable in modes 2, 3 and 4. Over estimation

68
occurred during mode 1, the high speed mode. The sensor dropout was again seen by
NOx levels during the last mode in Figure 6.8 and with flow levels in the last mode of
Figure 6.9. Figure 6.10 shows the EERL and UIS thermocouple outputs. The effect of
thermal inertia of the catalyst was seen during the last mode.
-0.05
0
0.05
0.1
0.15
0.2
0.25
0.3
0.35
0.4
0.45
0.5
0 200 400 600 800 1000 1200 1400 1600
Time (sec)
NOx (g/sec)
Ecophysics
Siemens
Figure 6.8 NOx Comparisons for the EcoPhysics and Siemens Sensor During the
ICOMIA E5 Cycle

69
-100
0
100
200
300
400
500
600
700
800
900
0 200 400 600 800 1000 1200 1400 1600
Time (sec)
SCFM LFE
Flow Tube
Figure 6.9 Flow Comparison of LFE and UIS Flow Tube for ICOMIA E5 Cycle
0
50
100
150
200
250
300
350
400
450
500
0 200 400 600 800 1000 1200 1400
Time (sec)
Temperature C
Post SCR
Post Turbo
Flow System
Figure 6.10 Temperature Plot for EERL and UIS Thermocouple Outputs for
ICOMIA E5 Cycle

70
6.2 NRTC with varied Duty Cycle
After the background runs were completed for the baseline emissions levels,
multiple NRTCs were run. The initial system settings had a urea dope amount of one.
This meant that the urea requested was based on stoichometric reaction of NO with NH3.
Theoretically, if there were no inefficiencies within the system, the reduction in NOx
would have been 100% at this level. Various tests were run with multiple urea dope
amounts. The ‘Urea Dope’ variable was a simple scalar applied to the duty cycle (DC)
input of the injector driver. NRTC were run at 100%, 70% and 50% duty cycle.
Figure 6.11 shows the NOx level as measured by the EcoPhysics analyzer for the
background and urea injection runs. As the dope amount was decreased, the NOx level
increased towards the baseline run. The various duty cycles were applied in order to
minimize the ammonia slip. NOx reduction for the 100% DC, 70% DC and 50% DC
based on cycle average ppm was 63%, 54% and 51%, respectively. NOx reductions based
on g/bhp-hr were 67.4%, 56.0% and 50.0%, respectively.

71
-20
0
20
40
60
80
100
120
140
160
180
0 200 400 600 800 1000 1200
Time (sec)
NOx (ppm) Without SCR
W/ Urea 100% DC
W/ Urea 70% DC
W/Urea 50% DC
Figure 6.11 Run to Run Reduction in NOx (ppm) Based on Varied Duty Cycle
Figure 6.12 shows the corresponding injection rates for the 100% DC, 70% DC
and 50% DC tests. The figure shows that urea injection did not occur when the flow
system temperature was under the threshold of 250º C. The estimated amount of urea
delivered for each of tests was 445, 319 and 241 grams, respectively. The average fuel
used per NRTC was 7,428 grams based on carbon balance. The amount of urea injected
per cycle as a percentage of fuel consumed was 5.99%, 4.29% and 3.24%, respectively.
Literature suggested that the maximum values should be no more than 5% and less
dependent upon cycle.

72
0
50
100
150
200
250
300
350
400
0 200 400 600 800 1000 1200
Time (sec)
Temperature C
0
0.2
0.4
0.6
0.8
1
1.2
Urea Injection Rate (g/sec)
Flow System Temperature
Urea Injection Rate 50% DC
70% DC
100% DC
Figure 6.12 Urea Injection Rate Based on DC Requested and Flow Tube
Temperature
Each of the various NRTC had significant ammonia slip. If the entire system was
overdosed with urea, then CO spikes should have occurred with the ammonia slip. Figure
6.13 shows the CO for the background NRTC and the urea injection cycles. CO spikes or
significant cycle to cycle variation was not found. CO levels for the NRTC background,
100% DC, 70% DC and 50% DC cycles were 1.57, 1.61, 1.67, and 1.55 g/bhp-hr,
respectively.

73
-100
0
100
200
300
400
500
600
700
0 200 400 600 800 1000 1200
Time (sec)
CO ppm
Without SCR
100% DC
70% DC
50% DC
Figure 6.13 NRTC CO Emissions for Various Cycles with and Without Urea
Injection
With respect to the goal of minimizing ammonia slip, the NRTC with 100% DC
produced the worst results. Figure 6.14 shows the dilute ammonia levels in ppm that were
recorded for the 100% DC test. Due to the transient nature of the test and the differencing
method of the EcoPhysics analyzer background ammonia levels were between -15 and
+15 ppm. The un-calibrated AO2020 was over ranged during the test to above its 50 ppm
limit. Peak dilute ammonia slip from the EcoPhysics was 50 ppm.

74
-30
-20
-10
0
10
20
30
40
50
60
0 200 400 600 800 1000 1200
Time (sec)
Ammonia (ppm)
Ecophysics
Uncalibrated AO
Without SCR
Figure 6.14 Dilute Ammonia Levels for NRTC 100% DC
When the goal of 50% NOx reduction with minimized ammonia slip was
examined, the NRTC with 50% DC was the best test. Figures 6.15 and 6.16 illustrate the
pertinent results for this test. Figure 6.15 again shows the NOx levels with and without
the 50% DC urea injection. The figure also contained a continuous NOx reduction
percentage line. Negative reduction percentages and those above 100% were set to 0 and
100% values. Figure 6.16 shows the ammonia slip for this cycle. The maximum
EcoPhysics dilute ammonia slip value was 13 ppm, with a minimum of -4 ppm and a
cycle average of 5 ppm.

75
-20
0
20
40
60
80
100
120
140
160
180
0 200 400 600 800 1000 1200
Time (sec)
NOx (ppm)
0
20
40
60
80
100
120
NOx Reduction (%)
Without SCR
W/ Urea Injection 50% DC
Reduction
Figure 6.15 NRTC with 50% DC NOx Results and Continuous Reduction
Percentage
Figure 6.16 Dilute Ammonia Results for NRTC with 50% DC
-25
-20
-15
-10
-5
0
5
10
15
20
25
30
0 200 400 600 800 1000 1200
Time (sec)
Ammonia (ppm)
Ecophysics
Uncalibrated AO
Without SCR

76
6.3 ICOMIA E5 with 50% Duty Cycle
The multiple NRTC runs were used to make the necessary changes to the system
in order to meet the target NOx reduction of 50% while minimizing ammonia slip
through software control. The best NRTC results based on minimization of ammonia slip
were obtained by setting the urea dope amount or DC to 50%. This setting was then
applied to the ICOMIA E5 cycle. Figure 6.17 shows the results obtained from three E5
cycles. The first data was the NOx levels from the background run without urea injection;
the second was a clean up run after the 100% DC NRTC. The 50% DC test results are
also shown along with continuous NOx reduction. The clean up run was included to
visually illustrate the available ammonia storage capacity of the catalyst. The maximum
reduction level based on ppm was 52.90%. The average cycle NOx reduction based on
ppm was 33.93%. The reduction results based ppm did not fairly represent the NOx
reduction capabilities of the system since the cycle average included all idle modes.
When the idle periods were included, the system was above the 250º C limit only 67% of
the time. Mode by mode values are represented later.

77
-50
0
50
100
150
200
0 200 400 600 800 1000 1200 1400
Time (sec)
NOx (ppm)
0
10
20
30
40
50
60
Reduction (%)
Without SCR
50% DC
Clean Up Run
Reduction Percentage
Figure 6.17 ICOMIA E5 Test Results with NOx Reduction Percentage for 50% DC

78
Dilute ammonia samples were also collected for the E5 50% DC run. Figure 6.18
represents the background ammonia levels without urea injection and the values for the
urea injection run. The maximum value from the EcoPhysics was 23.27 ppm of dilute
ammonia, with a minimum value of 0.96 ppm and a cycle average value of 7.40 ppm.
Figure 6.18 Dilute Ammonia Slip Results for E5 50% DC
-5
0
5
10
15
20
25
30
35
40
45
0 200 400 600 800 1000 1200 1400
Time (sec)
Dilute Ammonia Slip (ppm)
Ecophysics
Uncalibrated AO
Without SCR

79
Figure 6.19 shows the carbon monoxide levels for the background and 50% DC
tests. The results again fluctuated between +/- 15 ppm between the cycles. No significant
spikes or variations were found.
-20
0
20
40
60
80
100
120
0 200 400 600 800 1000 1200 1400
Time (sec)
CO (ppm)
-20
-15
-10
-5
0
5
10
15
Difference in CO (ppm)
Without SCR
50% DC
Difference
Figure 6.19 E5 Carbon Monoxide Results

80
In order to better represent the NOx reduction capabilities of the system Table 6.1
was provided. The table contains mode by mode data for the E5 50% DC test. Higher
reduction capabilities were found per mode on a g/bhp-hr level.
Table 6.1 ICOMIA E5 Mode by Mode Data
Mode 1 2 3 4 5 6
Speed % Low idle 100 90.58 79.46 62.54 Low idle
Torque % 0 100 78.91 57.20 29.55 0
Time Weighting Added for
idle start up 0.08 0.13 0.17 0.32 0.30
Time of collection (sec) 60 120 195 255 480 450
Baseline Nox g/bhp-hr -- 3.48 3.65 3.44 4.69 --
With Urea SCR 50%DC -- 2.03 1.9 1.79 2.64 --
Reduction % -- 41.67 47.95 47.97 43.71 --
Fuel used (grams) 31.36 1846 2150 1932 1796 238.6
Urea delivered (grams) 0 160.45 168.46 132.86 147.80 0.06
Urea as % of Fuel 0 8.69 7.84 6.88 8.23 Negligible

81
7 Conclusion and Recommendations
From the discussed results, it has been shown that an independently controlled,
stand-alone urea SCR system was feasible for retrofit applications to reduce diesel engine
NOx levels. A system was designed, constructed and tested to demonstrate its
functionality. The system had four basic input signals: differential pressure, absolute
pressure, temperature and NOx concentration. The system was controlled independently
of engine parameters. An injection system was able to deliver metered amounts of urea to
the exhaust stream based on a system algorithm. Testing at WVU’s EERL showed no
system failure throughout multiple tests over a two day period.
It was found that the target reduction of 50% was possible, but dependent upon
test cycle. Higher reduction was possible during transient cycles because of the lack of
idle time and buffer ability of the catalyst. Reduction fell to below the target of 50% only
due to software control to minimize ammonia slip. The system showed NOx reduction
capabilities of 41-67% (g/bhp-hr) based on cycle or mode values with and without urea
injection. The system showed significant dilute ammonia slip with higher NOx reduction
values. The lower average values of 5-7 ppm may be deemed acceptable, but are not raw
numbers. Dilution ratios would raise the average raw concentration to 25-35 ppm. Even
though ammonia slip was detected, no noticeable CO spikes of greater than +/- 15 ppm
occurred in either the NRTC or ICOMIA E5 cycles. Implementation of the UIS into the
exhaust system had no negative impacts on engine performance. NOx values and work
values for the NRTC were consistent throughout the two day testing and were the same
as results obtained from previous testing work of this engine.

82
From the preceding conclusions, recommendations were made to possibly
increase the urea injection system performance on NOx reduction while minimizing
ammonia slip. Since no noticeable spikes in CO occurred, the ammonia slip may have
been a result of mal-distribution of the urea on SCR bricks. The proposed mal-
distribution would most likely have been the result of poor atomization from the urea
injection system. Pooling due to wall impingement did occur causing a small leak of
liquid post injection plane and pre SCR. The injection rate was fixed at 7 Hz allowing for
a maximum duration of injection of nearly 142 milliseconds. Due to the high flow of this
injector a maximum duty cycle request of no greater than 32% for the NRTC was ever
demanded. This equated to maximum injection events of no greater than 45 milliseconds.
For further research, the injection rate could be double or tripled for better atomization on
a per injection event basis. Since the mass per injection event would decrease, the fluid
moment would decrease leading to enhanced mixing with the exhaust stream. The
distance from the plane of injection to SCR face could also be increased from the
previous value of 5 diameters to 7-10 diameters for enhanced turbulent mixing. If these
changes yielded significant improvements in ammonia slip, then the DC could again be
increased to improve the overall NOx reduction percentage.
Other recommendations would include a standard length between piping bends
and Pitot tubes to ensure a fully developed velocity profile, averaging methods to
decrease the noise of low pressure measurements, lowered temperature threshold to
200º C, and the use of a temperature estimation model.

83
If all of these changes still yielded unacceptable ammonia slip then a passive post-
SCR oxidation catalyst could be utilized to eliminate ammonia slip. Further research on
this system and other variations should be done as the results of this research are
promising for a stand alone urea SCR system to be applicable in retrofit applications for
diesel engines.

84
References:
1.) R. Mital, J. Li, S.C. Huang, B.J. Strola, R.C. Yu, J.A. Anderson and K. Howden, “Diesel Exhaust Emissions Control for Light Duty Vehicles,” SAE 2003-01-0041, 2003.
2.) W.W. Pulkrabek. Engineering Fundamentals of the Internal Combustion
Engine. New Jersey: Prentice Hall, 2004.
3.) “Air Toxics in New England.” U.S. Environmental Protection Agency. 2007.
EPA. 16 Aug. 2007 < http://www.epa.gov/ne/eco/airtox/diesel.html>.
4.) J. Gleshoff, M. Pfeifer, A. Shafer-Sindlinger, P.C. Spurk, G. Garr, T. Leprince and M. Crocker, “Advanced Urea SCR Catalysts for Automotive Applications,” SAE 2001-01-0514, 2001.
5.) W. Fraser, P. Marchman, D. Martinez and D. Thomas. “Reducing Air Emissions
from Marine Diesel Engines: Regional Recommendations.”, June 3, 2004.
6.) D. Kodjack, F. Kamakate, and J. Dixon. “New Study: Air Pollution from Ships
Overtakes Road Traffic.” The International Council On Clean Transportation.
March 22, 2007.
7.) “Overview of EPA’s Emission Standards for Marine Engines.” U.S.
Environmental Protection Agency. EPA420-F-04-031. August 2004.
8.) “Median Life, Annual Activity, and Load Factor Values fro Nonraod Engine
Emissions Modeling.” U.S. Environmental Protection Agency. EPA420-P-04-004.
April 2004.
9.) “Staten Island Ferry Alice Austen Vessel SCR Demonstration Project: Final
Report.” M.J. Bradley & Associates, Inc. August 2006.
< www.mjbradley.com/documents/Austen_Alice_Report_Final_31aug06.pdf>.
10.) C. Witherspoon, Executive Officer, California Air Resource Board.
11.) “What Is the Texas Emission Reduction Plan (TERP)?” Texas Commission on
Environmental Quality. 20 April 2008.
< http://www.tceq.state.tx.us/implementation/air/terp/program_info.html>.
12.) “A Comparative Analysis of the Feasibility and Cost of Compliance with
Potential Future Emission Standards for Heavy- Duty Vehicles Using Diesel or
Natural Gas.” Sierra Reseach, Inc. SR00-0202. February 2000. < http://www.cleanairnet.org/infopool/1411/articles-59978_resource_1.pdf>.
13.) M.D. Kass, J.F. Thomas, S.A. Lewis, J.M. Storey, N. Domingo, R.L. Graves, A.Panov and P. Park, “ Selective Catalytic Reduction of NOx Emissions from a 5.9 Liter Diesel Engine Using Ethanol as a Reductant,” SAE 2003-01-3244, 2003.

85
14.) S. Choi, Y. Yoon, S. Kim, G. Yeo and H. Han, “Development of Urea-SCR
System for Light-Duty Diesel Passenger Car,” SAE 2001-01-0519, 2001.
15.) C. Lambert, R. Hammerle, R. McGill, M. Khair and C. Sharp, “Technical Advantages of Urea SCR for Light-Duty and Heavy-Duty Diesel Vehicle Applications,” SAE 2004-01-1292, 2004.
16.) C.M. Schar, C.H. Onder, H.P Geering and M. Elsener, “Control-Oriented Model of an SCR Catalytic Converter System,” SAE 2004-01-0153, 2004.
17.) T. Kentaro. “High Performance Catalysts to Prevent Ammonia Slip.” Kagaku
to Kogyo. Vol. 56, No. 6, Pg. 682. 2003. ISSN: 0022-7684.
18.) J. Gieshoff, A. Schafer-Sindlinger, P.C. Spurk, J.A.A. van den Tillaart, and G.
Garr, “Improved SCR Systems for Heavy Duty Applications,” SAE 2000-01-0189,
2000.
19.) C. Havenith, R. P. Verbeek, D. M. Heaton and P. van Sloten, “Development of a
Urea DeNOx Catalyst Concept for European Ultra-Low Emissions Heavy-Duty
Diesel Engines,” SAE 95652, 1995.
20.) I. Gekas, P. Gabrielsson, K. Johansen, L. Nyengaard and T. Lund, “Urea-SCR
Catalyst System Selection for Fuel and PM Optimized Engines and a Demonstration
of a Novel Urea Injection System,” SAE 2002-01-0289, 2002.
21.) “75-90% NOx Reduction for Diesel & Natural Gas Engines.” RJM ARIS
Technology. 14 June 2007 < http://rjm.com/html/a_nox_control.htm>.
22.) H.T. Hug, A. Mayer and A. Hartenstein, “Off-Highway Exhaust Gas After-
Treatment: Combining Urea-SCR, Oxidation Catalysis and Traps,” SAE 930363,
1993.
23.) N. Kato, H. Kurachi and Y. Hamada, “Thick Film ZrO2 NOx Sensor for the
Measurment of Low NOx Concentrations,” SAE 980170, 1998.
24.) “Order and Consent Decree: Mack Truck Corporation and Renault V.I.” U.S.
Environmental Protection Agency. 10 May 2008.
< http://www.epa.gov/compliance/resources/decrees/civil/caa/mackall.pdf>.
25.) W. Miller. “Development of Urea-SCR For Heavy-Duty Trucks Demonstration
Update.” Mack Trucks, Inc. 2000.
26.) A. P. Walker, R. Allison. “The Development and Performance of the Compact
SCR-Trap System: A 4-Way Diesel Emission Control System,”
SAE 2003-01-0778, 2003.

86
27.) K. Hirata, N. Masaki, H. Ueno and H. Akagawa, “Development of Urea-SCR
system for Heavy-Duty Commercial Vehicles,” SAE 2005-01-1860. 2005.
28.) S. J. Jeong and W. S. Kim. “Simulation on the Optimum Shape and Location of
Urea Injector for Urea-SCR System of Heavy-duty Diesel Engine to Prevent NH3
Slip.” SAE 2005-01-3886. 2005.
29.) T.V. Johnson, “Diesel Emission Control Technology –2003 in Review,” SAE
2004-01-0070. 2004.
30.) West Virginia University Challenge X Team. “2006 Spring Technical Report.”
Submitted to General Motors 2006. < http://www.challengex.org>.
31.) “TerraCair Ultrapure Diesel Exhaust Treatment.” Terra Industries.
15 May 2008.
<http://www.terraindustries.com/our_products/urea/terracair/
terracair_brochure.pdf>.
32.) A.F. Mills. “Basic Heat and Mass Transfer.” Prentice Hall. New Jersey. 1999.
33.) D. Young, B. Munson, and T. Okiishii. “A Brief Introduction to Fluid
Mechanics.” John Wiley and Sons, Inc. New Jersey. 2004.

87
Appendix A

88

89

90

91

92

93