Embed Size (px)
Citation preview

Design and Testing of an Illuminance Management System
A. Terry Bahill, Ph.D., P.E.
Systems and Industrial Engineering,
University of Arizona, Tucson, Arizona
Students, the professor, and eight systems engineering advisors for a class project in the fall of
2009 designed a light management system for an operations room for astronomers on Mauna
Kea on top of Hawaii. For these astronomers who need constant illumination, BIMS is a light
and energy management system that will make them more comfortable and productive, and will
save money. Unlike conventional lights and blinds, BIMS will automatically control the
illuminance in the room when the sun’s or the moon’s light rays change. The documentation for
this design is lengthy; it has been condensed for this article: Parts that do not concern test and
evaluation have been eliminated.
Key words: Requirements, systems engineering process, SysML, UML, validation,
verification.
This article shows how systems engi-neering principles (Sage and Rouse2009) can be applied to test andevaluation. It is based on a set ofdocuments written in the fall of 2009
with weekly iterations to help the systems engineeringstudents at the University of Arizona model and designsystems. This set of documents was not intended to bea complete design; instead, it shows a few goodexamples of each type of item that might be in atypical design document. It has only one use case andonly one trade-off study. The full set of documents islocated at http://www.sie.arizona.edu/sysengr/sie554/BIMS/. This site has more examples in each section,but before discussing this case study, we must explainour set of documents (http://www.sie.arizona.edu/sysengr/sie554/8docs.doc; Chapman, Bahill, and Wy-more 1992; Pinewood 1992; Wymore 1993).
The eight systemsengineering documents
Document 1: The Problem Situation Document is theexecutive summary. It specifies the system’s mission,explains the customers’ needs and expectations, statesthe goals of the project, defines the business needs,prescribes the system’s capabilities, delineates the scopeof the system, expresses the concept of operations,describes the stakeholders, presents the key decisionsthat must be made, shows the incipient architecture,and (in the final version) highlights the preferred
alternatives. It is written in natural language and isintended for management and the public.
Document 2: The Customer Requirements Document isa description of the problem in plain language. It isbased on the use cases of document 6. It is intended formanagement, the customer, and engineering.
Document 3: The Derived Requirements Document is atechnical description (or model) of the problemstatement and the requirements of documents 1 and2. Each requirement in this document must trace todocument 1 or 2. Alternative names for this documentare Technical Requirements and Design Require-ments. The audience for document 3 is engineering.
Document 4: The Verification and Validation Docu-
ment has four parts. Validating the system meansbuilding the right system: making sure that the systemdoes what it is supposed to do. Verifying the systemmeans building the system right: ensuring that thesystem complies with its requirements and conforms toits design. Verifying requirements means proving thateach requirement has been satisfied. Validatingrequirements means ensuring that the set of require-ments is correct, complete, and consistent; that a modelcan be created that satisfies the requirements; that areal-world solution can be built that satisfies therequirements; and that this real-world solution can betested to prove that it satisfies the requirements. Theintended audience for document 4 is systems engi-neering, test and evaluation engineering, and thecustomer.
ITEA Journal 2010; 31: 63–89
Copyright ’ 2010 by the International Test and Evaluation Association
31(1) N March 2010 63

Document 5: The Concept Exploration Document isused to study alternative system designs throughbrainstorming, modeling, simulation, prototypes, andfinally the complete system (Daniels, Werner, andBahill 2001; Smith et al. 2007). In early iterations ofdocument 5, this exploration helps produce theincipient system architecture (Rechtin 2000). Thisdocument is rewritten continually as more informationbecomes available. Evaluation criteria are derived froma subset of the trade-off requirements. They are used inthe heart of later iterations, which is a trade-off studywhere the preferred alternatives are suggested by thedata. A sensitivity analysis identifies the most impor-tant parameters in a trade-off study; often these are thecost drivers that are worthy of further investment(Smith et al. 2008). This is one of the most populardocuments. It should be readable by the public.
Document 6: The Use Case Model contains many usecase reports that in the aggregate describe the requiredbehavior of the proposed system (Daniels and Bahill2004). The system design and the testing procedureshould be based on these use cases. The early use casesshould be independent of potential solutions. Theintended audience for document 6 is management,engineering, the customer, and the public.
Document 7: The Design Model shows the objects thatimplement the required functionality of the system.System interfaces and test equipment are designed inthis document. Its intended audience is engineering.
Document 8: The Mappings and Management Docu-ment shows the mappings between the documents. Italso includes activity diagrams, the risk analysis,schedule information (Gantt charts, program evalua-tion review technique charts, etc.), the project workbreakdown structure, the business plan, and a log ofmeetings with the customer.
These eight documents are often called a systemsengineering management plan. They are living docu-ments: They grow and are continually updatedthroughout the entire system life cycle. They are notwritten sequentially, but they are structured so they canbe read sequentially. The order in which a scientificarticle is written is usually not Introduction, Methods,Results, Discussion, and Conclusion, but it is the orderin which a scientific article is usually read.
‘‘Begin at the beginning,’’ the King said gravely,‘‘and go on ’til you come to the end; then stop.’’(From Lewis Carroll, Alice’s Adventures inWonderland.)
Bahill’s system design process is a use-case-basediterative process. It starts with a problem statement in apreliminary document 1 (Problem Situation). Next we
make a rough schedule of who does what and when,and we put that in document 8 (Mappings andManagement). Those were brief activities. Now wewrite the use cases that describe the behavior of thesystem. While we are writing the use cases, we developfunctional and nonfunctional requirements. These gointo a fairly large document 6 (Use Case Model). Thecustomer requirements (just discovered) go intodocument 2 (Customer Requirements) and also intothe requirements verification section of document 4(Verification and Validation). Design of tests can startas soon as the use cases are written. The systemsengineers then derive the technical requirements, andthe test engineers create the test requirements that gointo document 3 (Derived Requirements). Now thatwe have some requirements, we can form evaluationcriteria that will be used in the trade-off studies ofdocument 5 (Concept Exploration). Document 7(Design Model) contains Unified Modeling Language(UML) and Systems Modeling Language (SysML)diagrams that show the behavior and structure of theproposed system. This system design process is veryiterative. Creating these eight documents is not a serialprocess. There must be many iterations, and there aremany opportunities for parallel processing.
This article is based on one of the later iterations ofthe full set of design documents for the BIMS. It canbe read from beginning to end, but it might be easier toread this article in this order: document 1, 6, 2, 3, 4, 5,7, and 8.
Bahill Intelligent Computer Systems(BICS) Illuminance Management SystemDocument 1: Problem SituationProduct position statement. For astronomers whoneed constant illuminance, the BICS IlluminanceManagement System (BIMS) is a light and energymanagement system that will make them morecomfortable and productive, and will save money.Unlike conventional lights and blinds, BIMS willautomatically control the illuminance in the roomwhen the light rays of the sun or moon change.
Concept of operations (ConOps). Our customer (theNational Optical Astronomy Observatory [NOAO])needs a total light-management system for theoperations rooms of telescope enclosures to be builton Mauna Kea in Hawaii and on Cerro Pachon nearVicuna in Chile. However, the system must bedesigned so that it can be adapted for other structures.It should be the basis of a BICS company standard thatwill be sold in all commercial and residential venues.This system will be named the BICS IlluminanceManagement System.
Bahill
64 ITEA Journal

The system must conserve energy and provide anatural daylight color spectrum. An efficient way ofdoing this is to have the system use daylight instead ofartificial lighting as much as possible. BIMS will bepolitically correct (environmentally green) because itwill use renewable-energy electric generators, such assolar panels or wind turbines, but other electricgeneration alternatives such as geothermal systemsusing the Kilauea volcano should be considered.
Astronomers will use the operations room day andnight while observing both the sun and nighttimetargets such as stars and galaxies. In the daytime, theastronomers want a constant illuminance of 500 lux.The operations room will have a large east-facingwindow. As the sun rises, the lights can be turned on.By midmorning, the lights can be dimmed and thewindow screens or curtains can be gradually opened.After noon, the window screens or curtains can beopened wide. As the sun sets, the lighting level willgradually decrease following a predetermined program.
During the night, the astronomers will be contin-ually going in and out of the operations room. Therewill be no lights outside because that would interferewith the telescopes. So we want the light inside theoperations room to be dim and constant so that (1) theastronomers do not have to wait minutes for their eyesto dark adapt and (2) the light inside does not leak outand interfere with the telescopes. Therefore, we wantthe inside illuminance at night to be 0.4 lux. This isroughly the illuminance of a full moon. So your systemwill have to accommodate phases of the moon, itsrising and setting, and clouds that might obscure it.Figure 1 shows the scope of this project.
BICS company policy
All systems shall have built-in self test (BiST) with acontinuous visual indicator of status. At startup allsystems shall do self tests. In addition, whenever thesystem is not serving the customer, it should beperforming BiSTs.
All systems shall have the BICS touch, feel, and look.The BICS look includes options that portray elegance.
All systems shall use the International System of Units(SI). Input and output can be in familiar units, butall specifications and calculations shall be in SI units.
Our design process uses sequential incremental iterations(simulate a little, build a little, test a little, repeat).
It is company policy that nondevelopmental productsbe considered the primary solution to addressingcustomer needs with customized implementationsbeing secondary solutions. While the primarynondevelopmental products addressed in this policyare Commercial off the Shelf (COTS), the phraseprimary nondevelopmental products also includes
Government off the Shelf (GOTS), Open Sourcesoftware, and previously developed in-house prod-ucts.
System designs shall be satisficing designs, neveroptimal designs (Simon 1957, 1962).
All system designs shall follow the principles of gooddesign presented in Bahill and Botta (2008) andhttp://www.sie.arizona.edu/sysengr/publishedPapers/goodDesignPrinciples.pdf.
The on-line BIMS document has more examples ofcompany policy.
Applicable standards. Connection to the alternatingcurrent (AC) power grid must comply with theUL1741/IEEE1547 standard. The system must com-ply with Underwriters Laboratories, ISO 15288, EAI-632, OSHA, EPA environmental regulations, Nation-al Electrical Code (NEC), and Federal Communica-tions Commission (FCC) regulations concerning ourproduct’s emissions and FCC regulations concerningthe 434-MHz electromagnetic spectrum bandwidthallocation. The online BIMS document has otherexamples of applicable standards.
Stakeholders. BIMS stakeholders include architects,contractors, dealers, salespeople, end users, astrono-mers, NOAO, university students, a surrogate cus-tomer (an in-house person designated to haveknowledge of end user needs and expectations), and
Figure 1. Block diagram showing the scope of a BIMS.
Illuminance Management Systems Engineering
31(1) N March 2010 65

potential victims (such as other astronomers on themountain, construction workers, Hawaii Electric LightCompany Inc., the environment, and Poliahu the snowgoddess of Mauna Kea).
Ubiquitous language glossary
brightness: The amount of light coming from a unitarea of a flat surface that is seen by the human eye.Brightness is perceived, not measured, so it has nounits.
capacity factor: Electric generators do not generateelectricity at their maximum rate 24 hours a day, 7 daysa week. The system must be shut down formaintenance and repairs, and output will be reducedwhen the loads are small. In addition, renewable-energy systems will have reduced output when, forexample, clouds cover the sun or there is no wind. Thecapacity factor is defined for specified period: It is theactual electricity generated divided by the energy thattheoretically could have been generated if the systemran at maximum capacity for the whole period.
CapacityFactor~
ActualAverageDailyElectricityGenerated(kWh=d)
RatedPower(kW)|24h
d
The capacity factor of renewable-energy electricgenerators is typically 5% to 40%. For photovoltaicsolar power, the capacity factor is around 17%.
dark adaptation: When a person goes from sunlight todarkness, the retina can adjust its gain over nine ordersof magnitude. But this adaptation takes around10 minutes. This may be why pirates wore black eyepatches. When a pirate (probably just the captain or thefirst mate) was above deck, he put a black patch overone eye: That eye then became dark adapted. When hewent below deck, where it was dark, he would take thepatch off and the dark-adapted eye would immediatelybe able to see. When the pirate returned topside, hewould replace the black patch on his eye.
electric generators: Electric generators transformenvironmental energy into electric energy. Here aresome common examples: photovoltaic solar panels;wind turbines; ocean currents, waves, and tides;hydroelectric dams; tapping static electricity storedin the atmosphere; and geothermal systems based onthe Kilauea volcano. An electric generator generateselectricity. It transforms another form of energy intoelectric energy. It does not create energy or electricity.(So, in this context, generate does not mean create.)Power is the time rate of change of electric energy.
energy storage units: Energy storage units smooth theelectric grid voltage when the generating environmentvaries. However, energy need not be stored as
electricity. The energy storage units could be electric(like super capacitors), chemical (like batteries),thermal (like a big rock, a pond, molten salt, or ice),potential (like pumping water between two altitudes orcompressed air tanks), or kinetic (like a big flywheel).
expected average daily electricity generation: Thisterm estimates the amount of electricity that aparticular system would be expected to generate perday in a particular location (kWh/d).
illuminance: The amount of visible light coming froma source (such as the sun, the moon or a light bulb)that falls on a unit area of a surface. Its units are lux.One lux is one lumen per square meter. One lumenper square foot is one footcandle.
insolation: The amount of solar radiation that strikes asingle location over a given period (usually 1 day) iscalled insolation. It has units of kilowatt-hours persquare meter per day (kWh/[m2?d]).
inverter: Renewable-energy electric generators pro-duce direct current (DC) or some other form ofvoltage. The AC electric power grid has very wellcontrolled 60-Hz sinusoidal AC. Generally aninverter changes DC into AC.
luminance: The amount of light coming in a particulardirection from a unit area of a flat surface (such as awall, a table, or a computer monitor). Luminancedepends on the light source, the surface, and theviewing angle. Its units are candelas per square meter.
light blockers: Light blockers alter the amount of lightcoming into or out of a room. Examples are blinds,shades, screens, curtains, drapes, shutters, polarizedwindows, skylights, window films that changetransparency with electricity, and opaque screens thatunroll from the roof in front of the windows.
rated power: Rated power is the power that the systemwas designed to generate in steady-state at thenormal operating point. This is usually near themaximum power. It is also called generating capacityand nameplate capacity.
use case: A use case is an abstraction of required functionsof a system. A use case produces an observable result ofvalue to a user. A typical system will have many usecases, each of which satisfies a goal of a particular user.Each use case describes a sequence of interactionsbetween one or more actors and the system. Thissequence of interactions is described in a use casenarrative, and the relationships between the systemand its actors are portrayed in use case diagrams.Names of the use cases are set in the Verdana font.
Document 2: Customer RequirementsThe system requirements are discovered in the use
cases of document 6 (Daniels and Bahill 2004). They
Bahill
66 ITEA Journal

are formalized in document 2. Test engineers can usethese requirements immediately to start writing testcases and test procedures. Finally new requirements arederived based on the customer requirements, themission statement, and the concept of operation(Bahill and Dean 2009), and they are put intodocument 3 (Derived Requirements).
CuR1-1 The system shall use an ephemeris, tables,models, firmware, or similar methods to anticipatesunrise, sunset, moonrise, moonset, and the phase ofthe moon. Note: A ROM-based ephemeris isavailable commercially. DeriveReqt: Req 1-1 ofControl Illuminance During the Day use case.Notes: DeriveReqt means that this requirement isderived from the indicated requirement in the usecases.
CuR1-2 The system shall control the illuminance ofthe lights. DeriveReqt: Req 1-2 of ControlIlluminance During the Day use case.
CuR1-3 The system shall control the opening andclosing of window screens or curtains. DeriveReqt:Req 1-3 of Control Illuminance During theDay use case.
CuR1-4 The system shall sense the illuminance in theoperations room. DeriveReqt: Req 1-4 of ControlIlluminance During the Day use case.
CuR1-5 The system shall buy electricity from and sellelectricity to the AC electric power grid. DeriveR-eqt: Req 1-5 of Control Illuminance Duringthe Day use case.
CuR1-6 The system shall exchange electricity betweenthe DC electric generator and the energy storagedevice. DeriveReqt: Req 1-6 of Control Illumi-nance During the Day use case. This require-ment was removed by A. T. Bahill October 17,2009.
CuR1-7 The system shall execute Built-in Self Tests(BiST). DeriveReqt: Req 1-6 of Control Illumi-nance During the Day use case. Mandated byBICS company policy.
CuR1-8 The system shall maintain the daytimeilluminance in the operations room at 500 6 50 lux(<50 6 5 fc). Trace to CuR1-2, CuR1-3, andCuR1-4. DeriveReqt: Req 1-8 of Control Illumi-nance During the Day use case.
CuR1-9 The system shall maintain the nighttimeilluminance in the operations room at 0.4 6 0.2 lux(<0.04 6 0.02 fc). Trace to CuR1-2, CuR1-3, andCuR1-4. DeriveReqt: Req 1-9 of Control Illumi-nance During the Day use case.
CuR1-10 The system shall generate electricity at a costthat is competitive with commercial electricity costsat that location, after federal subsidies, etc. Trace to
CuR1-5 and CuR1-6. DeriveReqt: Req 1-10 ofControl Illuminance During the Day use case.
Mandatory requirements. This mandatory require-ments section contains the key decisions of document 1as well as some additional requirements. Mandatoryrequirements specify necessary and sufficient capabil-ities, use the verb shall, are passed or failed with no inbetween and should not be included in trade-offstudies. An example is ‘‘The system shall not violatefederal, state, or local laws.’’
The system shall have renewable-energy electricgenerators. Rationale: This is a political decision,not an economic or scientific decision. It is justifiedin document 8.
The system shall include all equipment needed forconnecting to the local AC electric power grid.
The system shall satisfy all rules, regulations, andstandards necessary for connecting to the local ACelectric power grid.
The system shall not have local energy storage units.Rationale: Grid-connected electric generators do notneed energy storage units such as batteries. InOctober 2009, Bill Henry of TEP said that very fewof TEP’s customers have batteries. Subsequently,Terry Bahill, president of BICS, decided that theBIMS will not have energy storage units.
The renewable-energy electric generators shall havethe capability of supplying the operations room withan average daily electricity generation of 40 kWh/d.This result is derived in the analysis at NFPR1-4.
The system shall be designed with the following siteconstraints. The average ground wind speed at thetelescope site on Mauna Kea is 10 miles/h (4.5 m/s).Yearly average insolation is 6 kWh/(m2 d). Averageair density for July is 0.76 kg/m3 (Bahill, Baldwin,and Ramberg 2009). This means that if theastronomers were to play a baseball game in the caldera,a hit that would travel 365 feet in San Francisco wouldtravel 430 feet on Mauna Kea.
Renewable-energy electric generators shall not inter-fere with any of the telescopes on the summit.
Mandatory requirements are not tested only once attotal system test. They are monitored continually.They are discussed at every design review. Becausethey are so important, some mandatory requirementswill become technical performance measures(TPMs) (Bahill and Dean 2009). The requirementfor an average daily electricity generation of 40 kWh/d is a prime candidate for a TPM.
Model mapping rules. Throughout the design of asystem many models will be made. Usually each
Illuminance Management Systems Engineering
31(1) N March 2010 67
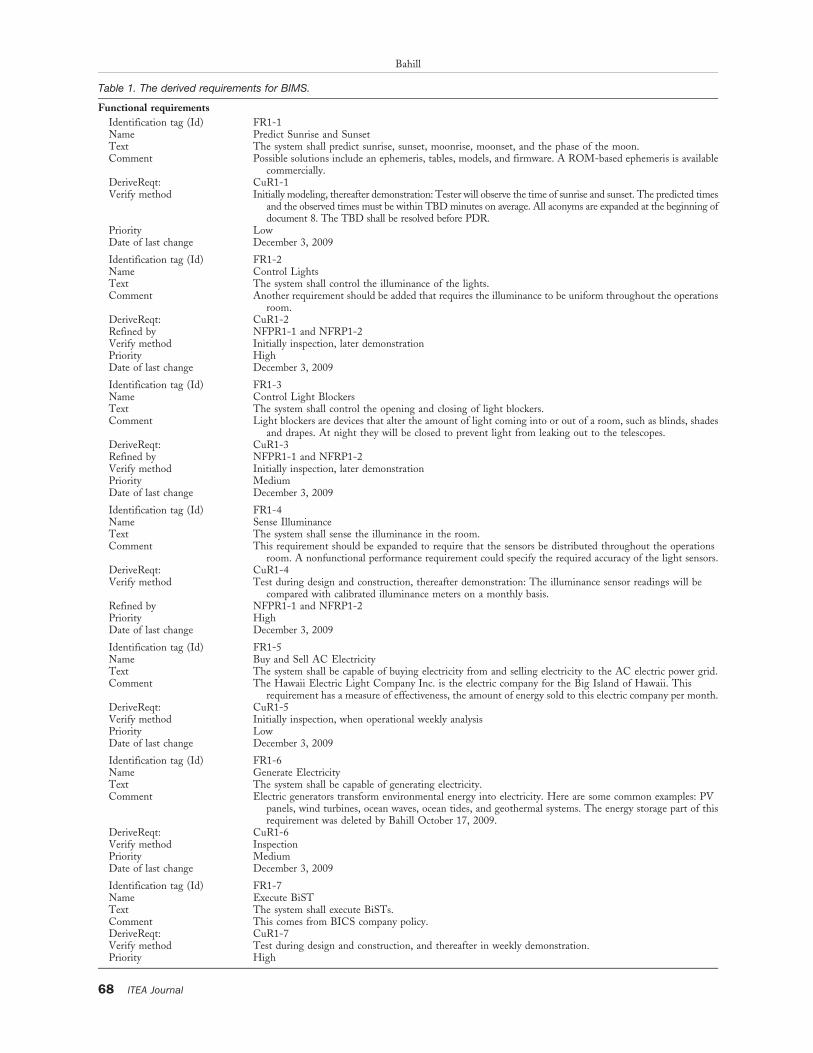
Table 1. The derived requirements for BIMS.
Functional requirements
Identification tag (Id) FR1-1Name Predict Sunrise and SunsetText The system shall predict sunrise, sunset, moonrise, moonset, and the phase of the moon.Comment Possible solutions include an ephemeris, tables, models, and firmware. A ROM-based ephemeris is available
commercially.DeriveReqt: CuR1-1Verify method Initially modeling, thereafter demonstration: Tester will observe the time of sunrise and sunset. The predicted times
and the observed times must be within TBD minutes on average. All aconyms are expanded at the beginning ofdocument 8. The TBD shall be resolved before PDR.
Priority LowDate of last change December 3, 2009
Identification tag (Id) FR1-2Name Control LightsText The system shall control the illuminance of the lights.Comment Another requirement should be added that requires the illuminance to be uniform throughout the operations
room.DeriveReqt: CuR1-2Refined by NFPR1-1 and NFRP1-2Verify method Initially inspection, later demonstrationPriority HighDate of last change December 3, 2009
Identification tag (Id) FR1-3Name Control Light BlockersText The system shall control the opening and closing of light blockers.Comment Light blockers are devices that alter the amount of light coming into or out of a room, such as blinds, shades
and drapes. At night they will be closed to prevent light from leaking out to the telescopes.DeriveReqt: CuR1-3Refined by NFPR1-1 and NFRP1-2Verify method Initially inspection, later demonstrationPriority MediumDate of last change December 3, 2009
Identification tag (Id) FR1-4Name Sense IlluminanceText The system shall sense the illuminance in the room.Comment This requirement should be expanded to require that the sensors be distributed throughout the operations
room. A nonfunctional performance requirement could specify the required accuracy of the light sensors.DeriveReqt: CuR1-4Verify method Test during design and construction, thereafter demonstration: The illuminance sensor readings will be
compared with calibrated illuminance meters on a monthly basis.Refined by NFPR1-1 and NFRP1-2Priority HighDate of last change December 3, 2009
Identification tag (Id) FR1-5Name Buy and Sell AC ElectricityText The system shall be capable of buying electricity from and selling electricity to the AC electric power grid.Comment The Hawaii Electric Light Company Inc. is the electric company for the Big Island of Hawaii. This
requirement has a measure of effectiveness, the amount of energy sold to this electric company per month.DeriveReqt: CuR1-5Verify method Initially inspection, when operational weekly analysisPriority LowDate of last change December 3, 2009
Identification tag (Id) FR1-6Name Generate ElectricityText The system shall be capable of generating electricity.Comment Electric generators transform environmental energy into electricity. Here are some common examples: PV
panels, wind turbines, ocean waves, ocean tides, and geothermal systems. The energy storage part of thisrequirement was deleted by Bahill October 17, 2009.
DeriveReqt: CuR1-6Verify method InspectionPriority MediumDate of last change December 3, 2009
Identification tag (Id) FR1-7Name Execute BiSTText The system shall execute BiSTs.Comment This comes from BICS company policy.DeriveReqt: CuR1-7Verify method Test during design and construction, and thereafter in weekly demonstration.Priority High
Bahill
68 ITEA Journal

Date of last change December 3, 2009
Identification tag (Id) FRz-1Name Gather V&V DataText The system shall facilitate gathering evidence that can be used to prove verification and validation (V&V) of
the system and the requirements.DeriveReqt: BICS company policyVerify method InspectionPriority HighDate of last change December 3, 2009
Nonfunctional performance requirements
Identification tag (Id) NFPR1-1Name Maintain Daytime IlluminanceText The system shall maintain the daytime illuminance in the operations room at 500 6 50 lux (<50 6 5 fc).
Trace to FR1-2, FR1-3, and FR1-4.DeriveReqt: CuR1-8Verify method The system will record the illuminance every minute. This file will be examined weekly. The average value,
the number of excursions from the limits and the total duration of the excursions will be computed. Thesemeasures shall be within TBD. This TBD shall be resolved before PDR.
Priority MediumDate of last change December 3, 2009
Identification tag (Id) NFPR1-2Name Maintain Nighttime IlluminanceText The system shall maintain the nighttime illuminance in the operations room at 0.4 6 0.2 lux (<0.04 6
0.02 fc). Trace to FR1-2, FR1-3, and FR1-4.DeriveReqt: CuR1-9Verify method The system will record the illuminance every minute. This file will be examined weekly. The average value,
the number of excursions from the limits, and the total duration of the excursions will be computed. Thesemeasures shall be within TBD. This TBD shall be resolved before PDR.
Priority MediumDate of last change December 3, 2009
Identification tag (Id) NFPR1-4Name Rated PowerText The electric generating system shall have a minimum rated power of 10 kW.Rationale Expected average daily electricity generation in this location with this type of plant must be at least 40 kWh/d. To
account for environmental variability, the capacity factor of renewable-energy electric-generators is typically5% to 40%. For photovoltaic solar power, we estimate a capacity factor of 17%. Therefore the minimum rated
power must be 10 kW. RatedPower~AverageDailyElectricityGeneration
CapacityFactor|24h
d
~40kWh=d
1
6|
24h
d
~10kW
DeriveReqt: FR1-6Verify method InspectionPriority HighDate of last change December 3, 2009
Test requirements*
Identification tag (Id) FRz2Name Acceptance Testing of COTS EquipmentText There shall be an office and yard in Hilo that will be used for receiving, testing, and initial assembly of
purchased equipment.Rationale Each major piece of equipment shall be tested to ensure that it satisfies the manufacture’s specifications.
Equipment will be preassembled in Hilo. Once equipment gets up to 13,800 feet, testing and assembly willbe more difficult and more expensive, and it will interfere with operation of the telescopes.
DeriveReqt: Test and EvaluationVerify method InspectionPriority HighDate of last change December 3, 2009
Cost requirements
Identification tag (Id) CoR3Name Cost of Generated ElectricityText The system shall generate electricity at a cost that is competitive with commercial electricity costs at that
location, after federal, state, local, and electric utility company credits.Comment Trace to CoR2 and NFPR1-4. To evaluate the cost of producing electricity, the streams of costs are converted to
a net present value using the time value of money. The cost includes design, purchase, installation, operation,maintenance, retirement, and replacement. It depends on the interest rate and the amortization period.
DeriveReqt: CuR1-10Verify method AnalysisPriority HighDate of last change December 3, 2009
*Test and evaluation engineers will create requirements for test and evaluation and put them in this section.
Table 1.—Continued.
Illuminance Management Systems Engineering
31(1) N March 2010 69

iteration produces more complex and more detailedmodels (Bahill et al. 2008). It is imperative that rulesbe written to show this progression between models(Mellor et al. 2004). For example, documents 6 and 2use phrases like ‘‘window screens or curtains.’’ Indocuments 3, 4, and 7, this phrase will be replaced withthe class name Light Blocker. The ConOps anddocuments 6 and 2 use phrases like ‘‘solar panels orwind turbines.’’ In documents 3, 4, and 7 this phrasewill be replaced with the class name DC ElectricGenerator.
In the use cases, the requirements are labeled as, forexample, Req 1-2, where the 1 indicates the first usecase and the 2 indicates the second requirement in thisuse case. In document 2, the requirements are labeledas customer requirements, for example, CuR1-2. Indocument 3, the requirements are labeled as functionalrequirements, for example, FR1-2, and nonfunctionalperformance requirements, for example, NFPR1-2.
Document 3: Derived RequirementsEach requirement is verifiable by (ordered by increas-
ing cost) logical argument, inspection, modeling, simu-lation, analysis, test, or demonstration (Bahill and Dean2009). Here are dictionary definitions for these terms.
logical argument: a series of logical deductions.inspection: to examine carefully and critically, espe-
cially for flaws.modeling: a simplified representation of some aspect
of a system.
simulation: execution of a model, usually with acomputer program.
analysis: a series of logical deductions using mathe-matics and models.
test: applying inputs and measuring outputs undercontrolled conditions (a laboratory environment).
demonstration: to show by experiment or practicalapplication (flight or road test). However, somesources say demonstration is less quantitative thantest. Demonstrations can be performed on electronicbreadboards, plastic models, sterolithography mod-els, prototypes made in the laboratory by techni-cians, preproduction hardware made in the plantusing developmental tooling and processes, andproduction hardware using full plant tooling andproduction processes.
The attributes of the requirements of Table 1 arelisted row by row, because this is a Word document. Ifthis were a spreadsheet, they would be listed column bycolumn. Figure 2 shows the relationships between theuse cases, the requirements, and the test cases. The on-line BIMS set of documents has more requirementexamples.
Document 4: Verification and ValidationVerification and validation has four parts (Bahill and
Dean 2009; Bahill and Henderson 2005). Validatingthe system: Building the right system: ensuring that thesystem does what it is supposed to do. Verifying thesystem: Building the system right: ensuring that the
Figure 2. Requirements diagram (req) for one use case of a BIMS.
Bahill
70 ITEA Journal

system complies with its requirements and conforms toits design. Verifying requirements: Proving that eachrequirement has been satisfied. Validating require-ments: Ensuring that the set of requirements is correct,comprehensive, complete, and consistent.
Validating the system. Validating the system meansbuilding the right system: making sure that the systemdoes what it is supposed to do in its intendedenvironment. Validation determines the correctnessand completeness of the product, and ensures that thesystem will satisfy the actual needs of the customer.
It is very important to note that validation is notdone once and that it is not a serial process. Like allsystems engineering processes, it is iterative and highlyparallel. System validation artifacts can be collected atthe following discrete events: trade-off study reviews,phase reviews, life cycle reviews, red team reviews,system requirements review, preliminary design review(PDR), Critical Design Review (CDR), and field test.Validation defects can be detected at inspections: Therole of tester should be given an additional responsi-bility, validation; tester should read the vision state-ment and the concept of operation, and specificallylook for such system validation problems. Systemvalidation artifacts that can be collected continuouslythroughout the life cycle include white papers, resultsof modeling and simulation, and a count of the numberof operational scenarios (use cases) modeled. Detect-able system validation defects include mismatchesbetween the model and simulation, and the realsystem. For BIMS, validation evidence will becollected throughout design and construction.
A sensitivity analysis can reveal validation errors(Smith et al. 2008). If a system is very sensitive toparameters over which the customer has no control,then it may be the wrong system for that customer. Ifthe sensitivity analysis reveals the most importantparameter and that result is a surprise, then it may bethe wrong system. If a system is more sensitive to itsparameters than to its inputs, then it may be the wrongsystem or the wrong operating point. If the sensitivitiesof the model are different from the sensitivities of thephysical system, then it may be the wrong model. Thesensitivity analysis in document 5 shows that our trade-off study is valid.
Verifying the system. Verifying the system meansbuilding the system right: ensuring that the systemcomplies with its requirements and conforms to itsdesign. Components are verified during componenttesting. Systems are primarily verified at Total SystemTest. Sensitivity analyses can also be used to help verifysystems. In a manmade system or a simulation,unexpected excessive sensitivity to any parameter is a
verification mistake. Sensitivity to interactions shoulddefinitely be flagged and studied: Such interactionsmay be unexpected and undesirable.
Verifying requirements. Verifying requirements meansproving that each requirement has been satisfied.Verification can be done by logical argument, inspec-tion, modeling, simulation, analysis, test, or demonstra-tion. The verification matrix must show a one-to-onemapping between the requirements and the test plan. Itsaudience is systems engineering and the customer.
The way documents 2 and 3 were written, we do nothave to verify any of the document 2 requirementsbecause they all have derived requirements in docu-ment 3. In the test section, we will verify each of thesystem functional requirements. We will not verify thebusiness model requirements, process requirements,the cost requirements, the schedule requirements, orthe verification and validation requirements.
It is important to note that verification is not a serialprocess: It is iterative and highly parallel. Verificationand validation are not done sequentially. They are donein parallel with many iterations.
System testRequirements verification. The system will havebuilt-in self-tests. In addition, it will be subjected tothe following logical tests.
TestCase1 for BIMS Functional Requirements{Test using the main success scenario of the
Control Illuminance During the Day use case}
1. Before sunrise, tester starts BIMS and recordsthat it has executed all of its built-in self tests.This verifies FR1-7.
2. The sun rises in the morning. The system turnsup the lights and closes the light blockers.
3. Tester records the result including actual andpredicted time of sunrise. This verifies FR1-1,FR1-2, FR1-3, FR1-4, and NFPR1-1.
4. The system senses the illuminance in theoperations room and adjusts the illuminancewith light dimmers and light blockers.
5. Tester measures the illuminance in the opera-tions room, observes that the system is followingthe sunrise sequence diagram fragment (Figure 7)and records the result. This verifies FR1-2, FR1-3, FR1-4, and NFPR1-1.
6. The sun moves across the sky and theilluminance from the sun increases.
7. The system decreases illuminance from thelights and partially opens the light blockers.
8. At half-hour intervals, tester measures theilluminance in the operations room and records
Illuminance Management Systems Engineering
31(1) N March 2010 71

the result. This verifies FR1-2, FR1-3, FR1-4,and NFPR1-1.
9. The sun rises to its zenith.10. The system reduces the illuminance of the lights
and opens the light blockers as far as possible,while maintaining the illuminance within itsdaytime limits.
11. Tester measures the illuminance in the opera-tions room and records the result. This verifiesFR1-2, FR1-3, FR1-4, and NFPR1-1.
12. The system senses the illuminance in the opera-tions room with light sensors and adjusts theilluminance with light dimmers and light blockers.
13. At half-hour intervals, tester measures theilluminance in the operations room and recordsthe result. This verifies FR1-2, FR1-3, FR1-4,and NFPR1-1.
14. The sun starts to set.15. The system slowly adjusts the illuminance to its
nighttime level.16. Tester measures the illuminance in the opera-
tions room, observes that the system is followingthe sunset sequence diagram fragment (Figure 7),and records the result. This verifies FR1-2, FR1-3, FR1-4, and NFPR1-1.
17. The sun sets.18. Tester observes that the system has shifted to
the Control Illuminance During the Nightuse case and records the result.
{Test using the Clouds Cover the Sun unanchoredalternate flow of the Control Illuminance Duringthe Day use case}
1. While the BIMS is operating properly during thedaytime, tester blocks sunlight from the opera-tions room. This could be done by waiting fornatural clouds to come by or by unrolling anopaque screen from the roof in front of theoperations room window. If wind turbines orother electric generating devices are used, then thisstatement will have to be changed accordingly.
2. The system opens the light blockers.3. Tester measures the illuminance in the opera-
tions room, observes that the system is followingthe Clouds Cover the Sun unanchored alternateflow and records the result. This verifies FR1-2,FR1-3, FR1-4, and NFPR1-1.
4. The system draws energy from the AC electricpower grid.
5. Tester measures the illuminance in the operationsroom and the flow of energy from the AC electricpower grid and records the result. This verifiesFR1-2, FR1-3, FR1-4, NFPR1-1, and FR1-5.
6. Tester turns off unnecessary electric loads andremoves the opaque screen from the operationsroom window.
7. The system delivers energy to the AC electricpower grid.
8. Tester measures the illuminance in the opera-tions room and the flow of energy to the ACelectric power grid and records the result. Thisverifies FR1-2, FR1-3, FR1-4, NFPR1-1, FR1-5, and FR1-6.
9. Tester observes that the system returns to themain success scenario and records the result.
{End of testCase1 for the Control IlluminanceDuring the Day use case}
This test case procedure has verified FR1-1, FR1-2,FR1-3, FR1-4, FR1-5, FR1-6, FR1-7, and NFPR1-1.Nonfunctional performance requirement NFPR1-2will be verified in tests based on the ControlIlluminance During the Night use case. CR3 willbe verified by analysis.
{Start of Verification and Validation (V&V) Test}
1. Tester uses the system as in the test for the mainsuccess scenario for the Control IlluminanceDuring the Day use case.
2. Tester observes and records the result.3. Tester examines the data and writes a V&V
report. This verifies FRz-1 Gather V&V data.
{End of V&V Test}
System verification{Test by system experiment}The system experiment in Table 2 will test the high-
level system functioning. It is based on the BIMSIlluminance controller state machine diagram indocument 7 (Figure 8).
Preconditions:Wait for weather conditions that will generate above
average electricity, such as a sunny afternoon forphotovoltaic panels or winds above 15 mph for windturbines.
Disconnect the system from the AC electric power gridand turn off all possible loads.The system experiment shown in Table 2 is a state-
based test. If the problem statement requires a state-based solution, then state-based tests must be used. It isnot possible to test a state-based system using onlyinput–output behavior (Botta, Bahill, and Bahill 2006;Wymore and Bahill 2000).
Validating requirements. Validating requirementsmeans ensuring that the set of requirements is correct,complete, and consistent, that a model can be createdthat satisfies the requirements, that a real-world
Bahill
72 ITEA Journal

solution can be built that satisfies the requirements,and that this real-world solution can be tested to provethat it satisfies the requirements. If the client hasrequested a perpetual motion machine, this is the placeto stop the project and save the money. Requirementsvalidation often uses comparisons to existing systemsthat do most of the desired tasks. Lutron Electronicshas two products that satisfy most of our lightmanagement requirements: the Daylighting systemand the Hyperion–Solar Clock. The features of BIMSthat are not included in either of those two systems areusing renewable-energy electric generators, remotelocations, and consideration of moonlight. We aresure that we can design and build a system that satisfiesthese requirements because most of them can befulfilled with presently available COTS systems. There
are lots of renewable-energy electric-generating sys-tems, including many that are already connected to ACelectric power grids. The validation process shouldstart at the beginning of the project.
Document 5: Concept ExplorationAlternative architectures. The BIMS project will dotrade-off studies for many decisions such as choosingthe type of light blockers, selecting a system to controlthe entire light management system, and suggesting anenergy storage unit to smooth the electric generationwhen the environment varies. This article only showsthe trade-off study for the type of electric generatorthat will be recommended.
Electric generators transform environmental energyinto electric energy. Here are some common examples:
Table 2. Test of the BIMS Illuminance Controller using a system experiment (Wymore 1993).
Time Input Present state Output Next stateBiST
indicatorRelated
requirement
0 Connect to AC Electric
Power Grid and turn
on the loads
Initial Running BiST Fail
1 statusBiST 5 finished Running BiST statusBiST 5 running; statusBiST
5finished; resultBiST 5 pass
Maintaining
Daytime
Illuminance
Fail FR1-7
2 illuminance . 550 Maintaining
Daytime
Illuminance
set (lightLevel, blockingPercent) Decreasing
Daytime
Illuminance
Pass FR1-2
FR1-3
FR1-4
NFPR1-1
3 illuminance # 550 Decreasing
Daytime
Illuminance
set (lightLevel, blockingPercent) Maintaining
Daytime
Illuminance
Pass FR1-2
FR1-3
FR1-4
NFPR1-1
4 sunset Maintaining
Daytime
Illuminance
set (lightLevel, blockingPercent);
requestProgram (sunset);
Running Sunset
Program
Pass FR1-1
FR1-2
FR1-3
FR1-4
NFPR1-1
5 programDone Running Sunset
Program
set (lightLevel, blockingPercent);
signal(programDone)
Maintaining
Nighttime
Illuminance
Pass FR1-2
FR1-3
FR1-4
NFPR1-2
6 sunrise Maintaining
Nighttime
Illuminance
requestProgram (sunrise); set
(lightLevel, blockingPercent);
Running Sunrise
Program
Pass FR1-1
FR1-2
FR1-3
FR1-4
NFPR1-2
7 programDone Running Sunrise
Program
runProgram(sunrise); set (lightLevel,
blockingPercent);
signal(programDone)
Maintaining
Daytime
Illuminance
Pass FR1-2
FR1-3
FR1-4
NFPR1-1
End of
test
Maintaining
Daytime
Illuminance
set (lightLevel, blockingPercent) Pass FR1-2
FR1-3
FR1-4
NFPR1-1
There are many more transition arrows of the state machine diagram that need to be tested.
Illuminance Management Systems Engineering
31(1) N March 2010 73

photovoltaic (PV) solar panels; thermal solar panels;wind turbines; ocean currents, waves, and tides;hydroelectric dams; balloons for tapping static elec-tricity stored in the atmosphere; and geothermalsystems based on the Kilauea volcano. For this projectthe electric generators will be connected to the ACelectric grid. Table 3 shows the alternative systems thatwere analyzed in this project.
The question posed to this trade-off study was, ‘‘Interms of using renewable energy to generate electricityfor the telescope operations room on top of Hawaii,what is the preferred electric generating system?’’Figure 3 suggests a part of the analysis that went intofitting the alternatives into the environment.
Evaluation criteria. Evaluation criteria will be neededfor each trade-off study. Some of the criteria may bereusable in several trade-off studies. Here are some ofthe criteria for choosing the preferred renewable-energy electric-generating systems.
Performance
Name of criterion: Perceived Ease of Test and
Evaluation
Name of criterion: Vendor Evaluation
Name of criterion: Possible Interference with Telescope Views
Each criterion will have a full description such as thefollowing.Name of criterion: Rated Power
Figure 3. Brainstroming illustration of alternative electric generators fit in the Mauna Kea environment. A trade-off study to helpdetermine the system architecture must consider multiple alternatives situated in the environment in which the system will operate.
Photo montage credit: Alex and Zach Bahill.
Bahill
74 ITEA Journal

Description: Rated Power (kW) is the power that thesystem was designed to generate in steady state atthe normal operating point, which is usually near themaximum power point. It is also called generatingcapacity and nameplate capacity. The normaloperating point for the telescope site on top ofHawaii has an average wind speed of 10 mph and anaverage insolation of 6 kWh/(m2 d).
Weight of importance (priority): 4 (Botta and Bahill2007)
Basic measure: The power that the system wasdesigned to generate
Units: kWMeasurement method: Initially we will believe the
manufacturers’ specifications. During operations wewill compute the value of the average power that isactually produced in steady state at the normaloperating point.
Input: Rated power (kW), with a domain of 0 to1 MW, and expected values between 5 and 25 kW.
Scoring function: Monotonic increasing, LL 5 5, BL5 10, S 5 0.2, UL 5 25 plotting range 5 to 16(Daniels, Werner, and Bahill 2001; Figure 4).
Output: 0 to 1Traces to NFPR1-4
The input to the function of Figure 4 is Rated Power,which has legal values between 0 and 1 MW. Feasiblealternatives will have expected values between 5 and25 kW. The preferred alternatives shown in Table 4 hadrated powers between 7 and 11 kW, which is where thecurve has its maximum slope and therefore the greatestdifferentiating power. Four of the alternatives are shownin the figure. The output is normalized to the 0 to 1range, and more output is better.Cost
Name of criterion: Total Life Cycle Cost (thousands ofU.S. dollars)
Name of criterion: Price to Power Ratio ($/W)
Name of criterion: Cost of Generated Electricity ($/kWh)
Company policyName of criterion: Built-in Self Test:Name of criterion: Reusability:
The online BIMS set of documents has moreevaluation criteria examples.
The trade-off study matrix for this project is shownin Table 4. It shows that the PV solar panels have thehighest alternative ratings. The complete trade-offstudy and sensitivity analysis is located at http://www.sie.arizona.edu/sysengr/sie554/BIMS/BIMS11.xls.
The values for the cells were derived by a panel ofdomain experts using the Delphi method. The valuescame from manufacturers’ data, peer reviewed journalarticles, and (only for the weather data) Internet Websites. A value was derived for each alternative and foreach criterion. This value was put into the scoringfunction for that criterion and the resulting score (Sc)was put into Table 4. Each score was then multipliedby its corresponding normalized weight (Wt), andthese products were summed in each column toproduce the alternative ratings.
This trade-off study answered the question ‘‘Interms of using renewable energy to generate electricityfor the telescope operations room on top of Hawaii,what is the preferred electric generating system?’’ bystating that the preferred alternatives are the PV solarpanels without battery storage.
Each number in a trade-off study matrix should havean explanation. For example, the score for total lifecycle cost for the ‘‘do nothing’’ alternative is 0.2. Itspurchase price is zero, which would give it a high score.But it would sell no energy to the electric company so itwould not generate revenue. This lowers its score to0.2. The original estimation was made by Bahill,December 3, 2009.
When filling in a trade-off study matrix, likeTable 4, it is important to pay attention to commonmental mistakes (Smith et al. 2007). For example, thecriteria total lifecycle cost, price to power ratio, andcost of generated electricity are dependent; evaluationcriteria should be independent. Second, there is anuneven level of detail in the description of the PV solarpanels and the LIMPET system. This often occurs forstraw men but should not exist for serious alternatives.
The sensitivity analysis (Smith et al. 2008) per-formed on this trade-off study showed that the mostimportant category weight was that for companypolicy, the most important subcategory weight wasthat for BiST, and the most important scores were forBiST for alternatives 1, 2, 3, 4, and 7. Therefore, wespent extra time discussing among ourselves and withtop management whether performance, cost, or
Figure 4. Scoring function for the Rated Power
evaluation criterion.
Illuminance Management Systems Engineering
31(1) N March 2010 75

Tab
le3.
Tra
de-o
ffst
ud
ym
atr
ixfo
rB
IMS
usi
ng
asu
mco
mb
inin
gfu
nctio
nw
ith
the
num
ber
of
altern
ative
s,m
510.
Cri
teri
aW
t.
No
rm.
crit
eria
wei
ghts
No
rmsu
bcr
iter
iaw
eigh
ts
Alt
1d
on
oth
ing
Alt
2S
un
Ele
ctro
nic
sP
V
Alt
3D
MS
ola
rP
V
Alt
4S
ola
rC
alcu
lato
rG
ener
icP
V
Alt
5Ja
cob
sW
ind
Tu
rbin
eA
lt6
Ber
gey
Win
dP
ow
erA
lt7
AR
E44
2
Alt
8S
kys
trea
m3.
7A
lt9
LIM
PE
T
Alt
10N
ord
tan
k65
Sc
Wt
3
Sc
Sc
Wt
3
Sc
Sc
Wt
3
Sc
Sc
Wt
3
Sc
Sc
Wt
3
Sc
Sc
Wt
3
Sc
Sc
Wt
3
Sc
Sc
Wt
3
Sc
Sc
Wt
3
Sc
Sc
Wt
3
Sc
Per
form
ance
80
.38
Ven
do
rev
alu
atio
n8
0.3
60
.90.
330
.50.
180
.60.
210
.80.
290
.50.
180
.50.
180
.50.
180
.40.
150
.80.
290
.80.
29In
terf
eren
cew
ith
tele
sco
pes
10
0.4
51
.00.
451
.00.
451
.00.
451
.00.
450
.20.
090
.20.
090
.20.
090
.40.
181
.00.
450
.10.
05
Rat
edp
ower
40
.18
0.0
0.00
0.5
0.10
0.6
0.11
0.3
0.05
0.1
0.01
0.0
0.00
0.0
0.00
0.0
0.00
1.0
0.18
0.5
0.09
Co
st4
0.1
9
To
tal
life
cycl
eco
st6
0.2
40
.20.
050
.50.
120
.50.
120
.80.
190
.50.
120
.50.
120
.50.
120
.50.
120
.40.
100
.50.
12P
rice
top
ow
erra
tio
90
.36
0.5
0.18
1.0
0.36
1.0
0.36
0.8
0.29
0.5
0.16
0.0
0.00
0.0
0.00
0.2
0.07
0.0
0.00
0.8
0.30
Co
sto
fge
ner
ated
elec
tric
ity
10
0.4
00
.20.
080
.50.
200
.50.
200
.80.
320
.50.
200
.50.
200
.50.
200
.50.
200
.60.
240
.60.
24
Co
mp
any
po
licy
90
.43
BiS
T1
00
.63
0.8
0.50
0.9
0.56
0.9
0.56
0.7
0.44
0.1
0.06
0.1
0.06
0.9
0.56
0.1
0.06
0.5
0.31
0.3
0.19
Reu
sabi
lity
60
.38
0.3
0.11
0.5
0.19
0.5
0.19
0.8
0.30
0.5
0.19
0.5
0.19
0.5
0.19
0.5
0.19
0.1
0.04
0.9
0.34
Alt
ern
ativ
era
tin
g0.
620.
730.
740.
770.
310.
270.
490.
310.
570.
51
Bahill
76 ITEA Journal

company policy should have the highest weight. Weexpended extra resources consulting with managementand the customer about the relative weights of thesubcriteria. We did extra research, analysis, andmodeling to get more reliable scores for BiST foralternatives 1, 2, 3, 4, and 7.
Document 6: Use Case ModelA use case is an abstraction of required functions of a
system. A use case produces an observable result ofvalue to the user. Each use case describes a sequence ofinteractions between one or more actors and thesystem.
Name: Control Illuminance During the DayIteration: 3.4Derived from: ConOpsBrief description: The sun rises and sets, but the
BIMS will keep the illuminance in the operationsroom constant.
Level: HighPriority: This is of the highest priority.Scope: The operations room of a telescope facility on a
remote mountaintop and a renewable-energy electricgenerator and an energy storage device. Note: theoriginal ConOps specified the use of energy storagedevices. This requirement was subsequently re-moved. In this use case, we show the removal byusing a strikethrough effect.
Added value: Astronomers are more comfortable andmore productive.
Goal: Maintain specified illuminance in the daytime.Primary actors: Astronomer, engineer, tester
Supporting actors: Sun, clouds (and during the nightthe moon).
Frequency: It will be used every day.Precondition: The system has passed all of its BiSTs,
and tester or the engineer has started the system.Trigger: The sun rises.
Main success scenario
1. The sun rises in the morning.2. The system turns up the lights and closes the
window screens or curtains.3. The system senses the illuminance in the room
with light sensors and adjusts the illuminancewith light dimmers and window screens orcurtains.
4. The sun moves across the sky, and theilluminance from the sun starts to increase.(Actually, the earth rotates, but it more intuitiveto say that the sun moves.)
5. The system decreases illuminance from thelights and partially opens the window screensor curtains. The trade-off between these twowould be determined by sunlight shining oncomputer monitors, heating and cooling con-siderations, as well as electricity usage.
6. The sun rises to its zenith.7. If it will not waste heating or cooling energy, the
system opens the window screens or curtains.8. The system senses the illuminance in the room
with light sensors and adjusts the illuminancewith light dimmers and window screens orcurtains.
9. The sun starts to set.10. The system slowly adjusts the illuminance to its
nighttime level. (Because of its complexity, thisstep will probably become a separate use case infuture models.)
11. The sun sets.12. Include the Control Illuminance During
the Night use case.
Clouds Cover the Sun unanchored alternate flow
1. Electric generation falls because of the winddropping, waves disappearing, or clouds coveringthe sun.
2. The system opens the window screens orcurtains.
3. The system draws energy from the energy storagedevice AC electric grid.
4. Electric generation resumes because of the windincreasing, waves coming back, or clouds blowingaway.
Table 4. Renewable-energy electric-generating systems that
were analyzed in a trade-off study.
Manufacturer
Ratedpower(kW)
Purchase pricewithout installation
(U.S. dollars)
Grid-connected PV systems
Sun Electronics 10.2 $34,000.
DMSolar 10.4 $34,000.
The Solar Calculator 8.9 $55,000.
Grid-connected wind turbines
Jacobs Wind Systems 7 $55,000.
Bergey WindPower 2 $30,000.
Abundant Renewable Energy 3.5 $50,000.
Southwest Wind Power 2.4 $14,000.
Nordtank 65 10.2 $62,000.
Other
LIMPET, wave power 100 $260,000
Helium balloons 6 3 10212 $100
The do-nothing alternative 0 0
Illuminance Management Systems Engineering
31(1) N March 2010 77
5. The system delivers energy to the energy storagedevice. AC electric grid.
6. The system readjusts the light dimmers andwindow screens or curtains. [return to the mainsuccess scenario.]
Postcondition: The system is in the ControlIlluminance During the Night use case.
Specific requirements (Daniels and Bahill 2004)
Functional requirements:
Req1-1 The system shall use an ephemeris, tables,models, firmware, or similar methods to anticipatesunrise, sunset, moonrise, moonset, and the phase ofthe moon.
Req1-2 The system shall control the illuminance of thelights.
Req1-3 The system shall control the opening andclosing of window screens or curtains.
Req1-4 The system shall sense the illuminance in theoperations room.
Req1-5 The system shall buy electricity from and sellelectricity to the AC electric power grid.
Req1-6 The system shall generate electricity and useenergy. Here are some common examples of sourcesof renewable energy: PV panels, wind turbines,ocean waves, ocean tides, and geothermal systems.The energy storage requirement was removed byBahill October 17, 2009.
Req1-7 The system shall execute built-in self tests(BiST). (Derived from BICS company policy.)Nonfunctional requirements:
Req1-8 The system shall maintain the daytimeilluminance in the operations room at 500 6 50 lux(<50 6 5 fc). Trace to Req1-2, Req1-3, and Req1-4.
Req1-9 The system shall maintain the nighttimeilluminance in the operations room at 0.4 6 0.2 lux
(<0.04 6 0.02 fc). Trace to Req1-2, Req1-3, andReq1-4.
Req1-10 The system shall generate electricity at a costcompetitive with commercial electricity costs at thatlocation, after federal subsidies, etc. Trace to Req1-5and Req1-6.
Author/owner: Walt ZaharchukLast changed: December 3, 2009
A use case diagram is the table of contents of a usecase model. It shows all of the use cases that have beendescribed so far. Figure 5 is our first use case diagram.
Other use cases. So far, we have written one use case.A complete design will probably have dozens of usecases. Here are some other proposed use cases:
Control Illuminance During the NightBuy Electricity from and Sell Electricity to
the AC Electric Power GridGenerate Electricity Using Renewable-
energy Electric-generatorsFollow Sunrise and Sunset Programs. For
the telescopes, these programs will be differentfrom residential venues because during this criticaltime of day naked-eye observations by astrono-mers, meteorologists, naval personnel, etc., areimportant. The algorithms here may be the mostcomplex because the change of illuminance willhave the largest dynamic range and the fastesttime constant.
Run Built-in Self TestsRun Tests and Evaluate the SystemControl Temperature in the Operations
Room. The lighting control system must interactintimately with the HVAC system. This willproduce requirements of temperature goals andtolerances.
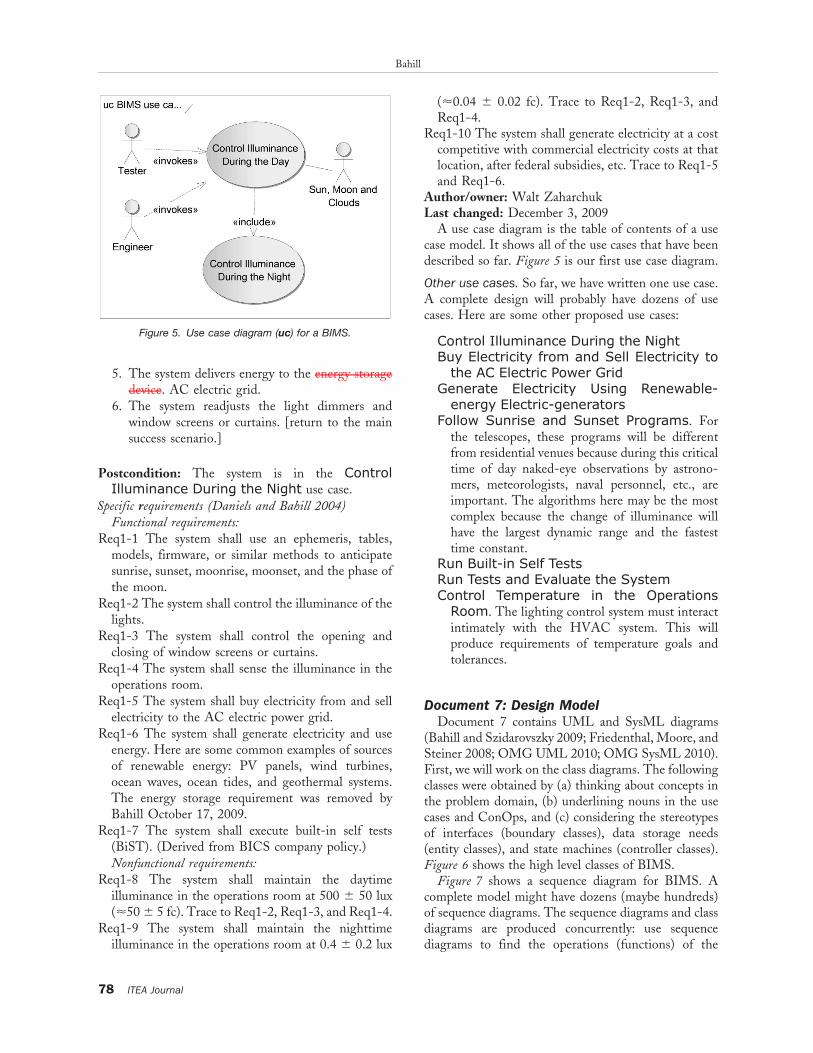
Document 7: Design ModelDocument 7 contains UML and SysML diagrams
(Bahill and Szidarovszky 2009; Friedenthal, Moore, andSteiner 2008; OMG UML 2010; OMG SysML 2010).First, we will work on the class diagrams. The followingclasses were obtained by (a) thinking about concepts inthe problem domain, (b) underlining nouns in the usecases and ConOps, and (c) considering the stereotypesof interfaces (boundary classes), data storage needs(entity classes), and state machines (controller classes).Figure 6 shows the high level classes of BIMS.
Figure 7 shows a sequence diagram for BIMS. Acomplete model might have dozens (maybe hundreds)of sequence diagrams. The sequence diagrams and classdiagrams are produced concurrently: use sequencediagrams to find the operations (functions) of the
Figure 5. Use case diagram (uc) for a BIMS.
Bahill
78 ITEA Journal
classes. There should be a sequence diagram for everyflow of every use case. After the CDR, test andevaluation should ensure that the commands andmessages of the sequence diagrams are related to thefunctions (operations) of the classes.
Analysis classes
Engineer ,,actor..
name: StringprogramBIMStroubleshootBIMS
An engineer programs and troubleshoots the BIMS.Lifetime: An engineer exists from the moment aperson has been classified as an engineer with BICSuntil the moment the engineer ceases his or herrelationship with BICS.
Tester ,,actor..
name: StringtroubleshootBIMStestBIMS
The role of tester will be filled by a member of thetest and evaluation team. It could be filled by the sameperson(s) who fills the role of engineer.
Sun, moon, clouds ,,supporting actors..
name: StringvaryIlluminaceOfEarth()
Later this class will be decomposed into threeclasses. Lifetime: The sun is about 5 billion years old:
It will last another 5 billion years. The earth is about4.5 billion years old, and the moon is a bit younger.Each cloud lasts a few hours.
Operations Room ,,package..
depth: Real 5 7 {m}height: Real 5 4 {m}width: Real 530 {m}
The operations room contains the thermostat, thelight sensor, and the light blocker. It is 7 m deep, 30 mwide, and 4 m high. Its east wall is all glass and facesdirectly east. All other walls have minimal glass andmaximum insulation.
Thermostat ,,boundary class..
temperature: Integer 5 65 {0–100, degrees Fahrenheit}measureTemperature()sendTemperature()
The thermostat measures the average temperature inthe operations room and sends that value to the BIMSilluminance controller.
Light Sensor ,,boundary class..
illuminance: Real {0.01–3000, lux}measureIlluminance()sendIlluminance()
The light sensor measures the average illuminance inthe operations room and sends that value to the BIMSilluminance controller.
Light Blocker ,,boundary class..
Figure 6. High-level class diagram for a BIMS.
Illuminance Management Systems Engineering
31(1) N March 2010 79

blockingPercent: Integer 5 100 {0–100}blockingPercent()
The light blocker blocks some percentage of theincoming light.
Light Dimming System ,,block or package..
The light dimming system is composed of the lightcontroller, the light dimmer, and the light bulb. Therewill be many light bulbs in this system, but in UMLand SysML we name the classes with a singular noun.
Light Controller ,,control class..
lightLevel: Integer 5 100 {0–100, percent}lightLevel()
The light controller is the brains of the LightDimming System. The bars on the sides of this boxindicate that the BIMS Light Controller is an active
class. That means it has one or more state machinediagrams.
Light DimmerpowerLevel: Real {watts}increasePower()decreasePower()
The light dimmer varies the power being sent to thelight bulb.
Light Bulbilluminance: Integer 5 0 {0–12,000 lumens}colorTemperature: Integer 5 3,500 {Kelvins}emitLight()
Beverage Store ,,subsystem..
address1: String 5 ‘‘Hawai’i Nui Brewing, 275 E.Kawili St, Hilo, HI 96720’’
Figure 7. Time runs from top to bottom in this sequence diagram (sd) for one instance of the main success scenario of the ControlIlluminance During the Day use case.
Bahill
80 ITEA Journal

address2: String 5 ‘‘Stores in the town of Vicuna, aone-hour drive from the top of Cerro Pachon’’
sellBeer(MehanaMaunaKeaPaleAle)sellBeer(RogueChipotleAle)
Graphical User Interface (GUI) ,,boundary class..
statusGUI: Boolean 5 off {on, off}Use the company standard GUI.
AC Electric Power Grid Interface ,,boundary class..
statusAC: Boolean 5 buying {buying, selling}energySold: Real {kWh or J}sellACelectricity()buyACelectricity()
Our system must be able to buy and sell electricitythrough the AC electric power grid interface. TheWattHourMeter indicates the direction of and amountof energy flow. The measure of effectiveness attribute
energySold indicates the amount of energy that hasbeen bought or sold to the electric power grid.Physically, this could be 1 WattHourMeter or 2.
Renewable-Energy System ,,subsystem..
The Renewable-Energy System is a subsystem ofBIMS composed of a DC electric generator and a DCto AC inverter.
DC Electric GeneratorratedPower: Real {kW}generateElectricity()
DC/AC InverterratedPower: Real {kW}convert DC to AC()
Database ,,entity class..
read/writeData()
Figure 8. State machine diagram (stm) for a BIMS Illuminance Controller (IC). The illuminance limits could be parameters instead of
fixed values. The IC increases or decreases the illuminance by commanding a different lightLevel and blockingPercent. Running the
sunrise program is accomplished by commanding a sequence of preprogrammed lightLevel and blockingPercent.
Illuminance Management Systems Engineering
31(1) N March 2010 81

provideData()The clock and the database work together so that
they always know the correct time and date. They usethis in conjunction with tables or models so that theyalways know where the sun and the moon are. Thedatabase also stores light programs. For example, thesunrise program might look like this:
1. The sun starts to rise.2. The light blockers close as necessary to eliminate
direct sun rays on computer screens.3. The light dimming system turns up the lights to
provide the desired daytime illuminance.4. As the sun rises, the light blockers are opened
and the lights are dimmed.
Clock ,,control class..
time(hh:mm): String {hh [0–24], mm [0–60]}date(mm/dd/yy): String {mm [1–12], dd [1–31], yy [0–99]}daytime(): Boolean {AM, PM}compute() {sunrise, sunset, moonrise, moonset,
phaseOfMoon}
announce() {sunrise, sunset, moonrise, moonset,phaseOfMoon}
requestData()
Built-in Self Test (BiST) ,,control class..
resultBiST: Boolean 5 fail {pass, fail}statusBiST: Boolean 5 finished {running, finished}sendResultBiST()indicateStatusBiST()
Whenever the system is not serving the customer, itshould be doing BiST. In addition, at startup it will doself tests. And finally it will run large diagnostic testsonce a day.
Illuminance Controller (IC) ,,control class..
statusIC: Boolean 5 notBusy {busy, notBusy}compute(lightLevel, blockingPercent)setLightLevel()setBlockingPercent()runBiST()requestProgram()runProgram()programDone()
Table 5. Standard ports that show the movement of signals, commands, or messages.
Control class Inputs and outputsSource and
destination class Explanation
Illuminance Controller
(IC)
Inputs Source Class
announce {sunrise, sunset, moonrise,
moonset, phaseOfMoon}
Clock This algorithm uses predicted sunrise and sunset,
and the illuminance to announce when the sun
is rising or setting.
illuminance() Light Sensor Average illuminance in the operations room.
programs {sunrise, sunset, etc.} Database Preprogrammed sequences of light and light
blocker parameters.
statusBiST {running, finished} BiST
statusIC {busy, notBusy} IC
Outputs Destination Class
setLightLevel() Light Controller
setBlockingPercent() Light Blocker
requestProgram() Database
programDone() IC
statusIC {busy, notBusy} IC
Light Controller Inputs
setLightLevel() IC
Outputs
lightLevel() Light Dimmer
BiST Inputs Source Class
runBiST IC
Outputs Destination Class
statusBiST() IC
resultBiST() IC, et al.
Clock Inputs Source Class
data() Database
illuminance() Light Sensor
Outputs Destination Class
announce {sunrise, sunset, moonrise,
moonset, phaseOfMoon}
IC
requestData Database
Bahill
82 ITEA Journal

The illuminance controller is an active class. Thatmeans it has one or more state machine diagrams. Itsends commands to the light controller and the lightblocker to make the illuminance follow certain pro-grams, such as for sunrise and sunset. The light sensorsends illuminance levels to the illuminance controller.
The major required functionality of the system(shown in the last two dozen class boxes) will becaptured in the use cases and put into the customerrequirements document. These functions will be testedin the use case derived test procedures. Detailed designwill produce additional lower level functions that mustbe tested. Test and evaluation must test each of thefunctions (the bottom compartment, the operations) ofevery one of these classes.
Other diagrams. Figure 8 shows a state machinediagram (stm) for a BIMS illuminance controller(IC). Table 5 shows standard ports that describe themovement of signals, commands, and messages.Table 1 showed a system experiment that would testthe behavior described in the state diagram of Figure 8.After CDR, test and evaluation should ensure that theinputs (events) and outputs (functions) of the statemachine diagrams are related to the commands and
messages of the sequence diagrams and the functions(operations) of the classes.
Figure 9 shows a SysML block definition diagram(bdd) illustrating the structure of a BIMS. The valuesin these blocks must be tested. These values should bethe same as the attributes in the center box of theclasses of the previous section.
Figure 10 shows a SysML block definition diagram(bdd) illustrating the constraints of a BIMS. Figure 11shows a SysML parametric diagram (par) thatillustrates the bindings for a BIMS: It shows thelocation of the values that will be used in the equationsof Figure 10. There is a constraint, shown in Figure 10,that the illuminance rate of change shall not be greaterthan 10 lux/s. To test compliance with this constraint,the tester must know where to get values for thisequation. A SysML parametric diagram (Figure 11)shows where these values can be found.
Document 8: Mappings and ManagementAcronyms
BICS-Bahill Intelligent Computer SystemsBIMS-BICS Illuminance Management SystemBiST-Built-in Self Test
Figure 9. SysML block definition diagram (bdd) showing the structure of a BIMS. Most of the values in the component blocks were
described with the classes. The new one is the Measure of Effectiveness (MoE) for the amount of energy sold to the commercialelectric power grid.
Illuminance Management Systems Engineering
31(1) N March 2010 83

CDR-Critical Design ReviewCDRL-Contract Deliverable Requirements ListConOps-Concept of OperationsCoR-Cost RequirementCuR-Customer RequirementFR-Functional RequirementHVAC-Heating, Ventilation and Air ConditioningIC-Illuminance ControllerLED-Light Emitting DiodeNFPR-Nonfunctional Performance RequirementOCD-Operational Concept DescriptionPDR-Preliminary Design ReviewPV-PhotovoltaicRR-Risk RequirementSI-Systeme International d’UnitesSR-Schedule RequirementSRR-System Requirements ReviewTBD-To Be DeterminedTEP-Tucson Electric Power Company
Risk analysis. Risk is an expression of the potentialharm or loss associated with an activity executed in anuncertain environment (Bahill and Smith 2009).Astronomical observatories face heightened scrutinyfrom environmentalists because of their prominentsiting. To ameliorate this potential opposition, BIMSwill use renewable-energy electric generators. This is apolitical decision, not an economic or scientific decision.In the risk analysis of Table 6, the greatest risk is thatenvironmental activists will try to prevent funding andconstruction of the facility. Tables 6 and 7 present tworisk analyses: One is specific for the telescope project,and the other is for home owners in general connectingPV-solar electric generators to an AC power grid.
The greatest risk is that environmental activists willtry to prevent funding and construction of the facility.We must alert our public relations people about this risknow. The second biggest risk is that a similar system hasalready been patented. Therefore, we should start
Figure 10. SysML block definition diagram (bdd) showing the constraints of a BIMS. The block named BIMSAnalysis would describe
the engineers doing the analysis, the computer operating system (LINUX, Windows, Macintosh), the software (MATLAB, Maple,
Mathematica), and the algorithms (Runge-Kutta, Adams-Moulton, Cooley-Tukey FFT) that would be used to analyze the equationsof BIMS.
Bahill
84 ITEA Journal

working on this risk immediately. We should contactBICS’s lawyer and then start a patent search.
Table 7 contains a failure modes and effects analysis(FMEA) for Tucson Electric Power’s (TEP) AC electricpower distribution grid. The input data were given to usby Tom Hansen, vice president of TEP, October 2008.We derived the rest of the numbers. First, we changedfrequency of occurrence into a percentage. Then wecalculated the range of these frequencies: about six ordersof magnitude. The range for frequency and severity must
be the same (Bahill and Smith 2009) so we assignednumerical values to the severities as follows:
extreme 1,000,000very high 100,000high 10,000medium 1,000low 100very low 10miniscule 1
The biggest risk in Table 7 is the short to ground onthe distribution grid. This is indeed a big risk becauseit cannot be fixed by merely throwing a switch on thecomputer control panel. The next biggest risks areinjury or death to humans. This shows that TEP caresabout its employees. The next risks are weather related:intermittent loss of the energy source (such as sunlightor wind) and interruption of power produced due to
thunderstorms. Although we cannot do anything aboutthe weather, we can affect how it affects our system.
Environmental risks. Raptors with large wing spanscan get electrocuted when their wings touch two powerwires at the same time. All birds can be killed if they flyinto the blades of a wind turbine. Many people areworried about possible noise from wind turbines.
Solar panels could destroy habitats and modify birdmigration patterns. Large fields of solar panelsmounted flat to the earth’s surface could look like alake to migratory birds and throw them off course.Panels mounted on roofs could reflect light into theeyes of car drivers or airline pilots.
Economic risks. The following are some factors thatcould affect the economic risks of attaching solarelectric generating equipment to the AC power grid:interest rates; continuation of federal, state, and utilitycompany rebates; amortization period; federal stimulusfunds; and federal regulations.
Risks that have already been addressed. The electricutilities have been doing risk analyses for years. Whenthey identified a risk, they did something to minimizeits effects. Here are a few examples.
There could be strong opposition from environmen-talists, neighbors, or businesses around the areas whereinstallation of solar panels is proposed. They mightclaim that solar panels are unsafe or ugly. Home owners
Figure 11. SysML parametric diagram (par) showing the bindings for a BIMS. This diagram shows where tester would go to get values
to plug into these equations.
Illuminance Management Systems Engineering
31(1) N March 2010 85

associations could prohibit or strongly discourage PVsystems. This was considered a long time ago, and thestate of Arizona passed laws making it illegal for homeowners associations to impose rules against PV systems.
If a home owner tried to install a photoelectricsystem, he (or she) could get electrocuted. Installationlooks like a simple task, but high voltages are involved.TEP has considered this, and they created the green
Table 6. Failure modes and effects analysis for a BIMS.
Failure mode Potential effectsRelative
likelihood*Severity of
failureEstimated
risk
Performance
The volcano might erupt. Acts of God are not normally included in a risk
analysis. But in this case we should ensure that
our system is connected to the USGS Volcano
Hazards Program, at the Hawaiian Volcano
Observatory in case we have to evacuate the
mountaintop.
0.001 0.9 0.0009
The electric generators might not supply
enough electricity in cold temperatures,
at high altitudes.
We would not be able to sell power to the AC
electric power grid.
0.01 0.02 0.0002
Telescopes operate below the temperature
of the outside air so telescope enclosures
are typically kept cold inside.
HVAC demands will be different than for a typical
office building (reuse).
0.9 0.001 0.0009
Commercial AC electric power grid may
fail for hours at a time.
We may have to incorporate backup diesel electric
generators.
0.01 0.1 0.001
Cost
It is expensive to build in such a remote
location. Skilled labor may be more
expensive than expected.
We could overrun our budget. 0.9 0.001 0.0009
Construction workers working at 13,800
feet (4,200 m) will have trouble breathing.
This will make the workers less efficient, and they
will need medical observation.
1 0.001 0.001
Something could interrupt the supply lines
across the ocean and up the mountain.
We could overrun our budget and schedule. 0.5 0.001 0.0005
Electric power is expensive on Hawaii
because it has no natural sources of fossil
fuels. The average electricity rate is
$0.2/kWh to $0.3/kWh compared with
the national average of $0.1/kWh.
This could increase construction and operations costs.
It will also affect the balance between electric
lighting cost and HVAC costs. This is also an
advantage because it will help us compete with
commercial electricity rates.
1 0.001 0.001
Cost of generating electricity in this
location is more than the cost of buying it.
We would abandon this part of the project. 0.05 0.5 0.025
Business
The project might lose political support,
and Congress or the NSF could stop
funding.
The project would be terminated. 0.01 1 0.01
Observatories face heightened community
scrutiny because of their prominent siting.
Proactively seeking accommodation with
environmental concerns is one ingredient to a
successful project.
0.5 0.5 0.25
A similar system has already been patented We would have to license patent rights. Although
it would cost at least $5,000, we should initiate
a patent search. If no similar patent is found,
then we should initiate a patent application.
We should immediately contact BICS’s lawyer
and ask if putting this document on my Web
site constitutes disclosure.
0.8 0.1 0.08
One of your teammates might refuse to
do any work.
You will have to fire that teammate, and everyone
else will have to work harder (process).
0.15 0.2 0.03
*Likelihood that the event would happen within the next year. Estimated risk is the product relative likelihood and severity of failure. These values
were estimated by Terry Bahill September 13, 2009.
Bahill
86 ITEA Journal

incentives program. If a business or a home isretrofitted with electricity-saving or electricity-produc-ing devices, TEP will pay about one-third of thepurchase price. But to qualify for the program, thesystem needs to be installed by a certified professional;this discourages people from installing the systemthemselves because they would forego the rebate.
Electric companies might refuse to buy electricityfrom homeowners. Federal law requires electriccompanies to buy electricity from their customers(http://irecusa.org/wp-content/uploads/2009/10/IREC_NM_Model_October_2009-1.pdf).
Photovoltaic panels contain no toxic chemicals orheavy metals. Smashing a panel would not release toxic
gases, produce short circuits on the power grid, orcreate unusual flying debris.
SummaryThe system design process is a use-case-based
iterative process. Use cases describe the requiredfunctionality of the system; the functional andnonfunctional requirements are developed while writ-ing the use cases. These customer requirements areused to derive technical requirements and create testprocedures. Some of the highest priority requirementswill be made into evaluation criteria for use in trade-offstudies. The system functions (described in the usecases) are mapped to classes and blocks, and these are
Table 7. Failures modes and effects analysis for TEP’s electric AC power distribution grid.
Failure mode EffectFrequency of occurrence,
raw data, % of time Severity Risk
Short to ground on the
distribution grid.
This could damage TEP’s equipment,
particularly transformers and capacitor
banks. The system should be back up
within 2 hours. This is unlikely to
damage our customers’ equipment.
Twice a month, 0.6% Medium, 1,000 6
Loss of ability to supply
full load.
This would trip breakers and leave
customers without electric power.
One hour in 10 years, 0.001% Low, 100 0.001
Accidents. Injury to humans requiring medical
attention.
0.02% High, 10,000 2
Human mistakes. Death of humans, with 100 employees,
TEP has had no fatalities in 25 years
of operation.
0.0005% Extreme,
1,000,000
5
Intermittent local loss of
energy source such as wind
or sunlight due to, for
example, clouds.
Voltage on the grid changes and frequency
of coal-fired generators may change.
Big electric generators do like transients.
The average annual sunshine in Tucson
is 85%.
15% Very low, 10 1.5
Massive interruption of power
generation due to monsoon
thunderstorms.
This would cause the voltage on the grid
to change, and this might cause the
frequency of coal-fired generators to
change.
1% during July and August Low, 100 1
TEP must have the capacity to
supply peak power even if
clouds cover all of the solar
panels.
This not a problem when solar power
comprises only 1% or 2% of the load.
But if solar power were to approach
one-fourth to one-half of the peak
power, then TEP would have to have an
expensive, seldom used, backup system.
Presently, 0.01% Medium, 1,000 0.1
Grid frequency goes out of
60.5-Hz limits
This will trip generators, perhaps
overloading transmission lines and
may result in fines. Duration is usually
less than 5 minutes. This failure has a
low severity with existing equipment.
However, it will increase with
distributed generation.
Twice a week, 0.7% Low, 100 0.7
Feeder circuit disconnects
from substation
Feeder circuit voltage gets out of phase
with the grid. This failure has a
medium severity for existing equipment,
but it will get worse with PV solar panels.
It may require synchronized reclosers.
Interruption may last 10 minutes.
Twice a month, 0.05% Medium, 1,000 0.05
Illuminance Management Systems Engineering
31(1) N March 2010 87

interconnected to reveal the system architecture.Testing is more effective if it is planned right alongwith the system. Basing the tests on the use casesallows development of the testing procedures to beginright at the beginning of the system design. Thisshould help produce more complete test plans anddevelop customer support for the test plans. The testplans should also include system experiments that willtest the logic of the state machine diagrams. Thesystem design process is not serial; it is very iterative,and there are many opportunities for parallel process-ing. C
TERRY BAHILL is a professor of systems engineering at the
University of Arizona in Tucson. He received his doctor of
philosophy degree in electrical engineering and computer
science from the University of California, Berkeley. Bahill has
worked with Lutron Electronics in Coopersburg, Pennsylva-
nia; BAE Systems in San Diego, California; Hughes Missile
Systems in Tucson, Arizona; Sandia Laboratories in
Albuquerque, New Mexico; Lockheed Martin Tactical
Defense Systems in Eagan, Minnesota; Boeing Information,
Space and Defense Systems in Kent, Washington; Idaho
National Engineering and Environmental Laboratory in
Idaho Falls, Idaho; and Raytheon Missile Systems in Tucson,
Arizona. For these companies he presented seminars on systems
engineering, worked on system development teams, and helped
them describe their systems engineering process. He holds
a U.S. patent for the Bat Chooser, a system that computes the
ideal bat weight for individual baseball and softball batters.
He received the Sandia National Laboratories Gold
President’s Quality Award. He is a Fellow of the Institute
of Electrical and Electronics Engineers (IEEE), of Raytheon
and of the International Council on Systems Engineering
(INCOSE). He is the Founding Chair Emeritus of the
INCOSE Fellows Selection Committee. His picture is in the
Baseball Hall of Fame’s exhibition ‘‘Baseball as America.’’
You can view this picture at http://www.sie.arizona.edu/
sysengr/. E-mail:[email protected]
ReferencesBahill, A. Terry, Dave G. Baldwin, and John S.
Ramberg. 2009. Effects of altitude and atmosphericconditions on the flight of a baseball, International
Journal of Sports Science and Engineering 3 (2): 109–128.http://www.worldacademicunion.com/journal/SSCI/sscivol03no02paper07.pdf (accessed January 19, 2010).
Bahill, A. Terry, and Rick Botta. 2008. Fundamen-tal principles of good system design. Engineering
Management Journal 20 (4): 9–17.Bahill, A. Terry, and Frank F. Dean. 2009.
Discovering system requirements, Chapter 4. In
Handbook of systems engineering and management, 2ndedition. Edited by A. P. Sage, and W. B. Rouse,205–266. New York: John Wiley.
Bahill, A. Terry, and Steven J. Henderson. 2005.Requirements development, verification, and valida-tion exhibited in famous failures. Systems Engineering 8(1): 1–14.
Bahill, A. Terry, and Eric D. Smith. 2009. Anindustry standard risk analysis technique. EngineeringManagement Journal 21 (4): 16–29.
Bahill, A. Terry, and Ferenc Szidarovszky. 2009.Comparison of dynamic system modeling methods.Systems Engineering 12 (3): 183–200. doi 10.1002/sys.20118.
Bahill, A. Terry, Ferenc Szidarovszky, Rick Botta,and Eric D. Smith. 2008. Valid models require definedlevels. International Journal of General Systems 37 (5):553–571. doi: 10.1080/03081070701395807.
Botta, Rick, and A. Terry Bahill. 2007. A prioriti-zation process. Engineering Management Journal 19 (4):20–27.
Botta, Rick, Zach Bahill, and A. Terry Bahill. 2006.When are observable states necessary? Systems Engi-neering 9 (3): 228–240.
Chapman, William L., A. Terry Bahill, and A.Wayne Wymore. 1992. Engineering modeling anddesign. Boca Raton, Florida: CRC Press Inc.
Daniels, Jesse, and A. Terry Bahill. 2004. Thehybrid process that combines traditional requirementsand use cases. Systems Engineering 7 (4): 303–319.
Daniels, Jesse, Paul W. Werner, and A. TerryBahill. 2001. Quantitative methods for tradeoffanalyses. Systems Engineering 4 (3): 199–212.
Friedenthal, Sanford, Alan Moore, and Rick Steiner.2008. A practical guide to SysML: The systems modelinglanguage. Burlington, MA: Morgan Kaufman Publishers.
Mellor, Stephen J., Kendall Scott, Axel Uhl, andDirk Weise. 2004. MDA distilled: Principles of modeldriven architecture. Boston: Addison-Wesley.
OMG SysML. 2010. OMG Systems ModelingLanguage, The Official OMG SysML site, http://www.omgsysml.org/ (accessed January 19, 2010).
OMG UML. 2010. Unified Modeling Language,UML Resource Page, http://www.uml.org/ (accessedJanuary 19, 2010).
Pinewood. 1992. http://www.sie.arizona.edu/sysengr/pinewood/pinewood.pdf (accessed January 19, 2010).
Rechtin, Eberhardt. 2000. Systems architecting oforganizations: Why eagles can’t swim. Boca Raton,Florida: CRC Press.
Sage, Andrew P., and William B. Rouse. 2009.Handbook of systems engineering and management, 2ndedition. New York: John Wiley.
Bahill
88 ITEA Journal
Simon, Herbert A.. 1957. Models of man: Social andrational. New York: Wiley.
Simon, Herbert A.. 1962. The architecture ofcomplexity. Proceedings of the American PhilosophicalSociety 106: 467–482.
Smith, Eric D., Ferenc Szidarovszky, William J.Karnavas, and A. Terry Bahill. 2008. Sensitivityanalysis, a powerful system validation technique. TheOpen Cybernetics and Systemics Journal 2: 39–56. http://www.bentham.org/open/tocsj/openaccess2.htm, doi:10.2174/1874110X00802010039 (accessed January19, 2010).
Smith, Eric D., Young-Jun Son, Massimo Piattelli-Palmarini, and A. Terry Bahill. 2007. Amelioratingmental mistakes in tradeoff studies, Systems Engineer-ing 10 (2): 222–240.
Szidarovszky, Ferenc, and A. Terry Bahill. 1998.Linear systems theory, 2nd edition. Boca Raton, Florida:CRC Press.
Wymore, A. Wayne, and A. Terry Bahill. 2000. Whencan we safely reuse systems, upgrade systems or useCOTS components? Systems Engineering 3 (2): 82–95.
Wymore, A. Wayne. 1993. Model-based systemsengineering. Boca Raton, Florida: CRC Press.
AcknowledgmentsWe thank the Systems Engineering Brain Trust,
George Dolan, Bob Sklar, Brad Sowers, BruceGissing, and Rob Seaman, for helping to teach thisclass and for comments on the project documents. Wethank Sparx Systems for a site license for EnterpriseArchitect.
Illuminance Management Systems Engineering
31(1) N March 2010 89