Embed Size (px)
Citation preview

DESIGN AND TESTING OF A PNEUMATICALLYPROPELLED UNDERWATER GLIDER FOR SHALLOW
WATER
A. Wolek, T. Gode, C. A. Woolsey, J. Quenzer and K. A. Morgansen
aCASVirginia Center for Autonomous Systems
Virginia Polytechnic Institute & State UniversityBlacksburg, VA 24060www.unmanned.vt.edu
October 28, 2015
Technical Report No. VaCAS-2015-01Copyright c© 2015

Summary
This report details the design and testing of a pneumatically propelled underwater glider.The vehicle was designed as a platform for motion control experimentation, and to explorethe use of novel actuator designs to improve performance in shallow water and significantcurrents. The glider’s pneumatic buoyancy engine is capable of rapidly inflating an elas-tomeric bladder to 5 liters. (This displacement is an order of magnitude greater than thatof legacy buoyancy engine designs.) The buoyancy engine was shown to operate reliablyat 25 m depth. However, the compressibility of the bladder and associated change in tankweight (from exhausting air with each dive) presented significant challenges in trimming thevehicle. The attitude of the glider is controlled by translating and rotating a semi-annularmass. Because of the geometry of this mechanism, the glider is not restricted to a range ofroll attitudes (i.e. the glider has unlimited roll authority and can “flip over”). By flippingover the glider may employ asymmetric hydrodynamic surfaces while preserving the sameflow-relative geometry during both descents and ascents. Such asymmetric hydrodynamicsurfaces (e.g. cambered hydrofoils, dihedral, wing twist) may be used to improve efficiencyand performance. The ability to operate in both upright and inverted orientations requiresreducing the contribution of the rigid body (minus the moving mass) to the bottom heavinessof the vehicle. A moving acoustic long-baseline ranging system was developed to positionthe glider while it was underway. The performance of this system was characterized exper-imentally in terms of ping success rate for various transducer geometries and depths in ashallow-water, rocky bottom lake.
The authors gratefully acknowledge the sponsorship of the Office of Naval Research underGrants No. N00014-08-1-0012, N00014-10-1-0022, and N00014-13-1-0060.
i
Contents
1 Introduction 1
2 Buoyancy Control 4
2.1 Shallow Water Buoyancy Engine Requirements . . . . . . . . . . . . . . . . . 4
2.2 Selecting the Buoyancy Control Mechanism . . . . . . . . . . . . . . . . . . 5
2.3 Design of a Pneumatic Buoyancy Engine . . . . . . . . . . . . . . . . . . . . 6
2.3.1 Conceptual Design . . . . . . . . . . . . . . . . . . . . . . . . . . . . 6
2.3.2 Detailed Design . . . . . . . . . . . . . . . . . . . . . . . . . . . . . . 13
2.3.3 Longitudinal Placement of the Bladder . . . . . . . . . . . . . . . . . 14
2.3.4 Bladder Pressure, Pitch Attitude, and Depth Rate Coupling . . . . . 15
3 Attitude Control 16
3.1 Pitch Attitude Requirements . . . . . . . . . . . . . . . . . . . . . . . . . . . 16
3.2 Actuator Sizing . . . . . . . . . . . . . . . . . . . . . . . . . . . . . . . . . . 17
3.3 Detailed Design . . . . . . . . . . . . . . . . . . . . . . . . . . . . . . . . . . 18
3.4 Bottom Heaviness for a Glider with a Cylindrical Actuator . . . . . . . . . . 20
4 Wing and Tail Design 22
4.1 Wing Sizing . . . . . . . . . . . . . . . . . . . . . . . . . . . . . . . . . . . . 22
4.2 Wing Harness . . . . . . . . . . . . . . . . . . . . . . . . . . . . . . . . . . . 22
4.3 Vertical Tail Sizing and Placement . . . . . . . . . . . . . . . . . . . . . . . 24
4.4 Wing Modifications . . . . . . . . . . . . . . . . . . . . . . . . . . . . . . . . 26
4.5 Gliding Performance . . . . . . . . . . . . . . . . . . . . . . . . . . . . . . . 28
ii

5 Structures 30
5.1 Hull Sizing . . . . . . . . . . . . . . . . . . . . . . . . . . . . . . . . . . . . . 30
5.2 Marinization . . . . . . . . . . . . . . . . . . . . . . . . . . . . . . . . . . . . 32
5.3 Endcap Sizing . . . . . . . . . . . . . . . . . . . . . . . . . . . . . . . . . . . 32
5.4 O-ring Seals . . . . . . . . . . . . . . . . . . . . . . . . . . . . . . . . . . . . 34
5.5 Pressure Relief Valve and Vent Plug . . . . . . . . . . . . . . . . . . . . . . . 34
6 Recovery Aids 36
6.1 Flashers . . . . . . . . . . . . . . . . . . . . . . . . . . . . . . . . . . . . . . 36
6.2 Drop-weights . . . . . . . . . . . . . . . . . . . . . . . . . . . . . . . . . . . 37
6.3 Emergency Locater . . . . . . . . . . . . . . . . . . . . . . . . . . . . . . . . 38
6.4 Boat-side recovery . . . . . . . . . . . . . . . . . . . . . . . . . . . . . . . . 38
7 Electronics 41
7.1 Computer . . . . . . . . . . . . . . . . . . . . . . . . . . . . . . . . . . . . . 41
7.2 Power . . . . . . . . . . . . . . . . . . . . . . . . . . . . . . . . . . . . . . . 42
7.3 Sensors . . . . . . . . . . . . . . . . . . . . . . . . . . . . . . . . . . . . . . . 44
7.3.1 Leak Sensor . . . . . . . . . . . . . . . . . . . . . . . . . . . . . . . . 44
7.3.2 Depth Pressure Sensor . . . . . . . . . . . . . . . . . . . . . . . . . . 45
7.3.3 Bladder Pressure Sensor . . . . . . . . . . . . . . . . . . . . . . . . . 46
7.3.4 Travel Limit Sensors . . . . . . . . . . . . . . . . . . . . . . . . . . . 46
7.3.5 Inertial Measurement Unit . . . . . . . . . . . . . . . . . . . . . . . . 47
7.4 Actuators . . . . . . . . . . . . . . . . . . . . . . . . . . . . . . . . . . . . . 49
7.4.1 Flow Controllers . . . . . . . . . . . . . . . . . . . . . . . . . . . . . 49
7.4.2 Motor Controllers . . . . . . . . . . . . . . . . . . . . . . . . . . . . . 49
7.4.3 Drop-weight Trigger . . . . . . . . . . . . . . . . . . . . . . . . . . . 49
7.4.4 Air Supply Solenoid Relay . . . . . . . . . . . . . . . . . . . . . . . . 50
7.5 Communication . . . . . . . . . . . . . . . . . . . . . . . . . . . . . . . . . . 51
7.6 Pinouts and Connectors . . . . . . . . . . . . . . . . . . . . . . . . . . . . . 51
8 Acoustic Positioning and Communication 54
iii

8.1 Underwater Navigation and Communication . . . . . . . . . . . . . . . . . . 54
8.2 Hardware Design . . . . . . . . . . . . . . . . . . . . . . . . . . . . . . . . . 56
8.3 Software Design . . . . . . . . . . . . . . . . . . . . . . . . . . . . . . . . . . 60
9 Software 63
9.1 Motivation . . . . . . . . . . . . . . . . . . . . . . . . . . . . . . . . . . . . . 63
9.2 Operating System . . . . . . . . . . . . . . . . . . . . . . . . . . . . . . . . . 63
9.3 Robot Operating System . . . . . . . . . . . . . . . . . . . . . . . . . . . . . 64
9.4 Software Architecture . . . . . . . . . . . . . . . . . . . . . . . . . . . . . . . 64
9.5 Graphical User Interfaces . . . . . . . . . . . . . . . . . . . . . . . . . . . . . 67
9.6 Development Tools . . . . . . . . . . . . . . . . . . . . . . . . . . . . . . . . 67
10 Testing 69
10.1 Buoyancy Engine Feasibility . . . . . . . . . . . . . . . . . . . . . . . . . . . 69
10.2 Depth Rating Validation . . . . . . . . . . . . . . . . . . . . . . . . . . . . . 70
10.3 Sawtooth Glides in Pool . . . . . . . . . . . . . . . . . . . . . . . . . . . . . 70
10.4 Buoyancy Engine Performance . . . . . . . . . . . . . . . . . . . . . . . . . . 72
10.5 Trim and Gain Tuning . . . . . . . . . . . . . . . . . . . . . . . . . . . . . . 72
10.5.1 Comms Stance Trimming . . . . . . . . . . . . . . . . . . . . . . . . 73
10.5.2 Roll Trimming . . . . . . . . . . . . . . . . . . . . . . . . . . . . . . 74
10.5.3 Pitch Trimming . . . . . . . . . . . . . . . . . . . . . . . . . . . . . . 76
10.5.4 Bladder Pressure Gain Tuning . . . . . . . . . . . . . . . . . . . . . . 76
10.6 LBL Ranging System: Planar Motion Test . . . . . . . . . . . . . . . . . . . 77
10.7 LBL Ranging System: Vertical Motion Test . . . . . . . . . . . . . . . . . . 81
10.8 Sawtooth Glides with Acoustic Positioning . . . . . . . . . . . . . . . . . . . 81
11 Conclusion 86
iv

List of Figures
1.1 Major components of the Virginia Tech Underwater Glider . . . . . . . . . . 2
1.2 The Virginia Tech Underwater Glider prior to deployment in Claytor Lake, VA 3
2.1 Number of dives . . . . . . . . . . . . . . . . . . . . . . . . . . . . . . . . . . 7
2.2 Net weight with bladder volume for various scuba tank weights . . . . . . . . 8
2.3 Experimentally determined bladder pressure vs. buoyancy curve . . . . . . . 9
2.4 Bladder open loop response . . . . . . . . . . . . . . . . . . . . . . . . . . . 10
2.5 Required air exchange rate to maintain a fixed bladder volume at the corre-sponding depth rate for various drag coefficients . . . . . . . . . . . . . . . . 11
2.6 Sizing the pneumatic buoyancy engine control valves for a fixed bladder volume 12
2.7 Pneumatic buoyancy engine schematic . . . . . . . . . . . . . . . . . . . . . 13
2.8 Interior and exterior of the buoyancy control system . . . . . . . . . . . . . . 14
3.1 Forces in pitch . . . . . . . . . . . . . . . . . . . . . . . . . . . . . . . . . . . 17
3.2 Determining the translational motor torque required τLS to rotate the lead-screw mechanism . . . . . . . . . . . . . . . . . . . . . . . . . . . . . . . . . 18
3.3 Determining the rotational motor torque required τG to rotate the gear mech-anism . . . . . . . . . . . . . . . . . . . . . . . . . . . . . . . . . . . . . . . 18
3.4 Longitudinally moving actuator . . . . . . . . . . . . . . . . . . . . . . . . . 19
3.5 Rotating moving mass actuator . . . . . . . . . . . . . . . . . . . . . . . . . 19
3.6 Components of the moving mass mechanism . . . . . . . . . . . . . . . . . . 20
3.7 Forces related to the rolling motion of a glider . . . . . . . . . . . . . . . . . 20
4.1 Schematic of wing harness design . . . . . . . . . . . . . . . . . . . . . . . . 23
4.2 Range of asymmetric geometries provided by the wing harness . . . . . . . . 25
v

4.3 Illustration of wing and tail configuration used with the Athena Vortex Lattice(AVL [23]) software to estimate Cnβ . . . . . . . . . . . . . . . . . . . . . . . 26
4.4 Maximum airfoil lift-to-drag ratio with Reynolds number (McMasters, Tech-nical Soaring, 1980) [25] . . . . . . . . . . . . . . . . . . . . . . . . . . . . . 27
4.5 Modified glider wings . . . . . . . . . . . . . . . . . . . . . . . . . . . . . . . 27
4.6 Longitudinal forces in a steady gliding turn . . . . . . . . . . . . . . . . . . . 28
4.7 Spider plot: predicted performance of a hypothetical Seaglider equipped witha high displacement bladder. Lines of constant flight path angle (green) andangle of attack (red) are superimposed. . . . . . . . . . . . . . . . . . . . . . 29
5.1 Hull fabrication and maintenance . . . . . . . . . . . . . . . . . . . . . . . . 32
5.2 Dropweight before chromate conversion (right) and after (left) . . . . . . . . 33
5.3 Sketch of endcap to hull connection [26] . . . . . . . . . . . . . . . . . . . . . 33
5.4 Installation of endcap . . . . . . . . . . . . . . . . . . . . . . . . . . . . . . . 34
5.5 Sample endcap design . . . . . . . . . . . . . . . . . . . . . . . . . . . . . . 35
6.1 Tail module connected to aft end of the hull . . . . . . . . . . . . . . . . . . 36
6.2 Tailboom containing GPS and LED flashers . . . . . . . . . . . . . . . . . . 37
6.3 Dropweights . . . . . . . . . . . . . . . . . . . . . . . . . . . . . . . . . . . . 38
6.4 Dropweights . . . . . . . . . . . . . . . . . . . . . . . . . . . . . . . . . . . . 39
6.5 Aids for deploying and recovering the glider . . . . . . . . . . . . . . . . . . 40
7.1 Main electronics bay . . . . . . . . . . . . . . . . . . . . . . . . . . . . . . . 41
7.2 Endcap removed to recharge batteries . . . . . . . . . . . . . . . . . . . . . . 43
7.3 Schematic for switching between external and battery power . . . . . . . . . 43
7.4 Glider power and connector interface . . . . . . . . . . . . . . . . . . . . . . 44
7.5 Battery voltage divider used to scale 15 - 24 V to approx. 2.5 - 4.5 V for inputto I/O board . . . . . . . . . . . . . . . . . . . . . . . . . . . . . . . . . . . 44
7.6 Custom sensor used to detect leaks inside the hull . . . . . . . . . . . . . . . 45
7.7 Leak sensor circuit . . . . . . . . . . . . . . . . . . . . . . . . . . . . . . . . 45
7.8 Calibration of the depth sensor using a dead weight tester . . . . . . . . . . 45
7.9 An experiment was designed to measure the change in reported bladder pres-sure resulting from the orientation of the transducer . . . . . . . . . . . . . . 46
vi
7.10 Contact switch to detect translational travel limit of the moving mass . . . . 47
7.11 Mounting location of the IMU . . . . . . . . . . . . . . . . . . . . . . . . . . 47
7.12 Determining the bias in the inertial measurement unit mounting location . . 48
7.13 Characterizing the interference of the moving mass on the magnetometer reading 48
7.14 Proportional solenoid valve drivers in the buoyancy engine . . . . . . . . . . 49
7.15 Motor controllers during assembly of the electronics main bay . . . . . . . . 50
7.16 Drop-weight digital trigger . . . . . . . . . . . . . . . . . . . . . . . . . . . . 50
7.17 Relay circuit to power air supply valve . . . . . . . . . . . . . . . . . . . . . 51
7.18 Power distribution board and aft endcap connector . . . . . . . . . . . . . . 52
7.19 Aft endcap connector . . . . . . . . . . . . . . . . . . . . . . . . . . . . . . . 52
7.20 Glider electronics system schematic . . . . . . . . . . . . . . . . . . . . . . . 53
8.1 Types of acoustic baseline geometries . . . . . . . . . . . . . . . . . . . . . . 55
8.2 Beacon deployed on a raft . . . . . . . . . . . . . . . . . . . . . . . . . . . . 56
8.3 All three beacons during a tank test . . . . . . . . . . . . . . . . . . . . . . . 56
8.4 Hardware within the acoustic beacon . . . . . . . . . . . . . . . . . . . . . . 58
8.5 WHOI micro-modem wiring diagram . . . . . . . . . . . . . . . . . . . . . . 60
8.6 Sequence of events for LBL ranging and heartbeat communication . . . . . 62
9.1 Node-topic structure of VTUG software . . . . . . . . . . . . . . . . . . . . 65
9.2 Node-topic structure of an acoustic beacon or ground station . . . . . . . . . 65
9.3 Screenshot of the benchtestGUI interface . . . . . . . . . . . . . . . . . . . . 67
9.4 Screenshot of the beaconGUI interface with radio communication . . . . . . 68
9.5 Screenshot of the beaconGUI interface with acoustic communication . . . . . 68
10.1 Feasibility test of the pneumatic buoyancy engine . . . . . . . . . . . . . . . 69
10.2 Lake Washington Depth Rating Test . . . . . . . . . . . . . . . . . . . . . . 70
10.3 Pool sawtooth test . . . . . . . . . . . . . . . . . . . . . . . . . . . . . . . . 71
10.4 Buoyancy engine tests at Claytor Lake, VA . . . . . . . . . . . . . . . . . . . 72
10.5 Glider in a communications stance . . . . . . . . . . . . . . . . . . . . . . . 74
vii

10.6 Pairs of neutrally buoyant trim foam (larger pink blocks) and trim weight(smaller black pieces) were used to adjust the position of the CG and CB inthe vertical plane (only). . . . . . . . . . . . . . . . . . . . . . . . . . . . . . 75
10.7 Effect of wing buoyancy on rolling moments . . . . . . . . . . . . . . . . . . 75
10.8 LBL testing area at Claytor Lake, VA (Map data from Google Earth) . . . . 78
10.9 Testing the LBL system with a GPS-equipped boat emulating the glider usingNorth-South oriented swaths (Track 1) . . . . . . . . . . . . . . . . . . . . . 79
10.10Testing the LBL system with a GPS-equipped boat emulating the glider usingEast-West oriented swaths (Track 2) . . . . . . . . . . . . . . . . . . . . . . 80
10.11Testing of ping success for various LBL network depths. For a given fixeddepth of all the acoustic beacons’ transducers (shown in yellow) a transduceremulating the glider’s motion was held for 5 minutes at a range of depths(shown in red). . . . . . . . . . . . . . . . . . . . . . . . . . . . . . . . . . . 81
10.12Ping success percentage for various depths of the acoustic beacons’ transducers 82
10.13Sawtooth glide test with acoustic positioning . . . . . . . . . . . . . . . . . . 83
10.14Various mounting locations of the acoustic transducer . . . . . . . . . . . . . 84
10.15Sawtooth glide test with acoustic positioning and attitude control . . . . . . 85
viii

List of Tables
1.1 Specifications of the Virginia Tech Underwater Glider . . . . . . . . . . . . . 3
2.1 Buoyancy engine design requirements . . . . . . . . . . . . . . . . . . . . . . 5
2.2 Scuba tank specifications . . . . . . . . . . . . . . . . . . . . . . . . . . . . . 6
4.1 Comparison of wing geometry and wing loading . . . . . . . . . . . . . . . . 23
4.2 Comparison of tail volume and Cnβ coefficients . . . . . . . . . . . . . . . . . 24
5.1 Material properties of AL-6061-T6 . . . . . . . . . . . . . . . . . . . . . . . 30
5.2 Analysis of hull stress and collapse pressure . . . . . . . . . . . . . . . . . . 31
5.3 Analysis of hull buckling criteria . . . . . . . . . . . . . . . . . . . . . . . . . 32
7.1 Glider PC/104 computer components . . . . . . . . . . . . . . . . . . . . . . 42
8.1 Node hardware specifications . . . . . . . . . . . . . . . . . . . . . . . . . . . 59
8.2 Sample NMEA commands used by the WHOI acoustic modems (adapted from[34]) . . . . . . . . . . . . . . . . . . . . . . . . . . . . . . . . . . . . . . . . 61
10.1 Summary of results from Track 1 . . . . . . . . . . . . . . . . . . . . . . . . 79
10.2 Results of Track 2 . . . . . . . . . . . . . . . . . . . . . . . . . . . . . . . . . 80
ix

A. Wolek, T. Gode, C. A. Woolsey, J. Quenzer and K. A. Morgansen
Chapter 1
Introduction
Sunlight penetrates the shallow waters of the coastal ocean creating a euphotic zone thathosts many plants, algae, reefs and other organisms of interest to marine biologists and ofcommercial value to industry. The littoral zone is also of strategic importance to the Navy.The task of sampling the coastal ocean is increasingly being carried out by autonomousunderwater vehicles (AUVs). However, the presence of significant currents, that are oftendynamic and spatially varying, can adversely affect the mobility and efficiency of AUVsoperating in this environment. Moreover, the increased rate of biofouling in the euphoticzone can cripple long endurance robotic platforms.
Underwater gliders are capable of traversing hundreds of kilometers over deployment timesof weeks, or months, because their motion largely consists of steady, stable, low powerglides. Energy intensive buoyancy changes occur infrequently. The lack of external movingparts makes gliders quiet (and stealthy). This also makes them more robust to corrosionor biofouling than their propeller driven counterparts with external moving control surfaces.From robustness and endurance considerations, underwater gliders are ideal candidates forshallow water operations.
Traditional “legacy” gliders, such as Spray [1], Slocum [2] and Seaglider [3], were designedto operate in the deep waters of the open ocean. However, the unique challenges associatewith shallow waters motivates developing new glider designs with improved capabilities. Theperformance of a glider is determined in part by its inherent design (i.e. actuator capabilities,hydrodynamics, and energy storage) and in part by the way it is operated (i.e. guidance,navigation, and control). The goal of this work was to develop a underwater glider platformfor testing novel motion platting strategies (such as those discussed in [4, 5, 6, 7]) and toexplore new actuator designs that can improve performance in significant currents.
A few gliders have been developed specifically for the coastal ocean. These include theshallow water Slocum Battery [8] and more recently the Coastal Glider [9]. The shallow water(200 m) Slocum Battery was designed with a single-stroke piston style buoyancy engine. Itemploys a rudder to yaw (rather than rolling with a laterally moving mass). This helpsachieve a tight turning radius (of about 7 m) and improves maneuverability [10]. Howeverthe Slocum Battery only displaces 0.5 L of water with it’s buoyancy engine, resulting in a
Page 1
Virginia Center for Autonomous Systems Report No. 2015-01

A. Wolek, T. Gode, C. A. Woolsey, J. Quenzer and K. A. Morgansen
Figure 1.1: Major components of the Virginia Tech Underwater Glider
top speed of 25 cm/s. Shallow water currents often exceed this speed and can potentiallydominate the dynamics of a slow moving glider. The Coastal Glider has been in developmentfor the past decade and is now being commercialized. It features a hydraulic pump basedbuoyancy engine that drives a piston to create large volume changes of 5 liters. It can reachspeeds in excess of 1 m/s making it a good candidate for shallow water operations.
In addition to these gliders, the XRay [11] and ZRay [12] have been developed for longdistance and long duration flight. These Liberdade class gliders differ significantly fromearlier legacy designs. They are large blended wing body gliders (6m and 20m wingspanrespectively). Their design was inspired by the comprehensive study [13] that recognized theimprovements to be gained in net transport economy by increasing the scale, buoyant lungcapacity, and improving the hydrodynamic design of legacy gliders.
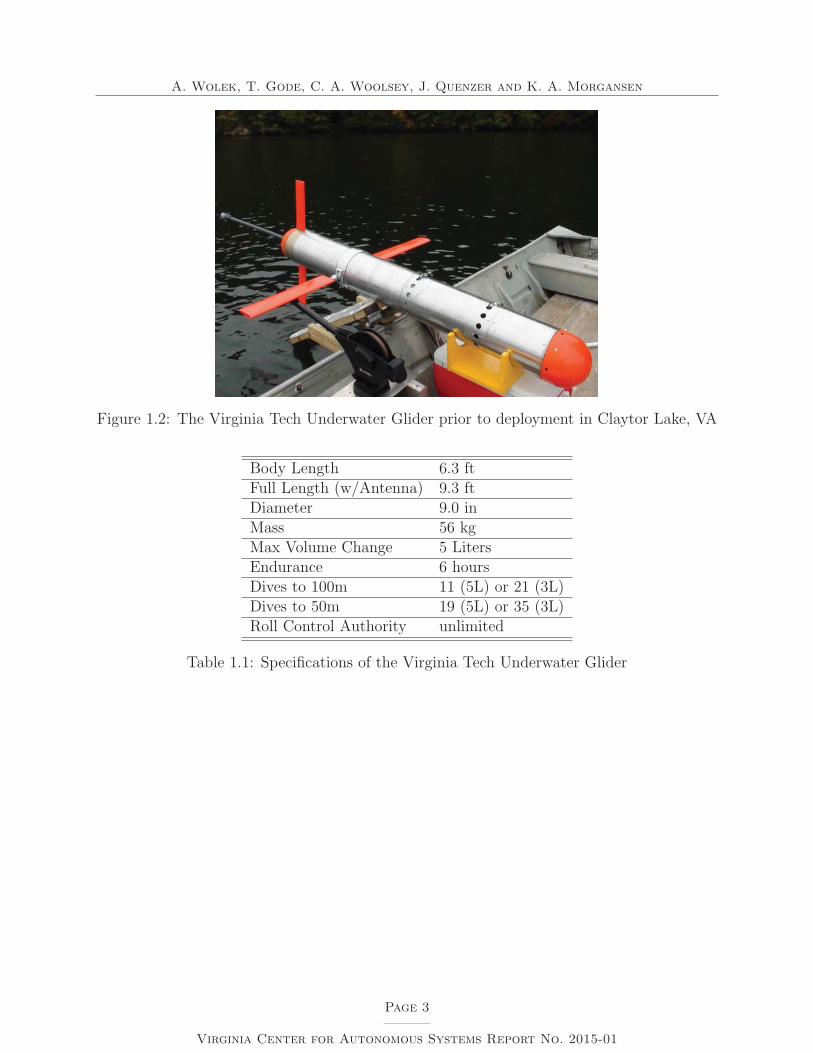
This report details the design and testing of a pneumatically propelled underwater glider,the Virginia Tech Underwater Glider [14, 15]. Key features of the design are illustrated inFigure 1.1. The glider’s pneumatic buoyancy is capable of rapidly inflating an elastomericbladder to 5 liters. The attitude of the glider is controlled by translating and rotating asemi-annular mass. A cylindrical moving mass mechanism allows the glider to “flip over”and employ asymmetric hydrodynamic surfaces. The glider was designed with open-sourcesoftware. The glider during testing is shown in Figure 1.2 and key specifications are givenin Table 1.1.
Page 2
Virginia Center for Autonomous Systems Report No. 2015-01
A. Wolek, T. Gode, C. A. Woolsey, J. Quenzer and K. A. Morgansen
Figure 1.2: The Virginia Tech Underwater Glider prior to deployment in Claytor Lake, VA
Body Length 6.3 ftFull Length (w/Antenna) 9.3 ftDiameter 9.0 inMass 56 kgMax Volume Change 5 LitersEndurance 6 hoursDives to 100m 11 (5L) or 21 (3L)Dives to 50m 19 (5L) or 35 (3L)Roll Control Authority unlimited
Table 1.1: Specifications of the Virginia Tech Underwater Glider
Page 3
Virginia Center for Autonomous Systems Report No. 2015-01

A. Wolek, T. Gode, C. A. Woolsey, J. Quenzer and K. A. Morgansen
Chapter 2
Buoyancy Control
Underwater gliders control their depth rate by controlling their net weight. This can beachieved by either adjusting the weight of the vehicle (e.g. releasing drop weights, or floodingballast tanks) or by adjusting the buoyancy (e.g. inflating a bladder, or displacing water in aflooded chamber using a piston). The mechanical device that adjusts buoyancy is sometimescalled the “buoyancy engine”, the “variable buoyancy device”, or the “buoyancy controlsystem”.
The total buoyancy B of a glider is the sum of the fixed buoyancy of the glider’s rigid bodyBRB (for shallow waters we may neglect hull compressibility, and assume this quantity isfixed) and the variable buoyancy generated by the buoyancy engine BBE. For a glider with“dry weight” W = mg (where m is the glider’s mass and g is gravitational acceleration), thenet force on the glider is referred to as the net weight W = W −B = W −BRB −BBE. Forthe glider to descend BRB < W is required, and there is a a value of BBE that gives neutralbuoyancy (W = 0). The buoyancy engine is typically designed to produce equal forces inboth ascents and descents.
2.1 Shallow Water Buoyancy Engine Requirements
Legacy gliders operate at horizontal speed of about 0.6 kts. At such low speeds, typicalcurrents in the coastal ocean can dominate the glider’s dynamics. This gap in speed motivatesthe design of faster gliders with larger buoyant lung capacities. Gliders are most efficientwhile in a steady equilibrium glide. Thus it is desirable to minimize the time it takes totransition from a dive to an ascent, and vice versa. This is particularly important in shallowwaters where there may not be sufficient depth to establish a steady glide. We refer tothe time that it takes the buoyancy engine to change between minimum and maximum netweight as the buoyancy transfer time. (Note that the speed of the moving mass actuator willalso determine the time it takes to achieve a steady glide.)
In the design of the Virginia Tech Underwater Glider (VTUG) the endurance was requiredto be long enough for a full day of field testing (about a 6 hour deployment). The max-
Page 4
Virginia Center for Autonomous Systems Report No. 2015-01

A. Wolek, T. Gode, C. A. Woolsey, J. Quenzer and K. A. Morgansen
Requirement ValueBuoyant Lung Capacity ± 5 % (± 2,500 cc assuming a 50 kg glider)Buoyancy Transfer Time ≤ 10 sec. (167 cc/s)Max. Operational Depth 100 mEndurance 6 hoursWeight ≤ 30 lbs (≈ 25% of vehicle dry weight)Size ≤ 20 in. length (≈ 25% of vehicle length)
Table 2.1: Buoyancy engine design requirements
imum operating depth was limited to 100 m. The buoyancy engine was required to havea large buoyant lung capacity (an order of magnitude larger than previous gliders) and asmall buoyancy transfer time (less than 10 seconds). These requirements are summarized inTable 2.1.
2.2 Selecting the Buoyancy Control Mechanism
There have been many mechanisms proposed for the purpose of buoyancy control. Tra-ditional buoyancy control mechanisms include piston-cylinder designs [8], hydraulic pump-powered bladders [1, 3] and the use of ballast tanks (as employed by manned submarines).Thermally driven phase-change buoyancy engines that harvest energy have been proven [2].Chemical reactions with surrounding seawater to produce gases for buoyancy control havebeen proposed [16, 17]. Using shape memory alloys to change the hull displacement for buoy-ancy control has also been investigated [18]. A detailed discussion of the working principlebehind each of these technologies is beyond the scope of this work. In the following, webriefly discuss the main reasons for choosing a pneumatic buoyancy engine.
A piston-cylinder buoyancy engine designed with a 8 inch diameter face (about the diameterof a typical glider hull) would require over 8,000 lbs of force to actuate at 100 m depth.Pretensioning the piston or reducing the piston face area (at the cost of a larger stroke)would reduce this force requirement. However, the power requirements to achieve the desiredtransfer time would remain prohibitive. Commercially available linear actuators (electricmotor/lead-screw or hydraulic models) designed for industrial applications were determinedto be too large and heavy to be viable options.
Oil-bladder and pump designs used by legacy gliders are efficient at high pressures and largedepths. To meet the buoyancy engine requirements, a fast and large displacement pumpwould be required. A common challenge associated with pump based buoyancy enginedesigns is the presence of air bubbles in the working fluid. Such air bubbles may be difficultto remove and under some conditions may result in a reduction or loss of pumping power. Apreliminary study of this concept concluded that commercially available pumps would notmeet the required specifications with a reasonable weight and volume.
Page 5
Virginia Center for Autonomous Systems Report No. 2015-01
A. Wolek, T. Gode, C. A. Woolsey, J. Quenzer and K. A. Morgansen
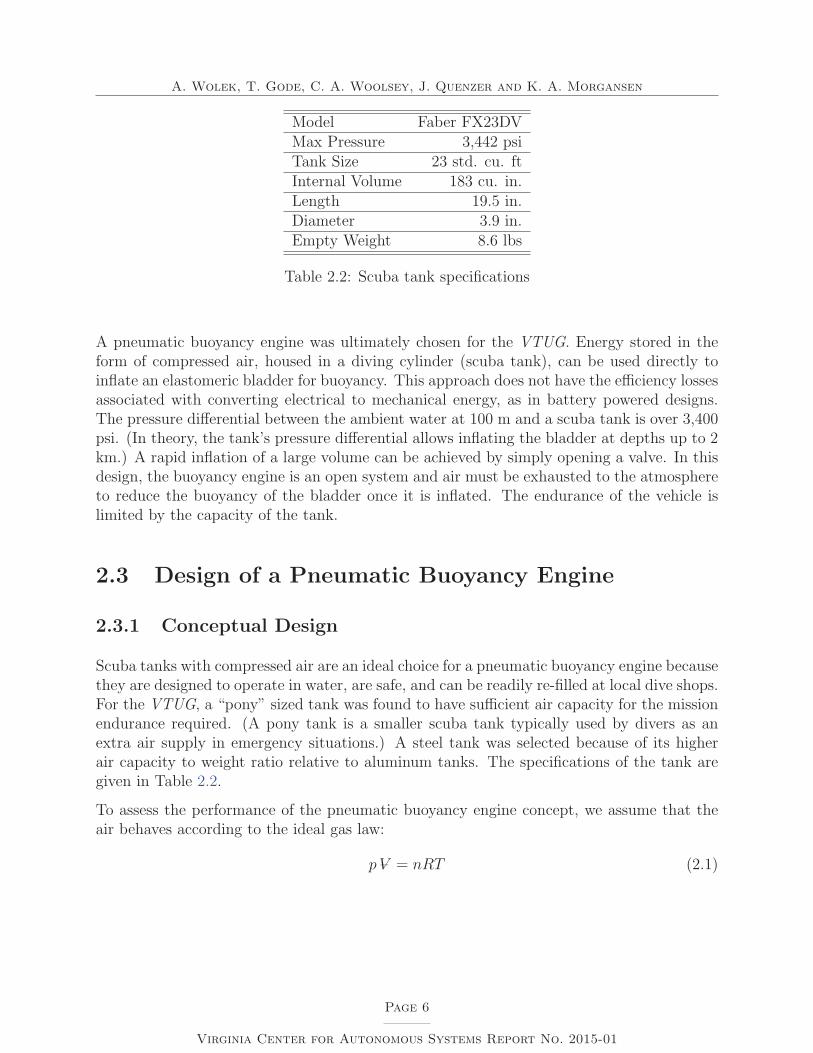
Model Faber FX23DVMax Pressure 3,442 psiTank Size 23 std. cu. ftInternal Volume 183 cu. in.Length 19.5 in.Diameter 3.9 in.Empty Weight 8.6 lbs
Table 2.2: Scuba tank specifications
A pneumatic buoyancy engine was ultimately chosen for the VTUG. Energy stored in theform of compressed air, housed in a diving cylinder (scuba tank), can be used directly toinflate an elastomeric bladder for buoyancy. This approach does not have the efficiency lossesassociated with converting electrical to mechanical energy, as in battery powered designs.The pressure differential between the ambient water at 100 m and a scuba tank is over 3,400psi. (In theory, the tank’s pressure differential allows inflating the bladder at depths up to 2km.) A rapid inflation of a large volume can be achieved by simply opening a valve. In thisdesign, the buoyancy engine is an open system and air must be exhausted to the atmosphereto reduce the buoyancy of the bladder once it is inflated. The endurance of the vehicle islimited by the capacity of the tank.
2.3 Design of a Pneumatic Buoyancy Engine
2.3.1 Conceptual Design
Scuba tanks with compressed air are an ideal choice for a pneumatic buoyancy engine becausethey are designed to operate in water, are safe, and can be readily re-filled at local dive shops.For the VTUG, a “pony” sized tank was found to have sufficient air capacity for the missionendurance required. (A pony tank is a smaller scuba tank typically used by divers as anextra air supply in emergency situations.) A steel tank was selected because of its higherair capacity to weight ratio relative to aluminum tanks. The specifications of the tank aregiven in Table 2.2.
To assess the performance of the pneumatic buoyancy engine concept, we assume that theair behaves according to the ideal gas law:
p V– = nRT (2.1)
Page 6
Virginia Center for Autonomous Systems Report No. 2015-01
A. Wolek, T. Gode, C. A. Woolsey, J. Quenzer and K. A. Morgansen
where
p = pressure (Pa)
V– = volume (m3)
n = amount of gas (moles)
R = universal gas constant
(8.314
J ·mole
K
).
T = temperature (K)
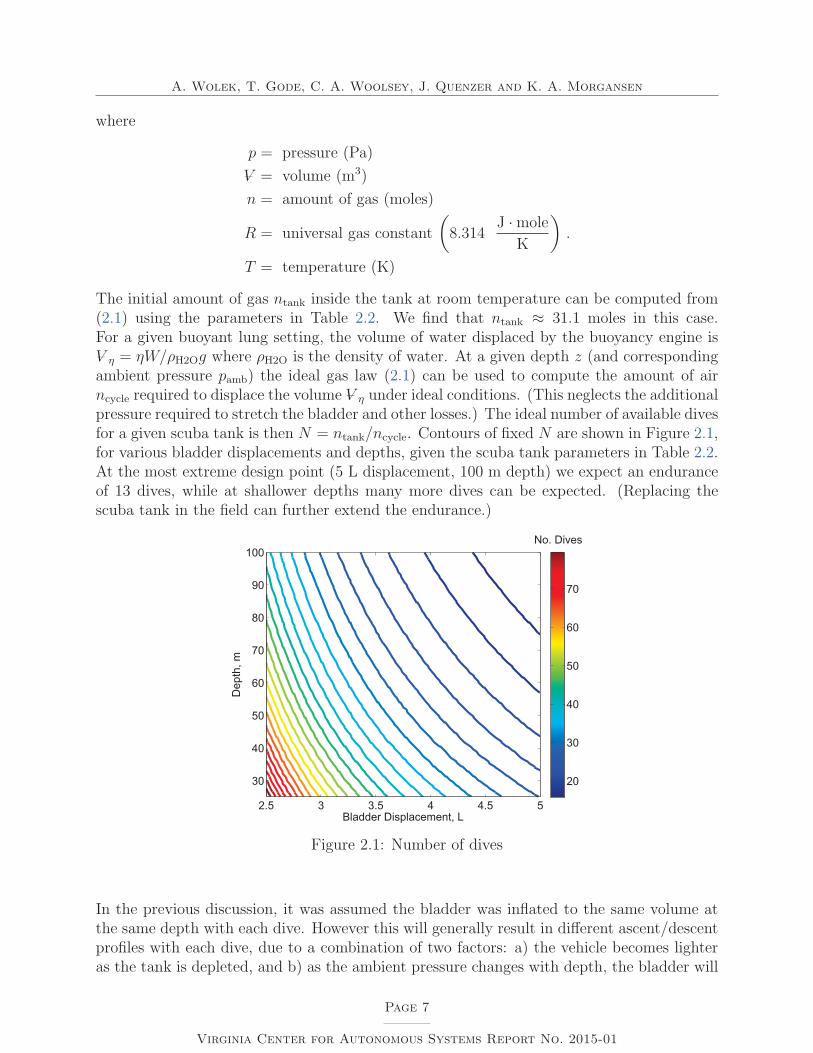
The initial amount of gas ntank inside the tank at room temperature can be computed from(2.1) using the parameters in Table 2.2. We find that ntank ≈ 31.1 moles in this case.For a given buoyant lung setting, the volume of water displaced by the buoyancy engine isV– η = ηW/ρH2Og where ρH2O is the density of water. At a given depth z (and correspondingambient pressure pamb) the ideal gas law (2.1) can be used to compute the amount of airncycle required to displace the volume V– η under ideal conditions. (This neglects the additionalpressure required to stretch the bladder and other losses.) The ideal number of available divesfor a given scuba tank is then N = ntank/ncycle. Contours of fixed N are shown in Figure 2.1,for various bladder displacements and depths, given the scuba tank parameters in Table 2.2.At the most extreme design point (5 L displacement, 100 m depth) we expect an enduranceof 13 dives, while at shallower depths many more dives can be expected. (Replacing thescuba tank in the field can further extend the endurance.)
Bladder Displacement, L
Dep
th, m
2.5 3 3.5 4 4.5 5
30
40
50
60
70
80
90
100No. Dives
20
30
40
50
60
70
Figure 2.1: Number of dives
In the previous discussion, it was assumed the bladder was inflated to the same volume atthe same depth with each dive. However this will generally result in different ascent/descentprofiles with each dive, due to a combination of two factors: a) the vehicle becomes lighteras the tank is depleted, and b) as the ambient pressure changes with depth, the bladder will
Page 7
Virginia Center for Autonomous Systems Report No. 2015-01

A. Wolek, T. Gode, C. A. Woolsey, J. Quenzer and K. A. Morgansen
0 0.5 1 1.5
4
2
0
2
4
6
Tank Air Weight (lbs)
Net
Wei
ght (
lbs)
5 L2.5 L0 L
Figure 2.2: Net weight with bladder volume for various scuba tank weights
expand/compress unless the pressure is actively regulated (with feedback control). In thefollowing we discuss these two effects.
The weight of air in the tank at full pressure (3,442 psi) is about 2 lbs. Assume that thevehicle is trimmed to be neutrally buoyant with a tank full and a bladder displacement of2.5 L. Then if every ascent corresponds to a bladder displacement of 5 L (fully inflated)and every descent to a displacement of 0 L (fully deflated), the change in (maximum andminimum) net weight as the tank becomes depleted is given by Figure 2.2. We find that asthe tank becomes lighter, the range of attainable net weights shifts towards higher buoyancyand the trim point will change significantly during the course of a single deployment.
The second effect results from the changes in ambient pressure around the elastomeric blad-der. Let pblad accounts for the pressure resulting from the elastic forces in a stretchedbladder. The bladder reaches an equilibrium volume when the ambient pressure pamb andelastic bladder pressure pblad is balanced by the internal bladder pressure pint:
pamb + pblad − pint = 0 . (2.2)
The ambient pressure is given by the hydrostatic equation
pamb = patm + ρH2Ogz , (2.3)
where patm is the atmospheric pressure. Assume that the elastic pressure pblad = pblad(V– )depends only on the volume of the stretched bladder. The internal bladder pressure is givenby the ideal gas law
pint =nRT
V–. (2.4)
Page 8
Virginia Center for Autonomous Systems Report No. 2015-01

A. Wolek, T. Gode, C. A. Woolsey, J. Quenzer and K. A. Morgansen
Then the equilibrium condition (2.2) is rewritten as
patm + ρH2Ogz + pblad(V– )− nRT
V–= 0 . (2.5)
In practice, we may measure pblad directly using a differential pressure sensor that comparesthe ambient water pressure to the internal bladder pressure. Figure 2.3 shows an experi-mental setup and resulting pressure-buoyancy curve for the bladder used on the VTUG. Theexperiment was conducted by submerging the buoyancy engine in a container and measur-ing the weight of water displaced by the bladder at various differential pressures pblad. (Asthe bladder was inflated, the displaced water drained through a hole in the container walldirectly onto a scale.) The pblad(V– ) curve-fit to the data in Figure 2.3 is a fourth orderpolynomial constrained to intersect the origin. (Note that the curve in Figure 2.3 actuallygives buoyancy with pressure, however it is trivial to obtain the corresponding volume.)
(a) Experimental setup (b) Fourth order fit to data (constrained to intersect the ori-gin)
Figure 2.3: Experimentally determined bladder pressure vs. buoyancy curve
Given the relationship pblad(V– ) we may use (2.5) to obtain an expression n(z, V– ) that givesthe amount of air required to inflate the bladder to a given volume, and a given depth. InFigure 2.4 contours of constant n are plotted in the z-V plane. These contours illustrate theopen-loop response of the bladder, with a fixed amount of air, subject to changes in depth.If we follow the contours starting along the maximum depth z = 100 m we find that for mostbladder displacements (V– > 0.8 L) the bladder volume expands to the 5 L and saturatesprior to reaching the surface.
The opposite effect occurs during descents. As the glider descends, the bladder is compressedand for displacements V– < 2 L (at the surface) the volume quickly approaches zero. Fromthis analysis it is clear that to maintain a fixed, non-zero, bladder displacement, the bladderpblad must be actively regulated by exhausting air during ascents and inflating air duringdescents.
Page 9
Virginia Center for Autonomous Systems Report No. 2015-01

A. Wolek, T. Gode, C. A. Woolsey, J. Quenzer and K. A. Morgansen
Volume, L
Dep
th, m
0 1 2 3 4 50
10
20
30
40
50
60
70
80
90
100mols
0.2
0.4
0.6
0.8
1
1.2
1.4
1.6
1.8
2
2.2
Figure 2.4: Bladder open loop response
Suppose that the bladder displacement is regulated to a fixed volume using two valves whichwe refer to as the inflator (to inject air into the bladder) and deflator (to exhaust air to theatmosphere). Holding V– fixed, and differentiating (2.5)
ρH2Ogz =nRT
V–. (2.6)
From (2.6) we may determine the air exchange rate n required for a given depth rate z. Therange of expected depth rates will depend on the buoyant lung setting and drag of the glider.A conservative estimate for the maximum depth rate can be obtained by equating the netweight to the drag force. This gives the terminal velocity
zmax = −sgn(W )
√2|W |
ρH2OSCD
, (2.7)
where S is the surface area and CD is the drag coefficient. Depending on the orientationof the glider the drag coefficient may vary. (We assume the worst case orientation wherethe glider is pointed downwards and is most streamlined. In this case, the surface area canbe taken as the hull cross-sectional area.) Equations (2.7) and (2.6) give a conservativeestimate of the required amount of air to be exhausted/inflated by the valves to maintain afixed bladder volume. This estimate is shown in Figure 2.5 for several drag coefficients, whereeach curve is generated by computing zmax and n, from (2.7) and (2.6), for varying W . It isinteresting to note that there is a maximum air exchange rate during descents. At W = 0the bladder displacement is 2.5 L corresponding to neutral buoyancy and thus zmax = 0 andn = 0. As W decreases, the bladder becomes completely deflated and there is no need toexchange air, and again n = 0. In-between these two conditions the maximum requiredinflation rate occurs. On the other hand, we find that the air exchange rate magnitude is
Page 10
Virginia Center for Autonomous Systems Report No. 2015-01

A. Wolek, T. Gode, C. A. Woolsey, J. Quenzer and K. A. Morgansen
monotonically increasing with W during ascents. The most demanding air exchange rateoccurs when the drag coefficient is low during highest speed ascents.
4 3 2 1 0 1 2 3 40.08
0.07
0.06
0.05
0.04
0.03
0.02
0.01
0
0.01
0.02
Air E
xcha
nge
Rat
e, m
ol/s
Depth Rate, m/s
CD = 0.25
CD = 0.1
CD = 1
Figure 2.5: Required air exchange rate to maintain a fixed bladder volume at the corre-sponding depth rate for various drag coefficients
Having established the required air exchange rates it remains to select actuators (valves andtubing) to meet these requirements. Generally, vendors of flow control valves provide flowcoefficients (Cv) or volumetric flow rate curves for various differential pressures. The flowcoefficient for gas flow [19] is given by
q = NCvp1
(1− 2Δp
3p1
)√Δp
p1T1
, (2.8)
where
q = volumetric flow rate (std. ft3/min)
p1 = inlet pressure (psia)
p2 = outlet pressure (psia)
Δp = p1 − p2, differential pressure (psid)
T1 = absolute temperature (R)
N = 22.67 (constant depending on unit choice).
In Figure 2.6(a), the deflator flow coefficient Cv is calculated from (2.8) for a range of bladderdisplacements and depths. For a given bladder displacement and depth, the correspondingmaximum depth rate and air exchange rate are calculated using (2.7) and (2.6), assumingCD = 0.1 (the worst case). Recall that mair = nMair relates an amount of air n to the mass
Page 11
Virginia Center for Autonomous Systems Report No. 2015-01

A. Wolek, T. Gode, C. A. Woolsey, J. Quenzer and K. A. Morgansen
of the air mair where where Mair is the molecular weight of air. Then the volumetric flowrate is
q =mair
ρair=
nMair
ρair.
For sizing the deflator, Δp = pblad(V– ), and the hydrostatic equation (2.3) can be used tocompute p2 = pamb. Then p1 = pamb+Δp. In Figure 2.6(a), we find that the deflator require-ments (to maintain a fixed bladder volume) increase with depth and bladder displacement.
A similar analysis can be used to size the inflator. The flow into the bladder is driven bythe large pressure differential between the scuba tank and the internal bladder pressure.Thus the effects of changes in depth can be ignored. In Figure 2.6(b) we find that the Cv issignificantly lower than that of the deflator. Further, there is a bladder displacement thatmaximizes the required Cv, and this is related to the maximum air exchange rate n seen inFigure 2.5.
Depth, m
Blad
der D
ispl
acem
ent,
L
0 20 40 60 80 1002.5
3
3.5
4
4.5
5Cv
0.2
0.4
0.6
0.8
1
1.2
1.4
1.6
(a) Deflator valve requirements
Tank Pressure, psia
Blad
der D
ispl
acem
ent,
L
500 1000 1500 2000 2500 30000
0.5
1
1.5
2
2.5Cv
0.02
0.04
0.06
0.08
0.1
0.12
(b) Inflator valve requirements
Figure 2.6: Sizing the pneumatic buoyancy engine control valves for a fixed bladder volume
Note that these previous analyses assumed the bladder is already inflated to a desired volume.To determine the flow coefficient require for a given buoyancy transfer time one must studythe dynamic process of inflating or deflating the bladder. We do not characterize this processhere but we note that it is largely driven by the pressure differential. In the case of inflatingthe bladder, the flow rate can be assumed fixed (since the change in tank pressure is smallduring a single inflation). Whereas during deflation, the change in pressure (and thus flowrate) is given by pblad(V– ) and cannot be assume fixed. The above analysis was used toselect the deflator (model: iQValves Standard PFCV-203321) and inflator (model: EnfieldTechnologies LS-V15) valves.
Page 12
Virginia Center for Autonomous Systems Report No. 2015-01

A. Wolek, T. Gode, C. A. Woolsey, J. Quenzer and K. A. Morgansen
Figure 2.7: Pneumatic buoyancy engine schematic
2.3.2 Detailed Design
A schematic of the major components in the pneumatic buoyancy engine is given in Fig-ure 2.7. A standard 1st stage dive regulator (model: Zeagle DS-V) is fitted to the scubatank. This regulator contains a diaphragm that outputs both a high pressure and low pres-sure. The high pressure (HP) air port is used for sensing the pressure remaining in the tank,and a low pressure (LP) air port is used to inflate the bladder. The regulator is designed todeliver the LP air at a constant 160 psid above ambient. Early work studying the feasibil-ity of the pneumatic buoyancy engine concept involved a test rig with on/off solenoid flowcontrol valves (see Section 10.1). In the design of the glider’s buoyancy engine proportionalsolenoid valves were used instead. (Note: some valves do not seal completely when they are“closed.” Such valves have a vendor specified “leakage rate”. The inflator valve’s leakagewas suppressed by installing an additional solenoid in-line to open the flow to the inflator,prior to an inflation.)
The pressure sensor inlet and bladder exhaust were fitted with 25 μm filters to preventdebris from entering the system. To prevent water from entering the bladder where the air isexhausted a check valve was used. The “cracking pressure” of a check valve is the minimumpressure differential required to open the valve. Since the bladder pressure is relatively low,a very low cracking pressure (0.02 psi) medical grade check valve was chosen. However,this valve was relatively small and restricted the flow. Thus a series of parallel check valveswere installed across a manifold. All of the pneumatic tubing consisted of perfluoroalkoxy(PFA) teflon tubing and Swagelok fittings. The Swagelok fittings provide an easy methodfor installing, maintaining, and altering the pneumatic system through the use of two-ferruletube fittings and a swaging technique. The latex bladder was originally fabricated for usein a blood pressure measurement device (sized to measure blood pressure around an adultthigh, model: W. A. Baum Co. Inc. #1844 ). This bladder was modified by installing a largediameter fitting (Figure 4.2(e)) to allow larger tubing to the deflator (Figure 4.3(d)). Toincrease the pressure in the bladder, and improve deflation rates, a covering for the bladderwas constructed from olefin fabric. This restricted the volume of the bladder while allowing
Page 13
Virginia Center for Autonomous Systems Report No. 2015-01

A. Wolek, T. Gode, C. A. Woolsey, J. Quenzer and K. A. Morgansen
higher pressures.
An external view of the pneumatic buoyancy control system fabricated for the glider is shownin Figure 2.8. The bladder pressure was regulated using a proportional-integral-derivative(PID) controller.
(a) Modified bladder with deflator fitting (b) Large diameter deflator tubing
(c) Internal pneumatic control and sensing (d) Flooded chamber removed to expose blad-der with olefin fabric jacket, exhaust manifold,and tank
Figure 2.8: Interior and exterior of the buoyancy control system
2.3.3 Longitudinal Placement of the Bladder
The buoyancy engine of the glider can generate large pitching moments and strongly influencethe attitude of the glider. Since the glider is generally in a nose up attitude during ascents,and nose down attitude during descents, it may seem appropriate to place the bladdertowards the nose in front of the vehicle’s center of gravity. In such a configuration, increasesand decreases in the buoyancy of the bladder relative to the neutral buoyancy state result ina pitching moment in a favorable direction. However, this makes achieving a communicationsstance on the surface more difficult. (See Section 10.5.1 for a detailed discussion.) To mitigate
Page 14
Virginia Center for Autonomous Systems Report No. 2015-01

A. Wolek, T. Gode, C. A. Woolsey, J. Quenzer and K. A. Morgansen
this issue some gliders have a secondary bladder used solely to assist in elevating the tail onthe surface. The placement of the bladder depends heavily on the design of the pitch controlmechanism and requires a detailed analysis of the available pitch attitudes under a range ofoperating conditions.
For the VTUG, we found that placing the bladder in the nose was not feasible as the pitchingmoments in this configuration were too large for the moving mass to have sufficient pitchauthority. A compromise was achieved by placing the bladder forward of the CG but “inside”the hull to reduce the bladder moment arm. This required a section of the vehicle to beflooded.
2.3.4 Bladder Pressure, Pitch Attitude, and Depth Rate Coupling
One challenge associated with placing the bladder forward of the CG is that this causes acoupling between bladder pressure, pitch, and depth rate. The result is that any open-loopequilibrium gliding state is unstable.
Consider a vehicle in a steady equilibrium descent and suppose that at a given instant thebladder feedback control loop is turned off. The bladder pressure will decrease as the gliderdescends and this will cause a nose-down pitching moment. A steeper pitch attitude willfurther increase the bladder’s depth and reduce its volume. The vehicle will become lessbuoyant and, together with a steeper flight path angle, the depth rate will increase.
This coupling can also occur on the surface when the glider is in a communications stance. Aperturbation in pitch attitude (e.g. from waves or wind) may cause the bladder (located inthe nose) to plunge deeper below the surface. Even with a small depth change the change inambient pressure (and therefore bladder pressure) may be significant (e.g. a change in depthof 0.5 m gives ≈ 0.7 psi change in ambient pressure). As discussed in Section 10.5.1 theVTUG executes its communications stance with just a marginally positive buoyancy. Thus,even a small bladder pressure change may be sufficient for the vehicle to become negativelybuoyant. In both of these cases, a well designed bladder feedback controller is needed tomitigate these effects.
Page 15
Virginia Center for Autonomous Systems Report No. 2015-01

A. Wolek, T. Gode, C. A. Woolsey, J. Quenzer and K. A. Morgansen
Chapter 3
Attitude Control
The attitude of the glider in pitch and roll is controlled using an internal translating androtating (cylindrical) mass that adjusts the vehicle’s center of gravity. A single moving massis used for both pitch and roll control.
3.1 Pitch Attitude Requirements
Typically the pitch actuator must be design to generate sufficient pitching moments to meeta desired:
1. range of pitch attitudes during descents,
2. range of pitch attitudes during ascents,
3. pitch attitude during surface communication.
A free body diagram of the forces acting on a glider in a steady, equilibrium glide is shownin Figure 3.1. (Note that we omit the hydrodynamic lift and drag forces here for simplicity.)It is assumed that all of the forces act along the vehicle centerline, with the exception of themoving mass weight WMM (which we assume acts a distance zMM below the centerline). Theattainable pitch angles will change with the buoyancy generated by the buoyancy engineBBE, and the weight of the tank WT. The remaining weight of the rigid body (excludingWMM and WT) is denoted WRB. Similarly, the buoyancy of the rigid body (excluding BBE)is denoted BRB. The longitudinal location through which each force acts is measured fromthe back of the vehicle (indicated by l in Figure 3.1). Then the conditions for equilibriumare:
ΣFz : WMM +WT +WRB − BRB − BBE = 0 (3.1)
ΣM : (lMM + zMM tan θ)WMM + lTWT + lRBWRB − lRBBRB − lBEBBE = 0 (3.2)
where θ is the pitch angle.
Page 16
Virginia Center for Autonomous Systems Report No. 2015-01

A. Wolek, T. Gode, C. A. Woolsey, J. Quenzer and K. A. Morgansen
Figure 3.1: Forces in pitch
If the moving mass can travel from lMM ∈ [lMM,min, lMM,max], then using (3.1) and (3.2) therange of possible pitch attitudes can be computed for a given bladder buoyancy and tankweight. The center of gravity (CG) and center of buoyancy (CB) positions in the verticalplane are given by:
CGx =lMMWMM + lTWT + lRBWRB
WMM +WT +WRB
(3.3)
CGz =zMMWMM
WMM +WT +WRB
(3.4)
CBx =lRBBRB + lBEBBE
BBE +BRB
(3.5)
CBz = 0 . (3.6)
By adjusting the moving mass position, tank weight, and bladder buoyancy parameters,one may determine if the vehicle is capable of meeting the desired range pitch attitudes.Inevitably the mass properties of the manufactured vehicle will deviate from those assumedduring the design. Uncertainty analysis must be incorporated into the design process, andtrim adjustments must be made by installing ballast (e.g. lead) or buoyancy (e.g. syntacticfoam) onto the vehicle as needed. Note that when the vehicle is on the surface, the problem ofdetermining the CB is much more complex because one must account for the discontinuity inthe fluid density. (The buoyancy of the portions of the glider exposed to the air is negligible.)On the VTUG, the tank was placed close to CB to reduce the effect on the pitch trim of thevehicle.
3.2 Actuator Sizing
To size the actuators, we compute the force required to move the mass by summing thefrictional forces and weight along the axis of the glider as shown in Figure 3.6. A lead-screwtype pitch actuator was chosen to move the mass. A “triple-start” lead-screw (with threeindependent threads) was used to maximize the travel per turn of the screw. (Each turnresulted in dLS = 1/4 in. of travel). The required lead-screw torque τLS was computed
Page 17
Virginia Center for Autonomous Systems Report No. 2015-01

A. Wolek, T. Gode, C. A. Woolsey, J. Quenzer and K. A. Morgansen
by assuming the rotational work from one turn of the lead-screw (τLS2π) is equal to thetranslational work of moving the mass: (Ff +WMM sin θ)dLS. Thus
τLS =(Ff +WMM sin θ)dLS
2π. (3.7)
Figure 3.2: Determining the translational motor torque required τLS to rotate the lead-screwmechanism
A motor and gear-head were selected to meet the required lead-screw torque with a sufficientfactor of safety. Since some of the moving mass is symmetric about the body axis, only afraction of the moving mass weight is used to roll the vehicle. Figure 3.3 shows the forcesand moments acting on the rotating mass where Ff is the bearing friction, WRM is the weightof the rotating portion of the moving mass, and τG is the force required to rotate the mass.The moving rotational moving mass weight WRM should be sized to overcome the buoyancyof the wings at the surface (see Section 10.5.2 for a detailed discussion).
Figure 3.3: Determining the rotational motor torque required τG to rotate the gear mecha-nism
3.3 Detailed Design
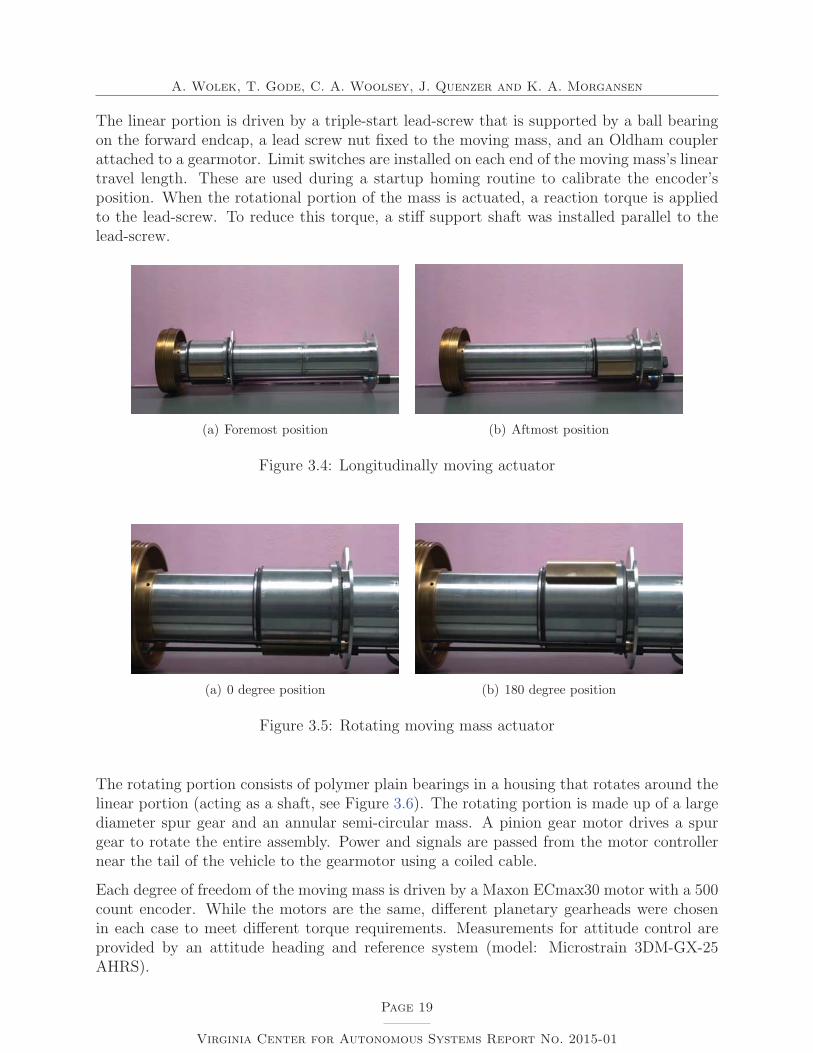
The moving mass weighs 11.2 lbs, of which the rotational portion weighs about 8.1 lbs. Usingpolymer plain bearings, the linear portion of the mass slides along the large diameter shaft(that also houses the scuba tank), and rotates as shown in Figure 3.4 and 3.5. The shaftalong which the mass moved allows a linear travel range of 15 inches with a maximum speedof 0.42 in/s. The angular range is unrestricted and has a maximum angular rate of 70 deg/s.
Page 18
Virginia Center for Autonomous Systems Report No. 2015-01
A. Wolek, T. Gode, C. A. Woolsey, J. Quenzer and K. A. Morgansen
The linear portion is driven by a triple-start lead-screw that is supported by a ball bearingon the forward endcap, a lead screw nut fixed to the moving mass, and an Oldham couplerattached to a gearmotor. Limit switches are installed on each end of the moving mass’s lineartravel length. These are used during a startup homing routine to calibrate the encoder’sposition. When the rotational portion of the mass is actuated, a reaction torque is appliedto the lead-screw. To reduce this torque, a stiff support shaft was installed parallel to thelead-screw.
(a) Foremost position (b) Aftmost position
Figure 3.4: Longitudinally moving actuator
(a) 0 degree position (b) 180 degree position
Figure 3.5: Rotating moving mass actuator
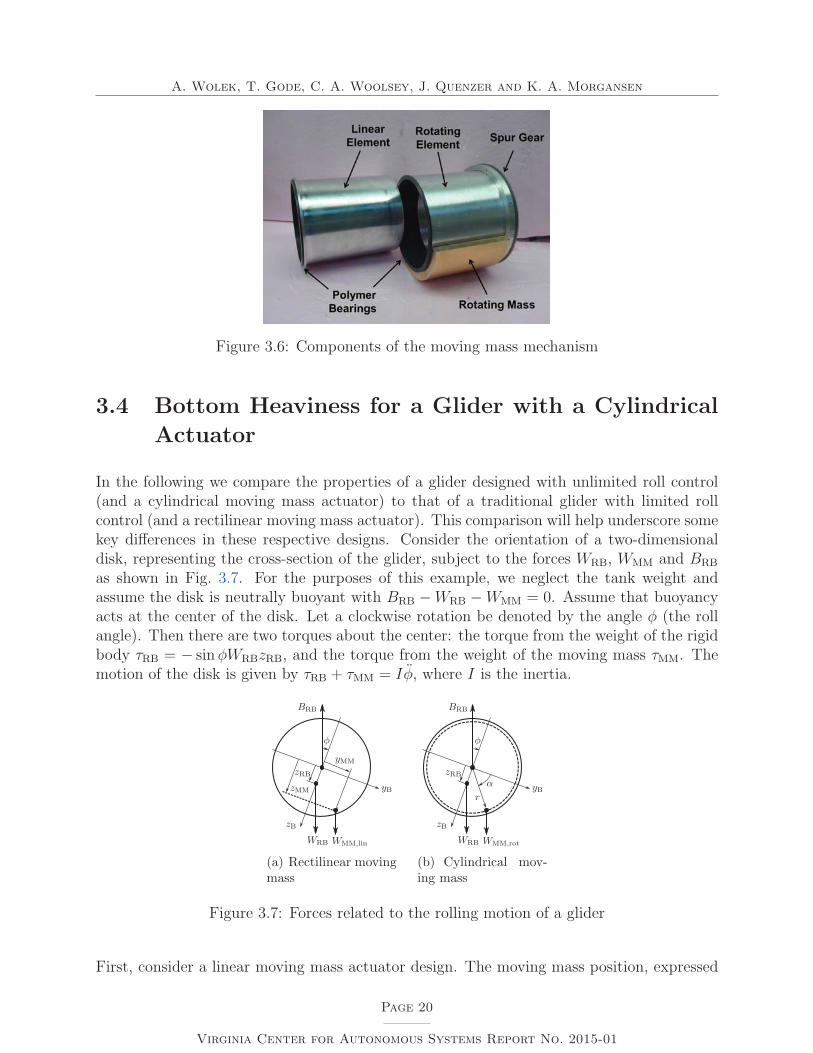
The rotating portion consists of polymer plain bearings in a housing that rotates around thelinear portion (acting as a shaft, see Figure 3.6). The rotating portion is made up of a largediameter spur gear and an annular semi-circular mass. A pinion gear motor drives a spurgear to rotate the entire assembly. Power and signals are passed from the motor controllernear the tail of the vehicle to the gearmotor using a coiled cable.
Each degree of freedom of the moving mass is driven by a Maxon ECmax30 motor with a 500count encoder. While the motors are the same, different planetary gearheads were chosenin each case to meet different torque requirements. Measurements for attitude control areprovided by an attitude heading and reference system (model: Microstrain 3DM-GX-25AHRS).
Page 19
Virginia Center for Autonomous Systems Report No. 2015-01
A. Wolek, T. Gode, C. A. Woolsey, J. Quenzer and K. A. Morgansen
Figure 3.6: Components of the moving mass mechanism
3.4 Bottom Heaviness for a Glider with a Cylindrical
Actuator
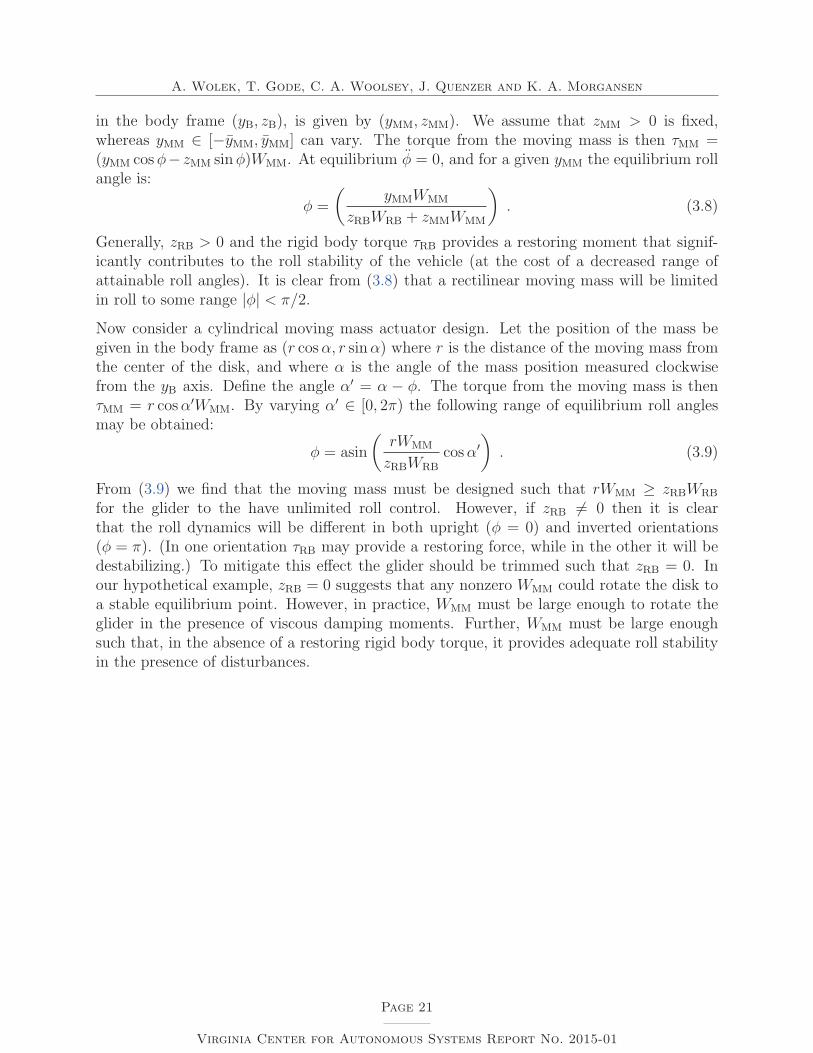
In the following we compare the properties of a glider designed with unlimited roll control(and a cylindrical moving mass actuator) to that of a traditional glider with limited rollcontrol (and a rectilinear moving mass actuator). This comparison will help underscore somekey differences in these respective designs. Consider the orientation of a two-dimensionaldisk, representing the cross-section of the glider, subject to the forces WRB, WMM and BRB
as shown in Fig. 3.7. For the purposes of this example, we neglect the tank weight andassume the disk is neutrally buoyant with BRB −WRB −WMM = 0. Assume that buoyancyacts at the center of the disk. Let a clockwise rotation be denoted by the angle φ (the rollangle). Then there are two torques about the center: the torque from the weight of the rigidbody τRB = − sinφWRBzRB, and the torque from the weight of the moving mass τMM. Themotion of the disk is given by τRB + τMM = Iφ, where I is the inertia.
(a) Rectilinear movingmass
(b) Cylindrical mov-ing mass
Figure 3.7: Forces related to the rolling motion of a glider
First, consider a linear moving mass actuator design. The moving mass position, expressed
Page 20
Virginia Center for Autonomous Systems Report No. 2015-01
A. Wolek, T. Gode, C. A. Woolsey, J. Quenzer and K. A. Morgansen
in the body frame (yB, zB), is given by (yMM, zMM). We assume that zMM > 0 is fixed,whereas yMM ∈ [−yMM, yMM] can vary. The torque from the moving mass is then τMM =(yMM cosφ− zMM sinφ)WMM. At equilibrium φ = 0, and for a given yMM the equilibrium rollangle is:
φ =
(yMMWMM
zRBWRB + zMMWMM
). (3.8)
Generally, zRB > 0 and the rigid body torque τRB provides a restoring moment that signif-icantly contributes to the roll stability of the vehicle (at the cost of a decreased range ofattainable roll angles). It is clear from (3.8) that a rectilinear moving mass will be limitedin roll to some range |φ| < π/2.
Now consider a cylindrical moving mass actuator design. Let the position of the mass begiven in the body frame as (r cosα, r sinα) where r is the distance of the moving mass fromthe center of the disk, and where α is the angle of the mass position measured clockwisefrom the yB axis. Define the angle α′ = α − φ. The torque from the moving mass is thenτMM = r cosα′WMM. By varying α′ ∈ [0, 2π) the following range of equilibrium roll anglesmay be obtained:
φ = asin
(rWMM
zRBWRB
cosα′)
. (3.9)
From (3.9) we find that the moving mass must be designed such that rWMM ≥ zRBWRB
for the glider to the have unlimited roll control. However, if zRB �= 0 then it is clearthat the roll dynamics will be different in both upright (φ = 0) and inverted orientations(φ = π). (In one orientation τRB may provide a restoring force, while in the other it will bedestabilizing.) To mitigate this effect the glider should be trimmed such that zRB = 0. Inour hypothetical example, zRB = 0 suggests that any nonzero WMM could rotate the disk toa stable equilibrium point. However, in practice, WMM must be large enough to rotate theglider in the presence of viscous damping moments. Further, WMM must be large enoughsuch that, in the absence of a restoring rigid body torque, it provides adequate roll stabilityin the presence of disturbances.
Page 21
Virginia Center for Autonomous Systems Report No. 2015-01

A. Wolek, T. Gode, C. A. Woolsey, J. Quenzer and K. A. Morgansen
Chapter 4
Wing and Tail Design
4.1 Wing Sizing
The wings were initially sized to be approximately equal to those of legacy gliders. Holdingthe wing size fixed makes it possible to evaluate the performance improvements resulting froma larger buoyant lung capacity alone. The scaled planform drawings of the legacy glidersSpray [1], Slocum [2], and the Seaglider [3] were imported into computer-aided drafting(CAD) software. These drawings were used to estimate the details of the legacy gliderwing and tail geometry that are not explicitly stated in the literature. (Note that theseestimates are based on older publications and do not reflect their modern variants. Further,in calculating the wing and tail geometry the fuselage area was ignored.) The baselinewing for the VTUG was chosen to be a straight rectangular wing with a symmetric airfoil(NACA-0015) and a span and chord comparable to that of legacy gliders, see Table 4.1 fora comparison. Since the net weight of the VTUG is an order of magnitude larger than thatof legacy gliders, the wing loading is proportionally larger as well.
The relatively small wings of underwater gliders are often placed far aft of the center of grav-ity. In such a position the wings act like a combined wing and horizontal tail. A positive(nose-up) perturbation in angle of attack increases the lift force on this aft wing/tail andresults in a restoring moment. However, when fuselage effects are considered, the hydro-dynamics of the glider do not necessarily contribute to longitudinally (static) stability [20].Instead, longitudinal static stability is primarily driven by the restoring moment resultingfrom the offset between the center of gravity and center of buoyancy.
4.2 Wing Harness
The chief advantage of unlimited roll control (i.e. the ability to “flip over”) is that the thevehicle may employ various asymmetric wing and tail geometries to improve performance.
Page 22
Virginia Center for Autonomous Systems Report No. 2015-01

A. Wolek, T. Gode, C. A. Woolsey, J. Quenzer and K. A. Morgansen
Net Weight, W(lbs)
Span, b(in)
Mean Geometric Chord, c(in)
Wing Loading, W/S(psf)
Seaglider 0.33 29.4 6.68 0.24Spray 0.49 38.7 4.13 0.44Slocum 0.57 27.1 3.53 0.86VTUG 5.51 40.0 4.00 4.96
Table 4.1: Comparison of wing geometry and wing loading
Most existing gliders cannot flip over and thus they are typically designed to be symmet-ric about the vehicle’s horizontal plane. This ensures that the hydrodynamic forces areequivalent in both ascents and descents.
A wing harness was designed to hold the wing in a number of asymmetric geometries, includ-ing various dihedral angles (affecting roll stability), wing incidence angles (affecting drag)and at various longitudinal positions (affecting pitch stability). However, to change otherwing parameters such as wing camber, twist, or taper ratio, new wings must be fabricated.
601 RING
602 RING SET SCREW
603 CUSTOM BOLT
604 SLIDER
652 SLIDER SCREW
606 KEY CIRCLE
606 KEY BAR
607 WING
653 SPRING PLUNGER
651 KEY NUT
Figure 4.1: Schematic of wing harness design
A schematic of the wing harness design is shown in Figure 4.1. A large aluminum ring wasdesigned to fit around the hull. To adjust the longitudinal position of the wing harness
Page 23
Virginia Center for Autonomous Systems Report No. 2015-01

A. Wolek, T. Gode, C. A. Woolsey, J. Quenzer and K. A. Morgansen
(within a 22 in. range), the ring is moved along a groove machined in the top and bottomof the hull and fastened using set screws. A series of radial holes were drilled in the ringto allow a sliding fixture to be fastened to the ring at various dihedral angles (between 0 -20 deg. in 4 deg. increments). The sliding fixture held a captive bolt that was allowed torevolve in a groove and change the wing incidence angle by ± 30 deg. Figure 4.2 illustratesthe range of possible wing geometries provided by the wing harness.
4.3 Vertical Tail Sizing and Placement
The vertical tail was sized with respect to the baseline wing, described in Table 4.1. Thewing was assumed fixed at the longitudinal position in the center of the available rangeprovided by the wing harness. Several approaches were used to size the tail. Various tailsizes were iteratively considered and compared to legacy gliders. The center of gravity wasestimated to be at the geometric center of each glider analyzed.
First, an empirical method (Raymer [21]) was used. This method uses the tail volumecoefficient:
Cvt =LvtSvt
b S, (4.1)
where Lvt is the distance between the aerodynamic center of the wing and the aerodynamiccenter of the vertical tail, Svt is the vertical tail area, b is the wingspan, and S is the wingarea.
Next, the coefficient Cnβ (the variation of yawing moment coefficient with sideslip angle)was estimated. An analytical approach (Roskam [22]) that included the effects of sweep,taper ratio and aspect ratio was used to estimate Cnβ . Also, a potential flow solver (AthenaVortex Lattice (AVL) [23]) was used to model the legacy glider and VTUG geometry andestimate Cnβ . The AVL models of the gliders are illustrated in Figure 4.3. (Note that theeffects of the fuselage were ignored in these models.) The results of these analyses are givenin Table 4.2.
Cvt Cnβ Cnβ
(from Raymer [21]) (from Roskam [22]) (from AVL [23] )(non-dim.) (1/rad) (1/rad)
Seaglider 0.19 0.824 0.831Spray 0.46 0.904 0.811Slocum 0.34 2.317 1.829VTUG 0.30 2.013 1.410
Table 4.2: Comparison of tail volume and Cnβ coefficients
Page 24
Virginia Center for Autonomous Systems Report No. 2015-01

A. Wolek, T. Gode, C. A. Woolsey, J. Quenzer and K. A. Morgansen
(a) Nominal wing incidence angle, 0◦ (b) Maximum wing incidence angle, 30◦
(c) Foremost wing position (d) Aftmost wing position
(e) Nominal dihedral angle, 0◦ (f) Maximum dihedral angle, 20◦
Figure 4.2: Range of asymmetric geometries provided by the wing harness
We find from Table 4.2 that legacy gliders have tail volume coefficients Cvt ≈ 0.2 − 0.45.This is much larger than that of sailplanes (Cvt ≈ 0.02) or even jet transports (Cvt ≈ 0.09)[21]. This difference may be attributed, in part, to the fact that gliders typically bank toturn and do not have rudders. In the absence of a rudder, the relatively large vertical tailhelps reduce the sideslip angle in a turn. Comparing the estimated Cnβ coefficient for legacy
Page 25
Virginia Center for Autonomous Systems Report No. 2015-01

A. Wolek, T. Gode, C. A. Woolsey, J. Quenzer and K. A. Morgansen
(a) Seaglider (b) Slocum
(c) Spray (d) VTUG
Figure 4.3: Illustration of wing and tail configuration used with the Athena Vortex Lattice(AVL [23]) software to estimate Cnβ .
gliders, we find a reasonable agreement in trend and magnitude between the analytical andnumerical estimates. The VTUG ’s vertical tail was iteratively sized to obtain a Cvt and Cnβ
within the range of legacy glider designs. The resulting tail has a chord length of 3 in, aspan of 25 in, and is placed about 26 in aft of the nominal wing position.
4.4 Wing Modifications
The Reynolds number for legacy gliders is approximately Re ≈ 3 × 10⁴. John McMasters(a renowned aerodynamicist who worked on the Liberdade class underwater gliders Stingrayand XRay [24]) found that operating at Reynolds numbers below 105 results in a dramaticdecrease in the maximum lift-to-drag ratio of smooth airfoils [25] (see Figure 4.4). Thebaseline VTUG wing operating at 1 m/s has Re ≈ 1 × 10⁵. However, it is clear fromFigure 4.4 that, for smooth airfoils, an even higher Reynolds number is desired.
To explore this idea, a larger wing (60 in. span, and 12 in. chord) was constructed (see
Page 26
Virginia Center for Autonomous Systems Report No. 2015-01

A. Wolek, T. Gode, C. A. Woolsey, J. Quenzer and K. A. Morgansen
Figure 4.4: Maximum airfoil lift-to-drag ratio with Reynolds number (McMasters, TechnicalSoaring, 1980) [25]
Figure 4.5: Modified glider wings
Figure 4.5). For this larger wing, Re ≈ 3 × 10⁵ (assuming a 1 m/s speed) and the wingloading is closer to that of legacy designs with W/S = 1.1 psf.
4.5 Gliding Performance
Consider the free body diagram of a glider in a steady glide, as shown in Figures 4.6.Summing the net weight W , lift L, drag D along the (xs, zs) axes, gives the equilibriumconditions:
ΣFxs : −D − W sin γ = 0 , (4.2)
ΣFzs : L− W cos γ = 0 , (4.3)
where γ is the flight path angle (measured positive clockwise from the horizontal). Thevelocity triangle (u, w, V ) shown in Figure 4.6 with (4.2) gives the depth rate w (positive
Page 27
Virginia Center for Autonomous Systems Report No. 2015-01

A. Wolek, T. Gode, C. A. Woolsey, J. Quenzer and K. A. Morgansen
Figure 4.6: Longitudinal forces in a steady gliding turn
down) and forward speed u:
w = −V sin γ , (4.4)
u = V cos γ . (4.5)
Assuming the parabolic drag law (valid for low speed flight) D = 12ρH2OV
2S(CD0 + KC2L)
and the definition of lift coefficient L = 12ρH2OV
2SCL then (4.2) and (4.3) give
tan γ =
(L
D
)−1
=
(CD0 +KC2
L
CL
). (4.6)
We may rearrange (4.6) into a quadratic function of CL. Solving this equation gives anexpression CL(γ,K,CD0). We find the (for a real-valued solution) the shallowest glide slopepossible is γmin = atan(2
√KCD0). The speed can then be expressed as
V =2|W | cos γ
ρH2OSCL(γ,K,CD0). (4.7)
Using (4.4) and (4.5) with (4.7) we may construct the so called “spider plot” of forwardspeed vs. depth rate by varying γ ∈ [γmin, π/2] for a number of |W |. A sample spider plotfor the Seaglider is shown in Figure 4.7. The hydrodynamic parameters assumed for theSeaglider are taken from [20], however we have assumed a hypothetical bladder that gives upto 2.5 L of buoyancy to demonstrate the expected performance gains from a larger bladder.We find that at glide slopes of about 45 deg. a buoyancy equivalent to a displacement of 2.5L gives a speed of about 1.75 m/s.
Page 28
Virginia Center for Autonomous Systems Report No. 2015-01

A. Wolek, T. Gode, C. A. Woolsey, J. Quenzer and K. A. Morgansen
0 0.5 1 1.5 20
0.5
1
1.5
2
2.5
3
3.5
Forward Speed (m/s)
Dep
th R
ate
(m/s
)
V = 2.5 L
V = 2.0 L
V = 0.5 L
V = 1.0 L
V = 1.5 L
= 1° = 0.5°
= 0.25°
= 30°= 0.1°
= 20°
= 2°
= 40°
= 60°= 80°
B
B
B
B
B
Figure 4.7: Spider plot: predicted performance of a hypothetical Seaglider equipped with ahigh displacement bladder. Lines of constant flight path angle (green) and angle of attack(red) are superimposed.
Page 29
Virginia Center for Autonomous Systems Report No. 2015-01

A. Wolek, T. Gode, C. A. Woolsey, J. Quenzer and K. A. Morgansen
Chapter 5
Structures
A driving factor in the structural design of the VTUG was to reduce machining complexity,cost, and to maximize the use of commercially available materials.
5.1 Hull Sizing
The hull was designed as a series of connected, constant thickness, tubes. The majority ofthe glider’s components were machined from aluminum. (Specifically, Al-6061-T6 alloy wasused and the material properties in Table 5.1 were assumed for sizing purposes). The use ofribs and stringers, or a tailored compressible hull, was not considered. The American Societyof Mechanical Engineers (ASME) standard for construction of pressure vessels [26] was usedto determine the required thickness of the hull. (Design guidelines are given in SubsectionA, Part UG-28: Thickness of Shells and Tubes Under External Pressure of Section VIII,Division 1: Rules for Construction of Pressure Vessels [26].) The hull was sized assumingit was one long tube approximately equal to the vehicle’s expected length L = 62 in. Thediameter was assumed to be D = 9 in. The ASME sizing method was iteratively used for anumber of thicknesses t. It was found that t = 1/4 in. met the working pressure requirement(160 psi) with a factor of safety of ≈ 3.5. This is a large factor of safety and the thicknessof the tube could be reduced to save weight. However, the ends of the tube must be thickenough to allow an O-ring bore to be machined, and to hold threads for a number of set
Parameter ValueModulus of Elasticity, E 10.3× 10⁶ psiPoisson’s Ratio, v 0.33Tensile Yield Strength, σY 38 ksiDensity, ρ 0.0975 lbs/in3
Table 5.1: Material properties of AL-6061-T6
Page 30
Virginia Center for Autonomous Systems Report No. 2015-01

A. Wolek, T. Gode, C. A. Woolsey, J. Quenzer and K. A. Morgansen
Hoop Stress, σhoop Axial Stress σaxial Collapse Pressure qcollapseValue 2.88 ksi 1.44 ksi 365 psi
Factor of Safety 13.2 26.3 2.3
Table 5.2: Analysis of hull stress and collapse pressure
screws. Machining such a bore is challenging for long thin tubes. After consulting withmachinists, it was determined that the 1/4 in. thickness was a reasonable size that could bemachined to tolerance for the tube lengths desired (note that a lathe “steady rest” tool wasrequired). This thickness was also a stock tube size that was readily available.
The ASME code result were also verified analytically. The hoop stress, axial stress, andcollapse pressure of a cylindrical thin-walled pressure vessel, with ends capped, under auniform external pressure are given in Roark’s formulas for stress and strain [27] (Chapter13, Table 13.1, Case 1c). The hoop stress for a given external pressure q, at points awayfrom the hull ends, is:
σhoop =qR
t(5.1)
and the axial stress is:
σaxial =qR
2t. (5.2)
The external collapsing pressure of a thin tube under uniform external pressure is:
qcollapse =t
R
(σy
1 + (4σy/E)(R/t)2
). (5.3)
Evaluating the conditions (5.1)-(5.3) for the design of the hull we obtained the factors ofsafety shown in Table 5.2. It is clear from Table 5.2 that the most concerning condition isthe external collapse pressure.
We also considered the buckling of the hull. The critical pressure for buckling of a thin tubewith closed ends held circular under uniform external pressure is given in Roark’s formulasfor stress and strain [27] (Chapter 15, Table 15.2, Case 20a):
qbuckle =0.8E t
R
1 + 12
(πRnL
)2⎛⎜⎝ 1
n2[1 +
(nLπR
)2]2 +n2t2
12R2(1− v2)
[1 +
(πR
nL
)2]2⎞⎟⎠ , (5.4)
where n is the number of lobes formed by the tube in buckling, and R is the inner radius[27]. For n = 2, 3, 4 we obtained the critical pressures and factors of safety given in Table 5.3.From Table 5.3 we find that the first buckling mode with n = 2 has the lowest safety factorof 3.5.
Page 31
Virginia Center for Autonomous Systems Report No. 2015-01

A. Wolek, T. Gode, C. A. Woolsey, J. Quenzer and K. A. Morgansen
Number of lobes, n qbuckle (psi) Factor of Safety2 558 3.53 1,201 7.54 2,125 13.3
Table 5.3: Analysis of hull buckling criteria
5.2 Marinization
Since the glider was designed to operate only for short durations in fresh water, a rigorousmarinization of all components was not required. Nonetheless, several methods were used tominimize the effects of corrosion. Regular polishing of the hull is one method of removingoxidation and preventing corrosion (see Figure 5.4(b)).
(a) The hull was machined from a seriesof stock aluminum tubes
(b) Polishing the hull removes oxidationand prevents corrosion
Figure 5.1: Hull fabrication and maintenance
Anodizing and painting is a more permanent corrosion prevention method. Alternately, achromate conversion coating can be applied to small parts without the need for specializedtools. This process consists of cleaning the aluminum parts using Alumiprep 33 and brushingor immersing them in Alodine 1201. The result is a coating with a bronze appearance (seeFigure 5.2). While we found this method produced good results for small parts by immersion,applying Alodine 1201 evenly to the entire hull with a brush was difficult and not pursued.
Lastly, a sacrificial anode was also employed by the VTUG for corrosion resistance. Thisconsisted of a small piece of zinc, designed for use with boats, threaded into the aft endcap.
5.3 Endcap Sizing
The most common pressure vessel caps are either hemispherical, ellipsoidal or otherwisecurved sections. However, to simplify manufacturing it is desirable to construct the endcap
Page 32
Virginia Center for Autonomous Systems Report No. 2015-01

A. Wolek, T. Gode, C. A. Woolsey, J. Quenzer and K. A. Morgansen
Figure 5.2: Dropweight before chromate conversion (right) and after (left)
from a flat plate. The endcap was sized using the ASME standard for construction of pressurevessels [26]. (Design guidelines are given in Subsection A, Part UG-34: Unstayed Flat Headsand Covers of Section VIII, Division 1: Rules for Construction of Pressure Vessels [26].) Aflange type design was chosen (see Figure 5.3).
Figure 5.3: Sketch of endcap to hull connection [26]
This endcap design is classified as “unstayed” since it is only supported on its circumference.According to ASME standards the required thickness tendcap of the aft head is given by
tendcap = d
√Cq
σyE, (5.5)
where d is the inner diameter, C is a factor depending on the method of attachment (C = 0.33using the method in Figure 5.3) and E is the joint efficiency for the weld. In the VTUGdesign the endcap is attached using a series of set screws that are sized with a very highsafety margin, therefore it is assumed to be equivalent to a perfect weld, E = 1. From (5.5)the required thickness is tendcap = 0.32 in.
To verify this result analytically, we considered the stress and deflection of a flat circularplate of constant thickness with fixed edges, subject to a uniform pressure load, as given inRoark’s formulas for stress and strain [27] (Chapter 11, Table 11.2, Case 10b). Performingthe analysis one finds the above determined thickness satisfactory. The final endcaps wereoversized to a 0.5 in. thickness to accommodate a number of threaded fittings that wereinstalled in each endcap face.
Page 33
Virginia Center for Autonomous Systems Report No. 2015-01

A. Wolek, T. Gode, C. A. Woolsey, J. Quenzer and K. A. Morgansen
5.4 O-ring Seals
An easily machinable and reliable design for sealing the endcaps was desired. Each endcapwas machined with a pair of O-ring grooves (for redundancy) and one set screw groove tosecure the endcap (see Figure 5.5). The hull was bored to Parker O-ring handbook speci-fications [28], whereas the dimensions of the endcap plug and O-ring grooves were slightlymodified to ease installation (within acceptable O-ring stretch and squeeze tolerances). Wefound that endcap removal and cleaning was easiest with a silicone compound (such asChemplex 710) rather than a petroleum-based grease (such a Parker O-Lube).
(a) Bore of the hull being lubricated (b) Endcap and O-Rings being lubri-cated
Figure 5.4: Installation of endcap
5.5 Pressure Relief Valve and Vent Plug
Heating of electrical components within the hull can cause the air inside the pressure vesselto expand. In addition, the buoyancy control system houses some high pressure componentsthat can potentially pressurize the pressure vessel to a dangerous level. As a safety precautionan anodized aluminum shallow depth pressure relief valve (Model: Prevco LP-PRV) waspermanently installed in both the main hull and in the buoyancy control module. This valveopens at a differential pressure of 5 psid to exhaust air from inside the pressure vessel.
Further, a vent plug (Model: Prevco No. 4 Vent Plug) was used to exhaust any excesspressure (below 5 psid) remaining in the hull after a deployment. This vent plug also helpsin installing and removing the endcaps. By removing the vent plug the hole in the endcapallows air to move into and out of the hull preventing pressure from building up as the endcapis installed.
To prevent water condensation on electronics that heat up during a deployment, humid aircontained in the hull may be removed by pulling a vacuum and “backfilling” it with drynitrogen gas. While the vent plug port allows this option, this procedure was not necessaryfor the typically short deployments of the VTUG.
Page 34
Virginia Center for Autonomous Systems Report No. 2015-01

A. Wolek, T. Gode, C. A. Woolsey, J. Quenzer and K. A. Morgansen
SECTIONA-A
SCALE1/3
DETAIL
BSCALE
1:1
AA
B
11
22
AA
BB
VIRGINIATECH
NONLINEAR
SYSTEMSLABO
RATORY
BLACKSBURG,VA
NOTES:
1)MATER
IAL:ALUMINUM6061
2)MADEFROM9.00
ODROUND
9.000
4X1/4-20
UNC
0.2590APART
FULLROUND
0.9400.04
1/2-20UNF-2B
THRU
0.9400.04
1/2-20UNF-2B
THRU
EEDUALSEAL
VENTPORT(#4)-
INTERFACE
DRAWING
(PREVCO#00669-000)
SEEPRV
PORT,
LOWPRESSU
RE-
INSTALLATIO
NINTERFACE
DRAW
ING
(PREVCO#01274-001)
1/4-20UNC
0.25
1/4-18NPT
THRU
ASSEMBLY
300-EMB
PAGE
1/1
DRAWNBY
A.WOLEK
*ALLDIMENSIONSININCHES,TO
LERANCE
0.005UNLESS
OTHERW
ISESTATED
SCALE
1/3
PART
301-ENDCAP
DATE07/26/12
PROJECT
UNDERWATER
GLIDER1
REV.05
2X1/4-20
UNC
0.25
1.400
8.172
0.135
0.426
0.717
0.1670.090
2XPARKER
#173
O-RINGGROOVE
:8.510
+0.001
WIDTH:0.142
0.002
5.000
25.0
45.0
25.0
6.700
0.850
4.500
15.0
0.500
PARKER#173
O-RIN
GPLUG
:8.672
+0.001
0.08X15
2.250
1.150
0.500
3.100
1/4-18NPT
THRU
Figure 5.5: Sample endcap design
Page 35
Virginia Center for Autonomous Systems Report No. 2015-01

A. Wolek, T. Gode, C. A. Woolsey, J. Quenzer and K. A. Morgansen
Chapter 6
Recovery Aids
A number of recovery aids are used to help locate the glider in adverse weather conditions, aidin bringing the vehicle aboard, and to prevent the loss of the vehicle in emergency situations.The glider’s tail houses a series of light emitting diodes (LEDs), an LED driver, the GPS,radio modem and antenna, as well as a solenoid mechanism to actuate the dropweights. Thetail module is physically isolated from the remaining vehicle so that damage to the tail boomwould not flood the main hull. Electrical signals are passed between the tail and the glider’smain hull using a short wet-mateable cable (as shown in Figure 6.1).
Figure 6.1: Tail module connected to aft end of the hull
6.1 Flashers
A series of four LEDs (model: Luxeon Rebel 6500K Cool White) were embedded in a clearpolyvinyl chloride (PVC) housing in the tip of the tailboom. These LEDs were used toimprove visibility of the glider during retrieval. They could also be used to indicate somebasic status information during deployment (e.g. using a particular flash pattern duringpower on, prior to beginning a dive, or to indicate an emergency). The LEDs were intended
Page 36
Virginia Center for Autonomous Systems Report No. 2015-01

A. Wolek, T. Gode, C. A. Woolsey, J. Quenzer and K. A. Morgansen
to flash for short durations. (Continuously powering them for long periods of time mayoverheat components in the assembly.)
Figure 6.2: Tailboom containing GPS and LED flashers
6.2 Drop-weights
A drop-weight mechanism was designed to release weights and force an ascent in the event ofa buoyancy system failure. The primary requirement was for the weights to be heavy enoughto cause the vehicle to ascend if all of the buoyancy from the bladder was lost. Assumingthe vehicle trims to neutral buoyancy with BBE,0 (and a full tank) the drop-weights musthave a net weight WDW > BBE,0 to be effective.
Several designs for the the drop-weight release system were considered, including a galvanicrelease, shearing a thin attachment wire with a solenoid, or using a pyrotechnic fastener.Ultimately, a mechanism consisting of two interlocking cylindrical masses released by a re-tracting a pin was designed (as shown in Figure 6.3(a)). The drop-weights interlock suchthat two concentric holes align, allowing a retractable pin to protrude from the tail pressurevessel and hold the weights fixed. Upon retracting the pin, the drop-weights are free torotate and fall under their own weight.
A schematic of the drop-weight design is shown in Figure 6.4(a). The resistance forces ofthe dynamic O-ring Fseal can be estimated using the Parker O-Ring Handbook [28]. The pinis spring loaded, providing a Hookian force Fspring = kx where k is the spring coefficient andx is the spring deflection. The net weight of the drop-weights acting on the pin results ina frictional force Ff = μWDW where μ is the friction coefficient between the steel pin andaluminum drop-weights in water. The ambient pressure force Famb = ρH2OgzA, where A isthe pin face area, acts to depress the pin at depth. If the available solenoid force Fsolenoid
satisfiesFsolenoid > Fspring + Fseal + Ff , (6.1)
then the drop-weight can be actuated at any depth. (With increasing depth Famb > 0 andthis reduces the required Fsolenoid). Note that available solenoid force typically increases as
Page 37
Virginia Center for Autonomous Systems Report No. 2015-01

A. Wolek, T. Gode, C. A. Woolsey, J. Quenzer and K. A. Morgansen
(a) Interlocking dropweights and re-tracting pin
(b) Dropweights with fairings
Figure 6.3: Dropweights
the pin is retracted closer to the electromagnetic coil. Thus the conditions (6.1) shouldconsider the available solenoid force in its nominal extended position.
A second requirement is for the spring to be sufficiently stiff, such that the spring deflectionx is significantly less than the thickness of the drop-weight-plate xDW. (This is required sothat the pin is not inadvertently retracted at depth causing the dropweights to fall). Thuswe have the conservative condition (neglecting friction forces), that at maximum depth
x =Famb
k xDW .
Based on these design criteria a solenoid (model: Ledex 5EC) and spring were selected.The drop weight assembly also included the vertical stabilizers and fairings as shown inFigure 6.3(b).
6.3 Emergency Locater
A standalone acoustic pinger (model: Vemco V9-1) can be attached to the glider’s hull duringuntethered deployment. This small device, originally designed for tagging fish, provides acontinuous ping for 20 days. In the event that the glider does not surface a diver with aspecialized receiver may attempt to locate the source of the ping and recover the vehicle.
6.4 Boat-side recovery
To aid in recovering and deploying the glider, a retractable glider “chute” was designed asshown in Figure 6.5(a). To assist in handling the glider while it is near the boat (e.g. toprevent collisions and to steer the glider towards the chute) a “snare” consisting of a hollowpipe threaded with a rope and a carabiner was used to hook the glider.
Page 38
Virginia Center for Autonomous Systems Report No. 2015-01

A. Wolek, T. Gode, C. A. Woolsey, J. Quenzer and K. A. Morgansen
(a) Forces acting in dropweight design
(b) Dropweights with fairings
Figure 6.4: Dropweights
Page 39
Virginia Center for Autonomous Systems Report No. 2015-01

A. Wolek, T. Gode, C. A. Woolsey, J. Quenzer and K. A. Morgansen
(a) Glider chute (b) Glider snare
Figure 6.5: Aids for deploying and recovering the glider
Page 40
Virginia Center for Autonomous Systems Report No. 2015-01
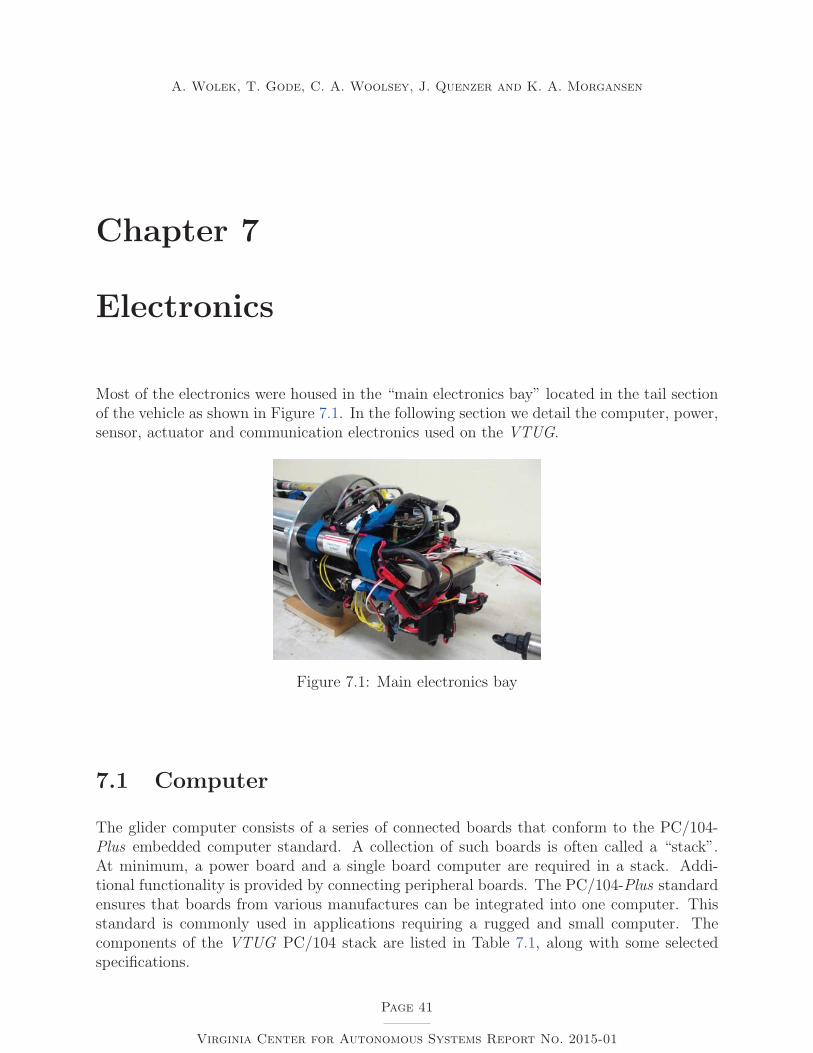
A. Wolek, T. Gode, C. A. Woolsey, J. Quenzer and K. A. Morgansen
Chapter 7
Electronics
Most of the electronics were housed in the “main electronics bay” located in the tail sectionof the vehicle as shown in Figure 7.1. In the following section we detail the computer, power,sensor, actuator and communication electronics used on the VTUG.
Figure 7.1: Main electronics bay
7.1 Computer
The glider computer consists of a series of connected boards that conform to the PC/104-Plus embedded computer standard. A collection of such boards is often called a “stack”.At minimum, a power board and a single board computer are required in a stack. Addi-tional functionality is provided by connecting peripheral boards. The PC/104-Plus standardensures that boards from various manufactures can be integrated into one computer. Thisstandard is commonly used in applications requiring a rugged and small computer. Thecomponents of the VTUG PC/104 stack are listed in Table 7.1, along with some selectedspecifications.
Page 41
Virginia Center for Autonomous Systems Report No. 2015-01

A. Wolek, T. Gode, C. A. Woolsey, J. Quenzer and K. A. Morgansen
Description PC/104-Plus Stack PropertiesPower Supply Jupiter (JMM-SIO-XT) 50 Watts Power
7-30 V Input5 V Output (10A)12 V Output (2A)
Main Computer Pegasus (PGS800-256) 500 MHz, AMD LX800 Processor256 MB RAM4 USB 2.0 Ports2 RS-232 Serial Ports
Input/Output Diamond (DMM-16-AT) 6-channel, 16-bit A/D4-channel, 12-bit D/A8 digital inputs8 digital outputs
Table 7.1: Glider PC/104 computer components.
7.2 Power
The VTUG is powered by 3-cell lithium polymer (LiPo) batteries. The nominal voltageof each battery is about 11.1 V (and over 12 V at full charge). On the VTUG, two suchbatteries are connected in series to provide approximately 24 V. Advantages of LiPo batteriesare that they have a high energy density, high discharge rates, and relatively flat dischargecurves. (A flat discharge curve of voltage (V) vs. capacity (mAh) implies that relatively smallvoltage drops are expected for most of its operation. However, this is typically followed by asudden and rapid voltage drop as the battery nears depletion.) Knowledge of proper handingtechniques is necessary to prevent common safety hazards associated with LiPo batteries.They must be charged with a specialized charger that balances the voltage in each cell, thusa total of 12 conductors are needed to charge two batteries. (The VTUG was not designedwith this many waterproof conductors dedicated for battery charging, thus one limitation ofusing these batteries is that the endcap had to be removed after each deployment to rechargethe vehicle, as shown in Figure 7.2.)
It is desirable to be able to switch between external power and battery power to reservebattery charge prior to deployment. To achieve this a latching relay was used to placeboth external and battery power sources in parallel prior to cutting off external power, asshown in Figure 7.3. (Note: This method requires the main power switch to be the onlypath to ground. If an alternate path to ground exists when the switch is flipped, then anycomponents along this path (e.g. VGA, ethernet connectors) may be damaged by excessivecurrent.) A disadvantage of this approach is the need to return to external power to unlatchthe relay and remove power from the glider. Other vehicles sometimes use a magnetic switchinstead to cut the main power. (In such designs the the switch is activated by manuallyremoving a magnet on the exterior of the vehicle.)
Page 42
Virginia Center for Autonomous Systems Report No. 2015-01

A. Wolek, T. Gode, C. A. Woolsey, J. Quenzer and K. A. Morgansen
Figure 7.2: Endcap removed to recharge batteries
DC POWER SUPPLY
BATTERYLATCHING
RELAY
GLIDER
RELAY ON/OFFSTATE
SWITCH
MAIN PWRSWITCH
Figure 7.3: Schematic for switching between external and battery power
The external power provided to the glider was typically either a DC power supply (in thelab), or a 12 V boat battery (in the field). The boat battery voltage supply was increasedto 24 V using a DC-DC converter (model: Vicor Corporation V28B24C150BL). A diodewas used to protect against inadvertent reverse polarity while connecting power. To powerthe glider, a wet-mateable cable was plugged into the tail of the vehicle and into part of theground station node shown in Figure 7.4. The power draw by the glider was monitored usinga Watt meter (model: AstroFlight Inc. 101Q). Typical idle power consumption was about48 Watts (approx. 2 A at 24 V).
To scale the voltage of the battery such that it can be read by the I/O board a simple voltagedivider and op-amp follower circuit was used, see Figure 7.5(a). The A/D converter was setfor an input range of 0 - 5 V, and the battery voltage range (min. 15V, max 25V) was scaledto approximately 2.5 - 4.5V so that it can be measured. A calibration curve was developedthat maps the op-amp output to true battery voltage, see Figure 7.5(b).
Page 43
Virginia Center for Autonomous Systems Report No. 2015-01

A. Wolek, T. Gode, C. A. Woolsey, J. Quenzer and K. A. Morgansen
Figure 7.4: Glider power and connector interface
(a) Voltage divider and follower op-amp circuit (b) Output from op-amp
Figure 7.5: Battery voltage divider used to scale 15 - 24 V to approx. 2.5 - 4.5 V for inputto I/O board
7.3 Sensors
7.3.1 Leak Sensor
A custom sensor was constructed to detect leaks. The sensor consists of two parallel wiresbound by heat shrink tubing with bare conductors exposed in regular intervals as shown inFigure 7.6(a). This sensor can be shaped to conform to the hull interior and glued into place(Figure 7.6(b)). On the VTUG, three such sensors were used (two in the main hull, one inthe buoyancy control module).
When the exposed conductors come in contact with water, current flows between the parallelwires (with a large resistance). A voltage divider circuit was designed (Figure 7.7) to takeadvantage of this effect. When the leak sensor encounters water, the circuit is closed and avoltage drop is detected. The circuit was tested by applying a water droplet and observingthe response.
Page 44
Virginia Center for Autonomous Systems Report No. 2015-01
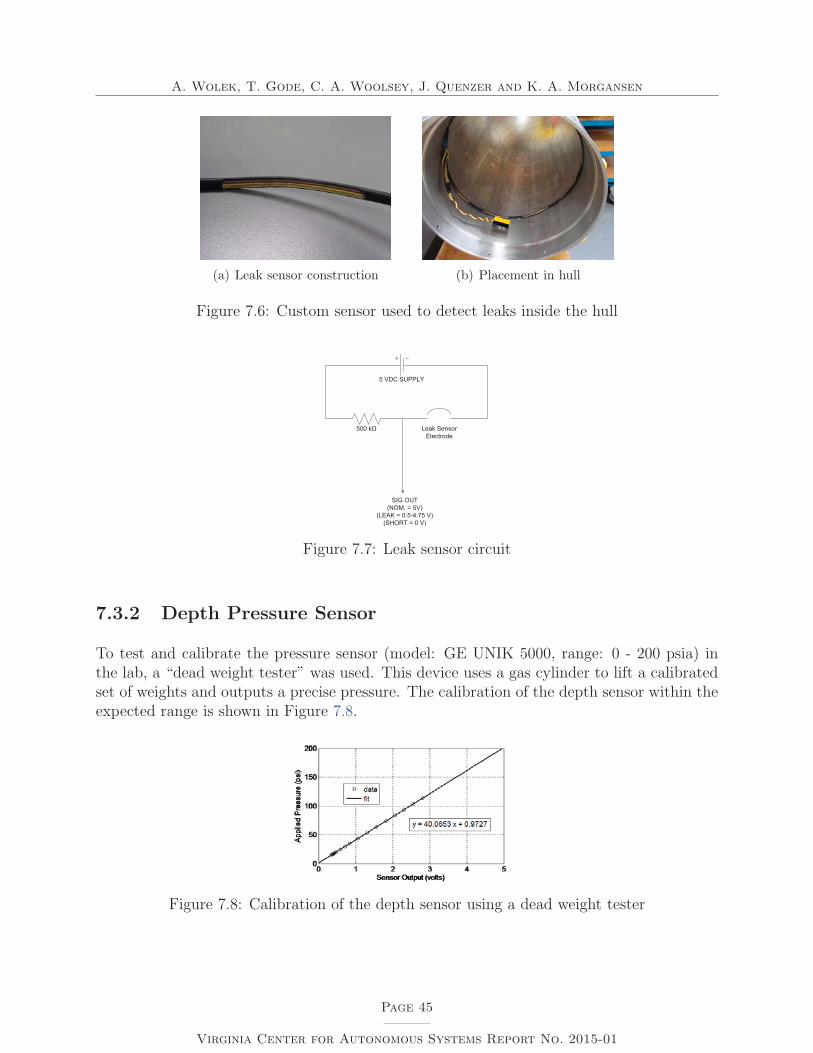
A. Wolek, T. Gode, C. A. Woolsey, J. Quenzer and K. A. Morgansen
(a) Leak sensor construction (b) Placement in hull
Figure 7.6: Custom sensor used to detect leaks inside the hull
Figure 7.7: Leak sensor circuit
7.3.2 Depth Pressure Sensor
To test and calibrate the pressure sensor (model: GE UNIK 5000, range: 0 - 200 psia) inthe lab, a “dead weight tester” was used. This device uses a gas cylinder to lift a calibratedset of weights and outputs a precise pressure. The calibration of the depth sensor within theexpected range is shown in Figure 7.8.
Figure 7.8: Calibration of the depth sensor using a dead weight tester
Page 45
Virginia Center for Autonomous Systems Report No. 2015-01

A. Wolek, T. Gode, C. A. Woolsey, J. Quenzer and K. A. Morgansen
7.3.3 Bladder Pressure Sensor
A differential bladder pressure sensor (model: GE UNIK 5000, range: 0 - 5 psid) was used tomeasure the pressure difference between one port exposed to the ambient water and the otherport exposed to the air pressure inside the bladder. Benchtop tests showed an unexpectedchange in the pressure sensor reading with orientation of the transducer (when both portswere exposed to ambient pressure). This effect was most likely caused by the weight of thefluid within the differential pressure sensor itself. To characterize this error, an experimentedwas conducted in which the transducer was moved through a 180 deg. range while recordingthe measured pressure as shown in Figure 7.9.
(a) Test setup for ro-tating pressure sensorthrough 180 degrees
(b) Pressure sensor output
Figure 7.9: An experiment was designed to measure the change in reported bladder pressureresulting from the orientation of the transducer
7.3.4 Travel Limit Sensors
Upon powering the motor controllers, a homing routine is initiated that seeks to find areference point by turning the motors in a predefined direction until a limit switch signalis activated. Initially, hall effect sensors were used for this purpose however these require amagnet to be installed on the moving mass. This magnet interfered with the magnetometerand was replaced by a contact switch instead (as shown in Figure 7.10).
Page 46
Virginia Center for Autonomous Systems Report No. 2015-01

A. Wolek, T. Gode, C. A. Woolsey, J. Quenzer and K. A. Morgansen
Figure 7.10: Contact switch to detect translational travel limit of the moving mass
7.3.5 Inertial Measurement Unit
It is desirable to mount the inertial measurement unit (IMU) parallel to the body axis andnear the CG to minimize the error in the computed Euler angles. If the IMU is mounted inan orientation different than that of the body axis, then the IMU reports local Euler anglesand a computation involving rotation matrices is required to compute the true body axisEuler angles. This is particularly problematic if the rotation matrix involves the headingangle. (The heading angle is measured by a magnetometer and is often a noisy measurementthat is susceptible to interference.) The IMU on the VTUG was iteratively mounted inseveral locations to minimize magnetic interference. While the mounting location away fromthe motors, shown in Figure 7.11, was best, the interference was still a significant source oferror.
Figure 7.11: Mounting location of the IMU
After mounting the IMU inside the glider, the vehicle orientation was adjusted using a bubblelevel such that the glider was horizontal with wings level. The pitch and roll bias of the IMUwas then recorded by collecting IMU data for several minutes as shown in Figure 7.12.
To characterize the interference resulting from moving the mass on the magnetometer, theglider was left stationary while the moving mass moved to various linear and rotational
Page 47
Virginia Center for Autonomous Systems Report No. 2015-01

A. Wolek, T. Gode, C. A. Woolsey, J. Quenzer and K. A. Morgansen
(a) Vehicle oriented level during test (b) Output from IMU
Figure 7.12: Determining the bias in the inertial measurement unit mounting location
positions (see Figure 7.13). We found that rotational movement of the mass had the greatesteffect on the heading error and resulted in deviations up to ≈ 13 deg.
Figure 7.13: Characterizing the interference of the moving mass on the magnetometer reading
Page 48
Virginia Center for Autonomous Systems Report No. 2015-01

A. Wolek, T. Gode, C. A. Woolsey, J. Quenzer and K. A. Morgansen
7.4 Actuators
7.4.1 Flow Controllers
Each solenoid (the inflator and deflator) is driven by a separate valve controller as shownin Figure 7.14. These drivers take an analog signal and amplify it appropriately to open orclose the solenoid by the desired amount. The driver circuit boards have potentiometers thatallow adjusting several operating parameters (e.g. dead band, dither, max current draw).The inflator solenoid was driven by the Enfield Technologies, D1 PWM Valve Driver. Thedeflator solenoid was driven by the iQValves Standard PFCV Signal Amplifier.
Deflator Valve Driver
Inflator Valve Driver
Figure 7.14: Proportional solenoid valve drivers in the buoyancy engine
7.4.2 Motor Controllers
Each Maxon motor (for mass rotation and mass translation) requires its own dedicatedcontroller. These controllers are housed in the main electronics bay next to the batteries(see Figure 7.15). The EPOS2 motor controller takes the encoder input, travel limit signals,and supplies power to the motor coils. The controller is capable of operating in a numberof modes including position, velocity, or acceleration modes. The controller communicateswith the PC/104 through a universal serial bus (USB).
7.4.3 Drop-weight Trigger
A digital output was used to control the drop-weight because the analog ports of the PC/104were all occupied. The drop-weight is suitable for being triggered by a digital signal becauseit only has two states. A circuit was designed to supply power to the drop-weight solenoidwhenever a logical high signal was detected (see Figure 7.16). For this purpose a metal-oxide-semiconductor field-effect transistor (MOSFET) was used. A pull down resistor is used tokeep the gate input at GND, in case a wire comes loose or if nothing is being commanded onthe digital port. When the input reaches a 3-5 V, then full power (24 V) is supplied to the
Page 49
Virginia Center for Autonomous Systems Report No. 2015-01

A. Wolek, T. Gode, C. A. Woolsey, J. Quenzer and K. A. Morgansen
EPOS2 Motor Controllers
11.1 V LiPo Batteries
Figure 7.15: Motor controllers during assembly of the electronics main bay
solenoid. A fly-back diode is used to prevent reverse voltage from damaging the MOSFETwhen the solenoid is turning off.
24 VDC BATTERY
FAIRCHILDFQP30N06L
60 V LOGIC N-CHANNELMOSFET
DRAIN
SOURCE
GATE
6 kPULL DOWN RESISTOR
0 / 5VDIGITALLOGIC IN
FLY-BACK DIODEREVERSE BREAKDOWN > 24VFORWARD CURRENT > 10 A
LEDEX 5 ECSOLENOID
(a) Circuit schematic (b) Fabricated circuit board
Figure 7.16: Drop-weight digital trigger
7.4.4 Air Supply Solenoid Relay
As discussed in Section 2.3.2, the inflator valve has some associated leakage rate even whenit is “closed”. If the scuba tank valve is left opened while the bladder pressure is not beingregulated, then this will cause the bladder to slowly fill up and rupture. To prevent this,a flow control valve was placed in series with the inflator to shut off the air supply whenthe inflator was not in use. This solenoid was triggered by sending an analog voltage to a
Page 50
Virginia Center for Autonomous Systems Report No. 2015-01

A. Wolek, T. Gode, C. A. Woolsey, J. Quenzer and K. A. Morgansen
op-amp and relay circuit (see Figure 7.17) that then provided full power (24 V) to the flowcontrol solenoid.
LM324N
OUT1 IN1+IN1-
GND
V+
OUT4 IN4+IN4-
IN2+ OUT2IN2-
IN3+ OUT3IN3-
SIG
GND(white)
24 VDC
TSC-105D3H
NO OUTCOIL-
NC OUTCOIL+ 24 VDC
Solenoid
Figure 7.17: Relay circuit to power air supply valve
7.5 Communication
There are four modes of communication with the glider: directly connecting to the PC/104,establish a secure shell over ethernet, creating a serial socket over radio, or using acousticchannels. For details regarding the acoustic communication, see Section 8. During benchtoptests it is possible to connect a VGA monitor and keyboard directly to the PC/104. Whenthe glider is sealed, a 16-pin wet mateable cable plugged into the tail provides an ethernetconnection. This high-bandwidth mode of communication is used to update the glider’ssoftware and download log files after field trials. When the glider is deployed the radio(model: Freewave FGR2 Series, 900 MHz) is the primary method of communication.
7.6 Pinouts and Connectors
Deans connectors were used for high-amp connections (e.g. to connect the batteries). Formost other connections either Powerpole or D-sub connectors were used depending on thenumber of connectors required and the space available. Molex connectors were used toconnect to the WHOI micro-modem and EPOS motor controllers. For external connections,Teledyne wet-mateable cables were used to connect the transducer. Subconn micro wet-mateable connectors were used to join the buoyancy engine to the main hull, the tail to themain hull, and the ground station to the main hull.
A detailed pinout diagram and schematic is maintained for the interfaces between majorelectrical assemblies. Figure 7.18 shows the schematic of connections made on a breadboardthat distributed power from the batteries to other systems of the vehicle, as well as routedsignal from the D-sub endcap connector (shown in Figure 7.19). An early revision of the fullschematic of electrical connections on the VTUG is shown in Figure 7.20.
Page 51
Virginia Center for Autonomous Systems Report No. 2015-01

A. Wolek, T. Gode, C. A. Woolsey, J. Quenzer and K. A. Morgansen
EMB DSUB
Figure 7.18: Power distribution board and aft endcap connector
Figure 7.19: Aft endcap connector
Page 52
Virginia Center for Autonomous Systems Report No. 2015-01
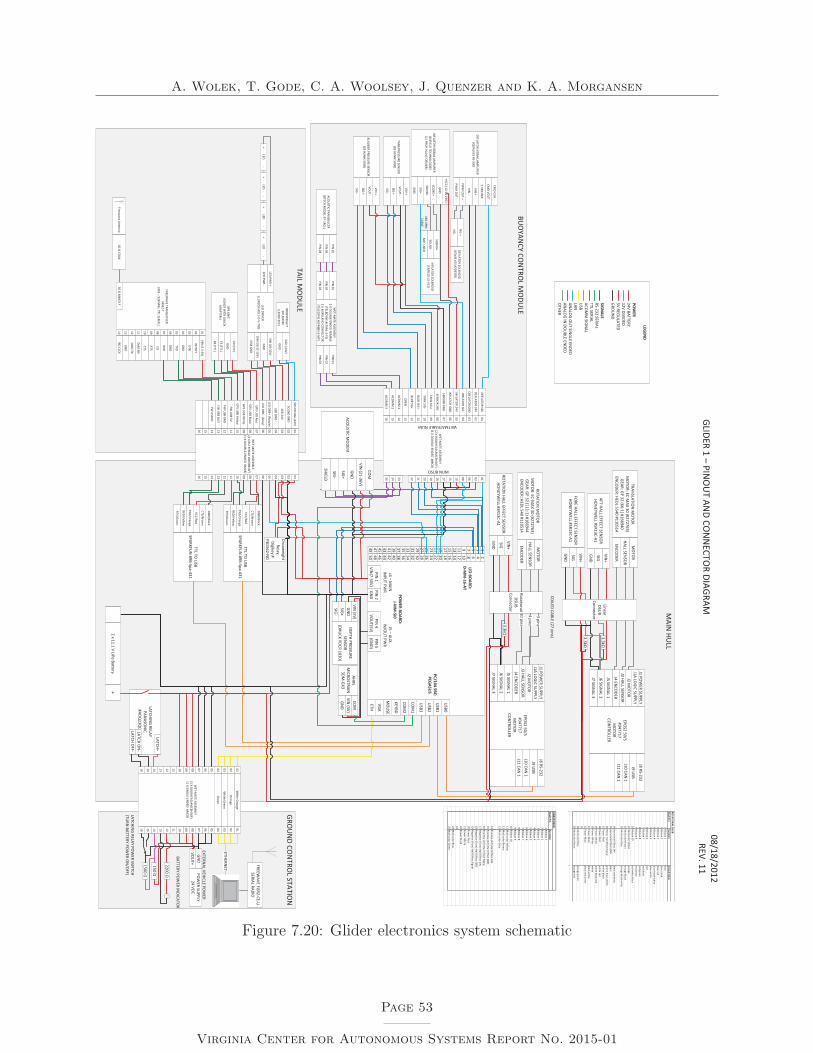
A. Wolek, T. Gode, C. A. Woolsey, J. Quenzer and K. A. Morgansen
MAIN
HULL
4 pins
GROU
ND CO
NTRO
L STATION
BUO
YANCY CO
NTRO
L MO
DULE
TAIL MO
DULE
GLIDER 1 –PIN
OU
T AND CO
NN
ECTOR DIAGRAM
08/18/2012REV. 11
LEGEND
POW
ER24V BATTERY12V DIVIDED5V REGU
LATEDGRO
UN
D
SIGNALS
RS-232 SERIALTTL SERIALACO
MM
SIGNAL
USB
LANAN
ALOG O
UT SIN
GLE ENDED
ANALO
G IN DO
UBLE EN
DEDO
THER
ACOU
STIC TRANSDU
CER(BTECH M
ODEL BT-1RCL)
PIN 01
PIN 02
PIN 03
WET-M
ATE ASSEMBLY
1 X DOU
BLE ENDED FEM
ALE(TELEDYN
E #LPMIL-3-FS)
1 X M.BU
LKHD CON
NECTO
R(TELEDYN
E #LPMBH-3-M
P)
PIN 01
PIN 02
PIN 03
PIN 01
PIN 02
PIN 03
BLADDER PRESSURE SEN
SOR
(GE #UN
IK 5000)
VIN +
VOU
T -
SIG +
SIG -
TANK PRESSU
RE SENSO
R(GE #U
NIK 5000)
VIN +
VOU
T -
SIG +
SIG -
INFLATO
R SIGNAL AM
PLIFIER(EN
FIELD TECHNO
LOGIES
D1 PROP.VALVE DRIVER)
+VCC (12-24 VDC)
GND
SOLN
D+
SOLN
D-
SIG+
DEFLATOR SO
LENO
ID(IQ
VALVES #203305)SIG +
SIG -
DEFLATOR SIGN
AL AMPLIFIER
(IQVALVES #5-500)
CMD CU
R
CMD VO
LT
5 VDC REF
VIN +
VIN -
PWM
OU
T +
PWM
OU
T -
GND
M8-3PIN
CABLE
INFLATO
R SOLEN
OID
(ENFIELD LS-V15)
SOLN
D+
SOLN
D-
NO
T USED
EPOS2 50/5
#347717M
OTO
R CO
NTRO
LLER
J1 POW
ER SUPPLY
J1A LOGIC SU
PPLYJ2 M
OTO
RJ3 HALL SEN
SOR
J4 ENCO
DER
J5 SIGNAL 1
J6 SIGNAL 2
J7 SIGNAL 3
J8 RS-232
J9 USB
J10 CAN 1
J11 CAN 1
EPOS2 50/5
#347717M
OTO
R CO
NTRO
LLER
J1 POW
ER SUPPLY
J1A LOGIC SU
PPLYJ2 M
OTO
RJ3 HALL SEN
SOR
J4 ENCO
DER
J5 SIGNAL 1
J6 SIGNAL 2
J7 SIGNAL 3
J8 RS-232
J9 USB
J10 CAN 1
J11 CAN 1
WET-M
ATE ASSEMBLY
(2 X BULKHEAD #M
CBH16F)(1 X DO
UBLE-EN
DED #MCB)
DEFLATOR 24V
DEFLATOR GN
D
INFLATO
R SIG
INFLATO
R 24V
INFLATO
R GND
SENSO
R GND
OPEN
ACOM
M 1
ACOM
M 2
SENSO
R 24V
TANK SIG+
TANK SIG-
BLDR SIG+
BLDR SIG-
0102030405060708091011121314
ACOM
M 3
15
DEFLATOR SIG
16
010306081015171819202122232425
ROTATIO
N M
OTO
RM
OTO
R: EC-MAX 30 (#272763)
GEAR: GP 32 (111:1) #166944EN
CODER: HEDL 540 #110514
MO
TOR
HALL SENSO
R
ENCO
DER
TRANSLATIO
N M
OTO
RM
OTO
R: EC-MAX 30 (#272763)
GEAR: GP 32 (66:1) #166940EN
CODER: HEDL 5540 #110514
MO
TOR
HALL SENSO
R
ENCO
DER
10 pins
3 pins
ETHERNET
LATCHING RELAY PO
WER SW
ITCH (TU
RN BATTERY PO
WER O
N/O
FF)
2 x 11.1 V LiPo Battery+
-
LATCHING RELAY
PANASO
NIC
#ADQ23Q
012
LATCH+
LATCH OFF-
WET-M
ATE ASSEMBLY
(1 X BULKHEAD #M
CBH16F)(1 X SIN
GLE-ENDED #M
CB)
01020304050607080910111213141516
01020304050607080910111213141516
DEPTH PRESSURE
SENSO
R(DRU
CK PDCR 1830)
VIN (5V)
GND
SIG+SIG-
COILED CABLE (27 pins)
+ LED
-+
LED -
+ LED
-+
LED -
FREEWAVE TRAN
SECIVERM
M2-T
(902 –928 M
Hz, TTL SERIAL)
50 M
MCX F
0102030405060708091011121314
VIN (3.3-5V)
INTRPT
DTR
GND
TXD
GND
RXD
CD
RTS
CTS
DIAG RX
DIAG TX
GND
BD CLCK
DROPW
EIGHT SO
LENO
ID(LEDEX 5EC)
SIG+ (24V)
GND
GPS UN
IT(GS407 W
ITH UBLO
X ADAPTERr)
VIN (5V)
GND
TX (TTL)
RX (TTL)
LED DRIVER(LU
XEON
A011-D-V-700)
VIN (10-32V)
GND
DIM SIG (0-10V)
DIM GN
D
LED PWR +
LED PWR -
FREEWAVE FGR2-CE-U
SERIAL RADIO
Freewave Antenna
50 CO
AX
POW
ER SUPPLY
24 VDCGN
DVO
UT+
EXTERNAL VEHICLE PO
WER
1718
1920
2122
2324
2526
2728
2930
3132
12
34
56
78
910
1112
1314
1516
3334
3536
3738
3940
4142
4344
4546
4748
4950
I/O BO
ARD: D-M
M-16-AT
PIN 1
VIN(7-30V)
POW
ER BOARD:
J-MM
-SI0J4 –
MAIN
IN
PUT PW
R
PIN 4
VOU
T(5V)PIN
5 (GN
D)
J5 –AU
X. IN
/OU
T PWR
PC/104 SBC:PEGASU
S
USB0
USB1
USB2
USB3
COM
1
COM
2
KEYBD
MO
USE
VGA
ETHPIN
2GN
D
ROTATIO
N HALL EFFECT SEN
SOR
HON
EYWELL #SR13C-A1
VIN+
SIG
GND
BATTERY POW
ER INDICATO
R
FORE HALL EFFECT SEN
SOR
HON
EYWELL #SR13C-A1
VIN+
SIG
GND
WET-M
ATE ASSEMBLY
(2 X BULKHEAD #M
CBH16F)(1 X DO
UBLE-EN
DED #MCB)
01020304050607080910111213141516
01020304050607080910111213141516
SOLN
D SIG+(24V)
LED 24V
LED GND
SOLN
D GND
LED DIM+ (Purple)
GPS USB Red
GPS USB Black
LED DIM -(Grey)
GPS USB W
hite
FW U
SB 5V
FW U
SB GND
GPS USB Yellow
FW U
SB OU
T
FW U
SB IN
TTL TO U
SBSPARKFU
N #RB-Spa-431
GND/Black
CTS/Brown
VCC/Red
RXD/Yellow
TXD/Orange
RTS/Green
TTL TO U
SBSPARKFU
N #RB-Spa-431
GND/Black
CTS/Brown
VCC/Red
RXD/Yellow
TXD/Orange
RTS/Green
White O
range
Orange
White Green
Green
2200
150
1500 LATCH O
N-
3.3k
3.3k
AFT HALL EFFECT SENSO
RHO
NEYW
ELL #SR13C-A1
VIN+
SIG
GND
Linear DSU
B Connector
3.3k
Rotational DSU
B Connector
AHRSM
ICROSTRAIN
3DM-GX3
COM
VIN (5V)
GND
Dropweight
RelayDigikey #
PB1562-ND
ACOU
STIC MO
DEM
VIN (21-36V)
GND
SIG+
SIG-
COM
SHIELD
WETMATEABLE NUM
DSUB NUM
ROTATIO
NAL DSU
B Dsub Pin
functionCoiled Cable
1Ribbon 1
blue2
Ribbon 2blue black
3Ribbon 3
blue red4
Ribbon 4blue black w
hite5
Ribbon 5blue w
hite6
Ribbon 6red
7Ribbon 7
red black8
Ribbon 8red green
9Ribbon 9
red white
10Ribbon 10
red white black
11M
ulticolor Yelloworange
12M
ulticolor Brown
orange black13
Multicolor Grey
orange black white
14Hom
e Hall Effect 24Vblack red w
hite15
Home Hall Effect GN
Dblack
16Hom
e Hall Effect Signalgreen black w
hite17
Power Red
white black
18Pow
er Redw
hite red19
Power W
hitew
hite black red20
Power W
hitew
hite21
Power Black
black white
22Pow
er Blackblack red w
hite2324
Multicolor Blue
orange green25
Multicolor Green
orange red
LINEAR DSU
B Dsub Pin
function1
Ribbon 12
Ribbon 23
Ribbon 34
Ribbon 45
Ribbon 56
Ribbon 67
Ribbon 78
Ribbon 89
Ribbon 910
Ribbon 1011
Multicolor Yellow
12M
ulticolor Brown
13M
ulticolor Grey
14Positive (Aft) Hall Effect 24V
15Positive (Aft) Hall Effect GN
D16
Positive (Aft) Hall Effect Signal17
Negative (Fore) Hall Effect 24V
18N
egative (Fore) Hall Effect GND
19N
egative (Fore) Hall Effect Signal20
Power Red
21Pow
er White
22Pow
er Black2324
Multicolor Blue
25M
ulticolor Green
Figure 7.20: Glider electronics system schematic
Page 53
Virginia Center for Autonomous Systems Report No. 2015-01

A. Wolek, T. Gode, C. A. Woolsey, J. Quenzer and K. A. Morgansen
Chapter 8
Acoustic Positioning andCommunication
8.1 Underwater Navigation and Communication
A number of positioning and communication systems exist for land and air vehicles operatingautonomously within a relatively short distance (several miles) of a ground control station.In such applications, a radio and global positioning system (GPS) receiver often suffice toperform the communication and positioning tasks. However, because electromagnetic wavesare strongly attenuated in water (especially seawater) these technologies cannot be effec-tively used with underwater vehicles while they are underway. Instead, acoustic methodsare typically employed. Acoustics communication is relatively bandwidth limited and canbe challenging in certain environments, especially where the speed of sound profile is notproperly characterized or accounted for. Further challenges arise from multi-path, propaga-tion delays and Doppler-shifts (when applicable). Nonetheless, this method of underwatercommunication remains the most effective and widely used.
In the absence of an acoustic positioning system, underwater vehicles typically employ thedead reckoning technique. Dead reckoning uses an initial position (e.g. obtained usingGPS) and measurements from an inertial navigation system to estimate the position ofthe vehicle. (Often the inertial navigation system consists of accelerometers, gyroscopesand a magnetometer.) Sources of error associated with the technique include the inherentsensor error and exogenous disturbances [29, 30]. More advanced sensors, such as DopplerVelocity Logs (DVLs) or gyro-compasses may improve a dead reckoned estimate, howeverthey ultimately suffer from the same sources of error.
Acoustic ranging systems provide independent position estimates that do not degrade withtime (i.e. they do not suffer from error drift). They require deploying a number of transduc-ers, and accompany acoustic modems, at known locations in the vicinity of an underwatervehicle. The distance between these transducers is called the baseline. Depending on thegeometry of the transducer network they may be referred to as short baseline (SBL), ultra
Page 54
Virginia Center for Autonomous Systems Report No. 2015-01

A. Wolek, T. Gode, C. A. Woolsey, J. Quenzer and K. A. Morgansen
short baseline (USBL), and long baseline (LBL) positioning systems (see Figure 8.1).
(a) A USBL is typically < 10cm (b) A SBL is typically 20− 50m
(c) A LBL is typically 100m −10km
(d) A MLBL is similar to a LBLhowever the acoustic nodes aremobile
Figure 8.1: Types of acoustic baseline geometries
An acoustic ranging system works by successively sending an acoustic pulse (a “ping”) toeach transducer in the network. Upon receiving a response, the travel time of sound betweentwo transducers can be computed. Assuming some acoustic properties of the water, namelythe speed of sound profile, the distance between transducers may be estimated. Further,these measurements are used to estimate the unknown position of the underwater vehicle.The estimation algorithms may either be static or dynamic. Static estimates are based purelyon the geometry of the system (e.g. the intersection point of a series of spheres is estimatedusing a a least-squares solution). Dynamic estimates (e.g. a Kalman filter) incorporate adynamic model of the vehicle and additional sensor measurements.
While much of the previous discussion was limited to discussing acoustic positioning. Thesame acoustic network can be used to communicate with the vehicle while it is underway.However, because this communication is bandwidth-limited, generally only the most criticalinformation is communicated in this way (e.g. occasional updates on vehicle health andstatus, or high-level commands from human operators). For a thorough discussion of under-water navigation techniques, relevant estimation algorithms, and details pertaining to theVTUG acoustic positioning and communication system see [31].
Page 55
Virginia Center for Autonomous Systems Report No. 2015-01

A. Wolek, T. Gode, C. A. Woolsey, J. Quenzer and K. A. Morgansen
8.2 Hardware Design
The LBL positioning system used by the VTUG consists of three mobile nodes/beacons builtto serve as part of the acoustic network. One of the three beacons is designed to be on-boardthe boat and accessible to operators. This beacon is referred to as the ground station (GS)node. It houses some additional hardware for communicating with and powering the glider.The remaining two nodes are deployed on anchored, inflatable rafts (see Figure 8.2). Werefer to these two beacons as B1 and B2, respectively.
Figure 8.2: Beacon deployed on a raft
Figure 8.3: All three beacons during a tank test
Page 56
Virginia Center for Autonomous Systems Report No. 2015-01

A. Wolek, T. Gode, C. A. Woolsey, J. Quenzer and K. A. Morgansen
Figure 8.3 shows the three nodes during a communication test of the acoustic transducersin a water tank at Virginia Tech. The electrical components are housed in an aluminum80× 20 frame, placed inside a rugged Pelican case. The frame has two levels, as illustratedin Figure 8.4.
Page 57
Virginia Center for Autonomous Systems Report No. 2015-01
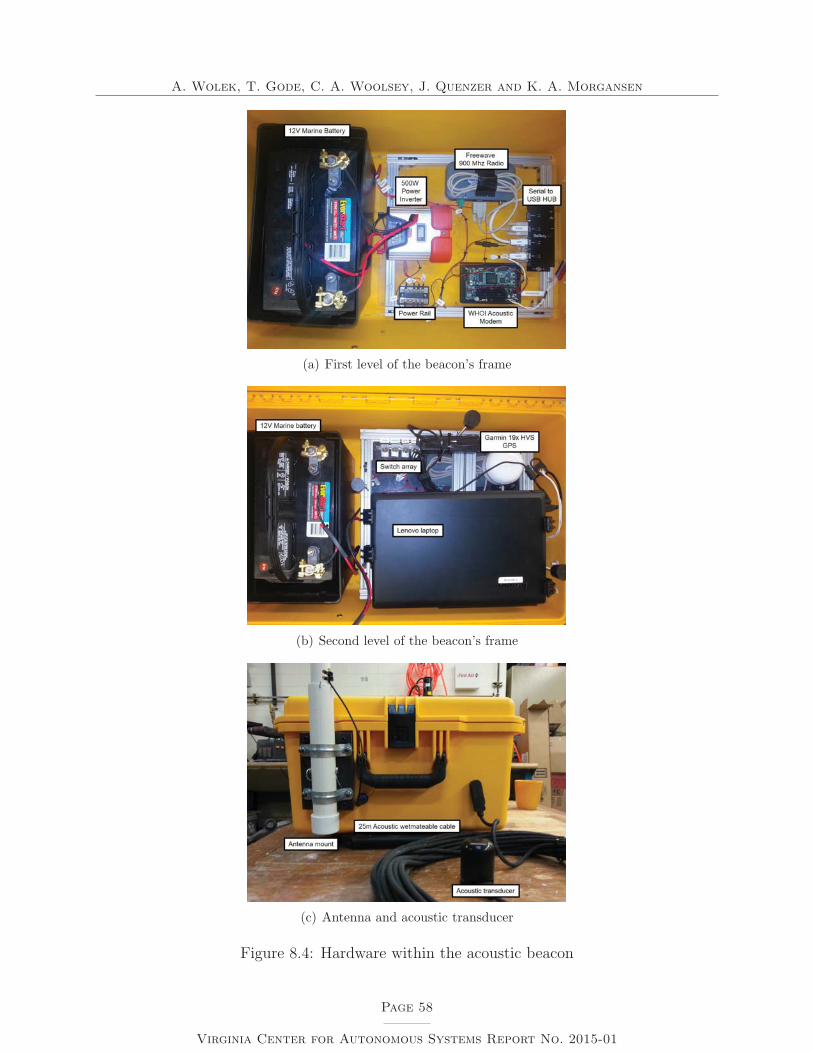
A. Wolek, T. Gode, C. A. Woolsey, J. Quenzer and K. A. Morgansen
(a) First level of the beacon’s frame
(b) Second level of the beacon’s frame
(c) Antenna and acoustic transducer
Figure 8.4: Hardware within the acoustic beacon
Page 58
Virginia Center for Autonomous Systems Report No. 2015-01

A. Wolek, T. Gode, C. A. Woolsey, J. Quenzer and K. A. Morgansen
Power is provided by a 12 V marine deep-cycle battery. A power inverter converts thisinto an alternating current (AC) source to power the laptop (other devices in the systemuse this direct current (DC) source directly). The beacon is equipped with a GPS, radio,and an acoustic modem. The acoustic modem, developed by Woods Hole OceanographicInstitute (WHOI), consists of several components: the micro-modem, power amplifier andco-processor (see [32] for a detailed description of these components). Serial communicationfrom these devices is converted to a laptop-compatible USB connection. An array of switchesprovides independent power to each device to assist with debugging (and in some cases toavoid powering unused devices.) A 25 m Teledyne wet-mateable cable is used to submergethe transducer to a predetermined depth. To prevent the cable from swaying due to currents,it was weighed down by running it through a 4 foot plastic pipe. All the components withinthe Pelican case are friction fit using foam to prevent them from moving around. Table 8.1gives a summary of the technical specifications of the components in each of the three nodes.
Component Description ModelBattery - 12 V, 575 CCA (cold cranking amps) DieHard RV 27MInverter - 500 W, Two 110 V AC outlets Black&Decker 500Laptop - 1.5 GHz, 4 GB RAM, Intel i3-3120M
- Ubuntu 12.04 (Precise Pangolin)- ROS Fuerte
Lenovo G580
Radio - 900 MHz- 115.2/153.6 kbps speed
Freewave FGR2
Antenna - 12”, 150W- Frequency: 896-940 MHz- Nominal impedance: 50Ω
DATA-LINC (3db)Omni-directional antenna:EAN0900WC
GPS - FTDI interface- 2 Hz refresh rate (NMEA)- Sarantel omni-directional geo-helix S-type active antenna- Accuracy: ∼ 10m
GS407 U-Blox5H
AcousticModem
- 12 V, 4 KHz bandwidth (25-29 KHz)- QPSK modulation- Texas Instruments 1 GHz FPP DSP
WHOI Micro-Modem
AcousticTransducer
- Resonance frequency: 28 KHz- Max depth: 700 m
BTech BT-1RCL
Wet MateableCable
- 25 m shielded 20AWG 3 pin cable Teledyne Belden 8412
Serial to USBhub
- Four port RS-232 to USB serialadapter
StarTech ICUSB2324I
Table 8.1: Node hardware specifications
Page 59
Virginia Center for Autonomous Systems Report No. 2015-01

A. Wolek, T. Gode, C. A. Woolsey, J. Quenzer and K. A. Morgansen
The acoustic modem wiring diagram is shown in Figure 8.5.
MICROMODEM FULL ASSEMBLY (250012a)
MICROMODEM (201002c)
CTS1
RX2
GND3
TX4
EXTWAKE5
RTS6
JP1 – COM 1 (User)
POWER AMPLIFIER (202004c)
VIN1
GND2JP2 – Power Input
+SIG1
NC2
SHD3
-SIG4
JP3 – Transducer Signal I/O
ACOUSTIC TRANSDUCER (211001 – SPC)
-SIG 1
SHIELD 2
+SIG 3
TRANSDUCER
12V LEAD ACID MARINE BATTERY
+VE 1
-VE 2BATTERY
RS-232 DB9 Serial Connector (male)
DCD 1
DTR 4
GND 5
DSR 6
RTS 7
CTS 8
RI 9
RS232 (Male)
RX 2
TX 3
LAPTOP
USB PORT
SERIAL to USB Converter
GROUNDPOWERSIGNALOTHER
Figure 8.5: WHOI micro-modem wiring diagram
8.3 Software Design
The acoustic communication software was designed to be compatible with the VTUG ’ssoftware. It was developed using the Robot Operating Systems (ROS) architecture. Thecomputer runs on the Ubuntu 12.04 operating system. The open-source “Goby UnderwaterAutonomy Project” [33] library was used for interfacing with the WHOI acoustic modemsvia National Marine Electronics Association (NMEA) sentences. Some common NMEAcommands used to configure the modems and perform the modem-to-modem pinging arelisted in Table 8.2.
Page 60
Virginia Center for Autonomous Systems Report No. 2015-01

A. Wolek, T. Gode, C. A. Woolsey, J. Quenzer and K. A. Morgansen
Command Description$CCCFQ,NNN Query NVRAM configuration parameter
e.g. $CCCFQ,AGN: Prints the current value of the “analoggain”e.g. $CCCFQ,ALL: Prints a list of all current configurationparameters
$CCCFG,NNN,vv Used to set NVRAM configuration parameter, host to modemNNN: Name of the NVRAM parameter to setvv: New value to sete.g. $CCCFG,AGN,250: Sets the analog gain parameter to250
$CCMPC,SRC,DEST Mini-packet ping commandTo ping a beacon to compute one-way-travel-timeSRC: Source (unit designated as ping originator)DEST: Destination (unit designated as receiver of ping)
$CAMPA,SRC,DEST A ping has been receivedWhen a ping is received at the destination beacon, the modemsends this command to the userSRC: Source (unit designated as transmitter)DEST: Destination (unit designated as receiver of ping)
Table 8.2: Sample NMEA commands used by the WHOI acoustic modems (adapted from[34])
The modem is configurable with a number of various settings that are detailed in [34]. A typ-ical transmission consists of “data packets” which are further broken up into “frames”. Twomodes of communication are available: frequency shift keying (FSK) and phase shift keying(PSK). Each of these modes can accommodate a different configuration of packets/framesand their respective memory sizes. The later mode appeared to be more robust in the fieldand was used with the VTUG.
The ROS software architecture is based on the idea that the robot’s functions can be brokendown into task-specific “nodes” that communicate via predefined “topics”. A high levelchronological sequence of events that results in a LBL ranging cycle and a “heartbeat” (abrief vehicle health status) message being communicated by the glider is shown in Figure 8.6.(In Figure 8.6, boxes with a black border denote specific ROS nodes involved.)
Page 61
Virginia Center for Autonomous Systems Report No. 2015-01

A. Wolek, T. Gode, C. A. Woolsey, J. Quenzer and K. A. Morgansen
Glider side Beacon Side
Comms Acomms Acomms BeaconRequest Ping
Ranging Ping
Ping NotificationRanging ping Response
Range to beacon
Estimation
LBL Measurement
5 secs
Request PingRanging Ping
Ping NotificationRanging ping Response
Range to beacon5 secs
Request PingRanging Ping
Ping NotificationRanging ping Response
Range to beacon5 secs
Beacon GUI
Sensor
Sensor DataHeartbeat message Heartbeat
message Heartbeat message
Every 60 s
Frame size:1
Frame size:0
Frame size:0
Frame size:0
Frame size:1
Frame size:1
Frame size:1String Size: 29
Node 1
Node 2
Node 3
15s LBL ranging
cycle
Figure 8.6: Sequence of events for LBL ranging and heartbeat communication
Page 62
Virginia Center for Autonomous Systems Report No. 2015-01

A. Wolek, T. Gode, C. A. Woolsey, J. Quenzer and K. A. Morgansen
Chapter 9
Software
Human operators can command and control the glider via the “ground station”. In morecomplicated operations the system may also include a series of mobile acoustic beacons, asdiscussed in Chapter 8. Software was developed for the both the glider, acoustic beacons,and ground station within a single project.
9.1 Motivation
The Virginia Tech Underwater Glider software was created with easy portability and ex-tendability in mind. The code is open source and is licensed under the GNU General PublicLicense v3 <http://www.gnu.org/licenses/gpl.html>. The code should be:
• Open source and freely distributable so that anybody can contribute to the project.
• Easily accessible so that university students, who typically have limited time to famil-iarize themselves with the project, can be involved in the development.
• Portable between different glider platforms with minimal effort. The principal functionsthat all underwater gliders share should hence be created at an abstract software levelthat is independent of the detail of the physical devices that implement those functions.This separation of general functionalities from the physical devices allows swapping theunderlying software module with ease, and without any change to the interface thatthe software provides towards the user.
9.2 Operating System
The operating system used on the glider and acoustic beacons is Ubuntu 12.04 (PrecisePangolin). Note that the glider runs a server version of Ubuntu 12.04 that requires less
Page 63
Virginia Center for Autonomous Systems Report No. 2015-01

A. Wolek, T. Gode, C. A. Woolsey, J. Quenzer and K. A. Morgansen
computational power. This operating system was used because of its reliability, minimalCPU requirements, and the availability of open source software.
9.3 Robot Operating System
The Robot Operating System (ROS) was created by the Willow Garage project. It runs onUbuntu Linux (among other platforms) and was developed with a view toward portability,extendability, and a relatively easy learning curve for new developers. ROS is a communitydriven, open-source collection of software packages designed to interface with robot hardwarebringing the user both low and high level control. It was chosen for use on the glider for itsrepository of existing code and for its nodal architecture, that manages and simplifies thecommunication of multiple processes (nodes). A chief advantage of this architecture is thatsimilar tasks can be grouped into independent nodes that may be executed independently.For example all of the sensing, control, or estimation tasks can be grouped into three separatenodes. Nodes communicate through the use of messages with a pre-defined structure calledtopics. Inter-node communication is managed by a ROS Master. This approach makes thesystem more robust to failure (e.g. a single node can fail and be restarted without crashingthe entire system) and also modular (e.g. a single node can be updated, replaced or run atvarious frequencies). Various parameters (e.g. control gains, speed of sound estimate, etc. )are contained in human readable text files (ending with extension .yaml) that can be easilymodified in the field.
9.4 Software Architecture
A schematic of the node-topic structure employed by the VTUG is shown in Figure 9.1.Similarly, the node-topic structure employed by an acoustic beacon is shown in Figure 9.2.In the following, the role of each node is briefly described:
• /comms: manages the communication of the glider with the ground station and otheracoustic nodes. It serves three primary roles:
1. Relay radio communications:
– Command queue editing (add, insert, remove, refresh, clear)
– Broadcast of state estimates
2. Broadcast heartbeat data (acoustically). (A heartbeat is a short message thatcontains vital glider information.)
3. Ping LBL beacons and process ping response + beacon GPS data (acoustically).
This node must be running in any experiment where the glider is going to be remotelyoperated. The comms node behaves reactively to incoming data from the commshardware or to data transmission requests from associated nodes.
Page 64
Virginia Center for Autonomous Systems Report No. 2015-01
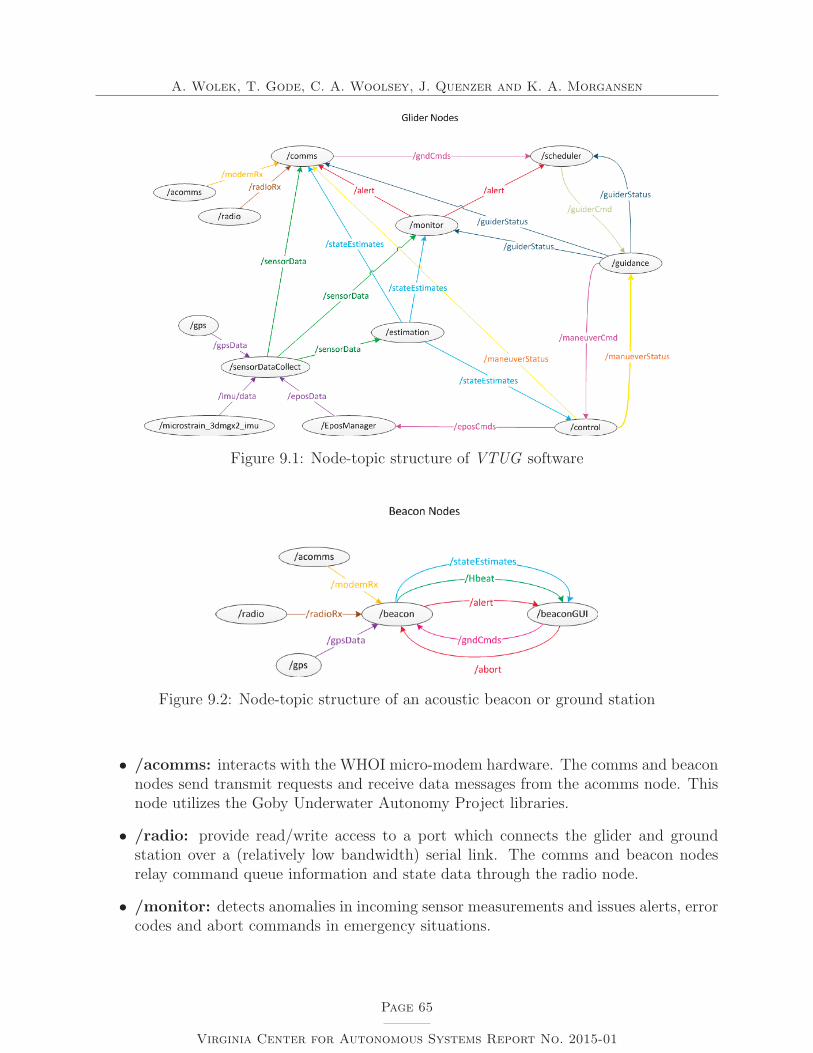
A. Wolek, T. Gode, C. A. Woolsey, J. Quenzer and K. A. Morgansen
Figure 9.1: Node-topic structure of VTUG software
Figure 9.2: Node-topic structure of an acoustic beacon or ground station
• /acomms: interacts with the WHOI micro-modem hardware. The comms and beaconnodes send transmit requests and receive data messages from the acomms node. Thisnode utilizes the Goby Underwater Autonomy Project libraries.
• /radio: provide read/write access to a port which connects the glider and groundstation over a (relatively low bandwidth) serial link. The comms and beacon nodesrelay command queue information and state data through the radio node.
• /monitor: detects anomalies in incoming sensor measurements and issues alerts, errorcodes and abort commands in emergency situations.
Page 65
Virginia Center for Autonomous Systems Report No. 2015-01

A. Wolek, T. Gode, C. A. Woolsey, J. Quenzer and K. A. Morgansen
• /estimation: contains the filters, smoothers, and estimators that are used to processsensor measurements and generate state estimates (e.g. first-order low-pass filter, orextended Kalman filter).
• /scheduler: manages the command queue that contains high-level commands. Whenexecution begins, this node advances through the queue passing the commands to theguidance node as they are completed.
• /guidance: implements the control strategies that convert high-level commands tolow-level reference signals (implementation of outer-loop controllers). Some examplecontrollers include go-to-depth, go-to-roll, comms-stance, and sawtooth.
• /control: implements the low-level control. Reference signals that can be passed tothe control node include depth rate, turn rate, pitch angle, etc. Some of the referencevalues that can be regulated are actually looped around other controllers. At the lowestlevel, the control node produces actuator signals for:
– internal moving mass linear position
– internal moving mass rotational position
– inflator solenoid valve position
– deflator solenoid valve position
– drop weight solenoid on/off
– LED array on/off
Currently all feedback control is accomplished with PID controllers.
• /sensorData: aggregates sensor measurements (e.g. from the glider’s input/outputboard, GPS unit, AHRS unit, etc.) and produces a publishes a sensor data topic.
• /datacollect: subscribes to sensor data, state estimates, and control status which arewritten to respective log files.
• /GPS: Since the GPS is a sensor this node only publishes incoming data. This nodehandles the processing of GPS information output by the gpsd daemon.
• /EposManager: controllers accept commands for the motor positions as well asproduce measurements of those positions. Hence the node both listens for commands(sent from control node) as well as publishes measurements (received by sensor node).Third party software is used for this node.
• /IMU: Since the IMU is a sensor this node only publishes incoming data. Third partysoftware is used for this node.
• /beacon: serves to relay communication between the beaconGUI and the glider viathe radio node, and to keep trakc of the beacon location (via GPS node) and respondappropriately when the glider pings the beacon during LBL ranging.
Page 66
Virginia Center for Autonomous Systems Report No. 2015-01

A. Wolek, T. Gode, C. A. Woolsey, J. Quenzer and K. A. Morgansen
9.5 Graphical User Interfaces
During benchtop testing, when the glider is connected to the ground station via an ether-net cable, the benchtestGUI node is used to display glider sensor data, status informationand accept commands from the operator. Figure 9.3 shows the commands and display tabsthat are available to the operator using the benchtestGUI. Similarly, during field testing,
Figure 9.3: Screenshot of the benchtestGUI interface
radio and acoustic communication is managed using the beaconGUI interface. This GUIis used for assembling/editing the command queue, displaying state data transmitted bythe glider, visualizing heartbeat information sent from the glider, visualizing beacon/gliderhealth status and also issuing emergency abort commands if necessary. The interface avail-able with radio communication is shown in Figure 9.4, while the interface available withacoustic communication is shown in Figure 9.5.
For a detailed discussion of the software see the Developer’s Manual [35] and the User’sManual [36].
9.6 Development Tools
The glider’s software was developed using the QT Creator and QT Designer. Cmake was usedas the fundamental make tool. Doxygen and LaTeX were used to produce documentation.RabbitVCS was used for version control.
Page 67
Virginia Center for Autonomous Systems Report No. 2015-01
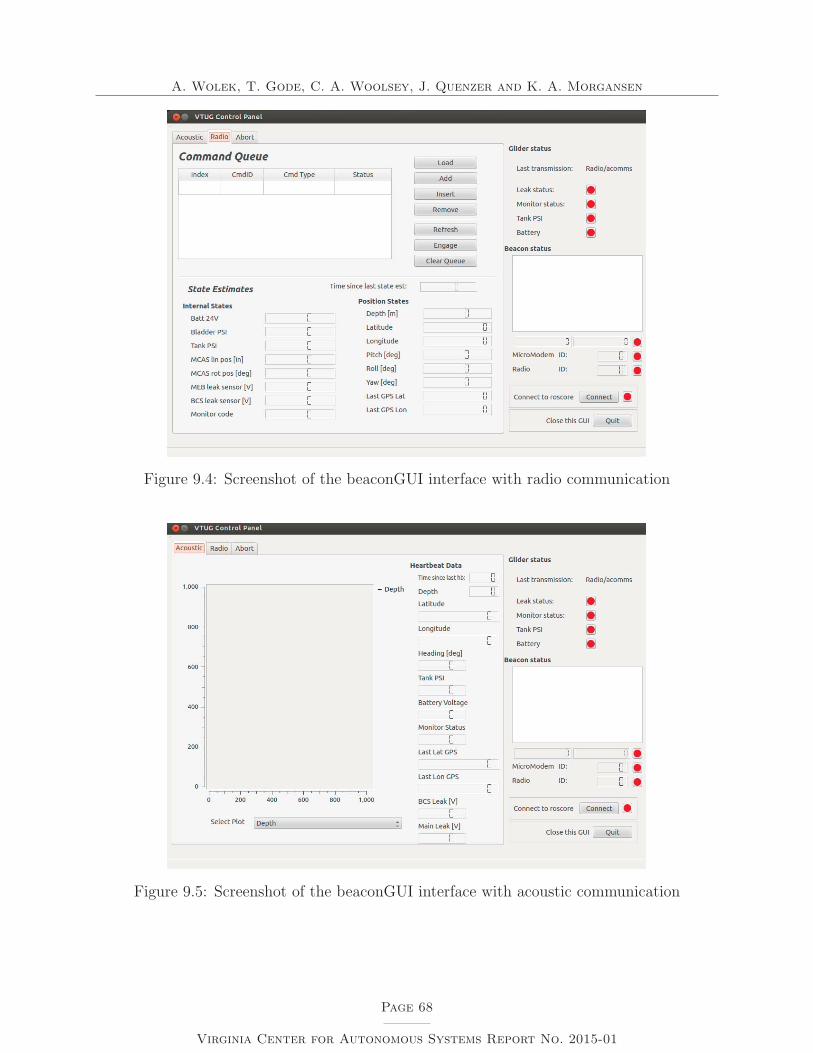
A. Wolek, T. Gode, C. A. Woolsey, J. Quenzer and K. A. Morgansen
Figure 9.4: Screenshot of the beaconGUI interface with radio communication
Figure 9.5: Screenshot of the beaconGUI interface with acoustic communication
Page 68
Virginia Center for Autonomous Systems Report No. 2015-01

A. Wolek, T. Gode, C. A. Woolsey, J. Quenzer and K. A. Morgansen
Chapter 10
Testing
10.1 Buoyancy Engine Feasibility
To determine the feasibility of the pneumatic buoyancy engine concept, and to test a numberof components selected, a prototype buoyancy control system was fabricated. The prototypeconsisted of a large scuba tank, a pressure vessel housing on/off type solenoid valves andbladder pressure and depth sensors, as well as flooded chamber that housed the elastomericbladder, see Figure 10.1. The rig was trimmed to remain vertical.
Figure 10.1: Feasibility test of the pneumatic buoyancy engine
Tests of this system were conducted in January 2012 at War Memorial Swimming Poolon Virginia Tech’s campus. In these experiments a bang-bang controller was designed tomaintain a desired depth within some deadzone. The pneumatic system was able to reliablymake the rig ascend and descend. However, finely regulating the bladder pressure was madedifficult due to the coarse pressure changes provided by the on/off type solenoids. Theinfluence of the inflator on the bladder pressure was disproportionately greater than that ofthe deflator. This test motivated revisiting the valve sizing and selection approach. As a
Page 69
Virginia Center for Autonomous Systems Report No. 2015-01

A. Wolek, T. Gode, C. A. Woolsey, J. Quenzer and K. A. Morgansen
result of further analysis, new proportionally controlled valves were selected. The diameter ofthe tubing and valve orifice in the deflation assembly was increased to improve the deflationrate.
10.2 Depth Rating Validation
In August 2012, the glider was tested in Lake Washington by deploying it with a tether to adepth of 25 m (see Figure 10.2). The purpose of the test was to verify the bladder is capableof inflating at this depth, and also to confirm the vehicle is properly waterproofed.
(a) Glider in tank for trimming at theUniversity of Washington
(b) Glider being launched from a sail-boat
(c) Tethered glider in Lake Washington
Figure 10.2: Lake Washington Depth Rating Test
10.3 Sawtooth Glides in Pool
A series of pool tests culminated with the glider performing a sawtooth glides across WarMemorial Swimming Pool in March 2013 (as shown in Figure 10.3(a)). The glider employeda modified bladder that used a fabric covering to restrict expansion beyond some volumeand allow higher pressures (up to 5 psi). This resulted in faster deflation rates and madethe bladder less susceptible to small changes in ambient pressure (as might occur from thevehicle pitching or changing depth). The data from this test is given in Figure 10.3(b). The
Page 70
Virginia Center for Autonomous Systems Report No. 2015-01

A. Wolek, T. Gode, C. A. Woolsey, J. Quenzer and K. A. Morgansen
glider was able to traverse the width of the diving well (≈ 20 m) in about 2.5 minutes. Itis important to note that the pool is much too shallow for the glider to establish a steadyglide and the sawtooth here consists of inefficient transient motions. The bladder pressureoscillated near the surface and further gain tuning was required. The target depth of theglider during the sawtooth (black dashed line, top right subplot in Figure 10.3(b)) wasovershot by about 1.5 m. Because of the limited depth of the swimming pool, the movingmass was only able to travel about 6 in. before the glider changed its direction. Theassociated descent and ascent pitch attitudes were about ±60 deg.
(a) Motion of glider across swimming pool
0 50 100 1504
2
0
2
4
6
Time (sec.)
Mas
s Li
near
Pos
ition
(in)
actualcommand
0 50 100 150
50
0
50
Time (sec.)
Pitc
h At
titud
e (d
eg)
0 50 100 1501
0
1
2
3
4
Time (sec.)
Dep
th(m
)
0 50 100 1500
2
4
6
Time (sec.)
Blad
der P
ress
ure
(psi
d)
actualcommand
(b) Corresponding data
Figure 10.3: Pool sawtooth test
Page 71
Virginia Center for Autonomous Systems Report No. 2015-01

A. Wolek, T. Gode, C. A. Woolsey, J. Quenzer and K. A. Morgansen
10.4 Buoyancy Engine Performance
Extensive testing of the buoyancy engine was conducted at Claytor Lake, VA. Figure 10.4shows a series of dives to target depths of 15 m then to 20 m conducted in September 2013.In these experiments the inflator command was saturated to 30 % to prevent excessively fastinflations. Dives to 20 m had about 3-4 m of overshoot and resulted in a change in tankpressure of about 70 psi. Thes experiments demonstrated the feasability and reliability ofthe pneumatic buoyancy engine concept.
0 5 10 15 200
5
10
15
20
25
Dep
th (m
)Time (min.)
0 5 10 15 200
1
2
3
4
5
Blad
der P
ress
ure
(psi
d)
Time (min.)
actualcommand
0 5 10 15 201100
1200
1300
1400
1500
1600
Tank
Pre
ssur
e (p
sid)
Time (min.)
rawfiltered
0 5 10 15 200
20
40
60
80
100
Time (min).
Com
man
d [%
]
delfatorinflator
Figure 10.4: Buoyancy engine tests at Claytor Lake, VA
10.5 Trim and Gain Tuning
The goal of “trimming” the glider is to achieve a desired weight, buoyancy, and balance thatmeets performance and stability requirements. This requires carefully designing the vehiclefor a range of center of buoyancy (CB) and center of gravity (CG) positions that meet theserequirements. Estimating the mass properties and locations of all components in the vehicleduring the detailed design and fabrication stage is essential to minimizing the amount of trimadjustments required once the vehicle is assembled. (Ideally, this also includes a sensitivityanalysis that ensures the design is robust to small deviations in the expected values.)
The glider was trimmed for a number of operating conditions: the communication (“comms”)stance (where the tail sticks above the water to improve reception), a desired depth rate andpitch attitude during ascents or descents, and the ability to roll completely around with onerevolution of the moving mass. (Trimming is also required whenever a major component ischanged or when moving from fresh water to sea water and vice versa.)
Page 72
Virginia Center for Autonomous Systems Report No. 2015-01

A. Wolek, T. Gode, C. A. Woolsey, J. Quenzer and K. A. Morgansen
However, uncertainty in the design and fabrication process may require adjustments to bemade. To determine the required adjustments in trim one may either attempt to measurethe mass properties directly and compute the required adjustments, or make changes in thefield (or in a trimming tank) based on observations of the vehicle’s motion.
The mass properties of the vehicle can be measured directly if appropriate facilities areavailable. The buoyancy of the entire vehicle can be measured by submersion (observingthe change in water level). Weight can be measured by placing the glider on a scale. Todetermine the CG and CB locations (along the longitudinal axis) the glider can be hung fromtwo or more spring scales both inside and outside a trimming tank. The position of the CGand CB locations in the vertical plane is more difficult to measure using this approach. Theinertia of the glider can be estimated using the bifillar or compound pendulum technique.
Trim adjustments may be made by: re-arranging existing components (when permissible),designing new replacement parts with different weight/buoyancy properties, using the mov-ing mass and buoyancy engine for trim, or adding/removing buoyancy and weight from thevehicle. In this latter approach, often foam is used to add buoyancy and a dense metalis used to add weight. Syntactic foam is a type of foam frequently used for this purpose,however it is expensive and rather brittle. (It must be encapsulated with epoxy and curedonce it has been shaped appropriately. This is a lengthy process that does not lend itselfwell to iterative adjustments.) Instead, a more machinable, inexpensive extruded polysyreneinsulation foam may be used (model: Owens Corning Foamular 1000, with a compressivestrength of 100 psi). Lead is often used as a trim weight, however tungsten powder is analternative that is safer to handle and can be mixed with epoxy to form a liquid which canbe poured into a mold that cures to a similar density as lead. This makes it easier to formthe trim weights into irregular shapes. It is important to design accessible but unobtrusivelocations along the vehicle’s body that can accommodate additional trim foam and weight.Ideally, any trim weights or foam should reside underneath the fairings such that it does notdisturb the flow around the vehicle. Trimming is an iterative process that often requires acompromise between competing objectives. In the following we discuss a few such objectives.
10.5.1 Comms Stance Trimming
The communication “comms” stance (see Figure 10.13) is used to extend the tail and improveGPS and radio reception. This desired attitude suggests making the glider nose-heavy (i.e.moving the internal mass forward) and and very buoyant (to raise the tail above the water.)However, because the bladder is located near the front of the vehicle, increases in buoyancytend to pitch the nose up and reduce the angle of the tail. Thus, there is a trade-off betweenthese two objectives.
If the moving mass alone does not pitch the vehicle down adequately enough then thebuoyancy and weight must be re-distributed such that the nose is heavier and the tail ismore buoyant. While this may improve the comms stance, it will bias the range of attainablepitch attitudes towards steeper nose-down angles.
Through testing with the VTUG, we found that the best comms stance was achieved when
Page 73
Virginia Center for Autonomous Systems Report No. 2015-01

A. Wolek, T. Gode, C. A. Woolsey, J. Quenzer and K. A. Morgansen
Figure 10.5: Glider in a communications stance
the vehicle was just slightly positively buoyant. However, this configuration was susceptibleto strong pitch-depth coupling. See Sections 2.3.3 and 2.3.4 for a detailed discussion.
These issues may be mitigated by carefully tuning the bladder pressure controller. We foundthat the gains required to maintain this sensitive comms stance were much different thanthose required during sawtooth glides. Thus the functionality of scheduling new gains duringa comms stance was implemented in the software.
10.5.2 Roll Trimming
The ideal case for roll trim is when the rigid body CG and CB are aligned along the vehiclelongitudinal axis (see Section 3.4 for a detailed discussion). It is desirable to adjust thebottom heaviness without perturbing the pitch trim (i.e. to only adjust the CG/CB locationsin the vertical plane). To achieve this, neutrally buoyant pairs of weight and foam were placedat approximately the same longitudinal position (see Figure 10.6).
It is preferable for a shallow water glider with unlimited roll control to “flip over” on thesurface, when transitioning from an ascent to a descent, rather than while it is underway.This maximizes the time available for the glider to maintain a steady glide. However, thereare several challenges associated with flipping over on the surface. As the glider begins to rollits wings on the surface there is a discontinuous change in buoyancy as one wing leaves thewater. The result is that the buoyancy of the other (submerged) wing is not balanced andtherefore a roll moment acts to restore the vehicle to the level orientation (see Fig. 10.7). Thisrestoring moment can be significant since the moment arm of the wings’ center of buoyancyis typically several times that of the moving mass. (Note that vertical stabilizers placedperpendicular to the wings reduce this effect.) The VTUG initially employed thick hydrofoilwings, however we found that these were too buoyant and prevented the vehicle from rollingon the surface. Flooded wings that were partially hollow were fabricated, however onlya small improvement in roll performance was observed. Last, flat plate steel wings withminimal buoyancy were constructed and these wings enabled the glider to complete full 360deg. rolls.
Page 74
Virginia Center for Autonomous Systems Report No. 2015-01

A. Wolek, T. Gode, C. A. Woolsey, J. Quenzer and K. A. Morgansen
Figure 10.6: Pairs of neutrally buoyant trim foam (larger pink blocks) and trim weight(smaller black pieces) were used to adjust the position of the CG and CB in the verticalplane (only).
Another factor that was found to affect the ability of the glider to roll was the drag due towind acting on the wings. A wing extending straight above the water has a relatively largesurface area and the resulting drag forces may be significant. On calm days it was observedthat by rolling clockwise, or counter-clockwise, the wings would act as paddles to change theheading of the vehicle. This effect may be exploited to re-orient the glider prior to initiatinga dive.
(a) At depth the wings are submergedand do not induce a rolling moment
(b) On the surface there is a discontin-uous change in wing buoyancy causinga restoring moment that works to keepthe glider level
Figure 10.7: Effect of wing buoyancy on rolling moments
Page 75
Virginia Center for Autonomous Systems Report No. 2015-01

A. Wolek, T. Gode, C. A. Woolsey, J. Quenzer and K. A. Morgansen
10.5.3 Pitch Trimming
As mentioned previously, the main objectives of pitch trimming is to ensure the movingmass is capable of achieving a desired range of pitch attitudes during ascents, descents, andduring the comms stance. Three locations on the vehicle were used to adjust the pitch trim:the nose, the tail, and the flooded coupler section containing the buoyancy engine.
One way to trim for descent pitch attitude is to perform tethered “drop tests” in which thetethered glider is held negatively buoyant near the boat and iteratively released to about 10m. Since the glider is not transitioning from a comms stance, the mass position and bladderpressure can be set before the glider is released to reduce the time it takes to achieve a steadyglide. The descent attitude of the glider can be determined both qualitatively (in extremecases) and quantitatively by reviewing attitude measurements. Based on these observations,trim adjustments can be made after each iteration. To reduce the number of test points,the pitch attitude can be observed with the mass at the limits of its range. For example,if the pitch attitude during a descent with the mass in its aftmost position is shallow (e.g.≈ 0 deg.), and then steep (e.g. ≈ 60 deg.) with the mass in its foremost position, then itfollows that intermediate positions will give intermediate pitch angles. This indicates thatthe trim of the vehicle is adequate for this condition and the problem then becomes to findthe correct mass position for the desired intermediate pitch angle. A similar approach can beused to trim for the ascent pitch attitude however this is more involved because it requiresperforming a sawtooth dive and analyzing the data from the ascent.
In practice, we found trimming the vehicle in pitch was very difficult. This can be attributedto at least three factors: the tank becomes lighter during a trimming campaign, the bladderpressure has a large influence on the pitch attitude, and the glider’s attitude is sensitive tosmall changes in trim because of the small bottom heaviness. Although these factors wereconsidered during the detailed process, their effect was underestimated and post-productionchanges to the design altered the desired balance of the vehicle. While for some specificconfigurations we could trim the pitch of the vehicle as desired, this configuration becameobsolete after a few dives due to the change in the weight of the tank.
10.5.4 Bladder Pressure Gain Tuning
It is clear from the discussion in Section 2 that the correct flow valve position is a functionof the depth rate, and may also depend on the bladder pressure command. (Recall thedeflator valve is more effective when the bladder pressure is higher.) Extensive testingtuning the gains of the proportional-intergral-derivative (PID) bladder pressure control loopsshowed that a single set of gains does not perform well for varying depth rates and bladderpressures. This lead to the development of a separate set of gains for the comms stance (seeSection 10.5.1). One way of mitigating the challenges associated with bladder pressure gaintuning is to limit the bladder’s operation to being fully deflated during descents and a fullyinflated bladder pressure during ascents. This reduces the number of operating conditionsthat must be tuned for at the cost of flexibility with the available buoyancy commands.Another approach, recommended for future work, is to design a model-based control law
Page 76
Virginia Center for Autonomous Systems Report No. 2015-01

A. Wolek, T. Gode, C. A. Woolsey, J. Quenzer and K. A. Morgansen
that captures coupling between bladder pressure, pitch, depth rate, and the required actuatorcommands.
10.6 LBL Ranging System: Planar Motion Test
The acoustic LBL ranging system was tested in Claytor Lake, VA in November 2014. The ob-jective of the experiment was to assess the performance of the system under ideal conditionsin the operating environment (see Figure 10.8(a)).
The experiment consisted of deploying three LBL nodes (each on their own rafts) withtransducers submerged to 15 ft. The glider’s motion was emulated by keeping the glideraboard a moving boat and submerging the transducer to 5 ft. Keeping the glider aboard theboat allowed us to record the true GPS position of the glider relative to all of the deployedbeacons (each logging their own GPS position as well). Thus the accuracy of the LBLranging system and our position estimates could be determined. For the purposes of thisexperiment only static estimation algorithms were implemented. All of the data collectedwas processed offline. The host vessel (and glider) were moved in a lawn mower pattern tocover a rectangular region in the vicinity of the deployed beacons as showed in Figure 10.8(b).
The full track of the boat was divided into two separate tracks for analysis. The first track(Track 1) comprised of the vertical (North-South) lawn mower paths (also called “swaths”).The second track (Track 2) comprised of horizontal (East-West) swaths. Figure 10.9 showsthe estimation results for Track 1.
Figure 10.9(a) shows a comparison of the modem ranges and the true ranges obtained byusing the GPS data from the nodes and glider. It can be seen that they both match quitewell.
Figure 10.9(b) shows a histogram of pings with, and without, a successful response fromthe nodes. For the duration of the run, 134 successful pings were expected from each node.However, only 101, 102, and 98 successful pings were obtained from Nodes 1, 2, and 3respectively. This shows some consistency in the performance of all the three nodes. However,the causes of the lost pings cannot be easily identified. Since extensive testing was done toensure the robustness of the hardware and software in the lab setting it is likely that thisis due to the properties of the underwater acoustic environment rather than a hardware orsoftware error.
Figure 10.9(c) shows the ping locations on the glider path. It was observed that threeconsecutive successful pings in the 15 s LBL range cycle were not always obtained. Most ofthe time two successful pings in the 15 s cycle were obtained. Whenever three consecutiverange measurements were available localization could be performed with higher accuracy.However, two successive range measurements were sufficient to localize the glider positionbecause:
1. Only planar estimation is being performed, since the depth of the transducers is knowna priori.
Page 77
Virginia Center for Autonomous Systems Report No. 2015-01

A. Wolek, T. Gode, C. A. Woolsey, J. Quenzer and K. A. Morgansen
(a) Testing site location
(b) Path of the boat (with onboard glider) during the test
Figure 10.8: LBL testing area at Claytor Lake, VA (Map data from Google Earth)
2. Due to the availability of GPS data of the boat, one of the solutions obtained via thealgebraic solution could be eliminated as knowledge of the baseline was available.
Figure 10.9(d) shows the results of implementing the least squares [37] and Bancroft algo-rithms [38]. The estimates with three range measurements and those with two are combinedtogether in the plot shown. As expected, their performances are similar. The results of therun are detailed in Table 10.1.
Page 78
Virginia Center for Autonomous Systems Report No. 2015-01

A. Wolek, T. Gode, C. A. Woolsey, J. Quenzer and K. A. Morgansen
(a) True range (based on GPS positions) andmeasured range (based on mode, and assumedspeed of sound)
(b) Histogram of successful vs. unsuccessfulrange measurements
(c) Actual path of boat with superimposedsuccessful ping locations
(d) Offline estimate of boat position based onrange measurements
Figure 10.9: Testing the LBL system with a GPS-equipped boat emulating the glider usingNorth-South oriented swaths (Track 1)
Parameter Value
Duration of run 34 minNumber of expected pings per beacon 134Avg. error∗ for LS with 3 range measurements 10 mAvg. error for LS with 2 range measurements 13 mAvg. error for Algebraic Solution with 3 range measurements 9 mAvg. error for Algebraic Solution with 2 range measurements 12 m
∗Error refers to the difference between range calculated using GPS, and range from WHOI Micro-Modems
with an assumed speed of sound
Table 10.1: Summary of results from Track 1
Figure 10.10 shows the results for Track 2, which are further detailed in Table 10.2. The
Page 79
Virginia Center for Autonomous Systems Report No. 2015-01

A. Wolek, T. Gode, C. A. Woolsey, J. Quenzer and K. A. Morgansen
results are comparable with Track 1.
(a) True range (based on GPS positions) andmeasured range (based on mode, and as-sumed speed of sound)
(b) Histogram of successful vs. unsuccessfulrange measurements
(c) Actual path of boat with superimposedsuccessful ping locations
(d) Offline estimate of boat position basedon range measurements
Figure 10.10: Testing the LBL system with a GPS-equipped boat emulating the glider usingEast-West oriented swaths (Track 2)
Parameter Value
Duration of run 22 minNumber of expected pings per beacon 86Avg. error∗ for LS with 3 range measurements 12 mAvg. error for LS with 2 range measurements 16 mAvg. error for Algebraic Solution with 3 range measurements 12 mAvg. error for Algebraic Solution with 2 range measurements 15 m
Table 10.2: Results of Track 2
Page 80
Virginia Center for Autonomous Systems Report No. 2015-01

A. Wolek, T. Gode, C. A. Woolsey, J. Quenzer and K. A. Morgansen
10.7 LBL Ranging System: Vertical Motion Test
An experiment was conducted to determine the optimal depth, d to which the acousticbuoys transducers should be deployed. While in some cases this optimal placement may bedetermined by analysis of the speed of sound profile and acoustic properties of the operatingenvironment, we did not have the expertise or capabilities to conduct such a study. Insteadwe sought to determine this parameter experimentally. A test was conducted with the glidertransducer removed from the vehicle and connected to a fourth 25m wet-mateable cable.The depth d of the beacons transducers was incrementally varied from: 5m, 10m, 15m to20m. For each configuration d the glider transducer was also lower to a particular depth(1m, 5m, 10m, 15m, or 20m) for 5 minutes. The test setup is sketched in Figure 10.11.
The resulting percentage of successful pings (from each beacon) was recorded. The resultsare shown in Figure 10.12. Note that the glider transducer was deployed from the GroundStation vessel, thus it was nearly coincident with Ground Stations transducer.
Legend
Figure 10.11: Testing of ping success for various LBL network depths. For a given fixeddepth of all the acoustic beacons’ transducers (shown in yellow) a transducer emulating theglider’s motion was held for 5 minutes at a range of depths (shown in red).
10.8 Sawtooth Glides with Acoustic Positioning
The first tests that utilized the LBL system with the glider underway were conducted inFebruary 2015 (see Figure 10.13). The sawtooth glide consisted of a switching between pre-defined mass positions and bladder pressure set-points at a target depth (to change fromascent to descent). Because there was no active pitch and roll control the glider was unableto attain a steady level equilibrium glide. It was also observed during this test that theacoustic ranging immediately ceased as the glider pitched down and began its dive. This
Page 81
Virginia Center for Autonomous Systems Report No. 2015-01

A. Wolek, T. Gode, C. A. Woolsey, J. Quenzer and K. A. Morgansen
1 5 10 15 200
10
20
30
40
50
60
70
80
90
Glider transducer depth (m)
% s
ucce
ss o
f pin
gs fo
r eac
h be
acon
B2B3GS
(a) d = 5 m
1 5 10 15 200
10
20
30
40
50
60
70
80
90
Glider transducer depth (m)
% s
ucce
ss o
f pin
gs fo
r eac
h be
acon
B2B3GS
(b) d = 10 m
1 5 10 15 200
10
20
30
40
50
60
70
80
90
Glider transducer depth (m)
% s
ucce
ss o
f pin
gs fo
r eac
h be
acon
B2B3GS
(c) d = 15 m
1 5 10 15 200
10
20
30
40
50
60
70
80
90
Glider transducer depth (m)
% s
ucce
ss o
f pin
gs fo
r eac
h be
acon
B2B3GS
(d) d = 20 m
Figure 10.12: Ping success percentage for various depths of the acoustic beacons’ transducers
may be due to the transducer being mounted in the nose of the vehicle, and the body of thevehicle interfering with the transducer’s operation.
In an attempt to improve the positioning of the glider while underway, the transducer wasmoved from its position in the front of the nose (aligned with the longitudinal axis) to thetop of the hull as shown in Figure 10.14.
Subsequent tests were conducted with closed-loop attitude feedback control to move theinternal mass, as shown in (see Figure 10.15). Unfortunately, the new transducer locationdid not improve the acoustic ranging performance (again, no pings were successful duringthe sawtooth glide). From Figure 10.15 it is clear that a steady shallow glide could not beestablished with the given trimming configuration, bladder pressure controller and movingmass actuators. We believe that the lack of successful pings during the sawtooth dive may bea result of the following factors: a) as the glider descends and ascends the body of the glidermay occlude the transducer located in the nose, b) the moving mass motors and solenoidvalves introduce significant noise into the LBL system, especially during sawtooth dives whenthey are most active, and c) the bladder is regulated by exhausting air that forms numerousbubbles in the vicinity of the transducer that may cause scattering of sound.
Page 82
Virginia Center for Autonomous Systems Report No. 2015-01

A. Wolek, T. Gode, C. A. Woolsey, J. Quenzer and K. A. Morgansen
(a) Visualization of glide orientation with depth and time: a circle indicatesa successful range measurement, circle’s color indicates range measurementfrom a unique beacon
12 12.5 13 13.5 140
5
10
15
20
25
Dep
th (m
)
Time (min.)12 12.5 13 13.5 14
−1
−0.5
0
0.5
1
Dep
th R
ate
(m/s
)12 12.5 13 13.5 14
−7.5−5
−2.50
2.55
7.5
Line
ar P
os. (
in.)
12 12.5 13 13.5 14−180
−90
0
90
180
Angu
lar P
os. (
deg)
Lin.PosLin.CmdRot.PosRot.Cmd
12 12.5 13 13.5 140
20
40
60
80
100
Time (min).
Com
man
d [%
]
DelfatorInflator
12 12.5 13 13.5 140
1
2
3
4
5
Blad
. Pre
ss. (
psid
)
Time (min.)
actualcommand
12 12.5 13 13.5 14−90
−45
0
45
90
Time (min.)
Angl
e (d
eg.)
PitchRoll
(b) Corresponding data
Figure 10.13: Sawtooth glide test with acoustic positioning
Page 83
Virginia Center for Autonomous Systems Report No. 2015-01

A. Wolek, T. Gode, C. A. Woolsey, J. Quenzer and K. A. Morgansen
(a) Nose mounted (b) Hull mounted
Figure 10.14: Various mounting locations of the acoustic transducer
Page 84
Virginia Center for Autonomous Systems Report No. 2015-01

A. Wolek, T. Gode, C. A. Woolsey, J. Quenzer and K. A. Morgansen
(a) Visualization of glide orientation with depth and time
1.4 1.6 1.8 2 2.20
5
10
15
Dep
th (m
)
Time (min.)1.4 1.6 1.8 2 2.2
−1
−0.5
0
0.5
1
Dep
th R
ate
(m/s
)1.4 1.6 1.8 2 2.2
00.5
11.5
22.5
33.5
44.5
5
Line
ar P
os. (
in.)
1.4 1.6 1.8 2 2.2
100
120
140
Angu
lar P
os. (
deg)Lin.Pos
Lin.CmdRot.PosRot.Cmd
1.4 1.6 1.8 2 2.20
20
40
60
80
100
Time (min).
Com
man
d [%
]
DelfatorInflator
1.4 1.6 1.8 2 2.20
1
2
3
4
5
Blad
. Pre
ss. (
psid
)
Time (min.)
rawfiltercommand
1.4 1.6 1.8 2 2.2−180
−135
−90
−45
0
45
90
135
180
Time (min.)
Angl
e (d
eg.)
YawPitchRollPitch CmdRoll Cmd
(b) Corresponding data
Figure 10.15: Sawtooth glide test with acoustic positioning and attitude control
Page 85
Virginia Center for Autonomous Systems Report No. 2015-01

A. Wolek, T. Gode, C. A. Woolsey, J. Quenzer and K. A. Morgansen
Chapter 11
Conclusion
In testing a novel underwater glider design and a long baseline ranging system in a shal-low water lake, we identified several challenges associated with key glider systems that weredesigned to make the glider faster and more maneuverable. For example, a pneumatic buoy-ancy engine was found to generate large attitude disturbances that challenged the vehicle’sattitude control system, a cylindrical moving mass actuator. Despite the challenges we en-countered, the pneumatic buoyancy engine was able to reliably control the depth of theglider and provide large and rapid buoyancy changes. This type of buoyancy engine maybe useful in applications requiring the vehicle to extract itself from a layer of debris aftera prolonged period of being inactive on the sea-floor (e.g. if the vehicle were to passivelycollect measurements and periodically surface to transmit data). Field tests of the VirginiaTech Underwater Glider underscore the challenges involved in developing new motion con-trol concepts. However, the experimental results also suggest that pneumatically poweredglider may be an effective mobile sensing technology in shallow water and strong currents.
Page 86
Virginia Center for Autonomous Systems Report No. 2015-01

A. Wolek, T. Gode, C. A. Woolsey, J. Quenzer and K. A. Morgansen
Bibliography
[1] J. Sherman, R. E. Davis, W. B. Owens, and J. Valdes, “The Autonomous UnderwaterGlider ‘Spray’,” IEEE Journal of Oceanic Engineering, vol. 26, no. 4, pp. 437–446, 2001.
[2] D. Webb, P. Simonetti, and C. Jones, “Slocum: an Underwater Glider Propelled byEnvironmental Energy,” IEEE Journal of Oceanic Engineering, vol. 26, no. 4, pp. 447–452, 2001.
[3] C. C. Eriksen, T. J. Osse, R. D. Light, T. Wen, T. W. Lehman, P. L. Sabin, J. W.Ballard, and A. M. Chiodi, “Seaglider: A Long-Range Autonomous Underwater VehicleFor Oceanographic Research,” IEEE Journal of Oceanic Engineering, vol. 26, no. 4,pp. 424–436, 2001.
[4] A. Wolek and C. A. Woolsey, “Feasible Dubins Paths in Presence of Unknown, UnsteadyVelocity Disturbances,” Journal of Guidance, Control, and Dynamics, vol. 38, no. 4,pp. 782–787, 2015.
[5] A. Wolek, E. M. Cliff, and C. A. Woolsey, “Time-Optimal Path Planning for a KinematicCar with Variable Speed Controls,” in review, 2015.
[6] A. Wolek and C. A. Woolsey, “Optimal Paths for a Sailplane with a Quadratic GlidePolar,” in review, 2015.
[7] A. Wolek, E. M. Cliff, and C. A. Woolsey, “Energy-Optimal Paths for a Glider withSpeed and Load Factor Controls,” Journal of Guidance, Control, and Dynamics (toappear), 2015.
[8] E. Creed, C. Mudgal, S. Glenn, O. Schofield, C. Jones, and D. Webb, “Using a Fleet ofSlocum Battery Gliders in a Regional Scale Coastal Ocean Observatory,” in Proceedingsof MTS/IEEE OCEANS’02 Conference and Exhibition, (Piscataway, NJ), pp. 320–324,IEEE, 2002.
[9] J. Imlach and R. Mahr, “Modification of a Military Grade Glider for Coastal ScientificApplications,” in Proceedings of MTS/IEEE OCEANS’12 Conference and Exhibition,(Piscataway, NJ), 2012.
[10] R. E. Davis, C. C. Eriksen, and C. P. Jones, Technology and Applications of AutonomousUnderwater Vehicles: Autonomous Buoyancy-Driven Underwater Gliders. New York,NY: Taylor & Francis Group, 2002.
Page 87
Virginia Center for Autonomous Systems Report No. 2015-01

A. Wolek, T. Gode, C. A. Woolsey, J. Quenzer and K. A. Morgansen
[11] G. D’Spain, S. Jenkins, R. Zimmerman, J. Luby, and A. Thode, “Underwater AcousticMeasurements with the Liberdade/X-Ray Flying Wing Glider,” Journal of the Acous-tical Society of America, vol. 117, no. 4, p. 2624, 2005.
[12] G. D’Spain, “Final Report: Flying Wing Autonomous Underwater Glider for BasicResearch in Ocean Acoustics, Signal/Array Processing, Underwater Autonomous Vehi-cle Technology, Oceanography, Geophysics, and Marine Biological Studies,” Tech. Rep.0704, Office of Naval Research, Arlington, VA, 2009.
[13] S. A. Jenkins, D. E. Humphreys, J. Sherman, J. Osse, C. Jones, N. Leonard, J. Graver,R. Bachmayer, T. Clem, P. Carroll, P. Davis, J. Berry, P. Worley, and J. Wasyl, “Un-derwater Glider System Study,” Tech. Rep. 53, Scripps Institution of Oceanography,2003.
[14] A. Wolek, J. Burns, C. A. Woolsey, J. Quenzer, L. Techy, and K. A. Morgansen,“A Maneuverable, Pneumatic Underwater Glider,” in Proceedings of the MTS/IEEEOCEANS’12 Conference and Exhibition, (Hampton Roads, VA), IEEE, 2012.
[15] A. Wolek, T. Gode, C. A. Woolsey, J. Quenzer, and K. A. Morgansen, “Testing aPneumatic Underwater Glider in Shallow Water,” in Proceedings of the IEEE/MTSOCEANS’15 Conference and Exhibition, (Washington, D.C.), IEEE, 2015.
[16] C. G. Cameron, “The WET Buoyancy Engine: Controlling Buoyancy via Electrochem-istry,” Tech. Rep. TM-2005-2014, Defense Research and Development Canada, Dart-mouth, Nova Scotia, 2005.
[17] J. Borchsenius and S. Pinder, “Underwater Glider Propulsion Using Chemical Hy-drides,” in Proceedings of the MTS/IEEE OCEANS’10 Conference and Exhibition,(Sydney, Australia), May 2010.
[18] Mide Technology Corporation, MSUB II - Underwater Morphing for Buoyancy Control.http://www.mide.com/technology/msub.php (accessed 05/10/2015), 2015.
[19] Swagelok Company, “Valve Sizing,” Tech. Rep. MS-06-84-E, Solon, Ohio, 2007.
[20] L. Techy, R. Tomokiyo, J. Quenzer, T. Beauchamp, and K. A. Morgansen, “Full-ScaleWind Tunnel Study of the Seaglider Underwater Glider,” Tech. Rep. 206, University ofWashington, 2010.
[21] D. P. Raymer, Aircraft Design: A Conceptual Approach. AIAA, fourth ed., 2006.
[22] J. Roskam, Methods for Estimating Stability and Control Derivatives of ConventionalSubsonic Airplanes. Lawrence, Kansas: Roskam Aviation and Engineering Corporation,1971.
[23] M. Drela and H. Youngern, Athena Vortex Lattice ver. 3.27. 2011.
[24] P. W. Dees, “The Technical Legacy of Dr . John McMasters,” in 47th AIAA AerospaceSciences Meeting, (Orlando, FL), Jan. 2009.
Page 88
Virginia Center for Autonomous Systems Report No. 2015-01

A. Wolek, T. Gode, C. A. Woolsey, J. Quenzer and K. A. Morgansen
[25] J. H. McMasters and M. L. Henderson, “Low Speed Single Element Airfoil Synthesis,”OSTIV International Journal of Technical Soaring, vol. 6, no. 2, pp. 1–21, 1980.
[26] American Society of Mechanical Engineers, ASME Boiler and Pressure Vessel Code.New York, NY: ASME, 2010.
[27] W. C. Young and R. G. Budynas, Roark’s Formulas for Stress and Strain. New York,NY: McGraw-Hill, 7th ed., 2002.
[28] Parker Hannifin Corporation, “Parker O-Ring Handbook,” Tech. Rep. ORD-5700,Cleveland, OH, 2007.
[29] B. Bingham, “Navigating Autonomous Underwater Vehicles,” in Underwater Vehicles,pp. 33–50, Rijeka, Croatia: InTech, 2009.
[30] A. J. Kapaldo, Gyroscope Calibration and Dead Reckoning for an Autonomous Un-derwater Vehicle. Master’s thesis, Virginia Polytechnic Institute and State University,Blacksburg, VA, 2005.
[31] T. Gode, Long Baseline Ranging Acoustic Positioning System. Master’s thesis, VirginiaPolytechnic Institute and State University, Blacksburg, VA, 2015.
[32] L. Freitag, M. Grund, S. Singh, J. Partan, P. Koski, and K. Ball, “The WHOI Micro-Modem: An Acoustic Communications and Navigation System for Multiple Platforms,”in Proceedings of the MTS/IEEE OCEANS’05 Conference and Exhibition, (Piscataway,NJ), pp. 1086–1092, IEEE, 2005.
[33] T. Schneider and H. Schmidt, “Goby-Acomms Version 2: Extensible Marshalling, Queu-ing, and Link Layer Interfacing for Acoustic Telemetry,” in Proceedings of the 9thIFAC Conference on Manouvering and Control of Marine Craft, (Kidlington, Oxford),pp. 331–335, IFAC, 2012.
[34] Woods Hole Oceanographic Institution, “Micro-Modem Software Interface Guide,”Tech. Rep. 401040, Woods Hole, MA, 2013.
[35] “Virginia Tech Underwater Glider Developers’ Manual,”http://vger.aa.washington.edu/docs/vtug/dev manual/, 2015.
[36] “Virginia Tech Underwater Glider Users’ Manual,”http://vger.aa.washington.edu/docs/vtug user.pdf, 2015.
[37] M. Deffenbaugh, J. G. Bellingham, and H. Schmidt, “The Relationship between Spheri-cal and Hyperbolic Positioning,” in Proceedings of MTS/IEEE OCEANS’16 Conferenceand Exhibition, (Piscataway, NJ), pp. 590–595, 1996.
[38] S. Bancroft, “An Algebraic Solution of the GPS Equations,” IEEE Transactions onAerospace and Elecrtrical Systems, vol. 21, no. 7, pp. 56–59, 1985.
Page 89
Virginia Center for Autonomous Systems Report No. 2015-01