Embed Size (px)
Citation preview

Sensor and Simulation Notes
Note 423
2 July 1998
Design and Test of a Half Reflector IRA with Feed-Point Lens
W. Scott Bigelow
Everett G. Farr
Farr Research, Inc.
Gary D. Sower
Donald E. Ellibee
EG&G MSI
Abstract
A feed-point lens may be used to match an electrically large, oil-filled, coaxialwaveguide to the feed arms of a high-voltage half reflector impulse radiating antenna (HIRA). Inthis note, we document the design and low-voltage test of a 1.83 m (6 ft) diameter HIRA, with afocal length-to-diameter (F/D) ratio of 1/4, and a titanium dioxide/epoxy feed-point lens with arelative dielectric constant of 7.0.
The on-boresight antenna step response is an impulse with a full-width-at-half-maximumof 70 ps. As a result of compromises in the design of the feed point, the radiated impulse wasbroadened somewhat, reducing the peak field. However, the measured effective aperture heightof the antenna, 0.36 m, is approximately one-half the dipole moment of the reflector, asexpected. Thus, the antenna performance is consistent with both theory and design.

2
1. Introduction
The availability of fast, single-ended, high-voltage pulsers has fueled a demand forsuitable antennas to radiate the signal. A candidate antenna for this application, the HalfReflector Impulse Radiating Antenna (HIRA), was first proposed in [1], and a variation wasdescribed in [2]. The HIRA converts a plane wave in a coaxial waveguide to a spherical wavewhich is launched onto the conical feed arms of a (half) parabolic reflector. Upon reflection, thespherical wave is radiated as a plane wave. Normally, one would want to keep the feed pointregion small in order to minimize pulse distortion; but high voltages preclude that possibility. Topreserve the pulse characteristics, while keeping the feed point dimensions large enough to holdoff high voltages, the HIRA employs a dielectric feed-point lens to manage the conversion of theplane wave to a spherical wave.
An idealized version of a HIRA feed-point lens, employing an inhomogeneous dielectricand an array of guiding conducting sheets, was described in [3]. In [4] a practical lens,constructed from homogeneous dielectric material, was developed. The lens has a prolatespheroidal surface at the interface with the coaxial waveguide and a quartic surface of revolutionat the output interface. In [5], that design was refined by linking the solution of the lensequations to the input impedance at the feed arms. Also, a figure-of-merit for the lens wasdefined based on maximizing the aperture integral of the electric field for the fast impulse. Theanalyses showed that a lens with a relative dielectric constant of 7.0 is optimal for a transitionfrom an oil-filled coaxial waveguide to a feed point in air.
The design approach of [5] assumed a rotationally symmetric lens and conical reflectorfeed arm. This symmetry was computationally convenient, but its application was restricted toreflectors having a focal-length-to-diameter ratio (F/D) of 1/4, with the focus in the apertureplane of the reflector. This limitation was overcome in [6] by the introduction of offset feed-point designs that accommodate larger F/D ratios, while retaining the rotational symmetry of thefeed-point lens.
On the basis of the predictions of [5], we designed a high-voltage HIRA with feed-pointlens, 1.83 m (6 ft) reflector diameter, and a focal-length-to-diameter (F/D) ratio of 1/4. This notedescribes that antenna, its measured impedance (TDR), its radiated field on boresight, and itscharacteristic step response and effective aperture height. Since a high-voltage pulser was notavailable, these measurements were all performed with a low-voltage source. To guide the

3
design of this antenna and to confirm the theoretical predictions of its performance, a scalemodel was first constructed and tested on a ground plane in a laboratory setting. Thosemeasurements were documented in [7], which also documented the selection and evaluation ofthe lens material, an epoxy paint loaded with titanium dioxide pigment. The lens material wasfound to have the desired relative dielectric constant of 7.0, and its breakdown strength wasfound adequate for pulsed high-voltage use.
The work reported in [7] demonstrated the feasibility of the full-scale high-voltage HIRAsystem which is the subject of this note. The system consists of the interface to the pulser, thehigh-voltage oil-filled coaxial feed, the feed-point lens, the radiating elements or feed arms, andthe (half) parabolic reflector. The pulser interface was designed to provide a smooth impedancetransition from the output of the Air Force Research Laboratory's H-5 pulser to the coaxial inputof the HIRA. Since no high-voltage pulser was ultimately available for use in testing the HIRA,an interface to permit a coaxial cable connection to a low-voltage pulser was built instead.
The antenna step response is an impulse with a full-width-at-half-maximum (FWHM) onboresight of 70 ps. Compromises in the feed-point design contributed to impulse broadening andto a reduction in the peak field radiated on boresight. However, the effective aperture height,which is a measure of the area under the impulse, is 0.36 m. This is approximately one-half thedipole moment of the reflector, as expected. Thus, the performance of the antenna is consistentwith both theory and design.
We now describe the full-scale HIRA system design and present measurementscharacterizing its performance.

4
2. HIRA System Design
In applying the feed-point lens design approach introduced in [5], we postulate 100 ΩHIRA driven by an oil-filled coaxial transmission line with a peak driving voltage, V0, of2.6 MV, and a maximum permissible electric field in the transmission line, Emax, of 2 MV/cm.Since the relative dielectric constant of the oil is about 2.2, the impedance of the line is about67 Ω (100 Ω in air). Although the design calculations assume a single conical feed for the halfreflector, this was replaced by a pair of equivalent 200 Ω feed cones, as indicated below.
Within the oil-filled transmission line, we have f Zg = 100 2 2 0.d i , where
Z0 376 727= . Ω is the impedance of free space. Thus, from [8, equation (4.5)], we find that an
outer coaxial conductor radius of about 4 cm will keep the electric field below our postulatedmaximum. From [8, equation (4.3)], the corresponding inner conductor radius is 0.75 cm. Sincethe relative dielectric constant of the lens material is known to be 7.0, only one additionalparameter needs to be specified in order to determine the feed-point lens design. That parameteris the radius of the lens at its output on the ground plane of the half reflector. We selected aradius of 12 cm as adequate to keep the field strength sufficiently low in the space between theemerging center conductor and the ground plane, about 0.3 MV/cm.
Figure 1. Concept for a two-armed HIRA with feed-point lens. In principle, the armsshould intersect on the ground plane at the axis of the lens. The final designemployed a somewhat simpler feed arm design.
Air
Lens
ParabolicReflector
2F
Oil
8.15o
45.0°
GroundPlane

5
The lens equations are solved as described in [5], with reference to the parametersidentified in the following diagram. The coordinate system origin is at the intersection of theground plane with the z-axis, which is an axis of rotational symmetry. The oil-lens interface is a
section of an ellipse of revolution, characterized by major semi-axis, a, and focal distance, d,with center at − + +l l1 2 d . The lens-air interface is a quartic surface of revolution characterizedby the distances from the intersection of that surface with the z-axis, z = l2 , to the focus of thequartic surface, z = 0 , and to the focus of the ellipsoidal surface, z = − +l l1 2 . In terms of theseparameters, the quartic surface is formed by revolution about the z-axis of the locus of pointsgiven by [5, equation (2.1)]
εr z z2 12
1 22
22 2− + + − +FH IK = − + +l l l lΨ Ψb g (2.1)
where ε ε εr 2 2 3= , and in this case (output in air), ε3 10= . .
Figure 2. Design parameters for a rotationally symmetric feed-point lens.
Inner Conductor
GroundPlane
Outer Conductor
OutputCone
ϑ π1 2= /
θ1
θ 0
ϑ0
− +l l1 2b g − + +l l1 2 db g − + + +l l1 2 d ab g l2b gz
Ψ
z2 2,Ψb g
Ψ1
Ψ 0
Air,ε3
Lens,ε2
Oil,ε1z3 3,Ψb g
z1 1,Ψb g
z0 0,Ψb g
Quartic Surface
EllipsoidalSurface

6
The results of the lens design calculations are summarized in the following diagram,which shows a cross section of the lens through the symmetry axis. In the final design, the shapeof the center conductor was modified to improve the impedance within the lens region. The
revised section of the center conductor is shown below, in Figure 4. The reduced diameter of thecenter conductor was intended to ameliorate an impedance drop within the lens region. Such adrop was predicted theoretically and demonstrated experimentally with a scale-model HIRA in[7].
The figure on the next page shows the top-level assembly drawings for the HIRA whichincorporated the lens designed above. Also shown are photographs of the completed HIRA asfielded for testing.
Figure 3. HIRA feed-point lens design. The relative dielectric constant of the lens is 7.0;that of the oil is 2.2.
Figure 4. Modified center conductor with reduced diameter within the section embedded inthe lens. (Dimensions are inches.)
Quartic Surface of Revolution
Ellipsoidal Surface of Revolutiona=4.83; b=4.00; d=2.71
Ground Plane
Center ConductorOuter Conductor
Lens
5.78°55.4°
Oil
Air
Axis of Revolution
2.71
Focus of Ellipse
4.83
Outer Conductor
Focus of Quartic3.57
34.6°
Center ConductorTapered Section
Ø 1.51Ø 8.00
Dimensions are cm(unless noted)
Ø 2.26
Center of Ellipse
l1 = 11.11
l2 = 2.85
Ø 24.00
Ψ
z
Ø 0.345Ø 0.595Ø 0.595
20.75°0.510
0.8153.354

7
Figure 5. HIRA design and hardware.
96" (REF)
36" RAD (REF)
48" (REF)
18" (REF)
8
In the preceding figure, the interface shown below the ground plane in the drawings is notthe one which was built. The interface in the drawings was designed for connecting the HIRA tothe output of the H-5 pulser. Subsequently, Figure 7 presents photographs of the parts of theHIRA that are located below the ground plane, specifically, of the interface to the pulser, of theoil-filled coaxial input line, and of the ellipsoidal surface of the lens.
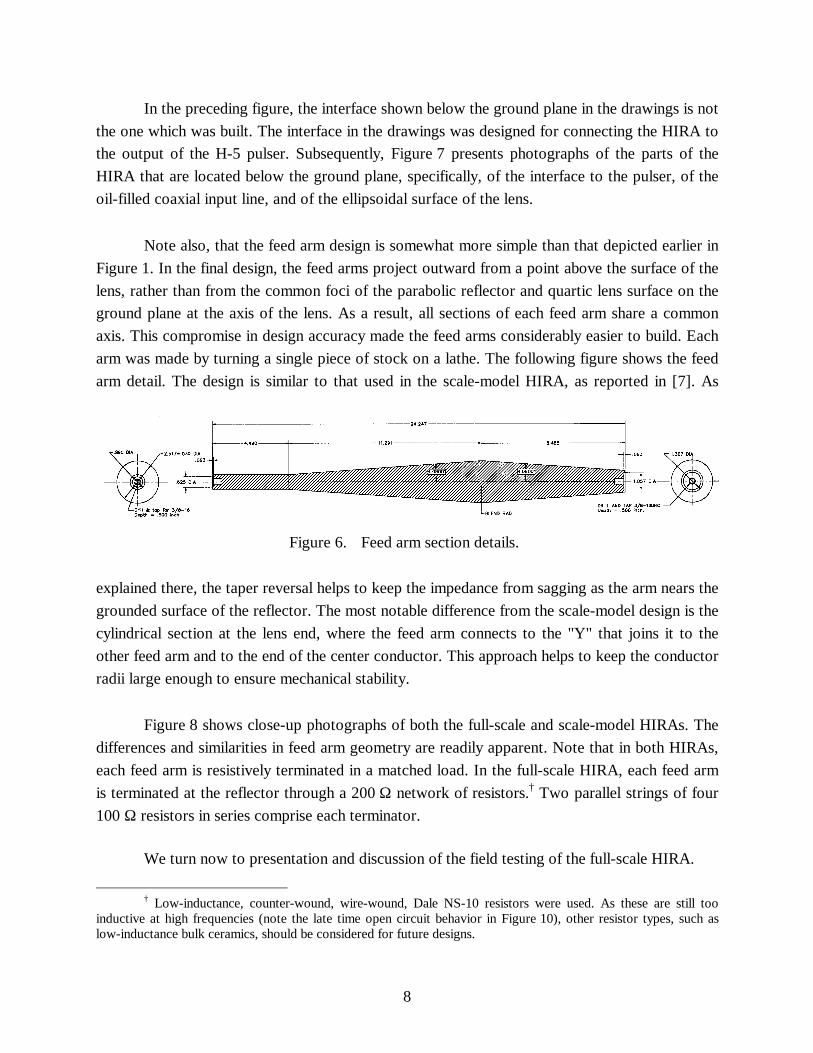
Note also, that the feed arm design is somewhat more simple than that depicted earlier inFigure 1. In the final design, the feed arms project outward from a point above the surface of thelens, rather than from the common foci of the parabolic reflector and quartic lens surface on theground plane at the axis of the lens. As a result, all sections of each feed arm share a commonaxis. This compromise in design accuracy made the feed arms considerably easier to build. Eacharm was made by turning a single piece of stock on a lathe. The following figure shows the feedarm detail. The design is similar to that used in the scale-model HIRA, as reported in [7]. As
explained there, the taper reversal helps to keep the impedance from sagging as the arm nears thegrounded surface of the reflector. The most notable difference from the scale-model design is thecylindrical section at the lens end, where the feed arm connects to the "Y" that joins it to theother feed arm and to the end of the center conductor. This approach helps to keep the conductorradii large enough to ensure mechanical stability.
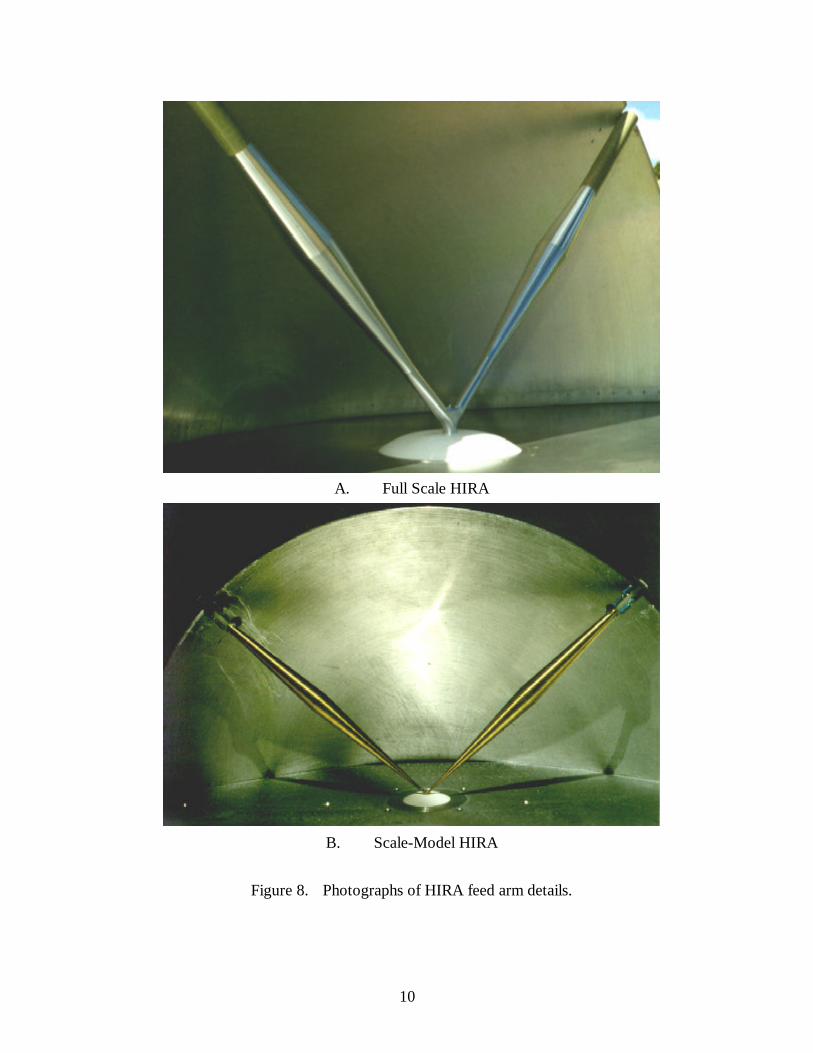
Figure 8 shows close-up photographs of both the full-scale and scale-model HIRAs. Thedifferences and similarities in feed arm geometry are readily apparent. Note that in both HIRAs,each feed arm is resistively terminated in a matched load. In the full-scale HIRA, each feed armis terminated at the reflector through a 200 Ω network of resistors.† Two parallel strings of four100 Ω resistors in series comprise each terminator.
We turn now to presentation and discussion of the field testing of the full-scale HIRA.
† Low-inductance, counter-wound, wire-wound, Dale NS-10 resistors were used. As these are still too
inductive at high frequencies (note the late time open circuit behavior in Figure 10), other resistor types, such aslow-inductance bulk ceramics, should be considered for future designs.
Figure 6. Feed arm section details.

9
Figure 7. HIRA components located below the ground plane.
A Base of lens mount, showingellipsoidal surface of lens andcenter conductor.
B 67 Ω coaxial input section.
C Completed input assembly, in-cluding tapered 50 Ω to 67 Ω inter-face. The base of the oil expansionreservoir is visible near the leftcenter edge of the photograph.
A B
C
10
Figure 8. Photographs of HIRA feed arm details.
A. Full Scale HIRA
B. Scale-Model HIRA

11
3. HIRA Testing
The HIRA was assembled for outdoor testing in a remote area northwest of the Air ForceResearch Laboratory's HERTF on Kirtland AFB. Test equipment included a modifiedPicosecond Pulse Labs Model 4600 step generator, which produces a 21 V step at 50 Ω , aTektronix 11801B digital sampling oscilloscope with SD24 sampling/TDR head and 2 mextender cable, and a prototype of the standard Farr Research 50 Ω replicating TEM sensor(Figure 9). Also available were interconnecting RF signal cables, trigger cable, and calibrated
high-voltage RF attenuators. A portable generator supplied power for the test equipment. A 9Xtelescopic sight with an aluminum channel mount was used as an aid to antenna and sensoralignment.
3.1 Impedance Measurement
The impedance of the HIRA system was measured with the Tektronix 11801B by drivingthe antenna through a 2 ft semi-rigid coax with the 30 ps step pulse of the SD24 sampling head.The resulting TDR is shown below in Figure 10, along with annotations identifying the parts ofthe system responsible for the observed features. The lens assembly accounts for a relativelybrief but large impedance discontinuity. Although this HIRA TDR profile closely parallels thatof the scale-model HIRA shown in [7, Figure 5-4], there are several differences. For example,the larger size of the HIRA permits the SD24 TDR pulse to better resolve impedance
Figure 9. Replicating 50 Ω TEM sensor. (Dimensions are inches. The original prototype isshown here. We actually used a later version, in which Teflon® posts were usedin place of foam to support the conducting strip.)

12
fluctuations. Also, there is a shoulder on the rising portion of the profile corresponding to the exitfrom the lens; and the impedance rises to 115 Ω before declining. This behavior may be causedby a combination of the "Y" connector for the feed arms and the cylindrical sections at the baseof each feed arm. Beyond the arms, the impedance rises sharply, as the somewhat inductivetermination is encountered.
3.2 Radiated Electric Field Measurements
3.2.1 Test Site Configuration
Figure 11 depicts the arrangement of the HIRA and TEM sensor for radiated electric fieldmeasurements. The ground at the test site was packed dry soil with typical desert vegetation(Figure 5). The surface was mostly flat, with a slight uphill grade from the HIRA to the sensorlocations. The HIRA ground plane was mounted on an adjustable Unistrut® frame at a height ofapproximately 2.78 m. The sensor was mounted on a tripod with extended elevator section at aheight of 2.43 m. The frame holding the HIRA was tipped so that the boresight would run
Figure 10. Impedance of the HIRA assembly.
0 2 4 6 8 10 12 14 16 1840
50
60
70
80
90
100
110
120TDR - HIRA with Lens
Time (ns)
Impe
danc
e ( Ω
)
Cab
le
Con
nect
ors
Oil-
fille
dC
oax
Tape
red
Inte
rface
Coa
xial
Feed
Ellip
soid
Lens
Feed
Arm
s
Term
inat
ion

13
approximately parallel to the ground surface. A 9X telescopic sight mounted on the HIRAground plane was used in adjusting the sensor to a position directly on boresight. Then, thetelescopic sight was moved to the sensor ground plane and used to align the sensor with theboresight direction.
3.2.2 Test Equipment Configuration
The experimental test configuration for the HIRA measurements is shown below. ThePicosecond Pulse Labs 4600 step generator drives the HIRA through a type SMA connector
mounted at the base of the oil-filled input section (Figure 7C). The length of the interconnectingcable was 1.9 m. On the receive end, the Farr Research TEM sensor receives the signal, which isthen passed through the 8.6 m signal cable and sampled by the SD24 sampling head and theTektronix 11801B digital sampling oscilloscope. Data is stored in the NVRAM of the
Figure 11. Physical layout of HIRA and TEM sensor for radiated field measurements. Thetime-of-flight for the ground bounce path is 1.3 ns longer than the direct path whenthe sensor is 35 m from the HIRA; it is 2.2 ns longer when the sensor is at 20 m.
Figure 12. Experimental test setup for measuring HIRA radiation characteristics.
35.0m.
2.61m.2.78m.
2.43m.
HIRA TEM Sensor
Ground Bounce Ray Path
TEM Sensor20.0m.Direct Ray Path
PSPL 4600Step Generator
SD24Sampling
Head
Tektronix11801B DigitalSampling Scope
1.9 m RFSignalCable
8.6 m RFSignalCable
2 mExtender
Cable
HIRA Farr Research TEM Sensor
TriggerCable

14
oscilloscope and subsequently downloaded to a computer for processing by way of a GPIBconnection. The signal to trigger the 11801B was supplied by the step generator. The rather longsignal cable on the receive end provided additional delay to permit the 11801B to synchronizereliably with the step generator.
The TEM sensor was calibrated previously, as described in [9]. Its impulse response isshown below in Figure 13. The step generator output and its derivative, as seen through the10.5 m total of the signal cable lengths, are shown in Figure 14. The long cables lead to a 5%attenuation of the step height to 19.5 V, and nearly double the FWHM of the derivative from75 ps to 140 ps. The derivative is also non-gaussian. These cable effects have no significantimpact on determination of the HIRA step response, however, as both the source and the sensorresponse are deconvolved from the raw data during signal processing.
Figure 13. TEM sensor response in time and frequency domains.
Figure 14. Voltage step and its derivative, through a 10.5 m length of RF signal cable. Themaximum height of the step is 19.5 V. The FWHM of the derivative is about 140 ps.
10-1 100 101 10210-4
10-3
10-2
10-1Impulse Frequency Response, Prototype 50 Ω TEM Sensor
Frequency (GHz)
|h( ω
)| (m
)
0 1 2 3 4 5 6 7 8 9 10-0.1
0
0.1
0.2
0.3
0.4
0.5
0.6Impulse Response, Prototype 50 Ω TEM Sensor
Time (ns)
h(t)
(m/n
s)
0 1 2 3 4 5 6 7 8 9 100
2
4
6
8
10
12
14
16
18
20Source
Time (ns)
Vol
ts
0 1 2 3 4 5 6 7 8 9 10-10
0
10
20
30
40
50
60
70
80
90Derivative of Source
Time (ns)
Vol
ts/n
s

15
3.2.3 Signal Processing
The voltage waveform as received by the SD24 sampling head contains contributionsfrom the sensor impulse response, the HIRA step response, and the driving step function source.From [10] we know that the received voltage can be represented as the convolution of the sensorimpulse response with the incident electric field, as
V r t h t E r trecSENSOR SENSOR
inc, ,b g b g b g= τ o (3.1)
where τ SENSOR is the transmission coefficient from the impedance of the sensor (50 Ω in ourcase) to the 50 Ω impedance of the cable at the output of the sensor (so that τ SENSOR = 10. ).
Similarly, the field radiated to a distance, r, from the aperture plane of the HIRA isrelated to the convolution of the antenna step response with the derivative of the source voltageat the feed arms of the reflector, as
E r tc f r
h tdV t
dtrad
gHIRA
arms
,b g d i b g b g= 12π
o (3.2)
where fg is the normalized impedance of the antenna, ZHIRA /Zo, and the driving function at thefeed arms is related to the drive at the feed cable of the source by
dV tdt
dV tdt
arms
HIRA
srcb g b g= τ (3.3)
where τ HIRA is the transmission coefficient from the 50 Ω feed cable impedance to the 100 Ωimpedance of the HIRA feed arms.
Since a convolution with an impulse-like function can be approximated by amultiplication by the area under the impulse, we can define an effective aperture height by
E r th
c f rdV t
dt
h h t dt
rad HIRA eff
g
src
eff HIRA
,
Impulse
b g d ib g
b g≈
= zτπ2 (3.4)

16
From symmetry arguments, the integral in (3.4) is also one half of the dipole moment of theHIRA, or a ( )2 2 , where a is the radius of the reflector. This can be used to predict HIRAperformance.
Now, by equating the radiated field in (3.2) to the incident field in (3.1), and using (3.3),we obtain
V r tc f r
h t h tdV t
dtrec SENSOR HIRA
gSENSOR HIRA
src
,b g d i b g b g b g= τ τπ2
o o (3.5)
Thus, by deconvolving the sensor response from the received voltage, we can obtain a measureof the radiated electric field at the sensor location. Furthermore, by deconvolving both the sensorresponse and the source derivative from the received voltage, we can obtain the HIRA stepresponse.
3.2.4 Test Protocol and Data Analysis
Measurements of the electric field radiated by the HIRA were made on boresight atdistances of both 35 and 20 meters from the focus of the reflector, as indicated previously inFigure 11. Data were also obtained at representative offsets from boresight. Signal processinggenerally employed the techniques of [11, Section III], and followed the approach outlinedabove.
On the top left in Figure 15, is the raw waveform observed on boresight at 35 m. Theprimary HIRA response is the impulse at 4.2 ns, with a FWHM of 216 ps. The inverted peakbeginning at about 5.5 ns is ground bounce. On the top right, is the raw waveform after time-gating out the ground bounce. The bottom two graphs compare the corresponding frequencydomain step responses. Note the absorption bands which are contributed by the radiationreflected from the ground when ground bounce is retained. We routinely time-gated out groundbounce and later contributions to the received waveforms prior to any other signal processing.

17
To process the raw test data, we first establish the values of the time-independentparameters appearing in equations (3.1) through (3.5). Since the impedance of the sensor and ofthe cable to the SD24 sampling head were both 50 Ω , the voltage transmitted to the samplinghead is the same as that received at the sensor aperture. Thus, τ SENSOR = 1.0. In contrast, we sawin Figure 10 that both the step generator output and feed cable impedance were 50 Ω , while theHIRA feed arm impedance was approximately 100 Ω . We assume an abrupt impedancetransition and write
Figure 15. Impact of ground bounce. The top two graphs show raw received signal before (left)and after (right) removal of the ground bounce peak. The bottom two graphs showthe corresponding frequency domain step responses. Note the soil absorption bandsin the left graph, where ground bounce is retained.
0 1 2 3 4 5 6 7 8 9 10-0.01
-0.005
0
0.005
0.01
0.015
0.02
0.025Received Signal, HIRA with Lens, 35m, On Boresight
Time (ns)
Vre
c (t) (v
olts
)
0 1 2 3 4 5 6 7 8 9 10-0.005
0
0.005
0.01
0.015
0.02
0.025Received Signal, HIRA with Lens, 35m, On Boresight
Time (ns)
Vre
c (t) (v
olts
)
10-1 100 10110-3
10-2
10-1
100Step Frequency Response, HIRA with Lens, 35m, On Boresight
Frequency (GHz)
|h( ω
)| (m
)
10-1 100 10110-3
10-2
10-1
100Step Frequency Response, HIRA with Lens, 35m, On Boresight
Frequency (GHz)
|h( ω
)| (m
)
18
τ HIRAHIRA
HIRA PULSER
ZZ Z
=+
2(3.6)
finding τ HIRA = 1.33. Also, since ZHIRA = 100 Ω , we have fg = 0.2654.
In presenting the radiated field obtained by deconvolving the sensor response from thereceived voltage, it is convenient to introduce normalized units. Thus, instead of graphingE r trad ,b g and, in the frequency domain, E rrad ,ωb g, we present the corresponding values ofrE Vrad
o/ , where Vo is a reference voltage. In the far-field,‡ this normalized function isindependent of the range, r. In the time domain, it is dimensionless; in the frequency domain, itsunits are 1/GHz. For the reference voltage, we choose the maximum of the voltage step appliedat the feed arms. From Figure 14, the maximum voltage at the HIRA input, V src
max , is 19.5 V.Thus, from V Vo HIRA
src= τ max , we obtain 25.9 V at the feed arms.
The normalized radiated field data are presented in Figure 16. The impulse maxima areapproximately equal for both 35 m and 20 m ranges, as we would expect for far-fieldmeasurements. The magnitude, 2.0, is about half the predicted value for our driving source [12,equation (5.1), et seq.]. Although boresight alignment error and reflection losses may contributeto this difference, the primary cause is probably the compromise we made in design of the feedpoint. Recall that there is a minor offset between the apparent intersection of the feed arms andthe focus of the reflector (see Figure 8A). This leads to some broadening of the impulse, thusreducing its maximum.
Next, the data are processed to extract h tHIRAb g, the HIRA response to a step input. Thesestep response results are presented in Figure 17. On boresight, we see an impulse with a FWHMof about 70 ps and maximum in the 3.2 to 3.8 m/ns range. As with the normalized fields, the on-boresight step response should be independent of range. Finally, in Figure 18, we provide theintegral of this impulse. From (3.4), the jump in the integral of h tHIRAb g gives us the effective
‡ Specification of what constitutes the far-field for an impulse field is open to some discussion. As a working
definition, we assume that a range greater than 3 22a ctr , where a is the reflector radius, is in the far-field. For a
gaussian impulse, the rise time is about 1.09 times the FWHM [12]. The FWHM of our source is about 140 ps,
leading to a far-field range of 27 m. The FWHM of the radiated impulse is at least 212 ps, corresponding to a far-
field range of only 18 m. On the basis of these observations, it appears safe to conclude that our 20 m
measurement location was at the near edge of the far-field, while the 35 m measurements were clearly within the
far-field.

19
aperture height of the HIRA, heff . On boresight, we obtain approximately 0.36 m. Since thereflector radius is 0.9144 m (36 inches), we expect to see 0 9144 2 2 0 32. .( ) = m. Thus, our heff
is only about 11% higher than expected; and we conclude that our measurement is consistentwith theory.
The following table summarizes the results of the HIRA measurements.
Range Position Relative toBoresight
Radiated Field(Normalized)
Step Response EffectiveAperture
(meters) Distance(meters)
Angle(degrees)
Peak FWHM(ps)
Peak(m/ns)
FWHM(ps)
Height(meters)
0. 0. 2.00 212. 3.76 70. 0.3590.6 1. 1.86 230. 2.94 84. 0.363
35.
1.2 2. 1.60 275 1.84 170. 0.3560. 0. 1.87 222. 3.22 76. 0.35220.1.6 5. 1.03 482. 0.88 300. 0.349

20
Figure 16. Normalized radiated electric fields at 35 and 20 meter ranges, both on and offboresight. The reference voltage, Vo, is 25.9 volts.
0 1 2 3 4 5 6 7 8 9 10-0.5
0
0.5
1
1.5
2
2.5Normalized Radiated Field, HIRA with Lens, 35m, On Boresight
Time (ns)
r Era
d (t)/V
o (di
men
sion
less
)
10-1 100 10110-3
10-2
10-1
100Normalized Radiated Field (Frequency Domain) HIRA with Lens, 35m, On Boresight
Frequency (GHz)
|r E
rad ( ω
)/Vo|
(GH
z-1)
0 1 2 3 4 5 6 7 8 9 10-0.5
0
0.5
1
1.5
2Normalized Radiated Field, HIRA with Lens, 35m, 0.6m Off Boresight
Time (ns)
r Era
d (t)/V
o (di
men
sion
less
)
0 1 2 3 4 5 6 7 8 9 10-0.2
0
0.2
0.4
0.6
0.8
1
1.2
1.4
1.6Normalized Radiated Field, HIRA with Lens, 35m, 1.2m Off Boresight
Time (ns)
r Era
d (t)/V
o (di
men
sion
less
)
0 1 2 3 4 5 6 7 8 9 10-0.5
0
0.5
1
1.5
2Normalized Radiated Field, HIRA with Lens, 20m, On Boresight
Time (ns)
r Era
d (t)/V
o (di
men
sion
less
)
0 1 2 3 4 5 6 7 8 9 10-0.4
-0.2
0
0.2
0.4
0.6
0.8
1
1.2Normalized Radiated Field, HIRA with Lens, 20m, 1.6m Off Boresight
Time (ns)
r Era
d (t)/V
o (di
men
sion
less
)

21
Figure 17. Step response of the HIRA, as observed from 35 and 20 meter ranges, both on andoff boresight.
10-1 100 10110-3
10-2
10-1
100Step Frequency Response, HIRA with Lens, 35m, On Boresight
Frequency (GHz)
|h( ω
)| (m
)
0 1 2 3 4 5 6 7 8 9 10-0.5
0
0.5
1
1.5
2
2.5
3
3.5
4Step Response, HIRA with Lens, 35m, On Boresight
Time (ns)
h(t)
(m/n
s)
0 1 2 3 4 5 6 7 8 9 10-0.5
0
0.5
1
1.5
2
2.5
3Step Response, HIRA with Lens, 35m, 0.6m Off Boresight
Time (ns)
h(t)
(m/n
s)
0 1 2 3 4 5 6 7 8 9 10-0.5
0
0.5
1
1.5
2Step Response, HIRA with Lens, 35m, 1.2m Off Boresight
Time (ns)
h(t)
(m/n
s)
0 1 2 3 4 5 6 7 8 9 10-0.5
0
0.5
1
1.5
2
2.5
3
3.5Step Response, HIRA with Lens, 20m, On Boresight
Time (ns)
h(t)
(m/n
s)
0 1 2 3 4 5 6 7 8 9 10-0.2
0
0.2
0.4
0.6
0.8
1
1.2Step Response, HIRA with Lens, 20m, 1.6m Off Boresight
Time (ns)
h(t)
(m/n
s)

22
Figure 18. Integral of HIRA step response, as observed at 35 and 20 m ranges, on boresight.The jump in the integral is the effective aperture height. It is the area underimpulse of h tHIRAb g.
0 1 2 3 4 5 6 7 8 9 10-0.25
-0.2
-0.15
-0.1
-0.05
0
0.05
0.1
0.15
0.2Integral of Step Response, HIRA with Lens, 20m, On Boresight
Time (ns)
h (m
)
0 0.5 1 1.5 2 2.5 3-0.05
0
0.05
0.1
0.15
0.2
0.25
0.3
0.35Integral of Step Response, HIRA with Lens, 20m, On Boresight
Time (ns)
h (m
)
0 1 2 3 4 5 6 7 8 9 10-0.2
-0.15
-0.1
-0.05
0
0.05
0.1
0.15
0.2Integral of Step Response, HIRA with Lens, 35m, On Boresight
Time (ns)
h (m
)
0 0.5 1 1.5 2 2.5 3-0.05
0
0.05
0.1
0.15
0.2
0.25
0.3
0.35
0.4Integral of Step Response, HIRA with Lens, 35m, On Boresight
Time (ns)
h (m
)

23
4. Conclusions
The measured effective aperture height of the antenna is approximately 11% greater thanthe theoretical value. The antenna step response is an impulse with a FWHM on boresight of70 ps. As a result of impulse broadening arising from compromises in the feed-point design, thepeak electric field radiated on boresight is reduced. This has no effect, however, on the areaunder the impulse. We conclude that the antenna performance is consistent with both theory anddesign.
Acknowledgments
We would like to thank Dr. Carl E. Baum, of the Air Force Research Laboratory, formany insightful discussions that contributed to this effort. We would also like to thank Mr.William D. Prather, also of the Air Force Research Laboratory, for arranging funding for thiswork.
24
References
1. C. E. Baum, Variations on the Impulse-Radiating Antenna Theme, Sensor and SimulationNote 378, February 1995.
2. E. G. Farr and C. E. Baum, Impulse Radiating Antennas with Two Reflecting or RefractingSurfaces, Sensor and Simulation Note 379, May 1995.
3. C. E. Baum and A. P. Stone, Transient Lens Synthesis: Differential Geometry inElectromagnetic Theory, Appendix I, Taylor and Francis, New York, 1991.
4. E. G. Farr and C. E. Baum, Feed-Point Lenses for Half Reflector IRAs, Sensor AndSimulation Note 385, November 1995.
5. W. S. Bigelow, E. G. Farr, and G. D. Sower, Design Optimization of Feed-Point Lenses forHalf Reflector IRAs, Sensor and Simulation Note 400, August 1996.
6. W. S. Bigelow and E. G. Farr, Design of a Feed-Point Lens with Offset Inner Conductor fora Half Reflector IRA with F/D Greater than 0.25, Sensor and Simulation Note 410,September 1997.
7. G. D. Sower, L. M. Atchley, D. E. Ellibee, W. S. Bigelow, and E. G. Farr, Design for HalfImpulse Radiating Antennas: Lens Material Selection and Scale-Model Testing,Measurement Note 54, February 1998.
8. E. G. Farr, G. D. Sower, and C. J. Buchenauer, Design Considerations for Ultra-Wideband,High-Voltage Baluns, Sensor and Simulation Note 371, October 1994.
9. E. G. Farr, C. E. Baum, and W. D. Prather, Multifunction Impulse Radiating Antennas:Theory and Experiment, Sensor and Simulation Note 413, November 1997.
10. E. G. Farr, E. E. Baum, and C. J. Buchenauer, “Impulse Radiating Antennas, Part II,” p. 159-170, in Ultra-Wideband, Short-Pulse Electromagnetics 2, New York, Plenum Press, 1995.
11. E. G. Farr and C. A. Frost, Compact Ultra-Short Pulse Fuzing Antenna Design andMeasurements, Sensor and Simulation Note 380, June 1995.
12. E. G. Farr and G. D. Sower, Design Principles of Half Impulse Radiating Antennas, Sensorand Simulation Note 390, December 1995.