Embed Size (px)
Citation preview

Alma Mater Studiaorum - Universita di Bologna
Dottorato di Ricerca in
Meccanica e Scienze Avanzate dell Ingegneria
Disegno e Metodi dell’Ingegneria Industriale
e Scienze Aerospaziali
Ciclo XXV II
Settore Concorsuale di Afferenza: 09/A1 - Ingegneria Aerospaziale
Settore Scientifico Disciplinare: ING-IND/03 - Meccanica del volo
Design and Prototyping High Endurance
Multi-Rotor
Coordinatore del Dottorato Presentata da:
Chia.mo Prof. Vincenzo Parenti Castelli Mauro Gatti
Relatore
Chia.mo Prof. Fabrizio Giulietti
Esame Finale - Anno 2015

ii

Theory is when we know everything but nothing works.
Praxis is when everything works but we do not know why.
We always end up by combining theory with praxis:
nothing works and we do not know why.
Albert Einstein
iii

iv

Acknowledgments
This thesis is submitted in partial fulfillment of the requirements for the Doctor of
Philosophy in Advanced Mechanics and Sciences of Engineering: Design and Methods of
Industrial Engineering’. The work has been carried out under the supervision of Prof. Fab-
rizio Giulietti.
I would like to thank Prof. Fabrizio Giulietti for his guidance during the research work
and all the other people that work inside that strange place that is the Flight Mecanics
Laboratory.
Mauro Gatti
May 2015, Forlı, Italy
v

vi
Summary
The topic of this thesis focus on the preliminary design and the performance analysis of
a multirotor platform. A multirotor is an electrically powered Vertical Take Off (VTOL)
machine with more than two rotors that lift and control the platform. Multirotor are agile,
compact and robust, making them ideally suited for both indoor and outdoor application
especially to carry-on several sensors like electro optical multispectral sensor or gas sensor.
The main disadvantage is the limited endurance due to heavy Li-Po batteries and high disk
loading through the use of different small propellers. At the same time, the design of the
multirotor does not follow any engineering principle but it follow the ideas of amateurs’
builder. An adaptation of the classic airplane design theory for the preliminary design is
implemented to fill the gap and detailed study of the endurance is performed to define the
right way to make this kind of VTOL platforms.
vii

viii

Contents
List of Figures xi
List of Tables xiii
1 Introduction 1
1.1 Motivation . . . . . . . . . . . . . . . . . . . . . . . . . . . . . . . . . . . . 1
1.2 Literature Review and Thesis Objectives . . . . . . . . . . . . . . . . . . . 2
1.3 Outline . . . . . . . . . . . . . . . . . . . . . . . . . . . . . . . . . . . . . . 2
2 System Description 3
2.1 Multi-Rotor platforms . . . . . . . . . . . . . . . . . . . . . . . . . . . . . 3
2.1.1 Coaxial rotor configuration . . . . . . . . . . . . . . . . . . . . . . . 7
2.2 Driving System . . . . . . . . . . . . . . . . . . . . . . . . . . . . . . . . . 9
2.2.1 Electric Motors . . . . . . . . . . . . . . . . . . . . . . . . . . . . . 9
2.2.2 Electronic Speed Control (ESC) . . . . . . . . . . . . . . . . . . . . 12
2.2.3 Propeller . . . . . . . . . . . . . . . . . . . . . . . . . . . . . . . . . 13
2.3 Batteries . . . . . . . . . . . . . . . . . . . . . . . . . . . . . . . . . . . . . 14
2.3.1 Discharge battery model and approximation . . . . . . . . . . . . . 21
2.4 Main electronics/avionics systems . . . . . . . . . . . . . . . . . . . . . . . 26
2.5 Payload . . . . . . . . . . . . . . . . . . . . . . . . . . . . . . . . . . . . . 28
3 Preliminary Design Methodology 33
3.1 Requirements and Constraints . . . . . . . . . . . . . . . . . . . . . . . . . 33
3.2 Take-Off Weight Buildup . . . . . . . . . . . . . . . . . . . . . . . . . . . . 35
ix

CONTENTS
3.2.1 Commercial Multirotor analysis and Empty-Weight Estimation . . . 36
3.2.2 Determination of the battery mass . . . . . . . . . . . . . . . . . . 36
3.2.3 Rotorcraft Power Requirements . . . . . . . . . . . . . . . . . . . . 38
3.2.4 Analysis and Results . . . . . . . . . . . . . . . . . . . . . . . . . . 39
4 Best Endurance Condition 45
4.1 The endurance for electrical RPAS . . . . . . . . . . . . . . . . . . . . . . 45
4.1.1 Constant Battery Voltage during the discharge . . . . . . . . . . . . 47
4.1.2 Definition of the Figure of Merit . . . . . . . . . . . . . . . . . . . . 48
4.1.3 Thrust and Power Measurement . . . . . . . . . . . . . . . . . . . . 48
4.1.4 A new approximation of FM . . . . . . . . . . . . . . . . . . . . . . 52
4.1.5 Maximum endurance condition . . . . . . . . . . . . . . . . . . . . 52
4.1.6 Analysis and Results . . . . . . . . . . . . . . . . . . . . . . . . . . 56
Bibliography 65
x

List of Figures
2.1 Oehmichen Quadrotor . . . . . . . . . . . . . . . . . . . . . . . . . . . . . 4
2.2 Bothezat Quadrotor . . . . . . . . . . . . . . . . . . . . . . . . . . . . . . 4
2.3 Quadrotor movements: (a) hover, (b) roll, (c) pitch, and (d) yaw . . . . . . 6
2.4 Coaxial rotor system . . . . . . . . . . . . . . . . . . . . . . . . . . . . . . 7
2.5 FM for a coaxial rotor compared to measurement [11] . . . . . . . . . . . . 8
2.6 Speed Constant (Kv) as a function of motor mass . . . . . . . . . . . . . . 10
2.7 Motor maximum output power as a function of motor mass (selection of 4
manufacturers) . . . . . . . . . . . . . . . . . . . . . . . . . . . . . . . . . 11
2.8 Motor maximum output power as a function of motor mass (trend) . . . . 11
2.9 Speed constant as a function of motor mass (selection of 4 manufacturers) 12
2.10 ESC cont. current vs mass . . . . . . . . . . . . . . . . . . . . . . . . . . . 13
2.11 ESC volume vs mass . . . . . . . . . . . . . . . . . . . . . . . . . . . . . . 14
2.12 ηp vs J of Graupner 11x8 propeller [21] . . . . . . . . . . . . . . . . . . . . 15
2.13 T-Motor 13x4.4 Carbon V2 . . . . . . . . . . . . . . . . . . . . . . . . . . 16
2.14 Specific Energy vs Energy density for several type of battery [28] . . . . . . 17
2.15 Battery capacity as a function of battery mass . . . . . . . . . . . . . . . . 19
2.16 Battery capacity as a function of battery mass trend line . . . . . . . . . . 20
2.17 Battery capacity as a function of battery mass (FlightPower) . . . . . . . . 20
2.18 Battery capacity as a function of Volume (FlightPower) . . . . . . . . . . . 21
2.19 Example of Li-Po battery discharge curves [27] . . . . . . . . . . . . . . . . 22
2.20 Voltage vs Capacity - Dualsky battery pack I . . . . . . . . . . . . . . . . 23
2.21 Voltage vs Elapsed time of discharge - Dualsky battery pack I . . . . . . . 24
2.22 Voltage vs Capacity - Dualsky battery pack II . . . . . . . . . . . . . . . . 25
xi

LIST OF FIGURES
2.23 Voltage vs Elapsed time of discharge - Dualsky battery pack II . . . . . . . 26
2.24 General scheme of multi-rotor avionics (i.e. DJI NAZA) . . . . . . . . . . . 27
2.25 Avionics volume vs mass . . . . . . . . . . . . . . . . . . . . . . . . . . . . 27
2.26 Zenmuse Gimbals (DJI) . . . . . . . . . . . . . . . . . . . . . . . . . . . . 29
2.27 Zenmuse H4-3D (DJI) . . . . . . . . . . . . . . . . . . . . . . . . . . . . . 29
2.28 Wgimbals & Wcamera vs W0 [DJI] . . . . . . . . . . . . . . . . . . . . . . . . 30
2.29 Wpay vs W0 [DJI] . . . . . . . . . . . . . . . . . . . . . . . . . . . . . . . . 31
2.30 Wpay vs W0 coomercial database . . . . . . . . . . . . . . . . . . . . . . . . 31
3.1 Empty Weight fraction Trend . . . . . . . . . . . . . . . . . . . . . . . . . 37
3.2 Multi-rotor Hovering Observation Mission . . . . . . . . . . . . . . . . . . 39
3.3 Disk Loading versus Empty Weight . . . . . . . . . . . . . . . . . . . . . . 43
4.1 IAI ETOP . . . . . . . . . . . . . . . . . . . . . . . . . . . . . . . . . . . . 46
4.2 Figure of Merit prediction made with modified momentum theory [11] . . . 49
4.3 Test Banch used for FM acquisition . . . . . . . . . . . . . . . . . . . . . . 50
4.4 Experimental value of FM . . . . . . . . . . . . . . . . . . . . . . . . . . . 51
4.5 Experimental trend of FM . . . . . . . . . . . . . . . . . . . . . . . . . . . 51
4.6 Rotor FM with a thrust value of T0 = 55% . . . . . . . . . . . . . . . . . . 52
4.7 Multirotor platform used for validation . . . . . . . . . . . . . . . . . . . . 57
4.8 Measured rotor thrust and power as a function of the throttle . . . . . . . 58
4.9 Rotor figure of merit as a function of the throttle . . . . . . . . . . . . . . 59
4.10 Hovering time as a function of the battery ratio . . . . . . . . . . . . . . . 60
4.11 Endurance error of approximate models in the range 50-70% of the motor
throttle . . . . . . . . . . . . . . . . . . . . . . . . . . . . . . . . . . . . . 61
4.12 Experimental validation . . . . . . . . . . . . . . . . . . . . . . . . . . . . 62
xii

List of Tables
2.1 General characteristics of rechargeable Battery Chemistries . . . . . . . . . 17
2.2 lythium Polymer Battery Voltage . . . . . . . . . . . . . . . . . . . . . . . 19
2.3 Dualsky nominal and experimental specification . . . . . . . . . . . . . . . 23
2.4 Average value acquired during discharge test . . . . . . . . . . . . . . . . . 25
2.5 Multirotor average data . . . . . . . . . . . . . . . . . . . . . . . . . . . . 28
2.6 Avionics components average weight & volume . . . . . . . . . . . . . . . . 28
2.7 Payload data from DJI . . . . . . . . . . . . . . . . . . . . . . . . . . . . . 30
3.1 Example of Commercial Multirotor Data available . . . . . . . . . . . . . . 37
3.2 Average Values from Manufacturers . . . . . . . . . . . . . . . . . . . . . . 40
3.3 Aeromechanical Coefficients . . . . . . . . . . . . . . . . . . . . . . . . . . 40
3.4 Power need, battery & motor characteristics . . . . . . . . . . . . . . . . . 41
3.5 Scorpion DC engine char. . . . . . . . . . . . . . . . . . . . . . . . . . . . 41
3.6 ESC char. . . . . . . . . . . . . . . . . . . . . . . . . . . . . . . . . . . . . 41
3.7 Results of the iterative calculation . . . . . . . . . . . . . . . . . . . . . . . 42
3.8 Preliminary design results . . . . . . . . . . . . . . . . . . . . . . . . . . . 42
3.9 Disk Loading versus We . . . . . . . . . . . . . . . . . . . . . . . . . . . . 43
4.1 Relevant parameters of a selection of existing platforms . . . . . . . . . . . 55
4.2 Multi-rotor platform parameters . . . . . . . . . . . . . . . . . . . . . . . . 56
4.3 Experimental results . . . . . . . . . . . . . . . . . . . . . . . . . . . . . . 63
xiii

LIST OF TABLES
xiv

Nomenclature
List of Symbols
At Total Disk Area
C Battery Capacity
C0 Effective Initial Battery Capacity
Cp Power Coefficient
Ct Thrust Coefficient
f ;FM Figure of Merit
i Current Intensity
k Peukert Coefficient
Kv Speed Constant
n Number of rotors
Pact Actual Power
Pap Power Required for autopilot and payload
Ppl Power Required for payload
Pr Power Required
Prtot Total Power Required
Ph Power Required in hovering Condition
q Dynamic Pressure
Rt Battery Hour Rating (in hours)
t Time
T Rotor Thrust
xv

LIST OF TABLES
List of Symbols
v,V Battery Voltage
Vi Induced Velocity
Wb Battery Weight
We Empty Weight
Weo Operative Empty Weight
Welsys Electronic System Weight
Wp Payload Weight
Wpp Power Plant Weight
Wto,W0 TakeOff Gross Weight
Greek symbols
ρ Air density at z
ηb Effectve Battery Capacity Ratio
ηe Elictrical Efficiency
ηm Mechanical Efficiency
ηp Propeller Efficiency
Ω Rotatio Rate
xvi

LIST OF TABLES
Acronyms
BLOS Beyond Visual Line-Off-Sight
BRLOS Beyond Radio Line-Off-Sight
COM SP COMmunication Service Provider
CS-LUAS Certification Specifications for Light Unmanned Aircraft
CS-LURS Certification Specifications for Light Unmanned Rotorcraft
EASA European Aviation Safety Agency
ENAC Enta Nazinale per l’ Aviazione Civile
GPS Global Position System
IMU Inertial Measuring Unit
JARUS Joint Authorities for Rulemaking on Unmanned Systems
LED Light Emission Diode
MC Main Controller
MTOW Maximum Take Off Weight
PMU Power Management Unit
RLOS Radio Line-Off-Sight
RPAS Remotely Piloted Aerial Systems
TLS Tolerable Level of Safety
VLOS Visual Line-Of-Sight
VTOL Vertical take Off and Landing
xvii

LIST OF TABLES
xviii

CHAPTER 1
Introduction
1.1 Motivation
The interest in electrically powered Remotely Piloted Aerial Systems (RPAS) among in-
dustry and academia has shown a steep increase along the last decade. This is mostly due
to the potentiality of such platforms to play a leading role within a wide range of applica-
tions in the field of aerial photography and 3D reconstruction [1], search and rescue [2] and
risk management, natural landscape monitoring, and disaster prevention [3]. In particular,
among the available fixed and rotary-wing configurations, multi-rotor platforms gained a
particular relevance, thanks to the simple configuration, simplicity of use (also in confined
spaces), and hovering and vertical take-off and landing capability, which all make them an
interesting alternative to fixed-wing aircraft in many practical applicative scenarios.. Also,
with respect to a conventional helicopter, a multi-rotor shows an increased manoeuvrabil-
ity and a faster response to external disturbances together with a more compact size. This
is achieved by spreading the total disc area into multiple rotor units. Thus, to provide
the required thrust, smaller propellers rotating at higher speed are employed, at the cost
of a loss in efficiency with respect to the conventional, single rotor configuration. This, in
addition to the limited duration/weight ratio typical of electrically driven systems, makes
the endurance in the hovering condition a critical, but challenging, issue in the framework
of the multi-rotor platform design process.
1
1. Introduction
1.2 Literature Review and Thesis Objectives
Studies addressing electric aircraft performance and became available only in last few
years. Recent works present results related to fixed-wing aircraft, where the effects of
Peukert’s law on the available battery capacity are taken into account. In Refs. [4] and [5],
the best range condition is derived, whereas in Ref. [6] endurance estimates are validated
by means of an experimental investigation. With respect to multi-rotor platforms, Ref.
[7] presents a novel configuration where endurance is increased by using higher diameter
propellers for lift generation and smaller propellers for attitude control, whereas in Ref. [10]
the authors present an application of a statistically-based sizing methodology to multi-rotor
RPAS, allowing for the estimation of the gross take-off weight as a function of hovering time
and payload requirements, through the analysis of available data from platforms currently
on the market. This thesis presents the analytical study of battery-powered rotary-wing
aircraft endurance in hovering flight condition, and its experimental validation carried
out by using a multi-rotor platform. Starting from the balance equation of required and
available power, and by taking into account airframe features, rotor figure of merit, and
payload required power, two main results are obtained and discussed: 1) an analytical
model for accurate estimate of hovering time as a function of on-board battery capacity,
and 2) a set of approximate solutions for deriving the best endurance condition in terms
of optimum capacity and maximum achievable hovering time for the cases when the figure
of merit can be assumed to be constant, and the power required by the payload is small
if compared to the hovering power. The problem of hovering flight time is addressed and
approximate analytical models describing the best endurance condition are derived. In
the Result section numerical simulations and flight testing campaign data, validating the
effectiveness of the proposed approach, are presented.
1.3 Outline
The work is divided into three main parts. The first part,(Chapter 2), describe the
platform in its main parts. Second part,(Chapter 3), copes with the adaptation of the
classic airplane design methodology already used for airplane and helicopters.Third part,
(Chapter 4), a detailed study about endurance performance is developed in relation to the
configuration of the platform. In particular, a closed analytical solution is proposed and
verified through practical experiments with a flying test bench.
2

CHAPTER 2
System Description
The following paragraph describe the platform studied during the three years of the PhD.
The short description contain physical and mechanical aspects and the basic theory about
generation of thrust for a rotor in single and coaxial configuration through the momentum
theory.
2.1 Multi-Rotor platforms
Multi-rotors are a VTOL aircraft where the general term encompassing not only quad-
rotor but also tri-rotor, hexa-rotor, octo-rotor and all other form of rotorcraft with more
than 2 propellers/rotors. The very first experimental attempts of taking off with a rotor-
craft were mostly done with multirotors. Around 1907 Jacques and Louis Breguet, French
brothers, built and tested Gyroplane, a quadcopter. They managed take-off, although the
design proved to be very unstable and hence impractical. In 1924 French engineer Etienne
Oehmichen flew his quadcopter (Fig.2.1) a distance of 360 m setting a world record.
In the same year he flew a 1km in 7m and 40s. Around the same time George de
Bothezat built and tested his quadrotor for the US army (Fig.2.2), completing a number
of test flights before the program was scrapped.
These type of vehicle typically had a central engine housed centrally in the fuselage,
driving the 4 rotors via belts or shafts. Belts and shafts however are heavy and importantly,
subject to breakage. A quad-rotor is not naturally stable because is, in terms of control
variables, an under actuated vehicle where four control variables are present to control six
3

2. System Description
Figure 2.1: Oehmichen Quadrotor
Figure 2.2: Bothezat Quadrotor
4

2.1 Multi-Rotor platforms
mechanical degrees of freedom. In the absence of computers, this meant a monumental
workload for the pilot. As a result, multi-rotors designs were abandoned in favor of single,
or on rare occasions for very large transport helicopters, double rotor designs.
With the advent of electric motors and especially microelectronics and micro-mechanical
devices, a few years ago it became possible to build reliable and efficient multi-rotors.
Modern multi-rotor have an electric motor mated to each rotor, sitting directly below
or above it. A flight computer constantly monitors the orientation of the copter and
corrects for instability by changing not the pitch of the rotors but simply the rpm of
the individual motors/rotors. This fixed pitch design is much simpler than the complex
swashplate mechanics that are required for single rotor helicopters.
The quad-rotor, features two pair of rotors mounted at the end of a simple cross-shaped
structure, or at the corners of a square frame. Two rotors rotate in the clockwise direction
and two rotate counter-clockwise, such that at hover each rotor produce a thrust equiva-
lent to one fourth of the vehicle weight, with zero pitch and roll moments and perfectly
balanced rotor aerodynamic yawing torques.Yaw control is achieved unbalancing aerody-
namic torques acting on the two pairs of rotors (i.e. increasing the speed of clockwise
rotors while decreasing the rotation rate of the other two, or viceversa), keeping a constant
total thrust. Roll and pitch moment are obtained by variation of lateral and longitudinal
rotor thrust, respectively (i.e. increasing the forward rotor rotation rate while decreasing
that of the aft-mounted rotor, a pitch-up moment is obtained) (Fig.2.3).
To compute the aerodynamic forces generated by rotors, and needed to the further
performance calculations, it is possible use the results of the classic momentum theory
(MT) and the more detailed blade element theory (BET) [11]. The induced rotor velocity,
by assumption, is constant on the whole area of the disk actuator. the air is considered
incompressible. The thrust (T), generated by rotors, is linked to the induced velocity (vi),
as the thrust coefficient (CT ) to the inflow ratio (λi) (2.1, 2.2).
T = 2ρAvi
√u2R + (wR − vi)2 (2.1)
CT =T
ρAV 2tip
(2.2)
Rearranging equation 2.1 the induced velocity, in hovering condition, can be expressed
as:
vi =
√(T
A
)1
2ρ(2.3)
5

2. System Description
Figure 2.3: Quadrotor movements: (a) hover, (b) roll, (c) pitch, and (d) yaw
6

2.1 Multi-Rotor platforms
So, the power required to hover condition, on the time rate-of-work done by the rotor
on the fluid per unit thrust, is given by:
Ph =T
32
√2ρA
(2.4)
This power is also called ideal power because it is entirely induced in nature without
consider the contribution of viscous effect of the fluid. using the modified form of the MT,
with non ideal approximation for the power, it is possible to write the figure of merit as:
FM =Pideal
kP ideal + P0
=
C3/2T√2
kC3/2T√2
+σCd0
8
(2.5)
Where P0 is the profile power required and k is the coefficient that take into account
the induced losses (i.e k = 1.0 for ideal induced losses and k = 1.15 for non-ideal losses).
2.1.1 Coaxial rotor configuration
In some cases multi-rotor adopt contrarotating coaxial rotor system. In electrical vehicle
this application is easier than a mechanical costruction because it is possible make this via
two DC motors commuting the poles of the power line (Fig.2.4).
Figure 2.4: Coaxial rotor system
Contrarotating coaxial rotor design has some advantage. One of these is that the net
size of the rotors is reduced because each rotor provide vertical thrust [11]. However, the
two rotors and their wakes interact with one other and this interacting flow incurs a loss of
net rotor system aerodynamic efficiency. Assuming the rotor planes are sufficiently close
7

2. System Description
together and that each rotor provide an equal fraction of the total system thrust, via the
MT is possible describe the induced power for the separate rotors as:
Pi =2T 3/2
√2ρA
(2.6)
The induced power factor kint is considered to be ratio expressed in the following equa-
tion:
kint =PitotPi
=
((2T )3/2√
2ρA
)(2T 3/2
√2ρA
)−1=√
2 (2.7)
That is the 41% of induced power relative to the power required to operate the two rotors
in complete isolation. MT shows a pessimistic analysis if compared with experimental
measurements. This is in function of the finite spacing between the two rotors. Through a
more detailed analysis of the induced velocity of the two rotors, kint is equal to 1.281, that
is the 28%. Under this condition the figure of merit of a coaxial rotor (Fig.2.8) became:
FM =Pideal
kPideal + P0
=
C3/2T√2
kintkC3/2T√
2+
σCd0
8
(2.8)
Where kint = 1 for a single isolated rotor.
Figure 2.5: FM for a coaxial rotor compared to measurement [11]
8

2.2 Driving System
Anyway the coaxial configuration maintain also other benefits [23]; the torque of any
couple of rotors is always balanced because they work at the same rotational speed with
opposite direction. Outside the hovering condition, for example in forward flight, the
dissymmetry of lift generated by the advancing rotor blade, is balanced by the effect on
the the retreating blade of the contrarotating rotor. Last benefits is a reduction of noise
and, in case of helicopter configuration, there is not a tail rotor that that wastes a part of
available engine power that would be devoted to lift and thrust.
2.2 Driving System
Conventional platform are driven by one or more internal combustion engine. In this
case engine controls can be added to simple engines in order to improve reliability and fuel
consumption. The engine control unit can control throttle servo position, spark timing,
cowl flap opening, or fuel injection, depending on engine configuration. Measured engine
properties can include shaft rotational angle, rpm, air inlet temperature, exhaust tempera-
ture, and cylinder head temperature. These sensors must be added to the engine. Instead,
electrical platform are simpler and so DC motors are driven directly by an Electronic Speed
Control. Both driving system configurations drive a propeller with two or more blade.
2.2.1 Electric Motors
Electric motors don’t have consumables as fuel and lubricants like combustion engine
and have poor maintenance. Brushless motors have two main configurations: inner-runner
and out-runner. Multi-rotor applications generally use out-runner motor. Out-runners
spin much slower than their inner-runner counterparts with their more traditional layout
while producing far more torque. This makes an out-runner an excellent choice for di-
rectly driving electric aircraft propellers since they eliminate the extra weight, complexity,
inefficiency and noise of a gearbox. Also performance characteristics are independent of
altitude to a first order; but the real one limitation is the the endurance in flight due to
power source.
Modern electrical UAS are small with a weight less than 10 kilograms and they are
powered with motors of less than 1 kW. The motor life is limited by the bearing wear.
Electric Motors model
Multi-rotors use DC electric motors. Such motors, featuring high power-to-weight ratio,
are widely used for scale-model aircraft, represent a suitable solution for micro/mini UAV
9

2. System Description
applications. The following assumption are made within the initial sizing process:
• for brushless permanent-magnet motors, the power factor is equal to unit
• Magnetic loss is neglected
Input power (Pin) and shaft output power are given by the following expressions:
Pin = Vin · Iin (2.9)
Pout = (Iin − I0) · (Vin − IinRa) (2.10)
Where Iin is the input current, I0 is the no-load current,Vin is the input voltage and Ra
is the motor resistance. The global electric system efficiency and the shaft rotational speed
(Ω) in function of the motor speed constant (KV ) are given as:
ηs = ηD ·(
1− Iin ·Ra
Vin
)·(
1− I0Iin
)(2.11)
Ω = (Vin − Iin ·Ra) ·KV (2.12)
Where ηD ≈ 0, 95 is the driver efficiency.
For the purposes of the present work more than 2000 DC engine have been selected and
classified from Motocalc databases. Fig.2.6 shows the results obtained.
Figure 2.6: Speed Constant (Kv) as a function of motor mass
Among 60 models of motor currently available on the market, 4 different DC motors
have been selected with a complete information datasheet.
10

2.2 Driving System
Figure 2.7: Motor maximum output power as a function of motor mass (selection of 4
manufacturers)
Figure 2.8: Motor maximum output power as a function of motor mass (trend)
11

2. System Description
We define maximum power-to-mass ratio (BPM) relative to list of 4 DC motors Fig.2.8
into the model as:
Poutmax = BPM ·mM (2.13)
That is by the trend line value:
Poutmax = 4140, 8 ·mM (2.14)
The same procedure is applied for KV and BKV(Fig.2.9):
Figure 2.9: Speed constant as a function of motor mass (selection of 4 manufacturers)
KV = BKV·mM
−0,586 (2.15)
KV = 286.5 ·mM−0,586 (2.16)
The expression that links the max Pout to the mass of the motor mM can be used to
estimate the DC engine weight.
2.2.2 Electronic Speed Control (ESC)
DC motor speed is controlled by a motor controller called ESC. The function of the ESC
is to vary the to vary the voltage that is applied to the motor and consequentially change
the rotational speed. The ESC’s choice is function of the maximum current of the motor
Data available online at http://www.motocalc.com/ [retrived April 2012]
12

2.2 Driving System
driven. Generally the user have to take an ESC that can menage a current of 10 − 20%
more than the maximum motor current. The power of an ESC [15] can be defined as:
Pesc =Imot · Vmot
ηesc(2.17)
The ESC efficiency (ηesc) is maximum when the power setting of the motor is near of
the 100%. The efficiency information for ESC is not available from the manufactures, but
it can be defined wit a value of 85%− 95%.
To define a database of ESC main characteristics it is take into account only one main
manufacturer (Turnigy) that allow info. With the database we can define two plot where
continuous current, Fig.2.10, and volume expressed in mm3, Fig.2.11, are in function of
the ESC mass.
Figure 2.10: ESC cont. current vs mass
The relation between the ESC parameters are defined by the following linear equations:
Contcurr = 1, 0316 ·massesc (2.18)
V olesc = 617, 31 ·massesc (2.19)
2.2.3 Propeller
Propeller performance at low Reynolds numbers has become increasingly important in
the design and performance prediction of RPSs. Generally a two blade type, with variable
http://www.turnigy.com/
13

2. System Description
Figure 2.11: ESC volume vs mass
diameter, in plastic or carbon fiber are widely used. The principal limit of these propeller is
the short diameter that have a negative influence on aerodynamic characteristics reducing
efficiency. The maximum average propeller efficiency is about 0.5 to 0.7 as shows, for
example, in Fig.2.12 relatives of a Graupner 11x8 propeller [21].
Propeller used for the experiment is a T −Motor13x4.4CarbonV 2. This lightweight
propeller is make to allow high strength with less inertia and prolong hovering time in
relation to high efficiency. Sadly, T-Motor do not provide aerodynamic characteristic that
are been obtained through a test banch.
2.3 Batteries
The device that convert electrochemical energy into electrical power is the battery. Bat-
tery can be rechargeable and not. Not rechargeable are also called primary or single use.
The first type have high performance than rechargeable but the cost of replacing is not
convenience for a multi-use RPV as the multi-rotors.Several battery chemistries have been
used for UAS propulsion systems. The properties of several battery types are shown in
Tab.2.1. Nickelcadmium (NiCd) batteries were dominant in the 1980s and 1990s. Nickel
metal hydride (NiMH) made a brief appearance in the late 1990s and early 2000s. However,
lithium-ion (Li-Ion) and lithium-ion-polymer (Li-Po) batteries are the main type in use
today for small UAS/RPAS propulsion systems. Lithium sulfur (LiS) promises to provide
improved performance once more fully matured.
The second step in the preliminary sizing process for conventional aircraft is the fuel
http : //www.rctigermotor.com/html/2013/prop0904/31.html
14

2.3 Batteries
Figure 2.12: ηp vs J of Graupner 11x8 propeller [21]
15

2. System Description
Figure 2.13: T-Motor 13x4.4 Carbon V2
fraction required for each mission segment, and thus the Specific Fuel Consumption (SFC)
plays a critical role. Electrically powered aircraft shows a different behavior, since the
weight remains constant along the whole missions. Currently, battery technology is based
on lithium polymer battery providing better performance with respect to previous tech-
nologies (NiCd, LiFe). The following batteries parameters [22] are available from manu-
facturers’ data sheets, allowing an estimation of the battery fraction:
1. Energy or Nominal Energy or Energy Capacity of the battery (measured in Wh for
a specific C-rate): is the total Watt-hours available when the battery is discharging
given a certain discharge current (specified as a C-rate) from100 percent state-of-
charge to the cut-off voltage. Energy is calculated by multiplying the discharge
power (in Watts) by the discharge time (in hours). Like capacity, energy decreases
with increasing C-rate.
2. Depth of Discharge (DOD - measured in %): is the percentage of battery capacity
that has been discharged expressed as a percentage of maximum capacity. A dis-
charge to at least 80 % DOD is referred to as a deep discharge. The cycle life of a
battery is the number of discharge-charge cycles before fails in function of tempera-
ture and humidity. High DOD generally define a low cycle of life.
3. Specific Energy (measured in Wh/kg): is the nominal battery energy per unit mass,
sometimes referred to as the gravimetric energy density. It is a characteristic of the
16
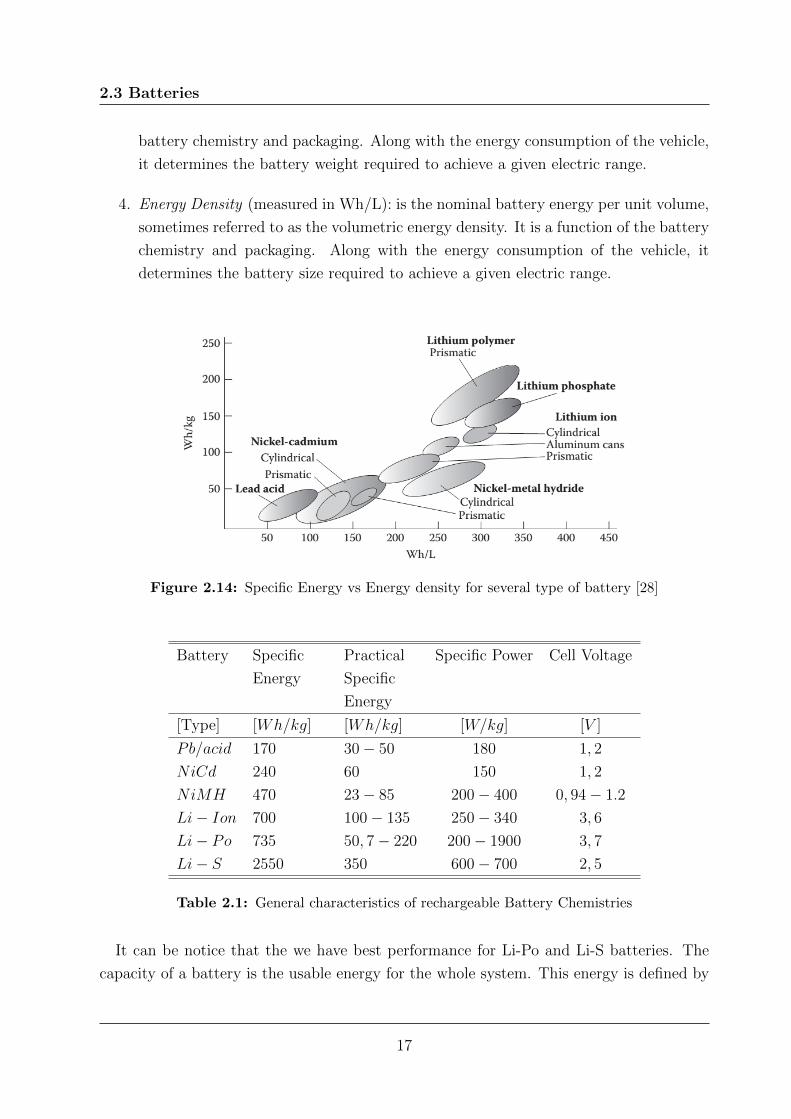
2.3 Batteries
battery chemistry and packaging. Along with the energy consumption of the vehicle,
it determines the battery weight required to achieve a given electric range.
4. Energy Density (measured in Wh/L): is the nominal battery energy per unit volume,
sometimes referred to as the volumetric energy density. It is a function of the battery
chemistry and packaging. Along with the energy consumption of the vehicle, it
determines the battery size required to achieve a given electric range.
Figure 2.14: Specific Energy vs Energy density for several type of battery [28]
Battery Specific
Energy
Practical
Specific
Energy
Specific Power Cell Voltage
[Type] [Wh/kg] [Wh/kg] [W/kg] [V ]
Pb/acid 170 30− 50 180 1, 2
NiCd 240 60 150 1, 2
NiMH 470 23− 85 200− 400 0, 94− 1.2
Li− Ion 700 100− 135 250− 340 3, 6
Li− Po 735 50, 7− 220 200− 1900 3, 7
Li− S 2550 350 600− 700 2, 5
Table 2.1: General characteristics of rechargeable Battery Chemistries
It can be notice that the we have best performance for Li-Po and Li-S batteries. The
capacity of a battery is the usable energy for the whole system. This energy is defined by
17

2. System Description
the following parametric equation [15] that scales the battery energy with battery weight
and specific energy:
EnergyBatt= Espec
Wb
g· ηb · fusable (2.20)
Where ηb is in function of the current draw profile and the fusable or fDOD is factor
accounts for the permissible battery pack depth of discharge, which can be a very significant
endurance driver. The depth of discharge is the ratio of battery usable energy to the total
stored energy. The battery efficiency and permissible depth of discharge depend on battery
chemistry and design attributes.
Multi-rotors adopt battery pack arranged in a combination of series and parallel cells.
A cell is the basic electrochemical unit providing a source of electrical energy by direct
conversion of chemical energy. A cell is an assembly of electrodes, separators, electrolyte,
container and terminals [28]; while a battery consist of one or more electrochemical cells
connected in an appropriate series (strings) or parallel arrangement to provide a specific
required current or voltage level. The type of arrangement is in function of the input motor
voltage and the maximum system current required as show in Eq.2.21 and Eq.2.22.
Vbatt = Nseries · Vcell (2.21)
Imax,batt = Nstrings · Imax,cell (2.22)
In relation of these the energy battery can be expressed as:
Ebatt = Ncell · Ccell · Vcell · fusable (2.23)
Lithium polymer batteries have a voltage per cell that varies between th absolute mini-
mum safe voltage per cell is 3.0 volts, and the maximum is 4.2 volts in function of the tech-
nologies used. Multiply these values by the cell count to get the minimum and maximum
voltages for a given battery pack as in example in Tab.2.2. As the battery is discharged,
the voltage drops gradually and constantly until it reaches 15% charge at a voltage of 3.7
volts. Below this point the voltage drops much more rapidly. Each lithium polymer battery
cell also has an internal resistance of around 5 milliohms for a new cell and 20 milliohms
for an old cell. The effect of this internal resistance is to cause a significant instantaneous
drop in the battery voltage as a function of the actual current draw as in equation 2.24.
Vdrop = I ·Rint (2.24)
18

2.3 Batteries
Cell Count Nominal Voltage Min Voltage Max voltage
1 3,7 3,0 4,2
2 7,4 6,0 8,4
3 11,1 9,0 12,6
4 14,8 12,0 16,8
5 18,5 15,0 21,0
6 22,2 18,0 25,2
Table 2.2: lythium Polymer Battery Voltage
Figure 2.15: Battery capacity as a function of battery mass
A battery set is selected on the basis of a dedicated database [18]. A number of 163
Lithium Polymer batteries from seven main manufacturers have been selected and clas-
sified. The relationship between energy capacity, Eb, (expressed in W · hr), and battery
mass, mb, is shown in Fig. 2.15.
while Fig. 2.16 shows the trend line that define the relation between the two parameters
given by the following equation:
Eb = 138, 17 ·mb − 0.0422 (2.25)
It can be noticed that FlightPower is the manufacturer that produces batteries that
allow a wide range of Eb in relation to the mb. Also its website gives a complete list of
data. So FlightPower is been chosen to be analyzed as follow. Fig. 2.17 and Fig. 2.18
show the relation of the parameters with the mass and the volume with their trend line.
Data available online at http//www.flightpower.co.uk/
19

2. System Description
Figure 2.16: Battery capacity as a function of battery mass trend line
Figure 2.17: Battery capacity as a function of battery mass (FlightPower)
20

2.3 Batteries
Figure 2.18: Battery capacity as a function of Volume (FlightPower)
The relation defined by trend line are:
Eb = 137, 93 ·mb (2.26)
Eb = 297845 · V ol (2.27)
2.3.1 Discharge battery model and approximation
In 1963, Shepard [24], define the equation that describe a complete battery discharge
for the case when current density distribution is uniform for a Li-Po battery. The battery
potential, during the discharge, is given as a function of time, current density, polarization,
internal resistance, and other factors (2.28).
V = E0 −R · i−KC
C − it(it+ i∗) + Ae(−B·it) (2.28)
Where the two main term are respectively the:
Polarization Resistance = KC
C − it· i∗ (2.29)
Polarization V oltage = KC
C − it· it (2.30)
The term A is the exponential zone amplitude (V); B is the exponential zone time
constant inverse (Ah−1); R is the internal resistance (Ω); i is the battery current (A),
21

2. System Description
i∗ is the filtered current (A); it =∫idt and K is the polarization constant (V/Ah) or
polarization resistance (Ω) [25].
The battery discharge characterization allow to find an experimental value of Peukert
coefficient. Via a Programmable DC Electronic Load were performed several tests on the
batteries used on-board of the multi-rotor. Four discharge at variable C-rate,from 1 to
4 with a step of 1, were performed. For every battery pack a non complete discharge is
achieved. The battery capacity is used for the 80% of the nominal capacity, this is reach
when the battery voltage has a drop of ∆V ≈ 2 volt. The typical discharge curves of a
Li-Po battery are shown in 2.19.
Figure 2.19: Example of Li-Po battery discharge curves [27]
The experimental characterizations of the batteries were obtained via set of battery
discharge performed with the electronic load. Electronic properties that are measured
include the battery voltage, current and power, while measurement variables are discharge
time and capacity. For the experiment four batteries Dualsky 10000mAh XP100004HED
type are been used. In order to define physical characteristics, the batteries were weighted
in order to calculate their Specific Energy and energy to Volume as show in Ta.2.3.
The results put on evidence that any battery pack have weight difference and so specific
energy difference. These difference, however small, have influence in term of capacity
and time of discharge. The curves were acquired fixing a constant current of discharge
in function of a C-rate. Fig.2.20 and Fig.2.22 show the voltage drop in function of the
battery capacity for the battery pack I; while Fig.2.21 and fig.2.23 show the voltage drop
in relation of the elapsed time of discharge. All the curves are plotted for different C-rate:
from 1C to 4C range.
Maynuo model M97 - www.maynuo.com/
22

2.3 Batteries
XP100004HED Specification
Nominal Capacity 10000 mAh
Nominal voltage 14.8 volt
Energy 148.0 Watt · hNumber of Cell 4S1P
Nominal Weight 780 g
Dimensions 167x48x48 mm
Batt. Pack Weight Specific Energy Energy to Volume
no [g] [Watt · h/g] [Watt · h/mm3]
I 774,8 0,1910 3, 846 · 10−4
II 771,0 0,1919 3, 846 · 10−4
III 783,2 0,1889 3, 846 · 10−4
IV 831,16 0,1780 3, 846 · 10−4
Table 2.3: Dualsky nominal and experimental specification
0 1 2 3 4 5 6 7 813.5
14
14.5
15
15.5
16
16.5
Capacity [Ah]
Cel
l Vol
tage
[vol
t]
1C discharge2C discharge3C discharge4C discharge
Figure 2.20: Voltage vs Capacity - Dualsky battery pack I
23

2. System Description
0 200 400 600 800 1000 1200 1400 1600 1800 200013.5
14
14.5
15
15.5
16
16.5
Elapsed time of discharge [s]
Cel
l Vol
tage
[vol
t]
1C discharge2C discharge3C discharge4C discharge
Figure 2.21: Voltage vs Elapsed time of discharge - Dualsky battery pack I
The discharge of the Li-Po cells show a linearly decreasing voltage as a function of
residual capacity when discharged from the fully-charged voltage. So it is possible thinking
the voltage constant during the discharge
The Peukert constant would be known for a particular battery type or established from
experiment. So discharge curves are been analyzed to extract Peukert constant for each
test. The average current in discharge was acquired during the test and substituted into
equation 2.31:
k =ln (E/Rt)
ln(C/[iRt]
) (2.31)
where C is the rated capacity, E is the endurance in hours and i is the average current
during the discharge and Rt is the rate of discharge (≈ 1 Ah). For each of four battery
pack, 4 discharge test are been performed and the Peukrt coefficient was calculated A
summary of these results are presented in Tab.2.4
Peukert constant for the 4 Li-Po battery packs move inside a range of 1, 12 to 1, 45 in
line with the average value of these kind of batteries.
24

2.3 Batteries
0 1 2 3 4 5 6 713.5
14
14.5
15
15.5
16
16.5
Capacity [Ah]
Cel
l Vol
tage
[vol
t]
1C discharge2C discharge3C discharge4Cdischarge
Figure 2.22: Voltage vs Capacity - Dualsky battery pack II
Pack V0 Vf E k
[no] [volt] [volt] [h] [/]
I 15,747 14,047 0,335 1,361
II 15,781 14,074 0,299 1,454
III 16,015 14,252 0,379 1,123
IV 16,063 14,318 0,361 1,293
Table 2.4: Average value acquired during discharge test
25

2. System Description
0 200 400 600 800 1000 1200 1400 1600 1800 200013.5
14
14.5
15
15.5
16
16.5
Elapsed time of discharge [s]
Cel
l Vol
tage
[vol
t]
1C discharge2C discharge3C discharge4C discharge
Figure 2.23: Voltage vs Elapsed time of discharge - Dualsky battery pack II
2.4 Main electronics/avionics systems
In modern multi-rotor, avionics is generally defined by 5 main components:
1. IMU : Inertial Measuring Unit
2. MC : Main Controller
3. PMU : Power Management Unit
4. GPS : GPS receiver antenna
5. Led : Led unit for visual warning and settings
MC is the component that is adopt to menage ESCs and payload (i.e. a gimbal)and
other commands from traditional radio controller (pitch, roll, yaw, throttle, ...). IMU, that
acquires accelerations for attitude determination, in many cases, it can be integrated inside
the MC. MC is also connected to the LED and the PCU. PCU is connected to the power
supply, for voltage detection and alarming, and to the GPS. Led unit allow the the ground
pilot visual information to the connection status of the GPS and other warning. It is also
26

2.4 Main electronics/avionics systems
present a micro-usb port for parameter configuration and firmware upgrade. Fig.2.24 shows
the typical avionics implementation on a multi-rotor platform with DJI NAZA system.
Figure 2.24: General scheme of multi-rotor avionics (i.e. DJI NAZA)
Three manufacturers, that allow available data to costumers, are been take into account.
Manufacturers (i.e. DJI) have datasheets about main physical characteristics as volume
and weight. Fig.2.25 shows the trend line about the mass in function of the volume.
.
Figure 2.25: Avionics volume vs mass
The avionics trend line can be defined by a linear equation as:
Aviomass = 0.0013 · Aviovol (2.32)
Main average data are listed in Tab.(2.5):
http://www.dji.com/
27

2. System Description
Electronic / Avionics Average Data
Total Volume 108415, 514 [mm3]
Total Weight 142, 43 [g]
Max Power Consumption 4, 3 [Watt]
Table 2.5: Multirotor average data
Inside Tab.2.6 it is shown the average value for the single element. In this case, in
relation to the costumer choices, it is possible use equation 2.32 to find the estimate value
of the avionics mass.
Single avionics components average data
Component [g] [mm3]
Flight Control 79 49958, 158
GPS & Compass 32, 71 31560, 911
LED-BTU-I 16, 66 2937, 833
PMU 24 8853, 318
IMU 70 34461, 203
Table 2.6: Avionics components average weight & volume
2.5 Payload
A multi-rotor platform can fly with several type of payload: from electro-optical payload
to atmospheric sensors. Multi-rotor is a very stable platform in hovering condition, and
this allow the use especially with digital camera in different spectral range. Generally the
camera is housed inside a particular robotic arm called Aerial Gimbals as shows in Fig.2.26
and Fig.2.27. Gimbals’ duty is to stabilize the camera to a fixed attitude, generally parallel
to the ground.
Gimbals take power directly to the main source of the platform and influence with this
and with its weight the endurance performance. Obviously also the sensors or, in some
cases, the camera, absorb power if there is not present a separate power source. Tab.2.7
list main parameters for payload as weight and power required useful for the performance
and preliminary design calculations derived by DJI website.
Payload trade, related to Tab.2.7, can be plotted in Fig.2.29 to draw the trend line of
equation 2.33.
28

2.5 Payload
Figure 2.26: Zenmuse Gimbals (DJI)
Figure 2.27: Zenmuse H4-3D (DJI)
29

2. System Description
Aerial Gimbals W Gimb. Sugg. Camera W Camera W payload
[type] [kg] [type] [kg] [kg]
Zenmuse Z-15 1.3 PanasonicGH2 + opt 0.6 1.9
Zenmuse Z-15 GH3 1.22 PanasonicGH3 + opt 0.6 1.82
Zenmuse Z-15 GH4 1.26 PanasonicGH4 + opt 0.7 1.96
Zenmuse Z-15 5D 1.26 Canon eos 5D markIII 1.23 2.65
Zenmuse Z-15-5D III HD 1.53 Canon eos 5D markIII 1.23 2.76
Zenmuse Z15-BMPCC 11.26 nd 1.23 2.26
Zenmuse H3-2D GoPro 0.23
Zenmuse H3-3D GoPro 0.168
Table 2.7: Payload data from DJI
W0 = 0, 8895 ·Wpay + 10, 71 (2.33)
Figure 2.28: Wgimbals & Wcamera vs W0 [DJI]
Collecting available information of commercial multi-rotor it is possible rewrite the equa-
tion of payload trade as 2.34 of Fig.2.30.
W0 = 1, 7691 ·Wpay + 1, 5311 (2.34)
30

2.5 Payload
Figure 2.29: Wpay vs W0 [DJI]
Figure 2.30: Wpay vs W0 coomercial database
31

2. System Description
32

CHAPTER 3
Preliminary Design Methodology
The following paragraphs show how the classical methodology, used for airplane design,
can be adopted for the new type of aerial platforms. in this case the methodology it has
been applied on multi-rotor configuration powered by electrical DC motors.
In according to preliminary aircraft design methodology it is necessary to find relation
between specific characteristics of commercial parts in order to get some mathematical
equations. So for every type of platform it is possible define groups weight and statistical
equations based on historical data of existing vehicles. So it is important create appropriate
database in relation to the configuration and technologies in use.
3.1 Requirements and Constraints
The problem of endurance for any type of vehicles start approaching the power balance
between the power required and the power available on board. Generally the vehicle power
required depends to aerodynamic characteristic and by the weight of the platform. The
designer find his first barrier against a free design by the National Rules defined to generate
a little beat of order inside a more and more heterogeneous family of RPASs especially
in civil fields. Aeronautical Rules divide vehicle in function its maximum take off weight.
Regulation (EC) No 216/2008 mandates EASA agency to regulate UAS and in particular
RPAS, when used for civil applications and with an operating mass of 150 Kg or more. Also
https://www.easa.europa.eu/unmanned-aircraft-systems-uas-and-remotely-piloted-aircraft-systems-
rpas
33

3. Preliminary Design Methodology
EASA is member of JARUS which is currently developing recommended requirements for:
1. Licensing of remote pilots;
2. RPAS operations in VLOS and BVLOS;
3. Civil RPAS operators and Approved Training Organisations for remote pilots (JARUS-
ORG);
4. CS-LURS and CS-LUAS below 600 Kg;
5. Performance requirements for ’detect and avoid’ to maintain the risk of mid-aid
collision below a TLS and taking into account all actors in the total aviation system;
6. Performance requirements for command and control data link, whether in direct
RLOS or BRLOS and in the latter case supported by COM SP;
7. Safety objectives for airworthiness of RPAS (’1309’) to minimize the risk of injuries
to people on the ground;
8. Processes for airworthiness.
In our case, for a muti-rotor platform, the maximum take off weight is less than 150
kg. So national rules are in charge. ENAC principally divided RPASs into two main
categories: one below 25 kg and one up 25 kg. Main difference between the two is that the
platform up 25 kg follow the same rules and certification of a normal aircraft while below
is the operator that is in charge for the certification and for the mission risk analysis.
If rules put on evidence requirements about flight time (endurance) and maximum take-
off weight, for these vehicles, constraints are derived from scenario of operation and from
payload. For example, if the platform have to be used in indoor condition, the frame
dimension should be reduced and the disc propeller ducted in function to preserve propeller
to possible collisions. Type of payload and its dimension constraints the frame and the
relative Gimbals.
In relation of this the if the endurance is calculated in function of the maximum take off
weight it will not be the optimum endurance but it will be a compromise in function of the
weight requirement. For example the necessity to store or carry-on payload will increase
the MTOW and will reduce endurance. The section of the endurance analytical solution
is studied without any weight limitation (weight is still a variable).
https://http://jarus-rpas.org/
https : //www.enac.gov.it/LaNormativa/NormativaEnac/Regolamenti/Regolamentiadhoc/info−122671512.html
34

3.2 Take-Off Weight Buildup
3.2 Take-Off Weight Buildup
According to the classical methodology for aircraft sizing [9], the design take-off gross
weight, the critical term for every flight machine, is given by the total weight of the aircraft
at the beginning of the mission that can be expressed as the sum of the all weights on the
RPS at the takeoff condition:
W0 =max∑i=0
Wi (3.1)
For an electrically powered flying platform the take-off gross weight (W0) it remains
constant along the mission, and may be written as:
W0 = We +Wpp +Welsys +Wb +Wp (3.2)
where: W0 is the takeoff gross weight, We is the empty weight (i.e. airframe weight
without any system add), Wppis the powerplant weight (i.e. DC motors total weight),
Welsys is the electronic systems weight (i.e. avionics, D/L and ESC systems), Wb is the
battery weight, Wp is the payload weight (i.e.optical device, etc.).
Wsys, as defined, is the weight of the avionics and other system use inside the platform
to perform the mission. Generally, for a multy-rotor platform, it is composed by a IMU,
GPS, MC, LED and a PCU. The electronic systems weight can be defined as the sum of
the avionics and the ESC as:
Welsys = Wavion +Wesc (3.3)
It is important underline that the ESC system works like a servo for the rpm settings
of the motor. If we consider an other type of platform the servo’s weight have been take
into account inside the list of partial weights.
Solving equation 3.2, the estimation of W0 can be defined as:
W0 =Wpp +Welsys +Wb +Wp
1− We
W0
(3.4)
Equation 3.4 shows that the elements of the numerator are not variable during the
iteration and the denominator is defined by the only empty weight fraction because is not
present the fuel fraction. This put on evidence that electric vehicles do not change their
weight during the flight mission.
35
3. Preliminary Design Methodology
3.2.1 Commercial Multirotor analysis and Empty-Weight Esti-
mation
First step in take-off weight buildup is the empty weight fraction, We/W0, estimation.
While in commercial aircraft design, due to the large amount of data available in the
literature, a first guess of We/W0 does not represent a critical issue, on the contrary, for
multi-rotors, since the design of multi-rotors aircraft is relatively new (and mostly based
on the scale-model aircraft enthusiastic experience on rotary wings models), the empty
weight fraction estimation may be affected by a poor availability of data.
For the purposes of the present work, seven international multi-rotors manufacturers
data available have been taken into account for collecting platform weight features. Among
them, Microdrones and Dragan-Flyer provide technical information about multi-rotors
performance for customers.
On the basis of (even limited) data available a first database showing platform geometry,
mass features, and flight performance is made, providing suitable values that can be used
as a first guess for multi-rotors preliminary design. Four and six rotors configurations
(namely quadcopters and hexacopters, respectively) have been taken into account to list
the database. All these type of multirotors are built of composite material for frame,
landing gear and brackets and only in small proportion aluminium parts to build stiffeners.
Composite material allow to reduce empty weight.
The empty weight fraction, We/W0, is statistically estimated from historical trends
obtained from the available literature. It results to vary from 0.9 to 0.3, and it decreases
while the total weight of the platform is increasing. It is worth noticing that the number of
rotor does not seem to have a direct influence on total weight. The Microdrone md4-1000
(quad-copter) and DJI S800 (hexa-copter) present the same total weight but a different
configuration.
Fig. 3.1 shows the empty weight trends obtained by available literature. The trend line
is defined by the following linear expression:
We
W0
= −0, 00118 ·W0 + 0, 6613 (3.5)
3.2.2 Determination of the battery mass
The specific energy of the battery can be defined in function of the power requirement
and the flight time [20] as:
http://www.microdrones.com/
http://www.draganfly.com/
36

3.2 Take-Off Weight Buildup
Dragan Flyer X4-P
Width 0,87 [m]
Lenght 0,87 [m]
Top Diameter 1,06 [m]
Height 0,32 [m]
Helicopter Weight 0,68 [Kg]
Payload 0,25 [Kg]
MTOW 0,98 [Kg]
Max Climb/Desc. Rate 2 [m/s]
Max Turn Rate 90 [deg/sec]
Max Air Speed 50 [Km/h]
Max Altitude (ASL) 2430 [m]
Engine 4 [num.]
Engine Type DC Brushless
Battery Type LiPo
Battery Capacity 5400 [mAh]
Battery Voltage 14,8 [v]
Table 3.1: Example of Commercial Multirotor Data available
Figure 3.1: Empty Weight fraction Trend
37

3. Preliminary Design Methodology
Eb =FT · Power req.fDOD · ηdischarge
(3.6)
where:
• fDOD ∼= 0.8
• ηdischarge ∼= 0.95
And the product of flight time and power requirements can be separated into the several
mission segments as:
FT · Power req. = (FTtot · Psys) +
+ (FTclimb · Pclimb) +
+ (FTcruise · Pcruise) +
+ (FTloiter · Phover)
(3.7)
Once the Eb has been found, the mass of the battery is determined through equation
(Eb = 137, 93mb) or graphically.
3.2.3 Rotorcraft Power Requirements
For rotorcrafts, the power requirements are given by the analysis of Momentum Theory
(MT) and Blade Element Theory (BET). For vertical climb and hover (setting climb rate
to 0) the power [9] is given by:
Pclimb =
1
ηpηelηmecc
[(fW
FM
√fW/S
2ρ
)+WVclimb
2
](3.8)
Where: W is the RPAS weight (in this case multi-rotor weight), S is the total rotor
disck area, FM is figure of merit (generally with a value of 0.4 ÷ 0.8 in relation to the
type/dimension of the propeller blade), Vclimb is the climb rate (= 0 for hover), f is the
downwash on fuselage (≈ 1.03).
For climbing forward flight and level forward flight (setting γ = 0) the power required
is given by:
38

3.2 Take-Off Weight Buildup
Pfor.climb =
V
ηpηelηmecc
[q
(D
q
)+
W 2
4eqS+W · sin (γ)
](3.9)
Where: ηp is the propeller efficiency (0.4÷0.5), ηmecc is the mechanical efficiency (1÷0.9),
ηel is the electrical efficiency (≈ 0.9), γ is the climb path angle.
Generally multirotors propellers are directly driven by the DC motor. The ηmecc in
this case is equal to 1; but if we consider the possibility to use commercial variable pitch
propeller for new multirotor configuration, we have to take into account a value different
to 1. The(Dq
)ratio is the drag area of the fuselage and could be analyzed as shape factors
and skin friction value.
3.2.4 Analysis and Results
Now with the methodology described in this thesis, an example of preliminary calculation
can be made. Generally multi-rotor RPV has mission profile like Military Radius Mission,
but the missions prefer are surveillance and border control to icrease security and provide
observation capabilities. For example multi-rotor can rise to heights in few seconds and
take and transmit with appropriate payload and data-link image from its payload (i.e.
CCD/IR cameras, cellular antennas, hyperspectral sensors, ...)
Figure 3.2: Multi-rotor Hovering Observation Mission
39

3. Preliminary Design Methodology
It is considered the case of a hexa-rotors RPV. The statistical data used in the analysis
are the following:
Average Value from Manufacturers Data
Weight, Dimension & Payload
Multirotor We 1,889 [Kg]
Payload 0,9558 [Kg]
MTOW 3,156 [Kg]We
W00,627 []
Propeller Diameter (D) 260 [mm]
Performance
FlightTime 38 [min]
Radius in RC 500 [m]
Radius in WP 4000 [m]
Table 3.2: Average Values from Manufacturers
Now define a mission of 15 minutes of hovering over a specific point with a payload of
0.5 Kg. This is a possible mission for a surveillance multi-rotor that departs from ground
and climb on a fixed operating altitude, see Fig.3.2. The payload could be any optical/IR
devices. It is assumes also the air density (ρ) at sea level.
The following values, listed in Tab.3.3, are assumed for the various coefficients.
M 0,6
f 1,3
ηp 0,4
ηel 0,9
ηmecc 1 (direct drive)
fDOD 0,8
ηdischarge 0,95
ρ 1,225 [Kg/m2]
Table 3.3: Aeromechanical Coefficients
In relation to the mission segment, in this case a 15 min of hovering, the calculation
starts from a W0guess of 4 Kg. The first step is to calculate the power need to perform the
mission using equation3.8 and equation 3.6. The power need, in relation to the flight time,
allow to find the battery and motor mass. In our case:
40

3.2 Take-Off Weight Buildup
Phover Eb Wbatt WDCmotor
[W ] [Wh] [Kg] [Kg]
921, 549 303, 141 2, 198 0, 037
Table 3.4: Power need, battery & motor characteristics
Power and motor mass allow to find an adequate DC engine inside the database. Scorpion
HKII−2212− 12 fits the results.
Scorpion HKII−2212− 12
Kv Max Current WDCmotor
[rpm/volt] [A] [Kg]
2580 38 0, 038
Table 3.5: Scorpion DC engine char.
After choice the DC motor it can be define the electronic speed control (ESC) using
the maximum motor current incremented of 20%. In the same manner of the DC motor
choice, using equation (2.18) and ESC database we can find the right elements: Turnigy
Multistar 45 Amp using equation (2.17) and (2.18).
Turnigy Multistar 45 Amp
Max Current Max Current +20% WDCmotor
[A] [A] [Kg]
38 45, 6 0, 044
Table 3.6: ESC char.
For avionics components, they are take into account a complete suite (IMU, PCU, ...)
with an average weight of 0, 142 kg.
These results are the input for the iterative calculation.To find iteratively the takeoff
gross weight, a guess value of it is fixed, generally close to the main historical value, and
used as one shot in the dark inside the equation 3.4. If the result value does not match
the guess value, the result value is used as next guess value. Just few iterations will cover
the result. This first-order sizing process is shown in Tab.3.7.
The results of the preliminary calculation are shown into Tab.(3.8).
http://www.scorpionsystem.com/
http://www.turnigy.com/
41

3. Preliminary Design Methodology
W0We
W0W0calc We
[Kg] [] [Kg] [Kg]
4,000 0,611 8,567 5,232
8,567 0,588 6,553 3,855
6,553 0,598 6,714 3,016
6,714 0,597 6,701 4,003
6,701 0,597 6,702 4,004
6,702 0,597 6,480 4,004
6,702 0,597 6,480 4,004
Table 3.7: Results of the iterative calculation
Summary of preliminary design results
RPV Configuration Hexa-rotor
W0 6, 702 [kg]
We 4, 004 [kg]
DCmotor Scorpion HKII−2212− 12
WDCTOT0, 230 [kg]
ESC Turnigy Multistar 45 Amp
WESCTOT0, 265 [kg]
Wbatt 2, 198 [kg]
Wpay 0, 5 [kg]
Wavion 0, 142 [kg]
Table 3.8: Preliminary design results
42

3.2 Take-Off Weight Buildup
By the way it is possible to check also the trend of the empty weight in function of the
disk loading.
n D S W0 We T/S
[nrot.] [m] [m2] [Kg] [Kg] [Kg/m2]
6 0,38 0,6801 6,480 4,004 9,856
6 0,36 0,6104 6,746 4,162 11,444
6 0,34 0,5445 7,041 4,336 12,404
6 0,32 0,4823 7,370 4,529 15,849
6 0,30 0,4239 7,741 4,744 18,979
6 0,28 0,3693 8,161 4,987 22,954
Table 3.9: Disk Loading versus We
Figure 3.3: Disk Loading versus Empty Weight
As shown in Tab.3.9 and in Fig.3.3 to an increase of Disk Loading corresponds an increase
of We. Obviously it is not possible reduce drastically the total Disk Surface area but this
puts on evidence that is possible design compact multirotor with low empty weight [19].
43

3. Preliminary Design Methodology
44

CHAPTER 4
Best Endurance Condition
Endurance, for electrical vehicle, is directly connected to the battery capacity and tech-
nology. Nowadays, multi-rotor platform do not have again a relevant endurance for which
it is possible use these kind of machine till more than 15-20 minutes. Some industrial
project as IAI ETOP, acronym of Electric Tethered Observation Platform (Fig.4.1), have
completely removed the endurance problem build a umbilical cable that supply without
limit the platform; in this case the platform can carry-on a payload of more than 20 Kg.
At the moment previous studies are developed for endurance of fixed wing platform ([6],
[4], [5]) but nothing for helicopter or multi-rotor. The following chapter explain the the
theoric dissertation about multi-rotor endurance and the validation through the use of a
test banch and several flight test with a commercial platform.
4.1 The endurance for electrical RPAS
How it is been explained in the previous chapter about the weight fraction, it is possible
rewrite equation 3.2 in a more usefull expression to use to calculate endurance. Let us
consider a rotary-wing platform equipped with a payload for a specific mission. The total
take-off weight can be expressed as:
Wto = Weo +Wp +Wb (4.1)
http://www.iai.co.il/2013/35735-41817-en/IAI.aspx
45

4. Best Endurance Condition
Figure 4.1: IAI ETOP
46

4.1 The endurance for electrical RPAS
where Weo is the empty-operative weight that includes the a) frame weight (structure
and rigging), b) the driving system weight (motors, regulators, and propellers), and c) the
avionics weight (autopilot and telemetry), Wp is the payload weight, and Wb is the battery
weight.
For the purposes of the present analysis, the total power required for flight is
Pr = Ph + Pap (4.2)
where Ph is the power required for the hovering condition and Pap is the power required for
avionics and payload. For rotary-wing aircraft, the power required in hovering condition
is given by [11]
Ph =W
3/2to
f√
2 ρAt(4.3)
where f is the figure of merit of the rotor, ρ is air density, and At is the total disc area.
After naming λ =√
2 ρAt, by imposing the balance between the required and available
power from the battery, the current draw, i, for the hovering condition is given by:
i =PrV
=1
V
(W
3/2to
λ f+ Pap
)(4.4)
where V is the battery voltage that, in general, is a function of both current draw and
capacity. From the definition of the discharge ratio, dC/dt = i, it is straightforward to
obtain the specific endurancedt
dC=
V λ fW
3/2to + Pap λ f
(4.5)
For a nominal battery capacity C0, the actual available capacity C at the discharge rate i
is provided by the Peukert equation, [12],
C = C0
(C0
i t0
)k−1(4.6)
where t0 is the rated discharge time, and k is Peukert’s coefficient. By considering the
complete discharge of the available capacity, flight endurance is given by the following
integral:
t =
C∫0
V λ fW
3/2to + Pap λ f
dC (4.7)
4.1.1 Constant Battery Voltage during the discharge
The battery voltage is supposed to be constant during the discharge [6, 14]. As a matter
of fact, for constant power applications, Li-Po cells show a linearly decreasing voltage
47

4. Best Endurance Condition
as a function of residual capacity (with a negligible dependency on current draw) when
discharged from the fully-charged voltage, Vf , to the standard voltage, V0.Let η express the fraction of the nominal capacity where the discharge process shows a
linear behaviour. The available capacity becomes
C = η C0
(η C0
i t0
)k−1(4.8)
By imposing in Eq.4.7 the discharge at the equivalent constant voltage, Ve = (Vf + V0)/2,
the endurance turns to
t =Ve λ f
W3/2to + Pap λ f
C∫0
dC =Ve λ f
W3/2to + Pap λ f
η C0
(ηC0
i t0
)k−1(4.9)
4.1.2 Definition of the Figure of Merit
The Figure of Merit, first introduced by Renard (1903) and Glauert (1935), with the
power loading (T/W), is one of the parameter that define the efficiency of one rotor.
Anyway it is of difficult definition because, involved inside its, many parameters as solidity,
blade aspect ratio, ecc. This quantity is equivalent to a static thrust efficiency and defined
as the ratio to the ideal power required to hover to the actual power required, that is:
PidealPmeas
=CT
3/2√2CP
< 1 (4.10)
Where the measured value of the power coefficient, CP , will include induced and non
ideal physical effects that have origin from viscosity. For an helicopter rotor a value of
0.7 and 0.8 represent a good hovering performance for a generic rotor with conventional
technology Fig.4.2.
Instead, propeller used for little RPAS, have an efficiency from a peak of 0.65 to near
0.28 (very poor propeller)[21], thus indicate that proper propeller selection have a dramatic
effect on vehicle performance. To investigate endurance it is necessary to know the FM
value.
4.1.3 Thrust and Power Measurement
The value of the Figure of Merit is obtained using a custom test bench. The value of
thrust is acquired by a load cell model Deltatech S −AL−A/25kg . The power required
is measured via APM Power Module current/voltage sensor and all the signals is acquired
http://www.deltatechitaly.com
http://store.3drobotics.com/products/apm-power-module-with-xt60-connectors
48

4.1 The endurance for electrical RPAS
Figure 4.2: Figure of Merit prediction made with modified momentum theory [11]
and elaborated through a micro-controller Arduino 2. For the test is used a Dji DC motor
model 2212/920KV with a 10x45 propeller driven by a 30A ESC.
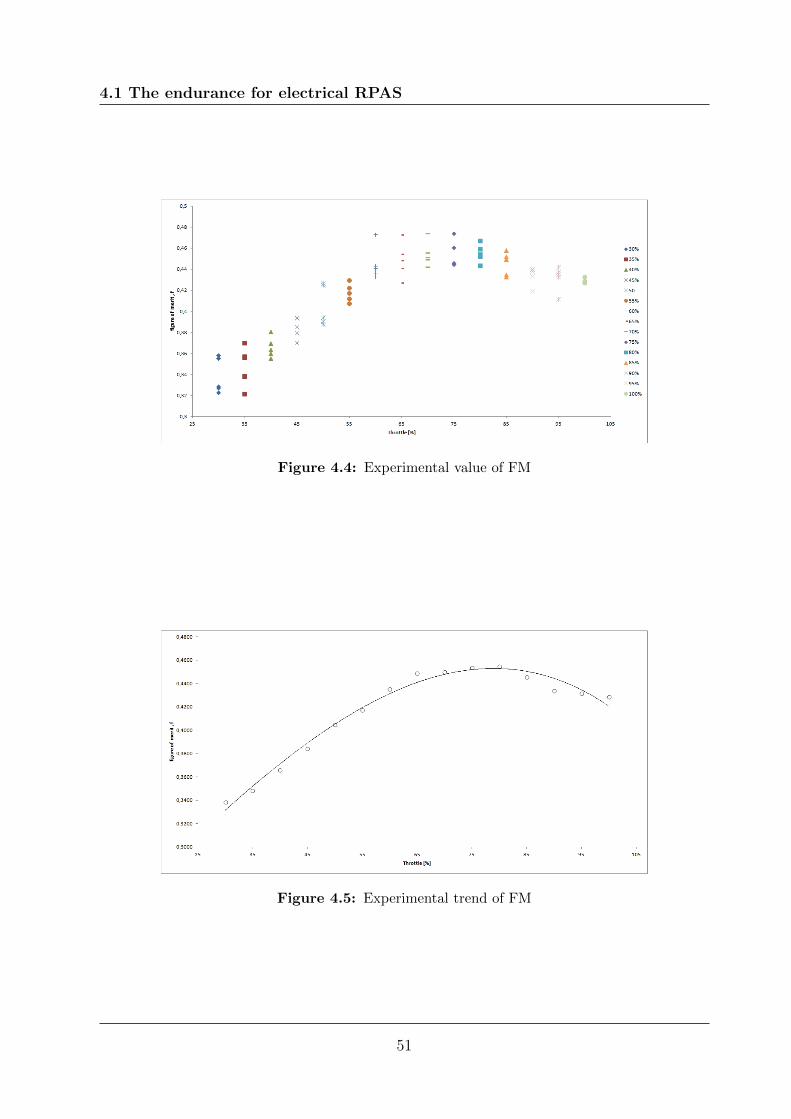
Starting from 30% to 85% of throttle, steps of 5%, five acquisitions are done for any
steps. Two battery pack of Li-Po battery (4S − 10.000 mAh) linked in parallel provide
the power for the whole system The time for the test is about 10 sec and the packs are
recharged after any test. This procedure is necessary to ensure a system voltage constant
and a basic time to permit at the engine to reach the performance rate.
The propeller, a 10 inch diameter, was driven by an ESC system that control and mount
on a DC out-runner motror. For any steps of throttle in % five value of thrust and power
are been acquired and later elaborated to find the FM value as shows in Fig.4.4.
After acquisition, it is been calculated the mean value to trace the approximate trend
of the figure of merit as show in Fig.4.5.
The data acquisition are needed to build a new model of FM useful for the endurance
estimation.
http://arduino.cc/
49

4. Best Endurance Condition
Figure 4.3: Test Banch used for FM acquisition
50
4.1 The endurance for electrical RPAS
Figure 4.4: Experimental value of FM
Figure 4.5: Experimental trend of FM
51

4. Best Endurance Condition
4.1.4 A new approximation of FM
Rotor figure of merit is supposed to be a slowly-varying power function of the rotor
thrust. The following model is proposed:
f = f0
(Wto
T0 n
)m(4.11)
where T0 is the rotor thrust at a reference percentage of throttle position (i.e. at 55%),
and n is the number of rotors. Model parameters, f0 and m, are obtained by available
data from the manufacturer and/or by means of an experimental characterization.
Via experimental data the FM is plotted into the rage of thrust used, Fig.4.6, and the
power trend line define the value of the coefficient.
Figure 4.6: Rotor FM with a thrust value of T0 = 55%
4.1.5 Maximum endurance condition
Letting α indicate the battery weight/energy ratio, aircraft take-off weight can be ex-
pressed as
Wto = W0 +Wb = W0 + αVeC0 (4.12)
where W0 = Weo + Wp is the zero-capacity weight, representing the weight of the aircraft
without the battery system. By substituting Eqs.4.4 and 4.11 into Eq.4.7, and by taking
into account Eq.4.12, endurance in hovering flight is given by
t = t0
[Ve η f0 λt0 (T0 n)m
]kΦ(C0) (4.13)
52

4.1 The endurance for electrical RPAS
where the function
Φ(C0) = Ck0
[(W0 + C0 Ve α)m−3/2 +
f0 λ
(T0 n)mPap
]−k(4.14)
depends on the nominal battery capacity.
Provided that all the parameters in the bracketed coefficient of Eq.4.13 are constant, the
best endurance condition is obtained by taking the derivative of Φ with respect to C0 and
imposing dΦ(C0)/dC0 = 0. The nominal capacity allowing for the maximum endurance
is thus obtained by solving the equation
Ve α (2m− 3) (W0 + C0 Ve α)1/2 (T0 n)m
(W0 + C0 Ve α)3/2 (T0 n)m + Pap f0 λ (W0 + C0 Ve α)m+
2
C0
= 0 (4.15)
To the best of the authors’ knowledge, an analytical solution to the problem cannot
be found when Φ(C0) assumes the form expressed in Eq.4.14. Nonetheless approximate
closed-form solutions can be obtained on the basis of two different simplifying assumptions.
Case 1
The rotor figure of merit is assumed to be constant, f ≈ f0. This assumption holds when
f shows negligible variations within the operational range of motor throttle (i.e |m| 1),
or when the aircraft is sized so that the driving system operates in the neighborhood of an
assigned throttle position. By imposing m = 0 in Eq.4.15 the problem reduces to:
2
C0
− 3Ve α (W0 + C0 Ve α)1/2
(W0 + C0 Ve α)3/2 + Pap f0 λ= 0 (4.16)
By solving with respect C0, the nominal capacity for the maximum endurance becomes
C0|(1)me =1
Ve α(Ψ0 −W0) (4.17)
provided
Ψ0 =
[(√f 20 λ
2 P 2ap −W 3
0 + Pap f0 λ)2/3
+W0
]2(√
f 20 λ
2 P 2ap −W 3
0 + Pap f0 λ)2/3 (4.18)
The maximum value for hovering time is obtained by substituting Eq.4.17 into Eq.4.14,
providing the following expression:
t|(1)me = t0
f0 η λ (Ψ0 −W0)
t0 α(
Ψ3/20 + Pap f0 λ
)k (4.19)
Results obtained under the hypothesis of constant figure of merit are effective in all
applications where the aircraft take-off weight is limited to a maximum value, W ?to, because
53

4. Best Endurance Condition
of mission and/or regulation constraints. As a matter of fact, for a given take-off weight,
the platform figure of merit is fixed, making Eqs. 4.17 and 4.19 provide an accurate
estimation of battery capacity and endurance. As a further contribution, by taking into
account Eq. 4.12, it is straightforward to obtain from Eq.4.16 the following expression,
C0|W ?to
=2
3
W? 3/2to + Pap f0 λ
αVeW ? 1/2to
(4.20)
which represents the nominal capacity for the maximum endurance in the presence of a
constraint on the maximum take-off weight.
Case 2
The power required for systems and payload is neglected, Pr ≈ Ph. This assumption is
usually valid in the following three scenarios: 1) there is no power-consuming payload on
board and aircraft systems only consist of autopilot and telemetry whose power consump-
tion usually has a negligible effect on endurance, 2) the payload uses a dedicated battery
system and the weight of such battery is already included in W0, 3) the power required for
avionics and payload is small if compared to the power required for the hovering condition,
Pap/Ph 1. After imposing Pap = 0 into Eq.4.15, the problem is thus reduced to
2
C0
+Ve α (2m− 3)
W0 + C0 Ve α= 0, (4.21)
which solution provides
C0|(2)me =1
αVe2W0
1− 2m(4.22)
By substituting this latter result into Eq.4.14 one has
t|(2)me = t0
[2 f0 η λ
t0 α (1− 2m)
Wm−1/20
(T0 n)m
(2m− 3
2m− 1
)m−3/2]k(4.23)
Optimal capacity and endurance estimation carried out with variable figure of merit rep-
resent a suitable solution for addressing the performance analysis with respect to battery
capacity of already existing platforms. In particular, the endurance prediction shows an
increased accuracy for a wide range of commercial multi-rotor platforms equipped with
a stabilised photo/video payload for surveillance, aerial photography, and low-cost pho-
togrammetry applications, where the ratio Pap/Ph has the same order of magnitude of 10−2.
Table 4.1 shows Pap/Ph and other design parameters values for a selection of platforms
available on the market.
Although C0|(1)me, and C0|(2)me represent acceptable approximations for a class of problems
involving hovering flight endurance, there are cases where a further simplified result would
be useful. As a matter of fact, in the preliminary phase of the design process, the selection
54
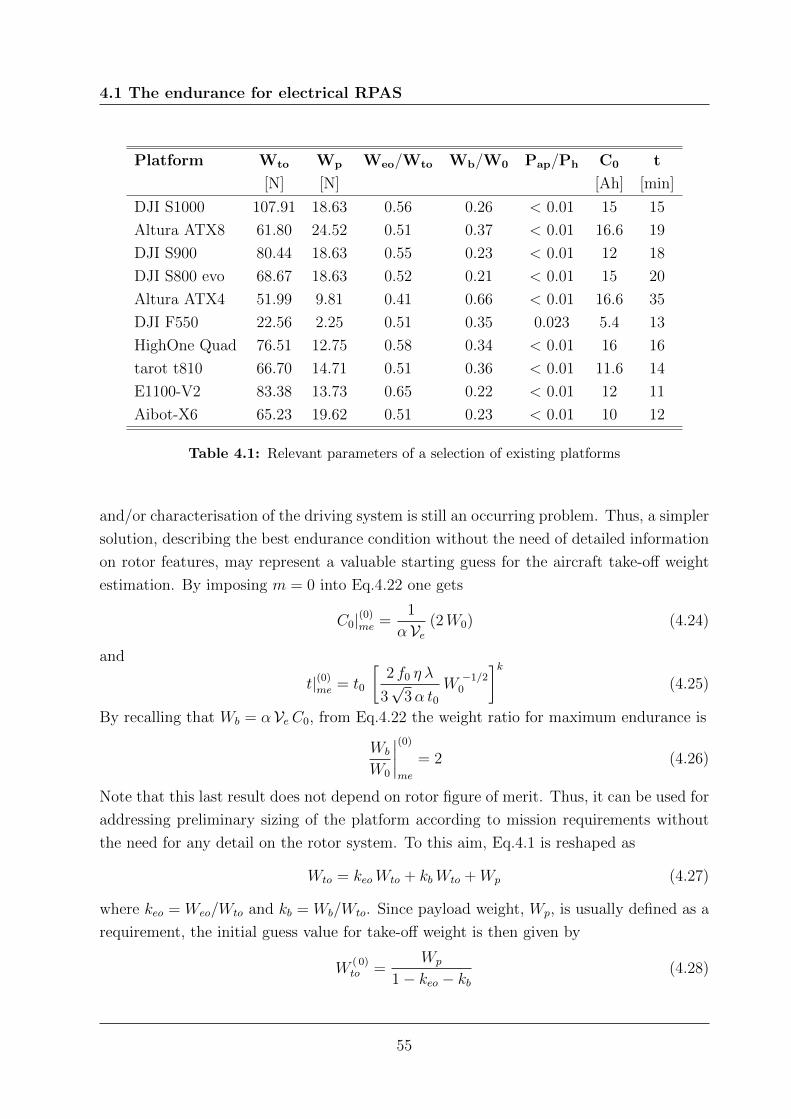
4.1 The endurance for electrical RPAS
Platform Wto Wp Weo/Wto Wb/W0 Pap/Ph C0 t
[N] [N] [Ah] [min]
DJI S1000 107.91 18.63 0.56 0.26 < 0.01 15 15
Altura ATX8 61.80 24.52 0.51 0.37 < 0.01 16.6 19
DJI S900 80.44 18.63 0.55 0.23 < 0.01 12 18
DJI S800 evo 68.67 18.63 0.52 0.21 < 0.01 15 20
Altura ATX4 51.99 9.81 0.41 0.66 < 0.01 16.6 35
DJI F550 22.56 2.25 0.51 0.35 0.023 5.4 13
HighOne Quad 76.51 12.75 0.58 0.34 < 0.01 16 16
tarot t810 66.70 14.71 0.51 0.36 < 0.01 11.6 14
E1100-V2 83.38 13.73 0.65 0.22 < 0.01 12 11
Aibot-X6 65.23 19.62 0.51 0.23 < 0.01 10 12
Table 4.1: Relevant parameters of a selection of existing platforms
and/or characterisation of the driving system is still an occurring problem. Thus, a simpler
solution, describing the best endurance condition without the need of detailed information
on rotor features, may represent a valuable starting guess for the aircraft take-off weight
estimation. By imposing m = 0 into Eq.4.22 one gets
C0|(0)me =1
αVe(2W0) (4.24)
and
t|(0)me = t0
[2 f0 η λ
3√
3α t0W−1/20
]k(4.25)
By recalling that Wb = αVeC0, from Eq.4.22 the weight ratio for maximum endurance is
Wb
W0
∣∣∣∣(0)me
= 2 (4.26)
Note that this last result does not depend on rotor figure of merit. Thus, it can be used for
addressing preliminary sizing of the platform according to mission requirements without
the need for any detail on the rotor system. To this aim, Eq.4.1 is reshaped as
Wto = keoWto + kbWto +Wp (4.27)
where keo = Weo/Wto and kb = Wb/Wto. Since payload weight, Wp, is usually defined as a
requirement, the initial guess value for take-off weight is then given by
W( 0)to =
Wp
1− keo − kb(4.28)
55
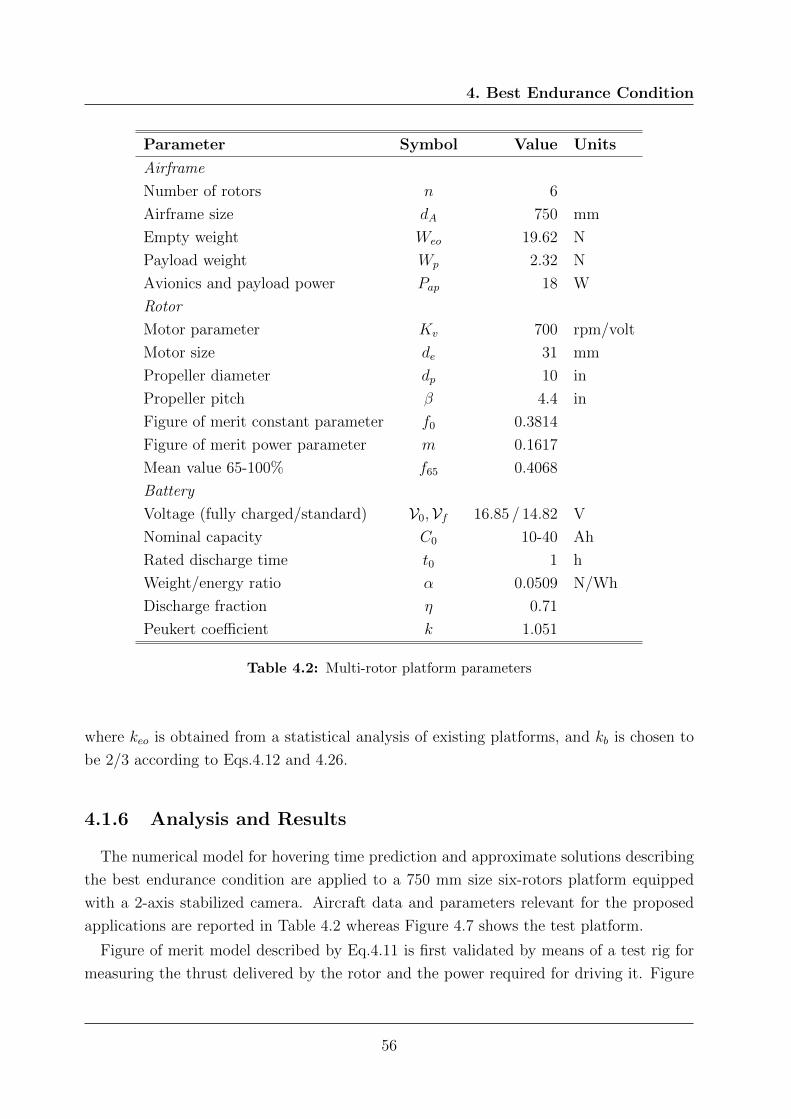
4. Best Endurance Condition
Parameter Symbol Value Units
Airframe
Number of rotors n 6
Airframe size dA 750 mm
Empty weight Weo 19.62 N
Payload weight Wp 2.32 N
Avionics and payload power Pap 18 W
Rotor
Motor parameter Kv 700 rpm/volt
Motor size de 31 mm
Propeller diameter dp 10 in
Propeller pitch β 4.4 in
Figure of merit constant parameter f0 0.3814
Figure of merit power parameter m 0.1617
Mean value 65-100% f65 0.4068
Battery
Voltage (fully charged/standard) V0,Vf 16.85 / 14.82 V
Nominal capacity C0 10-40 Ah
Rated discharge time t0 1 h
Weight/energy ratio α 0.0509 N/Wh
Discharge fraction η 0.71
Peukert coefficient k 1.051
Table 4.2: Multi-rotor platform parameters
where keo is obtained from a statistical analysis of existing platforms, and kb is chosen to
be 2/3 according to Eqs.4.12 and 4.26.
4.1.6 Analysis and Results
The numerical model for hovering time prediction and approximate solutions describing
the best endurance condition are applied to a 750 mm size six-rotors platform equipped
with a 2-axis stabilized camera. Aircraft data and parameters relevant for the proposed
applications are reported in Table 4.2 whereas Figure 4.7 shows the test platform.
Figure of merit model described by Eq.4.11 is first validated by means of a test rig for
measuring the thrust delivered by the rotor and the power required for driving it. Figure
56

4.1 The endurance for electrical RPAS
Figure 4.7: Multirotor platform used for validation
4.8 shows the data acquired for 13 different throttle settings between 40% and 100%. Model
parameters, f0 and m, are then obtained by a least-square estimate, and Fig. 4.9 presents
measured and approximated figure of merit as a function of the throttle.
The proposed model provides an accurate fit up to 75 % of the throttle setting, whereas
an increasing percentage error is found at higher values (5 @ 80 %, 8 @ 90 %, 10 @ 100 %).
Nonetheless, for many multi-rotor platforms, the driving system is sized so that the power
margin, intended as the ratio between the power available on-board and the power required
at hovering, lies between 1.2 and 2.2 [7]. As a matter of fact, these values for the power
margin allow for an increased maneuverability and, in case of a 6-rotor configuration, they
allow for keeping the hovering condition with a residual manoeuvre capability even in case
of engine failure. This makes the 50− 70% range suitable for operating the hovering flight
condition.
On the basis of the model for figure of merit, multi-rotor endurance is computed as a
function of battery ratio, Wb/W0. Fig. 4.10 compares numerical prediction expressed by
Eq.4.13 and approximate solutions derived in Section 2.1 with endurance calculated by
using the measured values of figure of merit.
Results show how in the range where the figure of merit model fits the measured data,
the hovering time prediction is accurate as well. At larger values of the throttle position,
57

4. Best Endurance Condition
40 50 60 70 80 90 1000
5
10
15
20
Thru
st, T
[N]
40 50 60 70 80 90 1000
100
200
300
400
Throttle, %
Pow
er, P
[W]
Figure 4.8: Measured rotor thrust and power as a function of the throttle
58

4.1 The endurance for electrical RPAS
40 50 60 70 80 90 100
0.3
0.32
0.34
0.36
0.38
0.4
0.42
0.44
0.46
Throttle, %
Figu
re o
f mer
it, f
measured dataapproximate model, Eq. (10)constant, f=f0
Figure 4.9: Rotor figure of merit as a function of the throttle
59

4. Best Endurance Condition
0 0.5 1 1.5 2 2.5 3 3.5 40
5
10
15
20
25
30
35
Battery ratio, Wb/W0
Endu
ranc
e, t
[min
]
50% 100%70%
measured datanumerical, Eq.(12)m=0Pap=0
m=0, Pap=0
f=f65
Figure 4.10: Hovering time as a function of the battery ratio
60
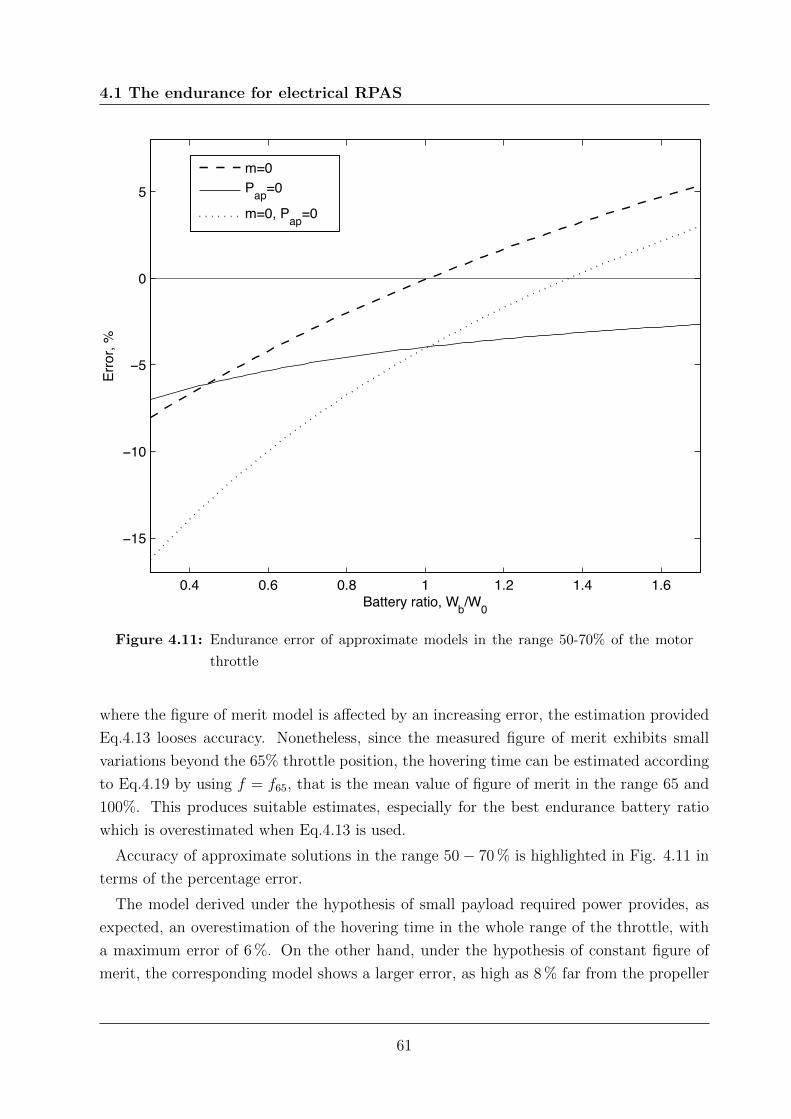
4.1 The endurance for electrical RPAS
0.4 0.6 0.8 1 1.2 1.4 1.6
−15
−10
−5
0
5
Battery ratio, Wb/W0
Erro
r, %
m=0Pap=0
m=0, Pap=0
Figure 4.11: Endurance error of approximate models in the range 50-70% of the motor
throttle
where the figure of merit model is affected by an increasing error, the estimation provided
Eq.4.13 looses accuracy. Nonetheless, since the measured figure of merit exhibits small
variations beyond the 65% throttle position, the hovering time can be estimated according
to Eq.4.19 by using f = f65, that is the mean value of figure of merit in the range 65 and
100%. This produces suitable estimates, especially for the best endurance battery ratio
which is overestimated when Eq.4.13 is used.
Accuracy of approximate solutions in the range 50− 70 % is highlighted in Fig. 4.11 in
terms of the percentage error.
The model derived under the hypothesis of small payload required power provides, as
expected, an overestimation of the hovering time in the whole range of the throttle, with
a maximum error of 6 %. On the other hand, under the hypothesis of constant figure of
merit, the corresponding model shows a larger error, as high as 8 % far from the propeller
61

4. Best Endurance Condition
0 10 20 30 40 50 60 70 800
5
10
15
20
25
30
35
Capacity, C0 [Ah]
Endu
ranc
e, t
[min
]
70%50%
flight testnumerical, Eq.(12)m=0
Figure 4.12: Experimental validation
regime where f = f0, but it provides the exact estimation when the actual figure of merit
lies in the neighborhood of f0. Also, it is worth noting that the simplest approximate
model, given by m = 0 and Pap = 0, still provides an acceptable estimation of the hovering
time, with a percentage error of about 15 % in the absence of detailed information on rotor
and payload characterization.
To validate the proposed methodology, an experimental test campaign is performed. A
total of twenty hovering flights are completed by using batteries with identical weight/energy
ratio, α, along four different nominal capacity values. Figure 4.12 presents the experimental
hovering time plotted vs. the nominal capacity.
Experimental data are compared to the analytical prediction of Eq.4.13 and constant
figure of merit approximation of Eq.4.19. Statistics of the test campaign are provided in
Tab.4.3 in terms of mean value, t, and standard deviation, σt.
Results show how the proposed approach provides a satisfactory estimation of the hov-
62

4.1 The endurance for electrical RPAS
Capacity [Ah] Take-off weight [N] Endurance [min]
Eq.(12) Experimental
C0 Wto t t σt
10 29.20 15.12 15.57 0.2902
20 36.84 22.90 22.86 0.1630
30 44.49 27.42 27.28 0.056
40 52.13 29.90 29.24 0.1522
Table 4.3: Experimental results
ering time, making the model a suitable analytical tool for the preliminary design phase.
In this respect, it is important to note that following an increase of battery capacity, the
corresponding increase in hovering time shows a negative trend. By increasing the capacity
from 10 to 20 Ah, one gains about 10 minutes of hovering time, for the considered plat-
form, which largely increases the initial endurance. A further addition of 10 Ah increases
endurance by less than 5 minutes. A further increase from 30 to 40 Ah provides only 2
minutes of additional hovering capability. These data represents a further proof for the
importance of correctly addressing the issue of preliminary sizing the battery-powered air-
craft, especially for multi-rotor platforms, on the basis of a physically sound methodology.
As a matter of fact, trying to increase the endurance of an already existing platform by
simply adding batteries may not be an effective solution, as propeller operates at higher
motor regimes, where the decreasing slope of the endurance vs. capacity plot provides only
a marginal improvement.
63

4. Best Endurance Condition
64

Bibliography
[1] Harwin S., Steve and Lucieer A.,Assessing the Accuracy of Georeferenced Point
Clouds Produced via Multi-View Stereopsis from Unmanned Aerial Vehicle (UAV)
Imagery, Journal of Remote Sensing, Vol.4, No. 6, 2012
[2] Rudol P., Doherty P., Human Body Detection and Geolocalization for UAV Search
and Rescue Mission Using Color and Thermal Imagery Aerospace Conference, Big
Sky, MT, 2008 IEEE, 1-8 March 2008
[3] Casber D.W., Beard R.W., McLain T.W., Forest Fire Monitoring With Multiple
Small UAVs, 2005 American Control Conference, June 8-10, 2005. Portland, OR,
USA
[4] Traub L.W., Range and Endurance Estimates for Battery-Powered Aircraft, Journal
of Aircraft Vol. 48, No. 2, March-April 2011
[5] Avanzini G., Giulietti F., Maximum Range for Battery-Powered Aircraft, Journal of
Aircraft Vol. 50, No. 1, March-April 2013
[6] Traub L.W., Validation of endurance estimates for battery powered UAVs, Aeronau-
tical Journal Vol. 117, No 1197, November 2013
[7] Verbeke, J., Hulens, D., Ramon, H., Goedeme, T., De Schutter, J.; The Design and
Construction of a High Endurance Hexacopter suited for Narrow Corridors, ICUAS,
27-30 May 2014, Orlando, FL, USA.
65

BIBLIOGRAPHY
[8] Roskam, J., Airplane Design. Part VII: Determination of Stability, Control and Per-
formance Characteristics: FAR and Military Requirements, University of Kansas,
Lawrence (KS), 1986, Chap. 5.
[9] Raymer, D.P., Aircraft Design : a Conceptual Approach, 4th ed., AIAA, Reston
(VA), 2006, Chap. 17.
[10] Gatti M., Giulietti F., Preliminary Design Analysis Methodology for Electric Mul-
tirotor, RED-UAS 2013,2nd IFAC Workshop on Research, Education and Develop-
ment of Unmanned Aerial Systems, November 20-22, 2013, Compiegne, France.
[11] Leishman, J. Gordon, Principles of helicopter aerodynamics, 2nd Ed.,Cambridge
University Press, Cambridge Aerospace Series, 2000, Cambridge, New York.
[12] Doerffel, D., Sharkh, S.A.; A critical review of using Peukert equation for determining
the remaining capacity of lead-acid and lithium-ion batteries, Jurnal of Power Sources
155 (2006)395-400.
[13] Shepherd C. M.,Design of Primary and secondary Cells, Journal of The Electrochem-
ical Society Vol. Vol. 112, 1965
[14] Tremblay O., Dessaint L.A.; Experimental Validation of a Battery Dynamic Model
for EV Application, World Electric vehicle Journal Vol.3 -ISSN 2032-6653 - (2009
AVERE)
[15] Gundlach, J. (2012). Designing Unmanned Aircraft Systems: A Comprehensive Ap-
proach (1 ed.). Virginia: AIAA Education series.
[16] Brandt, S. A., & Gilliam, F. T. (1995, July-August). Design Analisys Methodology
for Solar-Powered Aircraft. Journal of Aircraft, 32(4).
[17] Hanselman, D. C. (n.d.). Brushless Permanent-Magnet motor Design. New York:
McGrave-Hill.
[18] Ohad, G., & Aviv, R. (2009, Julay-August ). Optimizing Electric Propulsion Systems
for Unmanned Aerial Vehicles. Journal of Aircraft , 46(4).
[19] Prouty, R. W. (2002). Helicopter Performance, Stability, and Control . Malabar -
Florida: Krieger Publishing Company, inc.
[20] Shiau, J.-K., Der Ming, M., Chih-Wei, C., & Jie-Ren, S. (2010, March-April). Op-
timal Sizing and Cruise Speed Determination for a Solar-Powered Airplane. Journal
of Aircraft, 47(2).
66

BIBLIOGRAPHY
[21] Brandt J.B., Selig M.S., Propeller Performance Data at Low Reynolds Numbers,
University of Illinois, Urbana, 2011, 49th AIAA Aerospace Sciences Meeting, AIAA
2011-1255
[22] MIT Electrical Vehicle Team, A Guide to Understanding Battery Specifications,
December 2008
[23] Coleman P.C., NASA TR 3675 - A Survey of Theoretical and Experimental Coaxial
Rotor Aerodynamic Research, Ames research Center, Moffett Field, california, 1997
[24] Shepard C.M., Theoretical Design of Primary and Secondary Cells - Part III - Battery
discharge equation , NRL Report 5908, US Naval research Laboratory, Washington
DC, May 2, 1963
[25] tremblay O., Dessaint L.A., Experimental Validation of a Battery Dynamic Model
for EV Application, Electric Vehicle journal Vol. 3, ISSN 2032-6653, 2009 AVERE
[26] Jung-Ki Park, Principles and Applications of Lithium Secondary Batteries, Wiley,
ISBN: 978-3-527-33151-2, August 2012
[27] Jha A.R. Next-Generation Batteries and Fuel Cells for Commercial, Military, and
Space Applications, CRC Press - Taylor and Francis Group
[28] Handbook of Batteries, D. Linden - T.B. Reddy Editor, 3th Edition, McGraw-Hill
67