Embed Size (px)
Citation preview

Design and Preliminary Characterization of the Magnetically Stabilized Gliding Arc Discharge
A Thesis
Submitted to the Faculty
of
Drexel University
by
Shailesh Pradeep Gangoli
in partial fulfillment of the
requirements for the degree
of
Master of Science
September 2007

ii
© Copyright 2007
Shailesh P. Gangoli. All Rights Reserved.

i
Acknowledgements
I would like to thank my research advisors, Dr. Alexander Fridman and Dr. Alexander Gutsol for
their outstanding guidance during my pursuit of this research.
I would like to thank our research sponsors and collaborators. The research discussed in this
thesis was sponsored by Air Force Office of Scientific Research (AFOSR). It was conceived in
collaboration with the combustion group at Princeton University namely, Timothy Ombrello and
Dr. Yiguang Ju.
Also, I would like to thank other faculty members associated with the DPI – Dr. Alexander
Dolgopolsky, Dr. Young Cho, Dr. Victor Vasilets and Dr. Gary Friedman, with whom I have had
several fruitful discussions.
Special thanks to David Staack, my good friend and optical emission spectroscopy mentor. He
was instrumental with his guidance during plasma characterization discussed in this thesis.
Thanks to the brothers and sisters of DPI, for their unfailing support and companionship during
the course of this work.
Thanks to my parents, Pradeep and Vidya Gangoli and elder brother, Gautam Gangoli, for their
encouragement and support in my pursuit for higher studies at Drexel University.
Thanks to my wife, Harriet, the best thing that ever happened to me. She was my pillar of support
at all times.

ii
Table of Contents
List of Figures ................................................................................................................................. iv
Abstract ........................................................................................................................................... vi
Chapter 1: Introduction ................................................................................................................... 1
1.1. What is Plasma? .................................................................................................................... 1
1.2. Types of Plasma .................................................................................................................... 2
1.2.1. Equilibrium or Thermal Plasma ..................................................................................... 2
1.2.2. Non-Equilibrium or Non-Thermal Plasma .................................................................... 3
1.3. Methodology of generation of plasma discharges ................................................................ 4
Chapter 2: Background and Motivation .......................................................................................... 8
Chapter 3: The Gliding Arc Discharge ......................................................................................... 11
Chapter 4: The Magnetic Gliding Arc (MGA) .............................................................................. 14
4.1. Principle of the Magnetic Gliding Arc ................................................................................ 14
4.2. Design and Operation of MGA ........................................................................................... 15
4.3. Magnetic Field Strength (B) .............................................................................................. 17
4.4. Rotating Plasma Disk and Quasi-Uniformity ......................................................................... 18
4.5. Power Supply ...................................................................................................................... 20
Chapter 5: Experimental Characterization of the MGA ................................................................ 22
5. 1. OH (A2Σ, υ=0 X2П, υ’=0) Spectrum for Rotational Temperature ................................ 22
5. 2. The N2 Spectrum (C – B) for Rotational and Vibrational Temperature ............................ 25
5. 3. Electric Field in MGA plasma arc ..................................................................................... 27

iii
5. 4. Average Electron Energy Estimations ............................................................................... 29
5. 5. Current Density Estimations .............................................................................................. 29
5. 6. Electron Density Estimations ............................................................................................. 31
5.7. Voltage – Current Characteristics ....................................................................................... 32
Chapter 6: Discussion and Conclusions ......................................................................................... 33
Chapter 7: Bibliography ................................................................................................................. 36

iv
List of Figures
Figure 1. Examples of naturally occurring and artificially generated thermal plasmas, here (a) Lightning and (b) Arc discharge ...................................................................................................... 3 Figure 2. Examples of naturally occurring and artificially generated thermal plasmas, here (a) Aurora and (b) Dielectric Barrier Discharge at Drexel Plasma Institute ......................................... 4 Figure 3. Examples of naturally occurring and artificially generated thermal plasmas, here (a) Lightning and (b) Arc Discharge ..................................................................................................... 5 Figure 4. Characteristic Voltage Current (VI) curve for electrical plasmas [5] ............................... 6 Figure 5. A traditional flat gliding arc discharge operating in atmospheric pressure air ............... 10 Figure 6. The transition of gliding arc discharge from thermal to non-thermal regime of operation illustrated by a schematic of arc elongation and electric field measurements [26] ........................ 11 Figure 7. The transition of gliding arc discharge from thermal to non-thermal regime of operation illustrated by comparison between high speed camera and regular camera shots ......................... 12 Figure 8. Schematic of the newly developed Magnetic Gliding Arc (MGA) setup; 1 – Inner electrode (usually high voltage cathode), 2 – Outer electrode (grounded anode), 3 – Wire attached to inner electrode in a spiral configuration, 4 – Ceramic ring magnets, 5 – axially oriented magnetic field, 6 – flat profile nozzle, 7 – treated gas ................................................................... 15 Figure 9. Photos of the Magnetic Gliding Arc ............................................................................... 16 Figure 10. Simulation of magnetic flux lines in the MGA reactor (arb. units) that confirms the direction of magnetic field to be axial. .......................................................................................... 17 Figure 11. Simulation of the magnetic field strength (Tesla) along the radius of the reactor, at the location of stabilization of the arc that confirms the magnetic field being uniform at 0.12 T ....... 18 Figure 12. Experimental measurements and simplified model predictions of variation in the frequency of rotation of MGA plasma as a function of discharge current ..................................... 19 Figure 13. Power Supply custom-manufactured by Quinta Ltd. for the MGA .............................. 21 Figure 14. Experimental OH Spectrum obtained from the discharge at operational current of 40 mA. Also, theoretical spectra was generated in steps of 500K from 1000 K– 6000 K. A comparison is made to determine plasma (OH) rotational (~ translational) temperature. ............. 23 Figure 15. G0/GREF and G1/GREF ratios as a function of gas temperature, comparison of these ratios with experimental spectrum yields the range of OH rotational temperature ~ 2350 K ± 150 K ... 24 Figure 16. OH rotational temperature predicted by Spectrum Analyzer software [33] is 2360 K ± 400 K .............................................................................................................................................. 24

v
Figure 17. N2 vibrational temperature predicted by Spectrum Analyzer software [33] is 3500 K ± 600 K .............................................................................................................................................. 25 Figure 18. Comparison between experimental and theoretical prediction of rotational (3000 K) and vibrational temperature (4000 K) by SpecAir code ................................................................ 26 Figure 19. Comparison between high speed camera shots of the MGA different operational currents, (a) 44 mA, (b) 140 mA and (c) 220 mA ......................................................................... 28 Figure 20. Current density estimations in the NG and PC portions (shown in figure 20) of the MGA discharge .............................................................................................................................. 30 Figure 21. Voltage current characteristic curve recorded for the MGA plasma, it is observed that the curve shifts upwards (higher voltages) with increase in flow rates ......................................... 32 Figure 22. Snapshots of the MGA at different exposure times (top view) .................................... 33

vi
Abstract Design and Preliminary Characterization of the Magnetically Stabilized Gliding Arc Discharge
Shailesh P. Gangoli Alexander Gutsol and Alexander Fridman
Supersonic combustion is characterized by high flow speeds and consequently, short residence
times for ignition, flame stabilization and reaction completion. Hydrocarbon fuels that are of
major interest due to their high density and endothermic decomposition properties have longer
ignition and combustion times than that of hydrogen. Hence, there is a crucial need to
dramatically shorten the ignition time and to enhance the combustion and flame stabilization.
From the viewpoint of chemical kinetics, combustion is a chain process with two limiting
reactions: chain-initiation and chain-continuation. Plasma as a source of free radicals and ions can
significantly reduce the chain initiation time.
The best plasma discharge system should generate non-equilibrium plasma with high
concentration of active species and intermediate (better adjustable) temperature, high enough to
support chain continuation reaction. The discharge that suits the above description is the Gliding
arc (GA) plasma discharge. This unique discharge has relatively high plasma density (1012-1014
cm-3), power and operating pressure in comparison with other non-equilibrium discharges; higher
electron temperature (> 1 eV), relatively low gas temperature (< 3000K) and good chemical
selectivity in comparison with thermal discharges.
The GA discharge however, can be very unstable for study purposes. Hence, we develop a novel
gliding arc system that is driven and stabilized by a magnetic field. In this thesis, we discuss the
design and preliminary characterization of the stabilized magnetic gliding arc (MGA) discharge.
It is confirmed from our measurements and estimations that the MGA is a non-equilibrium GA
discharge that can be coupled with a counter flow burner for ignition and combustion studies.

1
Chapter 1: Introduction
1.1. What is Plasma?
Elementary school science taught us about the existence of three states of matter namely, solids,
liquids and gases. In the order mentioned, one state of matter converts to another when energy is
provided. If a gas is provided with sufficient additional energy, it transforms into “plasma” or an
“ionized gas”. It is often referred to as the “fourth state of matter”.
Just like other states of matter, plasmas occur naturally as well. Lightning and Auroras are some
classic examples. However, plasmas can be generated artificially at laboratory levels for practical
applications. It is understood that a continuous source of energy is required to generate and
sustain a state of matter. Man-made plasmas are commonly generated and sustained using
electrical energy and are often referred to as ‘discharges’.
In general, plasmas are realized by the generation of free electrons that make the gas conductive.
These electrons obtain energy from the electric field and further ionize, excite and dissociate gas
molecules via energy transfer during collisions. This makes plasmas very reactive. Also, plasmas
possess higher temperatures and energy densities in comparison with most other chemical
processes which make them interesting and efficient for various applications. They can be
generated over a wide range of pressures and differ in electron temperatures and densities. Most
applied plasmas have electron temperatures between 1 – 20 eV (1 eV ≈ 1.6·10-19 Joule ≈ 11600 K)
and densities between 106 – 1018 (electrons/cm3) [1].
The applicability of artificially generated plasma varies based on its nature. Hence, it is necessary
to identify and classify the nature of plasma generated in order to evaluate its candidature for a
given application. This classification is discussed in the next section (1.2).

2
1.2. Types of Plasma
Based in the nature of energy distribution plasmas can be broadly classified into two kinds
namely, 1) Equilibrium or Thermal plasma and 2) Non-Equilibrium or Non-Thermal plasma. As
discussed earlier, electrons gain energy from the electric field E, and lose this energy via
collisions with neutrals. With an increase in pressure of operation p, the number of collisions
increases. As the number of collisions increase, more energy is transferred from electrons to
neutral species causing them to go closer to equilibrium. A parameter named reduced electric
field E/p is considered here, which gives us an idea about the average energy that an electron
possesses in plasma. Greater the value of E/p (higher E and/or lower p) the further apart is the
average energy of the electrons from gas molecules. It is reported that this difference proportional
to the square of the ratio E/p [1].
1.2.1. Equilibrium or Thermal Plasma
As the name suggests, thermal plasmas are ‘hot’. They have high gas temperatures (usually >
10,000K). Due to equilibrium distribution of energy between electrons and gas molecules, the
average electron temperature (Te) ≈ average gas temperature (Tg). Hence, thermal plasmas are
characterized by low E/p values. These plasmas are usually sustained at high power densities
(power input per unit volume) and have low chemical selectivity. Also, the number density
(number per unit volume) of electrons (ne) is comparable to that of the gas (n), i.e. Ionization
degree, ne/n ≥ 10-3.
Lightning and thermal arc discharges (shown in figure 1 [2, 3]) are examples of naturally
occurring and artificially generated thermal plasmas, respectively.

3
Figure 1. Examples of naturally occurring and artificially generated thermal plasmas, here (a) Lightning and (b) Arc discharge
1.2.2. Non-Equilibrium or Non-Thermal Plasma
On the other hand, non-thermal plasmas are characterized by high E/p values. This implies that
the average electron and gas temperatures significantly differ from each other, hence the title
‘non-equilibrium’ plasma. Here, electron temperature (Te) >> gas temperature (Tg). The gas
temperatures in non-thermal plasmas can vary from 300 – 3000 K. They operate at low power
densities and but have very good chemical selectivity. Also, the ionization degree is usually ne/n
≤ 10-5 in these plasmas.
Auroras and low pressure glow discharges (shown in figure 2 [4]) are examples of naturally
occurring and artificially generated plasmas respectively.

4
Figure 2. Examples of naturally occurring and artificially generated thermal plasmas, here (a) Aurora and (b) Dielectric Barrier Discharge at Drexel Plasma Institute
1.3. Methodology of generation of plasma discharges
The simplest way to generate a plasma discharge is by applying a direct current (DC) electric
field between two electrodes (for example, in gliding arc discharges as shown in figure 3). Let us
assume that we have air in between the two electrodes. Air is a dielectric, meaning it is capable of
forming a conducting channel (dielectric breakdown) under the influence of a high enough
electric field. An air plasma channel can be initiated by applying about 30 kV·cm-1. This
breakdown voltage varies with the type of gas used and the ‘pd’ value given by the Paschen
curves [2]. Here, p is the pressure of operation and d is the distance between electrodes.
Once a conducting plasma channel is initiated, it can be sustained a much lower electric field as
compared to that required for breakdown. The temperature of neutrals is controlled by energy
transfer via collisions, as discussed earlier. The number of interactions between electrons-neutrals

5
Figure 3. Examples of naturally occurring and artificially generated thermal plasmas, here (a) Lightning and (b) Arc Discharge
increases with pressure and so does the degree of ionization. Hence, at higher pressures
(atmospheric) there is a tendency overheat the gas/electrodes and thus, transition into thermal
regime of operation. The overheated electrodes emit additional electrons via thermal emission
accompanied by erosion, which may be undesirable for controlled applications.
It is however, possible to control the regime of plasma operation and create non-equilibrium
plasma. Some of the methods are as follows –
1. Lowering the pressure of gas. This is the most obvious method of avoiding overheating of the
gas and electrodes. Due to an increase in mean free path (distance travelled by a particle
between successive collisions), the electrons gain more energy from the electric field a
transfer less energy via collisions. Hence, the electron temperature deviates from gas
temperature (i.e. high E/p). Further, energetic ions accelerate towards the cathode and
bombard its surface causing emission of secondary electrons.

6
2. Using a ballast resistor in series with plasma. Electric current is the main source of electrons
in a discharge. Hence, higher current usually leads to equilibrium operation of the discharge.
By employing external ballast resistor in series with the plasma, the current flow through the
circuit is restricted. Based on the regimes of operation, a characteristic Voltage-Current (V-I)
dependence [5] is exhibited by electrical discharges as shown in figure 4.
Figure 4. Characteristic Voltage Current (VI) curve for electrical plasmas [5]
3. Cooling the discharge. Even at higher pressures, plasma can be cooled either conductively or
convectively in addition to restriction of electric current.
a. Size of the discharge. Reducing the size of the discharge ensures increased
conductive cooling and thus, non-thermal operation plasma. For example,
atmospheric pressure DC glow micro-discharge [6].
b. Forced convective cooling of the plasma. Discharges can be forced to move and
elongate by transverse gas flow or using a magnetic field. For a restricted amount of

7
power input, discharge elongation leads to rapid decrease in current (electron density)
and increase in voltage (electron energy) to sustain the plasma. Also, the gas
molecules cool down due to convective cooling and the electrodes are not
overheated. This results in a transition of the operational regime from thermal to non-
thermal, as observed in gliding arc discharges (Chapter 3).
4. Using an alternating current (AC) source and isolating the electrodes with a thin dielectric
layer. Plasmas generated by the following arrangement are commonly known as dielectric
barrier discharges (DBD). Here, the electrons are not lost to the anode, but get momentarily
deposited onto the surface of dielectric. When the field changes polarity, they are propelled
back into the plasma volume. This serves are a secondary electron source that helps sustain
the plasma.
5. Using high frequency alternating polarity source with/without dielectric layer. Discharges are
operated at high frequencies (Radio Frequency – MHz or GHz) with or without dielectric
layer, so as to isolate the effect of electrodes as much as possible. Such discharges
(capacitively coupled plasmas, CCP) are known to operate in α and γ modes of operation [7,
8] based on the importance of electrodes on sustenance of the discharge.
Plasmas are often arranged in electrode-less configurations, for e.g. inductively coupled plasmas
(ICP). Here, the discharge is completely isolated from physical interaction with the electrodes. A
high current is passed through an inductor coil, which produces an induced magnetic field and in
turn induces an electric field. Such discharges require low pressures of operation in order to have
a reasonable value of E/p, due to low values of induced electric field.

8
Chapter 2: Background and Motivation
With the rapid development in high speed air breathing propulsion scramjet engines there exists
constant desire to design an efficient yet powerful supersonic combustion system. This efficiency
can be achieved by uniform treatment and complete combustion of incoming charge, before it
exits the ignition chamber. With achievable speeds ranging up to several Mach numbers (Mach 1
= speed of sound in air), the residence time in the combustor maybe on the order of reaction time
of hydrocarbon fuels that have longer ignition delay times. In addition to faster ignition,
sustenance of combustion is also of vital importance.
Over several decades, many solutions have been put forth to address these issues. Some examples
of proposed solutions are passive cavity flame holders [9-13], pre-combustors [14-16] and also
plasmas [17-23]. The first two solutions have their disadvantages such as flammability limits of a
mixture and / or requirement for an additional combustion chamber. On the other hand, plasma
based ignition is not constrained by these limitations and hence seems promising. It is however,
very important to identify the best kind of plasma system that can be utilized for ignition and
combustion systems.
Thermal plasmas such as arc discharges, plasma torches, and radio frequency inductively coupled
plasmas (RF-ICPs) operate at high power densities. As discussed earlier, there is equilibrium
energy distribution into all degrees of freedom. The gas and electron temperatures are both very
high (usually ≥ 10000 K). However, it is not required to have such high gas temperatures from
the point of view of ignition. This results in poor selectivity of chemical reactions during the
ignition process. Considering the large size of a supersonic combustion chamber, scaling up the
thermal discharge for uniform treatment would require a lot more power. Further, the electrodes

9
in thermal discharges such as plasma arcs and torches experience heavy erosion, which may
entail maintenance (and replacement) costs from time-to-time.
On the other hand, non-equilibrium plasmas such as direct-current glow, corona, radio frequency,
microwave, and nanosecond high-voltage discharges have high chemical selectivity. However,
due to typically low power densities, the gas temperatures are lower than that required for
ignition.
Therefore, an ideal plasma discharge for energy applications should have intermediate
temperatures between that of thermal and non-thermal plasma. The temperatures should be high
enough for the ignition of a fuel-oxidizer mixture, and should be capable of homogeneously
activating the incoming charge, providing simultaneously high chemical selectivity of reactions,
high electron temperatures and high plasma densities (ne) with low power requirements. The
discharge that aptly fits the above description is the Gliding Arc (GA). The GA is a unique non-
thermal plasma that has relatively high plasma density, power and operating pressure in
comparison with other non-equilibrium discharges; high average electron energy (> 1 eV),
relatively low gas temperatures (300 ≤ Tg < 3000 K) and good chemical selectivity in
comparison with thermal discharges. The GA is also known for its simple construction and ease
of applicability.
The traditional flat GA (figure 5) is a highly transient system with continuously changing plasma
properties. For the study ignition and combustion properties of the GA, we need a discharge
system with controllable parameters. The current goals of this thesis / research are,
1. Develop a stabilized GA discharge that can be integrated with a counter-flow burner system
(known for its ease of study by the combustion research community).
2. In addition to stabilization, the system needs to be characterized as intermediate temperature
non-thermal plasma.

10
Figure 5. A traditional flat gliding arc discharge operating in atmospheric pressure air
11
Chapter 3: The Gliding Arc Discharge
The phenomenon of evolution of the gliding arc is similar to that of Jacobs’ ladder [24]. The GA
is generated at atmospheric pressure and is typically arranged in series with a ballast resistance
(10 kΩ – 200 kΩ). Figure 3 shows a schematic of the gliding arc setup. A DC high voltage (~ 10
kV) is applied between two diverging electrodes. The arc initiates at the shortest gap between the
two electrodes, after which it elongates by transverse gas flow. At this point in time, the current in
the arc is at its maximum value and the voltage at the lowest (quasi-thermal regime). A transverse
gas flow is introduced that moves the arc from its initial position and elongates. The elongating
arc demands more power to sustain itself, until it reaches the maximum that the power supply can
provide. At this point the power drop on both plasma and external resistance is known to be 50 %
of the total power [1, 20, 25]. This is the point transition for the regime of operation of the GA.
Due to continuous gas flow, the length of the arc continues to grow, but the power supplied by the
source is insufficient to balance the convective energy losses to the surrounding gas.
Figure 6. The transition of gliding arc discharge from thermal to non-thermal regime of operation illustrated by a schematic of arc elongation and electric field measurements [26]

12
During this time, plasma draws more voltage from the source at the expense of current to sustain
itself. The electric field increases as the arc elongates beyond the transition point (figure 6) and so
does the average electron energy. This causes the ionization mechanism to change into a non-
thermal one, i.e., step-wise (thermal) to direct (non-thermal). Due to instability, the arc cools
down and finally extinguishes, marking the end of one cycle. The next cycle of arc evolution
begins as voltage in the gap reaches its breakdown value and initiates at the shortest gap once
again (easiest path for current flow). Enlisted in the table below are experimental parameters
reported for gliding arcs [1]. Figure 7 shows a comparison of high speed camera and regular
camera snapshot of gliding arc during operation (it shows a single arc in motion at various stages
of evolution). A detailed description of the physics involved in the evolution and transition of GA
can be found in [1, 19, 20, 25, 26].
Figure 7. The transition of gliding arc discharge from thermal to non-thermal regime of operation illustrated by comparison between high speed camera and regular camera shots

13
Table 1. Parameters of the Flat Gliding Arc Discharge
Property Name Value Electron Temperature (eV) ~ 1 - 1.5 Electron Density (1/cm3) 1011 – 1014 Gas Temperature (K) 300 – 3000 Average Power Density (W/cm3) 10 – 300 Ionization Mechanism Stepwise / Direct Discharge Cycle (millisecond) 2 – 10 Current (A) 0.01 – 10 Power (kW) 0.03 – 100

14
Chapter 4: The Magnetic Gliding Arc (MGA)
4.1. Principle of the Magnetic Gliding Arc
As discussed in chapter 2, one of the key problems in the employment of traditional flat GAs for
purposes of combustion studies is that the discharge extinguishes rapidly due to instability, after
transition into the non-equilibrium regime [1, 19, 25, 27]. This highly transient nature of the
discharge does not make it conducive for purposes of controlled studies. However, it was found
that the gliding arc can be stabilized well past the transition point before extinction, so called
‘overshooting’ effect [20] during a given cycle of operation. This result was of vital importance
as it opened up the possibility of stabilization of a strongly non-equilibrium gliding arc discharge.
One of the technical solutions to achieve this was to drive and elongate the arc using a force other
than transverse gas flow.
We used the concept of Lorentz force, wherein a moving charge in a magnetic field is subjected
to a force. The direction of motion of the charge due to this force is determined by the well-
known right-hand-rule; if you orient your right hand palm open, such that the fingers determine
the direction of magnetic field and the thumb points towards the direction of motion of the
charge, then the palm faces the direction of force experienced.
In DC discharges like the MGA, the polarity between electrodes is constant (not alternating).
Even though directions of motion (between electrodes) of negatively (electrons) and positively
charged species are opposite, they experience a force in the same direction due to their charge.
This facilitates the motion of the arc as a single unit. Building further on this concept, an Ampere
force is experienced by a current carrying conductor in a magnetic field. The strength of this force
is proportional to sine of the angle between conductor length and the magnetic field (maximum at

15
angle ~ 90°). In principle, if we drive an arc using a magnetic field normal to two infinitely long
parallel electrodes, it can be stabilized without blowing out.
4.2. Design and Operation of MGA
The MGA is setup in the form of a cylindrical reactor with concentric stainless steel electrodes. A
DC field is applied between the central cathode (high voltage) and outer grounded anode (or vice-
versa). Figure 8 shows a schematic of the MGA setup. A wire is attached to the inner electrode
that is spirally wound about the axis and along the length of the reactor. The end of the wire is
arranged such that it is separated from the outer electrode by an air gap of about 2 mm.
Figure 8. Schematic of the newly developed Magnetic Gliding Arc (MGA) setup; 1 – Inner electrode (usually high voltage cathode), 2 – Outer electrode (grounded anode), 3 – Wire attached to inner
electrode in a spiral configuration, 4 – Ceramic ring magnets, 5 – axially oriented magnetic field, 6 – flat profile nozzle, 7 – treated gas

16
Permanent ceramic ring magnets (donut shaped) are then mounted around the external grounded
electrode as shown in the schematic (figure 8). An inlet for air and fuel mixtures is facilitated at
the bottom of the reactor. To begin with, a high voltage is applied to initiate a breakdown of the
gas (here air) at the shortest gap between electrodes and quasi-thermal arc plasma is established.
The direction of applied electric field (and hence current) is radial. Based on the orientation of the
magnetic field (upward or downward) normal to the current, the arc experiences a clockwise or
anti-clockwise force that drives it in the tangential direction at all times. Due to this tangential
force, the arc moves along the spiral wire and elongates on its way. The distance between
electrodes is largest at the point of attachment of the spiral wire to the inner electrode. Thus, the
arc does not elongate beyond this point and gets stabilized on a plane formed by its revolution
about the axis of the reactor, along the circumference of two concentric electrodes. The elongated
rotating arc is rotates in the non-equilibrium plasma leading to more rapid cooling and
intermediate temperatures (2000 K – 3000 K, section 5.1, 5.2) as well as an increase in electric
field and average electron temperatures (> 1eV, section 5.4). Photographs of the MGA setup can
be seen in figure 9. The top view shows the plasma disc that is formed due to the motion of the
arc, ensuring ‘quasi-uniform’ activation of flow (section 4.4).
Figure 9. Photos of the Magnetic Gliding Arc

17
4.3. Magnetic Field Strength (B)
A finite element based software, Ansoft Maxwell SV was used to estimate the magnitude and
predict the variation of magnetic field strength in the zone where the plasma rotates. The 2D
simulation result presented in figure 10 shows that the magnetic flux lines (arbitrary units) are
parallel to the axis of the reactor (on the inside). This further bolsters the fact that magnetic field
in the system is normal to the radial direction at all times, assuring tangential motion of the arc.
Figure 11 shows a plot of variation of the magnetic field as a function of the radial distance about
the axis of the reactor at the plane where the arc stabilizes. The calculated average magnetic field
in the discharge zone is uniform and has magnitude of ~ 0.12 Tesla. This is a reasonable estimate
for the magnetic field typically produced by ceramic magnets. This result was further confirmed
using a Hall probe, where the magnetic field strength was found to be 0.1 Tesla.
Figure 10. Simulation of magnetic flux lines in the MGA reactor (arb. units) that confirms the direction of magnetic field to be axial.

18
Figure 11. Simulation of the magnetic field strength (Tesla) along the radius of the reactor, at the location of stabilization of the arc that confirms the magnetic field being uniform at 0.12 T
4.4. Rotating Plasma Disk and Quasi-Uniformity
As shown in figure 12, frequency of plasma arc rotation ranges from approximately 20 Hz (30
mA) to 50 Hz (90 mA) and only decreases by a few percent when the flow rate is increased [28].
From our concept of Ampere force, higher magnetic field or higher current (in our case) implies
greater tangential force and hence, faster rotation. When the arc reaches the largest gap, it rotates
at a fixed axial position where it no longer elongates i.e. its stabilized. The GA moves repeatedly
through a media that was previously ionized and hence sustains itself. Since the frequency of
rotation of the arc is fast when compared to the gas velocity (under specific conditions), we
expect to have ‘quasi-uniform’ activation of the flow.

19
Figure 12. Experimental measurements and simplified model predictions of variation in the frequency of rotation of MGA plasma as a function of discharge current
A simple model is proposed [27, 28] to estimate the flow rate, Q, of gas that could be quasi-
uniformly activated by the gliding arc. The largest distance between electrodes is about 10 mm,
where the arc stabilizes and rotates under the influence of magnetic field B, of 0.12 Tesla
(estimated value from simulations). Due to intermediate temperatures (relatively high compared
to ambient air) in plasma, it can be assumed that arc is “not transparent” to the surrounding air,
i.e. it experiences a drag force as it rotates. Hence, the plasma arc behaves like a current carrying
cylinder (wire) which experiences two sets of forces namely, Ampere Force per unit length Fa =
IB (assuming the current and magnetic field are normal at all times) and Drag Force per unit
length, . Here, Cd is the Coefficient of Drag ρ, the density of air (~1.29 kg·m-3), u,

20
the velocity of propagation of the arc and d, the approximate diameter of the arc. Under steady
state or equilibrium conditions we can approximate: Fa = Fd. The limits for the drag coefficient
for a very wide range of Reynolds numbers (from 102 to 105) are 1.3 < Cd < 1 [29].
Let us consider a specific case of 40 mA of operation. We use the above parameters in the force
balance equation proposed earlier. The arc that is stabilized is approximately 0.38 mm in diameter
(d, measured using high speed camera), moves relative to the gas flow at a velocity of
approximately 2.7 m·s-1. Using the mean diameter of the reactor to compute the circumference
covered during one rotation we can estimate the average rotation frequency of the arc ~ u/(πD),
where, D is the diameter (~ 3 cm) of the reactor. The corresponding average rotation frequency
value ~ 2.7/ (π*0.03) ~ 20 Hz. This value matches up reasonably well with experimental value
reported in figure 12 (40 mA in figure). This means that at 40 mA current, the arc will appear at
the same location 20 times in a second. Hence, the flow will be treated for sure if it passes the
diameter of the arc within (~1/20 sec) 0.05 sec. So, the velocity of air flow that will be treated
uniformly by the discharge is approximately d/τ, which upon calculation gives us 1.57 cm/s. This
corresponds to a flow rate Q of ~ 9 cm3·s-1 or 520 standard cubic feet per minute (SCCM). Based
on this simplified model, the predicted rotational frequency compares well with that
experimentally obtained (shown in figure 12).
4.5. Power Supply
The electrical circuit typically used for gliding arc discharges is as shown in the figure 3. As
discussed earlier the quasi-thermal regime exists (due to restriction of current by external
resistance) as long as the power supply is capable of providing energy enough to compensate for
loses to the surrounding during arc elongation. The transition to non-thermal regime happens at a
critical point, when the power drop in plasma is equivalent to that dropped on the external

21
resistance. In order words, this happens when the plasma resistance nearly equals the external
resistance [1, 20, 25, 26].
A power supply was custom made (Quinta Ltd.) for the magnetically stabilized gliding arc with
the capability of restricting current, while maintaining smooth current regulation. This was
accomplished by minimizing the active energy losses with the use of a reactive capacitive
resistance that imitates the resistive voltage at all times. To minimize the output electric capacity
and to provide the voltage-current characteristic of the power supply (which is close to the
resistive voltage-current characteristics), changing the frequency of the high voltage converter
allowed variation of the virtual resistance. After the output rectifier, there was unidirectional
voltage and current with a very high frequency of the residual pulsation (a pulsed DC source).
The plasma arc behavior was then the same as that for the plasma arc at a constant current and
voltage because of the limited time response of the gliding arc. This ensures that it operated more
or less in the non-thermal regime. Also, during operation the current can be reduced manually
(causing corresponding increase in voltage), to lower values than that were possible before it
extinguishes and restarts again (i.e. instability sets in). Figure 13 shows a picture of the custom
made power supply.
Figure 13. Power Supply custom-manufactured by Quinta Ltd. for the MGA

22
Chapter 5: Experimental Characterization of the MGA
The traditional flat gliding arc has been well studied over the years in [1, 19, 20, 25, 26].
Whereas, the MGA is a novel discharge that needs to be characterized in order to establish its
non-equilibrium nature. Optical diagnostic techniques were employed in order to obtain average
rotational and vibrational temperatures in the MGA with emission spectra obtained from OH and
N2 species from the discharge were used.
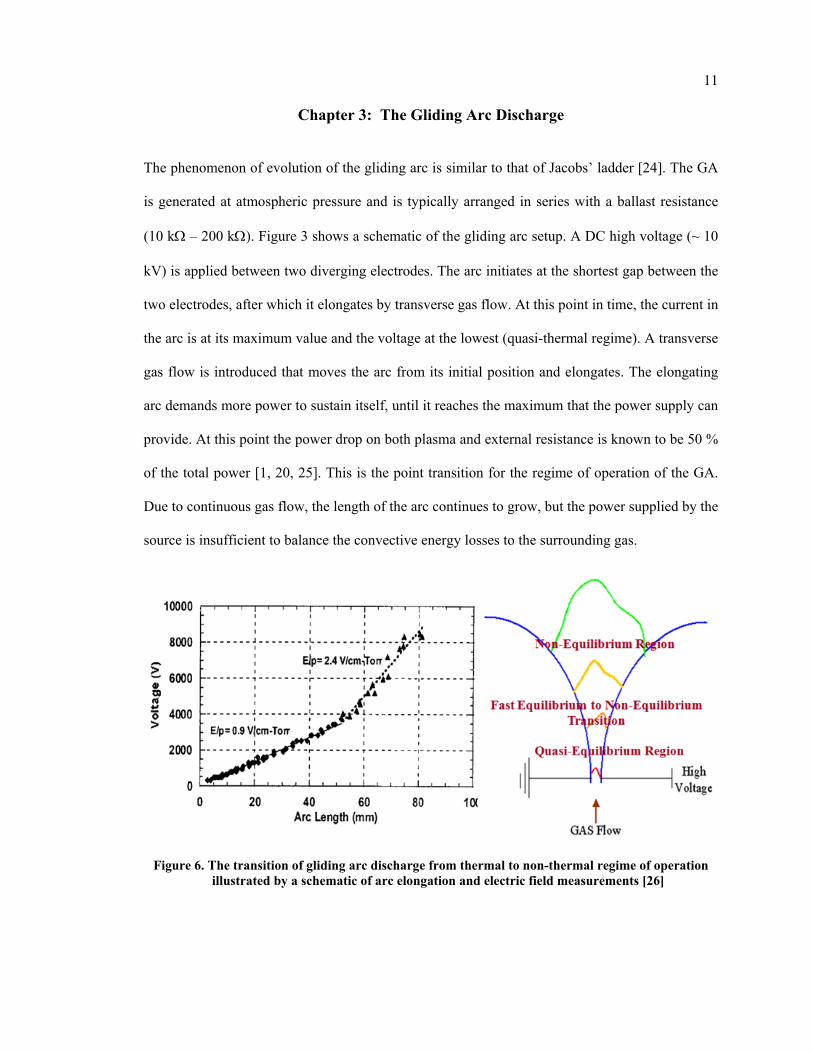
5. 1. OH (A2Σ, υ=0 X2П, υ’=0) Spectrum for Rotational Temperature
A spatially averaged optical spectrum was obtained from the MGA plasma disk operating at
approximately 40 mA at normal pressure in air. The experimental spectrum, as seen in figure 14,
had three major lines, G0, G1, and GREF that were of the most importance in the temperature range
from 1000K – 4000K. This is because the reference peak, GREF is the strongest group of
unresolved lines and G0 and G1 are highly sensitive to temperature variation in this range. For
temperatures above 4000K their sensitivity is relatively low [30]. Hence, the ratios of these peaks
are best considered for diagnostic analysis. A theoretical spectrum was then generated by using
the technique specified in Izarra [30] and Pellerin et al. [31] by collecting data pertaining to the
OH spectrum as studied by Dieke & Crosswhite [32] in the paper of Izarra , wherein weak
transitions were neglected and a set of delta functions corresponding to the strong transitions were
generated from the relation below,
·
Where, is the intensity of the OH transitions (nm) and occurs at a specific wavelength, is
the energy of the initial state and is the temperature at which the reference intensities
23
Figure 14. Experimental OH Spectrum obtained from the discharge at operational current of 40 mA. Also, theoretical spectra was generated in steps of 500K from 1000 K– 6000 K. A comparison is
made to determine plasma (OH) rotational (~ translational) temperature.
were obtained. The parameters were taken from the fundamental data found in Izarra [30]. The
ratio of the partition functions – ⁄ , was assumed to be unity. By using different
values of temperature, T, the corresponding normalized intensities were computed. Delta
functions corresponding to each transition were then convolved with an apparatus function (i.e.
impulse response of the optical device) obtained by employing sharp lines emitted by a low
pressure mercury lamp. Figure 14 shows a theoretical plot for temperatures in 500 K increments
for the range of 1000 K – 6000 K and their comparison with those measured in experiments. The
best fit of the ratios of G0 and G1 to GREF yielded a rotational temperature of 2350 K ± 150 K, as
shown in figure 15. The rotational temperature results obtained from the theoretical analysis
above were compared with Spectrum Analyzer [33] software to identify peaks and compute

F
F
Figure 15. G0/Gwith expe
Figure 16. OH
GREF and G1/erimental spec
rotational tem
/GREF ratios actrum yields th
mperature pre
as a function ohe range of OH
edicted by SpeK
of gas temperaH rotational t
ectrum Analyz
ature, compartemperature ~
zer software [
rison of these r~ 2350 K ± 150
[33] is 2360 K
24
ratios 0 K
± 400

25
rotational and vibrational temperatures. The results obtained from Spectrum Analyzer are more
refined when larger numbers of correctly identified lines are used. The results obtained (figure
16) agreed with our earlier estimations, giving an average OH rotational temperature of ~ 2360 K
± 400 K.
5. 2. The N2 Spectrum (C – B) for Rotational and Vibrational Temperature
A spatially averaged N2 spectrum was obtained from the MGA plasma disk operating at
approximately 40 mA at normal pressure in air.
Figure 17. N2 vibrational temperature predicted by Spectrum Analyzer software [33] is 3500 K ± 600 K
Using the SpecAir code [34, 35], the experimental and theoretical plots were compared and using
best fit analysis, the rotational temperature of 3000 K was obtained using the N2 (electronic

26
transition, C3Пu–B3Пg) line at wavelength 337.1 nm. This result was in agreement with
investigations reported earlier pertaining to gliding arcs [25, 36]. The vibrational temperature
computed using the Spectrum Analyzer software [33] (as shown in figure 17) was found to be ~
3500 K ± 600 K. Correspondingly, figure 18 shows the fit of theoretical and experimental plots,
with the best fit obtained for a vibrational temperature (C3Пu–B3Пg , vibrational transition, 0-0) of
~ 4000 K using the SpecAir code [34, 35].
Figure 18. Comparison between experimental and theoretical prediction of rotational (3000 K) and vibrational temperature (4000 K) by SpecAir code
The discrepancy between spatially averaged temperatures measured using different species (i.e.
OH and N2 in our case) can be explained particularly by the fact that measurements were
conducted without spatial resolution and that maximum radiation of different radicals could come
from different parts of the discharge with different temperatures. For example, the study of the
gliding arc in air using optical methods molecular spectra of OH and N2+ band heads at 306.3 nm
and 391.4 nm were used respectively. They proposed the plasma column to be divided into two
27
regions, one being the core in which the intensity of N2+ lines are observed and the other, the
outer “flame” in which the radiation from OH is typical of the surrounding excited molecular
region.
A spatially resolved spectrum was also obtained to determine N2 rotational temperature in the
cathode spot (CS) region for 40 mA, conditions and was found to be ~ 1610 K. A spatially
resolved OH spectrum could not be obtained for the present experimental setup because the
microscope used restricted our measurements to ~ 360 nm and above. However, it is within the
scope of our future work with the use of UV lenses.
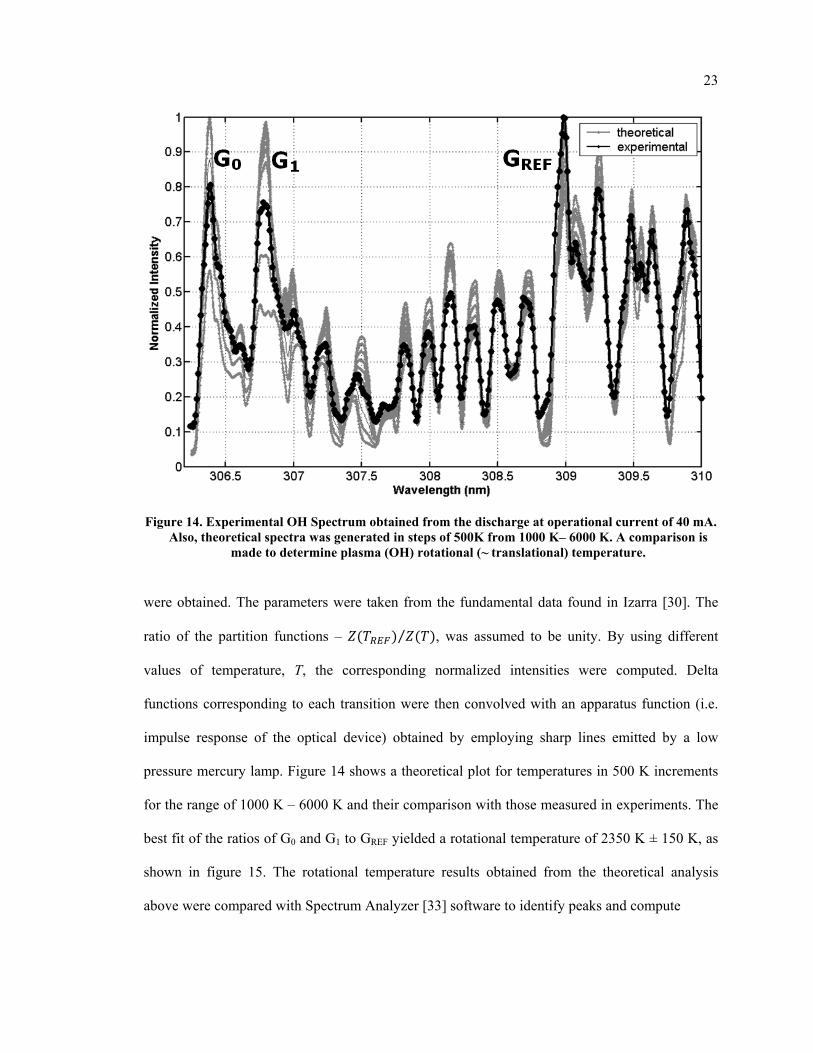
5. 3. Electric Field in MGA plasma arc
The snapshots in figure 19 show the gliding arc structure at different operating conditions (a) 44
mA (b) 140 mA and (c) 220 mA. For characterization of the plasma, we split the plasma into two
zones namely – (1) Cathode Spot (CS) or Negative Glow (NG), and (2) Plasma Channel or
Positive Column (PC). It was possible to notice that the CS width increased with current, thus
keeping the current density nearly constant (section 5.5). This is typical for non-thermal
atmospheric pressure glow discharge wherein the normal current density, remains constant [1, 6].
However, it is important to resolve the electric field in these zones as it was expected to have a
significant voltage drop in the CS.
The typical value for voltage drops in the CS of glow discharges operating in air with iron
electrodes ~ 260 V [1]. Using visual quantification from high speed camera arc images, the
approximate thickness of the cathode layer in our case (a) is about 0.03 cm. Hence the electric
field E ~ 8 kV·cm-1 and the reduced electric field E/n ~ 175 Td (1 Td ~ 10-17 V·cm2) using
spatially resolved CS temperature T ~ 1600 K. Of course, the electric field in the negative glow

re
co
F
It
an
H
sp
T
gl
–
es
th
ea
re
egion is expe
onducted for
Figure 19. Com
t follows that
nalysis softw
Hence, the ele
patially avera
The electric fi
low discharge
30 Vcm-1To
stimate reduc
he plasma col
arlier investig
egime at redu
ected to chan
estimation pu
mparison betw
t the voltage
ware ImageJ a
ectric field E
aged T ~ 2200
eld can be us
es where the r
rr-1 [1]. Usin
ced electric fi
lumn of the d
gations [26] f
ced electric fi
nge drastical
urposes.
ween high spee(a) 44 mA
drop in the P
and determin
~ 705 Vcm-
0 K – 3000K.
sed as a para
reduced elect
ng the calcula
eld values of
discharge, wh
for conventio
fields as low a
lly in space.
ed camera shoA, (b) 140 mA
PC is about (
ned the length
1 and reduce
meter for com
tric field valu
ated effective
f for our cond
hich is within
onal GA reve
as 2.4 Vcm-1T
However, th
ots of the MGA and (c) 220 m
1170 V – 26
h of the PC
d electric fie
mparison of o
ues typically a
pressure para
ditions ~ 7 V
n the range of
eal that it is p
Torr-1.
he above cal
A different opmA
60 V) ~ 910 V
to be approx
ld E/n ~ 20 T
our discharge
are in the rang
ameters as di
cm-1Torr-1 –
f non-thermal
possible to h
lculation has
perational curr
V. We used i
ximately 1.28
Td – 27 Td,
e with non-th
ge ~ 3 Vcm-1T
scussed abov
10 Vcm-1Tor
l discharges.
have a non-th
28
been
rents,
image
8 cm.
using
hermal
Torr-1
ve, we
rr-1 in
Also,
hermal

29
5. 4. Average Electron Energy Estimations
Using the parameters of the system, such as the geometry and assuming that the electric field is
uniform through the PC, the reduced electric field range obtained was for the CS and the PC
regions (computed earlier, above). A Boltzmann equation solver, BOLSIG [37] was employed to
calculate the average electron energy versus the reduced electric field for air i.e. 80% N2 and 20%
O2. The results obtained gave ~ 3.5 eV for the CS region and ~ 1 eV – 1.1 eV for the PC region at
atmospheric pressure air conditions. These high electron temperature estimates relative to the
rotational gas temperature (energies ~ 0.13 eV – 0.25 eV) suggest the two-temperature (non-
equilibrium) nature of the MGA.
5. 5. Current Density Estimations
From figure 20 it can be noted that there was a change in the width of the plasma column with an
increase in current / power on the arc. Considering the arc to have a cylindrical structure, we
assume that this width corresponded to the diameter of the gliding arc. By using these diameters
and quantifying them based on the length per pixel from known dimensions, we obtain
approximate cross-sectional areas of the arc column. In section 4.4, the frequency of arc rotation
with current was presented. Using these results and the diameters/widths of the arc obtained by
visual inspection and quantification at 8000th of a second exposure time, we needed to
incorporate a diametrical correction based on the frequency of arc rotation. These were
approximated by the relation,

30
Where, d was the corrected diameter of the arc, dmeas, the measured diameter of the arc, D, the
diametrical position in the device at which the measurement was taken, f, the frequency of arc
rotation and t, the exposure time. As mentioned earlier, for non-thermal characterization of
plasma, we consider the arc to be divided into CS zone and PC (rest of the arc zone). Fig. 20
shows plasma current density (A·cm-2) results obtained by dividing the value of current with the
cross-sectional area, calculated by assumptions as mentioned above. In low pressure non-thermal
plasmas for air at room temperature and iron electrodes, typically current density is ~ 300 μAcm-
2Torr-2 [1, 6].
Figure 20. Current density estimations in the NG and PC portions (shown in figure 20) of the MGA discharge
In low pressure non-thermal plasma, the ratio of electric field E to the pressure of operation p, i.e.
E/p or ratio of electric field to the gas number density n, i.e. E/n, governs various plasma
31
parameters. It is also sometimes known as the reduced electric field (REF). This scaling is
applicable only if the gas temperature is ambient, which is in case of low pressure non-thermal
plasmas. However, in the case of atmospheric non-thermal plasmas, the gas temperature mostly is
higher than that of the room, in which case, scaling needs to be incorporated. The REF parameter
is scaled based on effective pressure, PEFF = PATM*(TROOM/TACTUAL). Where, PEFF – effective
pressure, PATM – atmospheric pressure, TROOM – room temperature and TACTUAL – is the gas
temperature of plasma under consideration. The scaling is favorably formulated so as to preserve
its initial values at room temperature.
Using this result for our conditions, i.e., T ~ 1600 K (from spatially resolved diagnostic results for
CS zone) and scaling the pressure using number density, the effective pressure PEFF ~ 760 Torr *
(300 K / 1600 K) ~ 141.6 Torr and operating at 40 mA, we get a current density ~ 6 Acm-2, which
is reasonably close to our experimentally estimated value in the CS zone ~ 5.8 Acm-2. Also, from
spatially averaged rotational temperature values T ~ 2200 K – 3000 K, the current density
estimate in the PC zone was ~ 8.6 Acm-2. As the current was increased the temperature was
expected to increase as well, which decreased the PEFF value thereby decreasing the expected
current density from literature estimations. This was observed in the CS data. However, in PC
data an increase in current density was observed, which possibly could be compared to the
property of contraction of non-thermal glow discharge with increase in current.
5. 6. Electron Density Estimations
The electron density in the PC could approximately be estimated from current density, Je and
electron drift velocity, Vd, from the relation: ·⁄ . From our estimations above, current
density in the PC for I = 40 mA is ~ 8.6 A·cm-2. Using T = 2200 K - 3000K, we applied a

32
corresponding E/n ~ 20 Td - 27 Td into BOLSIG [37] to compute the electron drift velocity ~ (4 –
5)·106 cm·s-1, thereby the electron density ~ (1.3 – 1) x1013 cm-3 respectively, this gave an
ionization degree ~ (3.7 – 3.9) x10-6.
5.7. Voltage – Current Characteristics
The VI characteristic curve was obtained to determine the regime of operation of the plasma. The
voltage on the gliding arc decreases with an increase in current.
Figure 21. Voltage current characteristic curve recorded for the MGA plasma, it is observed that the curve shifts upwards (higher voltages) with increase in flow rates
This behavior is typical of an arc discharge. However, the voltage on the arc is quite high (kV)
and currents are restricted to < 0.25 A. Hence, the non-equilibrium nature of the arc is preserved.
Further, the VI curve shifts towards higher voltages of operation with increase in flow rate of

33
operation. This can be attributed to increase in voltage desired by the arc to sustain itself during
elongation by gas flow. The VI curve is as shown in figure 21.
Figure 22. Snapshots of the MGA at different exposure times (top view)

34
Chapter 6: Discussion and Conclusions
As discussed earlier, the Gliding Arc (GA) is an interesting discharge for energy applications due
to it hybrid nature i.e. possesses properties of thermal and non-thermal plasma. However, this
discharge is highly transient in behavior, which makes it difficult to use for purposes of controlled
studies.
A novel plasma discharge has been developed for study of ignition and combustion enhancement
by plasmas, namely the Magnetic Gliding Arc (MGA). Unlike the GA, the MGA is driven and
stabilized using a magnetic field instead of gas flow. The arc is stabilized on a plane and looks
like a plasma disc to naked eye (figure 22). In reality it is an arc (figure 19) that is rotating quite
fast (section 4.4). The plasma is not uniform, however, it is capable of treating the gas uniformly
up to a given flow rate (section 4.4).
Optical emission spectroscopy (OES) was employed to determine the rotational temperature of
plasma. The OH and N2 spectral data was used for this purpose. Further, estimations for electric
field, current density, and average electron energy and electron density were made. Given below
is a comparison between preliminary measurements in the MGA, an atmospheric pressure micro-
glow discharge and thermal plasma discharge.
Parameter MGA Glow Discharge [6] Thermal Arc [1]
Current (mA) 40 ± 5 0.4 – 10 > 104
Electric Field (Vcm-1) 700 5000 – 1400 20 – 100
E/n Parameter (Td)* 20 – 27 48 – 30 0.5 – 2
Gas Temperature (K) 2200 – 2600 700 – 1550 > 10000
Avg. Electron Energy (eV) 1 – 1.1 1.4 – 1.2 1 – 5

35
Cat. Current Density (A.cm-2) 5.8 5.8 104 – 107
Electron Density (cm-3) (1.3 – 1)·1013 1014 1016 - 1019
Ionization Degree (3.9 – 3.7)·10-6 10-5 10-3 – 10-1
Table 1. Comparison between micro-glow, gliding arc and thermal plasma discharge
It is clear from the above comparison that the MGA is closer to a non-thermal glow discharge
than an arc discharge. Moreover, gas temperatures and current (power) densities are much higher
than traditional non-thermal discharges [1]. Further, the obtained results compare very well with
that reported for GAs in literature [1, 20, 26]. Hence, the MGA can be successfully employed as a
study discharge that can replace the gliding arc in ignition and combustion experiments. The
combustion enhancement results obtained by using the MGA have been reported in literature [28,
38] and discussion of those results is beyond the scope of this thesis.
36
Chapter 7: Bibliography
[1] A. Fridman and L. A. Kennedy, Plasma Physics and Engineering: Taylor & Francis, 2004.
[2] "http://www.nasa.gov/images/content/150599main_lightning_photo.jpgs." [3] "http://www.scienceclarified.com/images/uesc_04_img0212.jpg." [4] "http://apod.nasa.gov/apod/ap050807.html." [5] J. R. Roth, Industrial Plasma Engineering, vol. 1: Institute of Physics Publishing, 1997. [6] D. Staack, B. Farouk, A. Gutsol, and A. Fridman, "Spectroscopic studies and rotational
and vibrational temperature measurements of atmospheric pressure normal glow plasma discharges in air," Plasma Sources Science and Technology, vol. 15, pp. 818, 2006.
[7] S. M. Levitsky, Zh. Tekh. Fiz., vol. 27, pp. 970, 1957. [8] Y. P. Raizer, Gas Discharge Physics, 1 ed: Springer, 2001. [9] R. Guerra, Waidmann, W., and Laible, C., "An Experimental Investigation of the
Combustion of a Hydrogen Jet Injected Parallel in a Supersonic Air Stream," in AIAA 3rd International Aerospace Planes Conference. Orlando, FL, 1991.
[10] Y. a. N. Ju, T., "Ignition Simulation of Methane/Hydrogen Mixtures in a Supersonic
Mixing Layer," Combustion and Flame, vol. 102, pp. 462-470, 1995. [11] G. Yu, Li, J. G., Zhang, X. Y., Chen, L. H., Han, B., and Sung, C. J., "Experimental
Investigation on Flameholding Mechanism and Combustion Performance in Hydrogen-Fueled Supersonic Combustors," Combustion Science and Technology, vol. 174, pp. 1-27, 2002.
[12] G. Yu, Li, J. G., Chang, X. Y., Chen, L. H., and Sung, C. J., "Fuel Injection and Flame
Stabilization in Liquid- Kerosene-Fueled Supersonic Combustor," Journal of Propulsion and Power, vol. 19, pp. 885-893, 2003.
[13] K. H. Yu, Wilson, K. J., and Schadow, K. C., "Effect of Flame-Holding Cavities on
Supersonic Combustion Performance," in 35th AIAA/ASME/SAE/ASEE Joint Propulsion Conference. Los Angeles, 1999.
[14] S. Tabejamaat, Ju, Y., and Niioka, T., "Numerical Simulation of Secondary Combustion
of Hydrogen Injected from Preburner into Supersonic Airflow," AIAA Journal, vol. 35, pp. 1441-1447, 1997.

37
[15] K. Takita, "Ignition and Flame-holding by Oxygen, Nitrogen and Argon Plasma Torches
in Supersonic Airflow," Combustion and Flame, vol. 128, pp. 301-313, 2002. [16] K. Takita, Moriwaki, A., Kitagawa, T., and Masuya, G., "Ignition of H2 and CH4 in High
Temperature Airflow by Plasma Torch," Combustion and Flame, vol. 132, pp. 679-689, 2003.
[17] S. M. Bozhenkov, Starikovskaia, S.M., and Starikovskii, A. Yu., "Nanosecond Gas
Discharge Ignition of H2- and CH4 Containing Mixtures," Combustion and Flame, vol. 133, pp. 133-146, 2003.
[18] N. Chintala, Meyer, R., Hicks, A., Bystricky, B., Rich, J.W., Lempert, W.R., Adamovich,
I.V., "Non-Thermal Ignition of Premixed Hydrocarbon-Air and CO-Air Flows by Non-Equilibrium RF Plasma," in 42nd AIAA Aerospace Sciences Meeting and Exhibit, 2004.
[19] C. Kalra, Gutsol, A., and Fridman, A., "Gliding Arc Discharges as a Source of
Intermediate Plasma for Methane Partial Oxidation," IEEE Transactions on Plasma Science, vol. 33, 2005.
[20] I. V. Kuznetsova, Kalashnikov, A.F., Gutsol, A.F., Fridman, A.A., and Kennedy, L.A.,
"Effect of ‘Overshooting’ in the Transitional Regimes of the Low-Current Gliding Arc Discharge," Journal of Applied Physics, vol. 92, pp. 4231-4237, 2002.
[21] S. M. Starikovskaia, Kukaev, E. N., Kuksin, A. Y., Nudnova, M. M., and Starikovskii, A.
Y., "Analysis of the Spatial Uniformity of the Combustion of Gaseous Mixture Initiated by Nanosecond Discharge," Combustion and Flame, vol. 139, pp. 177-187, 2004.
[22] D. Sullivan, Zaidi, S. H., Macheret, S. O., Ju, Y., and Miles, R. B., "Microwave
Techniques for the Combustion Enhancement of Laminar Flames," in 40th AIAA/ASME/SAE/ASEE Joint Propulsion Conference and Exhibit. Fort Lauderdale, FL, 2004.
[23] S. Zaidi, Macheret, S., Vasilyak, L., Miles, R., Ju, Y., "Increased Speed of Premixed
Laminar Flames in a Microwave Resonator," in 35th AIAA Plasmadynamics and Lasers Conference. Fort Lauderdale, FL, 2004.
[24] "http://dawntreader.net/hvgroup/jacob.html." [25] A. Fridman, S. Nester, L. A. Kennedy, A. Saveliev, and O. M. Yardimci, "Gliding Arc
Gas Discharge," Progress in Energy and Combustion Science, vol. 25, pp. 211-231, 1999.
[26] O. M. Yardimci, Saveliev, A.V., Porshnev, P.I., Fridman, A.A., and Kennedy, L.A.,
Annals of the New York Academy of Sciences, pp. 304-308, 1999. [27] S. Gangoli, A. Gutsol, and A. Fridman, "Rotating Non-Equilibrium Gliding Arc (MGA)
Plasma Disc for Enhancement in Ignition and Combustion of Hydrocarbon Fuels," presented at 17th International Symposium of Plasma Chemistry, . Toronto, Canada, 2005.

38
[28] T. Ombrello, Qin, X., Ju, Y., Gutsol, A., Fridman, A., Carter, C., AIAA Journal, vol. 44,
pp. 142-150, 2006. [29] F. White, Viscous Fluid Flow: McGraw-Hill Book Company, New York, 1974. [30] C. D. Izarra, "UV OH Spectrum Used as a Molecular Pyrometer," Journal of Physics D:
Applied Physics, vol. 33, pp. 1697-1704, 2000. [31] S. Pellerin, Cormier, J.M., Richard, F., Musiol, K., Chapelle, J., "A Spectroscopic
Diagnostics Technique Using UV OH Band Spectrum," Journal of Physics D: Applied Physics, vol. 29, pp. 726-739, 1996.
[32] G. H. Dieke, Crosswhite, H.M., "The Ultraviolet Bands of OH, Fundamental Data,"
Spectroscopic Radiation Transfer, vol. 2, pp. 97-199, 1961. [33] S. A. Software, "http://www.physics.muni.cz/~zdenek/span/." [34] C. O. Laux, T. G. Spence, C. H. Kruger, and R. N. Zare, "Optical diagnostics of
atmospheric pressure air plasmas," Plasma Sources Science and Technology, vol. 12, pp. 125, 2003.
[35] C. SpecAir, "http://specair-radiation.net/index.php." [36] M. Y. Ozlem, Saveliev A.V., Porshnev, P.I., Fridman, A., Kennedy, L.A., "Non-
Equilibrium Effects in Gilding Arc discharge," in 2nd International Symposium on Heat & Mass Transfer.
[37] B. Kinema Research & Software, Boltzmann Equation Solver, www.kinema.com. [38] T. Ombrello, X. Qin, Y. Ju, S. Gangoli, A. Gutsol, and A. Fridman, "Non-Equilibrium
Plasma Discharge: Characterization and Effect on Ignition," presented at 44th AIAA Aerospace Sciences Meeting and Exhibit, Reno, Nevada, 2006.