Embed Size (px)
Citation preview

WSAS White Paper, v3.5
Design and Performance of Onsite Wastewater
Soil Absorption Systems
Prepared by
Robert L. Siegrist1 E. Jerry Tyler2 Petter D. Jenssen3
Colorado School of Mines University of Wisconsin Agricultural University of NorwayGolden, Colorado Madison, Wisconsin Aas, Norway
Prepared for
National Research Needs ConferenceRisk-Based Decision Making for Onsite Wastewater Treatment
Washington UniversitySt. Louis, Missouri19-20 May 2000
Sponsored by
U.S. Environmental Protection Agency
Electric Power Research Institute’sCommunity Environmental Center
National Decentralized Water ResourcesCapacity Development Project
Draft version, v2.0, May 2000Final version, v3.5, September 2000
________________1 Environmental Science & Engineering Division, Colorado School of Mines, Golden, Colorado. 90401-1887.
Tel. 303.273.3490, Fax. 303.273.3413, email: [email protected] http://www.mines.edu/~rsiegris2 Soil Science Department, University of Wisconsin, Madison, Wisconsin. 53706.
Tel. 608.262.0853, Fax. 608.262. 265.2595, email: [email protected] Agricultural Engineering Department, Agricultural University of Norway, Aas, Norway.
Tel. 47.6494.8685, Fax. 47.6494.8810, email: [email protected]

WSAS White Paper, v3.5 i
TABLE OF CONTENTS
Page No.
List of Figures...................................................................................................................................................... iiList of Tables....................................................................................................................................................... ii1. Abstract.......................................................................................................................................................12. Introduction ................................................................................................................................................13. Soil Absorption System Features and Design Basis .................................................................................5
3.1. Features and Design of Modern WSAS..........................................................................................53.2. Modifications to Classic System Designs.....................................................................................113.3. Alternative Unit Operations to Classic System Designs ..............................................................13
4. Performance Capabilities, Predictability, and Reliability.......................................................................144.1. General Performance Capabilities of WSAS................................................................................144.2. WSAS Treatment Potential for Key Pollutant Groups.................................................................17
4.2.1. Organics and Suspended Solids.......................................................................................174.2.2. Nutrients ...........................................................................................................................174.2.3. Pathogens..........................................................................................................................18
4.3. Factors and Processes affecting Performance...............................................................................194.3.1. Soil and Site Conditions...................................................................................................194.3.2. WSAS Design Features....................................................................................................234.3.3. WSAS Construction and Operation and Maintenance....................................................26
4.4. Modeling WSAS Hydraulic and Purification Performance .........................................................275. Risk Assessment/Management Applied to Wastewater Soil Absorption Systems................................29
5.1. Risk Assessment and Risk Management Framework..................................................................295.1.1. Risk Assessment...............................................................................................................295.1.2. Risk Management.............................................................................................................29
5.2. RA/RM for Onsite Wastewater Soil Absorption Systems ...........................................................306. Critical Questions and Research Needs...................................................................................................33
6.1. Questions and Areas of Research Need ........................................................................................336.2. Prioritization of Research Needs...................................................................................................35
7. Conclusions ..............................................................................................................................................358. Acknowledgments....................................................................................................................................419. References Cited ......................................................................................................................................4110. Appendix – Acronyms, Abbreviations, and Symbols.............................................................................48

WSAS White Paper, v3.5 ii
LIST OF FIGURESPage No.
Fig. 1. Schematic of a modern wastewater soil absorption system and the engineering and design vs.site evaluation facets of system implementation................................................................................3
Fig. 2. Illustration of wastewater soil absorption system treatment processes .............................................3Fig. 3. Conceptual framework for risk assessment/management of wastewater
soil absorption systems .......................................................................................................................4Fig. 4. Examples of soil absorption unit design approaches, including: (a) conventional trench
excavation, (b) narrow trench excavation, (c) deep textile-lined narrow trench,(d) gravel-filled trench with geotextile overlay and 10-cm diameter STE delivery pipingcompared to a gravel-free chamber unit, (e) gravel-free chamber unit.............................................8
Fig. 5. Examples of effluent delivery methods for delivery of wastewater effluent into the soilabsorption unit: (a) STE baffle and gravity outlet, (b) 10-cm diameter perforated drain tile,(c) drop-box serial distribution for sloping sites, and (d) hydrosplitter to equalize flowbetween trenches .................................................................................................................................8
Fig. 6. Examples of wastewater source modifications: (a) 3-L volume flush toilet, (b) composttoilet, (c) graywater recycle unit, and (d) point-of-use bag filter for laundry discharge ................11
Fig. 7. Examples of alternative unit operations including: (a) effluent biofilter unit,(b) in-tank aeration unit, (c) rotating biological contactor, (d) sand filter, (e) foam filter,and (f) drip irrigation line..................................................................................................................14
Fig. 8. System hydraulic function versus operational age and installation period .....................................16Fig. 9. Time-dependent infiltration rate changes during wastewater application related to the
initial saturated hydraulic conductivity of the media for clean water (from Jenssen, 1986)..........21Fig. 10. Ground water mounding under WSAS as a function of infiltration rate, aquifer
depth and hydraulic conductivity, and distance to a hydraulic barrier(after Jenssen and Bromssen, 1985) .................................................................................................22
Fig. 11. Illustration of infiltration rate loss in a standard gravel-filled trench based on the cumulativemass density loading of total BOD and suspended solids (kg m-2) at different hydraulicloading rates and effluent compositions (after Siegrist 1987; Siegrist and Boyle, 1987) .............23
Fig. 12. Purification efficiency as affected by reaction rate and operating conditions which is turnimpact hydraulic retention time (after Ausland, 1998)....................................................................25
LIST OF TABLESPage No.
Table 1. Physical and operational features of historical, current, andemerging wastewater soil absorption system designs ....................................................................6
Table 2. Wastewater COC's and representative concentrations in effluents appliedto WSAS and percolates reaching ground water. ...........................................................................7
Table 3. Design and environmental conditions affecting WSAS performance .........................................20Table 4. Mathematical models and decision-support tools for design and performance of
onsite wastewater soil absorption systems....................................................................................28Table 5. Example scenarios for wastewater soil absorption systems that pose apparent risks to
human health and environmental quality and example risk management options ......................31Table 6. Example risk management strategies and options for wastewater soil absorption
systems at the site-scale and watershed scales..............................................................................32Table 7. Research questions for wastewater soil absorption systems ........................................................36Table 8. Prioritization of research questions into ranked research needs...................................................40
WSAS White Paper, v3.5 1
Design and Performance of Onsite Wastewater Soil Absorption Systems
Robert L. Siegrist1 E. Jerry Tyler2 Petter D. Jenssen3
1. Abstract
The primary system for onsite and decentralized wastewater treatment in the U.S. includes septic tankpretreatment followed by subsurface infiltration and percolation through the vadose zone prior to rechargeof the underlying ground water. These wastewater soil absorption systems (WSAS) have the potential toachieve high treatment efficiencies over a long service life at low cost, and be protective of public healthand environmental quality. Favorable results from lab and field studies as well as an absence ofdocumented adverse effects suggest that system design and performance are generally satisfactory.However, the understanding and predictability of performance as a function of design,installation/operation, and environmental factors, as well as the risk of inadequate function and its effects,have not been fully elucidated. This has been due to the complex and dynamic relationships betweenhydraulic and purification processes and the factors that control their behaviors. As a result, the currentstate-of-knowledge and standard-of-practice have gaps and shortcomings that can preclude rationalsystem design to predictably and reliably achieve specific performance goals. Moreover, the quantitativeanalysis of long-term treatment efficacy on a site-scale up to watershed scale is difficult, as is any formalassessment of risks and selection of appropriate management actions. This white paper describes theprocess function and performance of WSAS. The system performance capabilities and predictability aswell as reasonably conceivable system dysfunctions are described within a risk assessment andmanagement framework. Issues applicable to the single-site scale and to the multiple-site to watershedscales are addressed. Based on an analysis of the current state-of-knowledge, critical research needs areidentified and prioritized. As described herein, critical questions and current gaps in knowledge generallyrelate to the absence of fundamental process understanding that enables system performance relationshipsto be quantified and modeled for predictive purposes. High and very high priority research needs includethose that support: (1) fundamental understanding of clogging zone genesis and unsaturated zonedynamics and their effects on treatment efficiency, particularly for pathogens, (2) development ofmodeling tools for predicting WSAS function and performance as affected by design and environmentalconditions, (3) identification of indicators of performance and methods of cost-effective monitoring, and(4) development of valid accelerated testing methods for evaluating long-term WSAS performance.
2. Introduction
Wastewater infrastructure in the U.S. includes a continuum of technologies designed for scales ofapplication that span from small decentralized systems serving individual homes in rural and suburbanareas, to large centralized systems serving municipalities in densely populated urban areas. In the past,the decentralized or onsite systems were viewed by some as a means of providing temporary service untilcity sewers and a centralized treatment plant became available to provide permanent service. Earlyversions of onsite wastewater systems (e.g., pit privy, cesspool) were often designed with simple andshort-term goals of waste disposal to prevent direct human contact and to achieve basic public health andenvironmental protection.________________1 Environmental Science & Engineering Division, Colorado School of Mines, Golden, Colorado. 90401-1887.
Tel. 303.273.3490, Fax. 303.273.3413, email: [email protected] http://www.mines.edu/~rsiegris2 Soil Science Department, University of Wisconsin, Madison, Wisconsin. 53706.
Tel. 608.262.0853, Fax. 608.262. 265.2595, email: [email protected] Agricultural Engineering Department, Agricultural University of Norway, Aas, Norway.
Tel. 47.6494.8685, Fax. 47.6494.8810, email: [email protected]

WSAS White Paper, v3.5 2
In the early 1900’s, some system designs evolved to include raw wastewater pretreatment in a tank-basedunit (e.g., septic tank) followed by disposal through a soil drainfield, and extension bulletins and guidancematerials began to appear. As modern appliances became more commonplace, high water-use plumbingfixtures resulted in increased wastewater flows and a need for more careful siting and design of onsitewastewater soil absorption systems. For many designers and regulatory officials, the systems were stilloften viewed temporary with relatively simple waste disposal goals. During the 1990’s the rapidmovement toward centralization of wastewater treatment faded for a number of reasons, including the endof construction grants funding for treatment plants and a realization that large centralized solutions werenot appropriate for all situations. Continuing to evolve, classic and alternative WSAS have beenincreasingly viewed as treatment systems and they have been designed and implemented to achievepurification as well as disposal, and even considered for beneficial reuse. Recently, increasing concernsover ground water quality and the effects of hazardous chemicals and waste pollutants have elevated theattention given to proper design and performance of WSAS. Today, nearly 25% of the U.S. population isserved by onsite and decentralized wastewater systems and approximately one-third of new developmentis supported by such systems (USEPA, 1997). This amounts to roughly 25 million existing systems with0.2 million new systems being installed each year. These onsite systems are now viewed as a necessaryand permanent component of sustainable wastewater infrastructure in the U.S. and abroad.
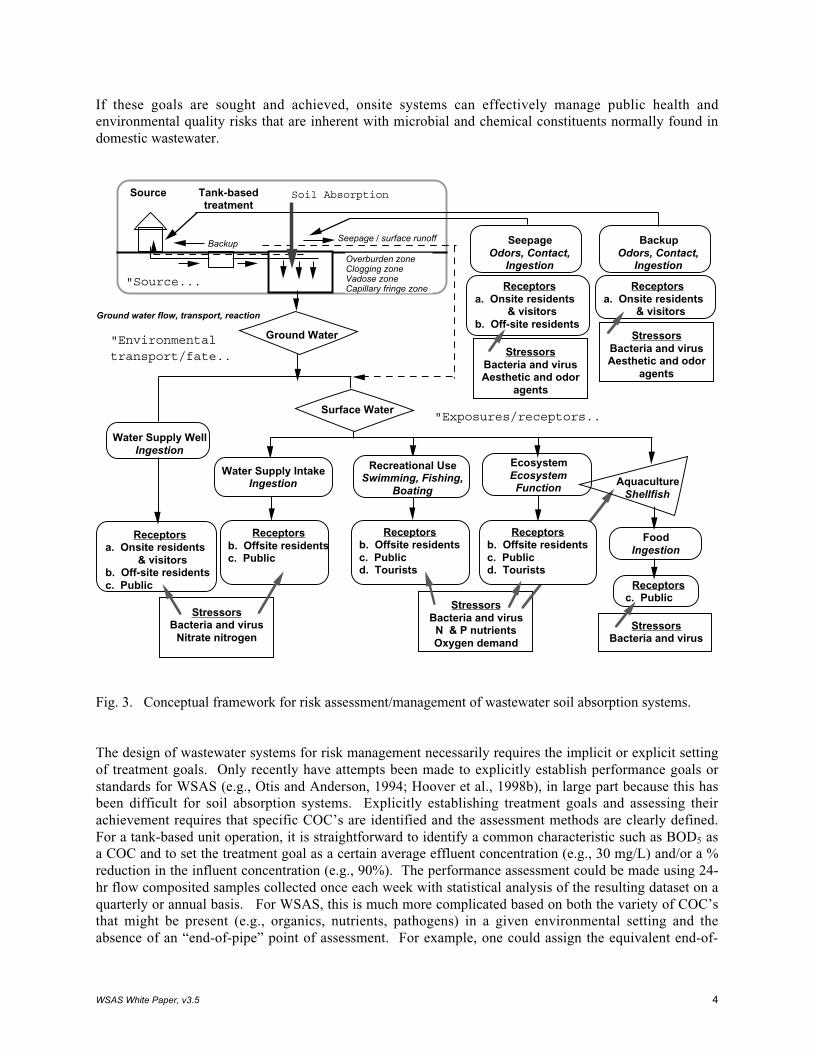
The most common WSAS includes intermittent delivery (by gravity or pressurized dosing) of primarytreated wastewater into the subsurface with infiltration and percolation through the vadose zone and intothe underlying ground water (Fig. 1). Successful application of WSAS is based on engineering designthat is compatible with the environmental conditions as determined through a site evaluation (Fig. 1). Inproperly implemented WSAS, advanced treatment is expected and can be achieved for many wastewaterconstituents of concern (COC’s) through removal (e.g., filtration of suspended solids or sorption ofphosphorus), transformation (e.g., nitrification of ammonium or biodegradation or organic matter), anddestruction processes (e.g., die-off of bacteria or inactivation of virus) (Fig. 2). For the purposes of thisdiscussion, the boundaries of the WSAS treatment system include the inlet to the soil absorption unitthrough the lower limit of the underlying vadose zone (see Figs. 1 and 2). In these WSAS, the conditionsimposed by the WSAS process design (e.g., applied effluent quality and hydraulic loading rate) in a givenenvironmental setting (e.g., soil type, moisture and temperature) must be such that key treatmentprocesses occur at a rate and to an extent such that advanced treatment is reliably achieved before groundwater recharge occurs (see Fig. 1). This is critical since the percolate released from most WSAS entersthe underlying ground water, which can migrate under natural gradients toward points of exposure forreceptors of concern (e.g., humans and drinking water supplies). Depending on local and regionalconditions, ground water transport/fate processes may or may not reduce percolate COC concentrations,which would be of concern if exposure occurred at the point of percolate entry to the ground water, tolower levels that are not of concern at a remote point of exposure (Fig. 3).
In contrast to the modern WSAS simply illustrated in Figure 1, the large population of onsite systems inthe U.S. today is extremely heterogeneous, including an array of old and new system designs, located invaried site conditions with different environmental sensitivities, and used to treat wastewaters fromresidential, commercial, and institutional sources (Table 1). Moreover, this population of systemsincludes those that are properly designed, installed and operated as well as those that are poorly designed,incorrectly sited, and/or improperly operated and maintained. Thus, characterization of performancecapability and reliability for modern WSAS (e.g., Fig. 1) that are properly implemented in a givenapplication must not be skewed based on the performance observed for older systems (e.g., disposal-based designs) and/or inappropriate applications (e.g., poorly sited systems).

WSAS White Paper, v3.5 3
Wastewater
Pretreatment Effluent delivery
Vadose zone
Ground water zone
Well
Percolation
GW recharge
Clogging zone
Infiltration
Advancedtreatment
Site evaluation
Engineering& design
Fig. 1. Schematic of a modern wastewater soilabsorption system and the engineering and designvs. site evaluation facets of system implementation.
Infiltrative surfaceand pore cloggingzone ~ infiltration
Vadose zone ~percolation
Advective and diffusivetransport, and purification by:
8 Straining and filtration8 Sorption8 Ion X-C, precipitation,...8 Biotransformation 8 Die-off and predation8 Plant uptake
Wastewater effluentWastewater effluent
Ground water… to receptors...?
Opensoilpores
Ground water zone ~
Fig. 2. Illustration of wastewater soilabsorption system treatment processes.
For example, a very old system (e.g., 50-yr. old cesspool) might function effectively for hydraulics anddisposal, yet accomplish limited purification, and thus its performance with respect to modern goals oftreatment would be viewed as inadequate. This is in contrast to more modern systems designed to exploitphysical, chemical, and biological processes to achieve highly efficient hydraulic and purificationperformance (e.g., 5-yr. old WSAS with pressure dosing of septic tank effluent into a network of shallow(e.g., 30 to 60 cm), narrow (e.g., 15 to 30 cm) trenches). In this paper, the emphasis will be on modernWSAS that have been designed, installed, and operated since about 1980 when contemporaryunderstanding of onsite and decentralized systems was well documented and information was widelyavailable (e.g., see USEPA, 1978; 1980).
Wastewater poses inherent risks due to its microbial and chemical constituents. The challenge with itsmanagement is to assess the magnitude of the risks in a given situation and decide on the most appropriatemethod to manage those risks (Fig. 3). For example, pathogenic bacteria, virus, and protozoa are presentin wastewater, and disease could result if they are not removed or inactivated before an effluent reaches areceiving environment where humans can contact and ingest the water (e.g., drinking water, bathingbeaches, shellfish beds). Also, if excessive levels of nitrogen and phosphorus in wastewater are input tosensitive surface waters (e.g., pristine lakes, estuaries), this could result in undesirable ecosystem changes(e.g., increased productivity and eutrophication). While simply stated, risk-based design and applicationof onsite WSAS is quite difficult to implement. For wastewater treatment, one could state the ultimategoal as being WSAS design and implementation so that (1) there is no infectious disease attributable to anonsite wastewater system, and (2) there is no measurable change in an ecosystem attributable towastewater system inputs. Clearly, in a given setting, an onsite system that provides no treatment at allmay present the highest risk, while increasing levels of reliable treatment effectiveness yield reducedlevels of risk. However, since risk management requires consideration of nontechnical issues, such associoeconomic factors, the most advanced treatment system will generally not be the best overall riskmanagement solution.
Older systems that were designed and implemented to achieve disposal may represent an unacceptablerisk to public health and environmental quality and need upgrading or replacement. A clear example ofsuch a situation would include cesspools constructed in the ground water and with limited travel distancesto drinking water supplies or sensitive surface waters. Other older systems are not so easily identified asinadequate and in need of upgrade or replacement. Modern onsite and decentralized systems areincreasingly being designed and implemented as permanent and sustainable solutions for wastewatertreatment rather than just disposal. In this context, treatment embodies goals associated with effectivehydraulic and purification performance that can be sustained over a long service life at an affordable cost.
WSAS White Paper, v3.5 4
If these goals are sought and achieved, onsite systems can effectively manage public health andenvironmental quality risks that are inherent with microbial and chemical constituents normally found indomestic wastewater.
Source Tank-based treatment
Soil Absorption
Ground Water
Surface Water
Water Supply WellIngestion
Water Supply IntakeIngestion
Food Ingestion
Receptorsa. Onsite residents & visitorsb. Off-site residentsc. Public
Overburden zoneClogging zoneVadose zoneCapillary fringe zone
"Environmental transport/fate..
"Exposures/receptors..
Receptorsb. Offsite residents c. Public
AquacultureShellfish
Receptorsc. Public
Ground water flow, transport, reaction
Seepage / surface runoff
"Source...
Recreational UseSwimming, Fishing,
Boating
Receptorsb. Offsite residents c. Publicd. Tourists
StressorsBacteria and virus
Nitrate nitrogen
StressorsBacteria and virus
N & P nutrientsOxygen demand
StressorsBacteria and virus
EcosystemEcosystem Function
Receptorsb. Offsite residents c. Publicd. Tourists
SeepageOdors, Contact,
Ingestion
Receptorsa. Onsite residents & visitorsb. Off-site residents
StressorsBacteria and virusAesthetic and odor
agents
Backup BackupOdors, Contact,
Ingestion
Receptorsa. Onsite residents & visitors
StressorsBacteria and virusAesthetic and odor
agents
Fig. 3. Conceptual framework for risk assessment/management of wastewater soil absorption systems.
The design of wastewater systems for risk management necessarily requires the implicit or explicit settingof treatment goals. Only recently have attempts been made to explicitly establish performance goals orstandards for WSAS (e.g., Otis and Anderson, 1994; Hoover et al., 1998b), in large part because this hasbeen difficult for soil absorption systems. Explicitly establishing treatment goals and assessing theirachievement requires that specific COC’s are identified and the assessment methods are clearly defined.For a tank-based unit operation, it is straightforward to identify a common characteristic such as BOD5 asa COC and to set the treatment goal as a certain average effluent concentration (e.g., 30 mg/L) and/or a %reduction in the influent concentration (e.g., 90%). The performance assessment could be made using 24-hr flow composited samples collected once each week with statistical analysis of the resulting dataset on aquarterly or annual basis. For WSAS, this is much more complicated based on both the variety of COC’sthat might be present (e.g., organics, nutrients, pathogens) in a given environmental setting and theabsence of an “end-of-pipe” point of assessment. For example, one could assign the equivalent end-of-

WSAS White Paper, v3.5 5
pipe assessment point to any one of the following: (1) soil solution in the lower limit of the vadose zoneunder the infiltration system under the seasonally highest water table elevation, (2) ground water at thedowngradient edge of the footprint of the infiltration unit, (3) the ground water at the property boundary,or (4) the water at some proximal receptor that would be sensitive to potential wastewater system inputs(e.g., drinking water, shellfish waters). As of this writing, standardized performance goals have beenadvocated (e.g., Otis and Anderson, 1994; Hoover et al., 1998a), but there appears to be no consensus asto the COC’s, the performance to be achieved within a prescribed space-time domain, or the methods tobe used to measure and assess compliance. In this paper, the primary COC’s are defined to includemeasures of oxygen consuming materials (e.g., BOD5 and COD), nutrients (e.g., N and P), and humanpathogens (e.g., bacteria and virus) based on their prevalence and potential adverse effects on humanhealth and environmental quality. The primary treatment unit boundaries for a WSAS are defined toinclude the influent from a tank-based treatment unit (e.g., septic tank) through infiltration andpercolation of the vadose zone and capillary fringe before discharge to a receiving ground waterenvironment (Fig. 3). However, the method of performance assessment is not defined as it is applicationspecific and many factors need to be considered such as system type, size, and the sensitivity of theprimary receiving environments (e.g., ground water) and secondary recipients (e.g., surface waters).
3. Soil Absorption System Features and Design Basis
3.1. Features and Design of Modern WSAS
While old and new WSAS vary widely in their design and implementation (see Table 1), the vast majorityof systems are based on discharge of partially treated wastewater effluent to subsurface soils withrecharge to ground water underlying the site. The classic onsite system of modern design involves awastewater source (e.g., dwelling unit), tank-based treatment unit (e.g., septic tank), and an infiltrationunit (e.g., subsurface trench or bed) (Fig. 1). In this system type, water use from all fixtures and activitiesgenerates a combined raw sewage (solid plus liquid wastes) which flows into a septic tank buried outsidebut adjacent to the home or establishment. The principal treatment processes in a septic tank includesedimentation, flotation, and some anaerobic digestion. Septic tank effluent (STE) still contains highconcentrations of organic matter, total suspended solids (SS), nutrients, and microorganisms and is notsuitable for discharge to a receiving environment without further treatment (see Table 2). Requisitefurther treatment is achieved by discharging STE into a subsurface trench or bed filled with gravelaggregate or outfitted with a chamber, from which infiltration and percolation occur through anunderlying unsaturated zone with recharge to ground water under the site (see Figs. 4 and 5). When apartially treated effluent such as STE, is applied to soil, infiltration and percolation through theunsaturated porous media involve a complex set of hydraulic and purification processes that can interactto reliably and sustainably achieve advanced treatment efficiencies (Table 2). These hydraulic andpurification processes interact in a dynamic manner, evolving as a WSAS matures from startup throughthe first year(s) of operation.
Design of WSAS has historically been accomplished through a series of steps such as the following:
o Estimate the wastewater flow and composition with an implicit or explicit factor of safety,o Characterize the site for landscape and land use features,o Determine the subsurface lithology and hydraulic properties, and identify any limiting features,o Select a design hydraulic loading rate, often based on a long-term acceptance rate for effluent,o Specify geometry and placement of the infiltrative surface and its interface features,o Select and size the pretreatment unit and the effluent delivery and distribution method,o Determine what modifications, if any, are needed and appropriate for the site, ando Select process controls and monitoring devices.

WSAS White Paper, v3.5 6
Table 1. Physical and operational features of historical, current, and emerging wastewater soil absorption system designs.1
Period of use System type oroperational feature
Motivation Description of representative system features
1. Historical systemdesigns
A. Cesspool Disposal Open or lined (e.g., brick or block) pit into which raw wastewater is discharged. Solids are retained in the pit while effluentinfiltrates into the surrounding soil for disposal though some treatment can occur.
B. Seepage pit Disposal, sometreatment
Open or lined (e.g., brick or block) pit into which pretreated wastewater is discharged. Effluent infiltrates into thesurrounding soil for disposal though some treatment can occur.
C. Leachfield Disposal, moretreatment
Network of trenches or beds filled with gravel or aggregate for disposal of pretreated wastewater by infiltration andpercolation.
2. Current commonsystem designs
A. Trench / bed WSAS Disposal andtreatment onfavorable sites
Engineered network of trenches or beds filled with gravel or outfitted with chambers from which wastewater effluent (oftenfrom a septic tank 2) infiltrates and percolates through 1 to 5 ft. or more of unsaturated soil before recharging ground waterunder the site.
B. Shallow LPP WSAS Disposal andtreatment ondifficult sites
Shallow, narrow trenches used for wastewater infiltration by intermittent delivery of wastewater effluent. Originally designedfor sites with shallow, slowly permeable soils and seasonally high water table conditions.
C. At-grade WSAS Disposal andtreatment ondifficult sites
Trench or bed WSAS designed with the infiltration surface placed at the original ground level. Designed for sites withshallow depth to limiting conditions such as seasonally high water table or bedrock.
D. Mound WSAS Disposal andtreatment ondifficult sites
Trench or bed WSAS designed with the infiltration surface placed within a bed of imported sand fill above the originalground surface by 1 to 2 ft. Designed for sites with very shallow depth to limiting conditions such as seasonally high watertable or bedrock.
2A. Current commoninstallation
A. Drainage Increase vadosezone depth
Use of dewatering trenches or drains to lower the permanent or seasonal water table such that an adequate depth ofunsaturated soil is maintained between the infiltrative surface.
or operationalvariants
B. Over-excavation Reduce particlesizes, increasemedia contact
Construction technique used wherein naturally occurring bedrock is excavated and crushed onsite and then placed back intothe excavation. This creates a coarse grained fill into which a trench or bed WSAS can be installed.
C. Dosing application Cyclic loading,better distribution
Intermittent application of effluent to any WSAS with delivery in large draintile or small diameter pressure pipe.
D. Pressurized dosing Cyclic loading,uniform distribut.
Operational method of intermittent application of effluent into small diameter pressurized pipe to achieve more uniformdistribution through the WSAS.
3. Emerging designsand operational
A. In-tank STE filters SS removal Filter cages installed into the effluent baffle from a treatment tank to capture suspended solids.
variants B. Timed-pressure appl. Cyclic loading,equalization
Design to include a pump vault and high/low switching gear with hourly bursts of STE discharged to a WSAS. Over a narrowrange of liquid levels, the septic tank can provide some equalization capacity.
C. Drip application Treatment andreuse
Method of soil application where STE is further treated by optional methods before delivery to the shallow soil zone by timedpump application and drip emitter lines.
D. Interm. sand filters Adv. treatment Design with single pass or recirculation through a 2 to 4 ft. packed bed of engineered sand media.
E. Advanced treatmentunits (ATU’s)
Adv. treatment Tank based systems using biological treatment in suspended growth or packed bed systems, possibly incorporating biofilmsupports of foam, textiles, or other materials.
F. NO3- removal Adv. treatment Recirculation of STE through a packed bed and return to the influent end of the septic tank for nitrification-denitrification.
G. UV irradiation Disinfection After advanced treatment, irradiation with UV light to kill/inactive pathogenic organisms in the effluent.
1 The information is provided to represent typical characteristics for residential systems and it is recognized that all known or possible system designs or operational strategies are not included.2 In some locations, aerobic treatment units (e.g., extended aeration package plants) are conventionally used for pretreatment prior to wastewater application to soil.
WSAS White Paper, v3.5 7
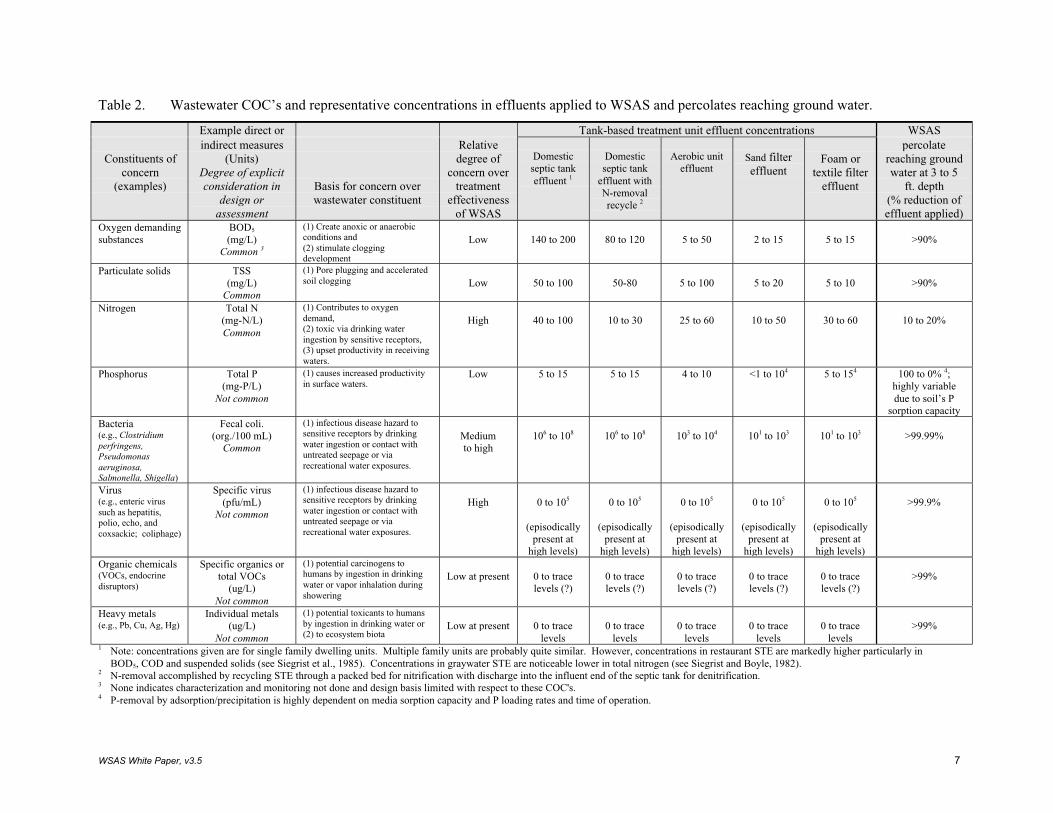
Table 2. Wastewater COC’s and representative concentrations in effluents applied to WSAS and percolates reaching ground water.
Example direct or Tank-based treatment unit effluent concentrations WSAS
Constituents ofconcern
(examples)
indirect measures(Units)
Degree of explicitconsideration in
design orassessment
Basis for concern overwastewater constituent
Relativedegree of
concern overtreatment
effectivenessof WSAS
Domesticseptic tankeffluent 1
Domesticseptic tank
effluent withN-removalrecycle 2
Aerobic uniteffluent
Sand filtereffluent
Foam ortextile filter
effluent
percolatereaching groundwater at 3 to 5
ft. depth(% reduction ofeffluent applied)
Oxygen demandingsubstances
BOD5
(mg/L)Common 3
(1) Create anoxic or anaerobicconditions and(2) stimulate cloggingdevelopment
Low 140 to 200 80 to 120 5 to 50 2 to 15 5 to 15 >90%
Particulate solids TSS(mg/L)
Common
(1) Pore plugging and acceleratedsoil clogging Low 50 to 100 50-80 5 to 100 5 to 20 5 to 10 >90%
Nitrogen Total N(mg-N/L)Common
(1) Contributes to oxygendemand,(2) toxic via drinking wateringestion by sensitive receptors,(3) upset productivity in receivingwaters.
High 40 to 100 10 to 30 25 to 60 10 to 50 30 to 60 10 to 20%
Phosphorus Total P(mg-P/L)
Not common
(1) causes increased productivityin surface waters.
Low 5 to 15 5 to 15 4 to 10 <1 to 104 5 to 154 100 to 0% 4;highly variabledue to soil’s P
sorption capacityBacteria(e.g., Clostridiumperfringens,Pseudomonasaeruginosa,Salmonella, Shigella)
Fecal coli.(org./100 mL)
Common
(1) infectious disease hazard tosensitive receptors by drinkingwater ingestion or contact withuntreated seepage or viarecreational water exposures.
Mediumto high
106 to 108 106 to 108 103 to 104 101 to 103 101 to 103 >99.99%
Virus(e.g., enteric virussuch as hepatitis,polio, echo, andcoxsackie; coliphage)
Specific virus(pfu/mL)
Not common
(1) infectious disease hazard tosensitive receptors by drinkingwater ingestion or contact withuntreated seepage or viarecreational water exposures.
High 0 to 105
(episodicallypresent at
high levels)
0 to 105
(episodicallypresent at
high levels)
0 to 105
(episodicallypresent at
high levels)
0 to 105
(episodicallypresent at
high levels)
0 to 105
(episodicallypresent at
high levels)
>99.9%
Organic chemicals(VOCs, endocrinedisruptors)
Specific organics ortotal VOCs
(ug/L)Not common
(1) potential carcinogens tohumans by ingestion in drinkingwater or vapor inhalation duringshowering
Low at present 0 to tracelevels (?)
0 to tracelevels (?)
0 to tracelevels (?)
0 to tracelevels (?)
0 to tracelevels (?)
>99%
Heavy metals(e.g., Pb, Cu, Ag, Hg)
Individual metals(ug/L)
Not common
(1) potential toxicants to humansby ingestion in drinking water or(2) to ecosystem biota
Low at present 0 to tracelevels
0 to tracelevels
0 to tracelevels
0 to tracelevels
0 to tracelevels
>99%
1 Note: concentrations given are for single family dwelling units. Multiple family units are probably quite similar. However, concentrations in restaurant STE are markedly higher particularly inBOD5, COD and suspended solids (see Siegrist et al., 1985). Concentrations in graywater STE are noticeable lower in total nitrogen (see Siegrist and Boyle, 1982).
2 N-removal accomplished by recycling STE through a packed bed for nitrification with discharge into the influent end of the septic tank for denitrification.3 None indicates characterization and monitoring not done and design basis limited with respect to these COC's.4 P-removal by adsorption/precipitation is highly dependent on media sorption capacity and P loading rates and time of operation.

WSAS White Paper, v3.5 8
(a) (b) (c)
(d) (e)
Fig. 4. Examples of soil absorption unit design approaches, including: (a) conventional trenchexcavation, (b) narrow trench excavation, (c) deep textile-lined narrow trench, (d) gravel-filledtrench with geotextile overlay and 10-cm diameter STE delivery piping compared to a gravel-freechamber unit, (e) gravel-free chamber unit.
(a) (b) (c) (d)
Fig. 5. Examples of effluent delivery methods for delivery of wastewater effluent into the soil absorptionunit: (a) STE baffle and gravity outlet, (b) 10-cm diameter perforated drain tile, (c) drop-boxserial distribution for sloping sites, and (d) hydrosplitter to equalize flow between trenches.
The design of WSAS has normally been completed with an over-riding conservatism in most all steps ofthe process, for example during selection of the (1) design flow, (2) septic tank size, and (3) applicationrate to the soil infiltrative surface (IS). The experiences and preferences of local designers andcontractors, as well as the availability of materials and equipment, that lead to the lowest system costsoften determine the WSAS designs that are most commonly used. For single-family home and othersmall WSAS, the design practices are often prescribed in state or local codes (e.g., Docken and Burkes,1994; Briggs and Barranco, 1994) which can vary widely from state to state and even county to countywithin a given state. The codes themselves have evolved from local practices and perceptions, sometimes

WSAS White Paper, v3.5 9
accounting for local conditions (e.g., topography, climate), but often not based on any fundamentalunderstanding or even objective technical data. Recognizing the great range in actual past and currentpractices, the following remarks are made to illustrate the type of practices used for a classic WSASserving a single-family dwelling unit.
Design flows are commonly calculated for a single-family home based on a per capita flow and aresidency estimate (USEPA, 1980a; Crites and Tchobanoglous, 1998). Flow estimates for commercialand institutional sources are based on occupancy and/or event/activity water-use and are much moredifficult to estimate accurately due to highly uncertain practices (Siegrist et al., 1985a). For a single-family dwelling unit with four bedrooms, the design flow might be estimated at 2.27 m3/d (600 gallonsper day, gpd) (assuming all four bedrooms are occupied by two persons each of whom produces 280 Lper day (Lpd) of wastewater (75 gal per capita per day, gpcd). This represents an implicit factor of safetyof over 500% compared to an average occupancy of 2.1 persons per home and average per capita flow of170 Lpd (45 gpcd) (USEPA, 1978; 1980). This large factor of safety may be appropriate for one singledwelling unit to ensure that the actual flow generated at any individual dwelling within a large populationof dwellings does not exceed the design flow. However, for a cluster of dwellings (e.g., five or morehomes on a clustered system), the design flow can be reduced toward the average since the clusteringattenuates the actual flow variations from home to home. For clusters of 5 or more dwelling units, thedaily design flow can be based on average conditions with an explicit factor of safety (e.g., 1.5 to 2.0)applied to the base flow.
Septic tanks are normally sized based on the design flow and 2/3 of the tank volume set aside for sludgeand scum accumulation and a 24-hr hydraulic detention time in the remaining 1/3 volume. Thiseffectively yields a total tank volume equal to 3 times the daily flow volume (Baumann et al., 1978;USEPA, 1980a). The septic tank sizing and design features can affect the average STE output rate andquality as well as the raw wastewater source (see Tables 1 and 2). Baffles are provided on the inlet andoutlet of a septic tank (see Fig. 5) to yield quiescent conditions within the tank and limit the disruptionand re-entrainment of sludge and scum in the wastewater passing through the tank, thereby minimizingsuspended solids concentrations in the STE. Sludge and scum accumulate over time in a septic tank andthese solids must periodically be pumped out and properly managed (USEPA, 1995). The neededfrequency of pumping and composition of the removed solids, referred to as septage, has been related tothe type of usage (e.g., with garbage disposals) and environmental conditions (e.g., temperature)(USEPA,1980a,b; 1995; Bounds, 1995a,b).
The soil absorption unit size is determined by selecting (1) a specific infiltrative surface geometry (e.g.,sidewall vs. bottom area) and placement in the soil profile (e.g., in situ deep, in situ shallow, at grade, ormounded in fill), (2) infiltrative surface character (e.g., gravel-laden or gravel-free chamber units, and (3)estimating the steady-state hydraulic capacity (e.g., cm/d) of the IS once a system is fully mature and soilclogging has approached its maximum (see Fig. 5). While bed geometries permit more efficient use oflandscape area, with increasing IS area per unit length of system, beds can experience diminishedperformance due to construction damage, high overburden pressures and gravel embedment, gasentrapment and anaerobiosis due to inhibited O2 transfer, and potentially excessive ground watermounding and reduced unsaturated zone depth (Siegrist et al., 1984; 1986; Mahuta and Boyle, 1991). Tomitigate the negative effects of beds, trench geometry’s with shallow placement have been advocated tomaximize IS area and exploit the most biogeochemically active zone of the soil profile. The requiredgross area of IS is based on the design flow divided by a long-term acceptance rate (LTAR) for the ISexpressed in volume per area per time (e.g., 1 cm3/cm2/d = 1 cm/d = 0.245 gpd/ft2 ). This gross IS areamay be increased by a factor of 1.5 to allow for extended resting (e.g., 6 mon.) of 1/3 of the absorptionsystem to retard soil clogging development. The gross IS required is then converted to a length of trenchof a prescribed width (e.g., 90 cm or 3 ft.) which then must be laid out on the landscape. Trenchseparation is prescribed (e.g., 1.8 m or 6 ft.) to enable a platform for construction equipment during

WSAS White Paper, v3.5 10
installation. Modern installation methods can use specialized equipment (e.g., continuous trenchers) forwhich trench separation can be quite low based on equipment constraints alone.
For most systems, delivery and application of the STE to the absorption area is based on wastewatergeneration in the dwelling unit or establishment with gravity flow from the septic tank designed to bedistributed to all of the operational absorption trenches or bed units. Attempts to distribute the flowequally between trenches or areas of a bed using distribution boxes and 10-cm (4-in) diameter perforateddrain pipe are commonly made, but have been shown to be ineffective (Otis et al., 1978) (see Fig. 5). Asdescribed below, this has led to modifications in system design that incorporate dosing into larger gravitypiping or dosing into small pressurized piping for more uniform delivery. For some systems, serialdistribution is used whereby a portion of a system is hydraulically overloaded during system startup, butas clogging evolves, additional trenches are loaded based on overflow from an upslope trench (Otis et al.,1978).
The total infiltration area required in a WSAS is determined explicitly or implicitly based on a long-termacceptance rate concept that attempts to account for the loss in infiltration rate capacity that occurs insoils as a result of wastewater effluent infiltration (more discussion is given in Section 4). For mostsituations with individual onsite systems, the effective IS area (i.e., bottom area vs. sidewall vs. both) andthe LTAR are incorporated but hidden within a code-prescribed system. For example, a prescribed sizingfor a 4-bedroom home on sandy soil might be to provide 60-m of lineal 90-cm wide by 30-cm deeptrench. As discussed in Section 4, several attempts have been made to estimate system infiltrative arearequirements by selecting an LTAR based on correlation’s between a LTAR and soil physical properties(e.g., Ryon, 1928; USPHS, 1967; Jones and Taylor, 1964; Bouma, 1975). Kiker (1948) proposed a fixedreduction factor based on the clean water infiltration rate. Ryon (1928) and later the U.S. Public HealthService (USPHS) (1967) based the assessment on a crude percolation test and a simple empiricalrelationship. Both of these methods are based on a strong soil dependence of the hydraulic design rate.Based on the imprecision and error of the test and a lack of any correlation between the test results and anLTAR (Bouma, 1971; Healy and Laak, 1974b; Jenssen, 1986; 1988), soil morphology evaluation waspromoted as a better method to estimate infiltrative capacity as well as identify depths to limitingconditions in the soil profile (e.g., seasonal perched ground water, low permeability restrictive layers)(e.g., Tyler and Converse, 1994). However, the morphologic description may be best suited toeliminating applications to problem sites and thereby preventing failures as opposed to discriminating aLTAR based on subtleties in soil morphology. Research does suggest lesser dependence of a LTAR onsoil properties such as soil texture and greater dependence on wastewater application rate andcomposition (Jenssen, 1986).
Common practice continues to be that the design application rates for soil absorption systems (trenches orbeds) are typically in the range of 1 to 5 cm/d (0.24 to 1.23 gpd/ft2 ) (either explicitly or implicitly set)with the site-specific rate based on soil textural properties (e.g., 5 cm/d for a sand and 1 cm/d for a clayloam) and in some areas, percolation testing (e.g., 5 cm/d (1.23 gpd/ft2 ) for a 10 minutes per inch (MPI)percolation rate and 1 cm/d (0.24 gpd/ft2) for a 60 MPI rate). While these relatively low design rates,which are only minute fractions of the respective soil saturated hydraulic conductivities (Ksat), arespeculated to represent an LTAR, there are continuing debates regarding the nature and magnitude ofLTAR’s. Some investigators have reported that an equilibrium or steady-state LTAR actually evolves(Healy and Laak, 1974a; Kropf et al., 1977; Anderson et al., 1982) while others have reported that acontinuous, albeit slow, decrease in infiltration rate capacity occurs (Thomas et al., 1966; Okubu andMatsumoto, 1979; Jenssen, 1986). It is likely that an LTAR does not represent a steady-state infiltrationrate capacity at which a wastewater absorption system will operate indefinitely when continuously usedand in the absence of permeability restoring processes (e.g., soil biota penetration, freeze-thaw effects).Rather, most systems that are operated under continuous use with STE applied at a design rate of 1 to 5cm/d (0.24 to 1.23 gpd/ft2) will eventually clog to a degree where hydraulic failure can occur ( i.e., the

WSAS White Paper, v3.5 11
daily application rate exceeds the infiltration rate at time, t (IRt). The wastewater-induced soil cloggingdevelopment and hence IRt is dependent on several factors such as soil morphology (Jones and Taylor,1964; Healy and Laak, 1974a; Bouma, 1975; Jenssen, 1986), wastewater composition and loading rate(Laak, 1970; Siegrist, 1987a; Duncan et al., 1994; Loudon et al., 1998; Amoozegar and Niewoehmner,1998; Loudon and Mokma, 1999) and application mode and continuity of use (McGauhey and Krone,1967; Siegrist, 1987a; Hargett et al., 1982; Tyler et al., 1985). Hence, the clogging process is complex anddifficult to model precisely. Most criteria for sizing of soil infiltration systems are therefore still based onempirical data regarding LTAR’s (Ryon, 1928; USPHS, 1967; Anderson et al., 1982) with increases inarea provided based on implicit or explicit factors of safety added (e.g., conservatively estimated designflows or increased areas for beds over trenches, respectively).
It is emphasized that practices as described above are applicable to domestic wastewater, often fromsingle-family homes. During the 1970’s and 1980’s, applications began to occur that included differentwastewater types and scales of development, such as multiple family dwelling units, restaurants andcommercial facilities, and small communities. The WSAS designs for these facilities was initially basedon a simple scale-up from that used for single-family homes with little or no adjustment for theperformance effects of system size and/or wastewater composition. As a result, hydraulic and purificationdysfunctions were reported (e.g., Siegrist et al., 1985a,b; Siegrist et al., 1986; Plews and DeWalle, 1985)which led to modifications in design practice to account for the performance effects of wastewater sourcetype and landscape loading. On the contrary, more dilute wastewaters such as graywater STE, may permitdifferent treatment approaches and equivalent or better public health protection (Siegrist and Boyle,1982).
3.2. Modifications to Classic System Designs
There are a number of modifications to the classic WSAS as described above that have evolved toimprove its performance capabilities and/or reliability (see Tables 1 and 2). Modifications of thewastewater source can be made to reduce the volume of wastewater to be treated and/or its pollutant loadthrough (1) flow reduction (e.g., water conserving fixtures) (Siegrist et al., 1978), (2) waste segregation(e.g., no garbage disposal, urine separation, or graywater vs. black water separation) (Siegrist, 1978;Siegrist and Boyle, 1982: Jenssen and Skjelhaugen, 1994; Rasmussen et al., 1996), (3) in-house recycle(e.g., graywater for toilet flushing) (Anderson et al., 1981; Siegrist et al., 1981), and/or (4) point of usetreatment (e.g., bag filter on laundry discharges) (Fig. 6). Modifications to septic tank designs have beentargeted at STE quality, particularly with respect to reducing the STE suspended solids concentration andto a lesser extent the BOD5, and thereby prevent accelerated clogging of soil absorption systems.Examples of these include the use of septic tank effluent biofilters units (see Fig. 7a).
(a) (c)(b) (d)
Fig. 6. Examples of wastewater source modifications: (a) 3-L volume flush toilet, (b) compost toilet,(c) graywater recycle unit, and (d) point-of-use bag filter for laundry discharge.

WSAS White Paper, v3.5 12
Modifications or variants to the soil infiltrative surface have been directed at improving infiltrationcapacity through changes to the interface character and its geometry and placement in the soil profile.Research related to the rate and extent of soil clogging in WSAS with gravel aggregate on the infiltrativesurface (aggregate-laden) led to the development and use of infiltration systems which have an opensurface without a layer of aggregate on it (aggregate-free), the most common of which is a chambersystem (see Fig. 4) (Tyler et al., 1991; Keys, 1996; May, 1996; Loudon et al., 1998; Van Cuyk et al.,2000). Based on the potential adverse effects of gravel on short- and long-term infiltration capacity (e.g.,compaction, fines, embedment, and focused pollutant loading), these aggregate-free systems are designedwith infiltration areas on the order of 40% to 50% less than required with gravel systems (see Fig. 4).Geometry and placement in the soil profile can be selected to maximize infiltrative surface area andenable delivery of effluent into the soil where the treatment potential is highest. Increasingly, the use ofnarrow trenches (e.g., 15- to 30-cm wide) that are placed shallow in the soil profile (e.g., 30- to 60-cmdepth) is being promoted (see Fig. 5). Soil permeability is usually higher shallow in the profile and moreimportantly, narrow and shallow placement improves aeration potential. The use of at-grade and lowpressure pipe (LPP) systems were designed to place the infiltration surface very near the land surfacewhile mound systems place it in an imported layer of sand fill. These system types are intended toovercome site limitations associated with an inadequate unsaturated zone thickness beneath an IS(Converse et al., 1978; Tyler and Converse, 1985; Stewart and Reneau, 1988; Converse et al., 1991;Hoover and Amoozegar, 1989; Amoozegar et al., 1994). Such limitations are most often due to thepresence of a low permeability layer, seasonal or permanent high water table, and/or porous or fracturedbedrock.
Modifications to the classic WSAS also encompass the method of delivery and frequency of applicationof wastewater effluent to the soil (see Fig. 5) (Otis et al., 1978). With the addition of a pump or siphon tothe system, intermittent dosing into conventional 10-cm (4-in.) diameter perforated pipe can enhance thedelivery of STE to a soil absorption system (see Fig. 5). Compared to the normal, gravity delivery thatresults in a semicontinuous trickle flow that is randomly and non-uniformly distributed, dosing improvesintermittent delivery of STE and improves the distribution somewhat. If small diameter (e.g., 2.5-cm)perforated (e.g., 3.2-mm orifices) pipe is used, a pump or siphon can produce pressurized distribution ofthe dosed effluent which can lead to more uniform application of the loading to the soil system. Earlyresearch led to guidance that dosing frequencies should be 1 to 4 times per day based on waste generationcharacteristics and pressurized dosing networks should be designed to achieve relatively equal headlossesand flow rates between orifices (Otis et al., 1978). Later, Hargett et al. (1982) showed that pressurizeddosing offered little advantage over gravity fed application in a silt loam soil since, with both deliverymethods, soil clogging evolved to the extent that the infiltrative surface was continuously ponded andfully utilized in both loading regimes. A recent innovation includes the concept of timed dosing throughpressurized distribution networks where the septic tank provides equalization capacity to permit frequentdosing. This is thought to enable more uniform application and enable more unsaturated flow through theunsaturated zone beneath the infiltrative surface, thereby aiding treatment.
An important development which might be viewed as a modification to the classic WSAS, includes thearray of devices and equipment that have evolved to enable process control and monitoring of systemfunction and performance. For example, the addition of control panels with hydromechanical sensors andtelemetry features have provided a means by which to control effluent application to a soil absorptionunit, to record effluent loading rates, and to detect gross system dysfunction and correct it early. Controland monitoring of purification still relies on sampling and analysis, which is easy for end-of-pipelocations but difficult for soil solution and ground water.

WSAS White Paper, v3.5 13
3.3. Alternative Unit Operations to Classic System Designs
Alternatives to the classic system design involve major changes in the unit operations and treatment trainwithin the system (Fig. 7) (see Tables 1 and 2). These alternatives can be categorized to include (A) add-on treatment units to a septic tank, (B) anaerobic unit operations as replacements for a septic tank, (C)aerobic package plants, and (D) engineered porous media biofilters (PMB’s). The primary purpose ofthese alternatives has been to (1) provide a measurable improvement in BOD5 and SS removal (group A);(2) remove nitrogen from STE before discharge to a WSAS thereby reducing nitrate contamination ofground water (group B), (3) markedly reduce the BOD5 and SS concentrations in STE before discharge toa WSAS thereby retarding soil clogging (group C and D) and/or (4) produce an effluent suitable fordisinfection and discharge to the land surface (disposal only or beneficial reuse such as landscapeirrigation) or a receiving water (group C and D).
Add-on units (AOU’s) are relatively simple in design and operation and include (1) specially designedeffluent filters which support biomass growth and SS removal (Fig. 7a) and (2) submerged media filterswith aeration and recirculation provided by a simple air-lift pump to provide some BOD5 removal (Fig.7b). The treatment efficiency of these AOU’s remains somewhat speculative as there have been few ifany experimental studies documenting performance.
Anaerobic upflow filters were envisioned as means of equal or better treatment with less susceptibility toupset and high concentrations of SS being released into the STE. These systems were comprised of rock-filled tanks with an upflow flow regime to aid in distribution through the media. Performanceobservations suggest the filter’s performance is comparable to that of a well-designed septic tank, andpossibly improved in some cases (Kennedy, 1982).
Aerobic package plants based on fixed film or suspended growth processes were down-scaled fromtraditional designs in an effort to produce an effluent quality suitable for infiltration in low permeabilitysoils and/or for discharge with disinfection to the ground surface or a receiving water (see Fig. 7c). Whilethese systems were shown to have the inherent ability to produce a higher quality effluent than STE, theywere subject to mechanical malfunctions and process upsets (Hutzler et al., 1978; USEPA, 1978; 1980;NSF, 1996). Thus, to reliably achieve their system performance capabilities, operation and maintenance(O&M) must be provided.
Advanced treatment has been demonstrated with PMB’s comprised of a bed of sand (Fig. 7d), peat, foam(Fig. 7e), textiles, or other granular media (see Fig. 7) that are intermittently loaded (e.g., 4 to 24 timesper day) at hydraulic loading rates that are much higher than those for a soil WSAS (e.g., 5 to 20 gpd/ft2
vs. <1 gpd/ft2) (Anderson et al., 1985; Effort et al., 1985; Jowett and McMaster, 1994; Loomis and Dow,1998; Crites and Tchobanoglous, 1998; Driscoll et al., 1998; Roy et al., 1998; Van Cuyk et al., 2000).The higher loading rates are enabled by coarse particle diameters and design, which allows easy access tothe medium to clean and/or replace it if, needed. These PMB’s are being advocated and used to providehigher quality effluents thereby reducing the purification that the soil absorption system must achieve aswell as reducing soil clogging and enabling higher application rates. Most PMB systems can yieldsubstantial reductions in BOD5 and SS as well as complete nitrification and even some N-removal (Lambet al., 1990; Loomis and Dow, 1998). Microbes can be reduced by a factor of 10 to more than 1000, butthere still can be pathogenic bacteria, viruses and protozoa in the effluent (Emerick et al, 1997; Higgins etal., 1999; Loomis and Dow, 1998; Van Cuyk et al., 2000). While small-scale onsite disinfection units(e.g., chlorination, ultraviolet light irradiation) are available, they are rarely used prior to subsurface soilabsorption.
PMB’s have also been applied to achieve nitrogen removal in an otherwise classic WSAS. The nitrifiedeffluent from a PMB (e.g., trickling filter, textile filter, or sand filter) is directed back to the influent end

WSAS White Paper, v3.5 14
of the septic tank (Whitmayer et al., 1991). The anaerobic conditions in the tank combined with adequatecarbon and nitrate as an electron acceptor have been shown to enable nitrogen removal, on the order of 50to 80% or higher in some cases, thereby yielding STE concentrations of 20 mg-N/L or less (Shafer, 2000).
Beneficial reuse of wastewater effluent has been accomplished through graywater treatment systemsproducing effluent for flushing water carriage toilets and/or landscape irrigation (Anderson et al., 1981).A recent innovation involves the application of drip irrigation tubing and emitters to deliver STE to theshallow subsurface into the root zone (see Fig. 7f) (Sinclair, et al., 1999). To prevent emitter plugging, aspin-disk filter apparatus is used to remove suspended solids normally found in STE.
(a) (b)
(d) (e)(e) (f)
(c)
Fig. 7. Examples of alternative unit operations including: (a) effluent biofilter unit, (b) in-tank aerationunit, (c) rotating biological contactor, (d) sand filter, (e) foam filter, and (f) drip irrigation line.
4. Performance Capabilities, Predictability, and Reliability
4.1. General Performance Capabilities of WSAS
The performance achieved by a modern WSAS depends on a number of inter-related factors. Engineeringdesign is completed for a given application based on a site evaluation. This leads to construction andstartup, followed by system usage, and any requisite O&M. If all of these factors are properly addressed,and the actual conditions and usage are consistent with any assumptions made, then system performanceshould be as described below. However, if any of these factors are overlooked or inadequately addressed,or if actual conditions depart from assumptions made in design and implementation, then performancedeficiencies can occur either early or late in the system’s life. These deficiencies can manifest themselvesas mechanical, hydraulic, and/or purification dysfunctions and all three can increase the risks of adversepublic health and environmental effects (see Fig. 3). Purification dysfunctions that lead to ground water

WSAS White Paper, v3.5 15
and surface water contamination and are of particular concern since they can be difficult to monitor for,detect, and mitigate.
The design of any WSAS inherently includes subsurface infiltration and percolation for advancedtreatment and disposal of a partially treated effluent, most often STE. As noted earlier, these systemstypically employ delivery of primary treated wastewater into a soil absorption trench or bed from whichwastewater infiltrates and percolates through a depth of soil into underlying ground water (see Figs. 1 and2) (Anderson et al., 1985; Brown et al., 1979; USEPA, 1978, 1980, 1981, 1992, 1997; Kristiansen, 1982,1991; Jenssen and Siegrist, 1990; Crites and Tchobanoglous, 1998). Effective purification requiresadequate hydraulic retention time (HRT) and suitable conditions for treatment processes to function (e.g.,adequate biomass and bioactivity, aerobic conditions, favorable pH and temperature) such that processesoccur at a rate and extent to achieve removal (e.g., sorption/precipitation), transformation (e.g.,biodegradation) and die-off/inactivation before ground water recharge occurs (see Fig. 2). The percolatemoving downward from the WSAS may be mixed with ambient ground water, which migrates under,natural gradients toward points of exposure to receptors of concern (see Fig. 3). Depending on local andregional conditions, transport/fate processes along the pathways to receptors may or may not reduceresidual concentrations of COC’s in the percolate from a WSAS that are above threshold concentrationsto lower levels that are no longer of concern.
For effective purification of primary treated wastewater in natural soils, unsaturated flow in the porousmedium can be critical since this controls contact between wastewater constituents and soil particles andassociated biofilms, over an adequate period for treatment processes to occur (Bouma, 1975; USEPA1978; Jenssen and Siegrist, 1990; Emerick et al., 1997; Schwager and Boller, 1997; Stevik et al., 1999;Van Cuyk et al., 2000; McCray et al., 2000). Unsaturated flow conditions can be achieved by applicationof limited daily loadings (e.g., 1 to 5 cm/d) which are usually a minute fraction of the medium’s Ksat (e.g.,100 to 1000 cm/d). Intermittent dosing (e.g., 4 to 24 times per day) and pressurized uniform applicationcan also be employed to help create an unsaturated flow regime. Also, in time, wastewater-induced soilclogging evolves due to an accumulation of inert particles and amorphous organic matter (like humic-substances) in a few cm-thick zone at the IS (see Fig. 2) (Otis, 1985; Jenssen and Krogstad, 1988;Siegrist, 1987a; Siegrist et al., 1991). This clogging leads to a reduced permeability and more uniformtemporal and spatial infiltration with a concomitant unsaturated flow almost independent of wastewaterloading. When soil-clogging is extensive, STE may continually pond on the horizontal infiltrative surfacethereby causing vertical sidewalls to become available for infiltration. Soil clogging is an important, if notcritical, process, which contributes to the advanced treatment potential of WSAS. Not only does itenhance infiltration surface utilization and yield an unsaturated flow regime in the vadose zone, itprovides powerful treatment in the clogging zone. However, if soil clogging yields too great a reductionin permeability at the IS, it can be detrimental by causing hydraulic dysfunction (e.g. backup into adwelling or seepage to the ground surface) or adversely affecting purification (e.g., anaerobic conditionsand reduced biotransformation rates).
For the common wastewater chemical COC’s such as BOD5, COD, and SS, purification efficiencies of>90% can be sustainably achieved by filtration, sorption, and biodegradation processes in most WSASand settings (see Fig. 2; Table 2) (USEPA, 1978; 1980; Jenssen and Siegrist, 1990; Van Cuyk et al.,2000). With dilution and dispersion in the ground water and any additional removal therein, these COC’sseldom present any concern for adverse impacts to the receiving environment. However, nutrient removal(nitrogen and phosphorus) and any adverse impact on a receiving environment are much more sensitive toprocess design and site conditions (Gold and Sims, 2000). Microbial COC’s commonly found in STEinclude pathogenic bacteria at sustained, high concentrations and virus and protozoa at highly variableand episodically released levels (see Table 2) (Bicki et al., 1984; Anderson et al., 1985; USEPA, 1978;Van Cuyk et al., 2000; Cliver, 2000). While WSAS performance has been documented for bacteria suchas fecal coliforms, there is less information on purification with respect to pathogenic bacteria, viruses,

WSAS White Paper, v3.5 16
and protozoa. Purification efficiencies in WSAS can be very high, yielding near complete removal offecal coliform bacteria and 99.99% or higher reductions in virus (Emerick et al., 1997; Stevik et al., 1999;Van Cuyk et al., 2000). Despite excellent purification performance observed in controlled experiments(e.g., Van Cuyk et al., 2000) and field studies with properly implemented modern systems (e.g., Andersonet al., 1991, Higgins et al., 1999, Oakley et al., 1999), the transport of pathogens from WSAS to groundwater, and in some cases, drinking water has been alleged (e.g., Rose et al., 1999). However, the factorscausing the transport were often not documented, or the WSAS studied were of older disposal-baseddesigns.
Apart from purification efficiency, the hydraulic function of a WSAS is often gauged by its service life.Service life is closely related to soil clogging and the daily loading rate vs. the long-term acceptance rate,which in turn are influenced by an operational loading factor (LF = ratio of actual loading to designloading) and continuity factor (CF = days of use divided by 365). At low LF’s or for low CF’s, servicelives may be practically indefinite. Several studies of system service life have been completed during thepast 25 yr. suggesting hydraulic service lives varying from 11 to >30 yr. (see Fig. 8) (Hill and Frink,1980; Hoxie and Frick, 1984; Plews and de Walle, 1985; Gårderlokken, 1997; Sherman et al., 1998; Keyset al., 1998). Hill and Frink (1980) studied more than 3000 small systems and concluded that a service lifeof more than 30 years could be expected. Plews and de Walle (1985) studied 369 large, buried systemsand found that more than 60% had a hydraulic service life of more than 20 years. For systems with anactual loading rate of < 4 cm/d only 3.8% had poor hydraulic performance. For Norwegian systems builtafter 1985 when new regulations and loading rates of 2.5 cm/d or less where applied to most systems, noreports of hydraulic failure of properly installed systems have been reported (Gårderløkken, 1997). Thissuggests that for standard domestic STE applied to gravel-filled infiltration trenches and loading rates<2.5 cm/d, a hydraulic service life of several decades can be expected for WSAS that are designed andconstructed today and operated and maintained as needed based on the design specifications. On thecontrary, Sherman et al. (1998) showed 18 years as the mean age of failure in three counties investigatedin Florida while Keys et al. (1998) predicted that gravel-filled systems in sand soils have a predicted lifeof 11 years, even when loaded as low as 1.6 cm/d. For other wastewater effluent types and sorted soils,coarse sands and gravels, Jenssen and Siegrist (1991) suggested a conceptual framework for hydraulicloading rates for subsurface treatment systems. However, no data are available on service life foralternative system designs.
0
10
20
30
40
50
60
70
80
90
100
0 5 10 15 20 25 30
Operational age (years since installation date)
Adapted from Clayton, 1975 (WSAS installed during 1952-1968)
From Hoxie and Frick, 1984 (WSAS installed during 1974-1983)
Reproduced from Plews and DeWalle, 1984 (Larger WSAS installed during 1950-1984)
Adapted from England and Dix, 1999 (Chamber WSAS installed during 1990-1998)
Systems still functioning (%)
Fig. 8. System hydraulic function versus operational age and installation period.

WSAS White Paper, v3.5 17
4.2. WSAS Treatment Potential for Key Pollutant Groups
The common COC’s in domestic wastewater and reasonable performance expectations for modern systemdesigns that are properly implemented (i.e., proper siting, design, installation and operation/maintenance)are summarized in Table 2. Additional details regarding three key pollutant groups, (1) organics andsuspended solids, (2) nutrients, and (3) pathogens, are given in this section.
4.2.1. Organics and Suspended Solids. Biodegradable organics in either dissolved or suspended form can becharacterized by the BOD5. Volatilization and adsorption, followed by microbial degradation are the mainprocesses for removal of soluble biodegradable organics. Suspended solids, including organic andmineral matter, can be removed through a combination of physical straining and biological degradationprocesses (Reed et al., 1994). Most soils are effective porous media biofilters due to narrow pores andeffective straining of wastewater particles. The large surface area of the soil particles also provides agreat potential for biofilm development and infiltration systems are reported to attain maximum efficiencywith respect to removal of organic matter as early as of 2 to 3 weeks from the onset of operation (Pell andNyberg, 1989a,b). Others report a period of 2 to 3 months before the biological degradation potential isfully developed (Van Cuyk et al., 2000). In either case, the start-up phase may be of little consequence tooverall public health and environmental protection given the service life of most WSAS is years in length.When viewed over their long service lives, most WSAS can be expected to reliably achieve very highremoval of BOD5 and SS (Hines and Favreau, 1975; Anderson et al., 1985; Effert et al., 1985; Soltman,1990). Organic chemicals such as volatile organic compounds (e.g., benzene, trichloroethylene) andpesticides can be present in domestic wastewater (Greer, 1987; Kolega et al., 1987; Bicki and Lang, 1991;Sauer and Tyler, 1991; Sherman and Anderson, 1991). However, the concentrations appear to be at tracelevels, which do not migrate and pose problems in most WSAS treating domestic wastewater.
4.2.2. Nutrients. In domestic wastewater, typically 70-90 % of the nitrogen is in the form of ammoniumion (NH4
+) and 10 to 30 % is in organic form (Lance, 1972; Nilsson, 1990; Gold and Sims, 2000). Theremoval mechanisms for nitrogen in a WSAS include volatilization, ammonification,nitrification/denitrification and matrix adsorption. For a properly installed system, the predominant N-retention reaction would be ammonium adsorption while the predominant transformation reaction wouldbe biological nitrification. The principal removal reactions include biological denitrification and leachingand under certain conditions also chemical denitrification in the ground water zone (Siegrist and Jenssen,1989). Nitrogen removal in wastewater infiltration systems vary greatly. In general near completenitrification is achieved in properly installed systems, and nitrification is normally very rapid occurring inthe first 30 cm of soil below the infiltrative surface. However, 1-2 months are required from the onset ofinfiltration to generate a full population of nitrifiers (Pell and Nyberg 1989a,b; Zhu 1998; Van Cuyk et al.,2000). A removal of 10 - 20% of the total nitrogen applied can normally be achieved in conventionalWSAS (Siegrist and Jenssen, 1989; Westby et al., 1997; Converse, 1999). Higher removal is possible inmound systems and those with cyclic loading/resting. Westby et al. (1998) found an average of >85% N-removal in dosed mound systems. In systems optimized for nitrogen removal, more than 50% removalcan normally be achieved (Lance et al., 1976; Laak, 1982; Siegrist and Jenssen, 1989; Converse, 1999).Phosphorus is typically present in wastewater as orthophosphate, dehydrated orthophosphate and organicphosphorus. Biological oxidation results in conversion of most phosphorus to the orthophosphate forms(Cooper et al., 1996). The main processes for phosphorus removal from wastewater in porous media areadsorption, complexation and precipitation. Most models assume that phosphorus fixation in a PMBoccurs in two consecutive kinetic reactions: rapid physical adsorption followed by a slower chemisorption(Tofflemire et al., 1973; Sikora and Corey, 1976; Gold and Sims, 2000). Calcium and oxidizedcompounds of Fe and Al are known to be important agents for P-sorption in soils. Stuanes and Nilsson(1987) documented that the Fe and Al pools were the most important P-sinks in soils receiving STE. Thepotential for P-sorption of a porous medium is dependent on the mineral composition and the degree of

WSAS White Paper, v3.5 18
weathering of the particle surfaces which renders the metals in an oxide or hydrous oxide state where theyare able to react with P compounds. In general, soils have variable P-sorption ability (e.g., 0.2 to 1.2 g-P/kg). In a quartz sand the P-sorption capacity of a wastewater infiltration system may become saturatedafter a few months whereas in weathered sand or fine grained soils (e.g., clays, silt, loam) the sorptioncapacity may hold for a period of ten years or more. Most studies of P removal have evaluated thesorption potential using equilibrium isotherms, often described by the Langmuir equation (Ellis andEricson, 1969; Tofflemire et al., 1973; Johnson et al., 1979; Sommers et al., 1979). Experimental resultsoften show that the P-sorption capacity of the PMB is actually much higher than estimated by anequilibrium isotherm (Stuanes and Nilsson, 1987). However, even though many studies assume sorptionto be instantaneous, it has been shown by several researchers that this is not always the case (Haseman etal., 1950; Coleman et al., 1960; Davidson and Chang, 1972; Enfield, 1974; Kuo and Lotse, 1974).Overman et al. (1978) reported that the assumption of equilibrium between solution and adsorbed phasesin wastewater PMB’s was reasonable for lower wastewater flow velocities but less suitable for highervelocities, the latter of which might occur for shallow depths in coarse PMB’s or at high loading rates.
4.2.3. Pathogens. Microbiologic COC’s commonly found in STE include pathogenic bacteria at sustainedhigh concentrations and virus and protozoa at highly variable and episodically released levels (Cliver,2000). From a single family home, wastewater bacterial densities are typically quite high with values of108 to 1012 organisms per L being commonly encountered (Bicki et al., 1984; Anderson et al., 1985;USEPA, 1978; Haas et al., 1999; Van Cuyk et al., 2000). Of the total bacterial density there can beprevalent, but highly variable, concentrations of pathogenic bacteria like E. coli, Pseudomonasaeruginosa, Staphylococcus aureus, and Salmonella. Other pathogens, such as virus and protozoa, arenot continuously present at high densities, but rather are shed during disease events and thus theconcentration in the wastewater stream at a given home can vary from non-existent levels to values on theorder of 106 organisms per L or more. Even domestic graywater can contain appreciable levels ofpathogens (Siegrist and Boyle, 1982; Rose et al., 1991). Multiple family homes or clusters of individualhomes tend to attenuate the episodic nature of pathogen release, but increase the likelihood that thewastewater will contain pathogens at any given time. Pathogens may also be more prevalent incommercial and institutional sources and in some cases, at very high levels (e.g., highway rest areas).
Numerous investigations have studied the transport and fate of bacteria and viruses in soil and groundwater under laboratory and field conditions (Romero, 1970; McCoy and Ziebell 1975, USEPA, 1978;Lewis et al., 1982; Harvey and Garabedian, 1991; Tuetsch et al., 1991; Yates and Ouyang, 1992; Harvey,1997; Higgins, 1999; Oakley et al., 1999; Stevik et al., 1999; Van Cuyk et al., 2000). Studies of bacterialtransport/fate have most often employed fecal indicator bacteria such as fecal coliforms or enteric bacteriasuch as E. coli. Studies of virus transport/fate have often been accomplished using bacteriophages such asMS-2 or PRD-1. In general it can be concluded that bacteria and viruses are transported only a fewdecimeters to meters in the unsaturated zone whereas in the ground water (saturated) zone, they can travelten to hundreds of meters (Keswick and Gerba, 1980; Keswick et al., 1982; Lewis et al., 1982; Rose et al.,1999). In WSAS removal and inactivation/die-off of pathogens can be extremely effective during STEinfiltration through the clogging zone and percolation through the unsaturated flow regime beneath it.The mechanisms for immobilization of bacteria and viruses in WSAS are a combination of straining andadsorption (Peckdeger and Matthess, 1983; Sharma et al., 1985). Straining of bacteria can occur if thepores of the filter are smaller than the bacteria. According to Updegraff (1983) straining becomes aneffective mechanism when the average cell size is greater than the grain size d5 of the soil (d5 is thediameter where 5% of the particles in mass are smaller and 95% of them are larger). Bouwer (1984)reported that straining occurred when the diameter of the suspended particle was larger than 0.2 times thediameter of the particles constituting the porous medium. A more sophisticated criterion for filtration ofbacteria under saturated conditions than the two mentioned above was suggested by Matthess andPeckdeger (1985). Results form straining experiments have shown that in addition to media grain size,straining is controlled by the amount of mechanical and biological clogging of the media, the degree of

WSAS White Paper, v3.5 19
water saturation, and the hydraulic loading rate (Peckdeger and Matthess, 1983; Corapcioglu and Haridas,1984). The work of several investigators (e.g., McCoy and Ziebell, 1975; Van Cuyk et al., 2000) hasshown that clogging can be of essential importance in pathogen cell removal. This is partly due toreduction of pore size, which induces straining, but also to biotic factors and adsorption, which mayincrease in importance when clogging, is present.
When the pores are larger than the microorganism, adsorption becomes the dominant retentionmechanism; adsorption is therefore of great importance to virus removal. Adsorption of cells to a porousmedia is dependent on several factors as the content of organic matter, degree of biofilm development,and electrostatic attraction due to ion strength of the solution or electrostatic charges of cell- and particlesurfaces (Stevik et al., 1998). Coating of Fe-oxides on media surfaces is shown to enhance adsorption ofbacteria and viruses (Keswick and Gerba, 1980). This is due to the Fe-oxides turning the surface chargemore positive and thereby increasing the adsorption of bacteria that normally have a negative surfacecharge at neutral pH. Iron oxides also enhance phosphorus removal (Stuanes and Nilsson, 1987) andhence a positive correlation between phosphorus and bacteria/virus sorption can be expected. Adsorptionof microbial cells is a two-step process that can be reversible or irreversible. Reversible adsorption is aweak interaction between the bacteria and the porous media, and the primary forces are electrostaticforces and van der Waals' forces (Mozes et al., 1986). Irreversible adsorption, or adhesion, is a permanentinteraction that occurs when bacterial polymers connect the bacteria and the adsorbent (Griffin and Quail1968; Marshall 1971; Elwood et al., 1982). Die-off of bacteria and inactivation of virus can occur in theadsorbed or in the liquid phases. These processes are affected by biotic and abiotic factors such as soilwater content, pH, temperature, organic matter, bacterial species, predation, and antagonistic symbiosisbetween microorganisms in the system (Yates and Ouyang, 1992; Stevik et al., 1999).
4.3. Factors and Processes affecting Performance
The performance capabilities as noted above are influenced by various factors and their interactions.While it is impossible to isolate a single factor and describe its effect on WSAS performance, Table 3 listssome key factors and the following discussion is given to illustrate the nature and types of effects that canoccur. Soil and site conditions are described first followed by system design, installation, andoperation/maintenance. For the purposes of this discussion, the WSAS treatment system encompasses theinlet to the soil absorption unit through the lower limit of the underlying vadose zone (see Fig. 3).
4.3.1. Soil and Site Conditions. Soil properties such as grain size and pore size distribution, bulk density,porosity, water content, surface area, mineralogy, organic matter content, pH, and microbial biomass anddiversity are very important to flow and transport processes in WSAS. Also important are anyheterogeneities in these properties with horizontal and depth dimensions. The infiltration zone,unsaturated zone, and ground water zone are all important regions of interest. As noted earlier, long-termacceptance rates have historically been linked with soil texture (e.g., sand, silt loam) and a crude measureof hydraulic capacity (i.e., percolation rate). However, there is little research evidence that hasestablished the relationship between LTAR’s and soil properties and some evidence to the contrary.Jenssen (1986) conducted column experiments that revealed that for time periods less than 2 yr., theinfiltration rate is dependent on the Ksat of the soil. However, for longer times and for soils with an initialsaturated hydraulic conductivity below 2500 cm/d (sands range from 50 – 10000 cm/d) the cloggingdevelopment seems to control the infiltration rate (Fig. 9). Jenssen concluded that there should be littleneed for differentiation of the loading rate based on soil type for standard gravel-filled soil absorptionunits receiving domestic STE in fine sands and soils of lower hydraulic conductivity (clayey, loamy andfine sandy soils). However, the actual flux rate through a soil clogging zone can be impacted by themoisture potential underneath it which is controlled by soil texture and unsaturated zone depth, as well asthe head of ponded effluent above it (Bouma, 1975).

WSAS White Paper, v3.5 20
Table 3. Design and environmental conditions affecting WSAS performance.
Category Factor/condition Example performance effects
Soil and siteconditions
Soil system propertiesand heterogeneity withinthe WSAS
Grain size and pore size distribution, bulk density, porosity, watercontent, surface area, mineralogy, organic matter content, pH, andmicrobial biomass can affect flow and transport processes.
Unsaturated zone depthbetween the infiltrativesurface and ground water
Distance can affect hydraulic function and in turn purification byinfluencing the soil water content, aeration status, media surface area,and hydraulic retention time.
Soil temperatures Can influence soil hydraulic conductivity properties based on viscosityeffects; can affect the solubility of dissolved gases such as O2 and therate and extent of biological reactions; virus inactivation is highlytemperature dependent with higher rates at higher temperatures.
Designfeatures
Effluent application rateand composition
Can affect the rate and extent of clogging at the infiltrative surface,which in turn can affect the hydraulic flow regime and treatment withinthe WSAS.
Method of effluentapplication
Can influence performance depending on the COC and the type and rateof reactions effecting its treatment.
Depth and geometry ofthe infiltrative surface
Can affect moisture, temperature, and aeration regimes, and the degreeto which diurnal and seasonal variations occur. Can affect degree ofbiogeochemical reactivity within the infiltration and vadose zones(shallower depth is typically more reactive).
Infiltrative surfaceinterface characteristics
Presence of an aggregate such as gravel on an infiltrative surface canreduce ISZ permeability by blocking pore entries, becoming embeddedin the soil matrix, yielding fines that are deposited in pore entries, or byfocusing BOD and TSS as a result of the reduced permeability.
System size and densityof application
As systems become larger and/or the density of application of smallsystems increases, there is increased potential for adverse hydrologiceffects (e.g., ground water mounding) and cumulative pollutant effects.
Constructionand operation
Construction practices Can affect the hydraulic properties of the natural, undisturbedsubsurface through compaction, smearing or puddling of the surface dueto shear from a vehicular tire or track at the ISZ interface, or depositionof wind-blown materials.
Age of installation andoperational service life
The age of installation is important as the state-of-knowledge andstandard of practice have evolved over the past 50 years and systemsinstalled in 1950 are not the same as those installed in 1990.Operational service life combined with age of installation can affectsystem performance, primarily due to the rate and extent of clogging.
Operation/maintenance Changes in wastewater flow/composition from design assumptions canimpact overall performance; maintenance through pumping andhydromechanical repair as needed is important to long-term function.
Unsaturated zone thickness beneath a soil absorption unit and the depth to ground water can affecthydraulic function and in turn purification by influencing the soil water content, aeration status, mediasurface area, and hydraulic retention time. In the U.S., the thickness of the unsaturated zone for WSASrange from 0.6 to 1.2 m and for intermittent sand filters, from 0.6 and 0.9 m (USEPA, 1980a; Anderson etal., 1985; Crites and Tchobanoglous, 1998). A high degree of treatment normally occurs in the infiltrationzone as soil clogging develops. However, at higher hydraulic loading rates and with nonuniformdistribution methods, constituents of concern that would normally be treated can be transported throughthe vadose zone to ground water.

WSAS White Paper, v3.5 21
Increasing operation time
IR (cm/d)
Range ofLTAR’s…?
Initial Ksat (cm/d)
Fig. 9. Time-dependent infiltration rate changes during wastewater application related to the initialsaturated hydraulic conductivity of the media for clean water (from Jenssen, 1986).
For example, many studies have shown that a large percentage of bacteria remain near the IS wheneffluents are applied to porous media (Brown et al., 1979; Kristiansen, 1981; Duncan et al., 1994; Smithet al., 1985; Huysman and Verstraete, 1993; Emerick et al., 1997; Stevik et al., 1999; Van Cuyk et al.,2000). Kristiansen (1981) found no fecal coliform bacteria at more than 30-cm depth below theinfiltrative surface of an onsite soil absorption system with a mature clogging zone. Duncan et al. (1994)evaluated the relationship of pretreatment and soil depth on percolate composition and found highremovals of fecal coliforms within the first 30 cm for all pretreatment methods. The authors concludedthat higher levels of pretreatment could be substituted for increased soil depth. Stevik et al. (1999) founda significant reduction of E.coli with soil depth and observed that 99% of E. coli was removed in the top12 cm of 80-cm long columns packed with sand media. Emerick et al. (1997) observed that intermittentsand filters as shallow as 38 cm were capable of removing 90 percent of coliform bacteria fromwastewater with a high dosing frequency and a hydraulic loading rate of 4.0 cm/day. Van Cuyk et al.(2000) completed 3-D lysimeter studies and field monitoring of mature systems to quantify the fate ofindigenous fecal bacteria as well as viral surrogates (MS-2 and PRD-1 bacteriophages). Lysimeter resultsrevealed breakthrough of fecal coliforms and virus in sand regardless of depth to ground water (60 vs. 90cm) or infiltrative surface/loading rate scenario (gravel-laden at 5.0 cm/d vs. gravel-free at 8.4 cm/d)(Masson, 1999; Van Cuyk et al., 2000). However, if hydraulic loading rates are too high or the dosingfrequency is too low, some microbes can be transported to lower regions in a soil matrix, posing apurification concern in systems that are too shallow to ground water. Alternatively, at some point there islimited additional improvement in purification by increasing unsaturated zone thickness (Peeples et al.,1991).
The thickness of unsaturated soil beneath an IS is not fixed. Rather, it can be quite variable due tochanging ground water table elevations associated with seasonal precipitation, or to excess infiltration dueto wastewater application. When wastewater is applied to soil, the ground water recharge in the area ofinfiltration increases. This can result in a local increase in ground water level termed ground water

WSAS White Paper, v3.5 22
mounding (Hantush, 1967; Fielding, 1982). The ground water mounding is dependent on several factors,such as the saturated hydraulic conductivity of the soil, distance to hydraulic barriers, and depth of thesaturated layer (see Fig. 10). The loading rate and design of the system also will influence the height ofthe ground water mound. In some tills and fine grained soils, the ground water can rise several metersdue to wastewater application to a WSAS. Jenssen (1988) therefore defined the hydraulic capacity of asite as “...the amount of liquid per unit time that can be continuously infiltrated without raising the groundwater table above an acceptable level”. The hydraulic capacity is most likely to be limited in soils of lowhydraulic conductivity or shallow depth. In such soils the hydraulic capacity should not be overlookedeven when designing small systems. Mound systems are built in shallow soils of low hydraulicconductivity and failure of mound systems (at least in Norway) is due to insufficient considerations of thehydraulic constraints at the site. Ground water mounding must be considered on sites with hydrauliclimitations and/or where the wastewater application rate per unit area increases due to clusters of smallWSAS or with larger commercial or smaller community systems. Modeling tools are available to aid inthe analysis of mounding under WSAS (see Table 4).
Fig. 10. Ground water mounding underWSAS as a function ofinfiltration rate, aquifer depthand hydraulic conductivity, anddistance to a hydraulic barrier(after Jenssen and Bromssen,1985).
Aquifer depth (m)
Moundingheight (m)
Soil temperatures can influence the hydraulic conductivity properties of a porous medium like soil, due tothe effects of temperature on water viscosity. Comparing a temperature of 10C to that of 30C, thehydraulic conductivity is lower and the moisture retention is higher under otherwise comparableconditions. Soil temperature can also affect the solubility of dissolved gases such as O2. The rate andextent of biological reactions can be described by an adaptation of the Arhennius relationship forchemical reactions which indicates that for a 10C decrease in temperature, the rate of reaction is 50% asfast. Some biological processes (e.g., nitrification) can effectively cease at very low (<10C) or hightemperatures (>40C). Virus inactivation is highly temperature dependent with higher rates at highertemperatures (Yates and Ouyang, 1992).
Climate considerations are diverse and include air temperatures, relative humidity, wind speed,precipitation, and so forth. These characteristics can influence the unsaturated zone properties withrespect to temperature and water content. Air temperature and relative humidity characteristics caninfluence the rate of evapotranspiration. This can be an important route for water movement in warm, dry
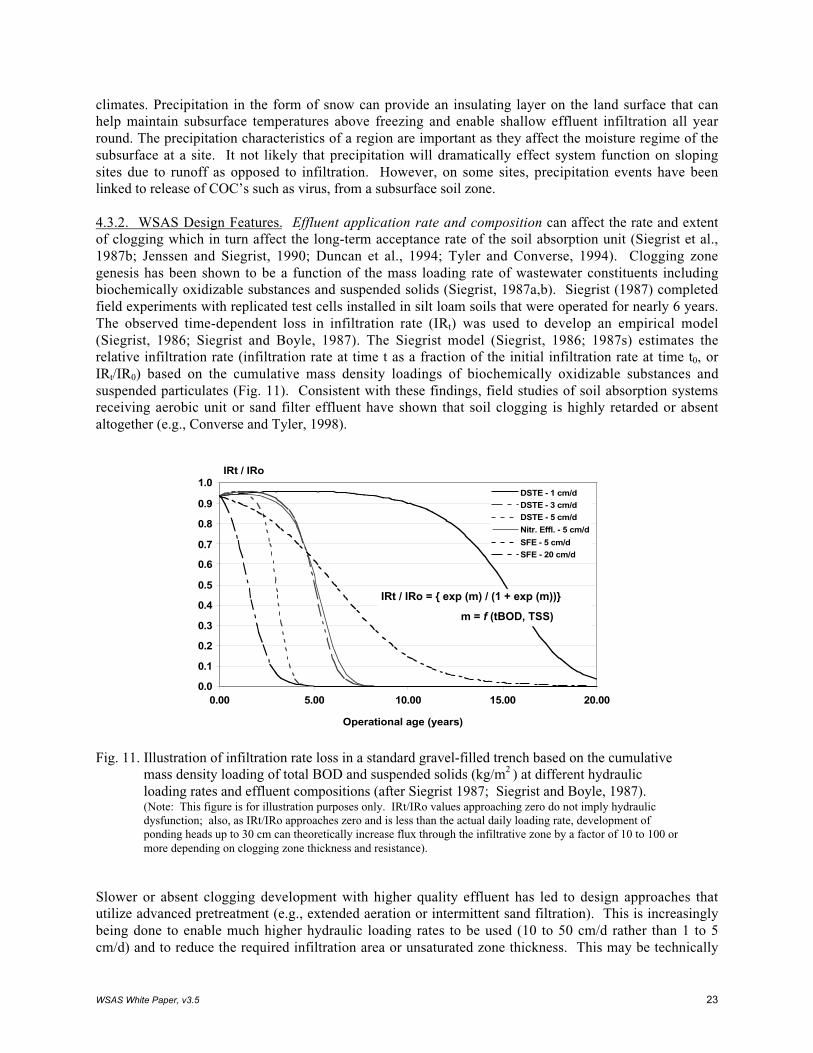
WSAS White Paper, v3.5 23
climates. Precipitation in the form of snow can provide an insulating layer on the land surface that canhelp maintain subsurface temperatures above freezing and enable shallow effluent infiltration all yearround. The precipitation characteristics of a region are important as they affect the moisture regime of thesubsurface at a site. It not likely that precipitation will dramatically effect system function on slopingsites due to runoff as opposed to infiltration. However, on some sites, precipitation events have beenlinked to release of COC’s such as virus, from a subsurface soil zone.
4.3.2. WSAS Design Features. Effluent application rate and composition can affect the rate and extentof clogging which in turn affect the long-term acceptance rate of the soil absorption unit (Siegrist et al.,1987b; Jenssen and Siegrist, 1990; Duncan et al., 1994; Tyler and Converse, 1994). Clogging zonegenesis has been shown to be a function of the mass loading rate of wastewater constituents includingbiochemically oxidizable substances and suspended solids (Siegrist, 1987a,b). Siegrist (1987) completedfield experiments with replicated test cells installed in silt loam soils that were operated for nearly 6 years.The observed time-dependent loss in infiltration rate (IRt) was used to develop an empirical model(Siegrist, 1986; Siegrist and Boyle, 1987). The Siegrist model (Siegrist, 1986; 1987s) estimates therelative infiltration rate (infiltration rate at time t as a fraction of the initial infiltration rate at time t0, orIRt/IR0) based on the cumulative mass density loadings of biochemically oxidizable substances andsuspended particulates (Fig. 11). Consistent with these findings, field studies of soil absorption systemsreceiving aerobic unit or sand filter effluent have shown that soil clogging is highly retarded or absentaltogether (e.g., Converse and Tyler, 1998).
0.0
0.1
0.2
0.3
0.4
0.5
0.6
0.7
0.8
0.9
1.0
0.00 5.00 10.00 15.00 20.00
Operational age (years)
DSTE - 1 cm/dDSTE - 3 cm/dDSTE - 5 cm/d
Nitr. Effl. - 5 cm/d
SFE - 5 cm/dSFE - 20 cm/d
IRt / IRo
IRt / IRo = { exp (m) / (1 + exp (m))}
m = f (tBOD, TSS)
Fig. 11. Illustration of infiltration rate loss in a standard gravel-filled trench based on the cumulativemass density loading of total BOD and suspended solids (kg/m2 ) at different hydraulicloading rates and effluent compositions (after Siegrist 1987; Siegrist and Boyle, 1987).(Note: This figure is for illustration purposes only. IRt/IRo values approaching zero do not imply hydraulicdysfunction; also, as IRt/IRo approaches zero and is less than the actual daily loading rate, development ofponding heads up to 30 cm can theoretically increase flux through the infiltrative zone by a factor of 10 to 100 ormore depending on clogging zone thickness and resistance).
Slower or absent clogging development with higher quality effluent has led to design approaches thatutilize advanced pretreatment (e.g., extended aeration or intermittent sand filtration). This is increasinglybeing done to enable much higher hydraulic loading rates to be used (10 to 50 cm/d rather than 1 to 5cm/d) and to reduce the required infiltration area or unsaturated zone thickness. This may be technically

WSAS White Paper, v3.5 24
sound from an infiltration rate capacity and hydraulic performance basis, but has questionableimplications related to purification. While advanced treatment units can reduce BOD5 and SS loadingsand retard wastewater-induced clogging, the concentrations of pathogenic bacteria and virus may not bemarkedly reduced. Thus absence of a clogging zone may diminish the effective purification of pathogensbefore ground water recharge. There is no current research that has clearly demonstrated effectivepathogen removal in relatively high-rate WSAS with retarded clogging development that are otherwiseconventionally designed.
The method of application, including the degree of uniformity (on an IS utilization basis) as well as thefrequency of application, can influence performance depending the constituent of concern and the typeand rate of reactions affecting its removal (see Fig. 12). More frequent application of small doses of STEuniformly applied can yield improved purification with respect to chemical and microbiologicalconstituents (Siegrist and Boyle, 1982; USEPA, 1978; Emerick et al., 1997). This is due to facilitatingfilm flow over particle surfaces and enabling more intimate contact between COC’s and media surfaces.As noted below, continuous operation (i.e., year-round) of a WSAS can yield potentially differentperformance than seasonal or intermittent use, or where long-term resting (e.g., 6 months out of eachyear) is planned.
The infiltration surface utilization, ISU, is a parameter that describes the fraction of the design oravailable infiltrative surface that is actually wetted and used for infiltration during operation. The ISUvaries from a value at startup (ISUo) to a value at time, t (ISUt) and is a function of the system designincluding the daily loading rate, the method of application and the hydraulic properties of the natural soil.End members on the ISU continuum (near 0 up to 1.0) include gravity fed systems in high permeabilitysoils (very low ISUo) versus pressure-dosed systems in low permeability soils (very high ISUo). In amature system that experiences ponding or near-ponding conditions due to clogging development, theISU approaches 1.0 independent of application method, rate, or soil properties. The ISU is important totreatment as it impacts the flow regime in the vadose zone underlying the infiltrative surface. Twoadditional related parameters of interest are the HRT and the volumetric utilization efficiency (VUE) ofthe porous media in the vadose zone beneath the IS. The HRT is important as it determines the timeavailable for reactions to occur. Biochemical treatment reactions such as organic matter degradation,nitrification, and fecal coliform removal can often be described by 1st-order kinetics which relate theconcentration at a given depth to that in the applied effluent. The value of the 1st-order reaction rateconstant, K , can vary with time and space due to soil clogging development and the accumulation oforganic matter and nutrients at the IS and an associated elevated biomass (Nilsson, 1990; Siegrist, 1987a).The rate of reaction for volatilization/sorption/degradation of most constituents is fastest at the infiltrativesurface and within the 15 to 30 cm of the vadose zone below it. The purification efficiency predicted by1st-order reactions is also impacted by the HRT (or t) which is affected by the effluent delivery methodand application rate, the soil grain size or pore size distribution, and the degree of soil clogging.Experimental data of Ausland (1998) clearly illustrates the interactions. Ausland completed a series offlow experiments in a large 2-D tank lysimeter (1-m wide by 90-cm deep) using medium vs. coarse sand,point loading vs. uniform distribution, and unclogged, partially clogged, and fully clogged IS conditions.As shown in Fig. 12, the predicted removal efficiencies for unsaturated coarse sand (d10=0.86 mm;d60/d10=1.74) at a daily loading rate of 9.6 cm/d varied from 10% to 100% dependent on conditions. Ingeneral, with rate constants on the order of 0.1 to 0.4 hr-1 (Ausland 1998), treatment efficiencies of 90%can be achieved with HRT’s of 24 hr or less. In research completed by Van Cuyk et al. (2000), four, 3-Dlysimeters were studied from startup through nearly one year of operation. Hydraulic and purificationbehavior was evaluated by routinely monitoring as well as periodic multicomponent surrogate and tracerstudies. It was observed that the treatment efficiencies observed in all four lysimeters after the initial 20weeks of operation were on the order of 90% or higher for COD, ammonium, and fecal coliforms whichwas not surprising given that the median hydraulic retention times (BT50) were 37 hr or greater. Thecomparatively lower efficiencies during the first 10 to 20 weeks of operation may be attributed to a lag

WSAS White Paper, v3.5 25
phase during which initial soil clogging is evolving and active bioprocesses necessary for purification arebecoming fully established (e.g., nitrification). McCray et al. (2000) completed model simulations ofWSAS showing that soil clogging (base and sidewall) clearly impacts the degree of treatment of certainCOC’s in the unsaturated zone below the infiltrative surface.
0
10
20
30
40
50
60
70
80
90
100
0,01 0,1 1
k-value
pre
dic
ted
% r
emo
val
uniform distribution, unclogged
point loading, uncloggedpoint loaded, partly clogged
point loaded, clogged
Uniform loading,Uniform loading,uncloggedunclogged
Point loading,Point loading,partly cloggedpartly clogged
Point loading, uncloggedPoint loading, unclogged
K-value (hr-1)0.01 1.0
100100
Point loading, cloggedPoint loading, clogged
Treatment efficiency (%)
Fig. 12. Purification efficiency as affected by reaction rate and operating conditions which is turnimpact hydraulic retention time (after Ausland, 1998).(Note: data shown are from a 1-m wide by 0.9-m deep, 2-D lysimeter and flow experiments with coarse sandloaded at 9.6 cm/d and Cz/Co = exp(-Kt), where, Cz = concentration of constituent at depth z from theinfiltrative surface, Co = input concentration of constituent at the infiltrative surface, K = overall rate constantfor combined volatilization/sorption/degradation, and t = hydraulic residence time for percolating water toreach depth z. The rate constant, K, is assumed constant with depth).
The volumetric utilization efficiency (VUE) can be defined as the ratio of the volume of media actuallycontacted by the applied wastewater as compared to the design volume (i.e., the total infiltrative surfacearea times the media depth) (Van Cuyk et al., 2000). The VUE parameter is directly related to anddependent on the ISU. High VUE’s are desirable to enable biofilm and sorption processes, which requireadequate surface area contact to achieve a desired removal rate and extent (e.g., phosphorus sorption). In3-D lysimeter experiments completed by Van Cuyk et al. (2000), the calculated VUE’s for week 0 wereon the order of 50% hydraulic loading rates and depths that varied by 50% or more. The VUE’s at week8 were nearly 100% suggesting that most of the available horizontal infiltration area was being utilizedafter an initial two months of early clogging development. Since purification with respect to someconstituents such as ammonium and fecal coliforms continued to improve until stabilizing at week 20 orlater, it was speculated that there was continued wastewater-induced clogging and a further establishmentof purification processes within an operative infiltration zone, rather than an increased expansion of theinfiltration area being utilized.
The depth and geometry of the infiltrative surface have long been the subject of debate, and to this day,remain poorly understood. Intuitively, shallow placement to exploit the most biogeochemically activezone of the soil profile seems desirable. Narrow trenches that rely on both horizontal and verticallyoriented IS areas also appear beneficial. However, very narrow and shallow trenches have limited storagecapacity and reduced depth for STE ponding, which may adversely impact long-term hydraulic

WSAS White Paper, v3.5 26
performance. Other variants include the use of at-grade or mounded systems, the latter being effectivelythe same as an intermittent sand filter followed by at-grade soil infiltration. An end memberincorporating both facets involves the use of drip irrigation in the shallow root zone. All of these systemsare often utilized to overcome site conditions that limit the thickness of the unsaturated zone fortreatment, such as depth below an IS to a low permeability restrictive layer, seasonal or permanent highground water table, or shallow bedrock.
The features of the infiltrative surface interface can be important to infiltration capacity. The presence ofgravel or other media on the surface may reduce the permeability of the infiltration zone due to a varietyof factors including (1) deposition of fines that plug pore entries initially or with time, (2) embedment ofgravel with the natural soil matrix thereby reducing porosity and permeability, or (3) focusing wastewaterorganic matter and solids through pore entries that are not plugged or otherwise masked by the gravel. Anumber of alternatives exist that mitigate the need for gravel within a subsurface infiltration trench or bed.The most common option is a chamber system (Keys, 1996; May, 1996; Tyler et al., 1991) while othersare based on fabric-wrapped piping designs.
System size and density of application can affect the system design and performance. As systems becomelarger and/or the density of application of small systems increases, the potential interaction of wastewateramendment to the landscape needs to be carefully considered. This is due to the hydrologic effects (e.g.,mounding) as well as the cumulative pollutant effects and the reduction in assimilative capacity due tosimple dilution and dispersion in the ground water. For example, there may be concerns where WSASapplication densities are high and they necessarily are located in close proximity to private drinking waterwells. Modeling tools (e.g. Table 4) can aid an assessment of the potential cumulative effects and water-shed scale concerns associated with WSAS.
4.3.3. WSAS Construction and Operation and Maintenance. Construction practices can affect thehydraulic properties of the natural, undisturbed subsurface. These effects include: (1) compaction due tovehicle traffic on the exposed IS or the dumping of gravel aggregate onto it, (2) smearing or puddling ofthe surface due to shear from a vehicular tire or track at the IS interface, (3) deposition of wind-blownfines while the infiltrative surface is exposed, and (4) smearing and compaction resulting fromconstruction when the soil is too wet (i.e., soil water content exceeds field capacity) (Tyler et al., 1985).
The age of installation and operational service life of a WSAS can greatly influence its performancecapabilities. The age of installation is important as the state-of-knowledge and standard of practice haveevolved over the past 50 years. Systems installed in 1950 are not the same as those installed in 2000.Operational service life combined with age of installation can affect system performance, primarily due tothe rate and extent of wastewater-induced clogging. The operation age of a system includes the actualloading rate and continuity of use (i.e., the LF and CF). In general, systems that are loaded near designspecifications and used continuously will mature more rapidly in time than those that are underutilized.With operation, wastewater-induced clogging increases the effective area for infiltration and the degree ofunsaturated flow conditions in the underlying soil, as well as create a biogeochemically active zone fortreatment to occur. Van Cuyk et al. (2000) completed 3-D lysimeter studies to quantify the hydraulic andpurification processes during the first year of system operation. Lysimeter results revealed relativelylower hydraulic retention times and vadose zone utilization during the first months of startup withbreakthrough of fecal coliforms and MS-2 and PRD-1 viral surrogates in sand WSAS regardless of depthto ground water (60 vs. 90 cm) or infiltrative surface/loading rate scenario (gravel-laden at 5.0 cm/d vs.gravel-free at 8.4 cm/d) (Masson, 1999; Van Cuyk et al., 2000). After 10 months of operation, thepercolates were of much higher quality in terms indigenous fecal coliforms (<10 org./100mL) andspecific pathogens (non-detect) as well as viral surrogates. Thus, the operational aging process appearsquite important to treatment efficiency and raises questions about the treatment performance of WSASwith discontinuous operation (e.g., at seasonal dwellings or with cyclic loading/resting operation).

WSAS White Paper, v3.5 27
Operation and maintenance are critical to the performance of a WSAS. If actual conditions such as dailywastewater flow rate or wastewater composition are different than design assumptions then systems canbe overloaded and hydraulically fail. Even if the design matches actual conditions, if the WSAS is notproperly maintained (e.g., repair of a broken pipe, replacement of a failed pump, periodic pumping ofseptic tank solids), then dysfunction and failure can result.
4.4. Modeling WSAS Hydraulic and Purification Performance
The performance capabilities of wastewater soil absorption systems and the factors affecting them areimportant, but the ability to reliably predict the performance to be achieved under a given set of designand operational conditions is perhaps even more critical. While relatively limited, there are conceptualand mathematical models that specifically relate the performance metrics of a WSAS (e.g., infiltrationcapacity and soil clogging, purification efficiency, or service life) to site conditions (e.g., soil properties,soil depth, temperature), system design (e.g., IS geometry, depth, or interface character, effluentapplication rate and composition), and operation (e.g., continuous or discontinuous operation) (see Table4).
Application of mathematical modeling for describing and predicting performance of WSAS as affected byprocess design factors and environmental conditions continues to advance with quantitative relationshipsemerging, being refined, and/or validated including:
LTAR = f (clogging zone genesis), (1)
CZG = f (HLR, quality and MLR, application method, IS, Ksat, oC, ...) , (2)
ISU = f (IS features, application method, and soil Ksat), (3)
VUE = f (ISU), (4)
Sorption efficiency = f (VUE, media properties, depth), and (5)
Reaction efficiency = f (kinetics K, HRT, oC, ...) (6)
where, LTAR = long-term acceptance rate, CZG = clogging zone genesis, HLR = hydraulic loading rate,MLR = mass loading rate, IS = infiltrative surface, Ksat = saturated hydraulic conductivity, ISU =infiltrative surface utilization, VUE = volumetric utilization efficiency, K = reaction rate constant, HRT =hydraulic retention time.
While challenging to fully develop and validate, expression of quantitative understanding throughmathematical relationships and models can enable effective practice regarding WSAS design andimplementation and support development and confidence in performance-based codes. Moreover, suchunderstanding and single-site scale modeling tools are required to properly account for WSAS cumulativeimpacts, if any, to public health and environmental quality in applications where there are clusters orsubdivisions of individual systems. Finally, such knowledge is needed to enable development andallocation of total maximum daily loads (TMDL’s) for watershed-scale environmental protection (Chen etal., 1999). Selected modeling tools that have been utilized for onsite WSAS applications as well as a fewothers that potentially could be adapted are summarized in Table 4.

WSAS White Paper, v3.5 28
Table 4. Mathematical models and decision-support tools for design and performance of onsite wastewater soil absorption systems.
Model Model Type / Scale Developer / Reference Model description and/or waste related application and results
----WSAS soil cloggingdevelopmentSite scale
Siegrist (1986)Siegrist and Boyle (1987)
Estimates IRt/IRo based on cumulative mass loadings of total BOD and suspended solids. Specific results include time-dependent loss in IRresults from input of hydraulic loading rate (cm/d) of wastewater flow and concentrations of total BOD (cBOD + nBOD) and SS,
SepTTS WSAS chemical fate/transportSite scale
Lee et al. (1998) Screening level tool for predicting fate and transport of down-the-drain household chemicals in septic systems.
VIRALTWell-head protection modelfor virusSite scale
Bechdol et al. (1994)Bechdol et al. (1992) conducted simulations of ground water in Rhode Island and found that the model was only capable of distinguishing risksbetween widely different situations. However, coarse textured soils and aquifers common to the coastal watersheds are very susceptible tovirus transport. Field monitoring and validation was recommended.
VIRTUSVirus transport and fate inunsaturated zoneSite-scale
Yates and Ouyang (1992)Simultaneously solves eqns. describing transport of water, heat and virus through unsaturated zone of soil. Predictive model of virus fate thatallows virus inactivation rate to vary based on soil depth and temperature changes. Tested on datasets in laboratory columns with MS-2coliphage transport.
---- Bacterial transportSite-scale
Harvey and Garabedian (1991) Bacterial transport in ground water simulated using a colloid filtration model that had been modified to include advection, storage, dispersionand adsorption.
---- Microbial transportSite-scale
Teutsch et al. (1991) One-dimensional model to describe microbial transport that includes decay, growth, filtration and adsorption. During lab-scale tankexperiments with MS-2, the predictions closely matched measured results at high flow rates, but did not match at flow rates.
MANAGEDecision support tool foraquifer vulnerabilityWatershed scale
Kellogg et al. (1997)Loomis et al. (1999)Joubert et al. (1997)
Used to identify ground water pollution sources, future threats, and evaluation effectiveness of various wastewater improvements.
WARMFDecision support system forTMDL developmentWatershed scale
Chen et al. (1999) A decision support system to calculate TMDL’s for a watershed. Incorporates cumulative effects of onsite systems into pollutant loading asnonpoint sources.
BASINSMultipurpose environ.analysis systemWatershed scale
Lahlou et al. (1998)Used by regional, state, and local agencies in performing watershed-based studies to facilitate examination of environmental information; tosupport analysis of environmental systems, and to provide a framework for examining management alternatives. Onsite systems can beincorporated as nonpoint sources.
DRASTIC Ground water sensitivitySite scale
Aller et al. (1985)Stark (1997)
Ranking system that evaluates 7 hydrologic factors (depth to water table, aquifer net recharge, aquifer media, soil media, topography, impact ofvadose zone, hydraulic conductivity) to yield a numerical index of an area’s relative degree of potential for pollution. Has been used toevaluate aquifer sensitivity to nitrate pollution from onsite systems.
3S-NPoP GIS-based conceptualWatershed scale
Stark (1997) Relates the potential impacts at the source areas to the nitrate levels in the stream, linking septic system site characteristics to water quality.
HYDRUSUnsaturated flow and solutetransportSite scale
Simunek et al. (1996)Schwager and Boller (1997)McCray et al. (2000)
Schwager and Boller (1997) Investigated solute and gas transport under intermittent flushing conditions. Found that single flush size andfrequency might considerably affect the performance of sand filters by impacting oxygen flux within systems. McCray et al. (2000) simulated2-D conditions related to flow and transport in WSAS under a range of conditions.
MOFATMulti-phase flow andtransport codeSite scale
Kaluarachchi and Parker (1991)Schwager and Boller (1997)
Investigated solute and gas transport under intermittent flushing conditions. Found that single flush size and frequency might considerablyaffect the performance of sand filters by impacting oxygen flux within systems.
----2(ADI) finite diff. approx. ofunsaturated flowSite Scale
Ewing et al. (1985)Studied the effects of unsaturated flow, inflow period length, and horizontal variations in vertical flow rates to determine the design factorshaving the greatest influence on flow conditions within buried sand filters. Found that application rate, retention times, and depth of the sandfilter had the greatest impact on unsaturated flow conditions within the filter medium.
TOPLATS 2 Nonpoint sourceWatershed scale
Endreny and Wood (1999)Determines source areas of nonpoint source pollution within a watershed using a water table-driven variable source area (VSA) routine todetermine runoff zones. Used for contamination from agricultural land use, but could be used to determine extent of contribution ofcontaminants from onsite systems.
---- GIS-basedSite scale
Lasserre et al. (1999) Models nitrate flux through the unsaturated zone and transport through ground water. Used for contamination from agricultural land use, butcould be used for nitrate transport from onsite systems.
FLUNIT 2 GIS-basedWatershed scale
Van den Brink et al. (1995) To evaluate ground water protection strategies based on risk analysis and effectiveness of possible measures. Nitrate concentration changes inthe subsurface from agricultural land use sources.
SPARROW 2 Surface water qualityWatershed scale
Preston & Brakebill (1999)Relates in-stream water quality measurement to spatially referenced characteristics of watersheds, including contaminant sources and factorsinfluencing terrestrial and stream transport. Has been applied to nitrogen modeling from point sources, urban areas, fertilizer application,manure generation and atmospheric deposition.
MORELN 2 Nitrogen cycleSite scale
Geng et al. (1996) Models the nitrogen cycle and nitrate leaching in soil and simulates nitrate migration in an aquifer system. Has been used on agricultural lands.1 These models were not developed for wastewater soil absorption systems, but potentially could be adapted to that application.
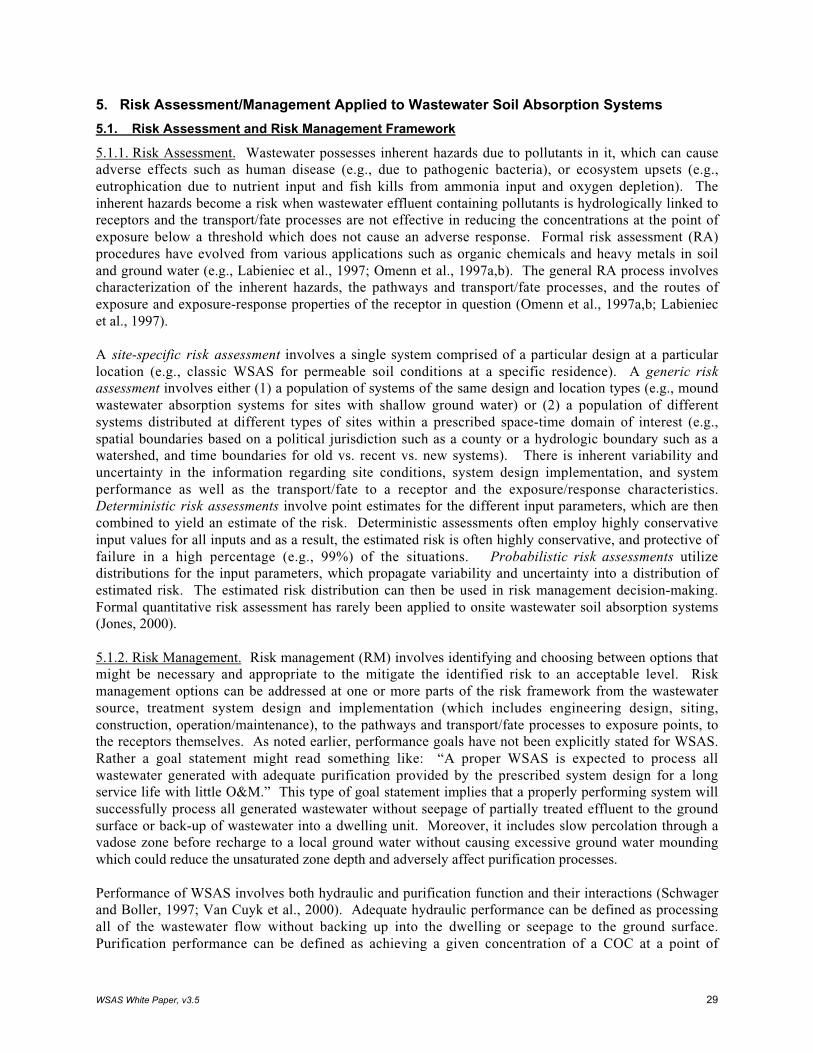
WSAS White Paper, v3.5 29
5. Risk Assessment/Management Applied to Wastewater Soil Absorption Systems
5.1. Risk Assessment and Risk Management Framework
5.1.1. Risk Assessment. Wastewater possesses inherent hazards due to pollutants in it, which can causeadverse effects such as human disease (e.g., due to pathogenic bacteria), or ecosystem upsets (e.g.,eutrophication due to nutrient input and fish kills from ammonia input and oxygen depletion). Theinherent hazards become a risk when wastewater effluent containing pollutants is hydrologically linked toreceptors and the transport/fate processes are not effective in reducing the concentrations at the point ofexposure below a threshold which does not cause an adverse response. Formal risk assessment (RA)procedures have evolved from various applications such as organic chemicals and heavy metals in soiland ground water (e.g., Labieniec et al., 1997; Omenn et al., 1997a,b). The general RA process involvescharacterization of the inherent hazards, the pathways and transport/fate processes, and the routes ofexposure and exposure-response properties of the receptor in question (Omenn et al., 1997a,b; Labieniecet al., 1997).
A site-specific risk assessment involves a single system comprised of a particular design at a particularlocation (e.g., classic WSAS for permeable soil conditions at a specific residence). A generic riskassessment involves either (1) a population of systems of the same design and location types (e.g., moundwastewater absorption systems for sites with shallow ground water) or (2) a population of differentsystems distributed at different types of sites within a prescribed space-time domain of interest (e.g.,spatial boundaries based on a political jurisdiction such as a county or a hydrologic boundary such as awatershed, and time boundaries for old vs. recent vs. new systems). There is inherent variability anduncertainty in the information regarding site conditions, system design implementation, and systemperformance as well as the transport/fate to a receptor and the exposure/response characteristics.Deterministic risk assessments involve point estimates for the different input parameters, which are thencombined to yield an estimate of the risk. Deterministic assessments often employ highly conservativeinput values for all inputs and as a result, the estimated risk is often highly conservative, and protective offailure in a high percentage (e.g., 99%) of the situations. Probabilistic risk assessments utilizedistributions for the input parameters, which propagate variability and uncertainty into a distribution ofestimated risk. The estimated risk distribution can then be used in risk management decision-making.Formal quantitative risk assessment has rarely been applied to onsite wastewater soil absorption systems(Jones, 2000).
5.1.2. Risk Management. Risk management (RM) involves identifying and choosing between options thatmight be necessary and appropriate to the mitigate the identified risk to an acceptable level. Riskmanagement options can be addressed at one or more parts of the risk framework from the wastewatersource, treatment system design and implementation (which includes engineering design, siting,construction, operation/maintenance), to the pathways and transport/fate processes to exposure points, tothe receptors themselves. As noted earlier, performance goals have not been explicitly stated for WSAS.Rather a goal statement might read something like: “A proper WSAS is expected to process allwastewater generated with adequate purification provided by the prescribed system design for a longservice life with little O&M.” This type of goal statement implies that a properly performing system willsuccessfully process all generated wastewater without seepage of partially treated effluent to the groundsurface or back-up of wastewater into a dwelling unit. Moreover, it includes slow percolation through avadose zone before recharge to a local ground water without causing excessive ground water moundingwhich could reduce the unsaturated zone depth and adversely affect purification processes.
Performance of WSAS involves both hydraulic and purification function and their interactions (Schwagerand Boller, 1997; Van Cuyk et al., 2000). Adequate hydraulic performance can be defined as processingall of the wastewater flow without backing up into the dwelling or seepage to the ground surface.Purification performance can be defined as achieving a given concentration of a COC at a point of

WSAS White Paper, v3.5 30
assessment. The receiving environment for treated wastewater normally includes the local ground watersystem, which may be connected to regional ground water systems, and/or surface waters such as rivers,lakes, and estuaries. The sensitivity of the receiving environment to perturbation must be considered.
For risk management, design of a WSAS, whether it be a classic system or one with modifications or analternative treatment train, should be based on a set of performance goals to mitigate an explicit risk to anacceptable level. For example, a performance goal for the WSAS could be established such that theconcentration of NO3-N in soil solution entering the ground water under a WSAS is below a level wheredilution and dispersion in the ground water will reduce the level of NO3-N at a conceivable point ofdrinking water extraction does not exceed 10-mg-N/L (the drinking water MCL). In order to design andimplement a system or systems to meet that goal requires an understanding of process function andperformance with respect to wastewater nitrogen. The design to achieve the goals must account for thenatural constraints of a site, the robustness of the WSAS to deviations from design assumptions, as wellas the need for and ability to deliver requisite O&M in order to reliably achieve performance capabilities.
5.2. RA/RM for Onsite Wastewater Soil Absorption Systems
Formal risk assessment and risk management have rarely applied to decision-making for onsite systems.However, risk assessment and risk management concepts have been implicit in WSAS practices based onthe regulations and code structures controlling their use. Recently explicit risk-based decision-makingbeen advocated (Otis and Anderson, 1994; Hoover et al., 1998a,b; Loomis et al., 1999; Jones, 2000).Most applications of WSAS are based on prescriptive codes (e.g., promulgated at the state level andenforced at the county level) which in turn have been developed based on historical and empiricalinformation which have evolved into a local practice that the contractors in an area are able toaccomplish. Modifications have been developed as well as alternative system designs, to enable onsitesystem use in site conditions that are not suitable for a classic system design. When first introduced,innovations can be permitted for limited use under provisional or experimental programs. Normally anabsence of reported problems can lead to a general use approval. In some cases, rigorous monitoring andformal documentation of operation and performance of alternatives have been required or have occurreddue to a research interest.
Risk assessment and management concepts implicitly are involved in decision-making for WSAS. Forexample, most prescriptive codes are designed to constrain WSAS applications to situations where anadverse effect will not occur or be manifested by actions such as:
o Prescribing site conditions that are believed to be suitable for WSAS of a certain design. Siteconditions usually involve metrics on landscape position, slope, subsurface permeability andunsaturated soil depth and possibly methods of assessment (e.g., percolation test by a licensedsoil analyst),
o Establishing setback distances to points of exposure and receptors, most notably drinking waterwells and surface waters,
o Prescribing design features, such as size of a soil absorption unit and related unit operations, ando Specifying monitoring and assessment methods (usually only for larger systems).
Within the code-based implementation structure, decision-makers still must chose between differentsystem design types and attributes. As shown in Table 5, there are a number of scenarios with WSASwhere the risk varies from negligible to high. High risk situations tend to occur where the performancecapabilities of the WSAS are deficient or uncertain, and where the environmental situation is sensitivewith respect to receptors and exposures. In these and other situations, there are a number of managementstrategies and options that can be implemented for a given situation and the implicit or explicit riskassessment thereof (Table 6).

WSAS White Paper, v3.5 31
Table 5. Example scenarios for wastewater soil absorption systems that pose apparent risks to human health and environmental quality andexample risk management options.
Example scenario Risk characterization Level of concernand basis
Traditional riskmanagement options
Alternative riskmanagement options
(1) Low density applications of conventionalWSAS designs in environmental settings with thinvadose zones of coarse soils or shallow fracturedrock and proximal private or public drinking waterwells.
Health risk to residentsdue to ingestion ofdrinking water containingnitrates and pathogens, andto visitors from pathogens.
Moderate due to inherenttreatment limitations ofconventional WSAS underthe environmentalconditions.
o Holding tankso Prohibit development
o Alternative WSAS designs(e.g.,. mounds)
o Advanced treatment beforeconventional WSAS
(2) High density applications of conventionalWSAS designs in environmental settings with thinvadose zones of coarse soils or shallow fracturedrock and proximal private or public drinking waterwells.
Public health risk due toingestion of drinking watercontaining nitrates andpathogens
High due to inherenttreatment limitations ofconventional WSAS underthe environmentalconditions and themultiple sourcescontributing.
o Provide public waterfrom a safe source
o Provide sewers and acentral treatment plant
o Alternative WSAS designs(e.g.,. mounds)
o Advanced treatment beforeconventional WSAS
(3) Low or high density applications of WSAS onlandscapes and soils with low permeability andseasonal saturation or flooding.
Health risk to residents,neighbors and visitors dueto seepage to the groundsurface and direct orindirect contact andingestion or inhalation ofpathogens.
High due to uncertainty indesign and performancerelationships forconventional WSAS underthe environmentalconditions.
o Accept intermittentseepageo Increase septic pump outduring wet periodso Increase WSAS size
o Alternative WSAS designs(e.g., mounds)
o Advanced treatment beforeconventional WSASo Advanced treatment anddisinfection for surfacedischarge
(4) Cesspools and old seepage pits located on theshores of sensitive receiving waters such as lakesand estuaries.
Environmental risk toecosystem includingdegradation of waterquality and biota habitat.
High due to inherentlimitations of treatmentunder conditions.
o Provide sewers andcentral treatment plant
o Upgrade existing onsitesystems with advancedtreatment or alternative WSASdesigns.
(5) WSAS that are seasonally used and do notdevelop adequate soil clogging and biofilm growthto achieve treatment for pathogens.
Health risk to residents,neighbors and visitors dueto drinking water ingestionof drinking water fromwells contaminated bypathogens.
High due to uncertaintyabout treatment inseasonally used systems.
o None since notrecognized
o To be determined
(6) WSAS that are designed for higher LTAR'sbased on advanced treatment units that reduce BODand SS and thereby retard soil clogging.
Health risk to residents,neighbors and visitors dueto drinking water ingestionof drinking water fromwells contaminated bypathogens.
High due to uncertaintyabout treatment ofpathogens in WSASreceiving advancedtreatment unit effluent.
o None since notrecognized
o To be determined

WSAS White Paper, v3.5 32
Table 6. Example risk management strategies and options for wastewater soil absorption systems at the site-scale and watershed scales.
Risk managementstrategy Example option
Desired impact(s) or effect(s)of option
Availability andimplementability of option
Implementation &reliability of option
Impact if option fails or has adysfunction
1. ConventionalWSAS design andimplementation
A. Conventional narrowtrench design (e.g., narrowtrenches with shallowplacement)
Control flux of pollutants intoground water while treating allwastewater generated withoutseepage to ground surface orbackup into dwelling
Design and product based options thatare widely available
May be constrained by site and/orenvironmental conditions
Design, installation andoperation by trainedpractitioners
Excessive risk to receptorsdependent on site and possiblywatershed conditions
2. Source control A. Remove toilet wasteand treat graywater by soilabsorption (e.g., composttoilet)
Reduce pollutant loading to WSAS,particularly N and pathogens
Product and/or engineered optionCommercially available
Good unless toilet wastesystem (e.g., composttoilet) is circumvented byuser
Loss of effect on specificpollutant loadings plus systemhydraulic overloading
3. Modified oralternative WSASdesign andimplementation
A. Increased conservatismin design and operation(e.g., reduce loading ratefrom 4 to 2 cm/d)
Reduce soil hydraulic applicationrate; or increase vadose depth;
Engineering optionMay be constrained by lot size,environmental conditions, and/or cost
Design and installation byindividuals/firms normallyinvolved in onsite systems
Loss of safety factor with defaultback to performance ofconventionally designed system(1A).
B. Alternative soilabsorption system designs(e.g., at-grade or moundsystems or drip irrigation)
Increase vadose zone depth;increase chance of nutrientremoval
Engineering optionMay be constrained by lot size,environmental conditions, localcompetency, and/or cost
Requires design andinstallation by trainedprofessional or reliability ispoor
Excessive risk to receptorsdependent on site and possiblywatershed conditions
C. Advanced treatmentbefore soil absorption (e.g.,sand filtration but notdisinfection)
Reduce pollutant loading to WSAS,particularly tBOD, TSS, N
Product and/or engineering optionMay be constrained by localcompetency, and/or cost
Requires O&M by trainedprofessional or reliability ispoor
Increased pollutant loadings toWSAS with potential forhydraulic and purificationdysfunction and increased riskto receptors
D. Advanced treatmentbefore soil absorption (e.g.,sand filtration with UVdisinfection)
Reduce pollutant loading to WSAS,particularly tBOD, TSS, N andpathogens
Product and/or engineering optionMay be constrained by localcompetency, and/or cost
Requires O&M by trainedprofessional or reliability ispoor
Increased pollutant loadings toWSAS with potential forhydraulic and purificationdysfunction and increased riskto receptors
4. Land use andexposure/receptorcontrols
A. Separation and setbackdistances (e.g., 200 ft. todrinking water well ratherthan 100 ft.)
Increase separation to receptors toenable dilution/ dispersion/reactions to reduce exposureconcentrations
Requires ability to model and predictenvironmental transport/fate andexposure benefits of increasedseparation
Requires sitecharacterization and landuse data and modelingexpertise
If predictions are inaccuratedesired benefits on exposureconcentrations will not berealized and risks will be higherthan predicted
B. Increased lot size orreduced density ofapplication (e.g., reducedensity from 4 DU/acre to0.5 DU/acre)
Reduce cumulative effects toreceiving environment and enabledilution/ dispersion/ reactions toreduce exposure concentrations
Requires ability to model and predictenvironmental transport/fate andexposure benefits of reduceddensity
Requires sitecharacterization and landuse data and modelingexpertise
If predictions are inaccuratedesired benefits on exposureconcentrations will not berealized and risks will be higherthan predicted
5. Monitoring A. Monitoring (e.g., pumpand level sensors, vadoselysimeters, ground waterwells)
Detect dysfunction and implementcorrective action before anadverse effect occurs
Hydromechanical functions can bereadily monitored but purificationand subsurface conditions aredifficult and costly
Design, installation and alsotelemetric and/or onsitesampling/analysis bytrained professional
Missed dysfunction and effectscould occur and be undetected
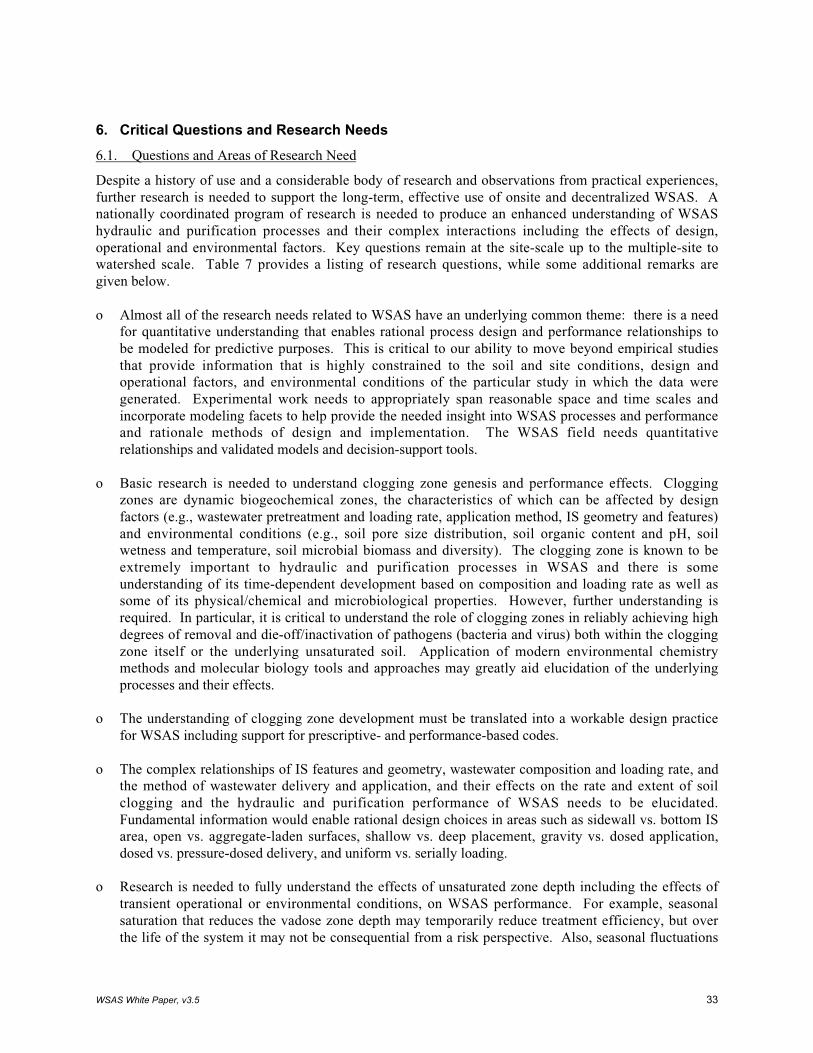
WSAS White Paper, v3.5 33
6. Critical Questions and Research Needs
6.1. Questions and Areas of Research Need
Despite a history of use and a considerable body of research and observations from practical experiences,further research is needed to support the long-term, effective use of onsite and decentralized WSAS. Anationally coordinated program of research is needed to produce an enhanced understanding of WSAShydraulic and purification processes and their complex interactions including the effects of design,operational and environmental factors. Key questions remain at the site-scale up to the multiple-site towatershed scale. Table 7 provides a listing of research questions, while some additional remarks aregiven below.
o Almost all of the research needs related to WSAS have an underlying common theme: there is a needfor quantitative understanding that enables rational process design and performance relationships tobe modeled for predictive purposes. This is critical to our ability to move beyond empirical studiesthat provide information that is highly constrained to the soil and site conditions, design andoperational factors, and environmental conditions of the particular study in which the data weregenerated. Experimental work needs to appropriately span reasonable space and time scales andincorporate modeling facets to help provide the needed insight into WSAS processes and performanceand rationale methods of design and implementation. The WSAS field needs quantitativerelationships and validated models and decision-support tools.
o Basic research is needed to understand clogging zone genesis and performance effects. Cloggingzones are dynamic biogeochemical zones, the characteristics of which can be affected by designfactors (e.g., wastewater pretreatment and loading rate, application method, IS geometry and features)and environmental conditions (e.g., soil pore size distribution, soil organic content and pH, soilwetness and temperature, soil microbial biomass and diversity). The clogging zone is known to beextremely important to hydraulic and purification processes in WSAS and there is someunderstanding of its time-dependent development based on composition and loading rate as well assome of its physical/chemical and microbiological properties. However, further understanding isrequired. In particular, it is critical to understand the role of clogging zones in reliably achieving highdegrees of removal and die-off/inactivation of pathogens (bacteria and virus) both within the cloggingzone itself or the underlying unsaturated soil. Application of modern environmental chemistrymethods and molecular biology tools and approaches may greatly aid elucidation of the underlyingprocesses and their effects.
o The understanding of clogging zone development must be translated into a workable design practicefor WSAS including support for prescriptive- and performance-based codes.
o The complex relationships of IS features and geometry, wastewater composition and loading rate, andthe method of wastewater delivery and application, and their effects on the rate and extent of soilclogging and the hydraulic and purification performance of WSAS needs to be elucidated.Fundamental information would enable rational design choices in areas such as sidewall vs. bottom ISarea, open vs. aggregate-laden surfaces, shallow vs. deep placement, gravity vs. dosed application,dosed vs. pressure-dosed delivery, and uniform vs. serially loading.
o Research is needed to fully understand the effects of unsaturated zone depth including the effects oftransient operational or environmental conditions, on WSAS performance. For example, seasonalsaturation that reduces the vadose zone depth may temporarily reduce treatment efficiency, but overthe life of the system it may not be consequential from a risk perspective. Also, seasonal fluctuations
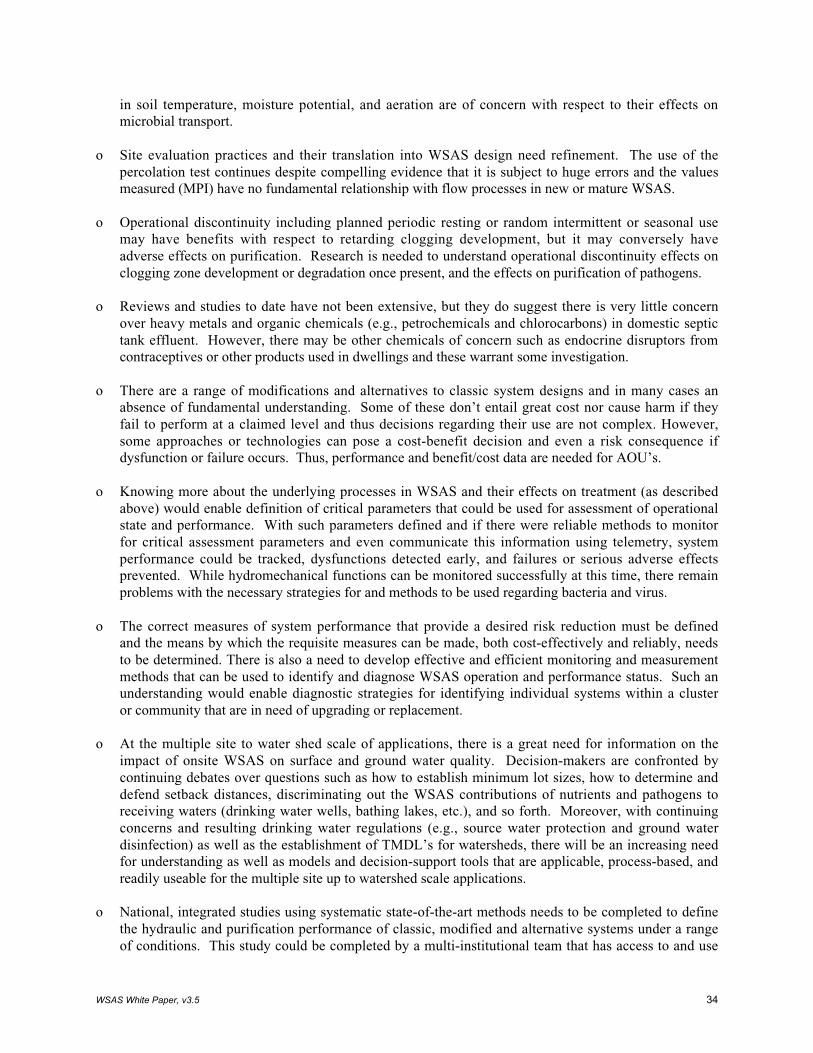
WSAS White Paper, v3.5 34
in soil temperature, moisture potential, and aeration are of concern with respect to their effects onmicrobial transport.
o Site evaluation practices and their translation into WSAS design need refinement. The use of thepercolation test continues despite compelling evidence that it is subject to huge errors and the valuesmeasured (MPI) have no fundamental relationship with flow processes in new or mature WSAS.
o Operational discontinuity including planned periodic resting or random intermittent or seasonal usemay have benefits with respect to retarding clogging development, but it may conversely haveadverse effects on purification. Research is needed to understand operational discontinuity effects onclogging zone development or degradation once present, and the effects on purification of pathogens.
o Reviews and studies to date have not been extensive, but they do suggest there is very little concernover heavy metals and organic chemicals (e.g., petrochemicals and chlorocarbons) in domestic septictank effluent. However, there may be other chemicals of concern such as endocrine disruptors fromcontraceptives or other products used in dwellings and these warrant some investigation.
o There are a range of modifications and alternatives to classic system designs and in many cases anabsence of fundamental understanding. Some of these don’t entail great cost nor cause harm if theyfail to perform at a claimed level and thus decisions regarding their use are not complex. However,some approaches or technologies can pose a cost-benefit decision and even a risk consequence ifdysfunction or failure occurs. Thus, performance and benefit/cost data are needed for AOU’s.
o Knowing more about the underlying processes in WSAS and their effects on treatment (as describedabove) would enable definition of critical parameters that could be used for assessment of operationalstate and performance. With such parameters defined and if there were reliable methods to monitorfor critical assessment parameters and even communicate this information using telemetry, systemperformance could be tracked, dysfunctions detected early, and failures or serious adverse effectsprevented. While hydromechanical functions can be monitored successfully at this time, there remainproblems with the necessary strategies for and methods to be used regarding bacteria and virus.
o The correct measures of system performance that provide a desired risk reduction must be definedand the means by which the requisite measures can be made, both cost-effectively and reliably, needsto be determined. There is also a need to develop effective and efficient monitoring and measurementmethods that can be used to identify and diagnose WSAS operation and performance status. Such anunderstanding would enable diagnostic strategies for identifying individual systems within a clusteror community that are in need of upgrading or replacement.
o At the multiple site to water shed scale of applications, there is a great need for information on theimpact of onsite WSAS on surface and ground water quality. Decision-makers are confronted bycontinuing debates over questions such as how to establish minimum lot sizes, how to determine anddefend setback distances, discriminating out the WSAS contributions of nutrients and pathogens toreceiving waters (drinking water wells, bathing lakes, etc.), and so forth. Moreover, with continuingconcerns and resulting drinking water regulations (e.g., source water protection and ground waterdisinfection) as well as the establishment of TMDL’s for watersheds, there will be an increasing needfor understanding as well as models and decision-support tools that are applicable, process-based, andreadily useable for the multiple site up to watershed scale applications.
o National, integrated studies using systematic state-of-the-art methods needs to be completed to definethe hydraulic and purification performance of classic, modified and alternative systems under a rangeof conditions. This study could be completed by a multi-institutional team that has access to and use

WSAS White Paper, v3.5 35
of demonstration projects and test facilities located in many parts of the U.S. Such study couldinclude design and implementation process review, installation and operation records review, onsiteinspections, sampling and analysis, and microbial surrogate/chemical tracer testing.
6.2. Prioritization of Research Needs
Prioritization of the various research needs was completed by the authors of this white paper using amulti-criteria, weighted evaluation scheme (e.g., Kepner and Tregoe, 1973). Five attributes wereidentified as important to assessing the priority of a research need and a weight was assigned to each.These included: (A) level of current science and technology understanding (wt. = 0.3), (B) level ofimportance to design and performance of new WSAS (wt. = 0.2), (C) impact if the research is completedand the need is satisfied (wt. = 0.3), (D) feasibility and cost of completing the work (wt. = 0.1), and (E)known or suspected work already in progress (wt. = 0.1). Before scoring the various needs listed in Table7, some were first combined with other closely related needs. Then for each of the research needs, eachattribute (A to E) was considered and given a numerical score of 1, 3 or 5 points based on explicit metrics(see Table 8). The weighted summary score was finally computed for each research need yielding theresults shown in Table 8. The needs were then ranked in four priority groups (i.e., very high, high,moderate, and low). This group ranking was based on similarity of scores between research needs and thebreakpoints in the numerical ranking.
7. Conclusions
Onsite and decentralized wastewater treatment in the U.S. relies on subsurface infiltration and percolationthrough the unsaturated zone prior to ground water recharge. These systems have evolved during the 20thcentury from early designs that were focused on simple disposal to contemporary designs that areintended to achieve advanced treatment. While the experience base does not suggest serious or broad-based problems with recent or current WSAS practices, it also does not demonstrate consistently adequateperformance based on an established design and implementation understanding. Moreover, it is possiblethat WSAS technology is not being exploited fully and/or as effectively as it might, or alternatively,inappropriate and deficient applications may be evolving. There is a considerable knowledge baseregarding WSAS design, implementation, and performance, that enables most systems to be protective ofpublic health and environmental quality. However, understanding is not fundamental enough todiscriminate between different approaches to WSAS system design and implementation, such that rationaldecision-making will lead to the most cost-effective approach for reducing risk to an acceptable level. Ofthe many research needs identified, several are given high priority because of their judged importance.As shown in Table 8, high and very high priority research needs include those that support: (1)fundamental understanding of clogging zone genesis and unsaturated zone dynamics and their effects ontreatment efficiency, particularly pathogenic bacteria and virus, (2) development of modeling tools forpredicting WSAS function and performance as affected by design and environmental conditions, (3)identification of indicators of performance and methods of cost-effective monitoring, and (4)development of valid accelerated testing methods for evaluating long-term WSAS performance.

WSAS White Paper, v3.5 36
Table 7. Research questions for wastewater soil absorption systems. 1
Strategic focus Tasks Products UsesI. Function and Design Needs1. What is the effect of pretreatment on soil
clogging zone genesis and WSAShydraulic and purification performance?
A. Conduct experiments with instrumented WSAS systems of thesame total size but with optional levels of pretreatment such as(1) domestic STE, (2) graywater STE, (3) sand filter effluent,and (4) aerobic unit effluent, and define IRt / IRo and pollutantfluxes through a given depth of unsaturated soil over time.Utilize surrogate/tracer testing to also assess treatment potentialfor virus and other non-routine constituents of concern.
1.
2.
Quantitative data and empirical and/ormechanistic models for LTAR’s andtreatment efficiency.Relationship of unsaturated soil depth totreatment efficiency for different soilsystems with different degrees of soilclogging.
(a)
(b)
Support design of specificsystems and development ofperformance and prescriptivecode requirements.Provide input for cumulativeeffects and watershed scaleassessment models.
B. Conduct experiments to assess pathogen purification asaffected by clogging zone biogeochemical activity levels as afunction of pretreatment level, temperature, and operationalage. Apply advances in environmental chemistry,microbiology and biotech molecular methods to understandfundamental nature of WSAS and cause/effect relationships.
1. Information on the role and importance ofthe clogging zone to pathogen purification(especially virus) and public healthprotection.
(c) Support decisions regardinguse of advanced pretreatmentwith higher application ratesunder otherwise comparabledesign and site conditions.
2. What is the relationship of infiltrativesurface character on short- and long-termhydraulic properties of the infiltrativesurface zone?
A. Conduct factorial designed experiments to explore the mainand interaction effects of (1) vertical vs. horizontal surfacesand (2) gravel vs. gravel free surfaces, on infiltration capacityover time and pollutant fluxes in the underlying vadose zone.
1. Information on the relative behavior ofdifferent infiltrative surface features oninfiltrability and LTAR's and pollutantfluxes to ground water.
(a) Support design to achieveoptimum LTAR's withoutcompromising treatmentefficiency.
3. What is the relationship between cloggingzone genesis and the resultant loss ininfiltration rate over time with commonSTE WSAS design, operation, andenvironmental factors?
A. Conduct factorial designed experiments to evaluate the effectsand interactions of (1) hydraulic loading rate, (2) applicationmethod, (3) infiltrative surface character, (4) soiltexture/structure, (5) soil temperature, and (6) soil moistureconditions, on development of an LTAR.
1. Semi-quantitative and quantitative dataand process models that describeinfiltrative surface utilization andvolumetric utilization efficiency with timeand the HRT within the soil.
(a) Predict ISU, VUE, and HRT,which can be used to predicttreatment efficiency.
4. What is the treatment efficiency achievedin a WSAS designed with differentmethods of application of domestic STE?
A. Conduct experiments with instrumented WSAS systems of thesame size but with optional methods of delivery anddistribution including (1) gravity/trickle, (2) serial loading, (3)dosed, and (4) pressurized uniform distribution. Identifypollutant fluxes through a given depth of soil over time.
1. Quantitative data on pollutant fluxesthrough a given depth of unsaturated soilover time.
(a)
(b)
Provide information for use inprescriptive codes.Support performance-baseddesign.
5. For a population of similar WSAS in asimilar environmental setting, what is thetime-dependent relationship betweenperformance and age of operation (a.k.a.,service life)?
A. Survey large populations of systems with stratified randomsampling methods to assess hydraulic performance anddevelop % functioning vs. age of operation relationships.
1. Fraction functioning vs. age of operationcurves for different WSAS designs indifferent environmental settings.
(a)
(b)
Support benefit/cost analysesof decentralized vs.centralized systems.Input for performanceguarantees, inspection, andcertification programs.
6. How is treatment efficiency affected bytransient and extreme environmentalconditions?
A. Conduct monitoring and experiments of treatment efficiencyas affected by ephemeral or seasonal saturation in the vadosezone beneath a WSAS.
1. Information on the adverse effects if anyof ephemeral or seasonal saturation in thevadose zone beneath a WSAS.
(a) Provide basis for design forcommon but challengingconditions.
B. Conduct monitoring and experiments of treatment efficiencyas affected by very low and very high soil temperatures.
1. Information on the temperaturedependency of WSAS function.
7. What models are appropriate for predictingtreatment efficiency as a function of siting,design, and operation?
A. Utilize databases produced by experimental work (I.1 to I.6) tosupport model development and validation for application atthe single site to multiple site and watershed scales.
1. Modeling tools for screening levelassessments to quantitative prediction ofperformance.
(a)
(b)
Provide information for use inprescriptive codes.Support performance designs.
B. Develop a methodology for evaluating the degree of modelcomplexity required for a given decision-making situations.
1. Decision-logic for selecting one modelingapproach over another in a givensituation.
(c) Enable cumulative effectsassessment and TMDLallocations.

WSAS White Paper, v3.5 37
Table 7. cont. Research questions for wastewater soil absorption systems. 1
Strategic focus Tasks Products Uses
II. Site Evaluation Needs1. What is the relationship between natural
soil profile properties and the hydrauliccapacity of a single site?
A. Develop methods to directly measure the soil pore sizedistribution at the local-scale and based on scaling theory,estimate the relevant site-scale value.
1. Methods and apparatus to directly estimatepore size distribution.
(a) Input to models on water andgas flow and pollutanttransport in the vadose zonebeneath a WSAS.
Alternatively stated, what are the essentialfield data needed to support understandingand/or modeling of unsaturated flow andhydraulic capacity?
B. Develop relationships between morphology and indirectmeasures (e.g., penetration resistance) with pore sizedistribution in different soil environments.
1. Methods and apparatus to indirectlyestimate pore size distribution.
(b) Support siting and designincluding landscape loadingeffects on degree of saturationand ground water mounding.
C. Develop methods and apparatus to enable a more accuratecalculation of hydraulic conductivity and capacity of lowpermeability soils and soils that have shallow ground watertables.
1. Apparatus and methods for determininghydraulic conductivity properties in lowpermeability media.
2. What methods can be used to assess thehydraulic capacity of a site for larger andclustered WSAS applications?
A. Evaluate existing hydrologic assessment approaches (e.g., forspatial variability and heterogeneity), field techniques (e.g.,geophysical methods), and modeling tools for theirapplicability and reliability for WSAS applications.
1. Approach to assessment and list ofapplicable assessment and modeling tools.
(a) Evaluate sites and developlandscape configurations forWSAS to avoid exceedingsite capacity.
3. How can the natural soil properties thatimpact wastewater-induced soil cloggingdevelopment be assessed in the fieldduring site evaluation?
A. Utilize experimental data generated in I.3.A. to assess impactand relationship of soil properties to design application ratesand LTAR.
1. Matrix of soil properties and appropriatedesign application rates.
(a) Support rational sizing ofinfiltrative surfaces.
4. What methods can be applied to assess thetreatment capacity of a site for nutrients,bacteria and virus?
A. Develop and validate testing techniques that can reliablymeasure the effectiveness of a given profile for treatment ofkey constituents of concern.
1. Test methods for assessing treatmenteffectiveness.
(a)
(b)
(c)
Support system design for agiven treatment objective.Provide more accuratemethods to assess sitecapacity and treatmentcapabilities.Input to flow and transportmodels for treatmentefficiency.
5. What methods can be used to estimate thecontribution of existing or new WSAS topollutant loads in a watershed or sub-watershed?
A. Utilize modeling and decision-support tools produced fromI.7.
1. Modeling tools for screening levelassessments to quantitative prediction ofperformance.
(a)
(b)
Enable assessment ofcumulative effectsEnable explicit incorporationof WSAS in TMDLassessment and allocations.

WSAS White Paper, v3.5 38
Table 7. cont. Research questions for wastewater soil absorption systems. 1
Strategic focus Tasks Products Uses
III. Performance Monitoring Needs1. What is an appropriate methodology for
defining the space-time domain forevaluating performance of one or manyWSAS, that is protective of public healthand environmental quality in a givensetting?
A. Develop a paradigm for the WSAS as a treatment unit andwhat the appropriate space and time dimensions are within thecontext of public health and environmental receptors andrisks.
1. Improved performance monitoringapproaches that enable risk assessmentand management.
(a) Support development andapplication of permits andmonitoring approaches toverify compliance.
2. What are easily measured “indicators” ofWSAS function that can be used to predicttreatment performance?
A. Based on system function, identify key indicators, and testthose indicators under varied conditions.
1. Information on readily measured systemfunctional attributes that are indicative oftreatment performance.
(a) Support application ofrelatively cheap and reliablemonitoring and performanceassessment methods.
B. Conduct studies to develop correlations between percolatefluxes estimated from analysis of soil solids versus soilsolution for nutrients, bacteria and virus.
1. Statistical relationships for alternativesampling and analysis approaches (e.g.,soil coring vs. soil solution sampling forN, P, fecal bacteria, virus).
C. Conduct studies to determine the utility and reliability ofonline monitoring of water quality (air composition)indicators (e.g., pH, Ec, D.O.) and treatment performance.
1. Statistical relationships for indicators vs.treatment parameters in WSAS.
3. What methods can be reliably used toprovide data on purification performanceand the flux of pollutants, particularlybacteria and virus, from a WSAS into anunderlying ground water?
A. Conduct studies of methods and statistical data analysisapproaches for monitoring in the vadose zone and groundwater beneath single systems and small clusters of systems.
1. Methods and apparatus for monitoring andperformance assessment for single sitesand small clusters.
(a) Monitoring of existing andnew systems suspected tohave poor or inadequatetreatment to target upgrade orreplacement needs.
B. Conduct studies of methods and statistical data analysisapproaches for monitoring in the vadose zone and groundwater for larger developments and watersheds. Carryout outfield testing to validate viability and utility of methods andapproaches.
1. Methods and apparatus for monitoring andperformance assessment for cumulativeeffects in larger developments andwatersheds.
(b) Routine monitoring of WSASto verify compliance withpermits.
C. Conduct controlled studies to determine the nature andreliability of the correlation between fecal coliforms andpathogens (infectious bacteria and enterovirus), and assess thevalidity of fecal coliforms as an indicator.
1. Information on the validity of fecalcoliforms as an indicator of pathogentreatment in WSAS.
(c) Monitoring of WSAS toverify pollutant allocationsmade as part of TMDL’s in awatershed.
4. What methods are available to assess thetreatment performance directly or byestimation, of old WSAS of unknowndesign and installation, and operationalhistory?
A. Test methods and approaches developed in III.1 to III.3 at oldsystems in different environmental settings.
1. Methods and apparatus for monitoring andperformance assessment for old unknownWSAS.
(a) Monitoring of existing andnew systems suspected tohave poor or inadequatetreatment to target upgrade orreplacement needs.
5. What is the role and impact of remotesensing and monitoring on performanceassurance for decentralized systems?
A. Conduct studies of cost/benefit of remote sensing andSCADA technology for controlling and monitoring WSASfunction and performance.
1. Information on available methods, costs,and viability.
(a)
(b)
Provide information tosupport development ofcontract services in theprivate and public sectors.Enables performance-baseddesign and implementation.

WSAS White Paper, v3.5 39
Table 7. cont. Research questions for wastewater soil absorption systems. 1
Strategic focus Tasks Products Uses
IV. Other Supporting Needs1. What is the composition of the effluent
produced by different types of emergingtank-based treatment units?
A. Complete monitoring of test systems or full-scale installationsto define effluent concentration distributions for keyconstituents in the effluent from different treatment units suchas (1) add-on units to septic tank, (2) spin-disk filters, (3)foam and textile filters, (4) peat filters, (5) LECA filters, and(6) aerobic package plants. Key constituents include thosethat affect soil clogging development (e.g., tBOD and SS) andalso constituents of public health and environmental qualityconcern.
1. Information on the effluent compositioncharacteristics (central tendency andspread of concentrations) and reliability ofalternative pretreatment units as comparedto septic tank treatment prior to WSAS.
(a)
(b)
Provide input to analysis ofeffects of pretreatment on soilclogging and performanceeffects.Provide input to riskreductions afforded byincreased pretreatment priorto WSAS.
2. What is the composition of the effluentproduced by different types of emergingtank-based treatment units?
A. Conduct international literature review and if needed,complete monitoring of source separation systems.
1. Information on the effluent compositioncharacteristics (central tendency andspread of concentrations) and reliability ofsource separation to produce a statedquality of effluent (e.g., graywater STE)prior to WSAS.
(a) Provide information on thebenefits and reliability ofsource separation to achievepollutant mass reductions andrisk reductions therefrom.
3. What methods can be used to restore theinfiltrative capacity of a WSAS withexcessive wastewater-induced soilclogging?
A. Conduct studies of alternative approaches based onknowledge of soil clogging genesis such as (1) long-termresting, (2) improved pretreatment, (3) forced aeration, (4)physical disruption, and (5) chemical amendments.
1. Methods and equipment to restoreexcessively clogged WSAS such as occurswith very old, overused, or commercialsystems.
(a) Restore dysfunctioningWSAS and mitigate adversehealth effects due to exposureto partially or untreatedwastewater.
B. Develop a methodology to diagnose WSAS function andperformance dysfunctions and select the most effectiverestoration technique.
2. Information and methods for assessinghydraulic dysfunction and choosing arestoration technique.
(a) Support continued use ofWSAS and preventunnecessary replacement ofsystems at higher cost anddisruption compared to that ofrestoration.
4. What short-term tests can be used topredict long-term performance?
A. Conduct comparative experiments with accelerated loadingschemes and based on findings, evaluate implications of timescales on testing of new technologies.
1. Practical test procedures that allow short-term testing of technologies with longfunctional service lives
(a) Test protocols for evaluatingWSAS system performance tosatisfy regulatory demandsand/or certification programs
5. What improvements in performance ofWSAS can be attributed to training andcertification programs?
A. Conduct studies to evaluate the improvements in performancethat have occurred and can be attributed to training andcertification programs.
1. Information on value and need for trainingand certification programs.
(a) Support state and localdecisions regarding trainingand certification programs.
1 Research needs for WSAS as outlined in Table 7 were intentionally developed to exclude the facets of implementation such as education and training, materials and constructionquality, regulatory/certification programs, system management, septage management, and so forth. While these are recognized as important and relevant to WSAS design andperformance, but beyond the scope of this research needs white paper.

WSAS White Paper, v3.5 40
Table 8. Prioritization of research questions into ranked research needs.
Weight. score 1 RankResearch question and need Attri bute sco re 1 A B C D E Total by Priority Comments
No. Description A B C D E 0.3 0.2 0.3 0.1 0.1 score score2 group3
I.1.A. Effect of pretreatment IRt/IRo and fluxes 3 3 5 3 5 0.9 0.6 1.5 0.3 0.5 3.80 6 HI.1.B. Pathogen fate vs. soil clogging genesis 5 5 5 5 3 1.5 1.0 1.5 0.5 0.3 4.80 1 VHI.2.A. I.S. character and hydraulics 3 5 3 3 3 0.9 1.0 0.9 0.3 0.3 3.40 13 M Needs I.2.A., I.3.A., and I.4.A. areI.3.A. Effects/interactions of STE on LTAR related and were grouped for rankingI.4.A. Effects of application methods on trtmentI.5.A. Survey large populations for service life 5 3 1 3 5 1.5 0.6 0.3 0.3 0.5 3.20 16 MI.6.A. Treatment effects of seasonal saturation 3 3 3 3 5 0.9 0.6 0.9 0.3 0.5 3.20 16 M Needs I.6.A. and I.6.B. areI.6.B. Treatment effects of temp. extremes related and were grouped for rankingI.7.A. Model development from databases 5 5 3 5 3 1.5 1.0 0.9 0.5 0.3 4.20 4 VH Needs I.7.A. and I.7.B. areI.7.B. Develop methodology for model selection related and were grouped for rankingII.1.A. Methods to directly measure pore size 3 3 1 5 3 0.9 0.6 0.3 0.5 0.3 2.60 19 L Needs II.1.A., II.1.B., and II.1.C. areII.1.B. Methods to indirectly estimate pore sizes related and were grouped for rankingII.1.C. Hydraulic cap. of LPM and shallow soilsII.2.A. Evaluate hydro assessment methods/tech. 3 5 3 5 3 0.9 1.0 0.9 0.5 0.3 3.60 8 HII.3.A. Field assessment of soil effects on LTAR 3 5 1 3 3 0.9 1.0 0.3 0.3 0.3 2.80 18 LII.4.A. Testing techniques for treatment potential 3 5 3 5 3 0.9 1.0 0.9 0.5 0.3 3.60 8 HII.5.A. Estimate pollutants loads to watersheds 3 5 3 3 3 0.9 1.0 0.9 0.3 0.3 3.40 13 MIII.1.A. Paradigm for WSAS treatment unit 5 5 1 5 5 1.5 1.0 0.3 0.5 0.5 3.80 6 HIII.2.A. Key indicators of system function 3 5 3 5 3 0.9 1.0 0.9 0.5 0.3 3.60 8 H Needs III.2.A., III.2.B., and III.2.C. areIII.2.B. Correlation’s for solids vs. percolate related and were grouped for rankingIII.2.C. Utility of online water quality sensorsIII.3.A. Monitoring of VZ/GW for small appl. 3 5 3 5 1 0.9 1.0 0.9 0.5 0.1 3.40 12 M Needs III.3.A. and III.3.B. areIII.3.B. Monitoring of VZ/GW for larger appl. related and were grouped for rankingIII.3.C. Correlation’s of FC and pathogens for WSAS 5 5 3 5 3 1.5 1.0 0.9 0.5 0.3 4.20 4 VHIII.4.A. Test methods for old systems 5 1 3 3 5 1.5 0.2 0.9 0.3 0.5 3.40 13 MIII.5.A. Cost/benefit of remote sensing/SCADA 5 5 3 5 5 1.5 1.0 0.9 0.5 0.5 4.40 3 HIV.1.A. ATU effluent profiles 3 3 1 3 3 0.9 0.6 0.3 0.3 0.3 2.40 21 LIV.2.A. Source separation systems lit review / mon. 3 3 1 5 3 0.9 0.6 0.3 0.5 0.3 2.60 19 LIV.3.A. Restoration of clogged systems 3 1 1 3 5 0.9 0.2 0.3 0.3 0.5 2.20 22 L Needs IV.3.A. and IV.3.B. areIV.3.B. WSAS performance dysfunction diagnoses related and were grouped for rankingIV.4.A. Accelerated loading testing 5 5 5 3 3 1.5 1.0 1.5 0.3 0.3 4.60 2 VHIV.5.A. Performance benefits of training/certif. 3 5 3 3 5 0.9 1.0 0.9 0.3 0.5 3.60 8 H
1 Prioritization categories and attributes with points: Total score = sum{(wt.A)(A) + (wt.B)(B) + (wt.C)(C) + (wt.D)(D) + (wt.E)(E)}A = Level of current science and technology base (wt. = 0.3)
1 = Mechanistic understanding exists; 3 = Empirical data exists for WSAS under common conditions or relevant understanding in allied fields; 5 = Limited/qualitative understanding exists for a few conditions.B = Level of importance to design and performance of "new" WSAS (wt. = 0.2)
1 = Not very critical, confirms expected/likely performance with more data; 3 = Enables semiquantitative design/analysis; 5 = Enables rational design and/or performance assessment.C = Impact if research is completed and need is satisfied (wt. 0.3)
1 = No extension or use or risk reduction for current applications likely; 3 = Reduces risk uncertainty regarding WSAS uses; 5 = Enables WSAS applications under new situations with known risk.D = Feasibility and cost of completing work (wt. = 0.1)
1 = Uncertain and/or very high cost; 3 = Can surely be done but at mod. to high cost; 5 = Has been / can be done at low cost and/or has been done in other fields and can be applied to WSAS with leverage.E = Known or suspected work in progress (wt. = 0.1)
1 = Programs or projects ongoing that should produce needed results; 3 = Programs or projects ongoing that should produce part of needed results; 5 = No known programs ongoing or pending.2 Numerical ranking is based on weighted attribute scoring with the highest weighted score yielding the highest rank in terms of priority of research need.3 Ranking into four groups is based on similarity of scores \ and breakpoints in the numerical ranking: Very high (VH) = >4.0; High (H) = 3.5 to 3.9; Moderate (M) = 2.9 to 3.4; and Low (L) = 2.8 and below.

WSAS White Paper, v3.5 41
8. Acknowledgments
This paper was prepared with contributions made by several individuals and organizations. Students, staffand faculty at the Colorado School of Mines are acknowledged for their valuable contributions incontributing to the tables and figures in the paper, as well as providing reviews of the draft manuscripts.The USEPA and the National Decentralized Water Resources Capacity Development Project areacknowledged for their sponsorship of the preparation of this and related white papers and the conveningof a national workshop on research needs. The constructive comments received from the white paperreviewers, Dr. Aziz Amoozegar and Dr. James Converse, are acknowledged, as are those received fromattendees at the national workshop convened in May 2000 at Washington University in St. Louis,Missouri.
9. References Cited
Aller, L.T., J.H. Lehr, and R.J. Petty, 1985. DRASTIC: A Standardized System for Evaluation Groundwater Pollution Potentialusing Hydrogeologic Settings. U.S. Environmental Protection Agency, 600/2-85/018, Ada, OK, 163 p.
Amerson, R.S., E.J. Tyler and J.C. Converse. 1991. Infiltration as Affected by Compaction, Fines and Contact Area of Gravel.In: Proc. 6th National Symposium on Individual and Small Community Sewage Systems. ASAE, St. Joseph, MI., 214-222.
Amoozegar, A., E.W. West, K.C. Martin, and D.F. Weymann. 1994. Performance Evaluation of Pressurized SubsurfaceWastewater Disposal Systems. Proc. 7th Natl. Symp. on Individual and Small Community Sewage Systems, 11-12 Dec.1994, Chicago, IL. ASAE Publ. 18-94. pp. 454-466.
Amoozegar, A. and C.P. Niewoehmner. 1998. Soil Hydraulic Properties Affected by Various Components of DomesticWastewater. Proc. 8th Natl. Symp. on Individual and Small Community Sewage Systems, 8-10 March 1998, Orlando, FL.ASAE Publ. 03-98. pp. 155-156.
Anderson, D.L., R.L. Siegrist, and W.C. Boyle. 1981. Performance Evaluation of Greywater Recycle Systems. Proc. WaterReuse II Symposium. Aug. 1981. Washington, DC. Am. Water Works Assn. (AWWA), Denver. pp. 65-83.
Anderson, J.L., M.J. Hansel, and R.E. Machmeier. 1982. Long-term Acceptance Rates of Soils for Wastewater. Proc. Natl. Sym.on Individual and Small Community Sewage Treatment. Dec. 1981. Chicago. ASAE Publ. 1-82. ASAE, St. Joseph, MI.pp. 93-100.
Anderson, D.L., R.L. Siegrist and R.J. Otis. 1985. Technology Assessment of Intermittent Sand Filters. U.S. EnvironmentalProtection Agency, Municipal Environmental Res. Lab., Cincinnati, Ohio.
Anderson, D.L., A.L. Lewis, and K.M. Sherman. 1991. Human Enterovirus Monitoring at Onsite Sewage Disposal Systems inFlorida. Proc. 6th Nat. Symp. on Small Sewage Systems. ASAE Publ. 10-91, St. Joseph, MI. pp. 94-104.
Ausland, G.A. 1998. Hydraulics and Purification in Wastewater Filters. Doctor Scient. Thesis 1998:23. Dept. of Agr. Eng., Agr.Univ. of Norway, Ås, Norway, ISBN 82-575-0359-2.
Baumann, E.R., E.E. Jones, W.M. Jakubowski, and M.C. Nottingham. 1978. Effluent Distribution. Proc. 2nd Natl. Symp. onHome Sewage Treatment. 12-13 December 1977, Chicago, IL. American Soc. Agric. Engr. Publ. 5-77. pp. 38-53.
Bechdol, M.L., A.J. Gold, and J.H. Gorres. 1994. Modeling Viral Contamination from Onsite Wastewater Disposal in CoastalWatersheds. Proc. 7th Natl. Symp. on Individual and Small Community Sewage Systems. 11-13 December 1994, Atlanta,GA. ASAE Publ. 18-94. pp. 146-153.
Bicki, T.J. and J.M. Lang. 1991. Fate of Pesticides Introduced into On-Site Sewage Disposal Systems. Proc. 6th Nat. Symp. onSmall Sewage Systems. ASAE Publ. 10-91, St. Joseph, MI. pp. 86-93.
Bicki, T.J., R.B. Brown, M.E. Collins, R.S. Mansell and D.F. Rothwell. 1984. Impact of Onsite Sewage Disposal Systems onSurface and Groundwater Quality. Soil Sci. Dept., Inst. of Food and Agric. Sci., Univ. of Florida, Gainesville.
Boller M., A. Schwager, J. Eugster and V. Mottier. 1993. Dynamic Behavior of Intermittent Buried Filters. Wat. Sci. Tech.28(19), 99-107.
Bouma, J. 1971. Evaluation of the Field Percolation Test and an Alternative Procedure to Test Soil Potential for Disposal ofSeptic Tank Effluent. Soil Sci. Soc. Ameri. Proc. Vol. 35.
Bouma, J. 1975. Unsaturated Flow During Soil Treatment of Septic Tank Effluent. J. Environ. Engr., Am. Soc Civ. Engrs.,101(EE6): 967-83.
Bouma, J., J.C. Converse, J. Carlson and F.G. Baker. 1975a. Soil Absorption of Septic Tank Effluent in Moderately PermeableFine Silty Soils. Trans. Am. Soc. Agr. Engrs., 18(6): 1094-1099.
Bouma, J., J.C. Converse, R.J. Otis, W.G. Walker, and W.A. Ziebell. 1975b. A Mound System for Onsite Disposal of SepticTank Effluent in Slowly Permeable Soils with Seasonally Perched Water. J. Environ. Qual. 4(3):382-388.
Bounds, T.R. 1995a. Septic Tank Sizes for Large Flows. Proc. Proc. 7th International Symposium on Individual and SmallCommunity Sewage Systems. ASAE Publ. 18-94. St. Joseph, MI. pp. 42-46..
Bounds, T.R. 1995b. Septic Tank Septage Pumping Intervals. Proc. 7th International Symposium on Individual and SmallCommunity Sewage Systems. ASAE Publ. 18-94. St. Joseph, MI. pp. 58-65.
Bouwer, H. 1984. Elements of Soil Science and Groundwater Hydrology. In: Groundwater Pollution Microbiology, Bitton, G.and Gerba, C.P. (Eds.), John Wiley and Sons, New York, N.Y. pp. 9-38.
WSAS White Paper, v3.5 42
Briggs, G.R. and E.J. Barranco. 1994. Standardization of Florida’s On-Site Sewage Treatment and Disposal System Program.Proc. 7th Natl. Symp. on Individual and Small Community Sewage Systems. 11-13 December 1994, Atlanta, GA. ASAEPubl. 18-94. pp. 22-31.
Brown, K.W., H.W. Wolf, K.C. Donnelly, and J.F. Slowey. 1979. The Movement of Fecal Coliforms and Coliphages belowSeptic Lines. J. Environmental Quality. 8(1):121-125.
Chen, C.W., J. Herr, L. Ziemelis, R.A. Goldstein, and L. Olmsted, 1999. Decision Support System for Total Maximum DailyLoad. Journal of Environmental Engineering, 125(7), 653-659.
Clayton, J.W. 1975. An Analysis of Septic Tank Survival Data from 1952 to 1972 in Fairfax County, Virginia. Fairfax CountyHealth Department. Proc. Conf. on Water Pollution Control in Low Density Areas. Jewell, W.J. and R. Swan (ed.). Univ.Press of New England, Hanover, New Hampshire.
Cliver, D.O. 2000. Fate and Transport of Pathogens. Proc. Decentralized Wastewater Management Research Needs Conference,Washington University, St. Louis, MO. May 19-20, 2000. U.S. EPA, Cincinnati, OH. In press.
Coleman, N.T., J.T. Thorup and W.A. Jackson. 1960. Phosphate-Sorption Reactions that Involve Exchangeable Al. Soil Sci. 90,pp. 1-7.
Converse, J.C., B.L. Carlile, and G.W. Peterson. 1978. Mounds for Treatment and Disposal of Septic Tank Eflluent. Proc. 2nd
Natl. Symp. on Home Sewage Treatment. 12-13 December 1977, Chicago, IL. American Soc. Agric. Engr. Publ. 5-77. pp.100-120.
Converse, J.C., M.E. Kean, E.J. Tyler, and J.O. Peterson. 1991. Bacterial and Nutrient Removal in Wisconsin At-Grade OnsiteSystems. Proc. 6th Nat. Symp. on Small Sewage Systems. ASAE Publ. 10-91, St. Joseph, MI. pp. 46-61.
Converse, J.C., and Tyler, E.J. 1998. Soil Treatment of Aerobically Treated Domestic Wastewater with Emphasis on ModifiedMounds. Proc. 8th National Symposium on Individual and Small Community Sewage Systems. ASAE Publ. 03-98. pp.306-319.
Converse, J.C. 1999. Nitrogen as it Relates to On-Site Wastewater Treatment with Emphasis on Pretreatment Removal andProfiles Beneath Dispersal Units. Proc. 10th Northwest On-Site Wastewater Treatment Short Course and EquipmentExhibition. 20-21 September 1999, Seattle, pp. 171-184.
Cooper, P.F., G.D. Job, M.B. Green and R.B.E. Shutes. 1996. Reed Beds and Constructed Wetlands for Wastewater Treatment.WRC Publications, Medmenham, Marlow, UK.
Corapcioglu, M.Y. and A. Haridas. 1984. Transport and Fate of Microorganisms in Porous Media; a Theoretical Investigation.J. Hydrol. 72, pp. 149-169.
Crites, R.C. and G. Tchobanoglous. 1998. Small and Decentralized Wastewater Systems. McGraw-Hill Publishing Company,Boston.
Davidson, M.J. and R.K. Chang. 1972. Transport of Picloram in Relation to Soil-Physical Conditions and Pore Water Velocity.Soil. Sci. Soc. Amer. Proc. 36, pp. 257-61.
Docken, L.M. and B.D. Burkes. 1994. Wisconsin’s On-Site Code: A Status Report. Proc. 7th Natl. Symp. on Individual andSmall Community Sewage Systems. 11-13 December 1994, Atlanta, GA. ASAE Publ. 18-94. pp. 16-21.
Driscoll, J.., K.D. White, D.W. Salter, and L. Garner. 1998. Long Term Performance of Peat Biofilters for Onsite WastewaterTreatment. Proc. 8th National Symposium on Individual and Small Community Sewage Systems. ASAE Publ. 03-98. pp.530-537.
Duncan, C.S., R.B. Reneau, and C. Hagedorn. 1994. Impact of Effluent Quality and Soil Depth on Renovation of DomesticWastewater. Proc. 7th Natl. Symp. on Individual and Small Community Sewage Systems. 11-13 December 1994, Atlanta,GA. ASAE Publ. 18-94. pp. 219-227.
Effert, D,J. Morand and M. Cashell. 1985. Field Performance of Three Onsite Effluent Polishing Units, In: C.E. Beer (Ed.) Proc.On-Site Waste Water Treatment Symp., New Orleans, LA, 10-11 Des., 1984. ASAE, ST. Joseph, MI. pp. 351-61.
Ellis, J.B. and A.E. Ericson. 1969. Movement and Transformations of Various Phosphorus Compounds in Soils. Report toMichigan Water Resources Commission. Soil Sci. Dep., Michigan State Univ. and Michigan Water Res. Commission.
Ellwood, D.C., C.W. Keevil, P.D. Mash, C.M. Brown and J.N. Wardell. 1982. Surface Associated Growth. Phil Trans. R. Soc.Land., 297, pp. 517-532.
Emerick, R.W., R.M. Test, G. Tchobanoglous, and J. Darby. 1997. Shallow Intermittent Sand filtration: MicroorganismRemoval. The Small Flows Journal. 3(1):12-22.
Endreny, T.A., and E.F. Wood, 1999. Distributed Watershed Modeling of Design Storms to Identify Nonpoint Source LoadingAreas. Journal of Environmental Quality, 28, 388-397.
Enfield, C.G. 1974. Rate of Phosphorus Sorption by Five Oklahoma Soils. Soil Sci. Soc. Amer. Proc. 38, pp. 404-7.England, A. and S. Dix. 1999. Performance of the Infiltrator Chamber System in Hamilton County, Tennessee. Proc. National
Onsite Wastewater Recycling Association 8th Annual Conf. and Exhibition, Jekyll Island, GA, November 1999. pp. 99-106.Ewing, L. K., D.H. Vanderholm, C.W. Boast, and W.D. Lembke. 1985. Numerically Simulated Unsaturated Flow for Sand Filter
Design. Trans. ASAE, 28(5), 1583-1590.Fielding, M.B. 1982. Ground Water Mounding Under Leaching Beds. Proc. 3rd Natl. Symp. on Individual and Small Community
Sewage Treatment. Am. Soc. Agric. Engr. ASAE Publ. 1-82, pp. 215-222.Gårderløkken. J. 1997. Hevert som Stotbelaster for Infiltrasjonsanlegg. M.Sc. Thesis, Dept. of Agricultural Engineering,
Agricultural University of Norway, Aas, Norway.Geng, Q.Z., G. Girard, and E. Ledoux, 1996. Modeling of Nitrogen Cycle and Nitrate Transfer in Regional Hydrogeologic
Systems. Ground Water, 34(2), 293-304.

WSAS White Paper, v3.5 43
Gold, A. and Sims. 2000. Fate and Transport of Nutrients. Proc. Decentralized Wastewater Management Research NeedsConference, Washington University, St. Louis, MO. May 19-20, 2000. U.S. EPA, Cincinnati, OH. In press.
Greer, B. 1987. Volatile Organic Compounds (VOCs) in Small Community Wastewater Disposal Systems Using SoilAbsorption. M.S. Thesis, Civil and Environmental Engineering, Univ. of Wisconsin, Madison.
Griffin, D.M. and G. Quail. 1968. Movement of Bacteria in Moist, Particulate Systems. Aust. J. Biol. Sci., 21, pp. 579-582.Hantush, M.S. 1967. Growth and Decay of Groundwater Mounds in Response to Uniform Percolation. Water Resources Res.
3(1):227-234.Hargett, D.L., E.J. Tyler, and R.L. Siegrist. 1982. Soil Infiltration Capacity as Affected by Septic Tank Effluent Application
Strategies. Proc. Natl. Sym. on Individual and Small Community Sewage Treatment. Dec. 1981. Chicago. ASAE Publ. 1-82. ASAE, St. Joseph, MI. pp. 72-84.
Harvey, R.W. and S.P. Garabedian. 1991. Use of Colloid Filtration Theory in Modeling Movement of Bacteria through aContaminated Sandy Aquifer. Environ. Sci. Technol. 25:178-185.
Harvey, R.W. 1997. In Situ and Laboratory Methods to Study Subsurface Microbial Transport. In: Manual of EnvironmentalMicrobiology. Hurst, C.J., G.R. Knudsen, M.J. McInerney, L.D. Stetzenback, and M.V. Walter (eds.). ASM Press,Washington, D.C., 586-599.
Haas, C.N., C.P. Gerba, and J.B. Rose. 1999. Quantitative Microbial Risk Assessment. John Wiley & Sons, Inc.Haseman, J.F, E.H. Brown and C.D. Whitt. 1950. Some Reactions of Phosphate with Clays and Hydrous Oxides of Iron and
Aluminum. Soil Sci. 70, pp. 257-71.Healy, K.H., and R. Laak 1974a. Problems with Effluent Seepage. Water and Sewage Works. Oct. pp. 64-67.Healy, K.A. and R. Laak. 1974b. Factors Affecting the Percolation Test. J. Water Poll. Control Fed. 7(45)1509-1515.Higgins, J.J., G. Heufelder, and Sean Foss. 1999. Removal Efficiency of Standard Septic Tank and Leach Trench Septic Systems
for MS2 Coliphage. Proc. 10th Northwest On-Site Wastewater Treatment Shortcourse. September 20-21, 1999, Univ. ofWashington, Seattle, WA. pp. 81-88.
Hill, D.E. and C.R. Frink. 1980. Septic System Longevity Increased by Improved Design. Connecticut Agr. Exp. Station Bull.,747.
Hines, M. and R.E. Favreau, 1975. Recirculating Sand Filters: An Alternative to Traditional Sewage Adsorption Systems. In: J.D. W. Robbins (Ed.) Proc, Home Sewage Disposal Symp., Chicago, 9-10 Dec. 1974. ASAE, St. Joseph, MI. pp. 130-36.
Hoover, M. and A. Amoozegar. 1989. Performance of Alternative and Conventional Septic Tank Systems. North Carolina StateUniversity, Department of Soil Science. Raleigh, NC.
Hoover, M.T., A. Arenovski, D. Daly, and D. Lindbo. 1998a. A Risk-Based Approach to On-site System Siting, Design andManagement. Proc. 8th Natl. Symp. on Individual and Small Community Sewage Systems, 8-10 March 1998, Orlando, FL.ASAE Publ. 03-98. pp. 66-78.
Hoover, M.T., D. Sievers, and D. Gustafson. 1998b. Performance Standards for On-Site Wastewater Treatment Systems. Proc.8th Natl. Symp. on Individual and Small Community Sewage Systems, 8-10 March 1998, Orlando, FL. ASAE Publ. 03-98.pp. 66-78. pp. 346-355.
Hoxie, D.C. and A. Frick. 1984. Subsurface Wastewater Disposal Systems Designed in Maine by the Site Evaluation Method:Life Expectancy, System Design, and Land Use Trends. Proc. Proc. 4th Natl. Symp. on Individual and Small CommunitySewage Treatment. Am. Soc. Agric. Engr. New Orleans, LA, 10-11 December 1984. pp. 362-371.
Hutzler, N.J., L.E. Waldorf, and J. Fancy. 1978. Performance of Aerobic Treatment Units. Proc. 2nd Natl. Symp. on HomeSewage Treatment. 12-13 December 1977, Chicago, IL. American Soc. Agric. Engr. Publ. 5-77. pp. 149-163.
Huysman, F. and W. Verstraete. 1993. Water Facilitated Transport of Bacteria in Unsaturated Soil Columns: Influence ofInoculation and Irrigation Methods. Soil Biol. Biochem. 25(1):91-97.
Jenssen, P.D. and U. Bromssen. 1985. Infiltrerbarhet och Hydraulisk Kapacitet. In: U. Bromssen (ed.). Infiltration avavloppsvatten. Minab/Gotab Stockholm.
Jenssen, P.D. 1986. Infiltration of Wastewater in Norwegian Soils – Some Design Criteria for Wastewater Infiltration Systems.Dr. Scient. Thesis, Dept. of Geology, Agricultural Univ. of Norway, Aas, Norway.
Jenssen, P.D. 1988. Design Criteria for Wastewater Infiltration Systems. In: R. Bhamidimarri (ed.), Alternative WasteTreatment Systems, Elsevier, London. pp. 93-107.
Jenssen, P.D. and T. Krogstad. 1988. Particles Found in Clogging Layers of Wastewater Infiltration Systems May CauseReduction in Infiltration Rate and Enhance Phosphorus Adsorption. Wat. Sci. Tech., 20(3): 251-253.
Jenssen, P.D. and R.L. Siegrist. 1990. Technology Assessment of Wastewater Treatment by Soil Infiltration Systems. WaterScience & Tech. 22(3/4):83-92.
Jenssen, P.D. and R.L. Siegrist. 1991. Integrated Loading Determination for Wastewater Infiltration System Sizing. On-sitewaste water treatment. Proc. 6th National Symposium on Individual and Small Community Sewage Systems, 16-17December 1991, Chicago, Illinois. ASAE Publ. 10-91. pp. 182-191.
Jenssen, P.D. and O.J. Skjelhaugen. 1994. Local Ecological Solutions for Wastewater and Organic Waste Treatment – TotalConcept for Optimum Reclamation and Recycling. . Proc. 7th International Symposium on Individual and SmallCommunity Sewage Systems, ASAE Publ. 18-94. St. Joseph, MI. pp. 379-387.
Johnson, D.W., D.W. Breuer and D..W. Cole. 1979. The Influence of Anion Mobility on Soil Leaching Following MunicipalWastewater Application. J. Environ. Qual. 8, pp. 246-50.
Jones, J.H. and G.S. Taylor. 1964. Septic Tank Effluent Percolation Through Sands Under Laboratory Conditions. Soil Sci.99(5):301-309.
WSAS White Paper, v3.5 44
Jones, D. 2000. Integrated Risk Assessment/Risk Management as Applied to Decentralized Wastewater Treatment: A High-Level Framework. Paper presented at the U.S. EPA Research Needs Workshop, Washington Univ., St. Louis, MO, 18-19May 2000. U.S. EPA, Cincinnati, OH. In press.
Joubert, L.B., D.Q. Kellogg, and A.J. Gold, 1997. Aquifer Protection Options for North Kingstown, East Greenwich, andWarwick: Results of a Pollution Risk Assessment for the Hunt River Aquifer and Potowomut River Watershed. Universityof Rhode Island Cooperative Extension, 3 p.
Jowett, E.C. and M.L. McMaster. 1994. Absorbent Aerobic Biofiltration for On-Site Wastewater Treatment – Laboratory andWinter Field Results. Proc. 7th Natl. Symp. on Individual and Small Community Sewage Systems. 11-13 December 1994,Atlanta, GA. ASAE Publ. 18-94. pp. 424-436.
Kellogg, D.Q., L. Joubert, and A.J. Gold, 1997. MANAGE: A Method for Assessment, Nutrient-loading, and GeographicEvaluation of Nonpoint Pollution. University of Rhode Island Cooperative Extension, Department of Natural ResourcesScience, Kingston, RI.
Kepner, C.H. and B.B. Tregoe. 1973. The Rational Manager: A Systematic Approach to Problem Solving and DecisionMaking. Princeton Research Press, Princeton, NJ.
Kennedy, J.C. 1982. Anaerobic Filters for the Treatment of Residential Sewage. Proc. 3rd Natl. Symp. on Individual and SmallCommunity Sewage Treatment. Am. Soc. Agr. Engr., ASAE Publ. 1-82, pp. 101-107.
Keswick, B.H. and C.P. Gerba. 1980. Viruses in Groundwater. Environ. Sci. Technol. 14(11):1290-1297.Keswick, B.H., D. Wang, and C.P. Gerba. 1982. The Use of Microorganisms as Groundwater Tracers: A Review. Ground
Water. 20(2):142-149.Keys, J.R. 1996. Septic Tank Effluent Infiltration and Loading Rates for Gravel and Chamber Absorption Systems. M.S. Thesis.
University of Wisconsin-Madison.Keys, J.R., E.J. Tyler, and J.C. Converse. 1998. Predicting Life for Wastewater Absorption Systems. In: On-Site Wastewater
Treatment. ASAE Publ. 03-98. pp. 167-176.Kiker J.E., 1948. Subsurface Sewage Disposal. Fl. Eng. and Ind. Exp. Sta. Bull. No. 23, Univ. of Florida.Kolega, J.J., D.W. Hill, and R. Laak. 1987. Contribution of Selected Toxic Organic Chemicals to Groundwater from Domestic
On-Site Sewage Disposal Systems. Proc. 5th Natl. Symp. on Individual and Small Community Sewage Treatment. Am.Soc. Agric. Engr. ASAE Publ. 10-87, pp. 274-283.
Kristiansen, R. 1982. The Soil as a Renovating Medium - Clogging of Infiltrative Surfaces. In: Alternative WastewaterTreatment, A.S. Eikum and R.W. Seabloom (ed.), D. Reidel Publishing Co., Boston. pp. 105-120.
Kristiansen, R. 1981. Sand-filter Trenches for Purification of Septic Tank Effluent: III, The Microflora. Journal ofEnvironmental Quality, 10(3):361-364.
Kropf, F.W., R. Laak and K.A. Healy. 1977. Equilibrium Operation of Subsurface Absorption Systems. J. Water Pollut.Control Fed., 49(9): 2007-16.
Kuo , S. and E.G. Lotse. 1974. Kinetics of Phosphate on Soil Clogging. J. Water Pollut. Control Fed. 42, pp. 1495-1500.Laak, R. 1970. Influence of Domestic Wastewater Pretreatment on Soil clogging. J. Wat. Pollut. Control Fed., 42(8): 1495-99.Laak R., K.A. Healy and D.M. Hardisty. 1974. Rational Basis for Septic Tank System Design. Ground Water, 12(6): 348-352.Laak, R. 1982. A Passive Denitrification System for On-site Systems. Am. Soc. Agric. Engr. Proc., 1/82, pp. 108-15.Labieniec, P.A., D.A. Dzombak, and R.L. Siegrist. 1997. Evaluation of Uncertainty in a Site -Specific Risk Assessment. J.
Environmental Engineering. 123(3):234-243.Lahlou, M., L. Shoemaker, S. Choudhury, R. Elmer, A. Hu, H. Manguerra, and A. Parker, 1998. BASINS: Better Assessment
Science Integrating Point and Nonpoint Sources, U.S. EPA Office of Water, EPA-823-B-98-006.Lamb, B.E., A.J. Gold, G.W. Loomis and C.G. McKiel. 1990. Nitrogen Removal for On-site Sewage Disposal: A Recirculating
Sand Filter/Rock Tank Design. Transactions Am. Soc. of Agr. Eng. 33(3), pp. 525-31.Lance, J.C. 1972. Nitrogen Removal by Soil Mechanisms. J. Water Poll. Control Fed. 44(7):1352-1361.Lance, J.C., F.D. Whisler, and R.C. Rice. 1976. Maximizing Denitrification During Soil Infiltration of Sewage Water. J.
Environ. Qual. 5(1):102-107.Lasserre, F., M. Razack, and O. Banton, 1999. A GIS-linked Model for the Assessment of Nitrate Contamination in
Groundwater. Journal of Hydrology, 224, 81-90.Lee, S., D.C. McAvoy, J. Szydlik, and J.L. Schnoor, 1998. Modeling the Fate and Transport of Household Chemicals in Septic
Systems. Ground Water 36(1):123-132.Lewis W.J., S.S.D. Foster and B.S. Drasar. 1982 The Risk of Ground Water Pollution by On-site Sanitation in Developing
Countries. A Literature Review. IRCWD-Report no. 01/82. Dubendorf, Switzerland.Loomis, G.W. and D.B. Dow. 1998. Utilizing Advanced Treatment Technologies to Remediate Failed On-Site Systems on
Marginal Sites Located in Sensitive Coastal Environments. Proc. 8th National Symposium on Individual and SmallCommunity Sewage Systems. ASAE Publ. 03-98. pp. 420-
Loomis, G., L. Joubert, B. Dillmann, D. Dow, J. Lucht, and A. Gold, 1999. A Watershed Risk-based Approach to OnsiteWastewater Management – a Block Island, Rhode Island Case Study. Proc. 10th Northwest On-Site Wastewater TreatmentShort Course and Equipment Exhibition. 20-21 September 1999, Seattle, pp. 249-262.
Loudon, T.L., G.S. Salthouse, and D.L. Mokma. 1998. Wastewater Quality and Trench System Design Effects on SoilAcceptance Rates. Proc. 8th National Symposium on Individual and Small Community Sewage Systems. ASAE Publ. 03-98. pp. 186-194.

WSAS White Paper, v3.5 45
Loudon, T.L. and D.L. Mokma. 1999. Trench Infiltration as Influenced by Soil Type, Depth, Application Method and EffluentQuality. Proc. 10th Northwest On-Site Wastewater Treatment Short Course and Equipment Exhibition. 20-21 September1999, Seattle, pp. 341-352.
Mahuta, F. and W.C. Boyle. 1991. Gas Transport in the Unsaturated Zone of Soil Absorption Systems. Proc. 6th NationalSymposium on Individual and Small Community Sewage Systems, 16-17 December 1991, Chicago, Illinois. ASAE Publ.10-91. pp. 233-242.
Marshall, K.C. 1971. Sorptive Interactions Between Soil Particles and Microorganisms. In: Soil Biochemistry. Vol. 2.McLaren, A.D. and J. Skujiins, Marcel Dekker, New York, N.Y., pp. 409-445.
Masson, S.K. .1999. Fate of Microorganisms in a Soil Infiltration System as Affected by Infiltrative Surface Character andDepth. M.S. Thesis. Colorado School of Mines, Golden, Colorado.
Mathess, G. and A. Peckdeger. 1985. Survival of Pathogenic Bacteria and Viruses in Groundwater. In: Ground Water Quality,C.H. Ward, W. Giger and P.L. McCarty (ed.), John Wiley, Boston. pp. 472-82.
May, R. 1996. Problems Associated with the Use of Gravel in Septic-Tank Leachfield Systems. Journal Environmental Health.September: 6-11.
McCoy, E. and W.A. Ziebell. 1975. Effects of Effluents on Groundwater, Bacteriological Aspects. Proc. 2nd Conference onIndividual On-site Wastewater Systems. National Sanitation Foundation, Ann Arbor, Michigan, pp. 67-76.
McCray, J.E., D. Huntzinger, S. Van Cuyk, and R.L. Siegrist. 2000. Mathematical Modeling of Unsaturated Flow and Transportin Soil-Based Wastewater Treatment Systems. Proc. WEFTEC 2000, Water Environment Federation, 15-18 October,Anaheim, CA.
McGauhey, P.H. and R.B. Krone. 1967. Soil Mantle as a Wastewater Treatment System. SERL Report, 67-11, Univ. ofCalifornia, Berkeley. 201 p.
Mozes, N, F. Marcha, M.P. Hermesse, J.L. Van Haecht, L Reuliaux, A.J. Leanonard and P.G. Rouxhet. 1986. Immobilization ofMicroorganisms by Adhesion: Interplay if Electrostatic and Nonelectrostatic Interactions. Biotechnol. Bioeng., 30, pp. 439-450.
Nilsson, P. 1990. Infiltration of Wastewater. An Applied Study in Treatment of Wastewater by Infiltration. Doctoraldissertation90/1002. Dept. of Environmental Eng, Lund Univ., Inst. Of Science and Technology, Lund, Sweden.
NSF, 1996. Residential Wastewater Treatment Systems. Standard No. 40, National Sanitation Foundation. Ann Arbor, MI.Oakley, S., W.P. Greenwood, and M. Lee. 1999. Monitoring Nitrogen and Virus Removal in the Vadose Zone with Suction
Lysimeters. Proc. 10th Northwest On-Site Wastewater Treatment Shortcourse. September 20-21, 1999, Univ. ofWashington, Seattle, WA. pp. 211-232.
Okubu, T. and J. Matsumoto. 1979. Effect of Infiltration Rate on Biological Clogging and Water Quality Changes DuringArtificial Recharge. Water Resources Res. 15(6):1536-1542.
Omenn, G.S. (ed.). 1997a. Framework for Environmental Health Risk Management. Final Report Volume 1. ThePresidential/Congressional Commission on Risk Assessment and Risk Management. Washington, DC 20045.http://www.riskworld.com.
Omenn, G.S. (ed.). 1997b. Risk Assessment and Risk Management in Regulatory Decision-Making. Final Report Volume 2.The Presidential/Congressional Commission on Risk Assessment and Risk Management. Washington, DC 20045.http://www.riskworld.com.
Otis, R.J., J.C. Converse, B.L. Carlile, and J.E. Witty. 1978. Effluent Distribution. Proc. 2nd Natl. Symp. on Home SewageTreatment. 12-13 December 1977, Chicago, IL. American Soc. Agric. Engr. Publ. 5-77. pp. 61-85.
Otis, R.J. and D.J. Anderson. 1994. Meeting Public Health and Environmental Goals: Performance Standards for On-siteWastewater Treatment Systems. Proc. 7th International Symposium on Individual and Small Community Sewage Systems,ASAE, St. Joseph, MI. pp. 1-10.
Otis, R.J. 1985. Soil Clogging: Mechanisms and Control. In: On-Site Wastewater treatment. Proc. 4th Natl. Symp. on Individualand Small Community Sewage Treatment. Am. Soc. Agr. Engr., ASAE Publ. 7-85, pp. 238-250.
Overman, A., R.R.L. Chu and Y. Lee. 1978. Kinetic Coefficients for Phosphorus Transport in Packed-Bed Reactor. J. WaterPollut. Control Fed. 50, pp. 1905-10.
Peckdeger, A. and G. Matthess. 1983. Factors of Bacteria and Virus Transport in Groundwater. Environ. Geol. 5, pp. 49-52.Pell, M. and F. Nyberg. 1989a. Infiltration of Wastewater in a Newly Started Pilot Sand-filter System: I. Reduction of Organic
matter and Phosphorous. J. Environ. Qual. 18:451-457.Pell, M. and F. Nyberg. 1989b. Infiltration of Wastewater in a Newly Started Pilot Sand-filter System: II. Development and
Distribution of the Bacterial Populations. J. Environ. Qual. 18:457-462.Peeples, J.A., K.M. Mancl, and D.L. Widrig. 1991. An Examination of the Role of Sand Depth on the Treatment Efficiency of
Pilot Scale Intermittent Sand Filters. Proc. 6th Nat. Symp. on Individual and Small Community Sewage Systems. ASAE,St. Joseph, MI.
Plews, G.D. and F. DeWalle. 1985. Performance Evaluation of 369 Larger On-Site Systems. Proc. 4th Natl. Symp. on Individualand Small Community Sewage Treatment. Am. Soc. Agric. Engr., ASAE Publ. 7-85, pp. 372-381.
Preston, S.D. and J.W. Brakebill, 1999. Application of Spatially Referenced Regression Modeling for the evaluation of totalnitrogen loading in the Chesapeake Bay watershed, USGS publication WRIR-99-4054, 17 p.
Rasmussen, G., P.D. Jenssen, and L. Westlie. 1996. Greywater Treatment Options. Environmental Research Forum, Vol. 5-6,pp. 215-220. Transtec Switzerland.
WSAS White Paper, v3.5 46
Reed, S.C., E.J. Middlebrooks, and R.W. Crites. 1994. Natural Systems for Waste Management and Treatment. 2nd edition.McGraw-Hill, New York, NY.
Romero, J.C. 1970. The Movement of Bacteria and Viruses through Porous Media. Ground Water, 8(2):73-92.Rose, J.B., G.S. Sun, C.P. Gerba, and N.A. Sinclair. 1991. Microbial Quality and Persistence of Enteric Pathogens in Graywater
from Various Sources. Water Research, 25:37-42.Rose, J.B., D.W. Griffin, and L.W. Nicosia. 1999. Virus Transport from Septic Tanks to Coastal Waters. Proc. 10th Northwest
On-Site Wastewater Treatment Shortcourse. Sept. 20-21, Univ. of Washington, Seattle, WA. pp. 71-80.Roy, C., R. Auger, and R. Chenier. 1998. Use of Non-Woven Fabric in Intermittent Filters. Proc. 8th National Symposium on
Individual and Small Community Sewage Systems. ASAE Publ. 03-98. pp. 500-508.Ryon, H. 1928. Notes on the Design of Sewage Disposal Works with Special Reference to Small Installations. Quoted in
McGauhey and Krone (1967). pp. 10-14.Sauer, P.A. and E.J. Tyler. 1991. Volatile Organic Chemical (VOC) Attenuation in Unsaturated Soil Above and Below an Onsite
Wastewater Infiltration System. Proc. 6th Nat. Symp. on Small Sewage Systems. ASAE Publ. 10-91, St. Joseph, MI. pp.76-85.
Schwager, A and M. Boller. 1997. Transport Phenomena in Intermittent Filters. Wat. Sci. Tech. 35(6): 13-20.Shafer, R. 2000. Nitrogen Removal in Onsite Systems. Presentation to Jefferson County Health Department, Golden, CO.
January 26, 2000.Sharma, M,M, Y.I. Chang and T.F. Yen. 1985. Reversible and Irreversible Surface Charge Modification of Bacteria for
Facilitating Transport though Porous Media. Colloids Surf. 16, pp. 194-206.Sherman, K.M., R. Varnadore, R.W. Forbes. 1998. Examining Failures of Onsite Sewage Treatment Systems in Florida. On-
Site Wastewater Treatment. ASAE Publ. 03-98. pp. 43-51.Sherman, K.M. and D.L. Anderson. 1991. An Evaluation of Volatile Organic Compounds and Conventional Parameters from
On-Site Sewage Disposal Systems in Florida. Proc. 6th Nat. Symp. on Small Sewage Systems. ASAE Publ. 10-91, St.Joseph, MI. pp. 62-75.
Siegrist, R.L. 1978. Waste Segregation to Facilitate Onsite Wastewater Disposal Alternatives. Proc. 2nd Natl. Sym. on HomeSewage Treatment. Dec. 1977. Chicago. ASAE Publ. 5-77. ASAE, St. Joseph, MI. pp. 271-281.
Siegrist, R.L., T. Woltanski, and L. Waldorf. 1978. Water Conservation and Wastewater Disposal. Proc. 2nd Natl. Sym. onHome Sewage Treatment. Dec. 1977. Chicago. ASAE Publ. 5-77. ASAE, St. Joseph, MI. pp. 121-136.
Siegrist, R. L., D. L. Anderson, and W. C. Boyle. 1981. Alteration of In-House Wastewater Flow With Low Flush ToiletFixtures and Graywater Recycle. In: Alternative Wastewater Treatment, Low Cost Small Systems, Research andDevelopment. Ed. by A. S. Eikum and R. W. Seabloom. D. Reidel Publishing Company, Dordrecht, Holland. pp. 25-42.
Siegrist, R.L. and W.C. Boyle. 1982. Onsite Reclamation of Residential Greywater. Proc. 3rd Natl. Symp. on Individual andSmall Community Sewage Treatment. Am. Soc. Agr. Engr., ASAE Publ. 1-82, pp. 176-186.
Siegrist, R.L., D.L. Hargett, and D.L. Anderson. 1984. Vadose Zone Aeration Effects on the Performance of Large SubsurfaceWastewater Absorption Systems. Proc. Conf. on Characterization and Monitoring of the Vadose (Unsaturated) Zone. Nov.1983. Las Vegas, NV. National Water Well Assn. (NWWA), Worthington, OH. pp. 223-242.
Siegrist, R.L., D.L. Anderson, and J.C. Converse. 1985a. Commercial Wastewater Onsite Treatment and Disposal. Proc. 4th Natl.Symp. on Individual and Small Community Sewage Treatment. Am. Soc. Agr. Engr., ASAE Publ. 7-85, pp. pp. 210-219.
Siegrist, R.L., D.L. Anderson, D.L. Hargett, and R.J. Otis. 1985b. Performance Characteristics of a Community WastewaterAbsorption System. Proc. 4th Natl. Symp. on Individual and Small Community Sewage Treatment. Am. Soc. Agr. Engr.,ASAE Publ. 7-85, pp. 144-154.
Siegrist, R.L. 1986. Wastewater-Induced Soil Pore Clogging Development as Affected by Effluent Composition and LoadingRate. Doctoral dissertation, Univ. of Wisconsin, Madison. 335 pp.
Siegrist, R.L. 1987a. Soil Clogging During Subsurface Wastewater Infiltration as Affected by Effluent Composition andLoading Rate. J. Environ. Qual., 15(3):181-87.
Siegrist. R.L. 1987b. Hydraulic Loading Rates for Soil Absorption Systems Based on Wastewater Quality. In: On-SiteWastewater treatment. Proc. Fifth National Symposium on Individual and Small Community Sewage Treatment. Am. Soc.Agr. Engr., ASAE Publ. 10-87. pp. 232-241.
Siegrist, R.L., D.L. Anderson and D.L. Hargett. 1986. Large Soil Absorption Systems for Wastewaters from Multiple HomeDevelopments. EPA 600/52-86/023, U.S. Environmental Protection Agency, MERL, Cincinnati, Ohio.
Siegrist, R.L. and W.C. Boyle. 1987. Wastewater Induced Soil Clogging Development. J. Environmental Engineering.113(3):550-566.
Siegrist, R.L. and P.D. Jenssen. 1989. Nitrogen Removal During Wastewater Infiltration as Affected by Design andEnvironmental Factors. Proc. 6th On-site Wastewater Treatment Short Course. Sept. 1989. University of Washington,Seattle.
Siegrist, R.L., R. Smed-Hildmann, Z. Filip, and P.D. Jenssen. 1991. Humic Substance Formation During Wastewater Infiltration.ASAE Publ. 10-91. ASAE, St. Joseph, MI. pp. 182-191.
Sikora, L.J. and R.B. Corey. 1976. Fate of Nitrogen and Phosphorus in Soils Under Septic Tank Waste Disposal Fields. Trans.Am. Soc. Agric. Engr., 19(5):866-875.
Simunek, J., M. Sejna, and M.Th. van Genuchten. 1996. The HYDRUS-2D Software Package for Simulating Water Flow andSolute Transport in Two-dimensional Variably Saturated Media. Version 2.0 IGWMC-TPS-53, International GroundwaterModeling Center, Colorado School of Mines, Golden, CO.

WSAS White Paper, v3.5 47
Sinclair, T.A., R. Rubin, and R.J. Otis. 1999. Utilizing Drip Irrigation Technology for On-Site Wastewater Treatment. Proc. 10th
Northwest On-Site Wastewater Treatment Short Course and Equipment Exhibition. 20-21 September 1999, Seattle, pp. 171-184.
Smith, M.S., G.W. Thomas, R.E. White, and D. Ritonga. 1985. Transport of Escherichia coli through Intact and Disturbed SoilColumns. J. Environmental Quality. 14(1):87-91.
Soltman, J.M. 1990. Sand Filter Performance, In: R. W. Seabloom and O. Lenning (Ed.). Proc 6th Northwest On-SiteWastewater Treatment Short Course, Seattle, WA. 18-19 Sept. 1989. Univ. of Washington, Seattle, WA. pp. 271-287.
Sommers, L.E., D.W. Nilson and L.B. Owens. 1979. Status of Inorganic Phosphorus in Soils Irrigated with MunicipalWastewaters. Soil. Sci. 127, pp. 340-50.
Stark, S., 1997. A GIS to Investigate Septic System Site Characterization and NO3- Pollution Potential. Master’s Thesis,
Colorado State University, Fort Collins, CO.Stevik, T.K., G. Ausland and J.F. Hanssen, 1998. Retention and Elimination of Pathogenic Bacteria Percolating Through
Biological Filters. Effect of Physical, Chemical and Microbiological Factors. Doctor Scient. Thesis 1998:20. AgriculturalUniv. of Norway, Dept. of Agricultural Eng., Ås, Norway.
Stevik, T.K.. G.A. Ausland, P.D. Jenssen, P.D., and R.L Siegrist. 1999. Purification of E. coli Bacteria During IntermittentFiltration of Wastewater Effluent as Affected by Dosing Rate and Media Type. Water Research. 33(9):2088-2098.
Stewart, L.W. and R.B. Reneau. 1988. Shallowly Placed Low Pressure Distribution System to Treat Domestic Wastewater inSoils with Fluctuating High Water Tables. J. Environ. Qual. 17(3):499-504.
Stuanes, A. and P. Nilsson. 1987. Investigation of Soil treatment Systems for Septic Tank Effluent. 3. The Fate of Phosphorus.VATTEN 43, pp. 45-53.
Teutsch, G., K. Herbold-Paschke, D. Tougianijou, T. Hahn, and K. Botsenhart. 1991. Transport of Microorganisms in theUnderground – Processes, Experiments and Simulation Models. Water Sci. and Tech. 24:309-314.
Thomas, R.E., W.A. Schwartz, and T.W. Bendixen. 1966. Soil Chemical Changes and Infiltration Rate Reduction under SewageSpreading. Soil Sci. Soc. Amer. J. 30:641-646.
Toffelmire , T.J., M. Chen, F.E. van Alstyne, L.J. Hetling and D.B. Aulenbach. 1973. Phosphate Removal by Sands and Soils.New York State Dep. Environ. Conserv., Technical Paper 31. Albany, New York.
Tyler, E.J., W.C. Boyle, J.C. Converse, R.L. Siegrist, M.R. Shoeneman, and D.L. Hargett. 1985. Design and Management ofSubsurface Soil Absorption Systems. Final research report, PB85-216570, U.S. Environmental Protection Agency, MERL,Cincinnati, OH. 144 pp.
Tyler, E.J. and J.C. Converse. 1985. Wisconsin Mounds for Very Difficult Sites. Proc. 4th Natl. Symp. on Individual and SmallCommunity Sewage Treatment. Am. Soc. Agr. Engr., ASAE Publ. 7-85, pp. 119-130.
Tyler, E.J., M. Milner and J.C. Converse. 1991. Wastewater Infiltration from Chamber and Gravel Systems. Proc. 6th Nat.Symp. on Small Sewage Systems. ASAE Publ. 10-91, St. Joseph, MI. pp. 214-222.
Tyler, E.J. and J.C. Converse. 1994. Soil Acceptance of On-site Wastewater as Affected by Soil Morphology and WastewaterQuality. Proc. 7th International Symposium on Individual and Small Community Sewage Systems, ASAE, St. Joseph, MI.pp. 185-194.
Updegraff, D.M. 1983. Plugging and Penetration of Reservoir Rock by Microorganisms. Proc. International Conference on theMicrobial Enhancement of Oil Recovery, Proceedings, Donaldson, E.C. and Clark, J.B. (Eds.), U.S. Dept. of Eng.Bartlesville Energy Tech. Center, Bartlesville, Okla,, pp. 80-85.
USEPA. 1978. Management of Small Waste Flows. Report of Small Scale Waste Management Project, University of Wisconsin,Madison, WI. U.S. Environmental Protection Agency, Municipal Environmental Res. Lab., EPA-600/2-78-173. Cincinnati,Ohio.
USEPA. 1980a. Design Manual for Onsite Wastewater Treatment and Disposal Systems. U.S. Environmental ProtectionAgency Municipal Environmental Res. Lab., Cincinnati, Ohio.
USEPA. 1981. Design Manual for Land Treatment of Municipal Wastewater. EPA625/1-81-501. U.S. Environ. ProtectionAgency, CERI, Cincinnati, OH.
USEPA. 1992. Design Manual for Wastewater Treatment/Disposal for Small Communities. EPA/625/R-92/005. U.S. Environ.Protection Agency, Office of Research and Development. Washington, D.C.
USEPA. 1980b. Septage Management. EPA-600/8-80-032. Municipal Environmental Research Laboratory, Cincinnati, OH.USEPA. 1995. Process Design Manual for Land Application of Sewage Sludge and Domestic Septage. EPA/625/R-95/001.
Office of Res. and Dev., Washington, D.C. 20460.USEPA. 1997. Response to Congress on Use of Decentralized Wastewater Treatment Systems. U.S. Environmental Protection
Agency, Office of Water, Washington, D.C.USPHS. 1967. Manual of Septic Tank Practice. U.S. Public Health Service, Publ. 526, U.S. Dept of Health Education and
Welfare, Washington D.C.Van den Brink, C. and W.J. Zaadnoordijk, 1995. Evaluation of Ground-water Contamination from Nonpoint Sources: A Case
Study, Ground Water, 33(3), 356-365.Van Cuyk, S., R.L. Siegrist, A. Logan, S. Masson, E. Fischer, and L. Figueroa. 2000. Hydraulic and purification behaviors and
their interactions during wastewater treatment in soil infiltration systems. Water Research. Accepted and in press.Westby T., J.S. Køhler, G. Ausland, L Westlie and G. Rasmussen 1997. Infiltrasjon av sanitæravløp I stedlige jordmasser.
Jordforsk rapport 145/97. Jordforsk 1432 Ås, Norway.

WSAS White Paper, v3.5 48
Whitmeyer, R.W., R.A. Apfel, R.J. Otis, and R.L. Meyer. 1991. Overview of Individual Onsite Nitrogen Removal Systems.Proc. 6th National Symposium on Individual and Small Community Sewage Systems, 16-17 December 1991, Chicago,Illinois. ASAE Publ. 10-91. pp. 143-154.
Yates, M.V. and Y. Ouyang. 1992. VIRTUS, a Model of Virus Transport in Unsaturated Soils. Applied and EnvironmentalMicrobiology, 58(5):1609-1616.
Zhu, T. 1998. Nutrient Pollutants Removal in Light-weight Aggregates (LWA) Constructed Wetlands and Filter Systems.Doctor scient. Thesis 1997:16. Agricultural Univ. of Norway, Dept. of Agricultural Eng., Ås, Norway.
10.0 Appendix - Acronyms, Abbreviations and Symbols
AOU - add-on unitATU - advanced treatment unitAUE - aerobic unit effluentBOD5 - 5-day biochemical oxygen demandBT10 - breakthrough at Ce/Co = 0.10cBODult - ultimate carbonaceous BODCF - continuity factorcfu - colony forming unitCOC - constituent of concernCe - concentration in percolateCo - concentration applied and/or at t=0Cz - concentration at depth, zCZG - clogging zone genesisD.O. - dissolved oxygenDSTE - domestic septic tank effluentEPRI - Electric Power Research Institutegpd - gallons per daygpcd - gallons per capita per dayGIS - geographic information systemGW - ground waterH - highHLR - hydraulic loading rateHRT - hydraulic retention timeIRo - infiltration rate at time, 0IRt - infiltration rate at time, tIS - infiltrative surfaceISU - infiltrative surface utilizationISUo - infiltrative surface utilization at t=0ISZ - infiltrative surface zoneK - reaction rate constantKsat - saturated hydraulic conductivity
L - lowLF - loading factorLpcd - liters per capita per dayLpd - liters per dayLPP - low pressure pipeLTAR - long-term acceptance rateM - moderateMLR - mass loading rateMPI - minutes per inchnBOD - nitrogenous BODN - nitrogenNSF - National Sanitation FoundationO&M - operation and maintenanceP - phosphoruspfu - plaque forming unitPMB - porous media biofilterRA - risk assessmentRM - risk managementSFE - sand filter effluentSS, TSS - suspended solidsSTE - septic tank effluentt - timetBOD - total BOD (cBODult + nBOD)TMDL - total maximum daily loadingUSEPA - U.S. Environ. Protection AgencyUV - ultraviolet lightVH - very highVOCs - volatile organic compoundsVUE - volumetric utilization efficiencyWSAS - wastewater soil absorption systemz - depth below the infiltrative surface