Embed Size (px)
Citation preview

0
Design and performance of high efficiency
Synchronous reluctance motor for an industrial
application.
Arpit Patel
Master of Engineering (Electronics)
Supervisor: Dr Amin Mahmoudi
May 2017
Submitted to the School of Computer Science, Engineering, and Mathematics in the Faculty of
Science and Engineering for the requirement for the degree of Master of Engineering
(Electronics)

1
Contents
List of Figures ................................................................................................................3 List of Tables ................................................................................................................ 4
Abstract .........................................................................................................................5 Declaration of Academic Integrity.................................................................................. 6 Acknowledgement ......................................................................................................... 6
Chapter 1 Introduction 7
1.1 Background 7 1.2 Problem statement 10 1.3 Objectives 11 1.4 Methodology 12
1.5 Limitations and scope 14 1.6 Thesis Outline 15
Chapter 2 Literature Review 16
2.1 Introduction 16 2.2 Induction motor 16 2.3 Line-start synchronous reluctance motor 17 2.4 Line-start permanent magnet synchronous reluctance motor 18 2.5 Gap statement 19
2.6 Contribution 20
Chapter 3 Design Aspects 21 3.1 Induction motor as a benchmark model 22
3.1.1 Specifications of motor under study 24
3.1.2 Stator 25 3.1.2.1 Stator slots 25 3.1.3 Rotor 26
3.1.3.1 Rotor slots 27
3.2 Design of line-start synchronous reluctance motor 27 3.2.1 Optimization of rotor design with two different aspects 28 3.3 Design of line-start permanent magnet synchronous reluctance motor 30
3.3.1 Permanent magnets 30
Chapter 4 Simulation and Parameters 32 4.1 Simulation Method 33 4.2 Magnetostatic analysis 34
4.2.1 Air Gap Flux Density 39
4.2.2 Magnetic Flux Linkage 41 4.3 Summary of Magnetostatic analysis 44 4.4 Steady-state Analysis 45
4.4.1 Open-Circuit analysis or No-load test 45
4.5 Transient analysis 45 4.5.1 Full load testing 45
Chapter 5 Results and Discussion 46
5.1 Start-up of the Motor 46 5.2 Winding currents 50 5.3 Torque produced by Machine 51 5.4 Loss Analysis of the Machine 55 5.5 Input and Output Power of the Machine 58
5.6 Power factor 61 5.7 Efficiency (%) 62 5.8 Fan-Type Load 63
Chapter 6 Conclusion and Future Work 65
6.1 Conclusion 65

2
6.2 Future work 67
References
68
Appendices 70 Appendix A: Specifications of benchmark induction motor. 71
Appendix B: Mesh Plots. 74 Appendix C: Half-load analysis plots. 77 Appendix D: More than full load analysis plots. 90

3
List of Figures: -
Fig 1: Global consumption of the electricity……………………………………. 7
Fig 2: Electricity used by motors in Australia and New-Zealand………………. 8
Fig 3: Co2 Emission caused by electric motors in Australia and New-Zealand... 8
Fig 4: Efficiency standard for 4-pole, 50Hz low voltage electric motor………... 9
Fig 5: Flow chart of designing and simulation process…………………………. 13
Fig 6: Full geometry and winding configuration of the induction motor……….. 22
Fig 7: Torque speed curve of double cage induction motor…………………….. 23
Fig 8: Stator of an induction motor……………………………………………... 25
Fig 9: Definition of stator slots…………………………………………………. 25
Fig 10: Rotor of an induction motor……………………………………………… 26
Fig 11: Study of flux line travelling path on solid core rotor…………………….. 28
Fig 12: Line start synchronous reluctance motor with hyperbolic curve and
hyperbolic shape flux barriers…………………………………………….
30
Fig 13: Final design of line-start permanent magnet synchronous reluctance
motor……………………………………………………………………...
31
Fig 14: Induction motor modelled in RMXprt…………………………………… 33
Fig 15: Flux density of all five models at No-load………………………………. 35
Fig 16: Flux density of all five models at full load………………………………. 35
Fig 17: Flux line path representation for all five models at no-load……………... 36
Fig 18: Flux line path representation for all five models at full-load……………. 37
Fig 19: Magnetic flux vector representation for all five models at No-Load……. 38
Fig 20: Magnetic flux vector representation for all five models at full-Load……. 38
Fig 21: Air gap flux density in the induction motor……………………………… 39
Fig 22: Airgap flux density at no-load and full load……….…………………….. 40
Fig 23: Flux Linkage at No-Load………………………………………………… 42
Fig 24: Flux linkage at Full-Load………………………………………………... 43
Fig 25: Models Considered for the simulation…………………………………… 46
Fig 26: Speed Vs. Time at No-load ……..……………………………………….. 47
Fig 27: Speed Vs Time at full load………………………………………………. 49
Fig 28: Nature of winding currents………………………………………………. 50
Fig 29: Torque Vs Time at No-load……………………………………………… 52
Fig 30: Torque Vs Time at Full load……………………………………………... 54
Fig 31: Losses in the Machine at No-load………………………………………... 56

4
Fig 32: Losses in the machines at full-load……………………………………….. 58
Fig 33: Input and output power of machines at No-load…………………………. 59
Fig 34: Input and output power of machines at full load………………………… 60
Fig 35: Power factor of motors at no-load and full load…………………………. 61
Fig 36: Efficiency plots at no-load and Full load………………………………… 62
Fig 37: Speed Vs Time (Fan Type Load)...………………………………………. 64
List of Tables: -
Table 1: Minimum efficiency standard for three phase electric motors in
Australia and New-Zealand…………………………………………...
9
Table 2: Induction motor specification under study……………………………. 24
Table 3: Stator slots dimensions………………………………………………... 26
Table 4: Dual cage rotor slots dimensions……………………………………... 27
Table 5: Line-start synchronous reluctance motor parameters………………… 29
Table 6: Properties of permanent magnet……………………………………… 31
Table 7: Dimensions of the magnets…………………………………………… 31
Table 8: Summary of result comparison for all proposed models with bench
mark induction motor………………………………………………….
63

5
Abstract
This thesis investigates a design development and performance improvement of Synchronous reluctance
motor with the line-start capability comparable with an induction motor. A three-phase induction motor
with the rated output power of 20kW is selected as a benchmark. The aim is to introduce the synchronous
reluctance motor designs with the same starting capability of the induction motor under the study. The
proposed synchronous reluctance motors have the same stator design as the induction motor but the
differences are in the rotor. Since the synchronous reluctance motors are not self-starting. The proposed
rotor designs are equipped with the cages and successfully their performances are improved. In the
proposed models, two different hyperbolic-line and hyperbolic curve shape of flux barriers are
introduced. The performances of these models are further improved by adding the permanent magnets
to the rotor flux barriers. All the proposed motor designs are simulated and tested under different loading
conditions in FEM software. The performance of the designed motors is satisfactory in both steady-state
and starting conditions. The proposed motor designs outperform the induction motor in terms of power
factor and efficiency with up to 10% of increment. The outcome of this research is expected for the
future investigation of the new configurations of the line-start motors with higher efficiency and power
factor.

6
Declaration of Academic Integrity ‘I certify that this thesis does not incorporate without acknowledgment any material previously
submitted for a degree or diploma in any university; and that to the best of my knowledge and belief
it does not contain any material previously published or written by another person except where due
reference is made in the text.'
Arpit Patel 27/08/2017
Acknowledgements
I would like to acknowledge my family for supporting me throughout this project. And I would like to
specially acknowledge my supervisor, Dr. Amin Mahmoudi for providing me the knowledge and also
for being my guiding lights.

Chapter 1
Introduction
7
1.1 Background
In today’s era, the main aim is to do the sustainable energy development with the use of highly efficient
products as well as more use of the renewable energy also appreciated. By looking in the present
scenario, at least 40 to 45% of electrical energy has been consumed by electrical motors with nearly 75%
efficiency [1]. The rest of the energy has been wasted in the different losses and the emission of CO 2.
As induction motor is the most commonly used motor for all industrial application and for other house
hold purpose. In addition to that to develop a motor with low cost and simple construction is the biggest
challenge. Slip in the motor is the major reason of the limited efficiency and losses can be another reason
for the limited efficiency.
These types of economical and efficient motors introduced with the use of permanent magnets in the
rotor construction. So, before developing the new design it is very important to study the consumption
of electrical energy by electrical motors and different efficiency standards of different countries.
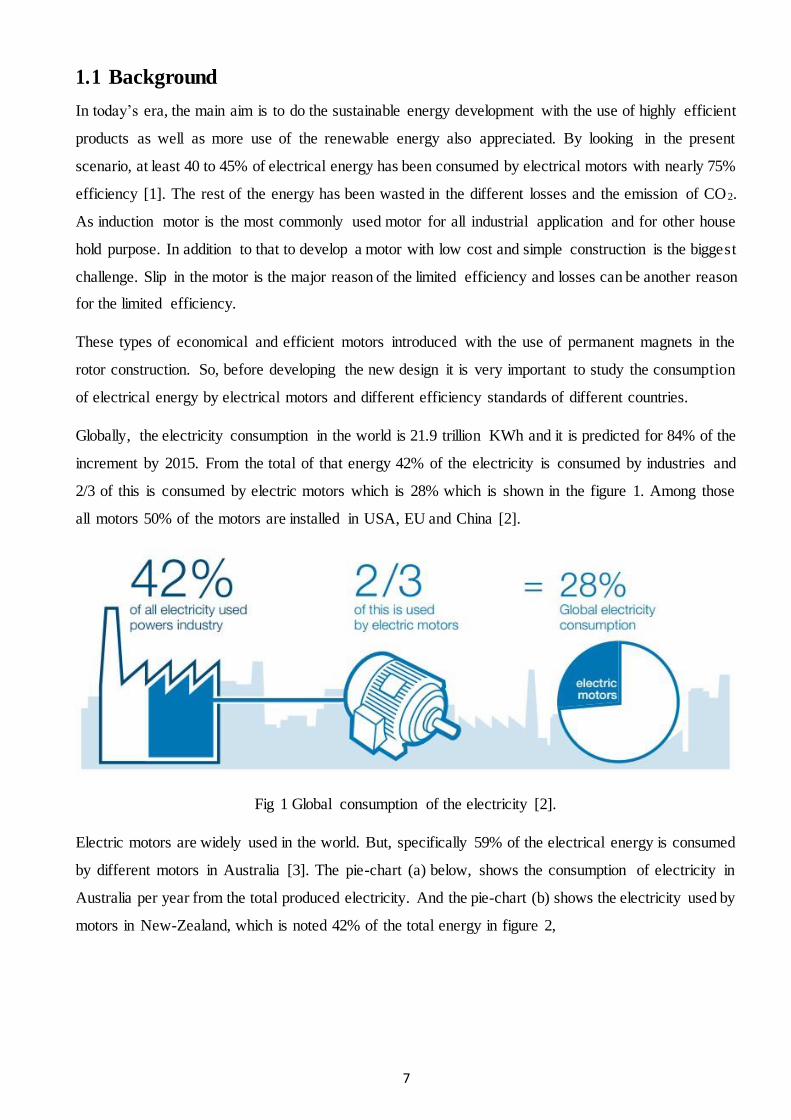
Globally, the electricity consumption in the world is 21.9 trillion KWh and it is predicted for 84% of the
increment by 2015. From the total of that energy 42% of the electricity is consumed by industries and
2/3 of this is consumed by electric motors which is 28% which is shown in the figure 1. Among those
all motors 50% of the motors are installed in USA, EU and China [2].
Fig 1 Global consumption of the electricity [2].
Electric motors are widely used in the world. But, specifically 59% of the electrical energy is consumed
by different motors in Australia [3]. The pie-chart (a) below, shows the consumption of electricity in
Australia per year from the total produced electricity. And the pie-chart (b) shows the electricity used by
motors in New-Zealand, which is noted 42% of the total energy in figure 2,
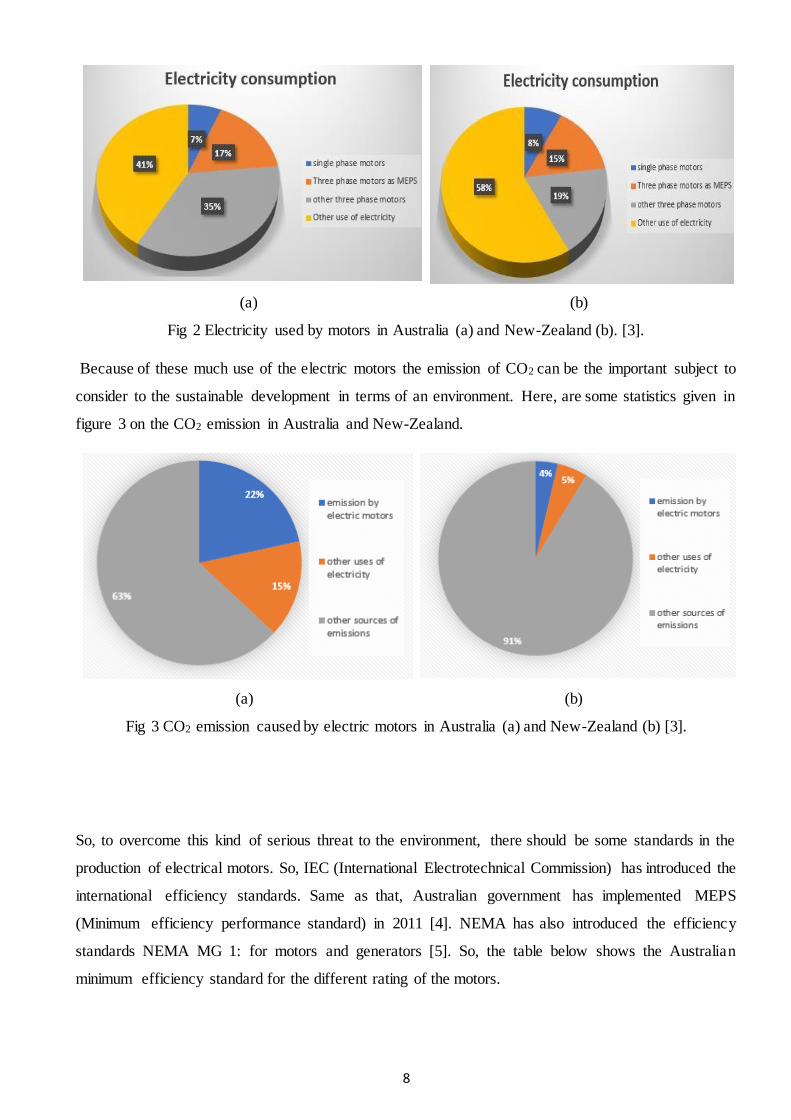
8
(a) (b)
Fig 2 Electricity used by motors in Australia (a) and New-Zealand (b). [3].
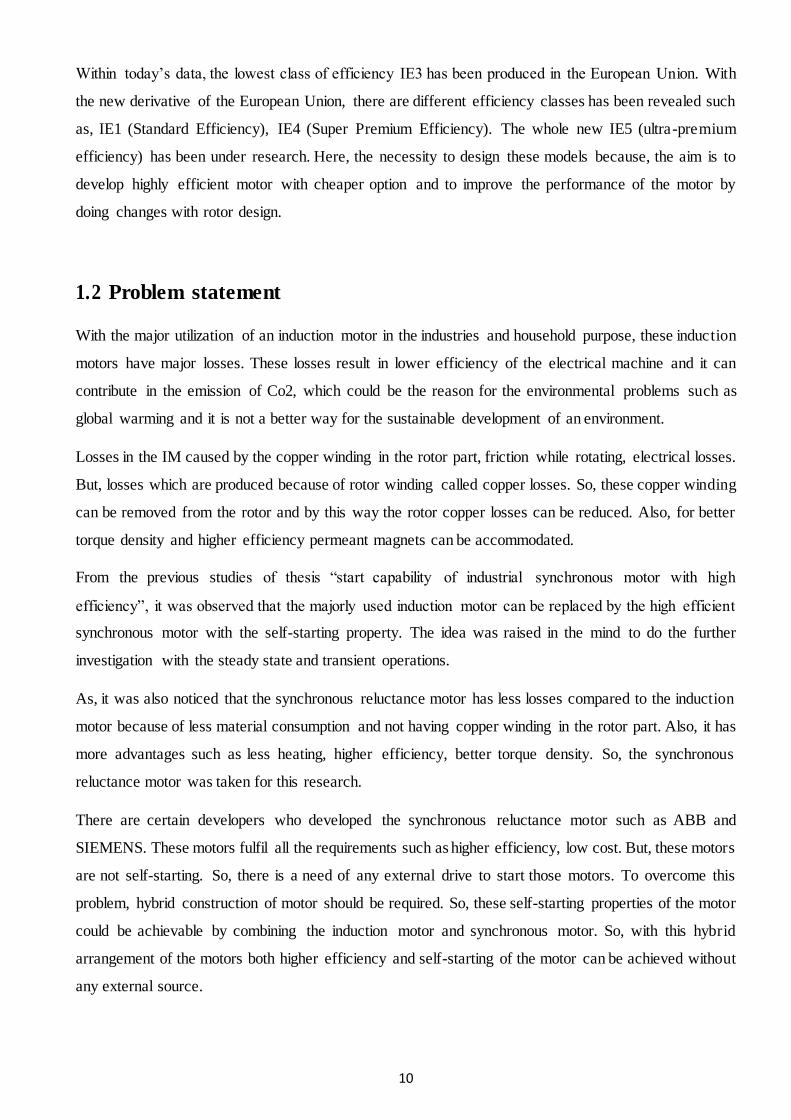
Because of these much use of the electric motors the emission of CO2 can be the important subject to
consider to the sustainable development in terms of an environment. Here, are some statistics given in
figure 3 on the CO2 emission in Australia and New-Zealand.
(a) (b)
Fig 3 CO2 emission caused by electric motors in Australia (a) and New-Zealand (b) [3].
So, to overcome this kind of serious threat to the environment, there should be some standards in the
production of electrical motors. So, IEC (International Electrotechnical Commission) has introduced the
international efficiency standards. Same as that, Australian government has implemented MEPS
(Minimum efficiency performance standard) in 2011 [4]. NEMA has also introduced the efficiency
standards NEMA MG 1: for motors and generators [5]. So, the table below shows the Australian
minimum efficiency standard for the different rating of the motors.

9
Table 1 Minimum efficiency standard for three-phase electric motors in Australia and New-Zealand
[6].
Also, European union has introduced minimum efficiency standards, which is illustrated below in the
figure 4.
Fig 4 Efficiency standard for 4-pole, 50Hz low voltage electric motor [7].
10
Within today’s data, the lowest class of efficiency IE3 has been produced in the European Union. With
the new derivative of the European Union, there are different efficiency classes has been revealed such
as, IE1 (Standard Efficiency), IE4 (Super Premium Efficiency). The whole new IE5 (ultra-premium
efficiency) has been under research. Here, the necessity to design these models because, the aim is to
develop highly efficient motor with cheaper option and to improve the performance of the motor by
doing changes with rotor design.
1.2 Problem statement With the major utilization of an induction motor in the industries and household purpose, these induction
motors have major losses. These losses result in lower efficiency of the electrical machine and it can
contribute in the emission of Co2, which could be the reason for the environmental problems such as
global warming and it is not a better way for the sustainable development of an environment.
Losses in the IM caused by the copper winding in the rotor part, friction while rotating, electrical losses.
But, losses which are produced because of rotor winding called copper losses. So, these copper winding
can be removed from the rotor and by this way the rotor copper losses can be reduced. Also, for better
torque density and higher efficiency permeant magnets can be accommodated.
From the previous studies of thesis “start capability of industrial synchronous motor with high
efficiency”, it was observed that the majorly used induction motor can be replaced by the high efficient
synchronous motor with the self-starting property. The idea was raised in the mind to do the further
investigation with the steady state and transient operations.
As, it was also noticed that the synchronous reluctance motor has less losses compared to the induction
motor because of less material consumption and not having copper winding in the rotor part. Also, it has
more advantages such as less heating, higher efficiency, better torque density. So, the synchronous
reluctance motor was taken for this research.
There are certain developers who developed the synchronous reluctance motor such as ABB and
SIEMENS. These motors fulfil all the requirements such as higher efficiency, low cost. But, these motors
are not self-starting. So, there is a need of any external drive to start those motors. To overcome this
problem, hybrid construction of motor should be required. So, these self-starting properties of the motor
could be achievable by combining the induction motor and synchronous motor. So, with this hybrid
arrangement of the motors both higher efficiency and self-starting of the motor can be achieved without
any external source.
11
This type of motor can be utilized for the different constant speed application in industries and it can
replace the small and the medium size of the motor. Which results an overall reduction of Co2 emission
every year.
So, the induction motor is considered as a benchmark model of study, and additional two designs of line-
start synchronous reluctance motors are introduced with different rotor configuration.
In addition, for more better results and better performance one of the possible alternate option is to insert
the permanent magnets in the hybrid constructed motor with cage winding. So, the magnets were
accommodated in the air barriers of the rotor. With these specifications, the all new line-start permanent
magnet synchronous reluctance motor is introduced with again two different rotor configurations. These
types of motors can start as an induction motor without any external source. Which excludes the cost of
external drive so, still these models are cheaper option for the replacement of an induction motor.
For the optimization of the performance the additionally designed four different line-start synchronous
reluctance motor and line-start permanent magnet synchronous reluctance motors are simulated and
tested for steady-state analysis, transient analysis to test the performance of the operation and magneto
static analysis is performed to obtain the magnetic quantities of the models and compared with the
benchmark three-phase induction motor.
1.3 Objectives
➢ To study the specification of 20kW three phase induction motor with 4-pole and 50Hz
configuration.
➢ To simulate and predict the performance of a three-phase induction motor as a benchmark design.
➢ To introduce the line-start synchronous reluctance motor comparable with the three-phase
induction motor.
➢ To simulate the introduced designs of line-start synchronous reluctance motor with two different
rotor configurations, without changing the stator of the motor.
➢ To improve the performance of the line-start synchronous reluctance motor, introduction to the
additional two designs with the permanent magnets accommodated in the rotor flux barriers and
design of line-start permanent magnet synchronous reluctance motor with the same curve and
line shape of flux barriers.
➢ To simulate and analyze the newly introduced model to check the performance with different
loading condition by performing steady-state, transient and magneto static analysis and

12
comparison with the benchmark model to validate the obtained results in terms of improvement
in power factor and efficiency of the motor.
1.4 Methodology In this research, the primary step was to study designing and simulating of electrical machine using
Ansys Maxwell 2D. Software used in the research were ANSYS Maxwell 2D, RMXprt, because of its
industrial standard accuracy. So, in the first step of the research, the 20kW , three-phase, 4-pole, 50Hz
induction motor was selected for the parameter and specification study in RMXprt to obtain the design
variable. After the study of the specification of the motor, it was designed in Maxwell 2D for the
performance analysis by using the finite element method. This benchmark induction machine was taken
from the previous paper. After the designing of induction motor, the performance results were obtained
from the simulation of the model. And the modern design of the line start synchronous motor was
predicted because of its bunch of advantages against induction motor. Again with help the parametric
analysis the line-start synchronous reluctance motor was designed using Maxwell 2D. and it was
simulated and the performance results were obtained in the form of graphs. In order to determine more
efficient design and better performance again with the parametric analysis the design of line-start
synchronous reluctance motor was modified. This modification was only kept limited to the rotor by
adding the magnets in the flux barriers but the stator part is remained same in the whole research. These
additionally designed two models of the line-start permanent magnet synchronous reluctance motor was
simulated for the same magneto static, steady state analysis and transient analysis. At last all the obtained
results were compared with the benchmark model and optimization of the better performance of the
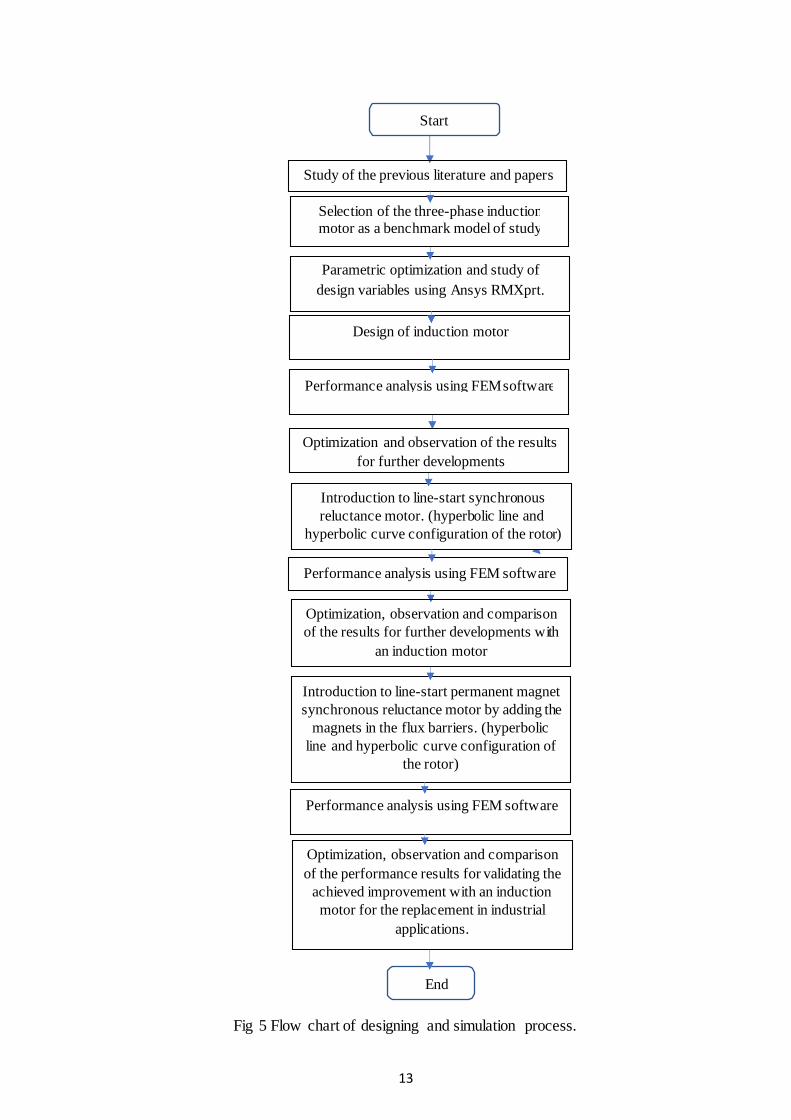
motor was validated in terms of power factor and efficiency. Here, the flow chart in the figure 5 shows
the brief designing process of motors.
13
Start
Study of the previous literature and papers
End
Optimization, observation and comparison
of the performance results for validating the
achieved improvement with an induction
motor for the replacement in industrial
applications.
Fig 5 Flow chart of designing and simulation process.
Parametric optimization and study of
design variables using Ansys RMXprt.
Design of induction motor
Selection of the three-phase induction
motor as a benchmark model of study
Performance analysis using FEM software
Optimization and observation of the results
for further developments
Introduction to line-start synchronous
reluctance motor. (hyperbolic line and
hyperbolic curve configuration of the rotor)
Performance analysis using FEM software
Optimization, observation and comparison
of the results for further developments with
an induction motor
Introduction to line-start permanent magnet
synchronous reluctance motor by adding the
magnets in the flux barriers. (hyperbolic
line and hyperbolic curve configuration of
the rotor)
Performance analysis using FEM software

14
1.5 Limitations and scope
In this research, designs were developed in 2D and most of the simulations are performed in Maxwell
2D. The limitation of this research is that, if all the models were designed in 3D, it becomes more
computationally expensive nature. But, still in 2D design the radial flux machine gives better
performance on the other side due to the limitation of the time Maxwell 3D is not used in this research
because it takes more time and the storage space. In Maxwell 2D, there is not much difference in the
designing and the accuracy of the results while simulating small and medium size machines. And due to
the limitation of the device used, major results of the thesis are simulated in Maxwell 2D.
The experimental testing of the motor can be more expensive because of its fabrication cost and material
cost. So, these models are tested analytically with the help of FEM and analytical software.
On the other side, the scope of this project includes the performance analysis and designing of the models
for examine the effect of change in flux density within the newly constructed rotor parts of the line-start
synchronous reluctance motor and the effect of flux linkage when the magnets are inserted. For the
further testing, at least new combination of the magnet accommodation should be developed for
simulation and it is expected for the better power factor and efficiency of the machine for the scope of
the research.

15
1.6 Thesis outline
Chapter 1: Introduction Chapter 1 consist of an overall background of the project. In this chapter, the problem statement,
methodology, limitations of the project and further scope of the project has been described. The thesis
outline is the last part of the chapter.
Chapter 2: Literature Review Chapter 2 gives a literature review in which, the previous papers and researches used as the guiding
lights of this research and some selected areas in which the best contribution can be made. It also includes
the brief information on the different papers related to the line-start synchronous motor and line-start
permanent magnet synchronous reluctance motor. Finally, this chapter ends with the gap statement with
the information of gap from the previous research and the contribution to that researches.
Chapter 3: Design Aspects and Specifications Chapter 3 stands for the design aspects and the specification used for designing the electrical machine.
It gives the step by step evolution of the designing process of the motors. And this chapter ends with the
proposed designs of line-start synchronous reluctance motor and line-start permanent magnet
synchronous reluctance motor.
Chapter 4: Simulation parameters and Analysis Chapter 4 elicits the information about the explanation of the software used to simulate the designed
models and the simulation parameters used for this research and it also includes the magnetostatic
analysis of the proposes models. In addition, this chapter also focus on the steady state and transient
analysis of the designed models. This chapter ends with the results of the analysis.
Chapter 5: Results and Discussion This chapter 5 includes the detailed description of the results. And it shows, how the purposed designed
models outperform the induction motor. This chapter ends with the comparison of the results obtained
from testing and simulation.
Chapter 6: Conclusion and Future Work Chapter 6 shows the conclusion derived from the comparison of the results. And this chapter ends with,
what future implementation can be done in the research in the future work based on the results of the
project.

15
Chapter 2
Literature Review

16
2.1 Introduction
There are several researches carried out throughout the last 10 years. Because of different researches on
electrical machine, there are different unique designs of the motors are invented. All of those new
innovated designs carry its advantages and disadvantages. Basically, there is not any standard method
decided for the design process or approach. But, there are several different paths for the optimization of
designing the electric motor. In this chapter, the review starts with the discussion of the previous papers,
which are contributing for the design of the synchronous reluctance motor also, it includes the different
analysis methods used by the researchers in the designing of line start motor and permanent magnet
assisted synchronous reluctance motor. In the second part of the chapter the research gap is illustrated.
2.2 Induction motor There are vast range of papers that uses different methods of the electrical machine design. But, from all
of them there are limited with the broad ideas of designing. Juha, Tapani and valeria [8] provides the
huge theoretical background with the mathematical equations to design the rotating electrical machine.
It also provides the huge amount of basic and detailed information for the different segments to focus on
while designing the electric machine such as, winding of the machine, analytical calculation of flux lines,
airgap, inductances in their book ‘design of Rotating Electrical machines’.
Also, there is one more source that gives the actual ideas of designing the induction motor with the
explanation of different useful parameters such as, in the construction part the stator and rotor design,
shaft and frame design. Then selection of the flux density, estimation of the main dimensions, the length
of machine, airgap length and the detailed information is provided including losses calculation and
estimation of the performance of the induction motor written by K.G Upadhyay [9].
Jalila, Naourez, Mourad, Rafik and Moez [10] presents their study with the two assorted designs of the
induction motor with two different topologies and the focus of the paper is specifically on the slot shape
of the induction machine. The analysis used in this study to test the performance of the induction motor
is finite element method. And also, tested the induction motor with different loading conditions. In
conclusion, It was concluded that the round shape of the slots are better than the rectangle shaped rotor
slots, which improves the sinusoidal flux lines.
Leonard, Alecsandru, Adrian, Margareta amd Ovidiu [11] provide a good example of designing the
induction motor and the performance analysis of the induction motor. The motor designed in this study
is the high-powered motor with the rated output power of 631kW, 4-pole, 50Hz. The rotor used for the
motor is the dual cage rotor which results decrease in the starting current and high pill-up torque. For
designing of the motor finite element method is used to check the magnet circuit of the motor and flux

17
paths in the different areas. This study concludes with the better performance results as proposed low
starting current and high pull-up torque.
Afaque and Vaibhav[12] gives the study on the investigation of the three phase induction motor using
finite element method for the power quality improvement. The rotor winding of the induction is in focus
in this study. Here, in this study the standard inductance motor is selected as a benchmark and with the
different combinations of the material used in the rotor winding, two unique windings are invented. And
for the rotor. The method used for the analysis is the same finite element analysis. This study concludes
with the better power factor and the losses of the rotor has been reduced and the efficiency has made an
improvement in the proposed design of the motor.
2.3 Line-start synchronous reluctance motor In the design of line-start synchronous reluctance motor, there are several papers which provides a huge
scope of designing aspects. So, in this type of motor, Samad, Mortaza and Nicola [13] focus on the
optimization of the flux berries of the line-start synchronous reluctance motor by using the
electromagnetic design procedure. They have used the automatic optimization algorithm for designing
the arc shaped and trapezoidal shaped flux barriers. After designing those models, to obtain the
performance results, Finite Element Method was used. In addition, permanent magnet assisted motor
design was also developed and analysed. This study concludes with the revision of the design procedure
and the arc shaped rotor design was validated with the better performance in terms of efficiency and
magnetic saliency.
Emeka s. obe [14] describe the performance of the line-start synchronous reluctance motor with the study
of motor. In this study, the rotor saliency was considered as a key point. The study was undertaken with
the reference of induction motor. The developed model of the line-start synchronous motor is having the
same cage as an induction motor with the aluminium bars inside it. The method used to perform this
analysis is finite element analysis and the results were derived in terms of efficiency and power factor.
The machine used in this study is having 2231 W rated output power, rated speed of 1500 rpm, 398 V.
Also, the model was tested with the prototype machine. At the end, it concludes that the line-start
synchronous motor counterpart the induction motor in terms of power factor and efficiency.
Daniel and Mathias [15] focus on the starting of the line-start synchronous reluctance motor, this study
shows the optimization of the line-start synchronous reluctance motor with two diverse types of rotors.
This study includes the study of 20kW motor, with 4-pole and 50Hz configuration and tested the rotors
by filing them with the aluminium with the finite element analysis. It is concluded with the better start-
up of the motor and in order to the performance analysis the line-start motor outperform the same size
18
of the induction motor and the variation in the amount of aluminium filled in the flux barriers does not
affect the performance of the motor.
Damian, Mykhaylo and Bogomir [16] used the geometry based equation for designing the rotor of line-
start synchronous reluctance motor. The aim of this study is the online starting performance of the
machine. The designed model is having the rated voltage of 210V and 1500 rpm. And to test the
performance of designed model the steady state and the transient analysis was performed with the help
of finite element method. This study concludes with the different material testing in the start-up of the
motor and the torque characteristics were analysed and the model was tested with the different
mechanical loading condition conclude with the better torque density.
Q. smit, A. Sorgdrager and R. wang [17] focus on the design and the optimization of the line-start
synchronous reluctance motor. The standard 2.2kW, 525V, 4-pole 3 phase induction motor was selected
as a benchmark model. For the designing process the stator part of the model kept same as reference
motor. The flux barriers were optimized by assuming the magnetic field contained by the stator and it
developed three unique designs of the synchronous reluctance motor. The cage bars kept same as a
referenced induction motor. This study concluded with the finite element analysis to check the
performance of operation and it was concluded that the line-start synchronous reluctance motor can
replace the induction motor in terms of the cheaper alternative of the induction motor with the better
efficiency. And also, better for the economical production as induction motor.
2.4 Line-start permanent magnet synchronous reluctance motor In this part of the review there are not much literature available for the permanent magnet with the line-
start capability. So, the papers used are more related to the permanent magnet assisted synchronous
reluctance motor. So, Wanzhen, Gaangqiang, Li and Yan [18] describe the rotor design optimization of
the permanent magnet assisted synchronous reluctance motor with the ferrite magnets. In this study the
motor was designed with the optimization of the flux barriers by deriving the distance between the
adjacent poles, ratio of flux barrier width to iron sheet width. And the designed model was analysed for
its torque nature with the help of finite element method. This paper contributes in the optimization of the
flux barriers and the techniques for the accommodation of the permanent magnet on the rotor.
Stjepan, Damir and Marinko [19] made the comprehensive approach for designing the permanent magnet
assisted synchronous reluctance motor. Also, prototype model is designed for the 100 kW and analysed
using finite element method. But, there is not much novel about analysis from this study.
Robert, Hamid [20] describe the design and comparison of an optimized permanent magnet assisted
synchronous reluctance motor. This study focus on the 7.5HP, 4-pole, 460V electrical machine. Before
developing the machine the reference induction motor was analysed and studied for the improvement of

19
LD and LQ using the flux linkage computation. The method used for performance analysis is finite
element method in 2D software. This study gives the conclusion that, the output torque of the motor is
high with the use of same stator as an induction motor. Due to less weight the motor give very fast
response to the dynamic transient and the motor has made improvement in terms of efficiency compared
to induction motor.
Mohamed, peter, Essam [21] presents the evolution of synchronous reluctance motor with and without
permanent magnets and performance analysis. In this study also, one design was taken as a reference
design. The machine was developed for 4-pole, 36 slots for study. With the help of magnetostatic
analysis, the study of flux paths and density on the different areas of the geometry is carried out. With
the help of that analysis, q-axis and d-axis representation was carried out and the method used for the
performance analysis is finite element method software. In the result of this study it has been concluded
that the notable increment has been done in the power factor and efficiency of the machine.
Dong-Hoon, Yunsang, Ju and Chang sung [22] focus on the study of optimal design of the permanent
magnet assisted synchronous motor loading ratio for getting the ultra-premium efficiency. In this study,
first the induction motor was selected as a representative industrial method. This study presents that the
stator and the rotor of this motor has been developed with the response surface method. And tested with
the finite element analysis. The motor has the rated output power of 2.2kW, reted speed of 1800 rpm for
this study. The performance results derived using the software simulation as well as prototyping. This
study concludes with the ultra-premium efficiency of the designed motor and it can replace the induction
motor.
2.5 Gap Statement From the literature review of the specific design of the synchronous reluctance motor has obtained the
area, where the special contribution can be made. From the review, it has been identified that most of
the papers are focus on the design of the line start synchronous reluctance motor. And there are few of
them which contributes for the load test at different values. Also, there is not much research done in the
permanent magnet synchronous reluctance motor with the line-start capability. So, with the benchmark
induction motor the study of the parametric optimization can be done and the line-start synchronous
reluctance motor can be developed and also with the prediction of the better performance the rotor cage
and the permanent magnets can be accommodated in the rotor. So, the new design can be done on the
line-start permanent magnet assisted synchronous reluctance motor and the transient and steady state
performance analysis in FEM (finite element method) software.

20
2.6 Contribution The aim of project is to develop the design of high efficiency synchronous reluctance motor with the
better efficiency and power factor. And the design is proposed to be self-starting, with hybrid
construction of the rotor with the combination of the induction motor and synchronous reluctance motor
using the same type of stator. The analysis is performed in order to get the performance results of the
motor design in different loading conditions and to obtain the magnetic circuit operation throughout the
machine.
21
Chapter 3
Design Aspects
22
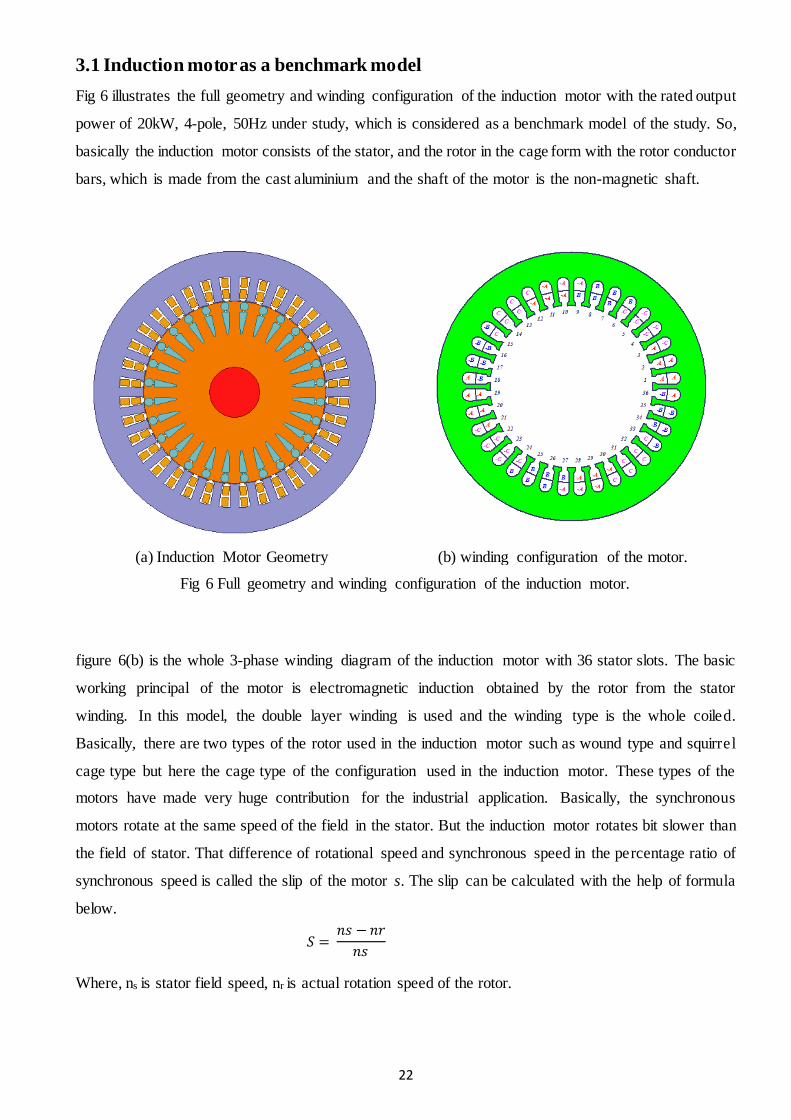
3.1 Induction motor as a benchmark model
Fig 6 illustrates the full geometry and winding configuration of the induction motor with the rated output
power of 20kW, 4-pole, 50Hz under study, which is considered as a benchmark model of the study. So,
basically the induction motor consists of the stator, and the rotor in the cage form with the rotor conductor
bars, which is made from the cast aluminium and the shaft of the motor is the non-magnetic shaft.
(a) Induction Motor Geometry (b) winding configuration of the motor.
Fig 6 Full geometry and winding configuration of the induction motor.
figure 6(b) is the whole 3-phase winding diagram of the induction motor with 36 stator slots. The basic
working principal of the motor is electromagnetic induction obtained by the rotor from the stator
winding. In this model, the double layer winding is used and the winding type is the whole coiled.
Basically, there are two types of the rotor used in the induction motor such as wound type and squirrel
cage type but here the cage type of the configuration used in the induction motor. These types of the
motors have made very huge contribution for the industrial application. Basically, the synchronous
motors rotate at the same speed of the field in the stator. But the induction motor rotates bit slower than
the field of stator. That difference of rotational speed and synchronous speed in the percentage ratio of
synchronous speed is called the slip of the motor s. The slip can be calculated with the help of formula
below.
𝑆 = 𝑛𝑠 − 𝑛𝑟
𝑛𝑠
Where, ns is stator field speed, nr is actual rotation speed of the rotor.
23
The torque of a three-phase induction motor is proportional to the flux per stator pole, rotor current and
the power factor of the rotor so, the torque formula of the induction motor can be,
T = K1E2I2 cos ϕ2
Where, K is the constant, I2 is the current of rotor at standstill condition, ϕ2 angle between rotor current
and rotor EMF and E2 is the rotor EMF at stand still condition.
Now, the maximum starting torque of the induction motor can be defined as,
𝑇𝑠𝑡 = 𝐾2 R2/ (𝑅22 + 𝑋22)
Where, R2 is the rotor resistance per phase and X2 is the rotor reactance at standstill condition. And the
equation for the torque under running condition can be,
T = (𝐾1𝑠𝐸2^2𝑅2)/√ (𝑅22 +𝑠𝑋22)
T = 3/2𝜋𝑁𝑠(𝑠𝐸2^2𝑅2)/ √(𝑅22 +𝑠𝑋22)
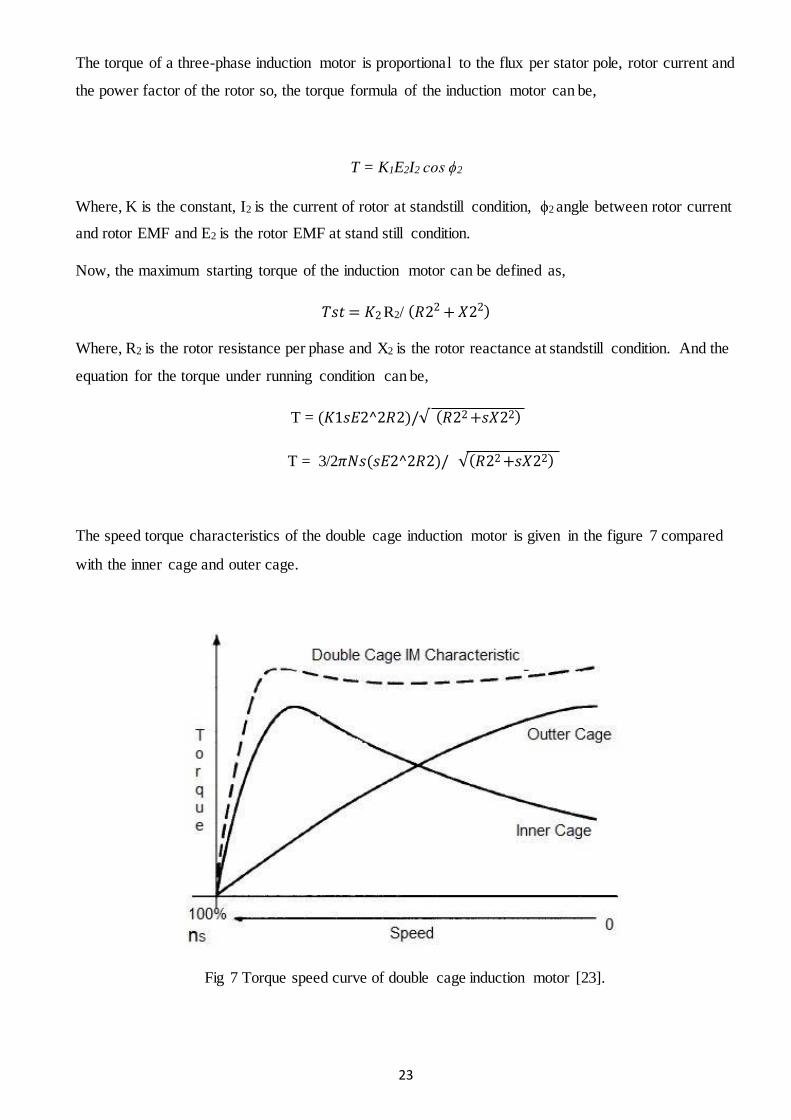
The speed torque characteristics of the double cage induction motor is given in the figure 7 compared
with the inner cage and outer cage.
Fig 7 Torque speed curve of double cage induction motor [23].

24
3.1.1 Specification of the motor under study In this part of study, the overall general specifications of the induction motor are given in the table 2.
The basic ratings of the machine are 20kW, 50Hz, 4-pole with 1470 rpm. And the operating temperature
of the machine is kept 75֯ C.
The stator of the machine has 36 slots. And the inner diameter is 254 mm and the outer diameter of the
machine is 165 mm. the material used in the construction of the core parts of the motor is M19_24G
steel. And the rotor conductors are made from cast aluminium.
On the rotor side of the machine, double cage configuration is used with 28 slots. The airgap is kept 0.55
mm. And the shaft diameter is 45mm for this induction motor. After the study of the specification the
whole geometry is built for the optimization of the performance results with the different loading
condition.
Table 2 Inductor motor specifications under study[15].
General data of machine
Given output power (kW) 20
Number of poles 4
Given speed (rpm) 1470
Frequency (Hz) 50
Operating temperature ( ֯C ) 75
Stray loss (W) 200
Type of load Fan Load
Winding connection Wye
Stator data
Number of stator slots 36
Outer diameter of stator (mm) 254
Inner diameter of stator (mm) 165
Rotor data
Number of rotor slots 28
Airgap (mm) 0.55
Shaft diameter (mm) 45
25
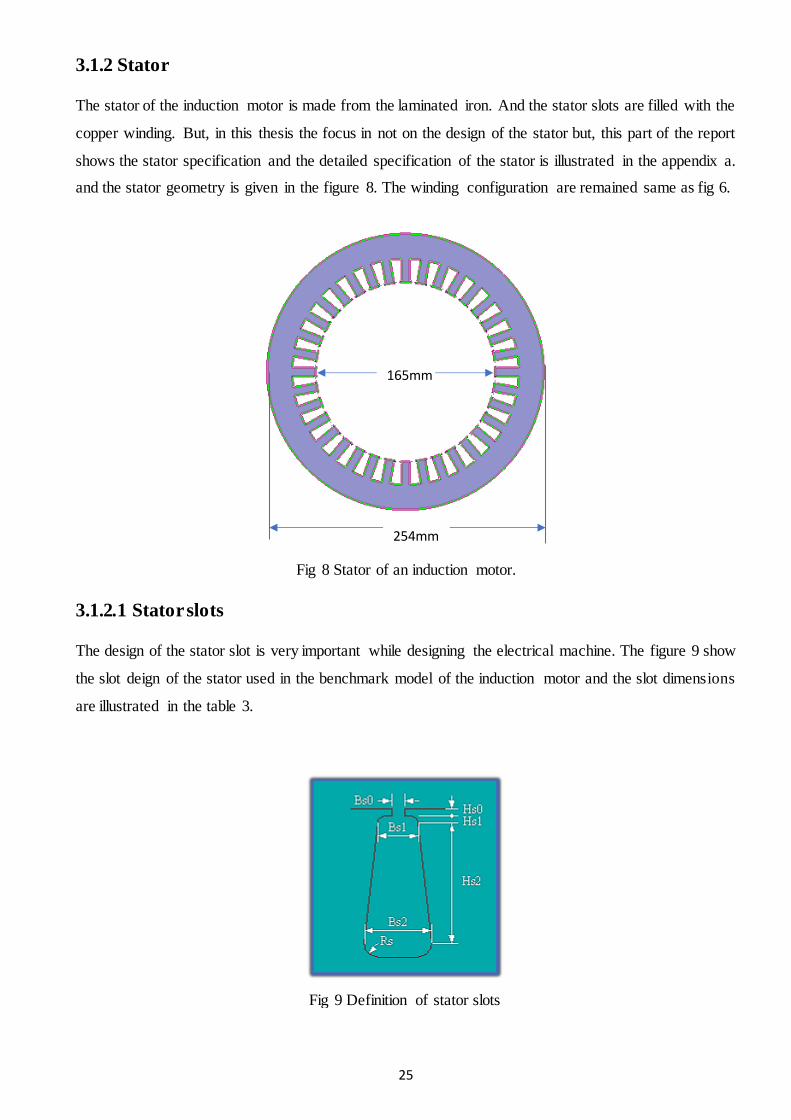
3.1.2 Stator The stator of the induction motor is made from the laminated iron. And the stator slots are filled with the
copper winding. But, in this thesis the focus in not on the design of the stator but, this part of the report
shows the stator specification and the detailed specification of the stator is illustrated in the appendix a.
and the stator geometry is given in the figure 8. The winding configuration are remained same as fig 6.
Fig 8 Stator of an induction motor.
3.1.2.1 Stator slots The design of the stator slot is very important while designing the electrical machine. The figure 9 show
the slot deign of the stator used in the benchmark model of the induction motor and the slot dimensions
are illustrated in the table 3.
Fig 9 Definition of stator slots
165mm
254mm
26
Table 3 Stator slots dimensions
Hs0 0.7mm
Hs1 0.8mm
Hs2 19.92mm
Bs0 3.9mm
Bs1 7.16mm
Bs2 10.6mm
Rs 0.2mm
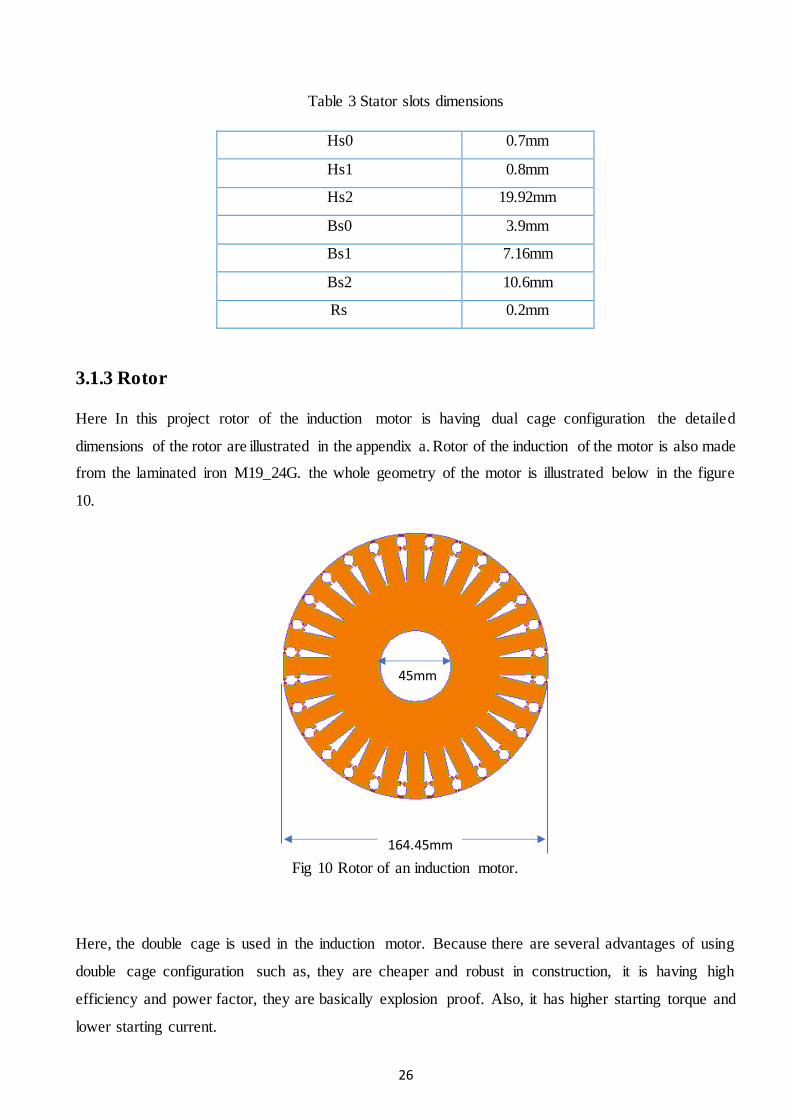
3.1.3 Rotor Here In this project rotor of the induction motor is having dual cage configuration the detailed
dimensions of the rotor are illustrated in the appendix a. Rotor of the induction of the motor is also made
from the laminated iron M19_24G. the whole geometry of the motor is illustrated below in the figure
10.
Fig 10 Rotor of an induction motor.
Here, the double cage is used in the induction motor. Because there are several advantages of using
double cage configuration such as, they are cheaper and robust in construction, it is having high
efficiency and power factor, they are basically explosion proof. Also, it has higher starting torque and
lower starting current.
45mm
164.45mm

27
3.1.3.1 Rotor slots In this rotor, the dual cage configuration is used so, there are two different slots are used. As, there are
several advantages of using the double cage rotor. One of them is, double cage rotor reduces the starting
current and the starting torque of the dual cage is higher. So, better torque density can be obtained with
the use of the double cage rotor.
The dimension of the slots is illustrated below in the table 4.
Table 4 Dual cage rotor slots dimension.
(a) Inner slots
(b) Outer slots
Hs0 0.35 mm Hs0 1.5 mm
Hs01 0.35 mm Hs1 1 mm
Hs2 0 mm Hs2 18 mm
Bs0 0 mm Bs0 2 mm
Bs1 7.5 mm Bs1 6.7 mm
Bs2 7.5 mm Bs2 2 mm
Rs 1 mm
With the help of study this bench mark model the design procedure moved on the additional design of
the proposed models. In the next part the design of the proposed models are illustrated. So, the induction
motor was designed in Maxwell 2D for the parametric optimization.
3.2 Design of line start synchronous reluctance motor Basically, synchronous reluctance motor has the same number of slots on its stator and rotor. So, with
the help of flux line analysis the flux barriers are designed. These barriers can direct the magnetic flux
so, the axis which is between two flux barriers can be identified as direct-axis of the motor.

28
Fig 11 study of flux line travelling path on solid core rotor.
The synchronous reluctance motor is having generally 4 and 6 poles. Rotor of the motor is made from
the laminated iron so, it has not any current conducting part. So, the rotor losses can be minimal in
comparison with induction motor. So, with the help of this path orientation the approximation on tracing
the flux barriers can be made.
But, these motors once start at synchronous speed it is operating on sinusoidal voltage. So, the variable
frequency drive can be required for the speed control of the motor.
On the other side, for the constant speed application the new idea is introduced to add cage in the rotor
part, so it can achieve the line-start capability. So, the designing method of the line-start synchronous
motor is described in detail in further.
3.2.1 Optimization of rotor design with two distinct aspects For designing the rotor, the basic step is to study the distribution of the flux line on the core. So, the flux
representation was checked and the approximate analysis was carried out for the design of the flux
barriers on the rotor.
In the second step of the design, the approximation of the placement of the flux barriers was made as the
q-axis flux is blocked by the barriers and the d-axis flux should not much affected. In addition, the
optimization of the width of the flux barriers is very important. The whole phenomenon of the width is
decided from the approximation of the flux line representation. Basically, it depends on the air/ iron
ratio. And the performance of the synchronous reluctance motor depends on the saliency ratio which is
defined as,
𝜉 =
𝐿𝑑
𝐿𝑞
Where, Ld inductance along direct axis, Lq inductance along quadrature axis.

29
The reluctance torque is generally affect the ferromagnetic part placed in the magnetic field, which force
the object to line up with the magnetic field. The external magnetic field produces the magnetic field in
the object so, the torque is produced. Because of this generated torque, the object is twisting around the
line with the magnetic field this torque is also called saliency torque. Reluctance motor operation relay
on the reluctance torque. The equation of the reluctance torque can be given by,
𝑇𝑟𝑒𝑙 = 𝑘 (𝑣
𝑓)
2
∗ sin(2𝛿𝑟𝑒𝑙)
Where, Trel = Average reluctance torque, V is the applied voltage, δrel is the electrical degrees and k is
the motor constant.
The barriers are designed with two different shapes such as, hyperbolic curve shape and hyperbolic line
shape. The design dimensions of these two assorted designs are illustrated below. The stator of the line-
start synchronous reluctance motor is kept same as much as possible in terms of parameters. So, the only
change is done with the rotor of the motor.
As, the synchronous motors are not having the line-start capability. So, the aluminium cage is inserted
in the rotor with the help of 2D software. So, the overall parameters and definition of the motor is given
in table 5.
Table 5 Line-start synchronous reluctance motor.
Motor parameters Data
Outer diameter of the rotor (mm) 164.45
Diameter of the shaft (mm) 45
Number of barriers, k 4
Bottom radius of the barriers Rb (mm) 29.35
Bottom thickness of the barriers Bo(mm) 9.6
Bottom yoke thickness, Yo(mm) 9.825
Thickness of bridge H(mm) 0.5
Aluminium outer radius, rout 78.25
Aluminium inner radius rin 70
Shape of barriers Hyperbolic Curve,
Hyperbolic Line

30
(a) Hyperbolic-Curve rotor barriers. (b) Hyperbolic-line rotor barriers.
Fig 12 Line-start synchronous-reluctance motor.
For getting more better performance these motor models are modified by inserting the magnets in the
flux barriers. So, the modification and the design optimization of the motors is described in the next part
of the report.
3.3 Design of line-start permanent magnet synchronous reluctance motor. Basically, there is not much research done on this kind of the motor. So, the previous papers on
permanent magnet synchronous reluctance motor are studied for finding the better way to insert the
magnets in the flux barriers. So, basically these magnets saturate the rotor bridges, which can be helpful
to increase the torque density and the power factor of the motor. Also, the reluctance torque of the motor
increases.
3.3.1 Permanent magnet
The magnets selected for these motor design is NdFe30 because these magnet material is majorly used
for the permanent magnet motors. These types of magnets are commonly available. And the different
properties of the magnet used in this motor is illustrated below, in the table 6. And table 7 shows the size
of the permanent magnets.

31
Table 6 properties of the permanent magnet.
Magnet Properties
Magnet Type NdFe35
Relative Permeability 1.0997785406
Bulk Conductivity 625000 siemens/m
Magnet Coercivity -890000 A/m
Mass density 7400 kg/m^3
Table 7 dimensions of the Magnets.
Motor Type NdFe35 Magnet size (mm)
Mag 1
(Barrier 1)
Mag 2
(Barrier 2)
Mag 3
(Barrier 3)
Hyperbolic curve (LSPMSynRM) 9.6mm 7.2mm 6.2mm
Hyperbolic line (LSPMSynRM) 9.6mm 7.2mm 6.2mm
So, after the orientation of the magnets in the rotor the final design of the motor looks like fig 13. Which
is having the same stator as the benchmark model and the rotor is having the permanent magnet and the
aluminium cage.
(a) Hyperbolic-Curve rotor with magnets.
(b) Hyperbolic-line rotor with magnets.
Fig 13 final design of the line-start permanent magnet synchronous reluctance motor
Finally, all the designed models were simulated for testing the performance in different loading
condition. So, the simulation and parameters and testing are illustrated in the next chapter of the report
and furthermore, all the obtained results are described and compared with the results of the reference
induction model.
Chapter 4
Simulation and Parameters
33
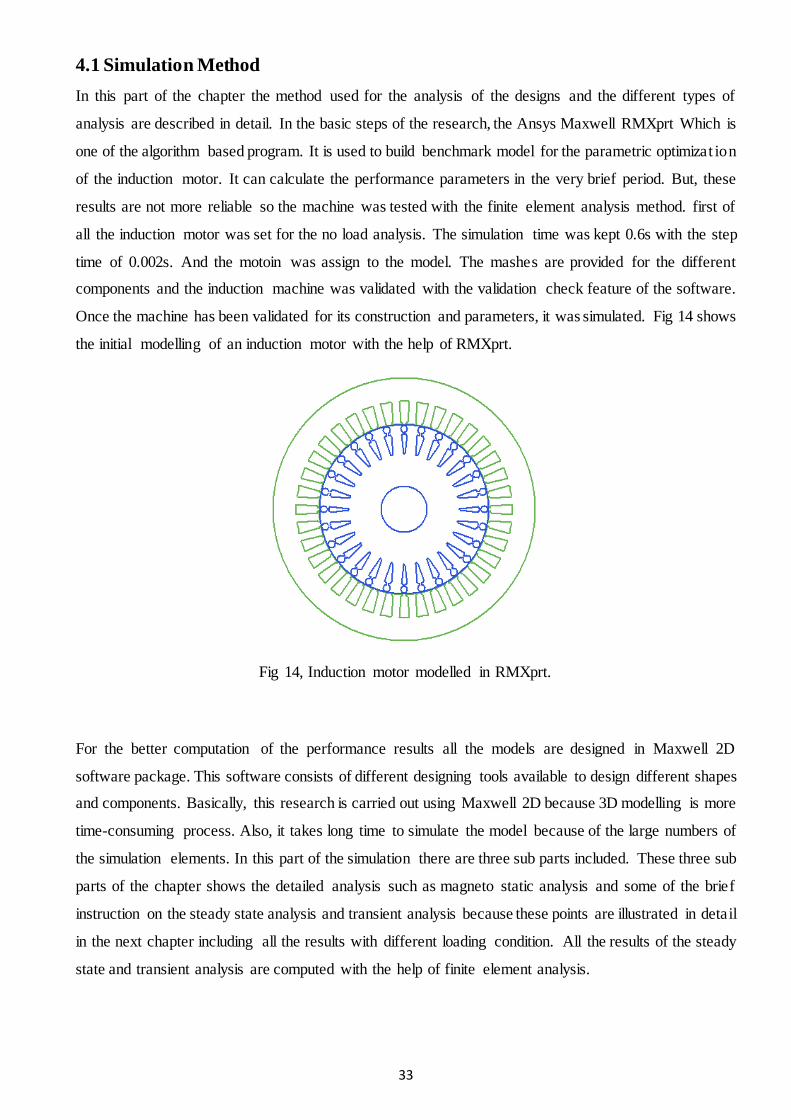
4.1 Simulation Method
In this part of the chapter the method used for the analysis of the designs and the different types of
analysis are described in detail. In the basic steps of the research, the Ansys Maxwell RMXprt Which is
one of the algorithm based program. It is used to build benchmark model for the parametric optimizat ion
of the induction motor. It can calculate the performance parameters in the very brief period. But, these
results are not more reliable so the machine was tested with the finite element analysis method. first of
all the induction motor was set for the no load analysis. The simulation time was kept 0.6s with the step
time of 0.002s. And the motoin was assign to the model. The mashes are provided for the different
components and the induction machine was validated with the validation check feature of the software.
Once the machine has been validated for its construction and parameters, it was simulated. Fig 14 shows
the initial modelling of an induction motor with the help of RMXprt.
Fig 14, Induction motor modelled in RMXprt.
For the better computation of the performance results all the models are designed in Maxwell 2D
software package. This software consists of different designing tools available to design different shapes
and components. Basically, this research is carried out using Maxwell 2D because 3D modelling is more
time-consuming process. Also, it takes long time to simulate the model because of the large numbers of
the simulation elements. In this part of the simulation there are three sub parts included. These three sub
parts of the chapter shows the detailed analysis such as magneto static analysis and some of the brief
instruction on the steady state analysis and transient analysis because these points are illustrated in detail
in the next chapter including all the results with different loading condition. All the results of the steady
state and transient analysis are computed with the help of finite element analysis.

34
4.2 Magnetostatic analysis Basically, FEA works with the help of meshing process. Because of that, mesh application also metters
to the accuracy of the results. The performance results of machine were derived from the simulation for
all designed models. And also with the help of magnetic analysis method, the magnetic circuit of the
rotating machine was obtained. These machines were tested for the flux density, flux linkage, and the
air-gap flux density distribution with the help of magnetic analysis.
Magneto static analysis is basically used for getting the quantities such as, magnetic field because of the
currents and permanent magnets in the machine. This analysis can be carried out for different
applications such as, motors and generators, relays, sensors and solenoids. Here, this analysis is used for
motors.
The magneto static analysis is performed for no-load and full-load conditions. In the no-load condition
there is not any mechanical load is applied to the motor and it is rotating freely. And in the full load
condition the full load value was calculated for the motor and the value of full load was applied from the
option of mechanical load application in the motion setup of the project.
For all the models, different flux density for no-load and full-load condition is illustrated in the fig 15
and figure 16 respectively. The flux lines representation is illustrated in fig 17 and 18 for the same two
loading conditions.
The other results are obtained for the vector representation of the flux destribution at the different part
of the rotating machine is shown in fig 19 and 20 with no-load and full load operating condition with the
appropriate legends. All the results are illustrated in for the rotational motion of the machines.

35
Fig 15 Flux density of all five models at No-Load.
Fig 16 Flux density of all five models at Full-Load.
From the figures, it was noticed that the magnetic flux density is high in the core part of the motors such
as rotor and stator. Here in the figure the orange and green areas represent the higher flux density and
blue areas are stand for low flux density in the machines.
With the help of magnetic flux lines representation, the magnetic circuits can be retrieved in the machine.
Here, in figure below the flux lines representation shows red colored line for the higher flux passing and
blue and green lines shows the less flux density on the flux travelling path. Also, from this representation
how the flux can be locked with the rotor and stator can be examined. Again, here there is not much
difference in the flux lines representation for both no-load and full-load condition. In the
induction motor, the flux lines passes between rotor slots to stator tooth. And for the hybrid motors it is

36
passing arround the flux barriers. In the LSPMSRM (hyperbolic curve and line) flux lines are passing
through the magnets and arround the flux barriers.
Fig 17 Flux lines representation at no load (Wb/m).

37
Fig 18 flux lines representation at full load (Wb/m).
Magnetic flux vector representation is also carried out with the all five designed models and with the
help of this plots the flow of the magnetic flux with different intensity can be identified in the different
parts of the motors. From the figures it was noticed that the vectors are uniformly distributed on the
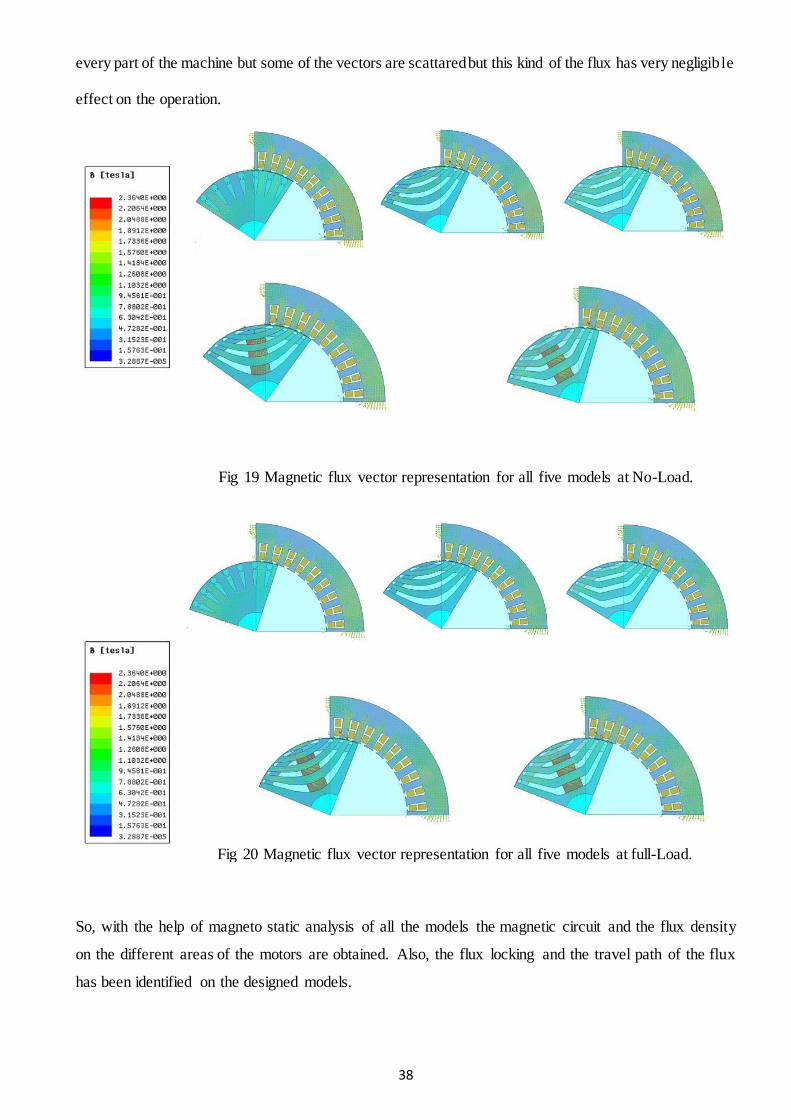
38
every part of the machine but some of the vectors are scattared but this kind of the flux has very negligible
effect on the operation.
Fig 19 Magnetic flux vector representation for all five models at No-Load.
Fig 20 Magnetic flux vector representation for all five models at full-Load.
So, with the help of magneto static analysis of all the models the magnetic circuit and the flux density
on the different areas of the motors are obtained. Also, the flux locking and the travel path of the flux
has been identified on the designed models.

39
4.2.1 Air Gap Flux Density In this part of the chapter the flux density in the airgap of the machine is illustrated. So, the amount of
flux density in the airgap can be measured with the help of this analysis. From this analysis, the idea of
the airgap length can be derived and tested for, whether it is ok or it needs any modification. It also gives
the idea about the travelling path of the flux from the airgap.
The results below shows the flux density passing through the airgap in the one segment of the machine
for all designed models for both no load and full load condition when machine is rotating. Here, the air
gap flux density is derived with the help of arc formation in the air gap and then the flux density at the
specific arc has been measured and illustrated in the plots further.
From the fig 21 it has been noticed that in the induction motor the air gap flux density at the stator slot
opening is less and the air gap flux density is increasing near the stator tooth. In the fig 21 the segment
of the induction motor shows the air gap flux density.
Fig 21 Air gap flux density in the induction motor.
Furthermore, the airgap flux density is obtained for other four proposed design which is illustrated in the
fig 22. From the results it is noticed that, the air gap flux density at no load is less than the air gap flux
density at full load for all the models.

40
Airgap flux density No-load Full load
B (Tesla)
(a) LSSynRM (Hyperbolic
Curve)
(b) LSSynRM (Hyperbolic
Curve)
(c) LSSynRM (Hype bolic
Line)
(d) LSSynRM (Hyperbolic
Line)
(e) LSPMSynRM (Hyperbolic
Curve)
(f) LSPMSynRM (Hyperbolic
Curve)
(f) LSPMSynRM (Hyperbolic
Line)
(d) LSPMSynRM (Hyperbolic
Line)
Fig 22 Airgap flux density at No-load and Full load.

41
4.2.2 Magnetic Flux Linkage The magnetic flux linkage plots shows how much flux travelling through the coils and plots for the flux
linkage for all the motors in the no load condition and the full load condition are illustrated further.
Basically the induced EMF and the derivative of the flux linkage is proportional to each other so, the
equation for that is illustrated below,
𝑒 = 𝑁
𝑑𝜙
𝑑𝑡
Where, e is the induced EMF, N= number of turns of coils and ϕ is the flux linkage.
Here, fig 23 shows the magnetic flux linkage of all the coils at no load. When the saturation takes place
in the machine the flux linkage wave form get scattared otherwise the waveforms are in the sinusoidal
shape. The reason of being scattered can be the saturation in the core. In the plot, the different phase ha
different color notations. So, when the alternating flux frequency increase as a result, the losses of the
machine get increases.
(a) LSSynRM (Hyperbolic Curve)
(b) LSSynRM (Hyperbolic line)

42
(c) LSPMSynRM (Hyperbolic Curve)
(d) LSPMSynRM (Hyperbolic Line)
Fig 23 Flux Linkage at No-Load.
From the figures above, it can be seen that there is not much difference in both of the line-start
synchronous reluctance motor and line-start permanent magnet synchronous reluctance motor. All the
waveform for the no load condition are finely sinusoidal. All the flux linkage plots are derived with
respect to time in this simulation. It shows the flux linkage during whole operation of the machine.
Here, fig 24 shows the flux linkage plots for the full load condition for the line-start synchronous
reluctance motor as well as line start permanent magnet synchronous reluctance motor.
(a) LSSynRM (Hyperbolic curve)
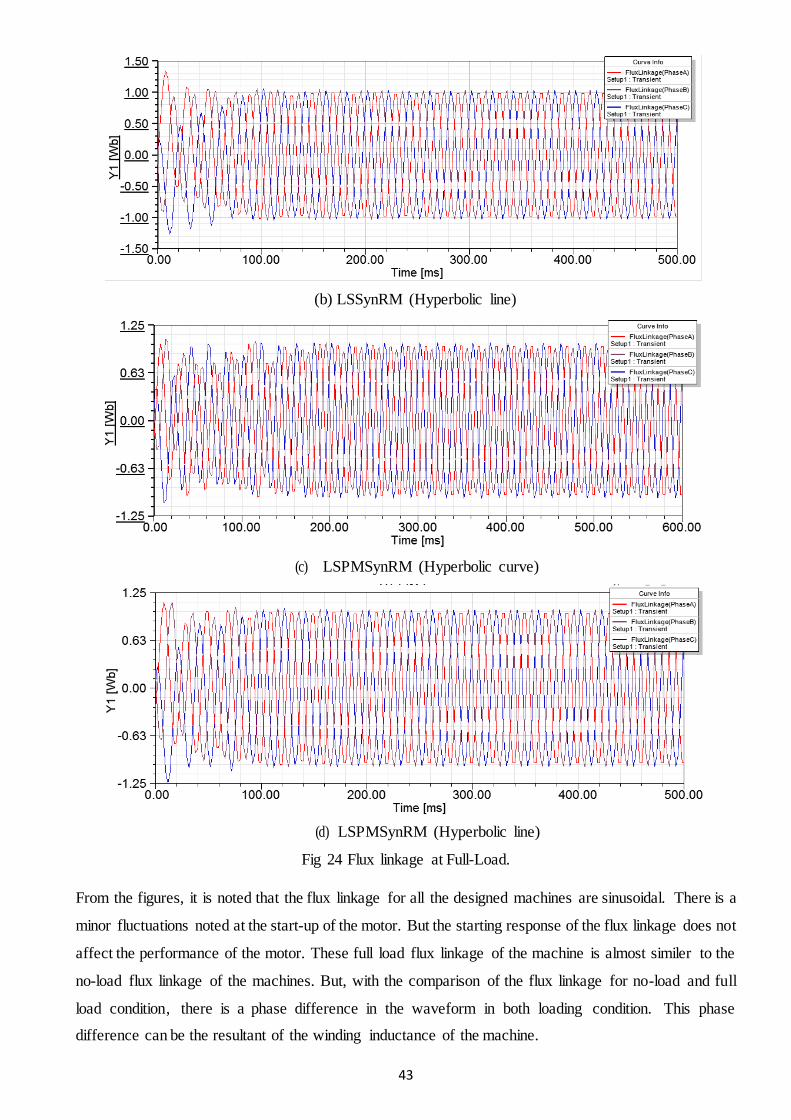
43
(b) LSSynRM (Hyperbolic line)
(c) LSPMSynRM (Hyperbolic curve)
(d) LSPMSynRM (Hyperbolic line)
Fig 24 Flux linkage at Full-Load.
From the figures, it is noted that the flux linkage for all the designed machines are sinusoidal. There is a
minor fluctuations noted at the start-up of the motor. But the starting response of the flux linkage does not
affect the performance of the motor. These full load flux linkage of the machine is almost similer to the
no-load flux linkage of the machines. But, with the comparison of the flux linkage for no-load and full
load condition, there is a phase difference in the waveform in both loading condition. This phase
difference can be the resultant of the winding inductance of the machine.

44
4.3 Summary of Magnetostatic analysis In this step of the research the magnetostatic analysis is carried out with all the machines. The magnetic
circuit of the machine is understood. With the help of field plots the magnetic flux density is measured
and the travelling path of the flux is derived.
Also, the airgap flux density for all the machine is obtained for both no-load and full load condition. The
flux linkage relationship with the EMF has been studied and it is noticed that the flux linkage plots are
finely sinusoidal for both no-load and full-load condition.

45
4.4 Steady-state analysis When the electrical machine obtains the original state, this state is called the steady state stability. So,
when the motor gains the synchronous speed the winding currents and the torque can be back to the steady
state position. So, in the steady state analysis the quantities such as winding currents, phase voltages or
the torque plots can be included. So, the steady state performance of the models is illustrated below in
the open circuit test section.
4.4.1 Open-Circuit analysis or No-load test Basically, the no load test on an induction motor is used to obtain the data of the currents and no-load
losses. While performing this test, three phase voltage is applied to the stator windings and in the no load
condition of the motor, there is not any mechanical load connected with the rotor. So, the motor can be
able to rotate freely without any blocking. At no load condition, the designed models are tested for
different parameters such as, speed, torque, input power, output power, winding currents and losses and
power factor. And from the obtained power the efficiency is calculated for the no load condition.
At last all the results for the no-load test are compared with the reference model (induction motor) and
the conclusion will be made in the next part of the report.
4.5 Transient analysis When the electrical machine is operating under the loading condition and when it is not in the steady
state condition is called the transient operation of the machine. In the transient analysis, the designed
motors are simulated with the different loading condition such as, half-load, Full-load and more than full
load. So, same as the steady-state analysis all the parameters of operation such as, speed, torque, input
power, output power, losses, power factor and efficiency under the different loading condition. But,
results for the full load condition is only illustrated in the next chapter of the report. Results for the half-
load and more than full load are illustrated in the appendix B at the end of the report.
4.5.1 Full Load Testing in this part of the simulation the motion model was modified with the full load mechanical load
application. Before testing the machines, the full load for the machine was calculated theoretically and
applied on the motor. The results for all the models are derived and captured in the form of image and
described in the next chapter in detail. All the models of the project are tested for the same parameters
as steady state analysis. In the next chapter of the thesis, all the results for the no load and full load
condition are compared and tested for their performance.

46
The summary of the models considered for the simulation is given below in the fig 25.
(a) Induction motor
(b) LSSynRM (Hyp. Curve) (a) LSSynRM (Hyp. Line)
(b) LSPMSynRM (Hyp. Curve) (e) LSPMSynRM (Hyp. Line)
Fig 25 Models considered for the simulation.

45
Chapter 5
Results and Discussion
46
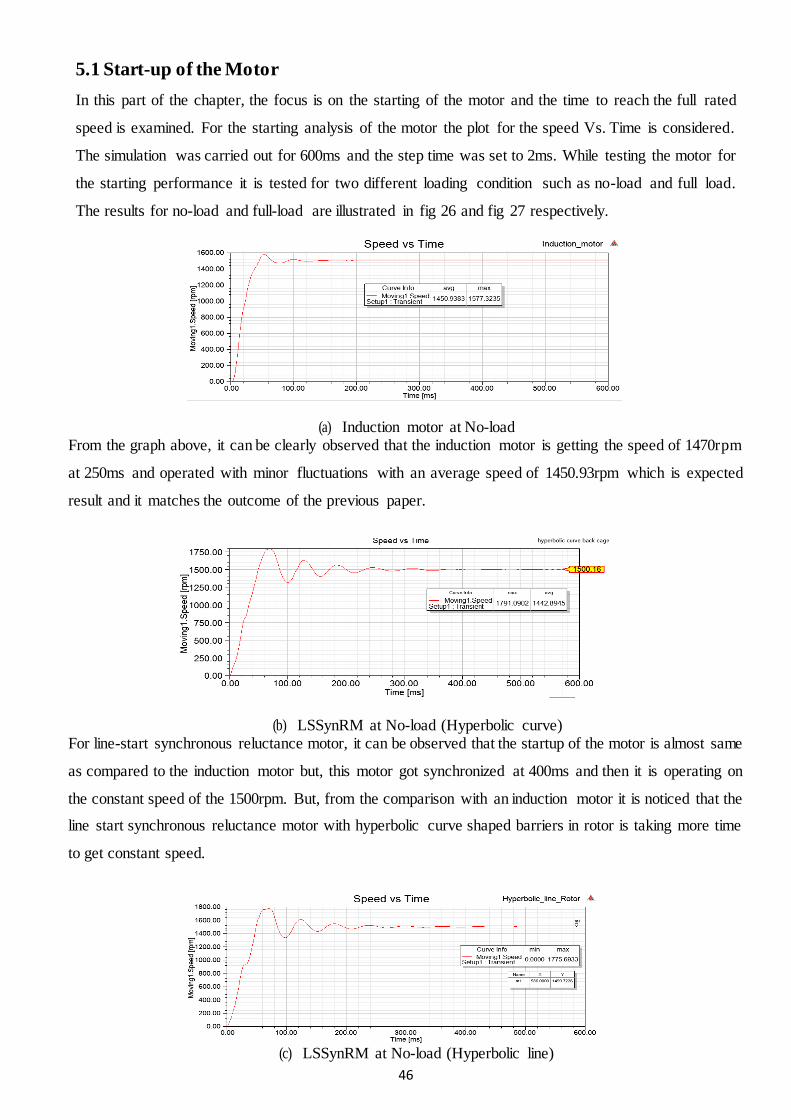
5.1 Start-up of the Motor
In this part of the chapter, the focus is on the starting of the motor and the time to reach the full rated
speed is examined. For the starting analysis of the motor the plot for the speed Vs. Time is considered.
The simulation was carried out for 600ms and the step time was set to 2ms. While testing the motor for
the starting performance it is tested for two different loading condition such as no-load and full load.
The results for no-load and full-load are illustrated in fig 26 and fig 27 respectively.
(a) Induction motor at No-load From the graph above, it can be clearly observed that the induction motor is getting the speed of 1470rpm
at 250ms and operated with minor fluctuations with an average speed of 1450.93rpm which is expected
result and it matches the outcome of the previous paper.
(b) LSSynRM at No-load (Hyperbolic curve) For line-start synchronous reluctance motor, it can be observed that the startup of the motor is almost same
as compared to the induction motor but, this motor got synchronized at 400ms and then it is operating on
the constant speed of the 1500rpm. But, from the comparison with an induction motor it is noticed that the
line start synchronous reluctance motor with hyperbolic curve shaped barriers in rotor is taking more time
to get constant speed.
(c) LSSynRM at No-load (Hyperbolic line)

47
The line-start synchronous reluctance motor is also getting speed of 1500rpm at 400ms, which is almost
same time taken by the motor with hyperbolic curve rotor configuration. In addition to that, the startup of
both the motors remained same compared to the induction motor. Because the induction motor is having
the cage type rotor construction. And the line-start synchronous reluctance motor is also having the
Aluminum cage in the rotor.
(d) LSPMSynRM at No-load (Hyperbolic Curve)
Now, in the line-start permanent magnet synchronous reluctance motor with both of the hyperbolic curve
and hyperbolic line rotor configuration the permanent magnets are used and accommodated in the air
barriers. Because of this magnets, the rotor is also having its own magnetic field. Also, these models are
less with the cage in the rotor. So, because of the magnets the motors are taking less time for the
synchronization process and synchronized and rotate on 1500rpm in 300ms which is 100ms quicker than
the models without magnets. So, these models with magnets are better startup compared to models without
magnets.
(e) LSPMSynRM at No-load (Hyperbolic Line)
Fig 26 speed Vs. Time at No-load (0Nm).
From the speed plots, it is concluded that, because of the aluminum cage the synchronous reluctance
motor start as an induction motor. There are certain transients during the start-up of the motor but at the
time of 400ms the line start synchronous motor trying to achieve the synchronous speed of 1500rpm.
Also, looking at the line-start permanent magnet synchronous reluctance motor, it is trying to get the
synchronous speed earlier compared to the models without magnets. On the other hand, the plots for the
full load operation, the plots for speed vs. Time is illustrated in the fig 27 below.
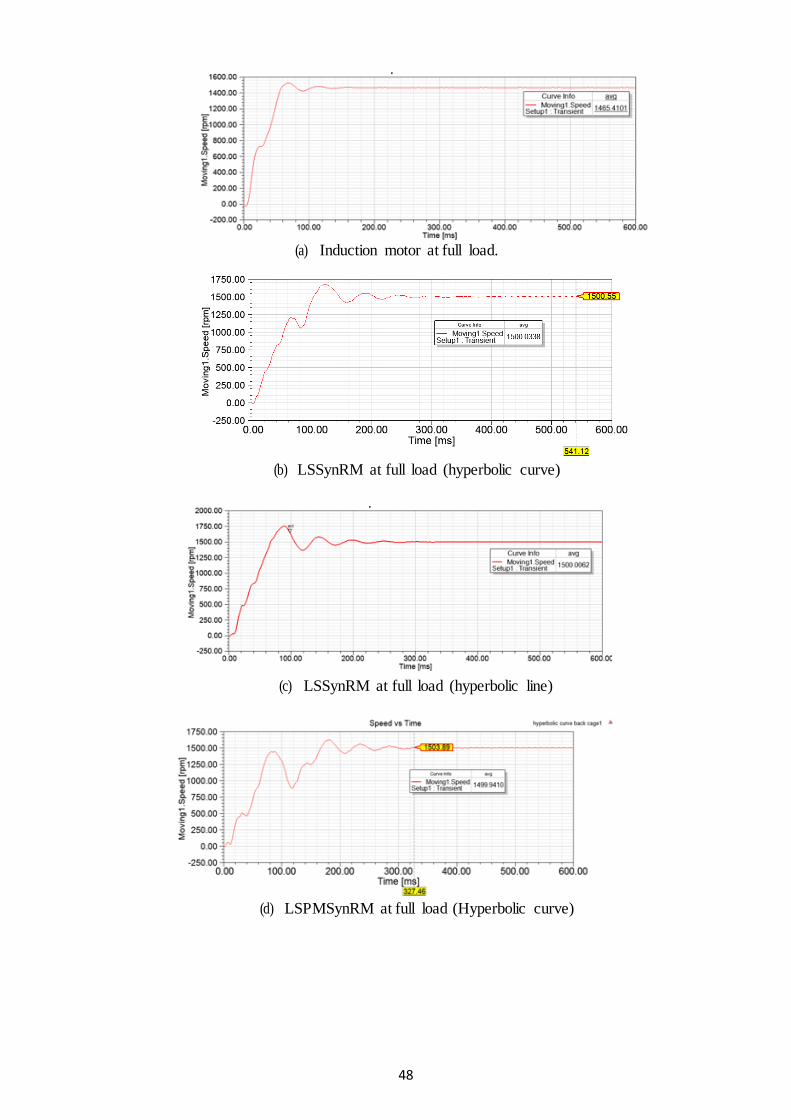
48
(a) Induction motor at full load.
(b) LSSynRM at full load (hyperbolic curve)
(c) LSSynRM at full load (hyperbolic line)
(d) LSPMSynRM at full load (Hyperbolic curve)

49
(e) LSPMSynRM at full load (Hyperbolic line)
Fig 27 Speed Vs Time at full load.
While simulating the models at full load the mechanical load of 127.38Nm is applied to the motor. And
the plots for the speed are obtained. So, from the plots at full load models of LSPMSynRM and
LSSynRM are getting speed of 1500rpm.
At full load operation, the motors are taking more time for getting synchronous speed compared to the
no-load plots. Line-start synchronous reluctance motor is taking 400ms for reaching to the synchronous
speed and the line-start permanent magnet synchronous reluctance models are also taking 350ms to
achieve the synchronous speed. So, from the observation it can be said that the line start synchronous
reluctance motor is having better performance compared to induction motor and the line-start permanent
magnet synchronous reluctance motors are better at operation compared to models without magnets and
the reference induction motor.
And, from these results it can be said that, because of the arrangement of the aluminum cage with the
synchronous reluctance motor and permanent magnet synchronous reluctance motor, models are getting
almost same starting characteristics as the reference induction motor. So, these kinds of motor can
replace induction motor in terms of the starting characteristic.

50
5.2 Winding currents In this part of the chapter the focus is on nature of the winding currents of the motors. Here, all five
models are tested for the nature of winding current. The nature of the winding current matters a lot in
the performance of the motor. Because of the same balanced flow of the winding currents for all the
models, the plots are illustrated for the different motors below in the fig 28.
(a) Winding currents for Induction motor.
(b) Winding currents for LSSynRM (Hyperbolic Curve)

50
(c) Winding currents for LSSynRM (Hyperbolic Line)
(d) Winding currents for LSPMSynRM (Hyperblic curve)
(e) Winding currents for LSPMSynRM (Hyperbolic Line)
Fig 28 Nature of winding currents.
For the better and smooth operation, the winding currents should be finely sinusoidal or balanced in
terms of phase shift and magnitude.
From the plots of the winding currents, for all the designed models the winding current waveforms are
having almost balance condition in terms of the magnitude and phase shift. The reason for having
unbalance winding currents can be the reactance of the three phases is not same as a result it causes the
unbalancing in the current, which may be effect the efficiency and the working performance of the
machine. If the motor works on the unbalanced winding current. This cause the degradation of the rotor
and the winding of the stator. That unbalancing of the motor draw more losses and the heating of the
machine.

51
Also, if the winding currents are more fluctuating, it causes unbalancing in the torque and the
unbalancing of the torque can cause the vibration during the operation, which leads to the destruction of
the machine or the system connected to it. To reduce this kind of unbalancing, the phase reactance of the
motor should be changed and the motor winding should be replaced. But, here the winding currents for
all the models are in balanced condition in terms of the magnitude and the phase shift. So, these machines
are having the better performance.
Furthermore, the torque produced by the motor is tested with the help of Torque Vs Time plots. It is
described in detail in the next part of the chapter.
5.3 Torque Produced by Machine The torque of the machine is also called the turning force through the radius of the machine. These plots
were obtained to check the starting torque of the machine and the torque produced by the machine during the
no-load and full load operation at the synchronous speed. So, the plots for Torque vs. Time is illustrated
below in the fig 29 and fig 30 for no-load and full load respectively. At no-load condition the torque in the
induction motor is 0Nm. And from the plot (a), when the induction motor reach at its full speed, the torque is
fluctuating around zero.
(a) No-load torque of Induction motor.
(b) No-load torque of LSSynRM (Hyperbolic curve)

52
(c) No-load torque of LSSynRM (Hyperbolic Line)
(d) No-load torque of LSPMSynRM (Hyperbolic curve)
(e) No-load torque of LSPMSynRM (Hyperbolic Line)
Fig 29 Torque Vs Time at No-load.
From the plots (b) and (c) of fig 29 the average torque becomes zero once the motor start running on
synchronous speed. Also, the line-start synchronous reluctance motor producing the high torque for
getting the motion and once it reached to 1500rpm, the torque becomes zero. The same reason is also
applied for the line-start permanent magnet synchronous reluctance motor and plots (d) and (e) shows the
53
torque vs time graph for LSPMSynRM.
Because of the high starting torque of the designed models, these machines can be used for the industrial
application such as cranes, rolling mills and also it can be used to run the large conveyors.
Also, the nature of the torque is tested for full load condition. So, during this simulation the full-load
value of 127.38Nm was applied in the mechanical load consideration and the machines were tested for
the same time frame.
The full load results of the analysis are illustrated below in the fig 30.
(a) Full-load torque of Induction motor.
(b) Full-load torque of LSSynRM (Hyperbolic curve)
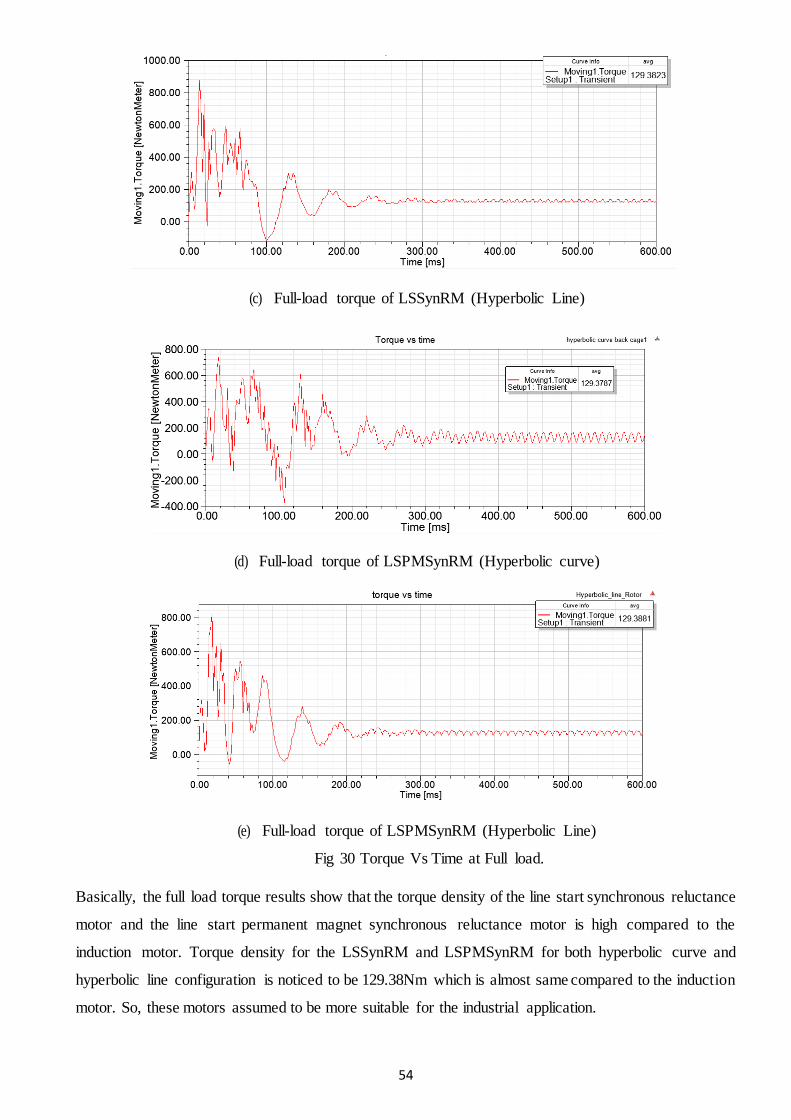
54
(c) Full-load torque of LSSynRM (Hyperbolic Line)
(d) Full-load torque of LSPMSynRM (Hyperbolic curve)
(e) Full-load torque of LSPMSynRM (Hyperbolic Line)
Fig 30 Torque Vs Time at Full load.
Basically, the full load torque results show that the torque density of the line start synchronous reluctance
motor and the line start permanent magnet synchronous reluctance motor is high compared to the
induction motor. Torque density for the LSSynRM and LSPMSynRM for both hyperbolic curve and
hyperbolic line configuration is noticed to be 129.38Nm which is almost same compared to the induction
motor. So, these motors assumed to be more suitable for the industrial application.
55
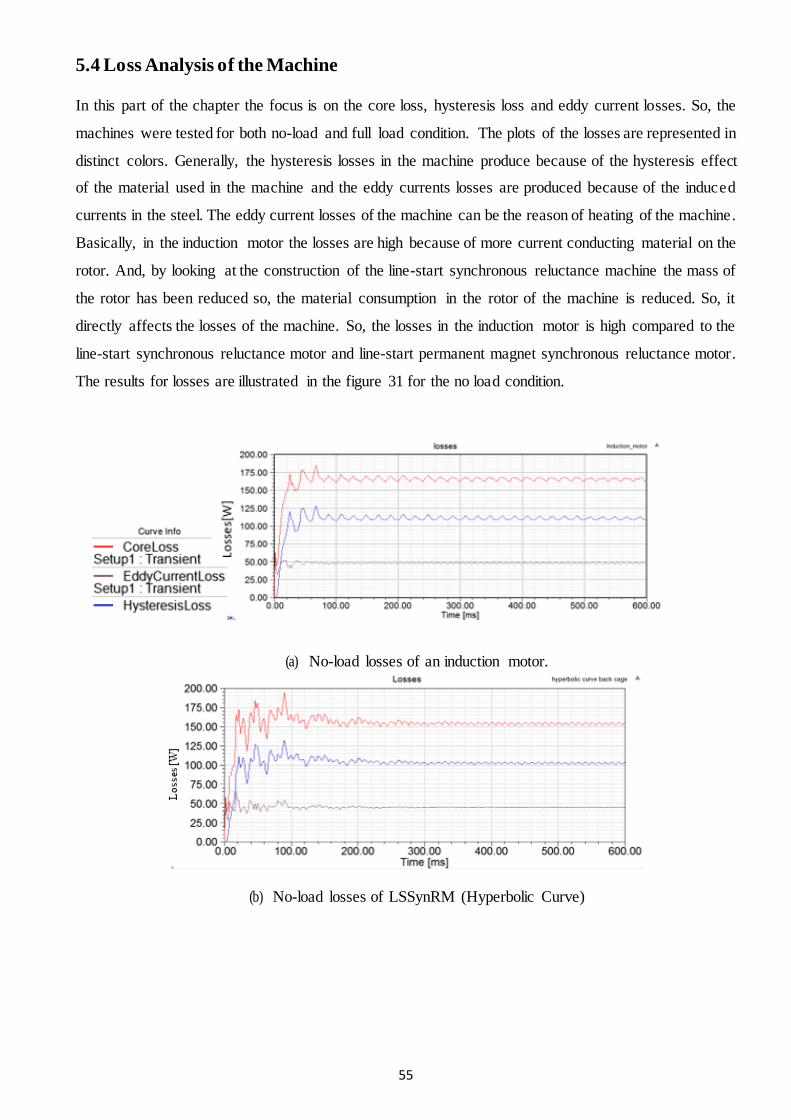
5.4 Loss Analysis of the Machine In this part of the chapter the focus is on the core loss, hysteresis loss and eddy current losses. So, the
machines were tested for both no-load and full load condition. The plots of the losses are represented in
distinct colors. Generally, the hysteresis losses in the machine produce because of the hysteresis effect
of the material used in the machine and the eddy currents losses are produced because of the induced
currents in the steel. The eddy current losses of the machine can be the reason of heating of the machine.
Basically, in the induction motor the losses are high because of more current conducting material on the
rotor. And, by looking at the construction of the line-start synchronous reluctance machine the mass of
the rotor has been reduced so, the material consumption in the rotor of the machine is reduced. So, it
directly affects the losses of the machine. So, the losses in the induction motor is high compared to the
line-start synchronous reluctance motor and line-start permanent magnet synchronous reluctance motor.
The results for losses are illustrated in the figure 31 for the no load condition.
(a) No-load losses of an induction motor.
(b) No-load losses of LSSynRM (Hyperbolic Curve)

56
(c) No-load losses of LSSynRM (Hyperbolic Line)
(d) No-load losses of LSPMSynRM (Hyperbolic Curve)
(e) No-load losses of LSPMSynRM (Hyperbolic Line)
Fig 31 Losses in the Machine at No-load.
From the plots of losses at no-load, it can be observed that the induction motor is having more loss of
158W compared to the line start synchronous reluctance motor and line start permanent magnet
synchronous reluctance motor. Also, it is noticed that the losses are reduced as the evaluation of the new
designs without magnets and with magnets compared to an induction motor.
After the no-load analysis, the full load analysis is carried out for obtaining the losses of the machines
at full-load condition, which is illustrated below in the fig 32. So, from both the figures it can be seen
that the losses in the induction motor is high and it is reduced as the new models developed.

57
(a) Full load losses of an induction motor
(b) Full load losses of LSSynRM (Hyperbolic curve)
(C) Full load losses of LSSynRM (Hyperbolic line)
(d) Full load losses of LSPMSynRM (Hyperbolic curve)
58
(e) Full load losses of LSPMSynRM (Hyperbolic Line)
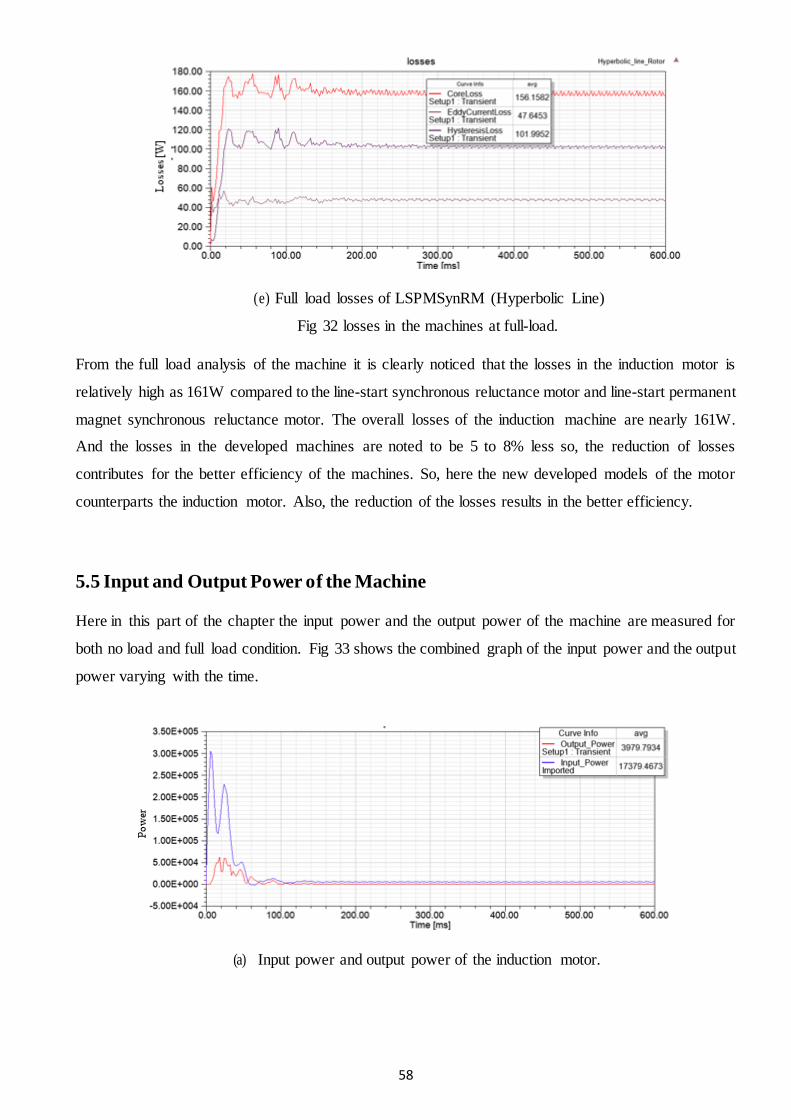
Fig 32 losses in the machines at full-load.
From the full load analysis of the machine it is clearly noticed that the losses in the induction motor is
relatively high as 161W compared to the line-start synchronous reluctance motor and line-start permanent
magnet synchronous reluctance motor. The overall losses of the induction machine are nearly 161W.
And the losses in the developed machines are noted to be 5 to 8% less so, the reduction of losses
contributes for the better efficiency of the machines. So, here the new developed models of the motor
counterparts the induction motor. Also, the reduction of the losses results in the better efficiency.
5.5 Input and Output Power of the Machine Here in this part of the chapter the input power and the output power of the machine are measured for
both no load and full load condition. Fig 33 shows the combined graph of the input power and the output
power varying with the time.
(a) Input power and output power of the induction motor.
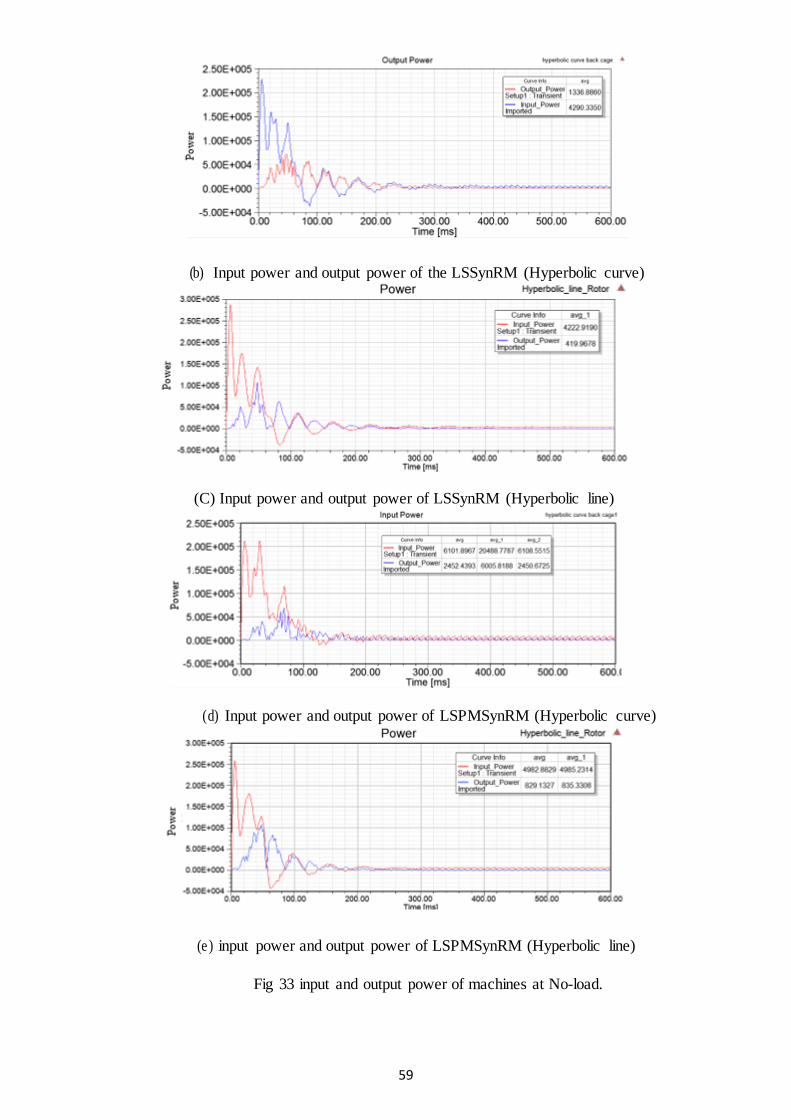
59
(b) Input power and output power of the LSSynRM (Hyperbolic curve)
(C) Input power and output power of LSSynRM (Hyperbolic line)
(d) Input power and output power of LSPMSynRM (Hyperbolic curve)
(e ) input power and output power of LSPMSynRM (Hyperbolic line)
Fig 33 input and output power of machines at No-load.

60
At no load condition, from the plot (a) of figure 33, the input power of the induction motor is noticed to
be 17379W but at no load condition the applied load to the machine is 0Nm. So from the formula of the
output power the output power should be zero. But, in the plot shows some amount of power which can
be considered as a computational error. So, for all rest of the plots the average value of the input power
is taken between 400ms to 600ms. In addition to that, the input power for both developed models of
LSSynRM and LSPMSynRM is noticed around 4000kW and the output power is considered as 0.
Basically, this plots are generated for the calculation of the efficiency. And the efficiency of the machine
at no-load should be zero because of the output power of the machine at no load is zero. Which is
illustrated in the part 5.7 of the chapter.
Furthermore, the input power and output power are obtained for the full load condition and the plots for
the full load is illustrated below in the fig 34.
(a) Input and output power of an induction motor
(b) Input and output power of LSSynRM (Hyperbolic curve)
(c) Input and output power of LSSynRM (Hyperbolic line)

60
(d) Input and output power of LSPMSynRM (Hyperbolic Curve)
(e) Input and output power of LSPMSynRM
(HyperbolicLine)
Fig 34 input and output power of machines at full load.
Now, at full load the average input power of the induction motor is 25.7kW and the output power for an
induction motor at full load is 20.1kW. Also, from the plot (b) and (c) it is observed that the motor is
working on the average output power of almost 20kW, when it is operated under the full load condition.
And plots (d) and (e) shows the average output power of line-start permanent magnet synchronous
reluctance motor at 20kW. So, from this plots the full load efficiency of the machines is derived.

61
5.6 Power Factor Basically, the power factor is also the important factor to consider while designing the electrical machine.
Power factor is one of the overlooked and less understood characteristic while designing the electric
motor. Power factor can be more important when the operating cost of the machine taken in to account.
It is basically measured as the ratio of kW and KVA. The bar chart for the power factor is illustrated
below in the fig 35.
The formula used to derive the power factor is given below, and the power factor of all the machines is
calculated manually.
PF = Mechanical power/Input Power.
Where, Mechanical power = Input Power – Electrical losses.
Fig 35 power factor of motors at no-load and full load.
From the results, it is noticed that in the no-load condition the power factor for all the machine was
around 0.93 and the power factor for the designs with the permanent magnet is 0.94 and at the full load
the power factor increased to the 0.97 for the developed new models. So, the higher power factor can
also be the reason for the better efficiency of the machine compared to the induction motor.
POWER FACTOR
No load Full load
IM L S S Y N R M L S S Y N R M L S P M S Y N R M L S P M S Y N R M
( H Y P . C U R V E ) ( H Y P . L I N E ) ( H Y P C U R V E ) ( H Y P L I N E )
0.93
0.96
0.92
0.96
0.92
0.96
0.94
0.97
0.94
0.97

62
5.7 Efficiency (%) In this part of the report, the efficiency results for all the motors in this study are illustrated in the form
of the bar chart. The efficiency of the motor is calculated manually from the obtained results of the
output power and the input power.
The plot shows the percentage efficiency of all the motors taken in this study. And evaluated for the
better performance.
Fig 36 Efficiency plots at no-load and Full load.
From the results of the efficiency it can be noticed that the new developed models are having around
10% of increment in the efficiency. The efficiency of the induction motor is noted 78% at full load
operation. So, there is the noticeable change in the efficiency noted and the losses are also decreased.
So, from the overall comparison the Line-start synchronous reluctance motor and the line-start
permanent magnet synchronous reluctance motor outperform the commonly used induction motor. But,
in the no-load efficiency the load is set to 0Nm. And in the, plots it shows some losses. But, by looking
at the actual efficiency at no-load for all the machines is 0%. Which is shown in the fig 36.
At last the summary of all the motors used in this study is illustrated in the form of table 8 below.
0%
10%
20%
30%
40%
50%
60%
70%
80%
90%
100%
IM LSSynRM(Hyperboliccurve)
LSSynRM(Hyperbolicline)
LSPMSynRM(Hyperbolic curve)
LSPMSynRM(Hyperbolic line)
Efficiency%
No Load Full-Load

64
Table 8, Summary of result comparison for all proposed models with benchmark induction motor.
Induction
Motor
LSSynRM
(Hyperbolic
curve)
LSSynRM
(Hyperbolic
line)
LSPMSynRM
(Hyperbolic
curve)
LSPMSynRM
(Hyperbolic
line)
Rated Output
Power (kW)
20 20 20 20 20
Number of
Poles
4 4 4 4 4
Speed (rpm) 1465 1500 1500 1499 1500
Frequency
(Hz)
50 50 50 50 50
Power Factor 0.96 0.96 0.96 0.97 0.97
Efficiency
(%)
78.2 86.9 83 88.75 88
Losses (W) 161.17 149.075 152.77 146.94 148
Permanent
Magnet
- - - Yes Yes
Material of
Magnet
- - - NdFe35 NdFe35
Airgap 0.55 0.55 0.55 0.55 0.55
Cage Type Double cage Aluminium
accommodated
in Flux
barriers
Aluminium
accommodated
in Flux
barriers
Aluminium
accommodated
in Flux
barriers
Aluminium
accommodated
in Flux
barriers
5.8 Fan Type Load Fig 37 shows the speed vs time response for the fan type load for all the motors. Here, the motors are
tested with the fan type load, where the load torque is proportional to the square of the speed. The
equation for the fan load is illustrated below.
T=TL(𝑆𝑝𝑒𝑒𝑑
𝑆𝑦𝑛𝑐ℎ𝑟𝑜𝑛𝑜𝑢𝑠 𝑠𝑝𝑒𝑒𝑑)
2
𝑁𝑚

64
Fig 37 Speed vs Time (Fan type load).
From the fig it is noticed that the induction motor reached to 1465 rpm and the line-start synchronous
reluctance motor reach to the speed of 1500 rpm after 300ms. Also, the line-start permanent magnet
synchronous reluctance motor reaches to 1500 rpm. So, from this response it can be noticed that the
induction motor takes less time to reach at the constant speed. So, induction motor has the better dynamic
performance for the fan type load compared to the other motors.
But, from all the different test it has been noticed that the proposed models are giving better performance
and compared to induction motor in the loading condition in terms of efficiency.

64
Chapter 6
Conclusion and Future Work

65
6.1 Conclusion
In this chapter of the report the conclusion is made with respect to the result. So, in the first chapter of
the report, the importance of the developing the efficient motor is studied and the overall worldwide
consumption of the electricity by electric motor was focused. And the special focus in that chapter is on
the consumption of electricity in Australia and New-Zealand and because of the losses in the electric
motors the emission of CO2 is taken in to account. So, from the first chapter the necessity of developing
efficient motor is understood and, the statistics of the world got to know from the carried-out study. The
first chapter also conclude the problem statement, which includes the reason for the lower efficiency in
the induction motor. Also, advantages of the synchronous reluctance motor over the induction motor.
These concludes the idea of designing the hybrid design of the motor.
Secondly, with the help of literature review, several researches and the obtained results were studied. In
addition to that, Different designing methods of electrical machines are got familiarized. The previous
researches also contribute in the development of the knowledge for designing the electrical machine and
various design aspects were studied. Also, the gap was notified that, most of the researches were based
on the synchronous reluctance motor and the permanent magnet synchronous reluctance motor which
gives an idea for combining the features of the permanent magnet and line-start capability.
In the next chapter of the design aspects, the study of the benchmark three-phase induction motor was
carried out. In this chapter, the induction motor was designed with the referenced parameters in Maxwell
2D. And the various parameters selection is learnt from this design. Also, it includes the design of
additional four design of the line-start synchronous reluctance motor with and without magnets were
created. While designing there are several complications were faced because of the beginner level of the
software. And with the help of online tutorials and available vast amount of the audio-visual resources
the knowledge of designing is developed. Also, the approximation of the barriers from the flux-lines on
the solid core was carried out for cutting the air barriers and the approximation for the accommodation
of cage in the rotor. This chapter was concluded with the fine design of the proposed models of the
motor.
From the simulation part of the project, the simulation procedure for obtaining various of the results
were learnt. The importance of the time steps and the parameters optimization is also understood. Also,
with the help of finite element analysis, the magnetostatic analysis was carried out and the magnetic
circuit of the machine, flux density, flux linkage and optimization of the magnetic flux density was
derived and understood. Also, the application of the mechanical load as well as the derivation of different
results in the form of graphs is learnt. In the magnetostatic analysis the flux density and the flux line
represents the concertation of the flux distributed on the surface of the rotor and stator which is found
4.00 wb/m is reasonable for the motor.
Result and discussion part of this report concludes that as the mass of the rotor decrease the rotor losses

66
got decreases and as a result the efficiency of the machine increased. Because of the hybrid arrangement
of the cage and the synchronous reluctance motor the newly developed line-start synchronous reluctance
motor and line-start permanent synchronous reluctance motor achieved the line-start capability as an
induction motor. So, from the plots in the start-up of the motor it can be clearly concluded that the
developed models reach 1500 rpm so, in the developed models matches the results obtained from the
benchmark induction motor. So, it can be concluded that the developed models are successful to achieve
the self-starting capability. Also, the torque density of the developed models is increased and due to the
better torque density, these line-start permanent magnet synchronous reluctance motors are suitable for
the industrial application.
In addition, the winding currents were noticed flowing smoothly throughout the motor. In the starting of
the motor the higher current drowns. But, as the motor start rotating gradually the current plots become
stable and smooth. The losses in the new developed models are noticed less than the benchmark model
of an induction motor. So, as the losses are decreased the efficiency of the motor got increased. And
because of adding the magnets the torque density and the efficiency is also improved. Also, it causes
lower thermal resistance and clean operation. For all the no-load operation, the efficiency of the motor
was notified as 0%. Because of 0Nm of load torque, which results output power to be zero. From the
efficiency plot of all the machines clearly shows the increment in the efficiency as the models got
modified. So, from the results it can be clearly seen that the proposed design can replace the induction
motor in terms of the performance. Also, the fan type load was applied to check the start-up of the motor.
In that test, the induction motor is getting nearly constant speed earlier than the other models. So, for the
fan type load means in the less loading condition the induction motor is getting advantage. But, in the high
loading condition such as in the industrial environment the developed models can be better than the
induction motor. In addition to that, the magnet used are not extremely expensive as rare earth magnets.
And due to the less material consumption, the construction of this motor can be economical same as an
induction motor. Also, for all the designed models the power factor is noticed below unity and the
efficiency got increased gradually.
So, the newly designed models can replace the widely-used induction motor in terms of performance and
as an economical alternative because of its better efficiency and several more advantages in terms of
torque density, low production cost, better output power and simple construction.
In addition to that, there are not much researches carried out on this type of the design of the machine.
And the carried-out tests are not limited to check the performance of the machine. So, there are various
areas to expand this project for getting more better performance and better optimization of the design,
which is illustrated below in the next part.
67
6.2 Future work
Optimal changes with the design Basically, this study focusses on the design of the line-start synchronous reluctance motor and line-start
permanent magnet synchronous reluctance motor and the performance analysis of these both machines
with the help of finite element method. But, for the future work in the research the shape of the magnets
can be changed and optimized. Also, the orientation of the cage in the rotor can be re- developed with the
different shape.
Analysis of the machine
In this research, it provides the results of magneto static analysis, steady state analysis and transient
analysis. In this analysis the speed, torque, winding currents, power factor, efficiency, input and output
power, losses of the machine are studied and obtained for no load and full load. But, other analysis can
be obtained for the harmonics of the motor, also the thermal analysis can be carried out as a future work.
Prototyping
In this study, the physical working models were not made. So, the prototyping of the motor can be done
for the validation of the simulated results.
Further testing of the machine
The tests given and performed in this thesis were not comprehensive. There is more test, which can be
performed on the motor. Such as, the strength of vibration, level of noise, thermal test. Furthermore, the
performance of the motor can be observed with the pulse load and ramp load.

68
References
[1] Z. Shahan, “Electric Motor Efficiency Infographic, “cleantechnica.com, para. 2, 16, June. 2011. [Online].
Accessed: 22 Jan 2017.
<https://cleantechnica.com/2011/06/16/electric-motors-consume-45-of-global-electricity-europe-responding-
electric-motor-efficiency-infographic/>
[2] ABB Electric Motors infographic, “ABB Global, Accessed: 5 Feb 2017,
<http://www04.abb.com>
[3] Product profile Electric motors ,”Energy Rating, Accessed: 8 Feb 2017,
<http://energyrating.gov.au/sites/new.energyrating/files/documents/Product_profile_-
_Electric_motors_September_2013.pdf.>
[4] E3 Program, “Energy Rating, Accessed : 10 March 2017,
< http://www.energyrating.gov.au/sites/new.energyrating/files/documents/Impacts-of-the-E3-Program.pdf >
[5] Standards, “National Electrical Manufacturers Association” Accessed: 9 March 2017,
<http://www.nema.org/standards>
[6] Electric Motors, “Energy Rating, Accessed : 10 March 2017,
< http://www.energyrating.gov.au/products/electric-motors#toc2 >
[7] Centrifugal pump lexicon, “KSB Australia private limited, Accessed: 15 Jan 2017,
<http://www.ksb.com/centrifugal-pump-lexicon/efficiency-class/328160/>
[8] P. Juha, J. Tapni and H. Valeria, Design of Rotating Electrical Machines, 2nd ed. Chichester, United
Kingdom: Wiley, 2014, pp. 293-456. [Accessed Dec. 10, 2016].
< http://ebookcentral.proquest.com.ezproxy.flinders.edu.au/lib/flinders/reader.action?docID=1414122>
[9] K. Upadhyay, Design of Electrical Machines. New Delhi: New Age International Ltd, 2000, pp. 192-211.
[Accessed Jan. 02, 2017].
< http://ebookcentral.proquest.com.ezproxy.flinders.edu.au/lib/flinders/reader.action?docID=3017431>
[10] J. Kaouthar, N. Hadj and M. Ghariani, ”Induction Motor Finite Element Analysis for EV Application,
Torque Ripple and Inter-turn Circuit,” Journal of Electrical System, pp. 447-462, November 2015. [Online].
Available: http://journal.esrgroups.org. [Accessed Feb. 20, 2017].

69
[11] L. Livadaru, A. Simion, A. Munteanu and O. Dabija, ”Design and FEM based Simulation of High Power
Induction Motor with severe Start-up Constraints,” AGIR, Romania, Tech. Rep. 101-106, 2012. [Online].
Available: http://www.agir.ro/buletine/1521.pdf. [Accessed Feb. 10, 2017].
[12] A. Mohd, and V. Agarwal, “Investigation & analysis of three phase induction motor using finite element
methof for power quality improvement,” International Journal of Electronic and Electrical Engineering, Vol 7,
no. 7, pp. 901-908, November 2014. [Online]. Available: www.ripublication.com. [Accessed Jan. 10,2017].
[13] S. Boroujeni, M. Haghparast and N. Bianchi, “Optimization of Flux Barriers of Line-start Synchronous
Reluctance Motors for Transient-and Steady-state Operation,” Electrical Power Components and System, vol.
43, issue. 5, pp. 594-606, October 2014. Available: www.tandfonline.com.
[14] E. Obe, “Steady-state performance of a line-start synchronous reluctance motor with capacitive assistance,”
Electric Power System Research, vol. 80, issue. 10, pp. 1240-1246, October 2010. Available:
www.sciencedirect.com.
[15] D. Pehrman and M. Jones, “Start capability of industrial synchronous motor with high efficiency,” Master
thesis, Chalmers University of Technology, Gothenburg, Sweden, 2014.
[16] D. Miljavec, M. Zagirnyak and B. Zidaric, “Rotor design and on-line starting-performance analysis of
synchronous-reluctance motor,” The international journal for computation and mathematics in electrical and
electronic engineering, vol. 20, no. 3, pp. 570-582, 2009. Available: search.proquest.com
[17] Q.Smit, A. Sorgdrager and R. Wang, “ Design and optimization of a line-start synchronous reluctance
motor,” In proc. 24th Southern African Universities power engineering conference, 26-28 January 2016,
Vereeniging, South Africa [Online]. Available: IEEE Xplore, http://www.ieee.org. [Accessed: 24 Dec. 2016].
[18] W. Liu, G. Liu, L. Yao and Y. Lin, “ Rotor design of permanent magnet-assisted synchronous reluctance
motor with ferrite magnets,” Electrical Machines and Systems 19th international conference, 13-16 Nov. 2016,
Chiba, Japan [Online]. Available: IEEE Xplore, http://www.ieee.org. [Accessed: 27 Dec. 2016].
[19] S. Stipetic, D. zarko and M. Kovacic, “optimised design of permanent magnet assisted synchronous
reluctance motor using combined analytical- finite element analysis based approach, “IET Electric Power
Applications, vol. 10, issue. 5, pp 330-338, June 2016. Available: IEEE Xplore, http://www.ieee.org. [Accessed:
28 Jan. 2017].
[20] R. Vartanian, H. Toliyat., Design and comparison of an optimized permanent magnet-assisted
synchronous reluctance motor (PMa-SynRM) with an induction motor with identical NEMA Frame stators,
Conf. Proc. Electric Ship Technologies Symposium, April 20-22, 2009, Baltimore, USA. May 02 2009.
[21] M. Ibrahim, P, Sergeant and E. Rashad,” Performance Evaluation of Synchronous Reluctance Motors
With and Without Permanent Magnets, Conf. proc. Department of electrical energy, system and automation,
May 12-13 2016. Available: http://flinders-primo.hosted.exlibrisgroup.com.

70
[22] D. Jung, Y. Kwak, J. Lee and C. Jin, “ Study on the optimal design of PMa-SynRM loading ratio for
achievement of ultra-premium efficiency, “ IEEE Transactions on Magnetics, vol. pp, issue. 99, February 06,
2017. Available: IEEE Xplore, http://www.ieee.org.
[23] ADMIN,”DIY electrical electronics projects”, Double cage induction motor, Dec 2015. [Accessed: 27
March 2017]. Available: http://www.electricalbasicprojects.com/double-cage-induction-motor-introduction/

70
Appendices
Appendix A: Specifications of benchmark induction motor.
Appendix B: Mesh Plots.
Appendix C: Half-load analysis plots.
Appendix D: More than full load analysis plots.

71
Appendix A: Specifications of Benchmark Induction Motor
Table 9 Detailed specification of an induction motor
GENERAL DATA OF MACHINE
Given output power (kW) 20
Number of poles 4
Given speed (rpm) 1470
Frequency (Hz) 50
Rated voltage (V) 400
Operating temperature ( ֯C ) 75
Frictional loss (W) 50
Windage loss (W) 50
Stray loss (W) 200
Type of load Fan Load
Winding connection Wye
STATOR DATA OF MACHINE
Number of stator slots 36
Inner diameter of stator (mm) 254
Outer diameter of stator (mm) 165
Type of stator slot 4
STATOR DATA
hs0 (mm) 0.7
hs1 (mm) 0.8
hs2 (mm) 19.9254
bs0 (mm) 3.9
bs1 (mm) 7.16595
bs2 (mm) 10.6524
rs (mm) 0.2
Top tooth width (mm) 7.49946
Bottom tooth width (mm) 7.49946
Length of stator core (mm) 205
Staking factor 0.96
Type of steel M19_24G
Coil pitch 8
Number of lamination sectors 0
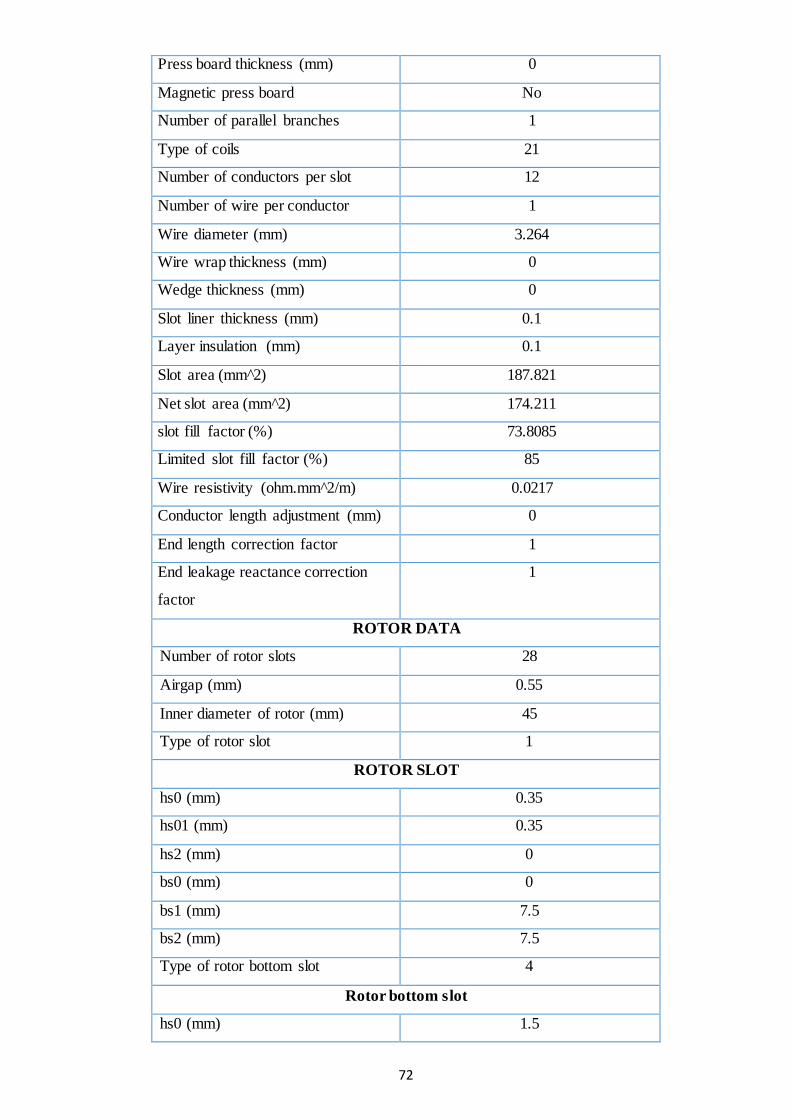
72
Press board thickness (mm) 0
Magnetic press board No
Number of parallel branches 1
Type of coils 21
Number of conductors per slot 12
Number of wire per conductor 1
Wire diameter (mm) 3.264
Wire wrap thickness (mm) 0
Wedge thickness (mm) 0
Slot liner thickness (mm) 0.1
Layer insulation (mm) 0.1
Slot area (mm^2) 187.821
Net slot area (mm^2) 174.211
slot fill factor (%) 73.8085
Limited slot fill factor (%) 85
Wire resistivity (ohm.mm^2/m) 0.0217
Conductor length adjustment (mm) 0
End length correction factor 1
End leakage reactance correction
factor
1
ROTOR DATA
Number of rotor slots 28
Airgap (mm) 0.55
Inner diameter of rotor (mm) 45
Type of rotor slot 1
ROTOR SLOT
hs0 (mm) 0.35
hs01 (mm) 0.35
hs2 (mm) 0
bs0 (mm) 0
bs1 (mm) 7.5
bs2 (mm) 7.5
Type of rotor bottom slot 4
Rotor bottom slot
hs0 (mm) 1.5

73
hs01 (mm) 1
hs2 (mm) 18
bs0 (mm) 2
bs1 (mm) 6.7
bs2 (mm) 2
rs (mm) 1
Cast rotor No
Half slot No
Length of rotor (mm) 205
Staking factor of rotor core 0.92
Type of steel M19_24G
End length of bar (mm) 0
Height of end ring (mm) 50
Width of end ring (mm) 15
Resistivity of rotor bar at 75cen.
(ohm.mm^2/m)
0.0434783
Resistivity of rotor ring
(ohm.mm^2/m)
0.0434783
Magnetic shaft Yes
These are the specifications used to design the bench mark induction motor. And after that from the
optimizations of the parameters the further parameters derived to design the proposed models.

74
Appendix B: Mesh Plots
During these research the mesh analysis is the important part of the design so the meshing of all the
models used in the study so, the mesh plots are illustrated below in the figures.
Meshing of LSSynRM (Hyperbolic curve)

75
Meshing of LSSynRM (Hyperbolic line)
Mesh plot for LSPMSynRM (Hyperbolic Curve)

76
Mesh plot for LSPMSynRM (Hyperbolic Line)

77
Appendix: C Performance Analysis Results at Half-load
Induction motor (Half Load 63.69Nm) 20kW
1.Speed Vs Time.
2.Torque Vs Time.
3. Winding Currents Vs Time.
4. Torque Vs Speed
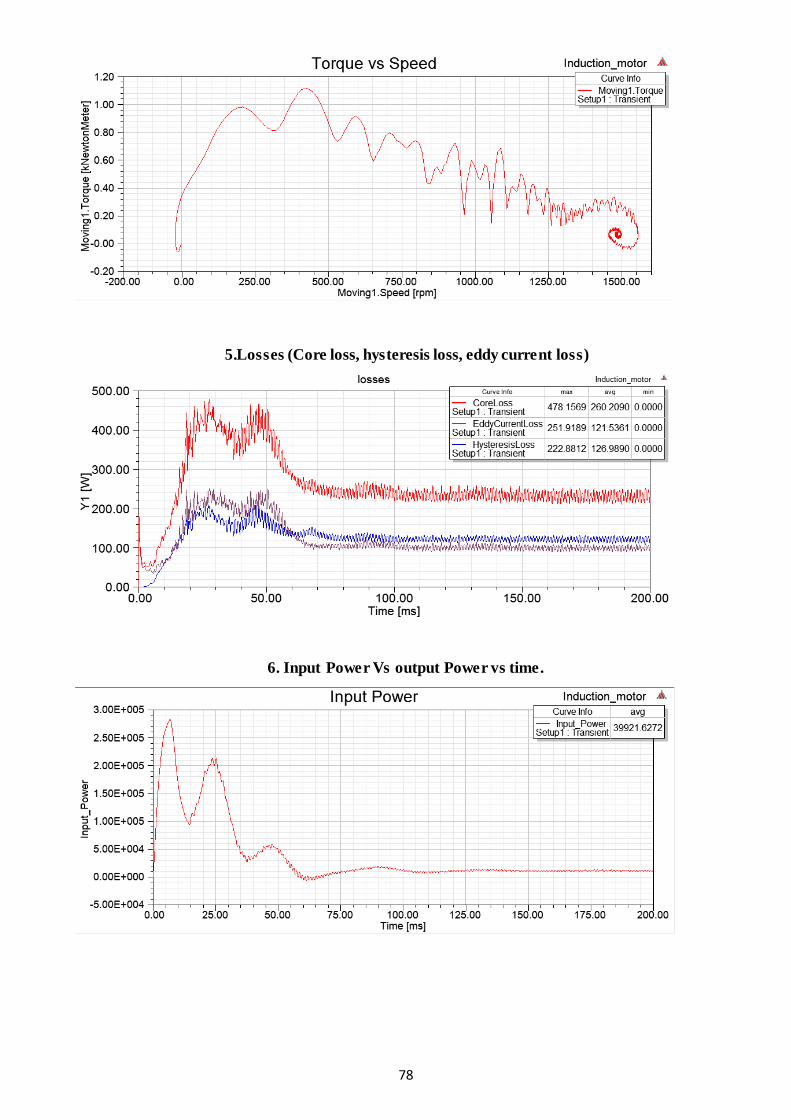
78
5.Losses (Core loss, hysteresis loss, eddy current loss)
6. Input Power Vs output Power vs time.
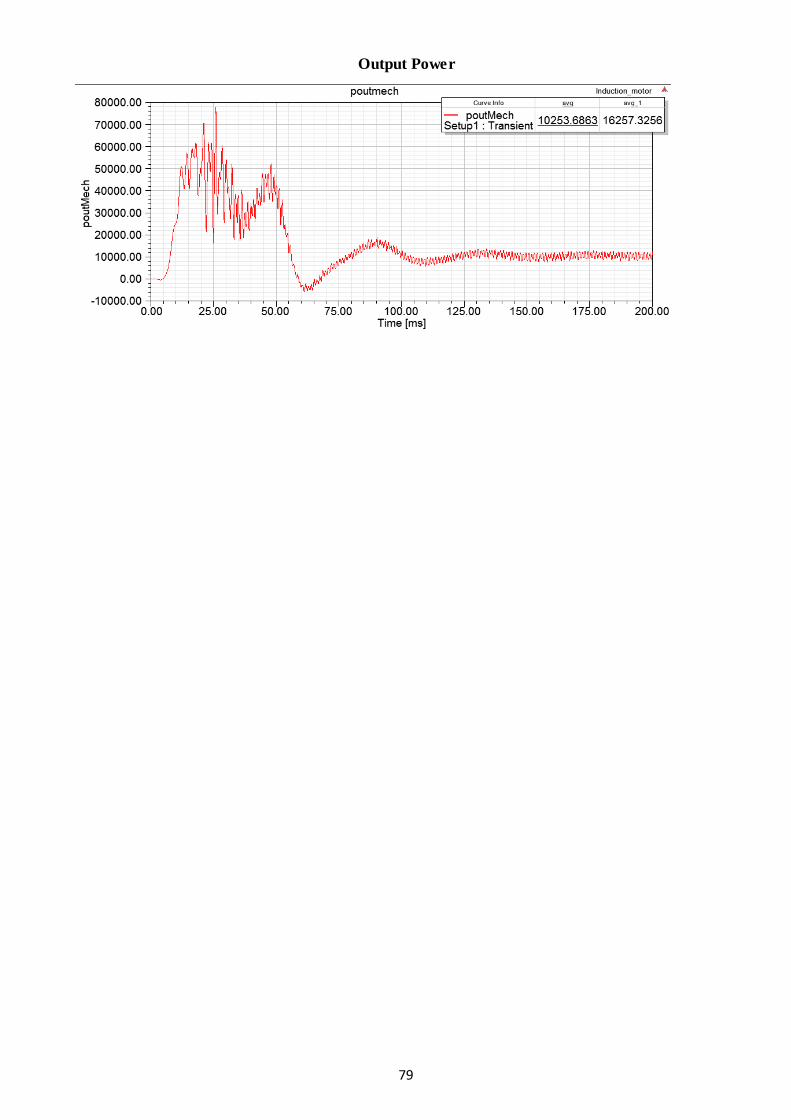
79
Output Power

80
Line start Synchronous Reluctance motor (Hyperbolic curve) (Half Load 63.69Nm) 20kW.
1. Speed Vs Time.
2. Torque Vs Time.
3. Winding Currents Vs Time.
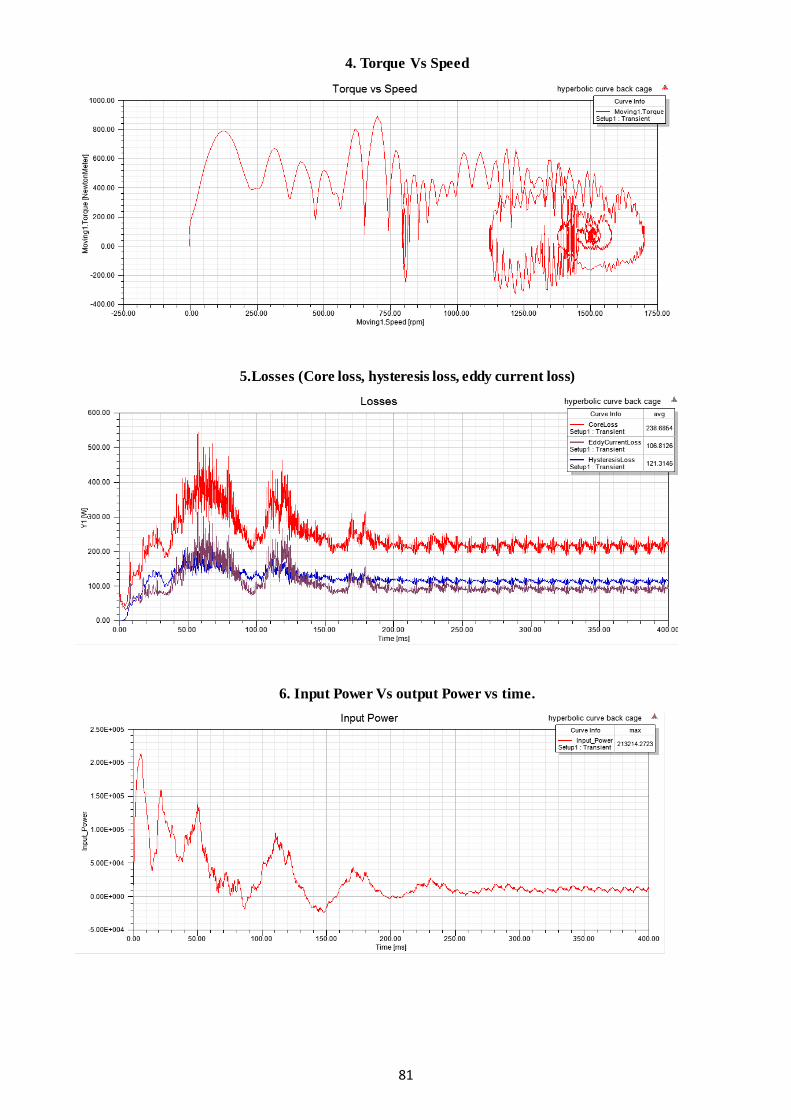
81
4. Torque Vs Speed
5. Losses (Core loss, hysteresis loss, eddy current loss)
6. Input Power Vs output Power vs time.
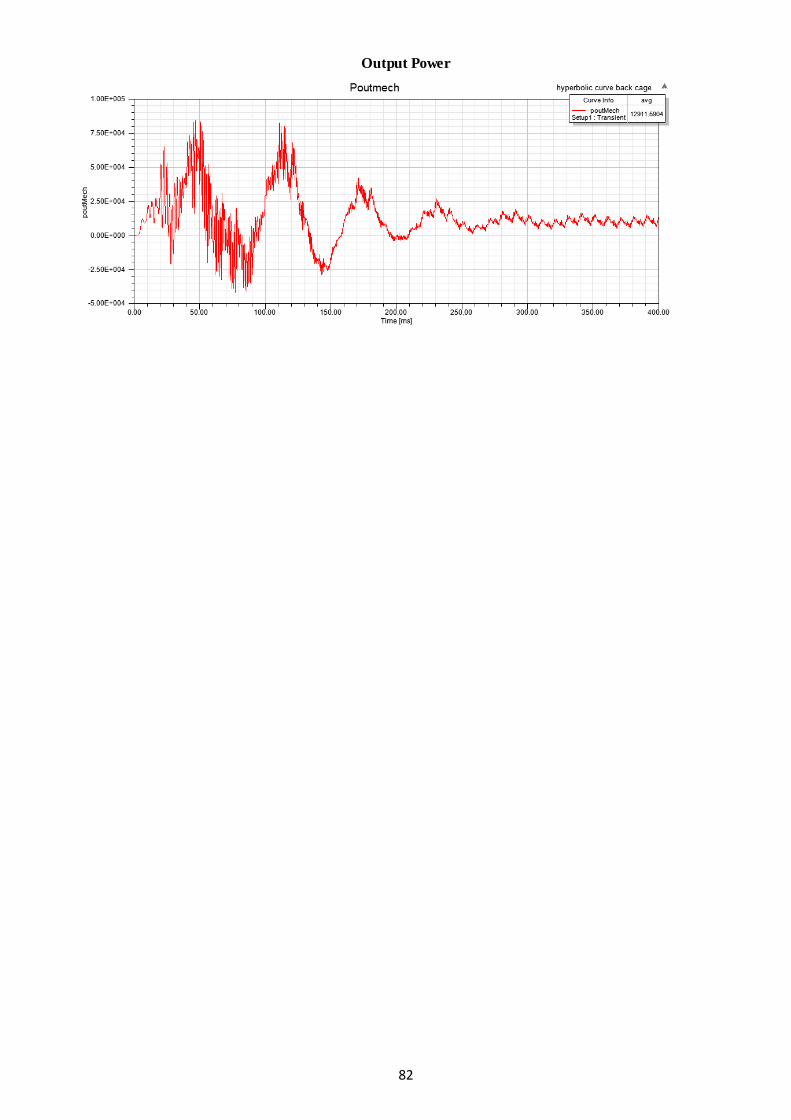
82
Output Power
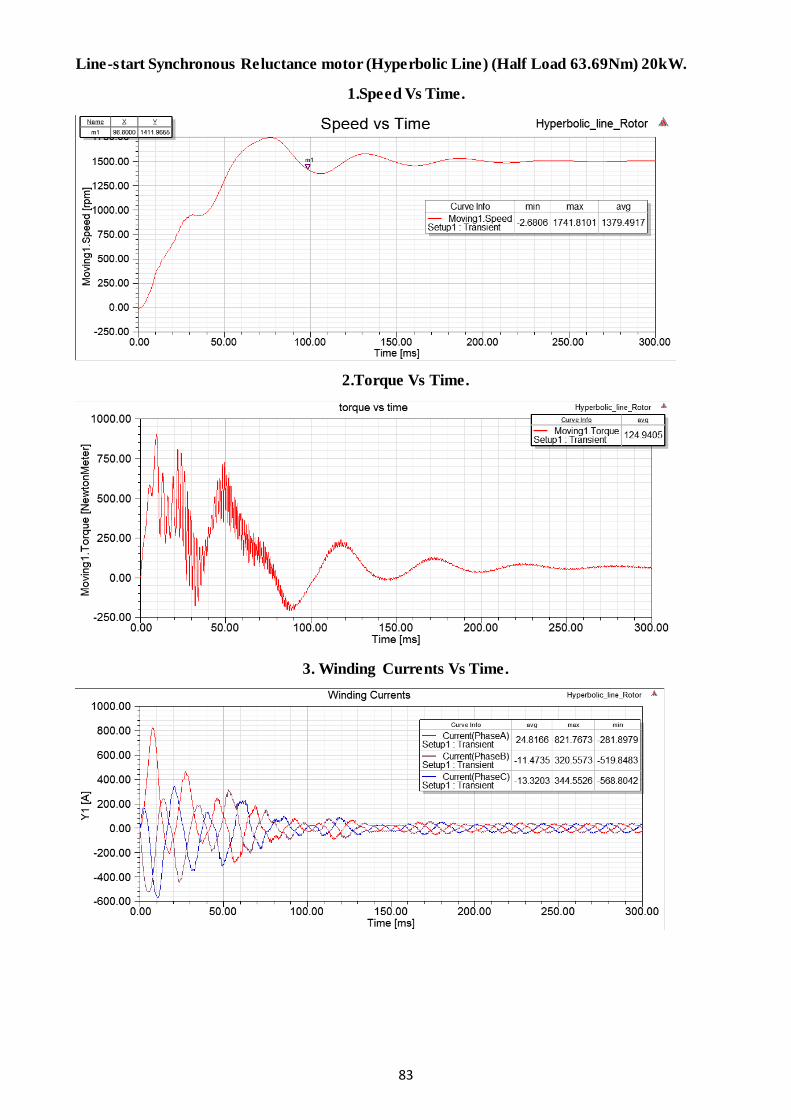
83
Line-start Synchronous Reluctance motor (Hyperbolic Line) (Half Load 63.69Nm) 20kW.
1.Speed Vs Time.
2.Torque Vs Time.
3. Winding Currents Vs Time.

84
4. Torque Vs Speed
5.Losses (Core loss, hysteresis loss, eddy current loss)
6. Input Power Vs output Power vs time.

85
Output Power

86
Line-start Permanent Magnet Synchronous reluctance motor (Hyperbolic curve)
(63.69Nm)
1. Speed Vs Time
2. Torque Vs time
3. Winding currents Vs time

87
4. Torque vs speed
5. Power Vs time
6. Losses Vs Time
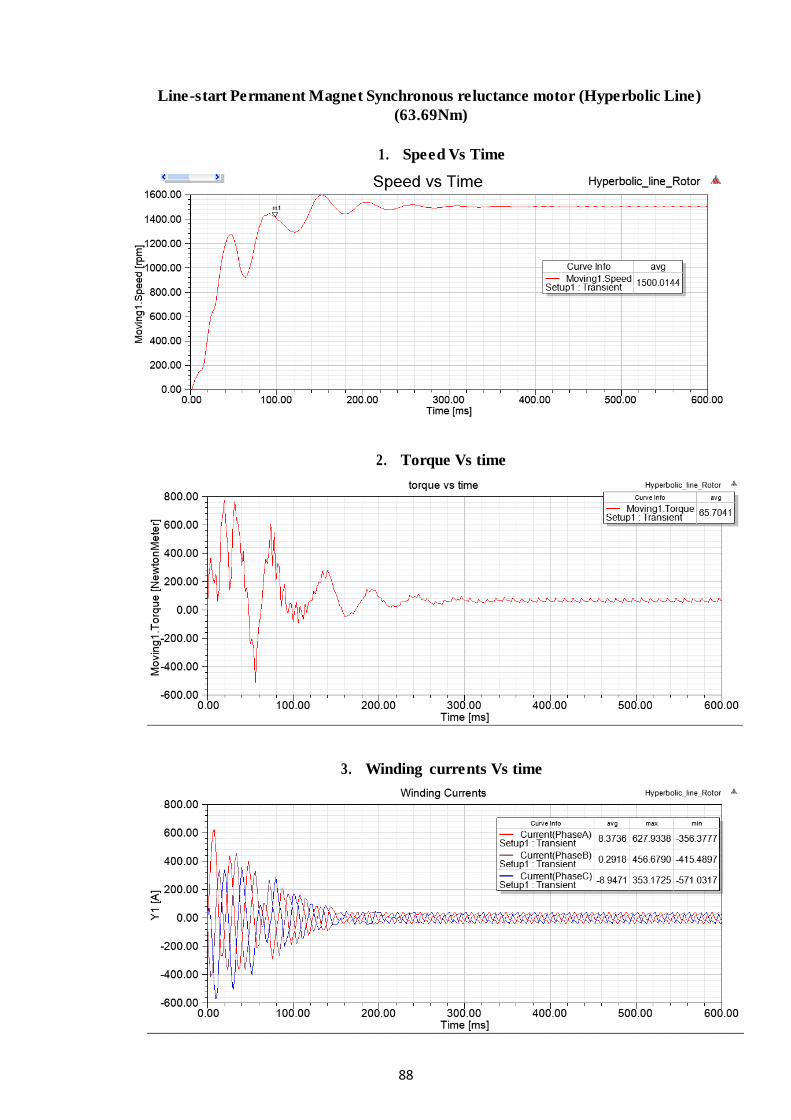
88
Line-start Permanent Magnet Synchronous reluctance motor (Hyperbolic Line)
(63.69Nm)
1. Speed Vs Time
2. Torque Vs time
3. Winding currents Vs time

89
4. Torque vs speed
5. Power Vs time
6. Losses Vs Time

90
Appendix D: More than Full Load Analysis Plots
Induction Motor (More than full load 137.38Nm) (20kW)
1.Speed Vs Time.
2.Torque Vs Time.
3. Winding Currents Vs Time.

91
4. Torque Vs Speed
5.Losses (Core loss, hysteresis loss, eddy current loss)
6. Input Power Vs Output Power vs time.

92
Output Power

93
Line-start Synchronous Reluctance Motor (Hyperbolic Curve) (20kW) (More than full load
137.38Nm)
1.Speed Vs Time.
2.Torque Vs Time.
3. Winding Currents Vs Time.
.

94
4. Torque Vs Speed
5.Losses (Core loss, hysteresis loss, eddy current loss)
6. Input Power, output Power vs time.

95
Output Power
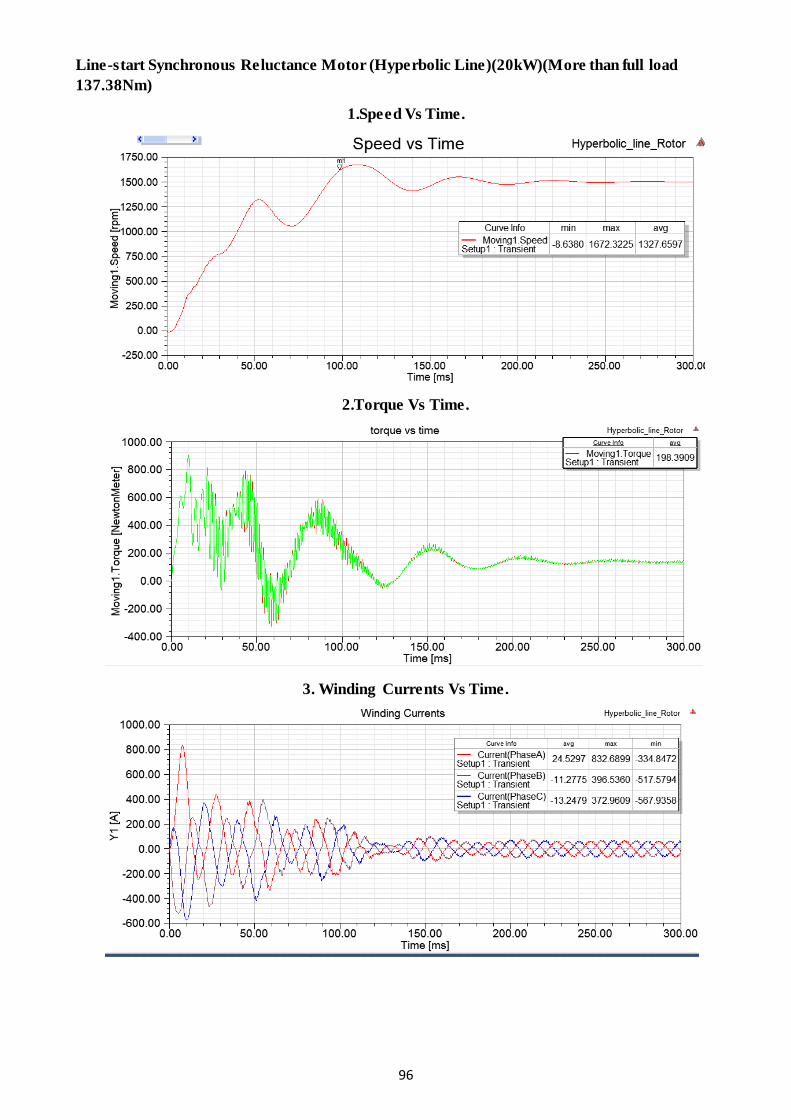
96
Line-start Synchronous Reluctance Motor (Hyperbolic Line)(20kW)(More than full load
137.38Nm)
1.Speed Vs Time.
2.Torque Vs Time.
3. Winding Currents Vs Time.

97
4. Torque Vs Speed
5.Losses (Core loss, hysteresis loss, eddy current loss)
6. Input Power Vs output Power vs time.
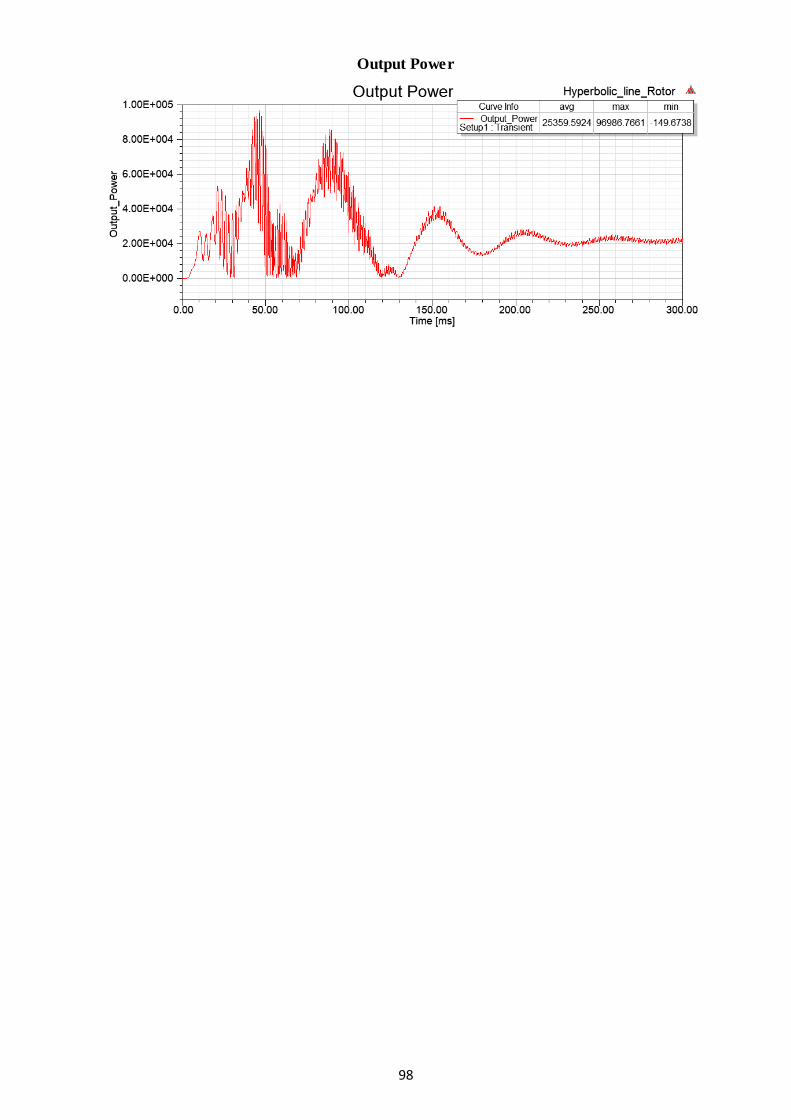
98
Output Power

99
Line-start Permanent Magnet Synchronous Reluctance Motor (Hyperbolic curve)
(137.38Nm)
1. Speed Vs Time
2. Torque Vs time
3. Winding currents Vs time
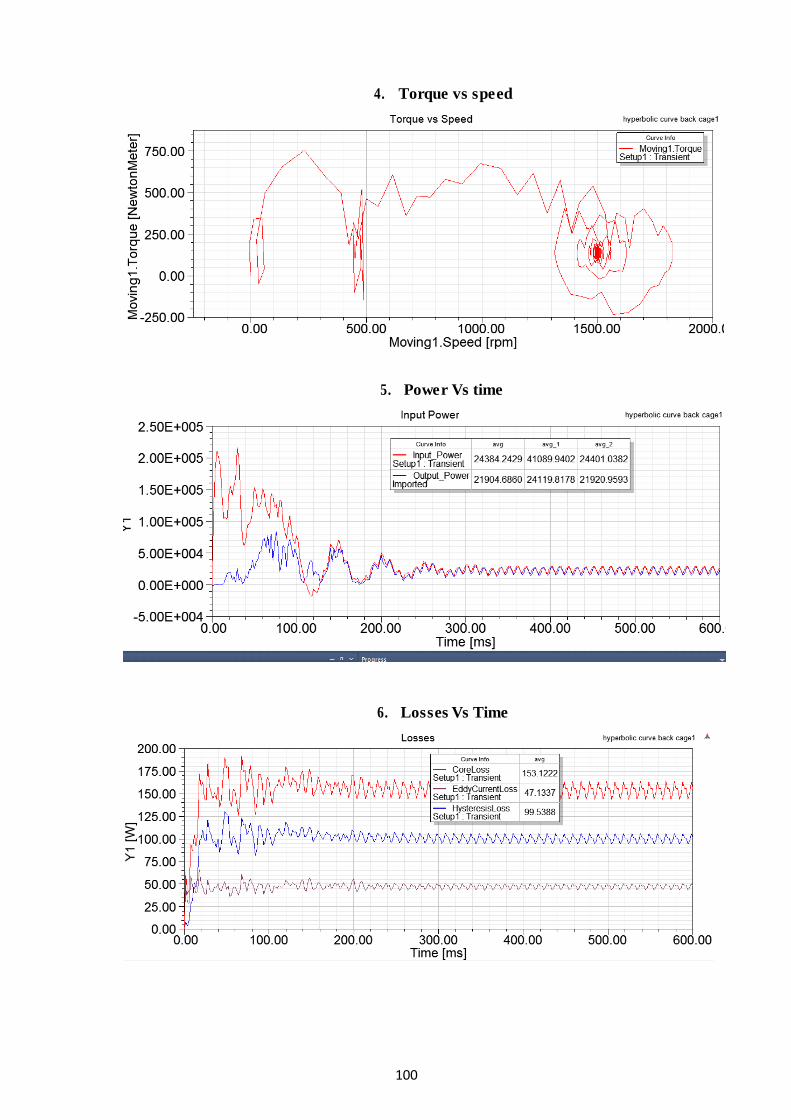
100
4. Torque vs speed
5. Power Vs time
6. Losses Vs Time

101
Line-Start Permanent Synchronous Reluctance motor
(Hyperbolic line) (137.38Nm)
1. Speed Vs Time
2. Torque Vs time
3. Winding currents Vs time

102
4. Torque vs speed
5. Power Vs time
6. Losses Vs Time
.