Embed Size (px)
Citation preview

Applied Energy 118 (2014) 156–165
Contents lists available at ScienceDirect
Applied Energy
journal homepage: www.elsevier .com/ locate/apenergy
Design and optimization of air bottoming cycles for waste heat recoveryin off-shore platforms
0306-2619/$ - see front matter � 2013 Elsevier Ltd. All rights reserved.http://dx.doi.org/10.1016/j.apenergy.2013.12.026
⇑ Corresponding author. Tel.: +45 45 25 41 29; fax: +45 45 88 43 25.E-mail address: [email protected] (L. Pierobon).
Leonardo Pierobon ⇑, Fredrik HaglindTechnical University of Denmark, Department of Mechanical Engineering, Building 403, DK-2800 Kgs. Lyngby, Denmark
h i g h l i g h t s
� Theory of power maximization used to design an air bottoming cycle.� Theory of power maximization extended by a multi-objective optimization method.� Three objective functions considered: net power output, recuperator volume and net present value.� Comparison between the theory of power maximization and the multi-objective optimization method.� Case study: a methodology applied to recover exhaust heat on off-shore platforms.
a r t i c l e i n f o
Article history:Received 23 March 2013Received in revised form 4 December 2013Accepted 17 December 2013
Keywords:Air bottoming cyclePower maximizationGas turbineShell and tube heat exchangerOff-shore platform
a b s t r a c t
This paper aims at comparing two methodologies to design an air bottoming cycle recovering the wasteheat from the power generation system on the Draugen off-shore oil and gas platform. Firstly, the designis determined using the theory of the power maximization. Subsequently, the multi-objective optimiza-tion approach is employed to maximize the economic revenue, the compactness and the power produc-tion of the air bottoming cycle. The system compactness is assessed by introducing a detailed model ofthe shell and tube recuperator and including geometric quantities in the set of optimization variables.Findings indicate that using the power production, the volume of the recuperator and the net presentvalue as objective functions the optimal pressure ratio (2.52) and the exhaust gas temperature(178.8 �C) differ from the values (2.80 and 145.5 �C) calculated using the theory of the power maximiza-tion. The highest net present value (2.8 M$) is found for a volume of the recuperator of 128 m3. Thus, itcan be concluded that the multi-objective optimization approach enables extending the theory of powermaximization bridging the gap between a mere optimization of the thermodynamic cycle and the prac-tical feasibility of a power generation system.
� 2013 Elsevier Ltd. All rights reserved.
1. Introduction
Due to environmental concerns there is an urgent need toreduce greenhouse gas emissions and pollutants in the industrial,civil and transportation sectors. Recovering the waste heat fromthese activities can make a major contribution to this purpose.As reported by the Lawrence Livermore National Laboratory [1],the annual energy rejected was about 57.3% of the primary energyresources utilized in the United States in 2010. In Europe theannual recoverable industrial waste heat potential is about140 TWh, corresponding to a CO2 reduction of about 14 Mton peryear [2]. The North Sea oil and gas platforms were responsiblefor about 25% of the total CO2 emissions of Norway in 2011 [3].Since 1991 Norway levies carbon tax on petroleum, mineral fuel
and natural gas with the rates based on the fuel’s carbon content.As reported by the Ministry of the Environment [4], the NorwegianGovernment has increased the CO2 tax to 410 NOK per ton of CO2
in 2013. Hence, the waste heat recovery in off-shore applicationshas become a focus area both from an environmental and aneconomic perspective.
In oil and gas platforms one or more redundant gas turbines areemployed to support the power demand. Only a small fraction ofthe heat associated with the exhaust gases released by the gasturbines is recuperated. A viable solution to recover the waste heatis to place a power cycle at the bottom of the gas turbine. The airbottoming cycle (ABC) is a technology that can be employed asan alternative to the conventional steam cycle. In fact, in off-shoreplatforms it may not be practical to have a steam plant due to theneed for make-up water [5]. Additionally, fuel flexibility andreliability are important factors when selecting the gas turbineand, therefore, both turbine inlet and outlet temperatures are usu-ally lower than those of state-of-art on-shore combined cycles [5].
Nomenclature
AbbreviationABC air bottoming cycleAC air bottoming cycle compressorAT air bottoming cycle turbineCC combustion chamberGA genetic algorithmGEN generatorHPC high-pressure compressorHPT high-pressure turbineLPC low-pressure compressorLPT low-pressure turbinePT power turbineTIT turbine inlet temperature
NotationsDT1 temperature difference at the inlet of the recuperator
(K)DT2 temperature difference at the outlet of the recuperator
(K)A area (m2)d diameter (m)Ft temperature correction factorh heat transfer coefficient (kW/(m2 K)) or enthalpy (kJ/kg)hu utilization factor (hours/year)I total capital investment ($)i yearJ array of the objective functionsjth tube side heat transfer factorjtf tube side friction factorjsh shell side heat transfer factorjsf shell side friction factorl length (m)M operating and maintenance cost factorm exponent in Eq. (9)_m mass flow (kg/s)
n number of yearsNPV net present value_P electric or mechanic power (kW)p pressure (Pa)pt tube pitch (m)Pr ¼ cpl
k Prandtl number
q interest factor_Q heat rate (kW)
R yearly income ($/year)rc pressure ratio compressorRe ¼ qude
l Reynolds numberT temperature (K)tw thickness (mm)U heat transfer coefficient (kW/(m2 �C))u velocity (m/s)V volume (m3)X array of the optimization variables
Greek symbolsD differenceq density (kg/m3)k thermal conductivity (kW/(m �C))l viscosity (N/m2)g efficiency
Subscriptsb bafflec compressore equivalentel electricH hoti insideid inside dirt coefficientin inletis isentropiclm logarithmic meannet neto outsideod outside dirt coefficientout outletrec recuperatorsw shell wallt tube or turbineth thermaltot totaltw tube wallw wall
L. Pierobon, F. Haglind / Applied Energy 118 (2014) 156–165 157
The ABC was invented by Farrell (General Electric) in 1988 [6]; ayear later Anderson and Farrell [7] patented the ABC for coal gasi-fication plants. The exhaust gases from a gas turbine fired by coalgas fuel were used as the heat source. Najjar and Zaamout [8] ana-lyzed the performance of the combined gas turbine and ABC sys-tem. The combined cycle presented an increment in thermalefficiency of about 23% compared with the gas turbine alone. Bol-land et al. [9] conducted a feasibility study for using the ABC on oiland gas platforms in the North Sea. The ABC added 10.5%-points tothe thermal efficiency of the LM2500-PE gas turbine. Total weightand package cost were estimated to be 154 metric tons and9.4 million US$ for a 6340.5 kW air bottoming cycle. Korobitsyn[10] suggested different industrial applications of the ABC. The re-sults indicated that the technology has a payback time of threeyears in industries that require hot air, e.g. glass, bakery and dairyindustries. In Poullikkas [11], the introduction of the ABC with twointercoolers at the bottom of the Allison 571-K gas turbine led toan increase in power from 5.9 to 7.5 MWe. More recently, Ghazikh-ani [12] introduced and analyzed two new cycles, e.g. the evapo-
rating gas turbine with the ABC and the steam injection gasturbine with the ABC. Tveitaskog and Haglind [13] employed theABC to enhance the performance of high-speed ferries; the studysuggested that the thermal efficiency of the combined cycle canbe increased by 8%-points compared with the LM2500 gas turbine.Chmielniak et al. [14] carried out a technical and economic analysisof the ABC considering the heat transfer area of the recuperatorand the cost of the single components. However, none of theseworks optimize the ABC for simultaneous consideration of thenet power output, the compactness and the economic feasibility.Furthermore, the geometry of the recuperator of the ABC was notincluded in the optimization processes in any of these studies.
The present paper aims at designing and optimizing an ABC foroff-shore applications. First, the theory of power maximization[15] is utilized to find the pressure ratio and the temperature ofthe exhaust gases that maximize the net power output of theABC. Subsequently, the multi-objective optimization with the ge-netic algorithm (GA) is used to maximize the net power outputand the net present value (NPV) and to minimize the volume of

158 L. Pierobon, F. Haglind / Applied Energy 118 (2014) 156–165
the recuperator. The design variables are the isentropic efficiencyof the compressor and turbine, the pressure ratio and the temper-ature differences of the recuperator. The shell and tube heat ex-changer is utilized to recuperate the waste heat exiting the gasturbine. Since the velocities inside the heat exchanger influenceboth the surface area and the pressure drop, the geometry of theshell and tube heat exchanger is also included in the optimizationroutine. The methodology is applied to recover the waste heat fromthe SGT-500 industrial gas turbine installed on the Draugen plat-form located in the North Sea. The economic feasibility of the com-bined gas turbine and ABC system is assessed through the netpresent value by assessing the total investment cost of the ABC,the yearly income, and the cost for operation and maintenance.
The models of the ABC components, the equations to computethe heat transfer coefficient and the pressure drop of the shelland tube heat exchanger and the power maximization theory aredescribed in Section 2. The case study and the multi-objective algo-rithm are also presented in Section 2. Results of the power maximi-zation and the multi-objective optimization are reported anddiscussed in detail in Section 3. Finally, the main conclusions arestated in Section 4.
2. Methodology
2.1. Air bottoming cycle solver
As shown in Fig. 1, the ABC components are the turbine (AT),connected through the shaft to the electric generator (GEN), thecompressor (AC) and the recuperator recovering the exhaust heatfrom the gas turbine. The mathematical model of each componenthas been developed in MATLAB� 2012a [16]. The thermodynamicand transport properties of the air and of the exhaust gases are ac-quired by means of the commercial software REFPROP� 9 [17].Each component is modeled at steady state conditions.
The mathematical model of the ABC is solved by setting thetemperature differences DT1 = TH,in � T3 and DT2 = TH,out � T2 atthe inlet and outlet of the recuperator. The purchase equipmentcost of the compressor, PECc, is evaluated using Eq. (1) introducedby Valero et al. [18]:
PECc ¼39:5 _m
0:9� gis;c
!p2
p1
� �ln
p2
p1
� �ð1Þ
The purchase equipment cost of the turbine, PECt, is evaluatedusing the following equation [18]:
PECt ¼266:3 _m
0:92� gis;t
!p3
p4
� �ln
p3
p4
� �½1þ expð0:036T3 � 54:4Þ� ð2Þ
Fig. 1. Air bottoming cycle layout.
The PECgen of the electric generator depends on the net poweroutput _Pnet and is estimated by the following equation [19]:
PECgen ¼ 60 _P0:95net ð3Þ
2.2. Shell and tube recuperator
The recuperator exchanges heat between two gas streams, i.e.the exhaust gases exiting the gas turbine and the air compressedby the ABC compressor. Therefore, a gas to gas heat exchanger isneeded. As reported by Douglas [20], two technologies are avail-able for this application: the shell and tube heat exchanger, andthe flat type heat exchanger. The shell and tube heat exchangeris selected due to its advantage of handling applications wherethere is a large difference in pressure between the two streams;thus, the probability of the mixing of the hot and cold fluids dimin-ishes. The heat transfer surface area A is evaluated using the basicdesign procedure proposed by Richardson and Peacock [21] wherethe governing equation for the heat transfer across a surface is
_Q ¼ UAFtDTlm ð4Þ
where _Q is the heat rate, U is the overall heat transfer coefficient,DTml is the logarithm mean temperature difference and Ft is thetemperature correction factor which accounts for co-current andcross flow. The correction factor in Eq. (4) is computed utilizingthe method proposed by Fakheri [22]. Namely, the value of Ft is gi-ven as a function of the inlet and outlet cold and hot side tempera-tures and of the number of shell passes. The overall heat transfercoefficient is calculated as the sum of five different contributors:the fluid film coefficient ho outside the tubes, the fluid film coeffi-cient hi inside the tubes, the outside dirt coefficient (fouling factor)hod, the inside dirt coefficient hid and the thermal conductivity of thetube wall material kw. The overall coefficient U based on the outsidearea of the tube can be calculated as follows:
1U¼ 1
hoþ 1
hodþ
d0 ln d0di
2kwþ d0
di
1hidþ d0
di
1hi
ð5Þ
As reported in Richardson and Peacock [21], a typical range ofvalues of the fouling coefficient is 5000–10,000 W/m2 K for airand 2000–5000 W/m2 K for exhaust gases. An intermediate valueof 5000 W/m2 K is assumed for both streams. The tube materialis stainless steel with a thermal conductivity of 50 W/m K.
As depicted in Fig. 2, the tubes follow a triangular pattern,which is the most common configuration [21]. The geometricalvariables considered in the design are the outer diameter do ofthe tubes, the tube length lt, the tube thickness twt, the distance be-tween the tube centers (pitch) pt and the baffle spacing lb. A bafflecut of 25% is used [21]. The calculation of the heat transfer coeffi-cients on the tube side hi and on the shell side ho in Eq. (5) is basedon the experimental work carried out by Kern [23].
Fig. 2. Shell and tube heat exchanger geometry and tube pattern.

L. Pierobon, F. Haglind / Applied Energy 118 (2014) 156–165 159
hi ¼kt
dijthRetPr0:33
tlt
ltw
� �0:14
ð6Þ
ho ¼ks
dsjshResPr1=3
sls
lsw
� �0:14
ð7Þ
In Eqs. (6) and (7) the subscripts ‘‘s’’ and ‘‘t’’ refer to the shell sideand the tube side, respectively. The variable k represents the ther-mal conductivity and l the viscosity of the hot and cold stream.The viscosities ltw and lsw are then calculated with the tempera-ture of the inner and of the outer wall of the tubes, respectively.The variables Re and Pr are the Reynolds number and the Prandtlnumber. The quantities jth and jsh are the heat transfer factors ofthe tube side and of the shell side and are evaluated as reportedin Richardson and Peacock [21]. The pressure drop on the shell sideDps are computed with the method proposed by Kern [23] and thepressure drop on the tube side Dpt with the modification intro-duced by Frank [24]:
Dps ¼ 8jsfds
de
lt
lb
ls
lsw
� ��0:14 qsu2s
2ð8Þ
Table 1Design point parameters assumed for the air bottoming cycle.
Variable Value
Compressor isentropic efficiency, gis,c 0.89Turbine isentropic efficiency, gis,t 0.9Recuperator relative pressure drop (tube side), Dpt 2%Recuperator outlet temperature difference, DT2 20 �CGenerator electric efficiency, gel 0.98
Dpt ¼ Nt 8jtflt
di
lt
ltw
� ��m
þ 2:5� �
qtu2t
2ð9Þ
where ut and us are the velocity across the shell and inside thetubes, Nt is the number of tubes, ds is the shell diameter, de is theequivalent diameter on the shell side and m is a coefficient equalto 0.25 for laminar flow (Re < 2100) and 0.14 for turbulent flow(Re > 2100). The quantities jtf and jsf are the friction factors of thetube side and of the shell side and are evaluated as reported inRichardson and Peacock [21]. The geometry of the recuperator canbe calculated following the iterative design procedure describedin detail in Richardson and Peacock [21]. The design process canbe summarized in the following steps:
(a) Calculation of the heat rate _Q using Eq. (4).(b) Initial guess for the value of the overall heat transfer
coefficient U and preliminary calculation of the heat transferarea A.
(c) Computation of the heat exchanger geometry given the tubelength lt, outer diameter do, tube pitch pt, tube thickness twt
and baffle spacing lb.(d) Computation of the fluid velocities on the tube and shell side
and of the individual fluid film coefficients hi and ho (see Eqs.(6) and (7)).
(e) Calculation of the overall heat transfer coefficient U andcomparison with the initial trial value U.
(f) Re-iteration of the procedure from step (b) to step (e) untilthe difference between the two latest U values is lower thana certain value.
(g) Calculation of the pressure losses on the tube side Dpt andon the shell side Dps (see Eqs. (8) and (9)).
Detailed equations on how to derive the quantities describingthe geometry of shell and tube heat exchangers (e.g. shell diame-ter, number of tubes and the equivalent diameter of the shell) forgiven tube length, outer diameter, tube thickness, tube pitch andbaffle spacing are reported in Richardson and Peacock [21]. The de-sign procedure implemented in MATLAB� 2012a has been vali-dated using an example outlined in Richardson and Peacock [21],comprising the design of a heat exchanger to sub-cool condensatefrom a methanol condenser with the use of liquid water as coolant.The results indicate differences of less than 1% in overall heattransfer coefficients and pressure drops between the models de-rived here and the results provided in Richardson and Peacock [21].
The recuperator is assumed to be a cylinder of diameter ds (shelldiameter) and height lt. Eq. (10) enables to compute the volume ofthe recuperator; a correction factor of 1.2 is applied to consider thespace required by the inlet and outlet ducts.
Vrec ¼ 1:2p4
d2s lt ð10Þ
The purchase equipment cost of the recuperator PECrec relates tothe heat transfer area A as reported in Eq. (11). The expression wassuggested by Hall [26] for stainless steel shell and tube heatexchangers.
PECrec ¼ 10;000þ 324A0:91 ð11Þ
2.3. Theory of power maximization
The main scope of an air bottoming cycle placed at the bottomof a gas turbine is to convert most of the exhaust heat into electricpower, i.e. to maximize the net power output. Considering areversible ABC with no heat losses to the environment, the optimalpressure ratio rc and exhaust temperature TH,out can be evaluatedusing the theory outlined in Bejan [15] and Leff [27]. If the irrever-sibilities associated with the compression and expansion processesand with the heat transfer process in the recuperator are included,the optimal pressure ratio and exhaust temperature can beexpressed as follows:
rc ¼p2
p1¼
TH;in�DT1T1
gis;cgis;t
� � k2ðk�1Þ
ffiffiffiffiffiffiffiffiffiffiffiffip3=p2
p ð12Þ
TH;out ¼ DT2 þ T1ð1� 1=gis;cÞ þ
ffiffiffiffiffiffiffiffiffiffiffiffiffiffiffiffiffiffiffiffiffiffiffiffiffiffiffiffiffiffiffiffiffiffiffiffiffiffiffiffiTH;in � DT1
T1gis;t
gis;c
sp3
p2
� �k�12k
,
ð13Þ
Eqs. (12) and (13) provide the pressure ratio and the temperatureof the exhaust gases that maximize the net power output of theABC for given compressor and turbine isentropic efficiencies, theinlet and outlet temperature difference and the pressure drop ofthe recuperator. Generally, when comparing turbomachineries ofdifferent pressure ratios, it is advisable to work with constant poly-tropic efficiency rather than an isentropic efficiency. In this paper,however, isentropic efficiencies are employed, because doing soenables us to derive analytical expressions for the exhaust gas tem-perature and the optimal pressure ratio (see Eqs. (12) and (13)) andto evaluate directly the cost of the air compressor and turbine (seeEqs. (1) and (2)). For reasons of consistency, the same approach isutilized in the multi-objective optimization. The implications onthe results of using isentropic efficiencies rather than polytropicefficiencies are quantified in Section 3. Table 1 lists the design vari-ables assumed to solve the ABC using the theory of powermaximization.

Table 2Lower and upper bounds specified for the variables included in the multi-objectiveoptimization (bounds for the geometry of the heat exchanger are taken fromRichardson and Peacock [21]).
Parameter Lowerbound
Upperbound
Recuperator inlet temperature difference, DT1 20 �C 70 �CRecuperator outlet temperature difference,
DT2
20 �C 70 �C
Pressure ratio, p2/p1 1.5 4.5Compressor isentropic efficiency, gis,c 0.8 0.9Turbine isentropic efficiency, gis,t 0.8 0.92Tube outer diameter, do 16 mm 50 mmTube length, lt 1.83 m 7.32 mTube thickness, twt 1.2 mm 3.2 mmBaffle spacing, lb 0.2ds 1.0ds
Tube pitch, pt 1.15do 2.25do
160 L. Pierobon, F. Haglind / Applied Energy 118 (2014) 156–165
2.4. Multi-objective optimization
The theory of power maximization enables us to find the opti-mal design of the air bottoming cycle based on the net power out-put. However, the methodology does not include the economicfeasibility of the ABC as waste heat recovery unit. Furthermore,in many applications, e.g. on off-shore platforms, the compactnessof the unit is a crucial concern. These issues are addressed byemploying a multi-objective optimization which optimizes simul-taneously two or more functions by means of a specific algorithm.The user defines one or more objective functions, sets the numberof variables and the upper and lower bounds, and subsequently theroutine starts to evaluate the objective functions. Compared to gra-dient-based methods (e.g. Steepest Descent Method [28]), the ge-netic algorithm (GA) [29] is used as it avoids the calculation ofderivatives. Furthermore, Kocer and Arora [30] found that com-pared to the simulating annealing method and the enumerationmethod, the GA requires less computational time and has a highertendency to converge to global optima. The population and gener-ation size are set to 1000 and 200 while the crossover fraction andmigration factor are fixed to 0.8 and 0.2. These numerical values
Fig. 3. Structure of the multi-objective algorithm. The optimization routine involves thobjective functions.
are selected by means of a sensitivity analysis in order to ensurethe repeatability of the solution when different simulations areperformed and to avoid that the method stops on local minima/maxima. The solution of a multi-objective optimization is not a sin-gle global solution, but a set of points that all fit the so-called ‘‘Par-eto optimality’’. Hence, the routine provides a Pareto front (curve)with a number of dimensions equal to the size of the array of theobjective functions J:
J ¼ _Pnet;Vrec;NPVh i
ð14Þ
As expressed in Eq. (14), the net power output of the ABC, the vol-ume of the recuperator and the net present value are selected asobjective functions. According to Bejan et al. [31], the NPV can becalculated considering the equipment lifespan n, the interest factorq, the total capital investment ITOT and the annual income Ri:
NPV ¼Xn
i¼1
Ri
ð1þ qÞi� ITOT ð15Þ
The array of the optimization variables X considered in thiswork can be expressed as follows:
X ¼ ½gis;c;gis;t ;DT1;DT2; rc; do; lt ; twt ; lb;pt � ð16Þ
where DT1 and DT2 are the temperature differences at the inlet andoutlet of the recuperator. In order to find a compromise betweeneconomy and performance of the compressor and turbine, the isen-tropic efficiencies are included in the set of optimization variables.In fact, high isentropic efficiencies imply lower thermodynamicirreversibilities (higher net power output) at the price of higherinvestment costs (see Eqs. (1) and (2)). Hence, using the set ofobjective functions defined in Eq. (14), the optimal quantities canbe determined. The lower and upper bounds for each variable in-volved in the optimization process are listed in Table 2.
The graphic representation of the complete optimization algo-rithm is depicted in Fig. 3. Firstly, the GA generates the initial pop-ulation using pseudo random values for the optimization variablesrespecting the lower and upper bounds. The variables are thenpassed to the ABC solver that calculates the net power output
e air bottoming cycle solver, the shell and tube designer, and the evaluation of the

Table 3Design point specifications for the Siemens SGT-500 twin-spool gas turbine [5].
Model Siemens SGT-500
Turbine inlet temperature 850 �CExhaust gas temperature 376 �CExhaust gas mass flow 93.5 kg/sNet power output 17.014 MWHeat rate 11312 kJ/kW h
L. Pierobon, F. Haglind / Applied Energy 118 (2014) 156–165 161
and the temperature, and pressure and enthalpy in the four nodesof the cycle (see Fig. 1).
At this stage the pressure drop in the recuperator is set to 0.Subsequently, the gas to gas shell and tube heat exchanger is de-signed by acquiring the inlet and outlet temperatures and pres-sures, the mass flows on each side and the optimization variablesrelated the geometric of the recuperator (i.e. the outer diameter,the length and the thickness of the tubes, the baffle spacing andthe tube pitch). The shell and tube designer computes the heattransfer area based on the well-established design procedure de-scribed in details in Richardson and Peacock [21] and summarizedin Section 2.2. Moreover, it is verified that the velocities in the tubeand in the shell are within the admissible range of gaseous fluids(5–30 m/s [21]). The shell and tube designer evaluates the volumeand the pressure drop on each side of the recuperator. Subse-quently, the ABC solver re-calculates the net power output includ-ing the pressure drop of the recuperator. The procedure continueswith the calculation of the investment cost and the net presentvalue. The routine terminates when the maximum number ofgenerations is reached or when the average change of the solutionis lower than the specified tolerance (10�3); if this is not the case, anew calculation starts.
2.5. Case study
The results of the power maximization theory and the multi-objective optimization are compared for designing a waste heatrecovery unit on the Draugen off-shore platform, located 150 kmfrom Kristiansund, in the Norwegian Sea. The platform, operatedby A/S Norske Shell, produces both oil and gas. The oil is stored
Fig. 4. Combined cycle layout including one SGT-500 tw
in storage cells at the bottom of the sea and is exported via a shut-tle tanker. The gas flows through the Åsgard gas pipeline to Kårstøwhere it is sold to the market. Three Siemens SGT-500 gas turbinesare utilized on the platform to provide the normal total electricload, equal to 19 MW. The power demand is increased up to25 MW (peak load) during seawater lifting, water injection, andoil export. In order to enhance the reliability and to diminish therisk of failure of the power generation system, two turbines runat a time covering 50% of the load each, while the third is kepton stand-by, allowing for maintenance work. Despite the low per-formance, this strategy ensures the necessary reserve power forpeak loads, and the safe operation of the engines. The engine modelis the C-version launched in the beginning of the 1980s. Table 3reports the design point specifications of the engine [5].
As can be noted in Fig. 4, the low pressure compressor (LPC) andthe high pressure compressor (HPC) are connected to the low pres-sure turbine (LPT) and to the high pressure turbine (HPT) respec-tively. In addition, the gas turbine features a power turbine (PT).Fig. 4 indicates that the compressed air flows on the tube side ofthe recuperator, since high pressure tubes are cheaper than highpressure shells [21].
NPV ¼Xn
i¼1
Mhu RCH4 þ RCO2
ð1þ qÞi
� ITOT ð17Þ
As expressed in Eq. (17), the evaluation of the net present value re-quires the calculation of the total investment cost ITOT and of thetwo incomes RCO2 and RCH4. The first relates to the CO2 taxes andthe second to the fuel savings. The detailed equations utilized to as-sess the two incomes and the total investment cost (see Eq. (17))can be retrieved from Pierobon et al. [25]. The maintenance factorM and the utilization factor hu are set to 0.9 and 7000 h/year. Anequipment lifespan n of 20 years and an interest factor q of 10%are assumed. Based on the press release of the Ministry of the Envi-ronment [4], the carbon tax is set to 410 NOK per ton of CO2. TheCO2 emissions of the SGT-500 are set to 2.75 kgCO2/kgf [32] whilethe fuel consumption is calculated depending on the load usingthe data provided by the gas turbine manufacturer. In the case thatthe power output of the combined system (one gas turbine and theair bottoming cycle) is lower than 19 MW the system operates at100% and a second gas turbine provides the remaining power. On
in-spool gas turbine and the air bottoming cycle.
0
500
1000
1500
2000
2500
3000
1 1.5 2 2.5 3 3.5 4 4.5 5
Net
pow
er o
uput
[kW
]
Pressure ratio
TIT=350 °CTIT=320 °CTIT=300 °CTIT=280 °C
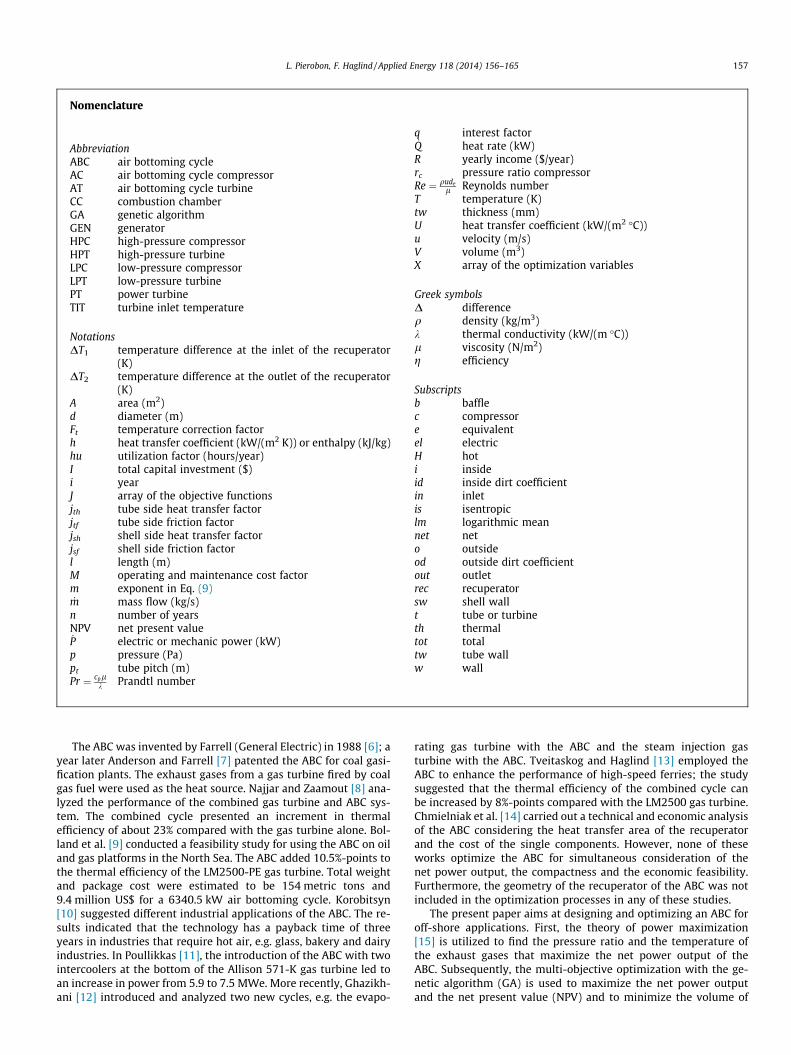
Fig. 5. Net power output versus pressure ratio for different turbine inlet temper-atures (TITs). The dots are calculated applying Eq. (12).
0
50
100
150
200
250
1 1.5 2 2.5 3 3.5 4 4.5 5
Exh
aust
gas
tem
pera
ture
[°C
]
Pressure ratio
simulations
Eqs. (12) - (13) TIT=350 °C
Eqs. (12) - (13) TIT=320 °C
Eqs. (12) - (13) TIT=300 °C
Eqs. (12) - (13) TIT=280 °C
Fig. 6. Exhaust gas temperature versus pressure ratio. The dots are calculated fordifferent turbine inlet temperatures (TITs) applying Eqs. (12) and (13) and using theparameters listed in Table 1.
3.5
3.0
4.5
2
2.5
4
500
1000
1500
2000
2500
3000
2% 4% 6% 8% 10% 12% 14%
Net
pow
er o
uput
[kW
]
Thermal efficiency [%]
TIT=350˚C
TIT=320˚C
TIT=300˚C
TIT=280˚C
1.5
Fig. 7. Net power output versus ABC thermal efficiency for different turbine inlettemperatures (TITs). The corresponding pressure ratios for the curve with thehighest turbine inlet temperature (blue line) are also reported. (For interpretationof the references to color in this figure legend, the reader is referred to the webversion of this article.)
Table 4Design point results for the air bottoming cycle.
Variable Value
Pressure ratio, p2/p1 2.80Mass flow, _m 98.4 kg/sExhaust temperature, TH,out 145.5 �CRecuperator inlet temperature difference, DT1 26 �C
Heat rate (recuperator), _Q 22,970 kW
Net power output, Pel 2793 kWThermal efficiency, gth 12.1%
162 L. Pierobon, F. Haglind / Applied Energy 118 (2014) 156–165
the contrary, the combined cycle provides alone the total power de-mand operating at part-load. For the latter case calculations showthat the combined cycle load is always higher than 95%; thus, a con-stant thermal efficiency for the combined cycle is assumed. Hence,the savings of CO2 emissions and of fuel consumption are calculatedwith respect to the existing power generation system. A constantCO2 emission (per kg of fuel) is assumed from the gas turbines whenthe load is reduced.
3. Results and discussion
In this section the results obtained through the theory of powermaximization are presented in Section 3.1. Subsequently, in Sec-tion 3.2, the outputs of the multi-objective optimization consider-ing both the volume of the recuperator and the net present valueare listed.
3.1. Maximum power design
The theory of power maximization, outlined in Section 2.3, al-lows obtaining the full profile (mass flow and outlet temperature)of the heat source and the ABC pressure ratio that maximizes thenet power output. The ISO conditions for the ambient pressureand temperature (1.013 bar and 288.15 K) are considered. Thepressure drop on the shell side of the recuperator Dps is neglected.
Fig. 5 depicts the net power output versus the pressure ratio ofthe air compressor for different turbine inlet temperatures, i.e. in-let temperature differences of the recuperator DT1. The dots in the
figure represent the values calculated using Eq. (12) and setting theisentropic exponent k equal to 1.37.
Eq. (12) gives an optimal pressure ratio of 2.80 and a net powerof 2793 kW which corresponds to a thermal efficiency of 12.1%. Atthe lowest turbine inlet temperature (280 �C), the maximum elec-tric production is 1867 kW at a pressure ratio of 2.28. Fig. 6 relatesthe exhaust temperature TH,out to the pressure ratio obtained withthe ABC solver (continuous line) and using Eqs. (12) and (13)(dots). The curve is the same at the different inlet temperature dif-ferences of the recuperator. However, the temperature of the ex-haust gases exiting the recuperator corresponding to themaximum power differs for each case ranging from 138.2 �C downto 117.5 �C. Furthermore, it can be observed that the optimal pres-sure ratio and exhaust gas temperature calculated using Eqs. (12)and (13) differ from the curve obtained by using the ABC solver(Section 2.1). Namely, Fig. 6 shows a highest relative deviation of5.3% on the calculation of the exhaust gas temperature at the opti-mal pressure ratio. It should also be noticed that the dots in Fig. 5do not meet exactly the maximum of the curves. The reasons forthe deviations are that, in order to derive Eqs. (12) and (13), airis treated as an ideal gas with a constant isentropic exponent k.
The net power output and the thermal efficiency of the ABC areplotted in Fig. 7 for different inlet temperature differences of therecuperator. Each curve presents a variation in the pressure ratiobetween 1.5 and 4.5 bar (see the blue line in Fig. 7). It can be notedthat the pressure ratios giving the maximum net power output andthe highest thermal efficiency are different. For example, at a tur-bine inlet temperature of 350 �C, the pressure ratios giving thehighest net power output and the best thermal efficiency arearound 2.80 and 3.75, respectively. At the lowest examinedtemperature (280 �C) the two maxima are located at a pressureratio of 2.28 (power output) and 2.75 (thermal efficiency). Hence,the design of the ABC reported in Table 4 can be proposed for

0
50
100
150
200
250
1200 1400 1600 1800 2000 2200 2400 2600 2800
Vol
ume
[m3 ]
Net power [kW]
Fig. 8. Pareto front obtained through the multi-objective optimization representingthe total volume of the recuperator versus net power output.
0
0.5
1
1.5
2
2.5
3
0 50 100 150 200 250
Net
pre
sent
val
ue [
M$]
Volume [m3]
Fig. 9. Pareto front obtained through the multi-objective optimization representingthe net present value versus the volume of the recuperator.
0
10
20
30
40
50
60
70
80
0 50 100 150 200 250
Hea
t tr
ansf
er c
oeff
icie
nt [
W/m
2 K]
Volume [m3]
Fig. 10. Overall heat transfer coefficient versus the volume of the recuperator foreach point of the Pareto front.
L. Pierobon, F. Haglind / Applied Energy 118 (2014) 156–165 163
recuperating the waste heat from the SGT-500 targeting the max-imum net power output.
To be noticed that the theory of power maximization does notenable selecting an optimal design of the recuperator, but it onlyallows the calculation of the pressure ratio and of the exhaustgas temperature that maximizes the power output. Theoretically,no limits on the isentropic efficiency of the compressor and theturbine and on the inlet and outlet temperature difference of therecuperator are encountered. Furthermore, a constant pressure rel-ative pressure drop (2%) in the recuperator is assumed. Therefore,it can be stated that the theory of power maximization is not suf-ficient for tailoring the ABC to recover the waste heat on off-shoreinstallation. Thus, the theory needs to be extended by including inthe objective functions the compactness of the system (i.e. the vol-ume of the recuperator) and economic indicators (e.g. net presentvalue and pay-back time).
3.2. Multi-objective optimization design
The multi-objective optimization gives 350 possible solutions,i.e. number of points in the 3-dimensional Pareto front. Fig. 8 re-lates the volume of the recuperator versus the net power output.The Pareto front ranges from a volume of 69.7 m3 up to207.7 m3. The higher the volume, the greater is the electricityproduction which varies from 1436 kW up to 2543 kW.
Fig. 9 depicts the net present value versus the volume of therecuperator. It can be seen that the net present value presents asteep increment between 69.7 and 127.7 m3, and it reaches amaximum of 2.80 M$. Subsequently, the NPV drops, with a similargradient, down to zero at a recuperator volume of 204.3 m3.
As concerns the optimization variables, the results indicate thatthe isentropic efficiencies of the compressor and of the turbine arewithin the range of 0.879–0.889 and of 0.879–0.903, respectively.As described in Section 2.3, in this work, isentropic efficienciesrather than polytropic efficiencies are utilized to quantify theirreversibility in the turbomachineries. The implication of thisassumption on the results is expected to be limited, since optimalperformance occurs within a narrow range of pressure ratios forthe ABC. The same optimization with polytropic efficienciesinstead of isentropic efficiencies indicates that deviations in thenet power output are expected to be less than 5%. The pressureratio of the compressor is 2.67 on average. The inlet and outlettemperature differences of the recuperator are 41.9 �C and61.0 �C on average. The length and the diameter of the tubes varybetween 4.76 and 5.75 m and between 26.9 and 41.0 mm. Thetubes are on average 1.53 mm thick. The ranges of solutions forthe tube pitch and the baffle spacing are 1.32–1.62 and
0.37–0.51, respectively. Furthermore, Fig. 10 shows the overallheat transfer coefficient versus the volume of the recuperator. Itcan be noticed that the heat transfer coefficient varies from 46.2to 69.0 W/m2 K and that it increases linearly with a decrease involume.
Figs. 8 and 9 suggest designing the air bottoming cycle to oper-ate where the net present value reaches the maximum (2.80 M$).This occurs at a volume of 127.7 m3, corresponding to a net poweroutput of 1983 kW. However, compactness may represent themajor constraint: thus, if a lower volume is required, the optimumdesign falls at the specified volume. For this specific case it is noteconomically feasible to implement the ABC when the availablevolume is lower than 69.7 m3. Table 5 lists the geometry, the pres-sure drop of the recuperator and the investment cost of each of theABC components.
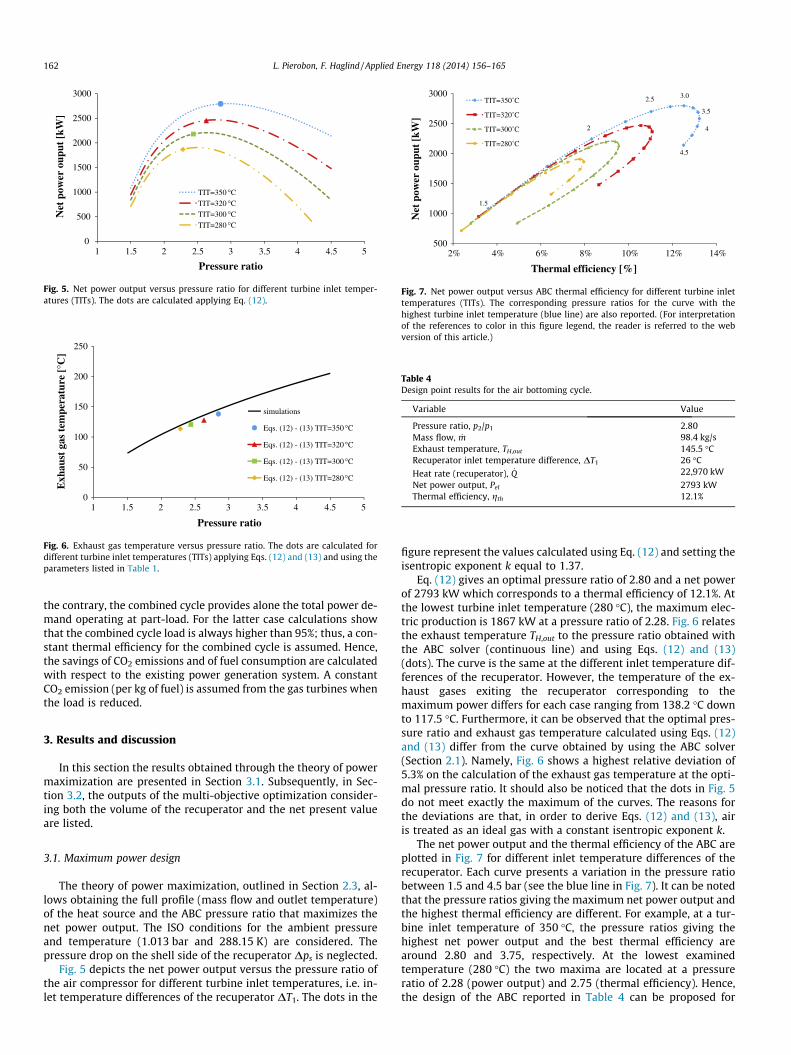
The pressure ratio and turbine inlet temperature giving thehighest economic revenue (2.52 and 332.4 �C, respectively) arelower than the values calculated with the theory of power maximi-zation. Consequently, the net power output and the thermalefficiency of the ABC are decreased by around 800 kW and2.0%-points respectively. The main reason is the different designof the recuperator. In fact, due to the low heat transfer coefficient58.7 W/m2 K, the volume and the purchase cost become large(127.7 m3 and 1.12 M$, respectively). Hence, higher inlet andoutlet temperature differences (43.6 �C and 64.7 �C, respectively)are needed for the recuperator. On the other hand, the pressuredrops on the tube side of the recuperator are low (0.05 bar) and,therefore, the friction losses are limited. The designs based onthe theory of power maximization and on the multi-objective opti-mization, respectively, are depicted in a T–s diagram; see Fig. 11.
As indicated by the multi-objective optimization the poweroutput and the thermal efficiency of the SGT-500 gas turbine
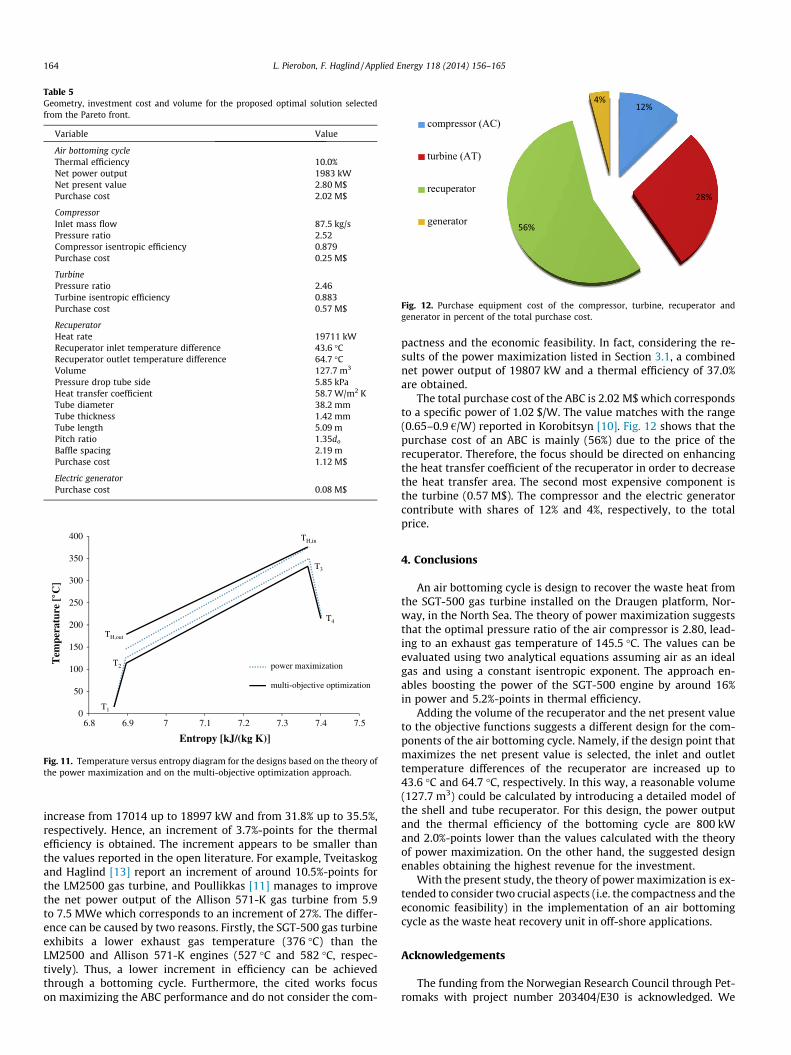
Table 5Geometry, investment cost and volume for the proposed optimal solution selectedfrom the Pareto front.
Variable Value
Air bottoming cycleThermal efficiency 10.0%Net power output 1983 kWNet present value 2.80 M$Purchase cost 2.02 M$
CompressorInlet mass flow 87.5 kg/sPressure ratio 2.52Compressor isentropic efficiency 0.879Purchase cost 0.25 M$
TurbinePressure ratio 2.46Turbine isentropic efficiency 0.883Purchase cost 0.57 M$
RecuperatorHeat rate 19711 kWRecuperator inlet temperature difference 43.6 �CRecuperator outlet temperature difference 64.7 �CVolume 127.7 m3
Pressure drop tube side 5.85 kPaHeat transfer coefficient 58.7 W/m2 KTube diameter 38.2 mmTube thickness 1.42 mmTube length 5.09 mPitch ratio 1.35do
Baffle spacing 2.19 mPurchase cost 1.12 M$
Electric generatorPurchase cost 0.08 M$
T1
T2
T3
T4
TH,out
TH,in
0
50
100
150
200
250
300
350
400
6.8 6.9 7 7.1 7.2 7.3 7.4 7.5
Tem
pera
ture
[C
]
Entropy [kJ/(kg K)]
power maximization
multi-objective optimization
Fig. 11. Temperature versus entropy diagram for the designs based on the theory ofthe power maximization and on the multi-objective optimization approach.
Fig. 12. Purchase equipment cost of the compressor, turbine, recuperator andgenerator in percent of the total purchase cost.
164 L. Pierobon, F. Haglind / Applied Energy 118 (2014) 156–165
increase from 17014 up to 18997 kW and from 31.8% up to 35.5%,respectively. Hence, an increment of 3.7%-points for the thermalefficiency is obtained. The increment appears to be smaller thanthe values reported in the open literature. For example, Tveitaskogand Haglind [13] report an increment of around 10.5%-points forthe LM2500 gas turbine, and Poullikkas [11] manages to improvethe net power output of the Allison 571-K gas turbine from 5.9to 7.5 MWe which corresponds to an increment of 27%. The differ-ence can be caused by two reasons. Firstly, the SGT-500 gas turbineexhibits a lower exhaust gas temperature (376 �C) than theLM2500 and Allison 571-K engines (527 �C and 582 �C, respec-tively). Thus, a lower increment in efficiency can be achievedthrough a bottoming cycle. Furthermore, the cited works focuson maximizing the ABC performance and do not consider the com-
pactness and the economic feasibility. In fact, considering the re-sults of the power maximization listed in Section 3.1, a combinednet power output of 19807 kW and a thermal efficiency of 37.0%are obtained.
The total purchase cost of the ABC is 2.02 M$ which correspondsto a specific power of 1.02 $/W. The value matches with the range(0.65–0.9 €/W) reported in Korobitsyn [10]. Fig. 12 shows that thepurchase cost of an ABC is mainly (56%) due to the price of therecuperator. Therefore, the focus should be directed on enhancingthe heat transfer coefficient of the recuperator in order to decreasethe heat transfer area. The second most expensive component isthe turbine (0.57 M$). The compressor and the electric generatorcontribute with shares of 12% and 4%, respectively, to the totalprice.
4. Conclusions
An air bottoming cycle is design to recover the waste heat fromthe SGT-500 gas turbine installed on the Draugen platform, Nor-way, in the North Sea. The theory of power maximization suggeststhat the optimal pressure ratio of the air compressor is 2.80, lead-ing to an exhaust gas temperature of 145.5 �C. The values can beevaluated using two analytical equations assuming air as an idealgas and using a constant isentropic exponent. The approach en-ables boosting the power of the SGT-500 engine by around 16%in power and 5.2%-points in thermal efficiency.
Adding the volume of the recuperator and the net present valueto the objective functions suggests a different design for the com-ponents of the air bottoming cycle. Namely, if the design point thatmaximizes the net present value is selected, the inlet and outlettemperature differences of the recuperator are increased up to43.6 �C and 64.7 �C, respectively. In this way, a reasonable volume(127.7 m3) could be calculated by introducing a detailed model ofthe shell and tube recuperator. For this design, the power outputand the thermal efficiency of the bottoming cycle are 800 kWand 2.0%-points lower than the values calculated with the theoryof power maximization. On the other hand, the suggested designenables obtaining the highest revenue for the investment.
With the present study, the theory of power maximization is ex-tended to consider two crucial aspects (i.e. the compactness and theeconomic feasibility) in the implementation of an air bottomingcycle as the waste heat recovery unit in off-shore applications.
Acknowledgements
The funding from the Norwegian Research Council through Pet-romaks with project number 203404/E30 is acknowledged. We

L. Pierobon, F. Haglind / Applied Energy 118 (2014) 156–165 165
also acknowledge the kind support from Siemens Industrial Turbo-machinery AB, Finspång, Sweden for providing necessary technicaldocumentation.
References
[1] U.S. Energy Information Administration. Annual energy review 2011. DOE/EIA-0384(2011); September 2012. <http://www.eia.gov/totalenergy/data/annual/pdf/aer.pdf> [08.02.13].
[2] De Paepe M. Situation of the ORCNext project. In: International symposium onadvanced waste heat valorization technologies, September 13–14, Kortrijk,Belgium; 2012.
[3] Nguyen TV, Elmegaard B, Pierobon L, Haglind F, Breuhaus P. Modelling andanalysis of offshore energy systems on North Sea oil and gas platforms. In:Proceedings of the 53rd Scandinavian Simulation and Modeling Societyconference, October 4–6, Reykjavik, Iceland; 2012.
[4] Ministry of the Environment. The government is following up on the climateagreement. Press release, 08.10.2012, Norway. <http://www.regjeringen.no/en/dep/md/press-centre/Press-releases/2012/the-government-is-following-up-on-the-cl.html?id=704137> [07.02.13].
[5] Pierobon L, Rambabu K, Haglind F. Waste heat recovery for offshoreapplications. In: ASME 2012 international mechanical engineering congressand exposition, IMECE2012, November 9–15, Houston, Texas, USA; 2012.
[6] Farrell WM. Air cycle thermodynamic conversion system. United States patentnumber 4751814; June 1988.
[7] Alderson ED. Air bottoming cycle for coal gasification plant. United Statespatent number 4785621; November 1988.
[8] Najjar YSH, Zaamout MS. Performance analysis of gas turbine air-bottomingcombined system. Energy Convers Manage 1996;37(4):399–403.
[9] Bolland O, Førde M, Hande B. Air bottoming cycle: use of gas turbine wasteheat for power generation. J Eng Gas Turb Power 1996;118(2):359–68.
[10] Korobitsyn MA. Industrial applications of the air bottoming cycle. EnergyConvers Manage 2002;43:1311–22.
[11] Poullikkas A. An overview of current and future sustainable gas turbinetechnologies. Renew Sustain Energy Rev 2005;9:409–43.
[12] Ghazikhani M, Passandideh-Fard M, Mousavi M. Two new high-performancecycles for gas turbine with air bottoming. Energy 2011;36:294–304.
[13] Tveitaskog AK, Haglind F. Optimization of advanced liquid natural gas-fuelledmachinery systems for a high-speed ferry. In: Proceedings of ASME Turbo Expo2012, GT2012, June 11–15, Copenhagen, Denmark; 2012.
[14] Chmielniak T, Czaja D, Lepszy S. Technical and economic analysis of the gasturbine bottoming cycle. In: Proceedings of ASME Turbo Expo 2012, GT2012,June 11–15, Copenhagen, Denmark; 2012.
[15] Bejan A. Advanced engineering thermodynamics. 3rd ed. Wiley; 2006. ISBN-13: 978-0-471-67763-5.
[16] The MathWorks, Inc. General release notes for R2012a; 2012.[17] Lemmon WE, Huber LM, McLinden OM. NIST reference fluid thermodynamic
and transport properties – REFPROP, version 9.0. User’s guide. ThermophysicalProperties Division, National Institute of Standards and Technology, Boulder,Colorado, USA; 2010.
[18] Valero A, Lozano MA, Serra L, Tsatsaronis G, Pisa J, Frangopoulos C, et al. CGAMproblem: definition and conventional solution. Energy 1994;19(3):279–86.
[19] Lian ZT, Chua KJ, Chou SK. A thermoeconomic analysis of biomass energy fortrigeneration. Appl Energy 2010;87:84–95.
[20] Douglas KL. Handbook of sulfuric acid manufacturing. DKL Engineering; 1961.ISBN 0-9738992-0-4.
[21] Richardson JF, Peacock DG. Coulson and Richardson’s chemical engineering –chemical and biochemical reactors and process control. vol. 3, 3rd ed. Elsevier;2001. ISBN 0-7506-4950-X.
[22] Fakheri A. A general expression for the determination of the log meantemperature correction factor for shell and tube heat exchangers. J HeatTransfer 2003;125(3):527–30.
[23] Kern DQ. Process heat transfer. McGraw-Hill; 1950. ISBN 0-07-Y85353-3.[24] Frank O. Simplified design procedure for tubular exchangers. Practical aspects
of heat transfer. Chem Eng Prog Tech Manual, Am Inst Chem Eng; 1978.[25] Pierobon L, Nguyen TV, Larsen U, Haglind F, Elmegaard B. Multi-objective
optimization of organic Rankine cycles for waste heat recovery in offshoreapplications. Energy 2013;58:538–49.
[26] Hall SG. Capital cost targets for heat exchanger networks comprising mixedmaterials of construction, pressure ratings and exchanger types. Chem Eng1990;14(3):319–35.
[27] Leff HS. Thermal efficiency at maximum work output: new results for oldengines. Am J Phys 1987;55(7):602–10.
[28] Mordecai A. Nonlinear programming: analysis and methods. Dover Publishing;2003. ISBN 0-486-43227-0.
[29] Falkenauer E. Genetic algorithms and grouping problems. Wiley; 1997. ISBN978-0-471-97150-4.
[30] Kocer FY, Arora JS. Standardization of steel pole design using discreteoptimization. J Struct Eng 1997;123(3):345–9.
[31] Bejan A, Tsatsaronis G, Moran M. Thermal design andoptimization. Canada: John Wiley & Sons, Inc.; 1995, ISBN 0-471-58467-3.
[32] Rypdal K. Anthropogenic emissions of the greenhouse gases CO2, CH4 and N2Oin Norway. Report 93/24. Central Bureau of Statistics of Norway, Oslo; 1993.ISBN 82-537-3917-6.