Embed Size (px)
Citation preview

Design and Implementation of QUEST 2.0
A THESIS
SUBMITTED IN PARTIAL FULFILLMENT OF THE
REQUIREMENTS FOR THE DEGREE OF
Master of Technology
IN THE
Computer Science and Engineering
BY
Urvashi Raj
Computer Science and Automation
Indian Institute of Science
Bangalore – 560 012 (INDIA)
June, 2018

Declaration of Originality
I, Urvashi Raj, with SR No. 04-04-00-10-42-16-1-13818 hereby declare that the material
presented in the thesis titled
Design and Implementation of QUEST 2.0
represents original work carried out by me in the Department of Computer Science and
Automation at Indian Institute of Science during the years 2016-18.
With my signature, I certify that:
• I have not manipulated any of the data or results.
• I have not committed any plagiarism of intellectual property. I have clearly indicated and
referenced the contributions of others.
• I have explicitly acknowledged all collaborative research and discussions.
• I have understood that any false claim will result in severe disciplinary action.
• I have understood that the work may be screened for any form of academic misconduct.
Date: Student Signature
In my capacity as supervisor of the above-mentioned work, I certify that the above statements
are true to the best of my knowledge, and I have carried out due diligence to ensure the
originality of the report.
Advisor Name: Prof. Jayant R. Haritsa Advisor Signature
1


© Urvashi Raj
June, 2018
All rights reserved


DEDICATED TO
My Family

Acknowledgement
I would like to express my sincere gratitude to my project advisor, Prof. Jayant R. Haritsa
for giving me an opportunity to work on this project. I am thankful for his valuable guidance
and moral support. His suggestions had always made me to have a better perspective of the
problem, and had steered me in the right direction for solution whenever needed.
I am thankful to Mr. Srinivas Karthik for mentoring and assisting me throughout the project.
His feedback and suggestions for implementation was very helpful. This project would not
have been possible without his constant support and motivation. I would also like to thank
Department of Computer Science and Automation for providing excellent learning evironment.
Finally I am indebted to my family for their constant support and encouragement that no
amount of thanks can suffice.
i

Abstract
In modern database systems, a query optimizer is used to estimate predicate selectivities during
plan selection for executing SQL queries. In practice, these estimates are often significantly
different compared to the actual values encountered during query execution which results in a
highly sub-optimal choice of the execution plan and corresponding blowups in query response
times. To address this classical selectivity estimation problem in databases, few radically dif-
ferent approaches such as PlanBouquet[2] and SpillBound[1] for query processing have been
proposed, wherein the estimation process is completely abandoned and replaced with a cal-
ibrated discovery mechanism. The beneficial outcome of these approaches is that provable
guarantees on worst-case performance are obtained, thereby facilitating robust query process-
ing.
In order to visually observe the estimation problem that plagues current database optimizers,
and the robustness characteristics that the PlanBouquet technique brings to bear on these
chronic problems. QUEST[4], a Java-based graphical tool already developed. In this work, we
have enhanced QUEST with (a) modified interface that shows the impact of errors in selectivity
estimation for join predicates done by the native optimizer by comparing the cost of optimizer’s
chosen plan with the oracular plan which is obtained by providing correct selectivity estimates.
(b) We also visually showcase the query execution using the SpillBound algorithm which pro-
vides better performance than PlanBouquet and overcomes few limitations of PlanBouquet. (c)
Finally, we also show a performance comparison of SpillBound with PlanBouquet and native
optimizer.
ii
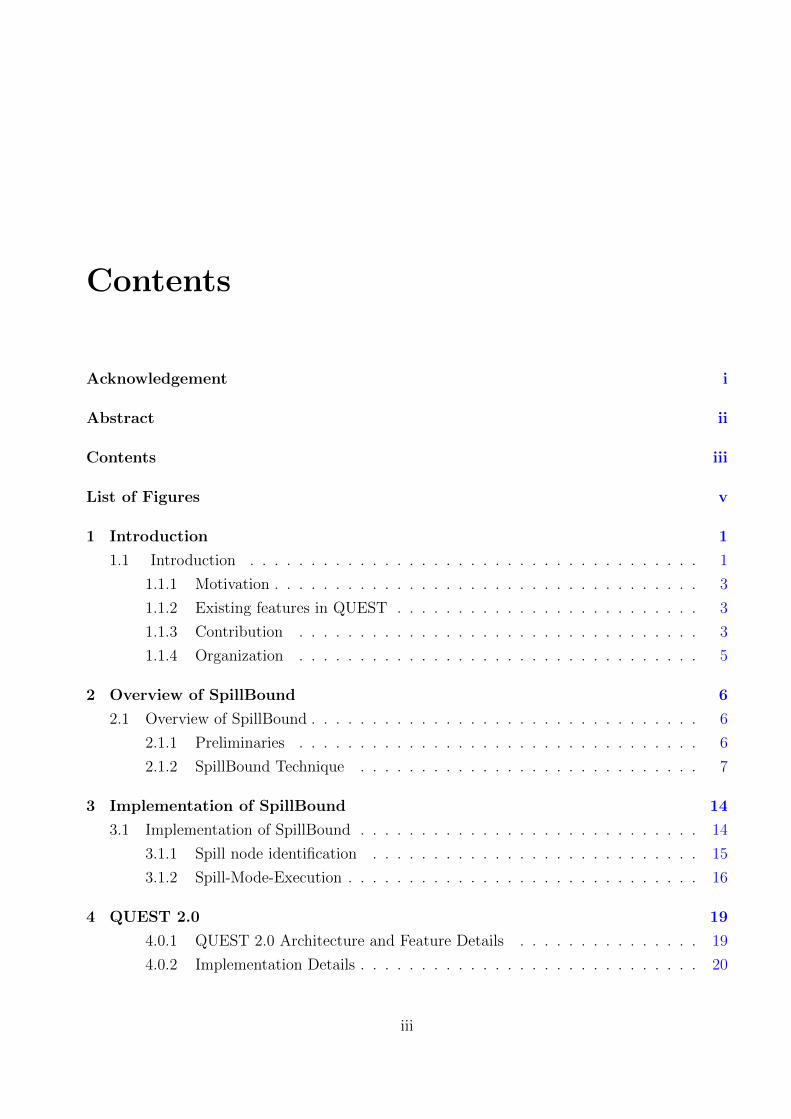
Contents
Acknowledgement i
Abstract ii
Contents iii
List of Figures v
1 Introduction 1
1.1 Introduction . . . . . . . . . . . . . . . . . . . . . . . . . . . . . . . . . . . . . 1
1.1.1 Motivation . . . . . . . . . . . . . . . . . . . . . . . . . . . . . . . . . . . 3
1.1.2 Existing features in QUEST . . . . . . . . . . . . . . . . . . . . . . . . . 3
1.1.3 Contribution . . . . . . . . . . . . . . . . . . . . . . . . . . . . . . . . . 3
1.1.4 Organization . . . . . . . . . . . . . . . . . . . . . . . . . . . . . . . . . 5
2 Overview of SpillBound 6
2.1 Overview of SpillBound . . . . . . . . . . . . . . . . . . . . . . . . . . . . . . . . 6
2.1.1 Preliminaries . . . . . . . . . . . . . . . . . . . . . . . . . . . . . . . . . 6
2.1.2 SpillBound Technique . . . . . . . . . . . . . . . . . . . . . . . . . . . . 7
3 Implementation of SpillBound 14
3.1 Implementation of SpillBound . . . . . . . . . . . . . . . . . . . . . . . . . . . . 14
3.1.1 Spill node identification . . . . . . . . . . . . . . . . . . . . . . . . . . . 15
3.1.2 Spill-Mode-Execution . . . . . . . . . . . . . . . . . . . . . . . . . . . . . 16
4 QUEST 2.0 19
4.0.1 QUEST 2.0 Architecture and Feature Details . . . . . . . . . . . . . . . 19
4.0.2 Implementation Details . . . . . . . . . . . . . . . . . . . . . . . . . . . . 20
iii

CONTENTS
4.0.3 Modifications in QUEST . . . . . . . . . . . . . . . . . . . . . . . . . . . 21
4.0.3.1 Native Optimizer Panel . . . . . . . . . . . . . . . . . . . . . . 22
4.0.4 Bouquet Identification Panel . . . . . . . . . . . . . . . . . . . . . . . . 23
4.0.4.1 Query Execution Panel . . . . . . . . . . . . . . . . . . . . . . . 24
4.0.4.2 Performance comparison panel . . . . . . . . . . . . . . . . . . 26
5 Verification for Implementation Correctness 27
5.1 Checks for Correct Implementation . . . . . . . . . . . . . . . . . . . . . . . . . 27
6 Performance Report 31
7 Conclusion 32
Bibliography 33
iv
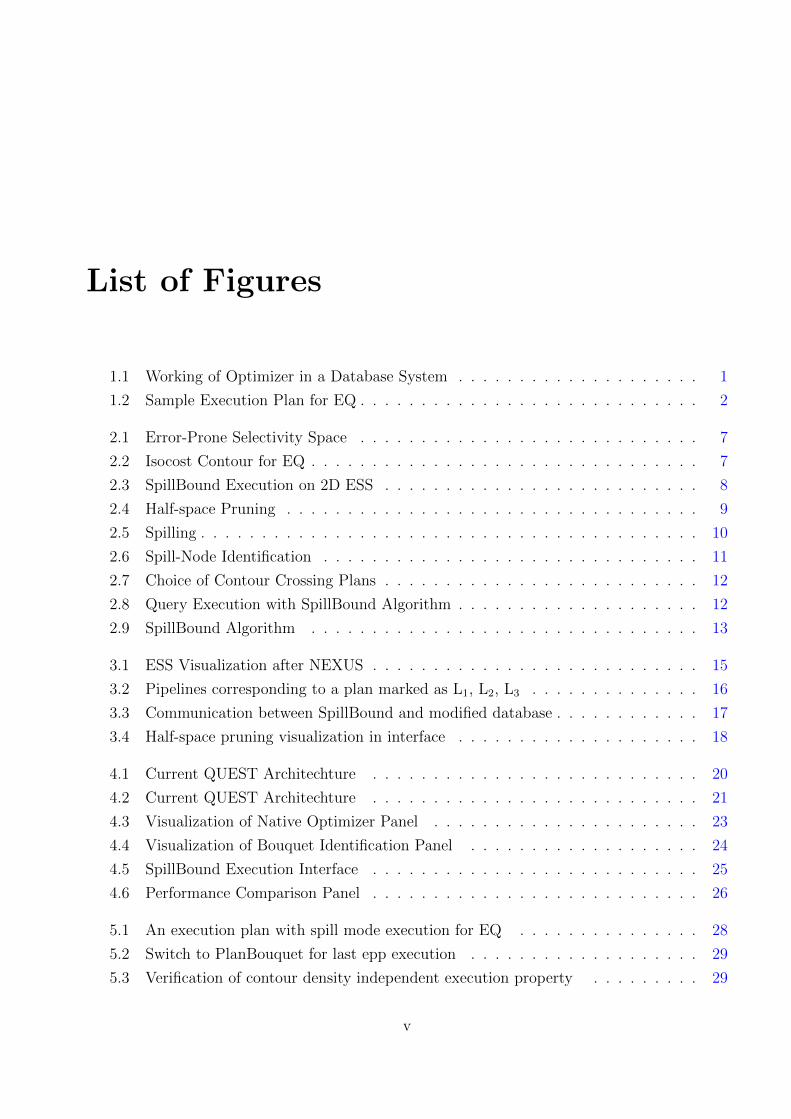
List of Figures
1.1 Working of Optimizer in a Database System . . . . . . . . . . . . . . . . . . . . 1
1.2 Sample Execution Plan for EQ . . . . . . . . . . . . . . . . . . . . . . . . . . . . 2
2.1 Error-Prone Selectivity Space . . . . . . . . . . . . . . . . . . . . . . . . . . . . 7
2.2 Isocost Contour for EQ . . . . . . . . . . . . . . . . . . . . . . . . . . . . . . . . 7
2.3 SpillBound Execution on 2D ESS . . . . . . . . . . . . . . . . . . . . . . . . . . 8
2.4 Half-space Pruning . . . . . . . . . . . . . . . . . . . . . . . . . . . . . . . . . . 9
2.5 Spilling . . . . . . . . . . . . . . . . . . . . . . . . . . . . . . . . . . . . . . . . . 10
2.6 Spill-Node Identification . . . . . . . . . . . . . . . . . . . . . . . . . . . . . . . 11
2.7 Choice of Contour Crossing Plans . . . . . . . . . . . . . . . . . . . . . . . . . . 12
2.8 Query Execution with SpillBound Algorithm . . . . . . . . . . . . . . . . . . . . 12
2.9 SpillBound Algorithm . . . . . . . . . . . . . . . . . . . . . . . . . . . . . . . . 13
3.1 ESS Visualization after NEXUS . . . . . . . . . . . . . . . . . . . . . . . . . . . 15
3.2 Pipelines corresponding to a plan marked as L1, L2, L3 . . . . . . . . . . . . . . 16
3.3 Communication between SpillBound and modified database . . . . . . . . . . . . 17
3.4 Half-space pruning visualization in interface . . . . . . . . . . . . . . . . . . . . 18
4.1 Current QUEST Architechture . . . . . . . . . . . . . . . . . . . . . . . . . . . 20
4.2 Current QUEST Architechture . . . . . . . . . . . . . . . . . . . . . . . . . . . 21
4.3 Visualization of Native Optimizer Panel . . . . . . . . . . . . . . . . . . . . . . 23
4.4 Visualization of Bouquet Identification Panel . . . . . . . . . . . . . . . . . . . 24
4.5 SpillBound Execution Interface . . . . . . . . . . . . . . . . . . . . . . . . . . . 25
4.6 Performance Comparison Panel . . . . . . . . . . . . . . . . . . . . . . . . . . . 26
5.1 An execution plan with spill mode execution for EQ . . . . . . . . . . . . . . . 28
5.2 Switch to PlanBouquet for last epp execution . . . . . . . . . . . . . . . . . . . 29
5.3 Verification of contour density independent execution property . . . . . . . . . 29
v

Chapter 1
Introduction
1.1 Introduction
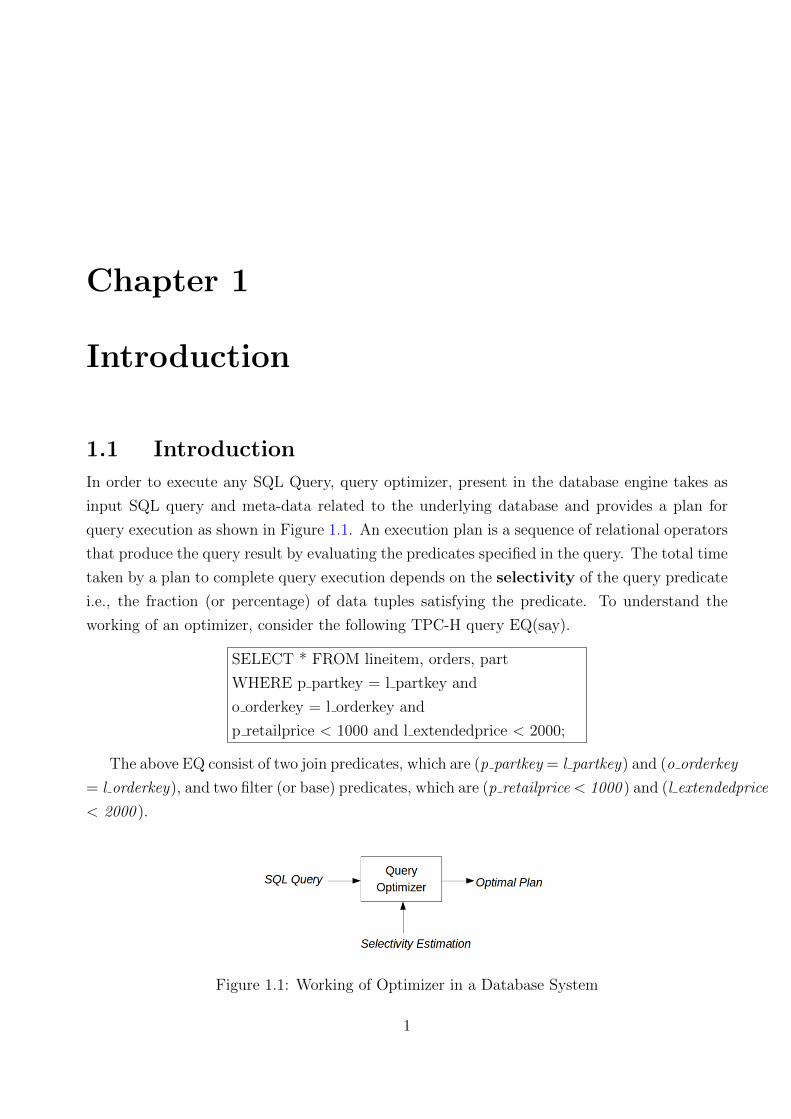
In order to execute any SQL Query, query optimizer, present in the database engine takes as
input SQL query and meta-data related to the underlying database and provides a plan for
query execution as shown in Figure 1.1. An execution plan is a sequence of relational operators
that produce the query result by evaluating the predicates specified in the query. The total time
taken by a plan to complete query execution depends on the selectivity of the query predicate
i.e., the fraction (or percentage) of data tuples satisfying the predicate. To understand the
working of an optimizer, consider the following TPC-H query EQ(say).
SELECT * FROM lineitem, orders, part
WHERE p partkey = l partkey and
o orderkey = l orderkey and
p retailprice < 1000 and l extendedprice < 2000;
The above EQ consist of two join predicates, which are (p partkey = l partkey) and (o orderkey
= l orderkey), and two filter (or base) predicates, which are (p retailprice < 1000 ) and (l extendedprice
< 2000 ).
Figure 1.1: Working of Optimizer in a Database System
1

In above example, percentage of tuples from retailprice column of part table satisfying the
filter condition p retailprice < 1000 is the selectivity of filter predicate p retailprice < 1000.
Query optimizer chooses a plan by comparing alternative execution plans based on their costs
i.e., expected time to complete the execution, and the minimum cost choice among them is
picked for execution. The total time taken by a plan to complete query execution depends on
the output selectivities of the query predicates and the physical implementation of the oper-
ators. The optimizer estimates selectivity at every node of the plan as shown in Figure 1.2.
These estimates are done using statistical metadata (such as histograms), and assumptions
like attribute value independence, join containment assumption, etc. These estimates are then
used to compute the cost of the plan. Due to various reasons such as outdated statistics,
coarse summaries, complex user-defined predicates, invalid assumptions and error-propagation
in query execution tree, selectivity estimations are highly erroneous, which result in highly
sub-optimal choices of execution plans, and corresponding blowups in query response times.
Figure 1.2: Sample Execution Plan for EQ
To address the above chronic problem, a radically different query processing technique,
called PlanBouquet[2], was proposed. In this approach, the highly brittle selectivity estimation
process is completely abandoned and replaced instead with a calibrated discovery mechanism.
An improved version of PlanBoquet, called SpillBound which significantly accelerates the se-
lectivity discovery process, and provides platform-independent performance guarantees, was
recently presented in[1].
2

1.1.1 Motivation
This project aims to develop an interface to showcase the concept of SpillBound. QUEST[4]
is an existing Java-based prototype implementation of PlanBouquet technique. It visually
shows the bouquet execution process and provides interactivity during execution. The goal of
this project is to enhance the functionality of the tool and remodel it as QUEST 2.0. Along
with integrating implementation of the SpillBound technique, QUEST 2.0 contains following
features:
1. To evaluate a query with error-prone join predicates, along with error-prone base pred-
icates. Predicates for which it is difficult to ensure accurate selectivity estimates are
referred to as error-prone predicates (or epps).
2. To visually observe the estimation problem plaguing the current database systems.
3. Visually showcases the query execution through SpillBound.
4. Performance comparison of SpillBound with PlanBouquet and native optimizer.
This tool helps to visualize how SpillBound helps to offer a substantive step in the long-standing
quest for robust query processing.
1.1.2 Existing features in QUEST
Since this project is an extension of the existing QUEST. We refer to existing implementation
as QUEST 1.0. We will describe briefly all the features which were present in QUEST 1.0 :
1. Only filter predicates were allowed as error-prone predicates.
2. Visually showcase the implementation of query execution through PlanBouquet.
3. Performance comparison of PlanBouquet and native optimizer.
4. PostgreSQL is modified to support cost budgeted execution.
1.1.3 Contribution
In this work, we generalize and enhance the QUEST 1.0 design and implementation so that any
2-dimensional ESS query with error-prone base and join-predicates can be evaluated, where
ESS is referred to error-prone selectivity space, wherein each error-prone predicate maps to an
independent [0,1] selectivity dimension in the space. Assumption for 2-dimensional helped in
better visualization of implementation. This project implementation is restricted only to any
3
two predicates as erroneous. ESS corresponding to two epps will be two-dimensional space. In
particular, our contributions are remodeled as QUEST 2.0 and are following:
1. Visualizing selectivity estimation problem:
Given a query for execution, QUEST 2.0 involves
• Selectivity estimation by the optimizer for error-prone predicates which can be either
base or join.
• Generation of the plan by optimizer from a set of alternative execution plans.
• Determining the actual selectivity of predicates after query execution through plan
given by optimizer.
• Determining optimal plan using actual selectivity of predicates.
• Mapping the differences in estimated and actual selectivity value in a graph.
• Calculating the sub-optimality of optimizer chosen plan with respect to the optimal
plan.
2. ESS generation through NEXUS:
Space and time efficient algorithm proposed in [2] named as NEXUS has been implemented
for ESS generation, contour identification and choosing a subset of plans which will be
provided as input for SpillBound execution.
3. Query execution through SpillBound:
Executing query through SpillBound helps to visually observe that how abandoning selec-
tivity estimation process completely and discovering selectivity at runtime helps to tackle
chronic problem of error in estimations.
4. Performance comparison of SpillBound:
Time-based and cost-based performance comparison of SpillBound are shown with Plan-
Bouquet and native optimizer. It helps to observe that SpillBound offer a substantive
step forward in the long-standing quest for robust query processing as the sub-optimal
performance of plan chosen through SpillBound technique performs a lot better than plan
chosen by the native optimizer. SpillBound also provides guarantees on sub-optimality
bound which is entirely query-dependent unlike PlanBouquet, which ensures that Spill-
Bound will not be going to perform worse than a certain limit, which is D2+3D, where D
refers to the number of error-prone predicates in the query.
4

Apart from the above, this work also comprises of the following:
• Verifying the correct implementation of SpillBound which will be discussed in detail in
Section ??.
• Modifications in underlying database engine to support some features of SpillBound such
as spill mode execution, selectivity injection etc which will be discussed in detail in Sec-
tion 3.1.
1.1.4 Organization
In rest of the report, Section 2.1 will provide the background detail of SpillBound technique.
Section 3.1 will discuss how system-level implementation of SpillBound is done. We will explain
the QUEST architecture in Section ?? and all the modifications and additional features included
in the QUEST. Section ?? will discuss how we are verifying that implementation of SpillBound
is done correctly. Section ?? will discuss performance report of project and implementation
results. Finally, Section ?? will summarize our work and outcome of this project.
5

Chapter 2
Overview of SpillBound
2.1 Overview of SpillBound
In this section, we present necessary conceptual background detail and an overview of Spill-
Bound technique which helps to understand the implementation level details of SpillBound.
2.1.1 Preliminaries
Consider the EQ shown in Section ??. Let’s assume two join predicates of the EQ are error-
prone whereas the filter predicates are estimated reliably. The selectivities of these two epps
are mapped to a 2-dimensional space. Since, selectivity of each predicate ranges over [0, 1], a
2-dimensional space[0, 1]2 results, referred as the error-prone selectivity space, or ESS as shown
in Figure 2.1. Each location q ∈ [0, 1]2 in the ESS represents a specific instance where the epps
of the query have selectivity corresponding to q. For example, point q(0.3, 0.2) represents query
with selectivity of predicate p partkey = l partkey as 0.3 and selectivity of predicate o orderkey
= l orderkey as 0.2 in 2-dimensional space. Each point in ESS stores optimal plan Pq and cost
of the plan at q.
6
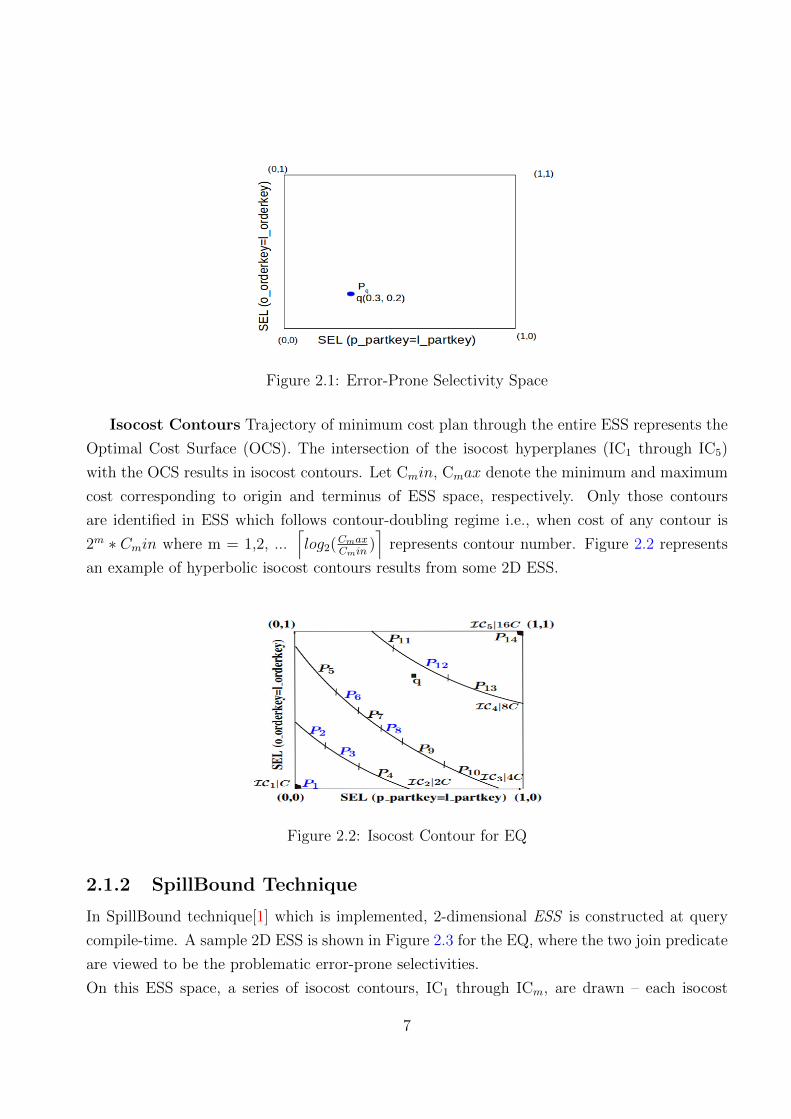
Figure 2.1: Error-Prone Selectivity Space
Isocost Contours Trajectory of minimum cost plan through the entire ESS represents the
Optimal Cost Surface (OCS). The intersection of the isocost hyperplanes (IC1 through IC5)
with the OCS results in isocost contours. Let Cmin, Cmax denote the minimum and maximum
cost corresponding to origin and terminus of ESS space, respectively. Only those contours
are identified in ESS which follows contour-doubling regime i.e., when cost of any contour is
2m ∗ Cmin where m = 1,2, ...⌈log2(
CmaxCmin
)⌉
represents contour number. Figure 2.2 represents
an example of hyperbolic isocost contours results from some 2D ESS.
Figure 2.2: Isocost Contour for EQ
2.1.2 SpillBound Technique
In SpillBound technique[1] which is implemented, 2-dimensional ESS is constructed at query
compile-time. A sample 2D ESS is shown in Figure 2.3 for the EQ, where the two join predicate
are viewed to be the problematic error-prone selectivities.
On this ESS space, a series of isocost contours, IC1 through ICm, are drawn – each isocost
7

contour ICi has an associated optimizer estimated cost CCi. Further, the contours are selected
such that the cost of the first contour IC1 corresponds to the minimum query cost C at the
origin of the space, and the cost of each of the following contours is double that of the previous
contour. Therefore, in Figure 2.3, there are five hyperbolic contours, IC1 through IC5, with
their costs ranging from CC1 = C to CC5 = 16C.
Figure 2.3: SpillBound Execution on 2D ESS
The union of the plans appearing on all the contours constitutes the “plan bouquet” for
the query – accordingly, plans P1 through P14 form the bouquet as shown in Figure 2.3. Given
this set, the SpillBound algorithm operates as follows: Starting with the cheapest contour IC1,
a carefully chosen subset of plans on each contour are sequentially executed with a time limit
equal to the contour's cost. Each plan execution focuses on incrementally learning the selec-
tivity of a specific error-prone predicate, based on the amount of data processed by the plan
within its allocated time budget means only plans equal to the number of error-prone predicates
will be processed. This process of contour-wise plan execution ends when all the selectivities
in the ESS have been fully discovered. Also, as per our assumption, we will process at most
two predicates in the query as erroneous hence at any contour we can execute at most two plan
only. Armed with this complete knowledge, the genuine optimal plan is now identified and used
to finally execute the query to completion
A special feature of SpillBound is that its contour plans are executed in “spill-mode” during
the discovery process. In this mode, execution plan tree are prematurely terminated at the cho-
sen location which is subtree with the node corresponding to epp as root-node in the modified
plan tree, thereby ensuring that the assigned budget is maximally utilized towards selectivity
8

discovery of a specific epp.
Choosing a subset of plans at each contour and performing spill-mode execution of plans are
two key steps of SpillBound technique. These steps are achieved by the following key properties
– Half-space Pruning and Contour Density Independent Execution – of the algorithm.
Figure 2.4: Half-space Pruning
Half-space Pruning: It is the ability to prune the half space from the search space, based
on the cost-budgeted execution of a contour plan. As shown in Figure 2.4, execution of P6 will
discover selectivity of epps in such a way that entire region 3 will be pruned as actual query
location will lie beyond that, similarly, execution of P8 will prune region 2. Half-space pruning
is achieved by using spilling during execution of query plans – objective here is to utilize the
assigned execution budget to extract increased selectivity information of a specific epp. Since
we are considering two epps so there is a procedure to create order among epps in which spilling
is to be done.
9

Figure 2.5: Spilling
Since spilling requires modification in plan execution as shown in Figure 2.5, we need to
first understand existing query execution model. In conventional database query processing,
the execution of a query plan can be partitioned into a sequence of pipelines[3]. Intuitively, a
pipeline can be defined as the maximal concurrently executing subtree of the execution plan.
The entire execution plan can, therefore, be viewed as an ordering on its constituent pipelines.
Consider the plan tree shown in Figure 2.6 – here, the constituent pipelines are highlighted
with ovals, and are executed in the sequence {L1, L2, L3}. Since execution cost incurred on
nodes which lie above node corresponding to epp is not useful for learning the selectivity of
that epp. So, discarding the output of node corresponding to epp without forwarding it further,
and devoting the entire budget to the epp rooted subtree, helps to use the budget effectively
to learn epp selectivity.
Given plan and order of the pipelines in the plan, ordering of two epps is done based on
following two rules:
Inter-Pipeline Ordering: Order the epps as per the execution order of their respective pipelines.
Intra-Pipeline Ordering: Order the epps by their upstream-downstream relationship, i.e., if an
epp node Na is downstream of another epp node Nb within the same pipeline, then Na is ordered
after Nb .
Above rules has produced a total-ordering on the epps in a plan in Figure 2.6, it is N7,N5 ,N3
,N2 ,N1.
10
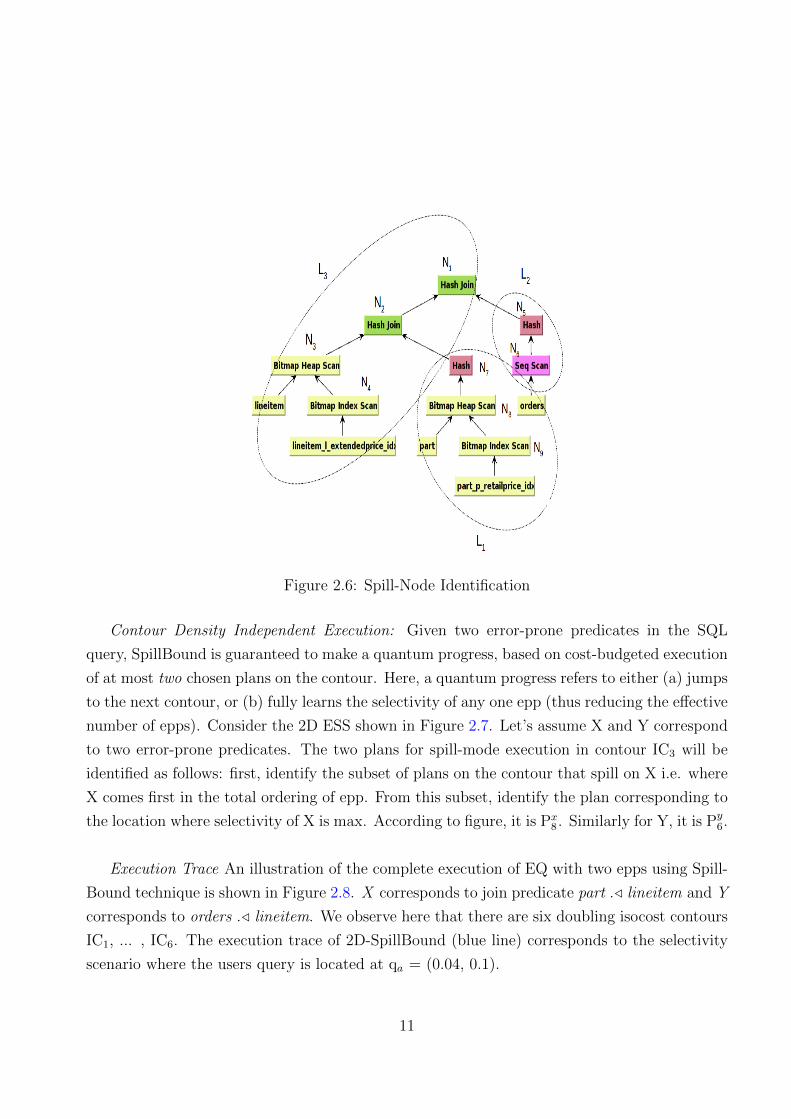
Figure 2.6: Spill-Node Identification
Contour Density Independent Execution: Given two error-prone predicates in the SQL
query, SpillBound is guaranteed to make a quantum progress, based on cost-budgeted execution
of at most two chosen plans on the contour. Here, a quantum progress refers to either (a) jumps
to the next contour, or (b) fully learns the selectivity of any one epp (thus reducing the effective
number of epps). Consider the 2D ESS shown in Figure 2.7. Let’s assume X and Y correspond
to two error-prone predicates. The two plans for spill-mode execution in contour IC3 will be
identified as follows: first, identify the subset of plans on the contour that spill on X i.e. where
X comes first in the total ordering of epp. From this subset, identify the plan corresponding to
the location where selectivity of X is max. According to figure, it is Px8 . Similarly for Y, it is Py
6.
Execution Trace An illustration of the complete execution of EQ with two epps using Spill-
Bound technique is shown in Figure 2.8. X corresponds to join predicate part ./ lineitem and Y
corresponds to orders ./ lineitem. We observe here that there are six doubling isocost contours
IC1, ... , IC6. The execution trace of 2D-SpillBound (blue line) corresponds to the selectivity
scenario where the users query is located at qa = (0.04, 0.1).
11

Figure 2.7: Choice of Contour Crossing Plans
On each contour, the plans executed by 2D-SpillBound in spill-mode are marked in blue for
example, on IC2, plan P4 is executed in spill-mode for the epp Y. Further, upon each execution
of a plan, an axis-parallel line is drawn from the previous qrun to the newly discovered qrun,
leading to the Manhattan profile shown in Figure 2.8. For example, when plan P6 is executed
in spill-mode for X, the qrun moves from (2E-4,6E-4) to (8E-4,6E-4).
Figure 2.8: Query Execution with SpillBound Algorithm
To make the execution sequence unambiguously clear, the trace joining successive qruns is
also annotated with the plan execution responsible for the move to highlight the spill-mode
12

execution, we use pi to denote the spilled execution of plan pi. So, for instance, the move
from (2E-4,6E-4) to (8E-4,6E-4) is annotated with p6. With the above framework, it is now
easy to see that the algorithm executes the sequence p2, p4, p6, p7, p10, p11, which results in
the discovery of the actual selectivity of Y epp. After this, PlanBouquet execution takes over
for remaining one epp and the selectivity of X is learned by executing P11 and P19 in regular
(non-spill) mode. Complete algorithm description of SpillBound is shown in Figure 2.9.
Figure 2.9: SpillBound Algorithm
13
Chapter 3
Implementation of SpillBound
3.1 Implementation of SpillBound
Implementation is primarily divided into two phases:
• Implementation of SpillBound Algorithm as driver program in Java swing.
• Customizing underlying database platform PostgreSQL version 9.4 with primary changes
being the
1. selectivity injection – to generate the ESS.
2. abstract plan execution – to instruct the engine to execute a particular plan.
3. time-limited execution of plans.
4. spilling-to execute plans in spill-mode.
SpillBound execution is done in two phases: Compile-time processing and Run-time pro-
cessing. Compile-time processing requires the generation of ESS, discovering isocost contours
and identification of plans lying on those contours. This complete procedure is done through
an existing algorithm, named as NEXUS algorithm[2]. Figure 3.1 is an example of visualization
of plans over entire ESS as shown in the QUEST 2.0 interface corresponding to compile-time
execution of SpillBound.
14

Figure 3.1: ESS Visualization after NEXUS
Next phase in SpillBound execution is runtime processing, which involves the implementa-
tion of the algorithm shown in Figure 2.9. The most important task here is to perform spilling
under Spill-Mode-Execution which requires identification of spill node when more than one epp
is present.
3.1.1 Spill node identification
As discussed in Section 2.1.2 in order to identify the set of plans on a contour that spill on epp
e1
(i) Firstly execution of a query plan is partitioned into a sequence of pipelines. Pipeline identi-
fication is done by traversing execution plan starting from leaf node and moving upward until a
blocking operator[3] is reached (A physical operator is termed blocking if it doesnt produce any
output until it has consumed at least one of its inputs completely such as Hash Join). On this
basis, considering Figure 2.6, constituent pipelines are highlighted with ovals, and executed in
the sequence {L1, L2, L3}.(ii) Taking plan and ordering of pipelines as input, ordering of epp is done. This epp order cor-
responding to each plan is stored in a HashMap, which maps plan number to a vector containing
epp order. Figure 3.2 is an example of pipeline visualization corresponding to one amongst the
chosen set of plan for the EQ as shown in the QUEST 2.0 interface.
15
Figure 3.2: Pipelines corresponding to a plan marked as L1, L2, L3
3.1.2 Spill-Mode-Execution
Implementation of Spill-Mode Execution is done as follows:
(i) We have stored information about every execution plan present on the contours in XML
format after compile time processing. We also have a total ordering of epps for every plan as
described above.
(ii) Now for every contour, we will identify plans that contain epp whose selectivity is to be
discovered as first in order among two epps.
(iii) Cost budget corresponding to every plan in a given contour is known at compile time.
(iv) With information about the current plan to execute, epp and cost budget, we will identify
the node in execution plan from where spilling is to be done and information of this node is
stored in a variable “spillNum”. Then, XML plan and “spillNum” variable is provided as input
to the underlying modified database PostgreSQL, which executes only sub-plan of the given
plan whose root node is “spillNum”.
16

Figure 3.3: Communication between SpillBound and modified database
(v) As shown in Figure 3.3, PostgreSQL after executing epp rooted subtree returns the
selectivity learned of that epp and also we can determine if query execution is completed or
not.
(vi) If query execution gets completed then we have known complete selectivity of that epp,
and will have one epp left.
(vii) If execution does not complete, we will try to learn selectivity of the second epp of present
contour then jump to next contour, i.e. increase in cost-budget.
Figure 3.4 is an example of visualization of half-space pruning as shown in the interface where
colors of line on contours denotes corresponding plan present in the contour. As throughout
implementation we are following a common color convention to denote every plan. This color
convention can be seen in Figure 3.1.
17

Figure 3.4: Half-space pruning visualization in interface
18

Chapter 4
QUEST 2.0
QUEST[4] (QUery Execution without Selectivity eStimation) is an existing implementation
of PlanBouquet technique. It provides an interactive interface for query execution through
PlanBouquet. We have integrated implementation of SpillBound to this existing platform and
remodelled it as QUEST 2.0. It also supports additional features such as–
(i)Predicates which is to be chosen as erroneous can be join predicates apart from base predi-
cates.
(ii) We now visualize the difference between actual and optimizer's estimated selectivities for
join predicates.
(iii) An additional feature of running in abstract mode is provided apart from the standard real
mode of execution. Abstract execution, allows users to provide any desired location of qa in
the text box, and then invoke SpillBound algorithm to confirm that sub-optimality incurred is
within stated bounds.
(iv) Performance comparison of SpillBound with native Optimizer as well PlanBouquet on the
basis of time-based sub-optimality and cost-based sub-optimality.
4.0.1 QUEST 2.0 Architecture and Feature Details
We now present an overview of current QUEST architecture, shown in Figure 4.1. The green
boxes represent new components added as part of this work. Orange boxes correspond to
existing technique in the QUEST. Complete architecture is divided into a compile-time/pre-
processing phase and a run-time/execution phase. In pre-processing phase, through repeated
invocation of the optimizer, and explicit injection of selectivities, we identify a small set of
plans which is to be provided as input to SpillBound. In execution phase, a calibrated sequence
of cost-budgeted executions of these plans is performed according to SpillBound technique to
complete the query execution.
19

Figure 4.1: Current QUEST Architechture
4.0.2 Implementation Details
QUEST interface is implemented using Java swing. First, it validates the input query by
accessing pg stats meta-data relation.
In this implementation, graphs and plan trees are drawn using open libraries “JFreeChart” and
“JGraph” respectively. During SpillBound execution, graphs are updated through functionality
provided in JFreeChart. QUEST also provides functionality for clearing system cache. This
cache clearing function runs system (Linux) commands through Java program.
20

Figure 4.2: Current QUEST Architechture
4.0.3 Modifications in QUEST
QUEST architecture shows six panels for complete visualization and implementation of Spill-
Bound and additional features in Figure 4.2 which was discussed in Section ??. We now discuss
in detail features present in different panels and their implementation with a variety of visual
scenarios crafted to highlight the selectivity estimation problem that plague current database
optimizers, and the novel characteristics that the SpillBound technique brings to bear on these
chronic problems. A two-dimensional ESS based on Query 5 of the TPC-H benchmark, with
selection predicates on part,lineitem and orders,lineitem as error-prone selectivity dimensions,
is used as a running example to explain these scenarios. The evaluation is carried out on
fully-indexed 4 GB uniform distributed TPC-H databases hosted on the PostgreSQL engine.
21
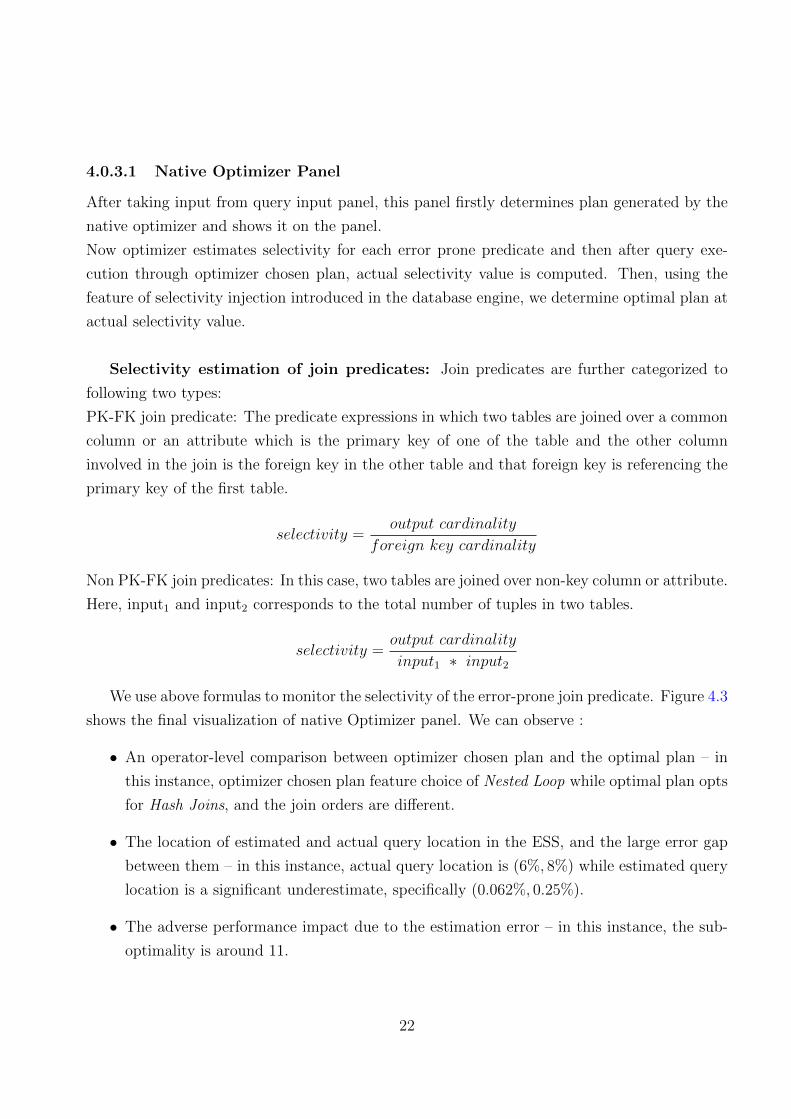
4.0.3.1 Native Optimizer Panel
After taking input from query input panel, this panel firstly determines plan generated by the
native optimizer and shows it on the panel.
Now optimizer estimates selectivity for each error prone predicate and then after query exe-
cution through optimizer chosen plan, actual selectivity value is computed. Then, using the
feature of selectivity injection introduced in the database engine, we determine optimal plan at
actual selectivity value.
Selectivity estimation of join predicates: Join predicates are further categorized to
following two types:
PK-FK join predicate: The predicate expressions in which two tables are joined over a common
column or an attribute which is the primary key of one of the table and the other column
involved in the join is the foreign key in the other table and that foreign key is referencing the
primary key of the first table.
selectivity =output cardinality
foreign key cardinality
Non PK-FK join predicates: In this case, two tables are joined over non-key column or attribute.
Here, input1 and input2 corresponds to the total number of tuples in two tables.
selectivity =output cardinality
input1 ∗ input2
We use above formulas to monitor the selectivity of the error-prone join predicate. Figure 4.3
shows the final visualization of native Optimizer panel. We can observe :
• An operator-level comparison between optimizer chosen plan and the optimal plan – in
this instance, optimizer chosen plan feature choice of Nested Loop while optimal plan opts
for Hash Joins, and the join orders are different.
• The location of estimated and actual query location in the ESS, and the large error gap
between them – in this instance, actual query location is (6%, 8%) while estimated query
location is a significant underestimate, specifically (0.062%, 0.25%).
• The adverse performance impact due to the estimation error – in this instance, the sub-
optimality is around 11.
22

Figure 4.3: Visualization of Native Optimizer Panel
4.0.4 Bouquet Identification Panel
Now visualizing working of bouquet identification panel, we start with compile-time phase i.e.,
bouquet identification, whose graphical display is shown in Figure 4.4. This panel visualizes that
for input query there are 13 distinct execution plans are available, but using NEXUS algorithm,
five plans are chosen amongst them which intersects with five isocost contours. Information
about contours identified along with plans is present in the lower corner of the panel. Only this
much information is required as input to SpillBound and is provided by execution of NEXUS
algorithm. “Show plan” allows seeing operator-level execution plan tree for the chosen set of
plans.
23

Figure 4.4: Visualization of Bouquet Identification Panel
4.0.4.1 Query Execution Panel
This panel is the key component of the project-illustrating the SpillBound technique’s cali-
brated sequence of cost-budgeted partial executions, starting with least cost contour, and then
execute contours until selectivity of epps is completely known. The dynamic nature of this
iterative process is shown in Figure 4.5, which is continually updated to indicate:
• The ESS region covered by each partial plan execution subsequent to each such execution,
the associated region which is half-pruned is being color shadowed.
• The execution order timeline of the plans, along with their tree structures This allows
database analysts to carry out offline replays of the plan execution sequence.
24

Figure 4.5: SpillBound Execution Interface
• The contour budgets, which initially appear as white bars of geometrically increasing
height, and are then filled with blue after the corresponding partial executions.
• The sub-optimality of SpillBound execution (for sample query it is around 3.7, depicted
by green bar) along with PlanBouquet sub-optimality which is depicted by blue bar.
User Interaction: Controls are provided which allows the user to pause the operation
after each partial execution so that the specific progress made through each such execution can
be fully assimilated before continuing to the next step,
Execution Mode: Controls are provided to run SpillBound in abstract mode or in real time
25

execution. Abstract mode, allows the user to provide any desired location of the query, by
taking input from textbox present in the panel.
4.0.4.2 Performance comparison panel
This panel generates a bar chart to compare the performance of SpillBound with PlanBou-
quet and native optimizer. It will take input from the values calculated in previous panels.
Observation on the basis of time-based and cost-based performance result verifies that Spill-
Bound provides sub-optimality better than PlanBouquet and native optimizer. For two epps,
theoretical bound of SpillBound is 10 (22 + 3 ∗ 2) but in most of the cases, the empirical sub-
optimality value of SpillBound is lesser than even 5. Figure 4.6 presents a comparison for
cost-based sub-optimality of SpillBound with native optimizer of PostgreSQL database engine
and PlanBouquet technique for running example. Here we can see that for the same query,
native optimizer is performing around 11 times worse, PlanBouqet is performing 8 times worse
whereas SpillBound is only 3.7 times worse than the optimal plan.
Figure 4.6: Performance Comparison Panel
26

Chapter 5
Verification for Implementation
Correctness
5.1 Checks for Correct Implementation
In order to claim that SpillBound is implemented correctly, we are ensuring that implementation
of two key properties: half-space pruning and contour density independent execution is correct.
• Verification of correct spilling implementation can be done by looking at the execution
done by PostgreSQL after taking the input of XML plan, spillNum as already shown in
Figure 3.2. The resulting execution plan will show never executed corresponding to all
other nodes except spill node and its child nodes. This modification is done at database
engine side. An example execution plan corresponding to EQ is shown in Figure 5.1.
27

Figure 5.1: An execution plan with spill mode execution for EQ
• Since, currently we are handling only two error prone predicates. As soon as, one epp
selectivity is known completely, we are switching to PlanBouquet execution as shown in
Figure 5.2.
28
Figure 5.2: Switch to PlanBouquet for last epp execution
• ESS region shown in Figure 4.5 also contains selectivity path, which shows discovered
selectivity value of epps. Every new discovered selectivity on ESS lies beyond already
pruned region. Hence, verifies half-space pruning.
• According to contour density independent execution property, at every contour atmost 2
plans can be executed.
– This can be verified in SpillBound execution as shown in Figure 5.3
Figure 5.3: Verification of contour density independent execution property
– Assert statements added to ensure that not more than two plans are being executed
at every contour.
– Also, two plans lying on the same contour must spill on the different dimension.
29

– Contour budgets bar chart in Figure 4.5 also verifies that not more than two plans
are executed at any contour.
30

Chapter 6
Performance Report
This full project is implemented in Java swing. All related classes are put into same package,
so complete implementation is done in three packages: runtime, db, algo .
runtime package contain programs which support front-end visualization. This package con-
tains six major programs, corresponding to each panel. A lot of features were already present
in QUEST. New features comprised of around 700 lines of code.
db package contains the programs which are responsible for communication with underlying
database engine PostgreSQL. New features mainly responsible for spill mode execution com-
prised of around 700 lines of code.
algo package contains the programs which are mainly responsible for end-to-end implementa-
tion of SpillBound and its performance comparison. This comprises of around 2000 lines of code.
31

Chapter 7
Conclusion
In this project, for initial work, we have developed an interface for query execution with Spill-
Bound. Then, we have integrated this complete implementation of SpillBound along with the
addition of new features into an existing system QUEST 1.0 and enriched functionality of the
system and remodeled it as QUEST 2.0. The outcome of this project is that it provides a visual
and interactive tour of how SpillBound technique delivers novel performance guarantees that
offers a substantive step in the long-standing quest for robust query processing.
In totality this tool will highlight the impact of errors in selectivity estimation on query ex-
ecution, visually showcases the all possible alternative execution plans and emphasizes how
slight differences in estimations results in an entirely different plan selection. Then, the tool
will execute SQL query using recently proposed techniques and verifies the claim that these
radically different approaches for query processing are providing amazing results for query ex-
ecution and provable guarantees on worst-case performance bound thereby facilitating robust
query processing.
32

Bibliography
[1] S. Karthik, J. Haritsa, S. Kenkre and V. Pandit. Platform-independent Robust Query
Processing. In Proceedings of 32nd IEEE International Conference on Data Engineering,
May 2016. ii, 2, 7
[2] A. Dutt and J. Haritsa. Plan Bouquets: Query Processing without Selectivity Estimation.
In Proceedings of ACM SIGMOD 33rd International Conference on Management of Data,
June 2014. ii, 2, 4, 14
[3] M. Kunjir, P. Birwa, and J. Haritsa. Peak Power Plays in Database Engines. In Proceedings
of 15th International Conference on Extending Database Technology, March 2012. 10, 15
[4] A. Dutt, S. Neelam, and J. Haritsa. QUEST: An Exploratory Approach to Robust Query
Processing. PVLDB Journal vol.7, no.13, August 2014. ii, 3, 19
33