Embed Size (px)
Citation preview

DESIGN AND IMPLEMENTATION OF
DATABASE AND GRAPHIC USER INTERFACE
--- An Application of Visual FoxPro6.0
Haoyu Qin
A Project Report
Submitted to Committee Members:
Dr. Kai-Hsiung Chang (Chair) Dr. Wen-Chen Hu Dr. Roland Hübscher
In Partial Fulfillment of the
Requirement of the
Degree of
Master in Computer Science and Engineering
Auburn, Alabama
July, 2000

2
ABSTRACT
DESIGN AND IMPLEMENTATION OF DATABASE AND GRAPHIC USER INTERFACE
--- An Application of Visual FoxPro6.0
Haoyu Qin
Master in Computer Science and Engineering, July, 2000
Directed by Dr. Kai-Hsiung Chang
PEANUT PLAN (PNTPLAN) is a farm planning system designed to assist
peanut producers in farming and financial planning decisions by developing formal
farming plans specific to individual farm operation. Basically PNTPLAN allows farmers
to “build” farming plans on a farm-by-farm and field-by-field basis.
The problems of the earlier PNTPLAN are: (1) It is based on the Corel Quattro
Pro and the user interface is not friendly, especially for the farmers; (2) It requires the
pre-installation of Corel Quattro Pro, which is expensive for both software and hardware;
(3) The data of the farming plan is not organized systematically, especially for the
accumulation of several years’ data.
Visual FoxPro is a Microsoft database development environment that simplifies
data management. Visual FoxPro makes it easy to organize data, define database rules,
and build applications. We can quickly create forms, queries, and reports with the visual
design tools and wizards. It is also possible to rapidly create full-featured applications by
providing an integrated development environment with powerful object-oriented
programming tools, client/server capabilities, and Active X support.

3
A full cycle of software development processes has been performed. A stand-
alone application with improved functionality for PNTPLAN has been developed using
the Visual FoxPro 6.0. Comparing to the original PNTPLAN, the user interface has been
improved, the data management has also been enhanced with more flexibility and less
cost.

4
CONTENTS
1. Introduction to PNTPLAN 6
1.1 General outlines of PNTPLAN 61.2 Major functions that PNTPLAN can perform 71.3 Detailed structures of PNTPLAN 71.4 Problems of PNTPLAN and the proposed solutions 10
2. Design of customer database and Graphical User Interface 12
2.1 Analysis of customer data 122.2 Design of customer database with Visual FoxPro 6.0 132.3 Analysis of customer background 142.4 Design of the Graphical User Interface 15
3. Implementation of the design with Visual FoxPro 6.0 17
3.1 Building and programming the database 173.2 Building the input and output forms for the database 283.3 Integrating the database and forms into application project 323.4 Building the distribution disks for the application 35
4. Demonstration of NewPeanutPlan 38
4.1 General outlook of NewPeanutPlan 384.2 Whole farm information 404.3 Data entry forms for peanut crop 424.4 Multiple-document interface (MDI) structure of NewPeanutPlan 44
5. Conclusions 46
References 47
Appendix --- Setup Wizard Summary Report for 1.44 Megabyte Disks

5
LIST OF FIGURES
Figure 1. The main interface of PNTPLAN 6
Figure 2. The major function sheets of PNTPLAN 8
Figure 3. Microsoft Visual FoxPro 6.0 environment for Form Designer 29
Figure 4. Visual FoxPro 6.0 Form Control window 30
Figure 5. Visual FoxPro 6.0 object Property window 30
Figure 6. The finished equipment data entry form 31
Figure 7. Microsoft Visual FoxPro 6.0 Application Builder window 32
Figure 8. The Menu Designer window of Microsoft Visual FoxPro 6.0 34
Figure 9. The Microsoft Visual FoxPro 6.0 Build Options window 34
Figure 10. Setup Wizard Progress window for building distribution disks 36
Figure 11. The report for result of building distribution disks 36
Figure 12. The starting point of NewPeanutPlan 38
Figure 13. The main window of the NewPeanutPlan and its file open window 39
Figure 14. The child window Quota Information contained in the main window 40
Figure 15. The child window Whole Farm Information 41
Figure 16. The first data entry form for peanut crop 42
Figure 17. The second data entry form for peanut crop 43
Figure 18. The third data entry form for peanut crop 44
Figure 19. Multiple-document interface structure of NewPeanutPlan 45

6
1. Introduction
1.1 General outlines of PNTPLAN
PEANUT PLAN (PNTPLAN) (see Figure 1) is a whole farm planning system
designed to assist peanut producers in farming and financial planning decisions by
developing formal farming plans specific to individual farm operation[1, 2]. Basically
PNTPLAN allows farmers to “build” farming plans individually on a farm-by-farm and
field-by-field basis and generate a variety of reports.
Once the farming plan is ‘built’ into PNTPLAN, many situations can be addressed to
analyze the direct impacts on the farm that the customer is working on.
Figure 1 The main interface of the original PNTPLAN.
7
1.2 Major functions that PNTPLAN can perform
The PNTPLAN is designed to help peanut producers evaluate and modify their
farm operation plans. The whole idea is to help them minimize cost and maximize profit.
Basically it can perform the following functions:
(a) Evaluating which crop enterprises to plant for profit maximization,
(b) Analyzing the impacts of changes in crop prices on farm income, cash flow,
break-even yields, optimal crop acreage, etceteras,
(c) Analyzing rents, either adding a potential rented farm or dropping an already
rented farm,
(d) Analyzing equipment purchase decisions, that is the fixed cost can be estimated
for an individual tractor (plow, etc.) to let a grower know what the per acre/per
crop cost of each piece of equipment is.
The detailed output of PNTPLAN can also be used as a supplement to loan
applications to lenders and help producers improve their financial position by providing a
more formal farm plan[1, 2].
The benefit is that the information is specific to the individual producer operation and
does not require a great deal of time to set up.
1.3 Detailed structures of PNTPLAN
As shown in Figure 1, the PNTPLAN program is a Corel Quattro Pro based
application. It is restricted on the Quattro Pro’s platform. The program is built by simply
combining spreadsheets each contributing to one single function, such as the main

8
introduction sheet shown in Figure 1. The spreadsheets contained in the program also
include the followings:
Figure 2 The major function sheets of PNTPLAN.
(a) WHOLE FARM sheet
The functionality of this sheet is to enter data for separate farms, either rented and/or
owned, which are under the whole farm management operation (see Figure 2). Data
entered at this level includes total cultivatable acres, quota pounds, yearly principle,
interest, taxes, insurance, rent, land and quota purchases.
(b) FIELD BY FIELD DATA sheet
This sheet is about the field data which applies to each individual field on each

9
separate farm. This data set defines a field as a tract of land with unique characteristics
relating to crop rotation history, crop production potential, cultivatable areas, and
irrigation status.
(c) COST ESTIMATIONS sheet
In this sheet, the data which applies to the whole farm operation (not individual farm)
is entered at this level. This includes crops grown and expected selling price, deficiency
payments, debt and other payments, management expenses, general overhead, other farm
and outside incomes, and interest on operation capital.
(d) EQUIPMENT sheet
This sheet includes a list of the farm equipment inventory which is entered with
annual principle and interest payments, annual taxes, insurance, and allowable
depreciation. This list includes all farm tractors, trucks, implements, combines, irrigation
system, etc. A percentage of time each piece of equipment is used in a crop enterprise is
entered, and PNTPLAN estimates the fixed cost.
(e) CROP BUDGETS sheet
At the crop enterprise level, a list of potential crops which you would like to examine
can be used as inputs for PNTPLAN. Budgets are available in PNTPLAN for many
potential options and must be completed for all to be analyzed.
(f) CROP ANALYSIS sheet
The Crop Analysis page generates an income statement for the entire farm operation
complete with acres, yield, price, revenue per acre, gross revenue, costs per acre, total
costs per acre, return per acre, and total return for each crop planted on the farm. Other
farm income, outside income, deficiency payments, debt payments, related non-farm

10
expense, and land and/or rent cost are included to provide the producer with a complete
income statement.
1.4 Problems of PNTPLAN and the proposed solutions
Although PNTPLAN has shown its full functionality in planning farm operations,
estimating cost and profit, it has some problems that make it difficulty to be a highly
marketable farm planning tool. As shown above, the first problem with PNTPLAN is its
user interface. The majority of users of PNTPLAN are peanut farmers who have little
experience of computer program, even the popular spreadsheet. The user interface of
PNTPLAN is too unfriendly to this group of users. There is no general rule to guide the
data entry, making the users confused about which cell to enter which data. On the other
hand, the hardware of this user group normally is not equipped with the latest technology.
The second problem with PNTPLAN is the requirement of the pre-installation of
Corel Quattro Pro. This is also a major factor preventing PNTPLAN from being a highly
marketable product. It is based on an expensive commercial software, and it requires a
good performance hardware platform.
The third problem with PNTPLAN is the organization of the entered data. The
system has difficulty to systematically retrieve and store data. When the accumulation of
data increases in size, the efficiency of data management is very poor.
Due to the problems described above, we planned to develop a stand-alone program
using the Visual FoxPro 6.0. This program will have basically the same functionality of

11
PNTPLAN, but with improved user interface and efficient data management system.
Also it will be more portable and the ownership will be less expensive.

12
2. Design of customer database and Graphical User Interface
2.1 Analysis of customer data
The original customer data is contained in the Corel Quattro Pro based spreadsheets,
PNTPLAN. For each sheet, the data is organized into rows and columns, i.e., cells. The
data in some cells is derived from other data on the same sheet, or different sheet[1, 2].
Majority of the data is entered by user of PNTPLAN. The customer data has been
grouped based on their business nature, each of these groups occupied one sheet. All
data in one sheet normally serves one central topic, such as “whole farm information”,
“quota information”, “field by field data”, etc. Through the analysis of each group of
data, the farm manager can get all information related to their farm operations[1].
The data organization of the spreadsheets is mainly based on its business operation
rules and models. Users found that they are comfortable with such data structures and
would like to maintain them unchanged. There is one major problem with this data
structure, i.e., it is a “field by field data” sheet. This sheet contains planting information
of all fields inside a farm. That means PNTPLAN needs to maintain one such sheet for
each added farm. However, the number of farms is unpredictable. As the number of
farms grows, PNTPLAN will eventually fail to handle the “field by field data” of large
number of farms.
With the relational database, such as the one in Visual FoxPro, we can easily solve
this problem. All the information of “field by field data” for every single farm can be
organized into one table. Of course, the benefit of database is not limited to just such one
aspect. The use of SQL in database will make data manipulation much more flexible.

13
2.2 Design of customer database with Visual FoxPro 6.0
When designing the database with Visual FoxPro, we need to consider both the
business models and database rules. After discussing with the previous PNTPLAN users
and the potential users of future program, we decided to use the basic PNTPLAN
spreadsheet data organizing structure to design the database. When PNTPLAN was
initially designed, its authors grouped the data into different functional spreadsheets
based the habits of a specific user group, that is, the users who have the first hand
experience of peanut planting. This group of users have their own views of how to
group and enter the peanut farming data with different interfaces, and the PNTPLAN is
the direct illustration of such views.
After detailed studying of each PNTPLAN spreadsheet, we decided to build a
database of which each table is serving one farm operation action. The information about
planting, such as “Field Name”, “Projected Field Acres”, “Irrigation”, “Actual Field
Acreage”, “This Year’s Crop”, “Last Year’s Crop”, “Yield Per Acre”, etc., is stored into
the table “Fieldbyfield”. The general information about single farm which includes
several fields is stored into the table “WholeFarmInfo”. The quota information about
each farm is organized into table “QuotaInfo”. The tables containing data about other
functional farm operation actions include “CostEstimate” for the cost estimations of each
kind of crop, “TotalFarm” for farms’ financial management, “Equipemt” for the usage of
equipment distributed among the different crops, etc.
Some PNTPLAN spreadsheets contain too much data to be put into one single table,
this is because the window’s physical space is limited. If we build an entry form for such
kind of table, this form has to be scrolled a long way between the top and the bottom. So

14
some spreadsheets have to be broken down into several ER database tables. When we
need to combine them together, we can use the common primary keys to relate them.
2.3 Analysis of customer background
The main reason to fund this project is that the users of PNTPLAN spreadsheet
program, almost all of them peanut farmers, found it so difficulty to use. As mentioned
in the first part of this report, its interface is so confusing that the users can not handle it
right unless he has some professional background. In order to promote agricultural
economics model, which the PNTPLAN is based on to peanut farmers, the PNTPLAN
has to be replaced by a standalone program, which will be easy and straight forward to
use.
Peanut farmers are a special group of users. They normally don’t have enough
background to use the office software, such as Corel Quattro Pro. In these days, the IT
industry changes so rapidly, no other industry can match its speed. In contrast, peanut
farming is a relatively stable area in which there has been no dramatic change in the last
several decades, especially there is less introduction of information technology to this
area. Little application of information technology in peanut farming operation has leaded
to the farmers with little knowledge of office software.
The computer hardware of most peanut farmers is also low in performance. Since
peanut farming doesn’t require much information technology, the computer hardware
upgrading in peanut farming area does not happen frequently as in other areas, such as
banking. The variety of the computer models in peanut farming operation is very wide.
It is not very hard to find an IBM compatible PC 386 in peanut farm with low capacity in
15
permanent storage and Random Access Memory. Considering these factors, the
programs we want to present to our users should be stand-alone, low in system
requirements, and easy to use with a simple interface.
2.4 Design of the Graphical User Interface
After the analysis of future users of this program, we realized that “easy-to-use” is
the first priority we have to focus on. The nature of the user group suggested that our
program’s GUI has to be simple and straightforward.
Basically, there are two ways to design the window programs[3]. The first one is the
multiple-document interface (MDI) applications which consist of a single main window,
and the application’s windows are contained within or float on top of the main window.
The other one is the single-document interface (SDI) applications which consist of one or
more independent windows, each of which appears separately on the Windows desktop.
Since most of the common window applications are MDI, such as those in Microsoft
Office Suite, we design our application in this most acceptable model. First, we need a
top level main form as the parent for other child forms in this MDI application. All other
forms are child forms of this main form. All these child forms can not be moved outside
the bounds of their parent form (main form), and when minimized, they appear at the
bottom of their parent form. If their parent form is minimized, they are minimized along
with it. The main form (top level form) works at the same level as other Windows
applications, and can appear in front of or behind them. It appears on the Windows
taskbar.

16
When users click on the icon of this application program on Windows desktop, we
want to present to them a main graphical interface, the main form. This main form will
carry the common characters and outfits of Window programs which have been broadly
accepted by vast majority of computer users. These characters and outfits include menu
items, background colors, minimizing, maximizing and close buttons on the upper right
corner, title and icon on upper left corner, commonly used buttons underneath the menu
items.
The child forms are opened by clicking the “Open” button or choosing “Open” in
the File menu. The child forms are used as the interfaces for the relational database
tables. Majority of the tables have one form--one table relationship. Each child form has
its own functional buttons, such as table records navigation buttons, adding new record
button, and save button, etc.
Generally, the GUI of this application program is simple and straightforward.
The menus are usually only two levels, maximum is no more than three levels. After the
program is started, user only need one click to get to the forms in which they can directly
manipulate the table records.

17
3. Implementation of the design with Visual FoxPro 6.0
3.1 Building and programming the database
In Visual FoxPro, a database is a collection of tables[3, 4]. In order to handle the
stored rules, procedures, SQL query, functions, views, relationship between tables, etc.,
Visual FoxPro needs to create a database container to hold them, i.e., a file with the
extension of ‘.dbc’. In our application program, we call it ‘farms.dbc’. There are
eighteen tables in farms.dbc to cover the raw data used for the operation of peanut
farming. These eighteen tables are,
(1) Farms!Costestimate table
Because of the large number of fields for each database table, there is not enough
space to hold all the field names in one row of the table. The field names will be listed
one by one vertically. This also applies to the other tables of the database.
County Location Grower Date Year_of_data Crop Actual_price Actu_def_pmt
CountyLocationGrowerDateYear_of_dataCropActual_priceActu_def_pmt
Farms!Costestimate fields

18
The data which applies to the whole farm operation (not individual farms) is
stored in this table[2]. The Visual tools are used to construct this table and all other
tables in database “farms.dbc”. The primary key for this table is “Grower”.
(2) Farms!Crop_analy_corn_1 table
The fields of this table are also listed in vertical way due to the space constraint.
Analysis_idCrop_insurance_numberCrop_insurance_priceFertilizer_numberFertilizer_priceFuel_harvest_numberFuel_harvest_priceFuel_preharvest_numberFuel_preharvest_priceHerbicide_numberHerbicide_priceIrrigation_numberIrrigation_priceLabor_numberLabor_priceLime_numberLime_priceNematicide_numberNematicide_priceRepair_harvest_numberRepair_harvest_priceRepair_preharvest_numberRepair_preharvest_priceSeed_numberSeed_price
This table is used to store the information about crop enterprise, especially for
corn. In this table, the analysis_id is assigned to be the primary key which will be used
later to relate the tables. This is a simple table but with lots of fields.
(3) Farms!Crop_analy_corn_2 table
This table is a continuation of the previous one, some of the crop enterprise
information about corn is stored in this table.
Farms!Crop_analy_corn_1 fields

19
Analysis_idCustom_work_numberCustom_work_priceDrying_numberDrying_priceEquip_depre_interest_tax_insurGeneral_overheadInterest_oper_capManagementNitrogen_numberNitrogen_priceOper_capOther1_numberOther1_priceOther2_numberOther2_priceOther3_numberOther3_price
The primary key for the table Farms!Crop_analy_corn_2 is “Analysis_id”. With
this primary key, the tables Farms!Crop_analy_corn_1 and Farms!Crop_analy_corn_2
can be combined into one new table which is the original format in spreadsheet.
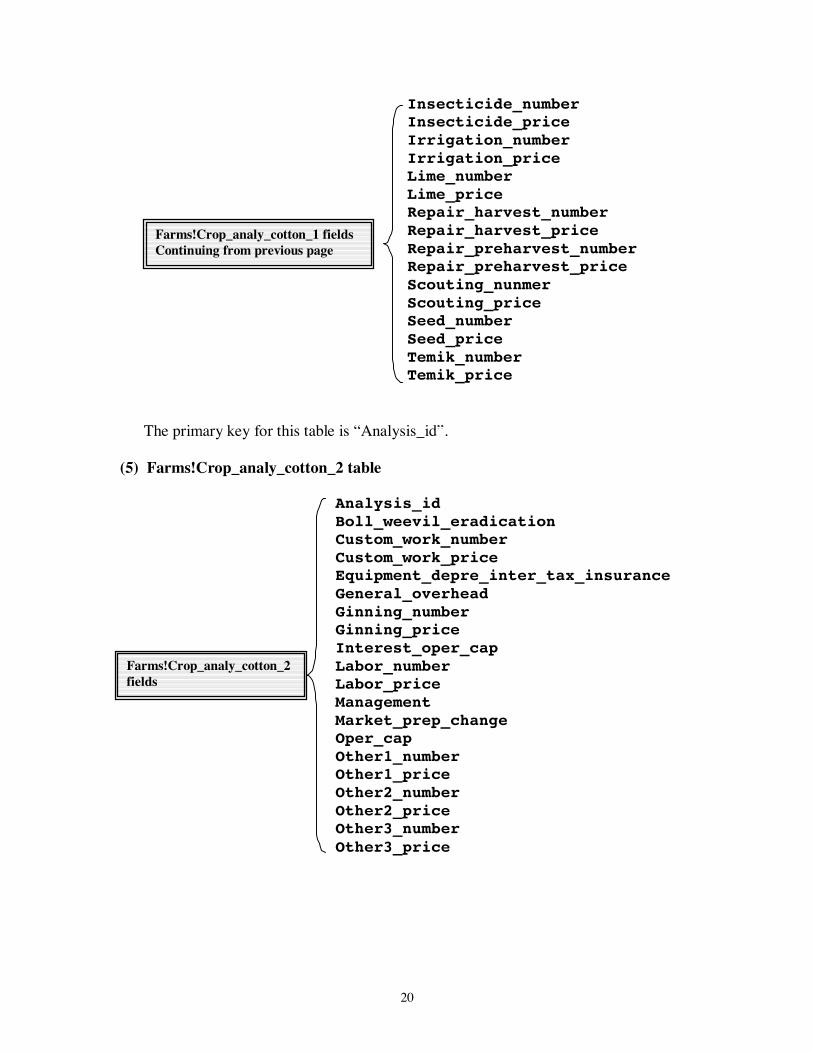
(4) Farms!Crop_analy_cotton_1 table
The nature of this table is same as the previous one, about the crop enterprise
information, and here is about the cotton.
Analysis_idCrop_insur_numberCrop_insur_priceDefolint_harv_aid_numberDefolint_harv_aid_priceFertilizer_numberFertilizer_priceFuel_harvest_numberFuel_harvest_priceFuel_preharvest_numberFuel_preharvest_priceGrowth_regulator_numberGrowth_regulator_priceHerbicide_numberHerbicide_price
Farms!Crop_analy_corn_2 fields
Farms!Crop_analy_cotton_1 fieldsContinued on next page
20
Insecticide_numberInsecticide_priceIrrigation_numberIrrigation_priceLime_numberLime_priceRepair_harvest_numberRepair_harvest_priceRepair_preharvest_numberRepair_preharvest_priceScouting_nunmerScouting_priceSeed_numberSeed_priceTemik_numberTemik_price
The primary key for this table is “Analysis_id”.
(5) Farms!Crop_analy_cotton_2 table
Analysis_idBoll_weevil_eradicationCustom_work_numberCustom_work_priceEquipment_depre_inter_tax_insuranceGeneral_overheadGinning_numberGinning_priceInterest_oper_capLabor_numberLabor_priceManagementMarket_prep_changeOper_capOther1_numberOther1_priceOther2_numberOther2_priceOther3_numberOther3_price
Farms!Crop_analy_cotton_2fields
Farms!Crop_analy_cotton_1 fieldsContinuing from previous page
21
This table is a continuation of the previous table “Farms!Crop_analy_cotton_1”,
which is about the crop enterprise information of cotton. The primary key for this table is
“Analysis_id”.
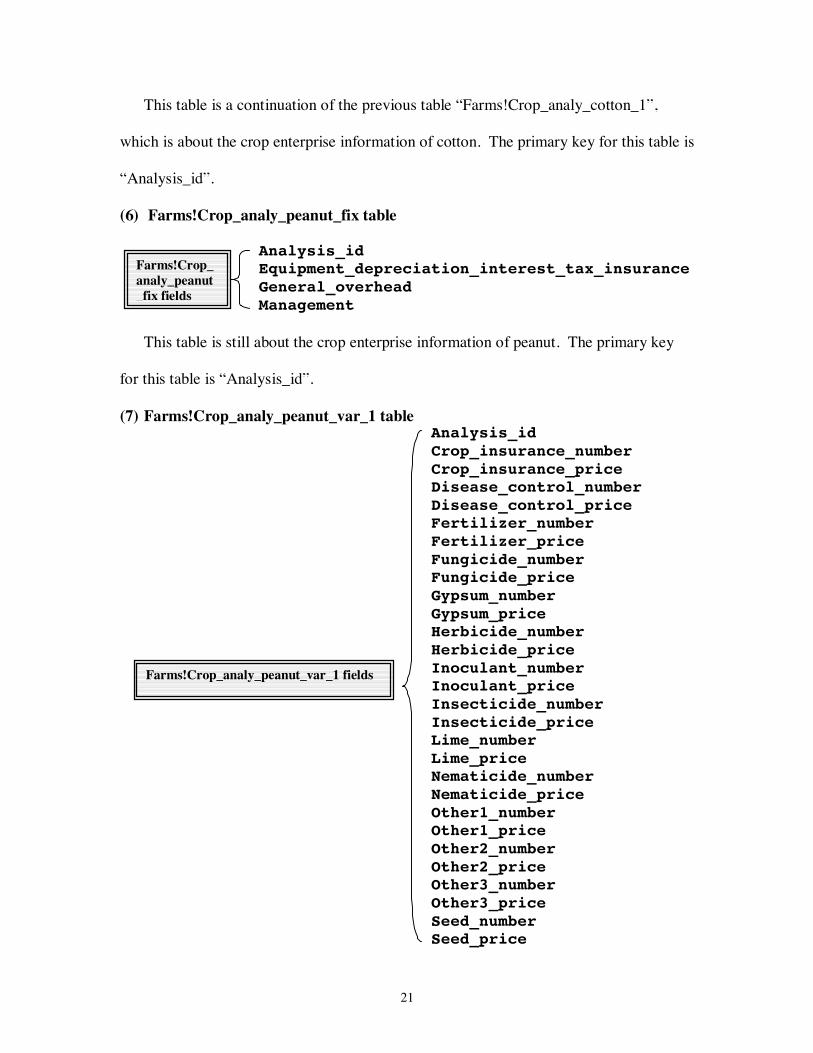
(6) Farms!Crop_analy_peanut_fix table
Analysis_id Equipment_depreciation_interest_tax_insurance General_overhead Management
This table is still about the crop enterprise information of peanut. The primary key
for this table is “Analysis_id”.
(7) Farms!Crop_analy_peanut_var_1 tableAnalysis_idCrop_insurance_numberCrop_insurance_priceDisease_control_numberDisease_control_priceFertilizer_numberFertilizer_priceFungicide_numberFungicide_priceGypsum_numberGypsum_priceHerbicide_numberHerbicide_priceInoculant_numberInoculant_priceInsecticide_numberInsecticide_priceLime_numberLime_priceNematicide_numberNematicide_priceOther1_numberOther1_priceOther2_numberOther2_priceOther3_numberOther3_priceSeed_numberSeed_price
Farms!Crop_analy_peanut_fix fields
Farms!Crop_analy_peanut_var_1 fields

22
This table is used to store some of the information of peanut enterprise. The
primary key is “Analysis_id”.
(8) Farms!Crop_analy_peanut_var_2 table
Analysis_idAssessmentCleaning_numberCleaning_priceCommodity_commissiorCustom_work_numberCustom_work_priceDrying_numberDrying_priceFuel_harvest_numberFuel_harvest_priceFuel_pre_harvest_numberFuel_pre_harvest_priceInterest_oper_capIrrigation_numberIrrigation_priceLabor_numberLabor_priceOper_capRepair_harvest_numberRepair_harvest_priceRepair_pre_harvest_numberRepair_pre_harvest_priceScout_numberScout_price
Same as the above one, this table is still about the crop enterprise information,
specially here is for peanut. The primary key for this table is “Analysis_id”.
(9) Farms!Crop_analy_soybean_1 table
This table is used to place the crop enterprise information of soybean. Some of this
information is stored in the next table Farms!Crop_analy_soybean_2. The primary key
of this table is “Analysis_id”. Almost all of these crop enterprise information table’s
fields are the same as others, but there are indeed some unique fields which prevent all
crops from using a single common crop enterprise table.
Farms!Crop_analy_peanut_var_2 fields

23
Analysis_idCrop_insur_numberCrop_insur_priceFertilizer_numberFertilizer_priceFuel_harvest_numberFuel_harvest_priceFuel_preharvest_numberFuel_preharvest_priceHerbicide_numberHerbicide_priceInsecticide_numberInsecticide_priceIrrigation_numberIrrigation_priceLime_numberLime_priceRepair_harvest_numberRepair_harvest_priceRepair_preharvest_numberRepair_preharvest_priceScouting_numberScouting_priceSeed_inoculant_numberSeed_inoculant_price
(10) Farms!Crop_analy_soybean_2 table
Analysis_idCustom_work_numberCustom_work_priceEquip_depre_inter_numberEquip_depre_inter_priceGeneral_overheadGeneral_overhead_numberHired_labor_numberHired_labor_priceInterest_oper_capManagement_numberManagement_priceOper_capOther1_numberOther1_priceOther2_numberOther2_priceOther3_numberOther3_price
Farms!Crop_analy_soybean_1 fields
Farms!Crop_analy_soybean _2 fields
24
The primary key for this table is “Analysis_id”.
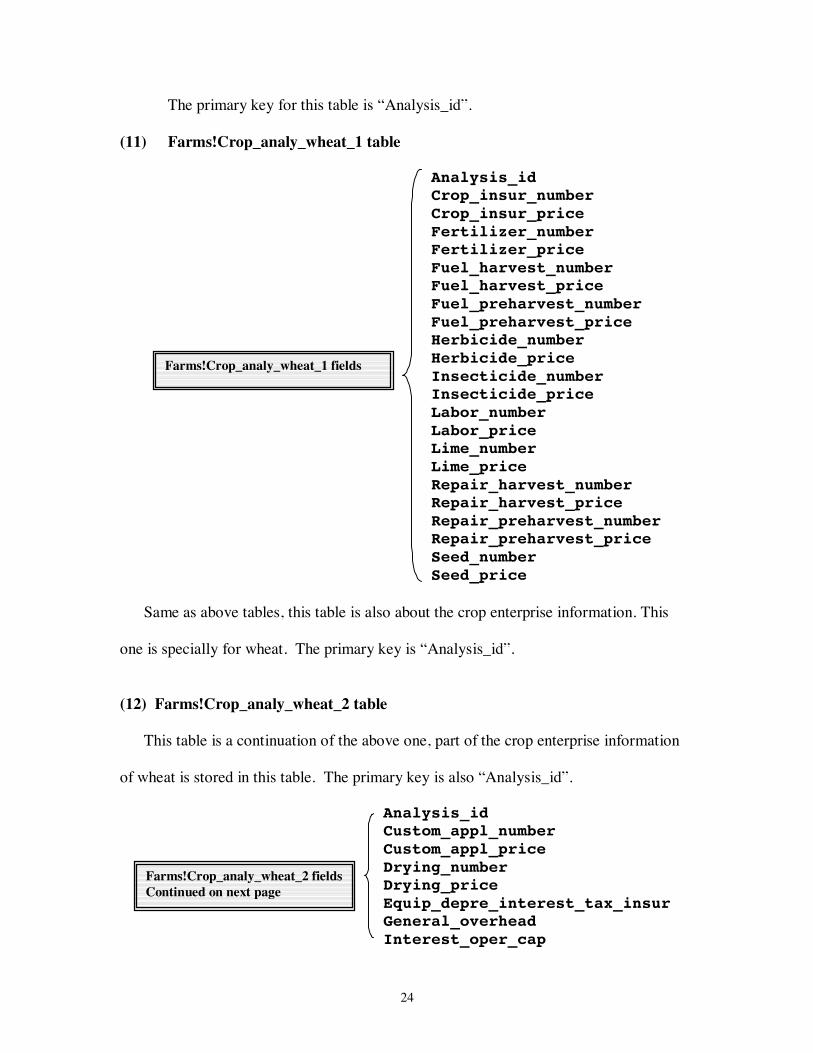
(11) Farms!Crop_analy_wheat_1 table
Analysis_idCrop_insur_numberCrop_insur_priceFertilizer_numberFertilizer_priceFuel_harvest_numberFuel_harvest_priceFuel_preharvest_numberFuel_preharvest_priceHerbicide_numberHerbicide_priceInsecticide_numberInsecticide_priceLabor_numberLabor_priceLime_numberLime_priceRepair_harvest_numberRepair_harvest_priceRepair_preharvest_numberRepair_preharvest_priceSeed_numberSeed_price
Same as above tables, this table is also about the crop enterprise information. This
one is specially for wheat. The primary key is “Analysis_id”.
(12) Farms!Crop_analy_wheat_2 table
This table is a continuation of the above one, part of the crop enterprise information
of wheat is stored in this table. The primary key is also “Analysis_id”.
Analysis_idCustom_appl_numberCustom_appl_priceDrying_numberDrying_priceEquip_depre_interest_tax_insurGeneral_overheadInterest_oper_cap
Farms!Crop_analy_wheat_1 fields
Farms!Crop_analy_wheat_2 fieldsContinued on next page

25
Irrigation_numberIrrigation_priceManagementOper_capOther1_numberOther1_priceOther2_numberOther2_priceOther3_numberOther3_priceSmall_grain_numberSmall_grain_price
(13) Farms!Equipment table
CornCorn_equip_costCottonCotton_equip_costEquipment_nameEquipment_tax_and_insuranceEquipment_idEstimated_depreciatioInterestPeanutsPeanuts_equip_costPrincipleSoybeansSoybeans_equip_costWheatWheat_equip_cost
This table is about the information of farm equipment inventory, and their annual
principle and interest payments. The primary key is “Equipment_id”.
(14) Farms!Farmquotainfo table
Cultivated_acresFarm_idFarm_nameQuota_pound
Farms!Crop_analy_wheat_2 fieldsContinuing from previous page
Farms!Equipment fields
Farms!Farmquotainfo fields

26
This table is about the quota information of each farm, i.e. how many pounds each
farm can sell. The primary key of this table is “Farm_name” field. The records also can
be indexed by “Farm_id”.
(15) Farms!Fieldbyfield table
This is the table which is used to store information about each individual field. Each
farm can have many fields, each field is referred to by its name under a specific farm
name. The primary key for this table is “Field_id”. The table can also be indexed by the
“Farm_name” and “Field_name”.
CountyCrop_1_yeaCrop_2_yeaCrop_3_yeaDateFarm_nameField_avg_Field_idField_nameGrowerIrrigationLocationPlanned_crPro_acreYield_per2Yield_per3Yield_per_
(16) Farms!Totalfarm table
Totalfarm table is the place to store the information about the management of each
farm. The primary key of this table is “Farm_id”, and the records in this table can also be
indexed by the field “Grower”.
Farms!Fieldbyfield fields

27
CountyDateDebt_payments_per_yearFarm_idGrowerIntr_rat_this_yrLocationManagement_expenseOther_farm_incomeOther_payments_per_yearOutside_incomeOvr_hd_this_yrYear_of_data
(17) Farms!Total_crop_analysis table
AcresCosts_per_acreCountyCropDateGross_revenueGrowerGrower_idIndividual_crop_returnLocationPriceReturn_per_acreRevenue_per_acreTotal_crop_costYield_per_acre
Total_crop_analysis table is the place to store the information about the farm
operation’s financial balances. The primary key for this table is “Grower_id”.
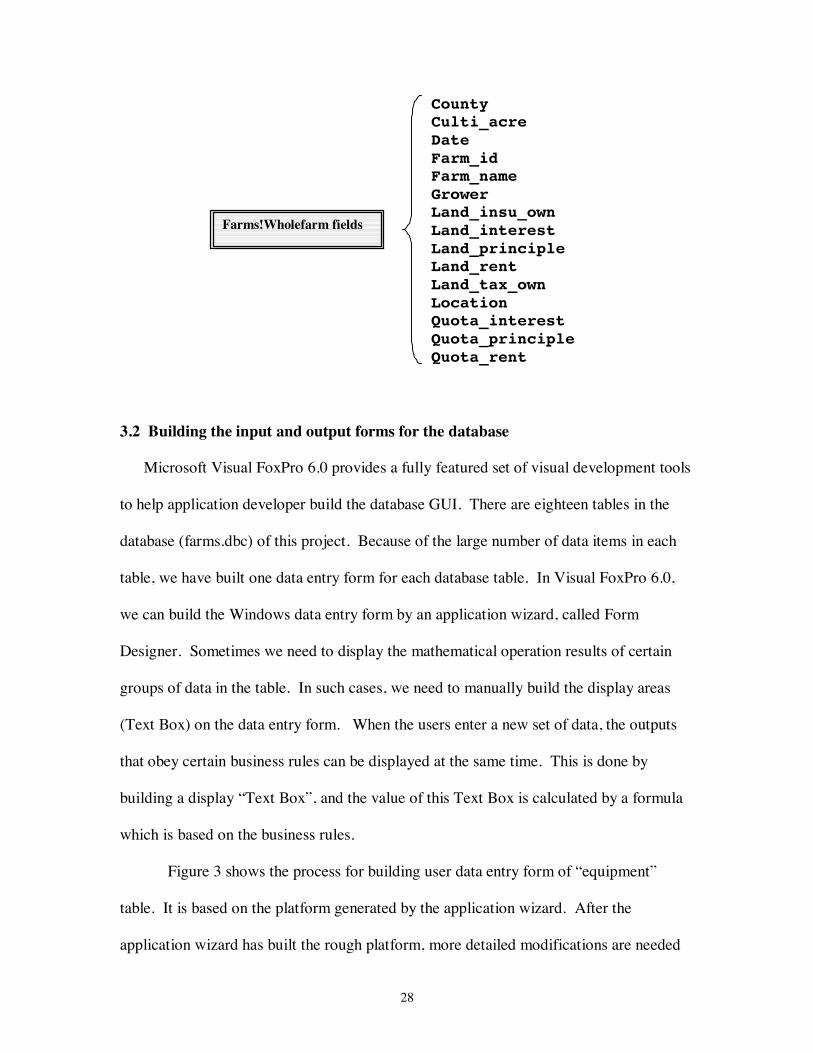
(18) Farms!Wholefarm table
Wholefarm table is used to store the information about the ownership of land and its
related information, either rented or owned. The information is used to serve the whole
farm management operation. The primary key for this table is “Farm_id”, and the table
records can also be indexed by “Farm_name”.
Farms!Totalfarm fields
Farms!Total_crop_analysis fields
28
CountyCulti_acreDateFarm_idFarm_nameGrowerLand_insu_ownLand_interestLand_principleLand_rentLand_tax_ownLocationQuota_interestQuota_principleQuota_rent
3.2 Building the input and output forms for the database
Microsoft Visual FoxPro 6.0 provides a fully featured set of visual development tools
to help application developer build the database GUI. There are eighteen tables in the
database (farms.dbc) of this project. Because of the large number of data items in each
table, we have built one data entry form for each database table. In Visual FoxPro 6.0,
we can build the Windows data entry form by an application wizard, called Form
Designer. Sometimes we need to display the mathematical operation results of certain
groups of data in the table. In such cases, we need to manually build the display areas
(Text Box) on the data entry form. When the users enter a new set of data, the outputs
that obey certain business rules can be displayed at the same time. This is done by
building a display “Text Box”, and the value of this Text Box is calculated by a formula
which is based on the business rules.
Figure 3 shows the process for building user data entry form of “equipment”
table. It is based on the platform generated by the application wizard. After the
application wizard has built the rough platform, more detailed modifications are needed
Farms!Wholefarm fields

29
to make the form more friendly to users. Some labels are also needed to guide the users
to fill in the correct data.
Figure 3 Microsoft Visual FoxPro 6.0 environment for Form Designer
In Figure 3, some of the text boxes are with white background and others with gray
background. The ones with white background are used for data entry by the user. The
ones with gray background are used for the display of calculated results.
Since Microsoft Visual FoxPro 6.0 is an Object-Oriented programming environment,
the data entry form is based on the Form Object. To make a customized form, a
programmer needs to replace the default properties of Form Object with the user desired
properties. Figures 4 and 5 show the Form Control window and object property window.

30
Figure 4 Visual FoxPro 6.0 Form Control window
Figure 5 Visual FoxPro 6.0 object Property window
In Figure 4, the form control window contains the visual objects available to
Visual FoxPro 6.0. Majority of them can be directly dragged and dropped to the user

31
customized form. Each visual object has its own properties which the programmer needs
to define their values. User defined visual objects can also be placed on the form control
window to make them available to other applications.
In Figure 5, the object property window contains all the properties of a visual
object, which include supporting data sources, event triggered methods, layout properties
of the visual object, and some other properties.
Figure 6 The finished equipment data entry form.
Figure 6 shows the finished data entry form for table “Equipment”. There are five
text boxes with gray background showing the calculation results based on this table.
There are eighteen tables in the database, each of them has a data entry form
similar to the one in Figure 6.

32
3.3 Integrating the database and forms into an application project
Once the database tables and user data entry forms have been built, we can integrate
them into a project which is necessary to build the distribution files. There are two types
of project files, application (.app) file and executable (.exe) file[3]. The application file is
for the users who have their own copy of Microsoft Visual FoxPro 6.0, and is 15K
smaller than the corresponding executable file. The executable file includes the
Microsoft Visual FoxPro loader, so the potential users don’t need to have their own
Visual FoxPro installed. Because the nature of our potential users is farming related, the
executable application project is our first choice.
Figure 7 Microsoft Visual FoxPro 6.0 Application Builder window
Figure 7 is the Application Builder window of Microsoft Visual FoxPro 6.0. We
name our project NewPeanutPlan. We built our application project as the “Top-Level”
type, and also included an image as part of the splash screen, an icon as the logo for the
application window’s title bar. Both the image and icon are built by ourselves. When the
33
application program is started, the plash screen will be displayed on the user’s desktop
for several seconds.
There are six-page frames in Application Builder window, Figure 7 shows the
first one. The second page is called “credit” which is about the ownership of the
application program. For the purpose of this Master degree project report, we filled in
“CSSE Department, Auburn University” as the owner.
The third page is about the database tables that the application needs to include.
For this project, we have built eighteen tables in the database “farms.dbc” and all of these
should be included in the application project.
The fourth page is about the data entry forms that the application has to include.
All the eighteen user data entry forms we have built should be included in the project.
The fifth page is about report which should be included in the project. We didn’t
build any report for this application, so there is nothing to be specified in this page. The
sixth page is about the application’s help file, default data directory, standard tool bar and
favorite menus.
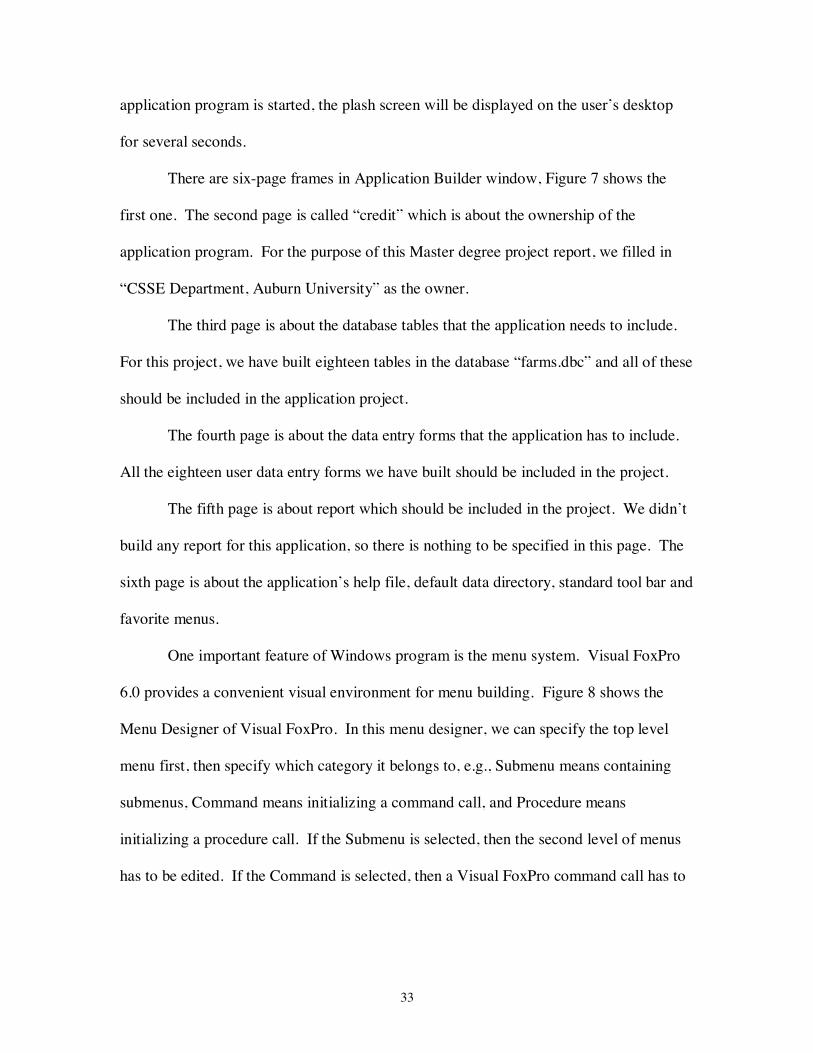
One important feature of Windows program is the menu system. Visual FoxPro
6.0 provides a convenient visual environment for menu building. Figure 8 shows the
Menu Designer of Visual FoxPro. In this menu designer, we can specify the top level
menu first, then specify which category it belongs to, e.g., Submenu means containing
submenus, Command means initializing a command call, and Procedure means
initializing a procedure call. If the Submenu is selected, then the second level of menus
has to be edited. If the Command is selected, then a Visual FoxPro command call has to
34
be specified in the text box next to it. If the Procedure is selected, then the whole
procedure has to be specified in a pop-up text editing window initialized by this selection.
Figure 8 The Menu Designer window of Microsoft Visual FoxPro 6.0
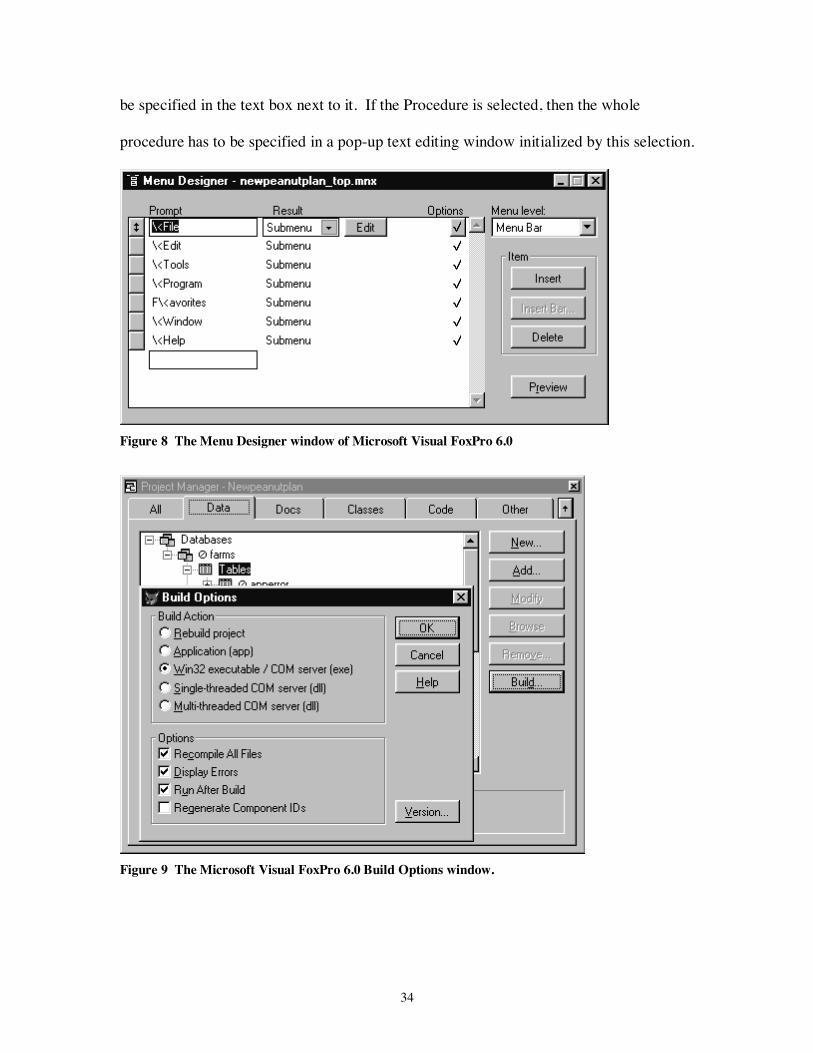
Figure 9 The Microsoft Visual FoxPro 6.0 Build Options window.

35
After adding and modifying all the component objects to the project manager, we
can press the “build” button to pop up the “Build Options” window, as shown in Figure 9.
In the Build Options window, we selected “Win32 executable / COM server (exe)” and
the first three options. This will generate an executable file for the application, and we
named it “NewPeanutPlan”.
3.4 Building the distribution disks for the application
The primary goal of this project is to develop a stand-alone application program for
the whole farm planning system which is designed to optimize the peanut-based rotation
decisions. To do this, we have built an executable file for this application and the
executable file is independent of the Visual FoxPro environment. Next step is to build
the distribution disks similar to those of commercial software.
There are three types of media which can be used for the application distribution.
They are 3.5 inches floppy disk, Websetup (compressed) and Netsetup (uncompressed).
We chose the most classical one, the 3.5 inches floppy disk.
There are two Dynamic Link Library (DLL) files which must be included in the
distribution disks in order to let the users run this application independent of the Visual
FoxPro 6.0[3]. They are “Vfp6r.dll” and “Vfp6renu.dll” which are located in the
directory of “C:\Windows\System”. We also have to specify the directory in which the
application project has been developed, all resource files have to be included in this
directory.
We also have to specify the directory in which the output disk files should be placed,
for our case we set it to “C:\qinhaoyu\project_MS”. Another directory name also has to
be specified, that is the default directory in which an user can install this program on

36
his/her hard drive when he/she runs the setup processes of the distribution disks. In this
case, we want the user to setup this program in a directory directly under the root
directory, we named it “NEWPEANUTPLAN”.
Figure 10 Setup Wizard Progress window for building distribution disks
Figure 11 The report for result of building distribution disks
37
Figure 10 shows the progress of building distribution disks. Figure 11 shows the
report window for the result of building distribution disks. Four 1.44Mb floppy disks are
needed to hold the distribution files. Each of the first three has about 1232Kb, and the
fourth one has only 46Kb. All of these four disk images are placed in the directory
“C:\qinhaoyu\project_MS”.
After the contents of these four disk images have been copied to four 3.5 inch
floppy disks, we can distribute them to the users.

38
4. Demonstration of NewPeanutPlan
In this chapter, several example demonstrations of NewPeanutPlan will be
described. They will cover all the major aspects of this stand-alone program. The other
features which are not described in this chapter are similar to these examples.
4.1 General outlook of NewPeanutPlan
The NewPeanutPlan starts with a splash screen which is displayed for several
seconds on a user’s desktop, as shown in Figure 12.
Figure 12. The starting point of NewPeanutPlan

39
Once the user finishes the setup of this program, he/she can make a shortcut of
this program on his/her desktop similar to the one in Figure12 (the second on the top row,
named “NewPNT”). When the user clicks on this shortcut, the splash screen will be
popped up as shown in Figure 12. As mentioned earlier, the owner of the program is
listed as “HAOYU QIN, CSSE, AUBURN UNIVERSITY”. The copy right is also
mentioned at this time. The version number is listed as “Version 1” for the first version.
The image in the splash screen directly reflects the client name, “National Peanut
Research Laboratory”. The peanut image specifies the topic of this program.
Figure 13 The main window of the NewPeanutPlan and its file open window

40
The main window of NewPeanutPlan (as shown in Figure 13) contains the
common features of Windows programs. This is because it is inherited from the
Microsoft Foundation Class (MFC) Library Win object. When the user wants to open a
data entry form, he/she can select a file from the file open window.
4.2 Whole farm information
In this section, some whole farm information forms and their functionality will be
described.
Figure 14 The child window "Quota Information" contained in the parent(main) window
Figure 14 shows the relationship between a child window and its parent window. The
“Quota Information” window contains four data entry textboxes and four calculation
result displaying textboxes. Its title bar has the common window features, such as the

41
unique program logo, window title, minimizing, maximizing and closing buttons. On the
bottom row, there are a group of common buttons which are used for the manipulations
of the database records. Based on the records in the database, the corresponding
calculation results are shown in the grayed textboxes.
Figure 15 The child window "Whole Farm Information"
Figure 15 shows the “Whole Farm Information” form which is used to enter the
data for entire farm information. Just like those in Figure 14, Figure 15 also has the
similar common features in its title bar and the same group buttons for record navigation.
After the user enters the data in the white-background textboxes, the results of “Owned
Land Costs Per Acre” and “Rented Land Costs Per Acre” will be shown immediately. In
this case, the result in “Rented Land Costs Per Acre” textbox means this farm doesn’t
have any rented land.

42
4.3 Data entry forms for peanut crop
Five crops are planned in this program. Each of them has the related crop data
entry forms. Here the peanut crop is used to illustrate the crop data entry form.
Figure 16 The first data entry form for peanut crop
Figure 16 shows the first data entry form for peanut crop. It also has the similar
features and functionality as described in previous forms. It contains many data entry
textboxes which are specific to peanut crop. For each cost item, once the user enters the

43
data of “Number of Units” and “Price Per Unit”, the “Cost per Acre” result will be
displayed in the last row. These result data will not be stored in the database.
Figure 17 The second data entry form for peanut crop
Figure 17 shows the second data entry form for peanut crop. It is the continuation
of the form in Figure 16. All the features and functionality of Figure 17 are similar to
those in Figure 16.
The last data entry form for peanut crop is shown in Figure 18. The data entered
in this form is about the fixed costs of peanut crop. Because each crop has its own
unique cost item(s), we can not develop a universal crop data entry form for all these five
crops. This makes NewPeanutPlan somehow less efficient. To overcome this problem,

44
the data structures of the crop data have to be modified. This will be decided by the
client of NewPeanutPlan.
Figure 18 The third data entry form for peanut crop
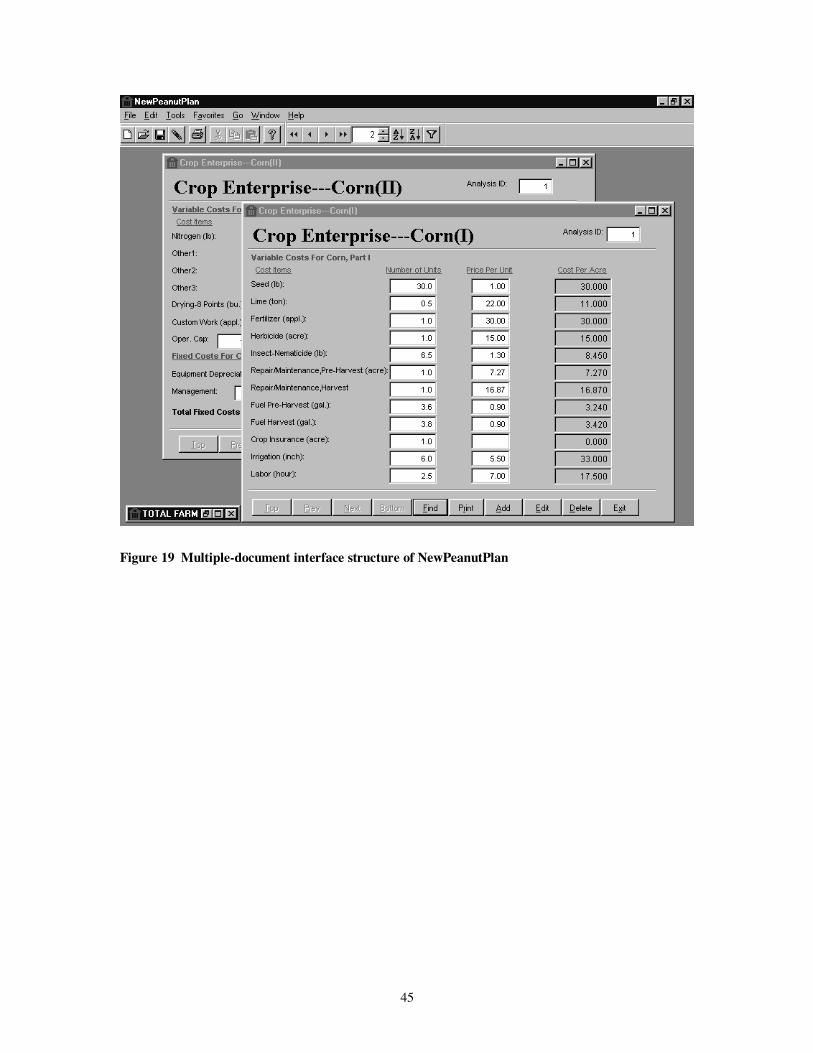
4.4 Multiple-document interface (MDI) structure of NewPeanutPlan
The NewPeanutPlan is a multiple-document interface (MDI) window
application. It consists of a single main(parent) window, and its child windows are
contained within or float on top of the main window. Figure 19 shows the MDI structure
of NewPeanutPlan. Several child windows can be opened at the same time, but only
one of them is active. The child window can be minimized or maximized, but they will
always stay inside the parent window. In Figure 19, two child windows are opened and
one is minimized. Figure 19 also shows the data entry forms for corn crop. They are
basically the same as those for peanut crop. When a child window is opened, a group of
record navigation buttons would be popped up in the menu bar (as shown in Figure 19).
45
Figure 19 Multiple-document interface structure of NewPeanutPlan

46
5. Conclusions
A complete cycle of software development process was practiced. It started with the
requirements derivation and system design, and completed with the final distribution of
the application. Through this project, the full picture of the Microsoft Visual FoxPro 6.0
development environment has been studied. Because of the object oriented nature of the
Microsoft Visual Studio, some common features of Visual FoxPro can also be applied to
other visual development environments, such as Visual C++, Visual Basic, etc.
The major framework of this application project has been finished, more detailed
modifications are still needed after user evaluation and testing.

47
References
[1] Marshall C. Lamb and Jesse W. Childre, PNTPLAN --- A Whole Farm Planning System, 1st Edition, USDA-ARS National Peanut Research Laboratory, Dawson GA, 1996.
[2] Marshall C. Lamb and Jesse W. Childre, PNTPLAN --- A Whole Farm Planning System, 2nd Edition, USDA-ARS National Peanut Research Laboratory, Dawson GA, 1999.
[3] Microsoft Corporation, Microsoft Visual FoxPro 6.0 Programmer’s Guide, Microsoft Press, 1998.
[4] Menachem Bazian, Jim Booth, Jeb Long, Vin Miller, Celia Silver, Robert A. Byers, Special Edition Using Visual FoxPro 6.0, Que Corporation.