Embed Size (px)
Citation preview
Design and Implementation of a Prototype Toolset
for Full Life-Cycle Management of Web-Based Applications
TR-29.3610
By
Joseph G. Gulla
A dissertation submitted in partial fulfillment of the requirements
for the degree of Doctor of Philosophy
Graduate School of Computer and Information Sciences
Nova Southeastern University
2002
We hereby certify that this dissertation, submitted by Joseph G. Gulla, conforms to acceptable standards and is fully adequate in scope and quality to fulfill the dissertation requirements for the degree of Doctor of Philosophy. ______________________________________________ ___2/5/2003___ John A Scigliano, Ed.D. Date Chairperson of Dissertation Committee ______________________________________________ ____1/22/2003__ Maxine S. Cohen, Ph.D. Date Dissertation Committee Member ______________________________________________ ____1/24/2003__ Sumitra Mukherjee, Ph.D. Date Dissertation Committee Member Approved: ______________________________________________ ____2/7/2003__ Edward Lieblein, Ph.D. Date Dean, Graduate School of Computer and Information Sciences
Graduate School of Computer and Information Sciences Nova Southeastern University
2002
Abstract
An Abstract of a Dissertation Submitted to Nova Southeastern University in Partial Fulfillment of the Requirements for the Degree of Doctor of Philosophy
Design and Implementation of a Prototype Toolset
for Full Life-Cycle Management of Web-Based Applications
by Joseph G. Gulla
November 2002
The goal in this study was the design and prototype implementation of procedures, programs, views, schema, and data (toolset) for the management of Web applications. This toolset pertained to all phases of the Web application's life including design, construction, deployment, operation, and change. The toolset built upon key functional perspectives including accounting, administration, automation, availability, business, capacity, change, configuration, fault, operations, performance, problem, security, service level, and software distribution. The main problems addressed by the researcher through the toolset were the lack of support in a number of key areas such as keeping applications available and performing well, making applications easy to fix when they fail, making applications easier to change and maintain, and ensuring that applications are secure. The toolset addressed these challenges and at the same time reduced the impact of application complexity, the labor needed, and the skill required to achieve Web application manageability. Joint application design techniques were used for requirements and design activities. A rapid application design approach was used for toolset implementation, planning, and construction. Evaluation was done using a five-question survey that focused on input about the toolset's software attributes and technology, level of satisfaction with the toolset, and perceived contribution of the toolset to the organization. It is expected that this research project will be used as input for future service-based offerings for IBM's e-Business Hosting line of business.

Acknowledgements I would like to thank Dr. Scigliano for his patient and skillful guidance of my dissertation project. Over the last two years, I have appreciated his consistent encouragement and celebratory messages as I completed each milestone including the idea paper, preliminary and formal proposals, and final report. I would also like to thank Drs. Cohen and Mukherjee for their helpful comments and suggestions regarding my Formal Dissertation Proposal and Final Dissertation Report. Finally, I would like to thank my wife Rosemarie for making it possible for me to complete this dissertation without taking a leave of absence from IBM.

Table of Contents Abstract iii List of Tables viii List of Figures xii Chapters 1. Introduction 1 Statement of the Problem Investigated and Goal Achieved 1 Statement of the Problem 1 Goal 10 Relevance and Need for the Study 12 Barriers and Issues 14 Applications and Their Environments are Complex 14 Making Applications Management Ready is Labor Intensive 15 Management Solutions Require a High Skill Level 15 There is a Lack of Focus on the Manageability of Applications 16 Hypotheses and Research Questions Investigated 16 Limitations and Delimitations of the Study 22 Definition of Terms 22 Summary 27 2. Review of the Literature 30 Introduction 30 Historical Overview of the Theory and Research Literature 30 Application Management as a Discipline 31 History of Applications Management 36 Major Research Efforts and Projects 40 The Theory and Research Literature Specific to Application Management 45 Management Infrastructure 46 Management Standards 52 Management Information Repository 63 Classes of Products 77 Summary of What is Known and Unknown About this Topic 88 Accounting 93 Administration 95 Automation 96 Availability 98 Business 99 Capacity 101 Change 103 Configuration 105 Fault 108 Operations 111 Performance 114
v

Problem 116 Security 118 Service Level 120 Software Distribution 122 The Contribution This Study Makes to the Field 123 Expand Knowledge and Capability in Full Life-Cycle Management of
Applications 124 Provide the Design of an Innovative Toolset for the Management of
Applications 125 Expand the Capabilities of 15 Key Functional Perspectives in Applications
Management 126 Integrate with Existing Products in a Seamless Fashion 126 Summary 127 3. Methodology 130 Research Methods Employed 130 Specific Procedures Employed 130 Design the Toolset 130 Implement the Toolset 134 Evaluate the Toolset 135 Formats for Presenting Results 139 Projected Outcomes 140 Resource Requirements 141 Hardware 141 Software 142 Data 143 Procedures 144 People 144 Reliability and Validity 144 Summary 145 4. Results 147 Introduction 147 Presentation of Results 148 Analysis 149 Toolset Design 149 Overall System Summary 149 Subsystem Summary 156 Support for the Accounting Functional Perspective 156 Support for the Administration Functional Perspective 160 Support for the Automation Functional Perspective 166 Support for the Availability Functional Perspective 171 Support for the Business Functional Perspective 174 Support for the Capacity Functional Perspective 177 Support for the Change and Configuration Functional Perspectives 180 Support for the Fault Functional Perspective 185
vi
Support for the Operations Functional Perspective 187 Support for the Performance Functional Perspective 189 Support for the Problem Functional Perspective 192 Support for the Security Functional Perspective 194 Support for the Service Level Functional Perspective 197 Support for the Software Distribution Functional Perspective 200 Other Support for the Functional Perspectives 206 Application Segment Strategy and Planning for Scenario Development 205 Web Application Operational Fault 207 Web Application Deployment is Unsuccessful 209 Web Application Change Results in Poor Performance 211 Web Application Experiencing Bottlenecks as Some Queries Take a Long Time 212 Overall Response for the Web Application is Slow but the Application is Still Functional 214 Toolset Implementation Using the Segment Strategy 217 Toolset Evaluation 222 Findings from the Survey 222 Profile of Participants 223 Responses to the Toolset Survey 226 Written Comments on the Strengths and Weaknesses of the Toolset 238 Summary of results 243 5. Conclusions, Implications, Recommendations, and Summary 246 Introduction 246 Conclusions 246 Conclusions for the Primary Research Questions and the First Hypothesis 247 Conclusions for the Secondary Research Questions 252 Conclusions for Hypotheses 2, 3, and 4 275 Strengths, Weaknesses, and Limitations of the Study 280 Implications 283 Recommendations 284 Summary 287 Appendixes 291 A. Functional Perspectives Analysis Tables 292 B. Toolset Evaluation Survey 297 C. Institutional Review Board Documents 300 D. Tivoli Management Applications 308 E. Survey Materials From the Toolset Evaluation 312 F. Background and Brainstorming Materials 362 G. Comment Sheet Detail 383 H. Data Dictionary for Full Life Cycle Toolset 399 Reference List 428
vii

List of Tables Tables 1. Messages Extracted From a Log File 48 2. Reference Architecture Components for CORDS Project 64 3. MIR Product Implementations Discussed 68 4. NetView Data Including Type, Table Name, and Description 73 5. Summary of Five Framework Products 83 6. Different Views of Application-Management Functional Perspectives 90 7. Management Products and the Function That They Perform 92 8. The Applications Dependency Stack and Application-Management Support 124 9. Proposed Category and Subcategory Elements of the TeamRoom 133 10. Hardware Used for the Creation of the Toolset 142 11. Software Used for the Creation of the Toolset 142 12. Primary Inputs to Design Sessions 150
13. Functional Perspectives and Related Subsystems 152
14. Resource Modeling Component Summary 157
15. Resource Accounting Component Summary 159
16. Automated Installation and Configuration Component Summary 161
17. Configuration Verification Component Summary 165
18. Template Creation Component Summary 167
19. Component Comparison Component Summary 170
20. Deep View Component Summary 173
21. Business Views Component Summary 175
viii
22. Application Capacity Bottlenecks Component Summary 178
23. Unauthorized Change Detection Component Summary 181
24. Change-Window Awareness Component Summary 184
25. Smart Fault Generation Component Summary 186
26. Integrated Operations View Component Summary 188
27. Intimate Performance Component Summary 190
28. Detailed Data Component Summary 193
29. Interface Monitoring Component Summary 195
30. SLO/SLA Data Component Summary 198
31. Deployment Monitoring Component Summary 201
32. MIR Creation Component Summary 204
33. Subsystems and Related Scenarios 217
34. Subsystems and Related Tables to Support the Prototype 221
35. Summary of Participant Profile Information 224
36. Scenario 1 Summary 227
37. Scenario 2 Summary 229
38. Scenario 3 Summary 231
39. Scenario 4 Summary 232
40. Scenario 5 Summary 234
41. Ranking of Scenarios 235
42. Summary of Question-by-Question Analysis 237
43. Ranking of Questions 238
ix

44. Informal Strengths Summary 239
45. Informal Weakness Summary 241
46. Other Informal Comments 242
47. Data Sources Used in the Toolset Scenarios 276
48. Three Attributes of Significance to Hypothesis 3 278
49. Availability and Performance Focus by Scenario 279
50. Standards Organizations and Support for Fifteen Functional Perspectives 292 51. Researchers, Research and Consulting Organizations, and Vendors and Support for Fifteen Functional Perspectives 293 52. Systems Management Products and Support for Fifteen Functional Perspectives (First Six) 294 53. Systems Management Products and Support for Fifteen Functional Perspectives (Last Seven) 295 54. Application Capacity Log 399 55. Application Definition 400 56. Automated Installation and Configuration Log 402 57. Business Systems Definitions 404 58. Change-Window Operations Log 404 59. Configuration Verification Log 406 60. Deep View Application Resources 407 61. Deployment Status Log 414 62. Detailed Data 415 63. Resource Modeling Log 416 64. Resource Monitoring Input 417
x

65. SLO/SLA Definitions 418 66. SLO/SLA Log 418 67. Specific Fault Data 419 68. Unauthorized Change Detection Log 426
xi
List of Figures Figures 1. The Toolset as Integrator of Existing Views or Tools with an Application
Management Layer 7 2. The Toolset as Management Functions with Actions that Support Application
Management 8 3. The Toolset and Its Components Consisting of Procedures, Programs, Views,
Schema, and Data 11 4. Applications Management as Part of a Comprehensive Approach 13 5. Categorization Grid Showing Business Impact of Applications 35 6. MANDAS Architecture 42 7. Concepts Important to the Management of Applications 45
8. Builders and Users of the GEM MIR 71 9. NetView, Sources of Data, and its Relational Database Support 72 10. The NetView OS/390 MIR 74 11. Solstice Enterprise Agents and Other Components 75 12. The Toolset and its Relationship to the Management and Application Domains 127 13. Layout of Typical Web Page 219 14. Layout of Typical Frameset 220 15. Results of the Survey Regarding Participants' Job Family 225 16. Results of the Survey Regarding Participants' Focus Area 226 17. Cover page from the JAD Kickoff Presentation 362 18. Agenda from the JAD Kickoff Presentation 363 19. Background from the JAD Kickoff Presentation 364 20. Design background from the JAD Kickoff Presentation 365
xii
21. Implementation background from the JAD Kickoff Presentation 366 22. Toolset Information from the JAD Kickoff Presentation 367 23. Procedures Information from the JAD Kickoff Presentation 368 24. View Information from the JAD Kickoff Presentation 369 25. Program Information from the JAD Kickoff Presentation 370 26. MIR Information from the JAD Kickoff Presentation 371 27. Schema Information from the JAD Kickoff Presentation 372 28. Data and Information for the MIR from the JAD Kickoff Presentation 373 29. Brainstorm page from the JAD Kickoff Presentation 374 30. Phases and Toolset Information from the JAD Kickoff Presentation 375 31. Functional Perspectives Information from the JAD Kickoff Presentation 376 32. Design Brainstorming Template from the JAD Kickoff Presentation 377 33. Construction Brainstorming Template from the JAD Kickoff Presentation 378 34. Deployment Brainstorming Template from the JAD Kickoff Presentation 379 35. Operations Brainstorming Template from the JAD Kickoff Presentation 380 36. Change Brainstorming Template from the JAD Kickoff Presentation 381 37. Next Steps from the JAD Kickoff Presentation 382
xiii
Chapter 1
Introduction Statement of the Problem Investigated and Goal Achieved
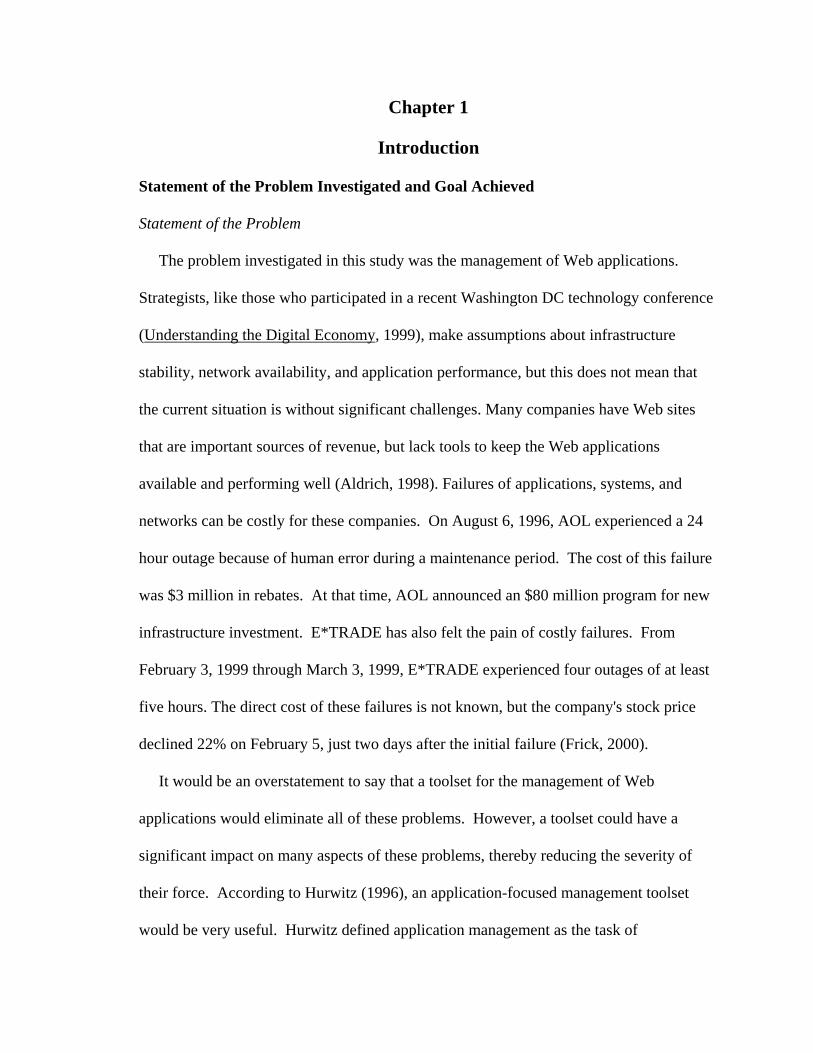
Statement of the Problem The problem investigated in this study was the management of Web applications.
Strategists, like those who participated in a recent Washington DC technology conference
(Understanding the Digital Economy, 1999), make assumptions about infrastructure
stability, network availability, and application performance, but this does not mean that
the current situation is without significant challenges. Many companies have Web sites
that are important sources of revenue, but lack tools to keep the Web applications
available and performing well (Aldrich, 1998). Failures of applications, systems, and
networks can be costly for these companies. On August 6, 1996, AOL experienced a 24
hour outage because of human error during a maintenance period. The cost of this failure
was $3 million in rebates. At that time, AOL announced an $80 million program for new
infrastructure investment. E*TRADE has also felt the pain of costly failures. From
February 3, 1999 through March 3, 1999, E*TRADE experienced four outages of at least
five hours. The direct cost of these failures is not known, but the company's stock price
declined 22% on February 5, just two days after the initial failure (Frick, 2000).
It would be an overstatement to say that a toolset for the management of Web
applications would eliminate all of these problems. However, a toolset could have a
significant impact on many aspects of these problems, thereby reducing the severity of
their force. According to Hurwitz (1996), an application-focused management toolset
would be very useful. Hurwitz defined application management as the task of

2
guaranteeing the availability, reliability, and performance of applications. Therefore, this
project is important at this time, because it will help to address the lack of tools by
providing a prototype toolset based on a design that is centered on the management of the
Web application.
The situation with the management of Web applications may be an even greater
challenge than that for other types of distributed applications. Many Web applications
require access to existing applications and data from client/server, distributed and
mainframe systems. This is the case for one of the Web applications recently deployed at
a leading insurance company (Turner, 1998). Since the Web implies 24 hours a day,
seven days a week availability, a toolset is needed to deal with challenges like minimizing
planned down time for application upgrades and database backups (Mason, 1998). A
toolset is also needed to help answer the question--is it the network or the application
(Garg, 1998)? Many of the application-response measurement techniques described by
Garg and Schmidt (1999) are needed for Web applications as they suffer from the same
problems that affect client/server applications.
In 1997, the White House of the United States published a report titled "A Framework
for Global Electronic Commerce." This important document focused on principles
regarding the way that electronic commerce should develop in the United States and
around the world. The principles explained included:
1. The private sector should lead.
2. Governments should avoid undue restrictions on electronic commerce.
3. Where government involvement is needed, its aim should be to support and enforce
predictable, minimalist, consistent and simple legal environment for commerce.
3
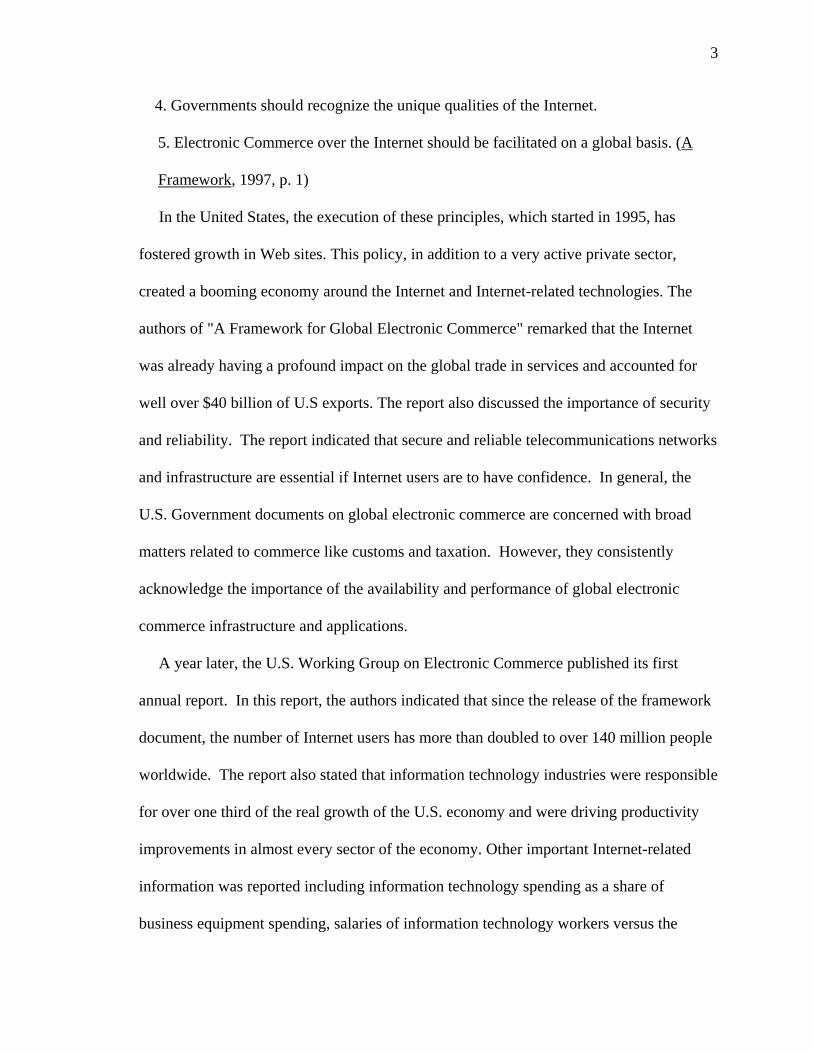
4. Governments should recognize the unique qualities of the Internet.
5. Electronic Commerce over the Internet should be facilitated on a global basis. (A
Framework, 1997, p. 1)
In the United States, the execution of these principles, which started in 1995, has
fostered growth in Web sites. This policy, in addition to a very active private sector,
created a booming economy around the Internet and Internet-related technologies. The
authors of "A Framework for Global Electronic Commerce" remarked that the Internet
was already having a profound impact on the global trade in services and accounted for
well over $40 billion of U.S exports. The report also discussed the importance of security
and reliability. The report indicated that secure and reliable telecommunications networks
and infrastructure are essential if Internet users are to have confidence. In general, the
U.S. Government documents on global electronic commerce are concerned with broad
matters related to commerce like customs and taxation. However, they consistently
acknowledge the importance of the availability and performance of global electronic
commerce infrastructure and applications.
A year later, the U.S. Working Group on Electronic Commerce published its first
annual report. In this report, the authors indicated that since the release of the framework
document, the number of Internet users has more than doubled to over 140 million people
worldwide. The report also stated that information technology industries were responsible
for over one third of the real growth of the U.S. economy and were driving productivity
improvements in almost every sector of the economy. Other important Internet-related
information was reported including information technology spending as a share of
business equipment spending, salaries of information technology workers versus the
4
private sector, and the growth of Internet hosts. This information built upon the work of
the original framework document. However, this report began new initiatives like
ensuring adequate bandwidth and access, consumer protection, the Internet and
developing countries, and understanding the digital economy (Unites States Government,
1998).
In May 1999, a conference was held in Washington, DC at the U.S. Department of
Commerce. The conference was titled "Understanding the Digital Economy." This
conference was a direct result of a working group initiative and covered a broad range of
topics. The topics included macroeconomic assessment, organizational change,
measuring the digital economy, small business access, market structure and competition,
and employment and the workforce. There were more than 35 speakers from government,
universities, and technology companies (Understanding the Digital Economy, 1999).
Most of the focus was on strategic issues, but throughout there was the assumption that
the Web would be up, available, and performing well.
All of the elements of a Web site must work correctly for it to be useful. Welter (1999)
put this in a business context by indicating that this would help maximize a company's
investment. Many interrelated elements must work together to support the Web
application. Web sites can be very complex in the way they are constructed. Jutla, Ma,
Bodorik, and Wang (1999) described the components of their Web-based system that
included browsers, database servers, Web servers, firewalls, network protocols, and SSL
components from a trusted third-party. Other Web-based systems have an even longer list
of interrelated elements. The USAA Internet Member Services system contained many of
the elements of the Web-based Order Management System, but also included legacy

5
components like database systems on mainframe computers. Member Services was also
closely related to systems owned and maintained by banks that were used by the USAA
Internet Member Services management system (Turner, 1998). Another example was the
IBM REQCAT Web application. This commercially available application had still other
components like mail servers, eNet Dispatchers (used for application-level load
balancing), gateway servers, and interfaces to SAP (Turner, 1999). SAP, which means
Systems Applications Products in Data Processing, is an industry leading enterprise
resource planning application. The broad number of elements or components that make up
these systems dramatically increases the challenge of maintaining their availability.
This toolset helps to address the challenge of keeping Web elements available by
reporting their availability in an application context. This context, which can also be
called business-system management, provides an alternative to the technology-based
approaches that dominate the systems-management field today. This prototype toolset
provides a way to anticipate failures and to automatically correct them when possible.
Automation is important for providing timely responses to problem situations just as it has
proven indispensable in other areas like the automatic creation of instrumentation for the
management of systems, networks, and applications (Hong, Gee, & Bauer, 1995) and
policy driven fault management in distributed systems (Katchabaw, Lutfiyya, Marshall, &
Bauer, 1996).
Future growth and stability are difficult without a well-managed site. According to
Hurwitz (1998), the bookseller Amazon.com recently lost the availability of its Web
servers. This is the only way Amazon.com customers can book orders! When this
happens, customers can wait until the system comes back or try another on-line

6
bookseller. Amazon.com is hopeful to turn a profit in 2002, so retaining its customers, and
attracting new ones is very important (Sandoval & Dignan, 2001). Other e-commerce
companies have experienced problems like Amazon.com. On June 12, 1999, eBay
experienced a 22 hour operating system failure that cost between $3 and $5 million.
eBay's stock price suffered a 26% decline that was attributed to the failure. Between
February 24, 1999 and April 21, 1999, Charles Schwab & Company experienced four
outages of at least four hours in duration. The direct cost of these failures is not known,
but shortly after the problems, the company announced a $70 million investment in new
infrastructure (Frick, 2000).
This toolset helps promotes a deeper understanding of how Web system and
application availability can be improved. With Web application management as a focus,
this toolset explores a new and different way to make Web sites more stable and better
managed. Initially, two approaches were considered for the overall approach of the
toolset. One approach was that the toolset would unify or integrate components of the
application into a new discipline by adding a new management layer to the management
layers that already exist. An example of an existing discipline is Network Management
used for the management of networks. The proposed discipline or way of thinking called
Web application management was in addition to the technology-based views, approaches,
and tools that are currently used to manage the components used by applications. The
new discipline of Web application management would work in cooperation with the other
management disciplines. This approach is shown in Figure 1.
7
________________________________________________________________________
N ewLayer
E xis tingLayers
H ardware S ystem s
W eb A pp lica tion M anagem ent
N etwork
M iddlewareD atabase
A pplication P rogram s
O perating System
P roposedT oolset
E xistingT ools
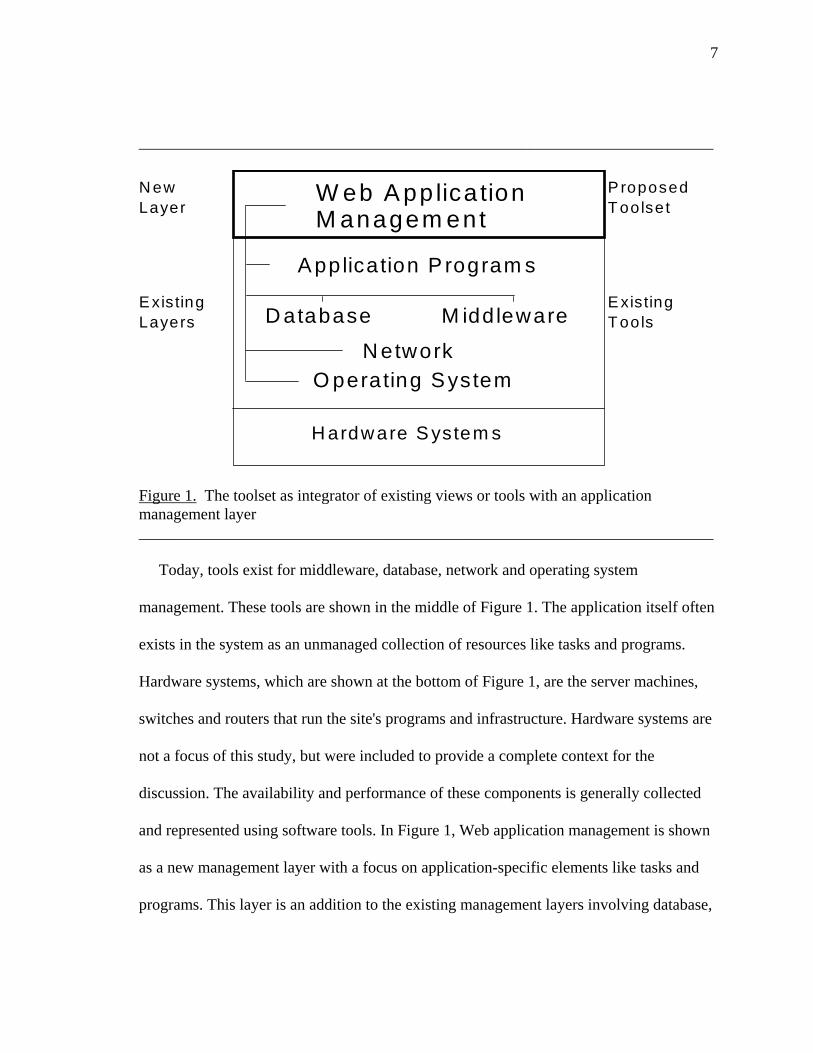
Figure 1. The toolset as integrator of existing views or tools with an application management layer ________________________________________________________________________
Today, tools exist for middleware, database, network and operating system
management. These tools are shown in the middle of Figure 1. The application itself often
exists in the system as an unmanaged collection of resources like tasks and programs.
Hardware systems, which are shown at the bottom of Figure 1, are the server machines,
switches and routers that run the site's programs and infrastructure. Hardware systems are
not a focus of this study, but were included to provide a complete context for the
discussion. The availability and performance of these components is generally collected
and represented using software tools. In Figure 1, Web application management is shown
as a new management layer with a focus on application-specific elements like tasks and
programs. This layer is an addition to the existing management layers involving database,
8
middleware, network and the operating system. This new layer complements the other
layers with a specific focus on the Web application.
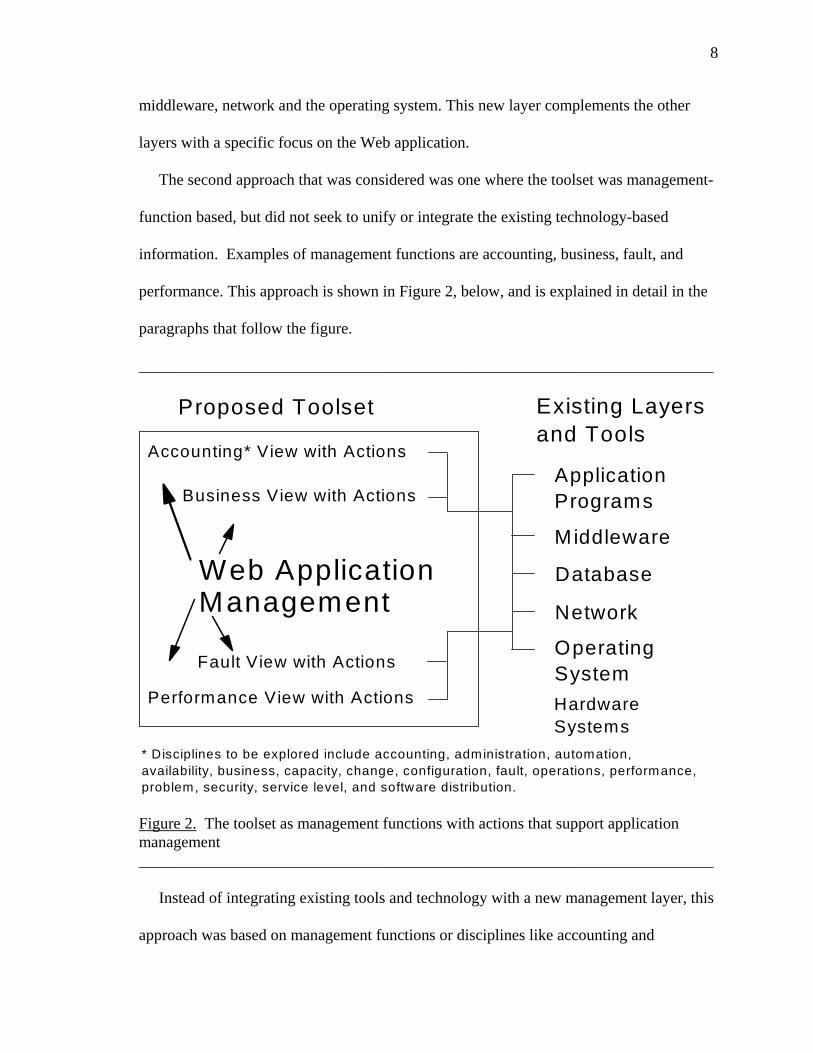
The second approach that was considered was one where the toolset was management-
function based, but did not seek to unify or integrate the existing technology-based
information. Examples of management functions are accounting, business, fault, and
performance. This approach is shown in Figure 2, below, and is explained in detail in the
paragraphs that follow the figure.
________________________________________________________________________
Network
Middleware
Database
ApplicationPrograms
OperatingSystem
Performance View with Actions
Web Application Management
Accounting* View with Actions
Fault View with Actions
Business View with Actions
HardwareSystems
* Disciplines to be explored include accounting, administration, automation,availability, business, capacity, change, configuration, fault, operations, performance,problem, security, service level, and software distribution.
Proposed Toolset Existing Layersand Tools
Figure 2. The toolset as management functions with actions that support application management ________________________________________________________________________
Instead of integrating existing tools and technology with a new management layer, this
approach was based on management functions or disciplines like accounting and
9
performance. Each management function had a management view of the Web application
and a set of actions that could be taken from the view such as start, stop, restart, and show
events. The accounting view could be used to show real-time charge back information for
the application. The accounting actions could be used to start or stop the accounting
recording function or generate an ad hoc bill for a department or division.
The business view could be used to monitor a collection of applications that indicated
the status and relationship of the components that made up the business system. The
business actions could include dynamically allocating resources to certain components of
the business system or restarting application components that have failed. The fault view
could be used to monitor for application-specific faults like application errors or
terminations. The fault actions could be used to repair errors using the guidance provided
in the recommended actions for the specific fault. The performance view could be used to
monitor for application performance bottlenecks. When these problems are detected,
performance action could be taken such as assigning additional threads or reducing the
number of concurrent users.
In summary, the management function software interfaced with existing layers and
tools, but operated in the context of a well-defined management function. This approach is
strongly tied to the ability of the computer management specialist to model the application
using views and to manage the application using monitors and commands.
The requirements and design activities for the toolset resulted in a management-
function based toolset. During the joint application design activities, one or more
subsystems were developed in support of each functional perspective. For example, the
accounting functional perspective had two subsystems to support its functional needs. The

10
Resource Modeling and Resource Accounting subsystems were developed to support the
accounting requirements of a Web application. The management function approach was
used because it offered the best opportunity to link application management with a set of
disciplines, such as administration and performance, which have long-standing
importance to users and the systems-management community. The management function
approach also offered the best opportunity to innovate and create an exciting design and
prototype toolset.
Goal The goal of the researcher in this dissertation was to reduce the barriers to the
successful implementation and operation of Web applications by providing full life-cycle
management support of these applications. In general, there are significant problems in
managing distributed applications. Bauer, Bunt, El Rayess, Finnigan, Kunz, Lutfiyya,
Marshall, Martin, Oster, Powley, Rolia, Taylor, and Woodside (1997) stated “the design,
development, and management of distributed applications presents many difficult
challenges. As these systems grow to hundreds or even thousands of devices and similar
or even greater magnitude of software components, it will become increasingly difficult to
manage them without appropriate support tools and frameworks” (p. 508). According to
the Hurwitz Consulting Group, "The lack of manageability has led to a crisis in enterprise
computing" (Application Management: A Crisis, 1996, p.3). Martin (1996) pointed out
that management support is often cited by users of a system as a very important aspect of
the distributed system.
In this dissertation, the researcher designed and implemented a prototype toolset for
the management of Web applications. The toolset included procedures, views, programs,

11
schema, and data as part of a system to improve the monitoring and control of Internet
applications (see Figure 3). Procedures were used to define tasks performed by operators
or system administrators. Views were used to monitor and manage the application using
graphical depictions of application components. Programs performed tasks and operations
with a minimum of human interaction. The schema defined the layout of the application-
management data. Management data was stored in a database and consisted of items like
run-time parameters, profiles, alerts, and log files.
________________________________________________________________________
Schema
Views
Data
Procedures
Programs
Figure 3. The toolset and its components consisting of procedures, programs, views, schema, and data ________________________________________________________________________
The design of the toolset was based on input gathered from system administrators,
developers, and systems-management personnel. A Joint Application Design approach
12
was used. Design collaboration was fostered with a document-based electronic data base
called a TeamRoom. The prototype toolset was developed using Rapid Application
Development techniques. The toolset leveraged existing technology like a database
management systems to store application management data and hypertext markup
language to build management views. The toolset evaluation uses a methodology based on
a framework from Boloix and Robillard (1995).
Relevance and Need for the Study Web application management is a necessary part of a management system that ensures
the viability of the Web site. Presently, there is an intense focus on the availability of the
servers and infrastructure such as switches and routers, but management of the e-business
application itself is also needed (Gillooly, 1999). Management of the Web application is
often neglected because it is considerably more challenging than management of a
common set of components like servers. Results of this study contribute to the discipline
of systems management by making it possible to consider comprehensive management of
a site by including the key discipline of managing the Web application itself.
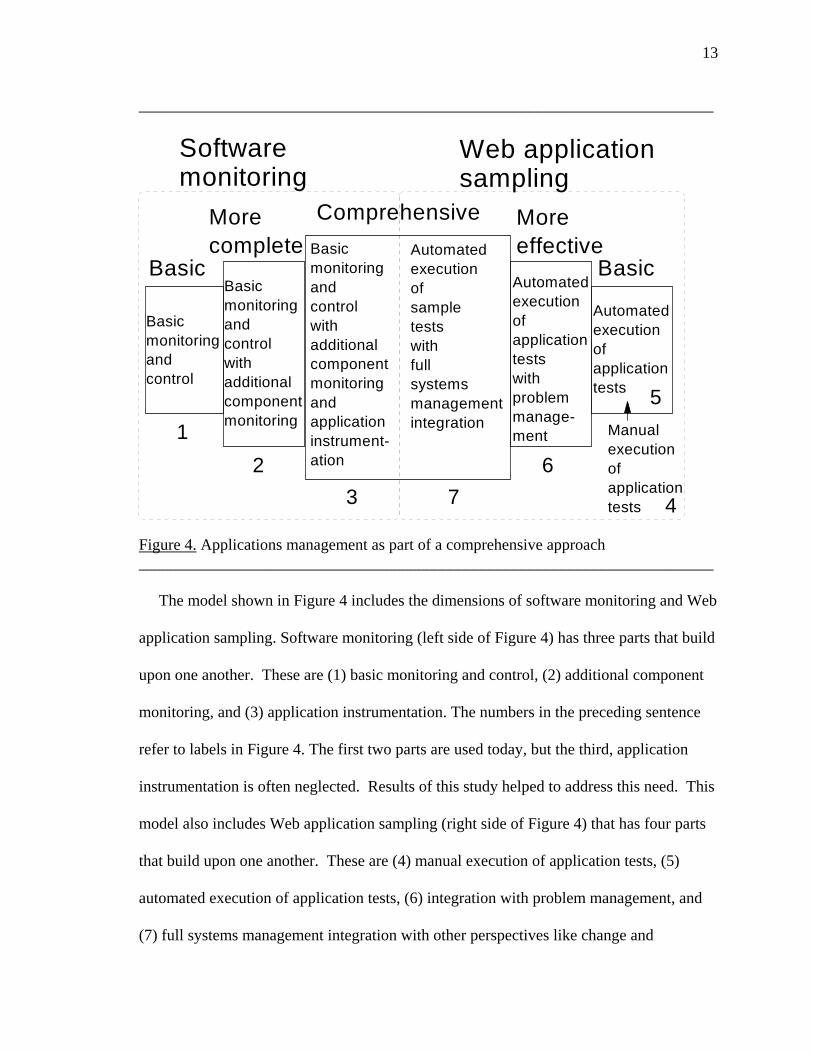
Results of this study produced work products that will foster the use of application
management instrumentation. Application management instrumentation is a key part of
Figure 4 that shows an original two-part model. Instrumentation makes a comprehensive
applications-management approach meaningful to the enterprise because it provides
detailed data about the application. For example, this detail can be used to answer specific
questions about the impact of application faults on the performance of the application.
13
________________________________________________________________________
Basicmonitoringandcontrolwithadditionalcomponentmonitoringand applicationinstrument-ation
Automatedexecutionof applicationtestswithproblemmanage-ment
Basicmonitoringandcontrolwith additionalcomponentmonitoring
Automatedexecutionofapplicationtests
Basicmonitoringand control
Manualexecutionofapplicationtests
Basic Basic
Morecomplete
Moreeffective
Comprehensive
Software monitoring
Web application sampling
Automatedexecutionof sample testswithfullsystemsmanagementintegration1
23 4
5
67
Figure 4. Applications management as part of a comprehensive approach ________________________________________________________________________
The model shown in Figure 4 includes the dimensions of software monitoring and Web
application sampling. Software monitoring (left side of Figure 4) has three parts that build
upon one another. These are (1) basic monitoring and control, (2) additional component
monitoring, and (3) application instrumentation. The numbers in the preceding sentence
refer to labels in Figure 4. The first two parts are used today, but the third, application
instrumentation is often neglected. Results of this study helped to address this need. This
model also includes Web application sampling (right side of Figure 4) that has four parts
that build upon one another. These are (4) manual execution of application tests, (5)
automated execution of application tests, (6) integration with problem management, and
(7) full systems management integration with other perspectives like change and

14
performance. This study addressed how to provide more complete systems-management
integration in direct support of Web applications. Using this model, the results of this
study help make it possible to provide a level of support (basic, more complete or
comprehensive) that meets the needs and budget of the application provider.
Barriers and Issues The challenge of managing applications is surfacing because more and more Web
applications are being developed and deployed. The situation is now more urgent because
many companies are using the Web for commerce. By 2003, the U.S. Commerce
Department estimates that business to consumer e-commerce will likely be in the range of
$75 to $144 billion. Business to business e-commerce could reach between $634 billion
and $3.9 trillion. (Leadership for the New Millennium, 2001).
Four barriers and issues were addressed by the proposed toolset. The challenges are
significant. Some challenges, like application complexity and high skill level
requirements, are growing more difficult over time as Web sites reference more legacy
data and systems. The lack of focus on manageability is a barrier that will require a
change in thinking. Making applications manageable involves a labor challenge that can
perhaps best be addressed by leveraging automated software capabilities. These barriers
and issues are explored in more detail below.
Applications and Their Environments are Complex Applications management is difficult, because applications and the environments they
run in are complex. Simply put, the complexity of applications is making them difficult
to manage (Application Management: A Crisis, 1996). This toolset addressed this
complexity by providing procedures, programs, views, schema, and data to help manage

15
these applications in the same way regardless of application environment or platform. In
so doing, the complexity of an applications-management implementation for developers
and systems-management administrators is reduced.
Making Applications Management Ready is Labor Intensive Another barrier is the labor-intensive nature of the effort required to put the
management system in place. Labor is needed to plan the effort. It is also needed to
design the management solution for the application. Planning and design activities are
only two of the many steps that are required to implement an applications-management
solution. In 1998, consultants from Tivoli Systems assisted a number of companies in
making their applications manageable. These efforts ranged from as few as 60 to as many
as 300 days of planning, design, and implementation. In 1998, a large effort was
undertaken for the Pentagon to instrument an important operational system. The pilot for
this effort took more than 250 days to complete (Tisdale, 1998). This toolset would have
helped to reduce the amount of labor required to implement a full life-cycle management
solution by providing procedures, programs, views, schema, and data that are ready to
implement and use across the application's life cycle.
Management Solutions Require a High Skill Level Another barrier is the high skill level required of the personnel that implement the
management solution. These individuals are required to be skilled in activities as diverse
as planning, debugging, design, and system testing. These individuals are also required to
know how to work with different operating systems, network protocols, databases, and
applications. Because of this high skill requirement, some analysts suggest that the
instrumentation should come from the vendors of application development tools
16
(Applications Management: A Crisis, 1996). This toolset helped reduce the skill
requirements by assisting individuals with planning, design, and implementation activities
over all life-cycle phases. This toolset also helped by providing management components
like monitors and tasks that run on any platform and do not require detailed platform
knowledge on the part of the personnel creating the management solution.
There is a Lack of Focus on the Manageability of Applications Another challenge to be overcome is the lack of focus on the management of the
application. Developers are primarily focused on the creation of the application’s useful
function and are often not concerned with how the application will be deployed and
managed after it is written. According to the Seybold Group, the solution is for
developers to participate in application management (Rymer, 1995). This toolset helped to
give management of the application the focus that it requires without mandating a high
degree of developer involvement. This toolset also helped to make the application
manageable by providing easy-to-use interfaces to popular application development
languages and environments. In addition, this toolset made it easier to define the
management characteristics of an application. These characteristics, once stored in a
machine-readable format, were used to distribute or monitor the availability of the
application.
Hypotheses and Research Questions Investigated Four hypotheses were explored in this study. The hypotheses are described below.
- Hypothesis 1 - The manageability of Web-based applications is improved by a
toolset (procedures, programs, views, schema and data) implemented in a full life-
cycle context, aligned with key functional perspectives.
17
- Hypothesis 2 - Existing data sources like alerts, traps, and messages are sufficient
to build and maintain an effective management information repository for the
management of Web-based applications.
- Hypothesis 3 - Problem determination is significantly improved by a toolset that
utilizes views to display information from a comprehensive management
information repository of data about the Web-based application.
- Hypothesis 4 - Availability and performance faults are more easily detected and
corrected using a comprehensive toolset.
Hypothesis 1 is related to the first three research questions. These questions are the
primary research questions. They are related to the first hypothesis because they explore a
specific aspect of the hypothesis such as the components that make up the toolset, the life
cycle context, and the appropriate functional perspectives. The primary research questions
are described below.
- Question 1 - What are the appropriate procedures, programs, views, schema, and
data that would improve the manageability of Web-based applications?
- Question 2 - How do these toolset components fit in the context of the
application's life cycle including design, construction, deployment, operation, and
change?
- Question 3 - How do these toolset components round out the functional
perspectives of accounting, administration, automation, availability, business,
capacity, change, configuration, fault, operations, performance, problem, security,
service level, and software distribution?
18
Hypotheses 2, 3, and 4 are associated with the secondary research questions. These
research questions are numbered 4 through 23. The secondary research questions explore
concepts specific to the functional perspectives that were examined in the study. The
secondary research questions are described below.
- Question 4, Part A - For the accounting functional perspective (as it relates to Web
application management), is it possible to instrument an application whereby the
developer or user specifies the resources they intend to use and the toolset alerts
them when the limit is exceeded? Part B - Are simple messages the appropriate
alert mechanism for this tool?
- Question 5, Part A - Another accounting research question is--is it possible to
instrument an application for accountability? Part B - Could this instrumentation
be used for the charge back of the Web site to the internal groups that use it?
- Question 6, Part A - For the administration functional perspective, is it possible to
completely automate the key administration activities for the installation of a Web
application? Part B - Is it possible to install a Web application without human
intervention?
- Question 7 - Another administration research question is--in a problem-solving
context, is it possible to verify the administrative settings of key Web application
software parameters using previously stored values?
- Question 8 - For the automation functional perspective, is it possible to read
design-phase work products and automatically produce templates to be used in
subsequent phases? Examples might include start, stop, and restart scripts or
19
schema that describes the key Web application components that make up the Web
site.
- Question 9 - Another automation research question is--is it possible to create a tool
that automatically compares designed versus actual installed Web application
components?
- Question 10, Part A - For the availability functional perspective, what are the
characteristics of "deep" availability? Often, availability is centered on the
management of the state of a logical resource--the symbolic representation of a
system or a user. Part B - How would a deeper treatment of availability be
managed? Would it automatically include responsiveness, stability, and usage
measurements?
- Question 11 - For the business functional perspective, what additional substance or
depth can be created in support of business-systems views, in addition to the
current focus on specific component monitors and commands?
- Question 12, Part A - For the capacity functional perspective, from the point of
view of the application (not the server), is it possible to determine the components
of the application that are important to understanding its potential for capacity
bottlenecks? Part B - Which application, middleware, and database components
are essential to understanding the capacity of the application and how does that
relate to server and network-based models and approaches?
- Question 13, Part A - For the change and configuration functional perspective, is it
possible for an application to detect unauthorized changes to itself? Part B - What
would be required to detect and notify these unauthorized modifications?

20
- Question 14, Part A - Another change and configuration question is--would
application-level change-window awareness be useful to the team or process
making the changes? Part B - Would this make possible the suppression of certain
kinds of application-generated faults, that often occur during planned change
periods?
- Question 15, Part A - For the fault functional perspective--is there an optimal
technique for generating application faults? Part B - Is a smart fault-generating
module possible? A smart module might be one that takes minimal input from the
application and makes intelligent choices regarding selections for the target-
systems.
- Question 16 - For the operations functional perspective, is there a way to have an
application view for the helpdesk that integrates key functions like job scheduling,
backup status and history, and the status of key print or file outputs?
- Question 17, Part A - For the performance functional perspective, is there an
alternative to gathering intimate application performance data by modifying the
application itself to insert calls to a performance-measurement tool? Part B - Is
there a proxy for this that is possible using an instrumented application robot?
- Question 18, Part A - For the problem functional perspective, most of the focus is
on the problem-management tools. Is it possible to instrument an application to
provide more meaningful and detailed data to the problem management system?
Part B - What would the instrumentation be that would minimize the programming
burden yet maximize the data collected and recorded?
21
- Question 19 - For the security functional perspective, is it possible to build a view
(with probes) that would be used to monitor key security interfaces for an
application? These interfaces might include traditional access points like
application sign on attempts, failures, and retries as well as information from
application dedicated routers, firewalls, and network interface cards.
- Question 20 - For the service level functional perspective, is it possible to architect
a service-level management tool that is independent of the application, yet it
records specific information, that can be used for both service-level objective and
service-level agreement reporting?
- Question 21 - Another service level question is--is it possible for a toolset to
gather availability and performance metrics as they relate to service level?
- Question 22 - For the software distribution functional perspective, is it possible to
create deployment-phase views that allow software distribution to be monitored on
an application component-by-component basis? Would it be helpful for the
monitoring of mission-critical distributions?
- Question 23 - Another software distribution question is--would it be useful to have
a tool that reads a directory structure and builds schema and data to populate the
Management Information Repository? These data, once loaded, could be used to
build packages for distribution, objects for distribution views, and storage for data
or information relating to distributions.
In summary, there are four hypotheses and twenty-three research questions. The first
hypothesis is associated with the primary research questions. Hypotheses 2, 3, and 4 are
associated with the secondary research questions. The results, which are explained in

22
Chapter 5 of this Final Dissertation Report, specifically address these hypotheses and
research questions in significant detail.
Limitations and Delimitations of the Study In this research, the author focused on the creation of a prototype, not a product. This
reflects the idea that the most important aspects of this work were the requirements
gathering and design work necessary to create a prototype of a management tool. The
design was comprehensive, but the implementation focused on a subset of function, that
supports the five scenarios explained in Appendix B - Toolset Evaluation Survey. This
prototype toolset has value as it could be used to assist with the development of service-
based offerings for an organization looking to develop or purchase an applications-
management solution. Kroenke and Dolan (1987) pointed out that prototyping is a
requirements-determination tool that is used like an architect's scale model.
This scale model focused specifically on the management of Web applications not
applications in general. Because of this, the toolset focused on Web-specific aspects of
monitoring, commands, operations interface, automation, and interface to management
systems like problem and change. The researcher did not focus on the management of
servers, networks, or hardware. These components are an important part of many Web
sites, but adequate management solutions are already in place to address these elements. A
management focus is missing at the top layer in the application-dependency stack. This
top layer is focused on the application itself and its supporting middleware and database
components.
Definition of Terms A number of key terms are defined below.

23
Application Programming Interface (API) - a formally defined programming language
interface between a program and the user of the program (Dictionary of Computing,
1987).
Application topology - used when describing application components and their
relationship to one another. With Tivoli software, this relationship is defined using the
enhanced relationship group that is defined in the Applications Management Specification
(Applications Management Specification, 1997).
Availability - has to do with monitoring an application and its environment while it is
running (Sturm & Bumpus, 1999).
Business to Business E-Commerce - where businesses sell to other businesses. For
example, when a shop orders new products for its shelves or a factory orders new steel to
make its products (Dr. Ecommerce, 2000).
Business to Consumer E-Commerce - where businesses set up a Web-based storefront
to reach a global market. The benefits to consumers are greater convenience, easy access
to a wide variety of goods and services, and savings in money and time (First Annual
Report, 1998).
Change - after an application is deployed and is running it is often changed. These
modifications take place during a period of time that is sometimes called the change
phase. These changes are often managed using change management practices and tools
(Harikian, Blust, Campbell, Cooke, Foley, Gulla, Gayo, Howlette, Mosher, and O'Mara,
1996).
Construction - a phase or period of time when the application is created. Some vendors
call this phase the assemble phase (CONTROL: Enterprise Web, 1999).
24
Data - a component of the toolset that is described by schema and resides in a
Management Information Repository (MIR) or file that is referenced by the MIR (Martin,
1996). Records in a Web-server log are typical of the data used in this project.
Deployment - a set of activities during the software life cycle where a software feature is
distributed and put in an installable state (DMTF Standards, 1998).
Design - a time during the creation of an application when the process of defining the
hardware and software architecture, components, modules, interfaces, and data for the
system is conceptualized and documented (Dictionary of Computing, 1987).
Desktop Management Task Force (DMTF) - this industry organization is leading the
development, adoption, and unification of management standards. The focus of this work
is broad – desktop, enterprise, and Internet environments (Distributed Management Task
Force, 1999).
Functional perspective - this term was used by Sturm and Bumpus (1999) for the
management functions needed to support an application. Examples include fault,
performance, configuration, and security.
Hyper Text Markup Language (HTML) - programming language that uses text and
tags to format a page or document on the World Wide Web (SCIS Help, 1999).
International Standards Organization (ISO) – work from this organization results in
international agreements that are published as international standards. ISO achievements
include the film speed code, the standardization of telephone and banking cards, and ISO
9000, which is used by businesses to provide a framework of quality management and
quality assurance (ISO - International Organization, 1999).
25
Information Technology Infrastructure Library (ITIL) - describes the organization of
service delivery in the area of automated information technology systems (Bladergroen,
Maas, Dullaart, Kalfsterman, Koppens, Mameren, & Veen, 1998).
Information Technology Process Model (ITPM) - an IBM process model consisting of
8 process groups, 41 processes, and 176 sub processes (Harikian et al., 1996).
Java Management Extensions (JMX) - an architecture, components, protocols, and
APIs that make it possible to manage Java applications through Java technology (JAVA
Management Extensions White, 1999).
Joint Application Design (JAD) - an approach that involves heavy client participation in
the development of formal requirement specifications (Jackson & Embley, 1996).
Management Information Repository (MIR) - tool to integrate management
applications and the data they require. A logically centralized database that is at the heart
of the management system (Martin, 1996).
Management Infrastructure - software, hardware, and procedures that are used to
support the management needs of an application. These needs cover activities like
application distribution, application installation, dependency checking, application
monitoring, application configuration, operational control, and deploying updates and new
releases. (Applications Management Specification, 1995).
Monitor - a program that examines specific applications or systems, upon which,
applications rely. Typical monitor programs examine available disk space or application
errors and use thresholds to determine when conditions require the attention of an
administrator (Tivoli Manager for Oracle, 2000).
26
Operation - a time in the application life cycle (phase) when a software feature is running
and being monitored (DMTF Standards, 1998). It can also refer to data or tasks performed
by people.
Open Software Foundation (OSF) / Distributed Computing Environment (DCE) -
OSF is now The Open Group and they provide DCE which is a robust, network-centric
computing environment that includes system services like remote procedure call, directory
services, time services, security services, and thread services (DCE Overview, 1996).
Procedure - a description of the course of action to be followed as a solution to a problem
(Dictionary of Computing, 1987).
Program - a sequence of instructions for processing by a computer (Dictionary of
Computing, 1987).
Rapid Application Development (RAD) - this approach is used in software development
as a means of delivering maximum functionality in the shortest time (Carter, Whyte,
Birchall, & Swatman, 1997).
Schema - a set of statements that describe the structure of the database (Dictionary of
Computing, 1987).
Secure Socket Layer (SSL) - a mechanism for securing Web transactions. This protocol
consists of an initial phase, called a handshake, during which secure communications are
established; a period of application-to-application communication where encryption is
applied to the data; and finally an exchange of data to close the dialog (Rubin, Geer, &
Ranum, 1997).

27
Simple Network Management Protocol (SNMP) – this protocol is a simply composed
set of network communication specifications that cover the basics of network
management in a way that does not stress an existing network (Vallillee, n.d.).
Transmission Control Protocol/Internet Protocol (TCP/IP) - a protocol suite named
for two of its most important protocols: Transmission Control Protocol and Internet
Protocol. The suite is over 25 years old and is still evolving (Feit, 1996).
UNIX – this operating system was created in the late 1960s to provide a multi-user,
multitasking system for use by programmers. It consists of a kernel, standard utility
programs, and system configuration files (Byrd, 1997).
Windows New Technology (NT) – this operating system was released in 1993 and was
built by former designers and developers of VMS, and operating system from Digital
Equipment. NT has similar goals to UNIX--portability, extensibility, and support for a
broad range of hardware from laptops and desktops to servers that support an entire
department (Russinovich, 1999).
Summary In this dissertation, the researcher designed and implemented a prototype toolset
consisting of procedures, views, programs, schema, and data. The toolset components
were chosen because they made possible a complete approach to the management of
applications. For example, procedures provided a through list of tasks to be performed by
the administrator whereas programs were used to automate steps and activities. Views
were provided so that the administrator could more easily grasp the meaning of the
management data. Schema was created so that the data would be organized in a
meaningful and orderly manner.

28
This toolset pertains to all phases of the Web application's creation and use including
design, construction, deployment, operation, and change. A full life-cycle approach was
chosen so that the application could be effectively managed through multiple phases not
just the operation phase that typically receives most of the focus. The toolset built upon
key functional perspectives including accounting, administration, automation, availability,
business, capacity, change, configuration, fault, operations, performance, problem,
security, service level, and software distribution. These functional perspectives were
chosen because they are important to the successful management of Web applications, and
provide a clear focus to the toolset functions within the life cycle context.
This toolset was designed to be used for the management of Web applications and
focused on improving their availability through effective monitoring, control, operations
interface, automation, and problem management. Four barriers and issues were addressed
by this toolset. The challenges included application complexity, the high skill level
requirement to create management solutions, the lack of focus on manageability, and the
challenge of making applications management ready.
Four hypotheses were examined in this study. Twenty-three research questions were
also explored. The first three research questions were the primary research questions and
the remaining were the secondary research questions. The secondary research questions
had an almost one-to-one relationship with the subsystems that were developed in support
of the 15 functional perspectives. Nineteen subsystems were developed in support of the
15 functional perspectives that are important to the management of applications.
A prototype toolset was developed and evaluated using a survey instrument. The
instrument made use of a framework that consisted of the system dimension and the
29
environment domain. Factors such as toolset understandability, technology, compliance,
performance, technology and contribution were considered. The evaluation aspect of the
research was based on ideas from Boloix and Robillard (1995).

30
Chapter 2
Review of the Literature
Introduction This chapter contains a review of the literature focused on systems, network, and
applications management. The historical overview discusses applications management as
an emerging discipline, the history of applications management, and major research
efforts and projects in the area of the management of applications. The theory portion of
the survey pertains to management infrastructure such as alerts and toolkits, management
standards such as CORBA and SNMP, management information repositories, and classes
of products such as point or framework.
This chapter also contains a summary of what is known and unknown about the
management of applications. This information is organized by functional perspective
starting with accounting and administration and ending with service level and software
distribution. The last major part of this chapter discusses the contribution that this study
makes to the field of applications management. The main contributions are in the areas of
expanding knowledge and capability in full life-cycle management, providing the design
of an innovative toolset, expanding the capabilities of 15 key functional perspectives such
as accounting and service level, and integrating with existing management products.
Historical Overview of the Theory and Research Literature Today, applications management is considered an emerging discipline. However,
managing applications has been done by computer professionals from the 1960s through
the 1990s (Sturm & Bumpus, 1999). Presently, the discipline is being defined by the

31
work of standards organizations, product manufacturers, systems-management
consultants, and professional-services personnel. The efforts are not coordinated so there
are differences in the terminology used and the scope of the efforts surrounding
applications management initiatives. In spite of the confusion, there is a recognizable and
developing discipline.
Application Management as a Discipline As a formal discipline, applications management emerged as a response to the
management challenges of client/server applications. One of the first groups to focus on
the manageability of applications was the Desktop Management Task Force. The DMTF
was formed in 1992 by companies including Intel Corp., Microsoft Corp., Novell, Inc.,
SunSoft, and SynOptics Communications. Hewlett-Packard, IBM, and Digital Equipment
Corp. also actively participated in the group (Applications Management Specification,
1997). During that time, software companies began to produce programs to manage
client/server applications.
Consultants from the Patricia Seybold Group began to write white papers in support of
the new products being developed. An early report (Rymer, 1995), was written in
response to the management challenges created by new applications written using the
client/server model. For some, the report might be suspect as it was written to support a
software product called AppMan by Unify Corporation. The report was not pure research,
but rather a tool used to sell products. Regardless of its purpose, this twenty six-page
report was remarkable because it identified and explained many of the core application
management issues. In the report, the researcher defined direct application management as
the "monitoring, control, and tuning of the software modules that make up client/server

32
applications" (Rymer, 1995, p. 1). Five disciplines of direct application management were
also defined. These included:
1. Fault management
2. Performance management
3. Application configuration management including software distribution
4. Security management
5. Accounting management including software asset management (Rymer, 1995)
Rymer also wrote of the need to build management right into the application programs.
He explained that developers must become participants in application management. This
is still an important issue today, as many applications are not instrumented for
manageability, and reworking applications after they have been written is a significant
challenge. Also, it is difficult to provide meaningful instrumentation without modifying
the application itself.
Starting in 1996, and continuing to the present, an important series of reports and
articles began to be available from Hurwitz Consulting. Some of these documents were
available in magazines, others on the Web. An early white paper (Application
Management: A Crisis, 1996), was also written to support the AppMan product. It too
was written for Unify Corporation. Another early article on managing applications
(Foote, 1997a) was published in DBMS Magazine. It focused on the disciplines
appropriate for applications management. A second article by the same author (Foote,
1997b) was published by Hurwitz Associates. That article focused on the management of
applications and databases. In that article, Foote explained the relationships between the
different components in the distributed computing environment. He explained the
33
application dependency stack that contained network, hardware, operating system,
database, application services, and application elements. He also identified the
appropriate disciplines--distribution, configuration, operations, event/problem,
performance, storage, and security. Finally, Foote added four environments to the
discussion that he named desktops, departmental servers, enterprise servers, and
mainframes. This entire discussion was framed in the context of the service-level
agreement. The article was notable for its description of the colliding trends in application
management. In Foote's view, the colliding trends included:
• Too frequent releases
• Componentization of applications (trend to create self-contained groups of
application function)
• Too many application sources (each provider has its own service and management
requirements)
• Constantly changing content
• Increasing availability requirements
• Component dependencies, incompatibility, collisions, and availability
requirements (Foote, 1997b, p. 6)
Several Hurwitz reports focused on the importance of an applications-management
strategy. Hurwitz (1997) explained the key organizational issues in developing an
applications management strategy. The researcher explained the importance of
establishing procedures, as well as the role of the help desk/service center in managing
user perceptions. Hurwitz also pointed out that the strategy was not just for the IT
department--it must take into account the needs and ideas from the user community. Later,
34
Hurwitz (1998) wrote a white paper to support the product strategy of Full Time Software
Corporation, a developer of application-availability products. The focus of the paper was
on the demand for 100% application availability.
Still other papers were available for a fee directly from Hurwitz Consulting. These
were some of the strongest reports available on the management of applications.
Geschickter (1996b) wrote a five-page report that defined applications as the intersection
of technology and business. It included a discussion of the application-dependency stack
and the vendors who have products to monitor the components of the stack. Geschickter
(1996a) also wrote a 36 page report that explained the results of a phone survey that was
conducted by the Hurwitz Consulting Group to validate applications management issues
and needs. In 1996, Sobel wrote a series of application management white papers for
Hurwitz Associates.
Sobel (1996d) wrote a seven-page report that discussed the limitations of network and
systems management, applications-management technology issues and methodologies,
standards, and APIs. The focus of that paper was to help IT managers separate the
important issues from the ideas being sold by the software industry at the time. Sobel
(1996b) wrote a five-page report that had as its focus guidelines for the creation of a user
strategy for the management of applications that support the business. In this report, Sobel
used a tool to determine the impact of an application on the business. This tool, in the
form of a categorization grid, was useful in helping to identify the applications that will
shut down the business if they are not available. Personal productivity programs are
important to individuals and are often used to support management and planning.
Although these programs are important to individuals, their failure is unlikely to shut

35
down the business. Mission critical applications are those programs that involve core
business processes like payroll, accounts receivable, and accounts payable. These
programs are used in an enterprise-wide manner and would have a very negative impact
on the business if the organization were to experience a catastrophic failure. For this
reason, these applications should be the focus of the strategic application-management
activities. Sobel's grid is shown in the Figure 5.
________________________________________________________________________
C o n s t i t u e n c y
Func
tion
C o r eB u s i n e s sP r o c e s s e s
A d v i s i n g /P l a n n i n g
I n d i v i d u a l E n t e r p r i s e
T a s kC r i t i c a l
P e r s o n a lP r o d u c t i v i t y
M i s s i o nC r i t i c a l
D e c i s i o nC r i t i c a l
Figure 5. Categorization grid showing business impact of applications
________________________________________________________________________
Sobel (1996a) continued to write on applications management with a four-page report
that expanded on the ideas discussed in "Creating an applications management strategy"
and gave detailed suggestions about managing user perceptions, service-level agreements,
and the role of the help desk or service center. Sobel (1997) also wrote a five-page report
that described the key applications-management standards activities including the work of
the DMTF (Desktop Management Interface standard), Tivoli (Applications Management
Specification), and the IEFT (Application Management MIB). Gillooly (1999) wrote a

36
six-page report that built upon the previous Hurwitz applications-management reports and
explained that e-business had made management much more critical and valuable to the
organization. The report described the problem, the requirement, and possible solutions to
the challenges of business-to-consumer and business-to-business e-commerce.
Taken as a body of work, the articles, reports, and white papers from Hurwitz
consulting and associates captured the problems, requirements, and strategies associated
with the management of client-server applications. They also form a good foundation
upon which to explore the management of business-to-consumer and business-to-business
Web applications.
History of Applications Management In the 1950s and early 1960s, computers made calculations in milliseconds. In one day,
ENIAC performed as many calculations as it would take a human to perform in 300 days
(Hussain & Hussain, 1985). At that time, managing applications was largely manual
labor. The management discipline was not identified or defined so anything that was done
to support an application could loosely be called an applications-management activity.
Computer operators worked with the applications and performed activities like
maintaining a log of when jobs started and ended. Operators also scheduled jobs based on
variables like when the input would be ready, what forms were required for the printer,
and what resources were needed like tape drives and card readers (Sturm & Bumpus,
1999). At the time, media was bulky taking about 100 cubic feet to store one million
characters of data (Hussain & Hussain, 1985).
In the 1970s, punched card and tape media gave way to disk, a direct-access media, and
Cathode-Ray Tubes (CRTs). A variety of other media were used including paper-tape
37
readers and punches, magnetic ink character readers, optical mark and character readers,
line printers, character printers, computer-output microfilm, direct-entry consoles and
recorders, graph plotters, and audio response units (Daniels & Yeates, 1971). Computer
applications were batch (like the 1960s) and on-line where users could get immediate
access to information like account balances. Programs were stored in disk libraries instead
of on cards and application software became more flexible and functional (Sturm &
Bumpus, 1999). By 1979, the space required to store one million characters of storage
dropped to .03 cubic feet (Hussain & Hussain, 1985). Managing applications was still
largely a manual process although some software features were developed to assist the
operators like a Job Entry Subsystem that made operating system software easier to use to
manage the application workload. This was the case for IBM's operating system of the
day, Multiple-Virtual System (MVS) that was both a batch operating system and one that
supported hundreds of concurrent users (Kronke & Dolan, 1987). MVS had two job
subsystems--JES2 and JES3. Each offered different workload management capabilities
(Gulla, 1991).
Mainframe computers were not the only computers used in the 1970s. At this time, the
minicomputer became popular and created a set of challenges associated with distributed
or departmental computing. Digital Equipment Company (DEC) produced the first
commercially successful minicomputer in the mid-1960s. By the 1970s, Hewlett-Packard,
Data General, Texas Instruments, Honeywell, Burroughs, Wang, IBM, and Prime all
entered the market (Szymanski, Szymanski, Morris, & Pulschen, 1988). Minicomputers
provided flexibility to their users and when these systems began to be used in a branch

38
bank or regional office, it became cost effective to use automated tools to manage these
systems (Sturm & Bumpus, 1999).
In the 1980s, the personal computer became a business tool. Invented in the late 1970s
by Jobs and Wozniak, the first personal computers had limited computing and storage
capability (Szymanski et al., 1988). However, they very rapidly grew in functionality, and
soon, they were linked to the mainframe. In some organizations, microcomputers were
clustered in Information Centers (ICs). The IC was a hands-on facility where
microcomputers, software tools, and training were made available to users. Individual
productivity was enhanced through word processing, mail merge, desktop publishing,
electronic spreadsheet, and presentation graphics software (Long, 1989). IC specialists
managed the hardware and software resources of the center and assisted the user
community.
Later, microcomputers were combined in departmental local-area networks. These
networks allowed for the sharing of files and resources like printers and plotters. It was
during the 1980s that management software started to be developed to manage the
infrastructure necessary to support the application. Vendors, like 3Com, IBM, Bay
Networks, Fluke, and HP developed management utilities that were used by technicians to
manage the availability of network infrastructure. These utilities took many forms from
stand-alone test instruments to UNIX-based management applications. Some were device
dependent applications whereas others were device independent. The scope of their
functionality included availability, performance, measurement, monitoring, and reporting
(Gulla, 1997). Additional software was developed to manage the other components upon
which the application depended. Database management vendors, like Informix,
39
developed utilities to manage the database. The System Monitoring Interface (SMI) was
used by management applications to get information about bottlenecks, resource usage,
performance profiling, lock usage, and other key values that are useful for managing the
database (Mattison, 1997). Management tools began to mature that were useful in
managing functions like backup and recovery and network management (Kronke &
Dolan, 1987).
In the 1990s, the management of applications became a topic of increased importance.
This topic became significant due to the proliferation of client-server applications and the
many distributed systems needed to support them. At this time, application management
research projects like the project that created the Modular Advanced Re-configurable
Integrated Architecture (MARIA) toolkit (Atkinson, Hawkins, Hills, Woollons,
Clearwaters, & Czaja, 1994), the Consortium for Research on Distributed System
(CORDS) project (Bauer, Finnigan, Hong, Rolia, Teorey, & Winters, 1994), and
Management of Distributed Applications and Systems (MANDAS) project (Martin, 1996)
appeared in the literature.
Applications-management products also appeared in the marketplace. Early examples
included Tivoli AMS-based products like Distributed Monitoring and Software
Distribution (Lendenmann, Nelson, Lara, & Selby, 1997). Since the late 1990s, the World
Wide Web has had a major impact on application development and delivery of new
function to users. Many different products are available to help solve problems found in
the Web environment, but no full life-cycle toolset has yet been developed.
40
Major Research Efforts and Projects Starting in the mid-1990s, application-management projects were being proposed and
carried out by a number of researchers around the world. Atkinson, Hawkins, Hills,
Woollons, Clearwaters, and Czaja (1994) wrote about an application management project
that had as it focus the implementation, re-configuration, monitoring, and control of an
application. The researchers, from the University of Exeter and Helitune Limited,
identified a broad number of requirements that included communication support,
distribution transparency, computer-aided development and tool support, structure
support, allocation support, change support, and fault tolerance. In addition, configuration
management was identified as a requirement for both planned and unplanned changes.
The researchers responded to the requirements by developing the Modular Advanced Re-
configurable Integrated Architecture (MARIA) toolkit. Most of the support was for
developers, but management of the application was a big part of the fiber of the toolkit.
Bauer, Coburn, Erickson, Finnigan, Hong, Larson, Pachi, Slonim, Taylor, and Teorey
(1994) explained the Consortium for Research on Distributed System research project.
The scope of this project was to develop new techniques for developing distributed
applications and for understanding the services required for distributed applications and
the associated tools. The researchers identified requirements that included support for
peer-to-peer development, accommodation of legacy systems, accommodation of
emerging applications, support for security and privacy, and manageability. They also
identified other requirements including data access, support for role-specific transparency,
support for visualization, support for application development languages and tools,

41
support for distributed debugging and testing, and the accommodation of evolving service
requirements.
The CORDS functional framework had a huge scope that included system management
and network management, which is how that project satisfied the manageability
requirement. In detail, system and network management included services like configure,
monitor, and control-managed objects. The objects represented real components like
applications, services, networks, and devices. The researchers organized management
services by subsystems. These subsystems included management information repository,
configuration, monitoring, and control subsystems. Management agents were also part of
this structure. The project team was composed of individuals from four IBM research
groups, six Canadian universities, four American universities, and other international
research entities.
Bauer, Finnigan et al. (1994) used prototypes from the CORDS project to focus almost
exclusively on system and application management issues. Their main proposal was a
reference architecture for distributed systems management that utilized system
monitoring, information management, and system modeling techniques. Within their
scope were three classes of system management. These included network services and
devices, operating system services and resources, and user applications. The focus on
user applications was most interesting as the network and system components were
somewhat well studied and understood. The services they identified--monitoring, control,
and management information, were all designed to interact with managed objects that
represented real components. In addition to network and system components, application
components were given a real focus. The application components included instances like

42
databases, files, programs, tasks, application clients, application servers, queues, and
processes.
Bauer, Lutfiyya, Black, Kunz, Taylor, Bunt, Eager, Rolia, Woodside, Hong, Martin,
Finnigan, and Teorey (1995) formalized the work that began with the CORDS project.
This research was supported by the IBM Center for Advanced Studies and the National
Sciences and Engineering Research Council of Canada. The MANDAS architecture
consisted of four parts (see Figure 6).
______________________________________________________________________
Figure 6. MANDAS architecture
________________________________________________________________________
The first part was the management applications that included configuration
management, performance management, fault management, and modeling. Modeling was
Management Applications
Management Services
Managed Objects
ConfigurationManagement
FaultManagement
PerformanceManagement
Modelling
ConfigurationSubsystem
MonitoringSubsystem
ControlSubsystem
Repository Subsystem
ManagementAgents
43
the most interesting of the management applications because it was a tool to help predict
the needs and behavior of the programs that it supported. The second part of MANDAS
was a set of management services that communicated with agents to manage network,
system, and application objects. A key part of the management services was its use of a
repository subsystem. This subsystem utilized data in a management information
repository. The third part of MANDAS was its management agents. These agents
executed on the systems that were being managed and communicated with the
management applications through the management services. The fourth part of
MANDAS was the managed objects. These objects represented the real components like
servers and applications. Object technology was used to take advantage of productivity
characteristics like inheritance.
Bauer et al. (1997) discussed the follow on activities of the MANDAS research.
MANDAS and MANDAS-related prototypes were also discussed. The MANDAS review
was detailed in a way that reflected that there were working prototypes of the subsystems.
For the first time, there was a detailed information model class hierarchy and a
management data warehouse. Registration and query services were named and explained.
An instrumentation architecture and environment were also depicted. The proposed
instrumentation was intrusive to the application thereby availing itself of application
details unavailable to external monitors. The article also contained a comprehensive list
of related work including other management frameworks, information models, systems for
the monitoring and control of distributed applications, and configuration services.
Some of the MANDAS researchers focused on specific management architectures and
protocols. Hong, Katchabaw, Bauer, and Lutfiyya (1995) discussed the use of the Open

44
Systems Interconnection (OSI) management framework for monitoring, analyzing, and
controlling networks and their devices. The OSI management framework used an object-
oriented methodology that employs the use of agents. This framework comes with
guidelines for the definition of managed objects. These guidelines help with methods and
notational techniques for depicting classes for the managed objects that represent the real
resources. Other systems-management researchers took an interest in the OSI
management platform. Maltinti, Mandorino, Mbeng, and Sgamma (1996) discussed a
system that was built for an Italian Public Administration department. The scope of this
management system included system and application resources. The application
resources were largely services like TP monitor, file transfer, software distribution,
activity scheduler, and terminal emulator.
Endler and Souza (1996) took a different approach from the MANDAS researchers.
Sampa was a system for the availability management of process-based applications.
Sampa was designed for support of DCE-based applications and is based on an
application-specific availability specification. Simply put, Sampa was built to detect and
automatically react to failures like node crashes, process crashes, and hang-ups. Sampa
used non-intrusive ways to monitor the application and requires no changes to the
application code. The researchers pointed out that this was a benefit of the design
approach taken by the developers. MANDAS was mentioned in the related-work section
of the article and influenced the Sampa architecture with its monitoring and configuration
control components.
Yucel and Anerousis (1999) explored the challenges of managing, filtering, and
aggregating event from the managed elements in a Web-based system. The system they
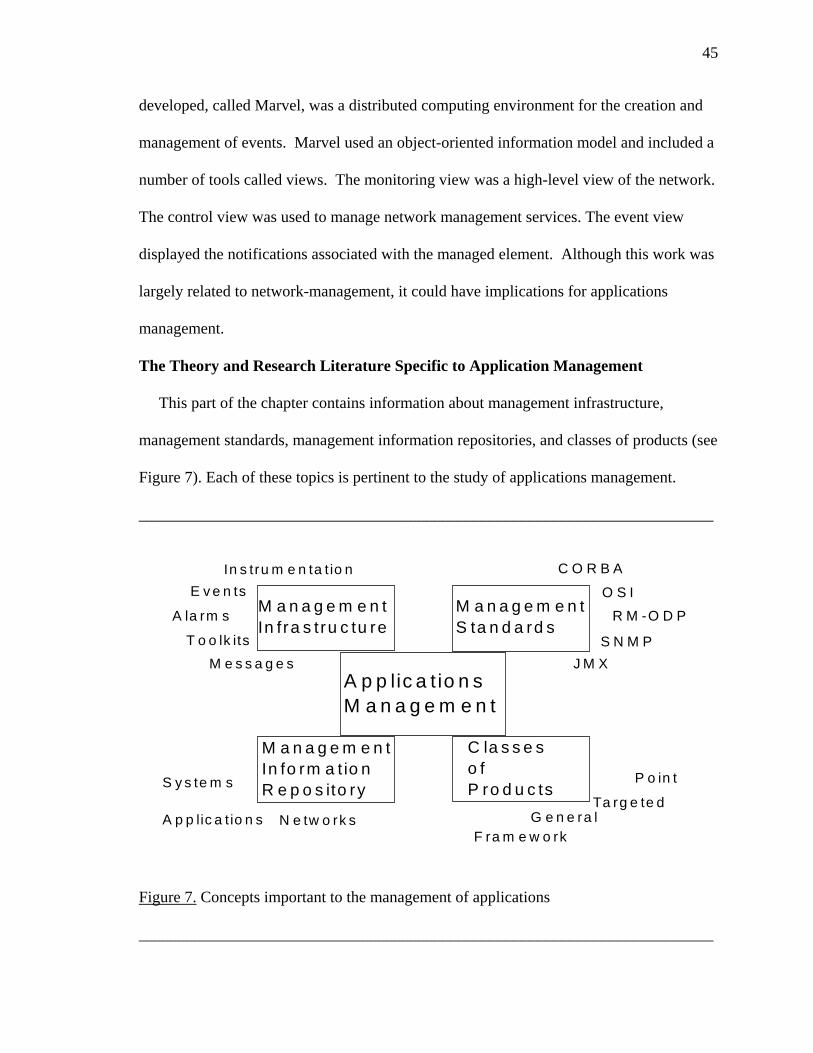
45
developed, called Marvel, was a distributed computing environment for the creation and
management of events. Marvel used an object-oriented information model and included a
number of tools called views. The monitoring view was a high-level view of the network.
The control view was used to manage network management services. The event view
displayed the notifications associated with the managed element. Although this work was
largely related to network-management, it could have implications for applications
management.
The Theory and Research Literature Specific to Application Management This part of the chapter contains information about management infrastructure,
management standards, management information repositories, and classes of products (see
Figure 7). Each of these topics is pertinent to the study of applications management.
________________________________________________________________________
A p p lic a t io n sM a n a g e m e n t
M a n a g e m e n tIn fra s tru c tu re
M a n a g e m e n tS ta n d a rd s
M a n a g e m e n tIn fo rm a t io nR e p o s ito ry
C la s s e s o fP ro d u c ts
T o o lk its
In s tru m e n ta t io nE v e n ts
A la rm s
M e s s a g e s
C O R B A
R M -O D PO S I
S N M PJ M X
P o in t
Ta rg e te dG e n e ra l
F ra m e w o rkA p p lic a t io n s
S y s te m s
N e tw o rk s
Figure 7. Concepts important to the management of applications
________________________________________________________________________

46
Management infrastructure is important because it is a key source of data about the
application being managed. Infrastructure topics include instrumentation, events, alarms,
toolkits, and messages. These infrastructure components are important sources of
information for a management system. Management standards are important because
standards make interoperability possible. Standards can also be used as building blocks.
Over time, tools are developed and individuals become skilled with important standards.
These software and human resources can be utilized on projects increasing the likeliness
of success in these activities. Examples of standards that will be covered include CORBA,
OSI, RM-ODP, SNMP, and JMX.
Management information repositories are important because they contain well ordered
information about systems, networks, and applications. Knowledge of the classes of
products is important because it is important to know the software in the marketplace so it
can be leveraged as appropriate. Management infrastructure, management standards,
management information repository, and classes of products are now discussed in detail.
Management Infrastructure Management infrastructure includes a wide variety of items from simple application
programming interfaces to complex architectures that include manager and agent roles.
Some items are free and available through downloads whereas others are products that are
costly and have significant vendor support. Many data sources provide input to
management systems. Alarms, events, and messages are some of the most basic ways that
systems, networks, and applications share data and information about problems and
steady-state operations. As such, these sources are important to the management system.

47
In general, an alarm is a warning signal (Webster's New International Dictionary,
1955). An alarm might be an event whose characteristics cause it to be given the
designation of an alarm. Examples of this are the communicationsAlarm,
environmentalAlarm, and equipmentAlarm (Solstice Enterprise Manager, 2001).
Sometimes alarms are called alerts as in the case of the Intrusion Detection Exchange
Format Data Model (Debar, Huang, and Donahoo, 1999). A management system that can
trap and interpret alarms has access to a significant information source about the system,
network, and application.
An event is something that comes, arrives, or happens (Webster's New International
Dictionary, 1955). SNMP events are unusual conditions that occur in the SNMP device.
The information for these events is represented in trap messages. Examples of these
messages include link up or link down, cold start or warm start, authentication failure, and
loss of EGP neighbor (Siyan, 2000). Events occur with great frequency in many
networked systems. Often, multiple events are generated by different components for the
same problem. This situation has led to research activities and products that handle both
high event volumes and event correlation. Yemini, Kliger, Mozes, Yemini, and Ohsie
(1996) described a network management system that polls devices and accepts
asynchronous events. This system also correlates events to the same root cause in a very
efficient manner.
There are a number of products that focus on event management. An example is BMC
Software's Patrol Enterprise Manager. This product has a three-tier architecture that
includes a graphical interface, a manager component, and agents. Its main features

48
include filtering, business views, correlation, data collection, and recovery (Event
Management, 2000).
Messages are important sources of data to the management system. Almost every
program that one can think of uses messages to communicate with its user. Messages can
be written by the application to a computer window or an application log or both. These
messages can indicate normal processing or can indicate a problem. Since there is no
global architecture for message format, messages can and often are free form in content.
Table 1 contains several messages extracted form a log file with an interpretation of the
significance of the message to a management system.
Table 1. Messages Extracted From a Log File
Message text Significance
The date is Saturday, August 05, 2000.
This message gives context to the other messages in the file since most do not have a date or time associated with the message.
08-05-2000 22:28:31.49 - Interpreted response: Ok
Example of message where response from the call to another function completed successfully.
Authentication completed successfully. Security message.
Internal state information is 'L=436CL:1:1:32:1:8432161366: 28800:3:1'
Example of a message that could be used for debugging internal program problems.
Name server (9.37.0.5) pinged in 281ms. Performance message.
Log files closed. Normal completion message.
49
It is easy to understand how messages are a key source of information to a
management system and could be used to make high-level determinations about the state
of system and application resources. Certainly, up and down states could be interpreted
from messages like "Authentication completed successfully". Performance level could be
implied by a message like " Name server (9.37.0.5) pinged in 281ms". If 281ms is
deemed slow then the name server resource in a network view might be set to yellow
(performance degraded).
Messages can be presented to the management system through an API or the messages
can be collected from a log file by a utility program. An example of the API technique is
the Write to Operator (WTO) macro interface used by the IBM OS/390 system. This
macro allows the application program to present a message of up to 122 characters to the
console (McQuillen, 1975). The message is presented to the operator and subject to
automation processing that is standard on mainframe systems (Irlbeck, 1992). An example
of the log file utility program approach is the Tivoli Event Adapter. This utility receives
log messages from the syslogd daemon running on a host computer. The utility reformats
the messages into Tivoli Event Console events and forwards them to the event server for
processing (Lendenmann et al., 1997). The reformatted events can be used to create
problem records or can trigger automated actions.
Instrumentation is a key applications-management concept as it is being developed and
discussed by researchers and product developers. Schade, Trommler, and Kaiserswerth
(1996) proposed a method to support the development of manageable distributed
applications. This method was based on a formal management interface based on
CORBA-compliant systems and DME. It also leveraged the capabilities of an
50
instrumentation library, called a management adaptation library that made management of
the application more straightforward when it was executing. Support was included for two
functions--initialize to register the object to the management system and state that updates
the MIB to reflect the new state and trigger any pending management actions. Hong, Gee,
and Bauer (1995) supported the idea of instrumentation as a tool for managing systems
and applications. They too were interested in automation for the instrumentation so little
needed to be done by the developers to set up the application for manageability. The
authors defined the process of instrumenting the application as having four steps. The
steps were defining the management data, defining the management operations,
generating the management interface code, and building the instrumented software
resource. The tool they created, the Management Interface Instrumentation Tool (MIIT),
was designed to take the resource to be managed like an application, and add the
management interface so it could be managed. This is a simple idea that minimized the
burden on the developer to instrument the application for manageability.
Many software companies and some researchers make toolkits available to support a set
of activities like OSI management alarm handling (Compaq TeMIP, 2000) or the
exchange of management data (Integration Overview, 2001). Although few of these
toolkits are application-management specific, many could be useful if the management
platforms that they support were used as the platform for an application-management
toolset. An example of a potentially useful toolkit is the Tivoli Multi-Platform Manager
API Software Developer Kit. This toolkit was developed for management applications to
perform functions like handle alerts and discovery of devices. This toolkit also supports
remote file operations and program execution (Integration Overview, 2001). It is easy to
51
see how these functions could be useful to a management program that was specifically
focused on applications. Using this toolkit, the management application could browse a
remote log to display application messages or execute a command to restart a failed
application component.
Another interesting toolkit is the Telecommunications Management Information
Platform (TeMIP) management toolkit. This toolkit provides alarm handling, event
logging, and problem-ticket support in a heterogeneous, distributed environment. The
toolkit supports SNMP and CMIP management protocols (TeMIP OSI Management
Toolkit, 1999). This toolkit also contains utilities that would be useful to an application-
management program running in a Digital UNIX environment. Another example of a
toolkit is Firmato, a firewall-management toolkit. This toolkit, which was developed by
researchers at Bell Laboratories, included an entity-relationship model, a model definition
language, a model compiler, and a graphic firewall rule illustrator (Bartal, Mayer, Nissim,
and Wool, 1999). It might be possible and interesting to invoke the firewall rule
illustrator from the context of an application-management program.
At this time, there are few application management toolkits. Examples include the
Tivoli Module Designer and Tivoli Developer Kit for PowerBuilder. The Tivoli Module
Designer uses a graphical user interface to capture key management data about an
application including the names of the directories where the programs reside, the files that
make up the application, information on its dependencies, and information to support the
installation and removal of the application. It also includes information like the
monitors and tasks needed to support application availability and the relationships
between

52
components (Tivoli Module Designer, 1998). The Tivoli Developer Kit for PowerBuilder
is a developer kit specific to PowerSoft Corporation's PowerBuilder application
development program. This toolkit makes it easier for PowerBuilder application
developers to define the manageability characteristics of their applications. The outputs of
the toolkit are used to distribute, monitor, and control the customer-developed
PowerBuilder application program (Tivoli Developer Kit, 1996). There are no
other commercial available application-management toolkits.
Management Standards Management standards that apply to application management are discussed in the
sections that follow. These standards have come from a variety of sources including
private companies like Tivoli Systems and Hewlett-Packard Company and standards
organizations like the Open Group and the Internet Engineering Task Force.
In 1996, Tivoli Systems and Hewlett-Packard Company announced an open API for
end-to-end applications management. It was called the Application Response
Measurement (ARM) API (Snell, 1997). At that time, Sobel from Hurwitz consulting
wrote a Balanced View bulletin on the subject. In that report, Sobel (1996c) wrote that
the API was a good start, but it was limited to six basic commands and it could not
determine response time for transactions across a distributed network. In 1999, the Open
Group adopted the ARM API Version 2 as its technical standard for application
performance instrumentation (The Open Group Adopts, 1999).
The ARM API was developed to measure responsiveness of client-server applications.
Applications that are instrumented using the API make it possible to answer questions like
"is the applications working correctly?" or "how is the application performing?" This

53
capability was made possible using a shared library of function calls. It also used a
management infrastructure that includes a measurement agent and a server-based manager
that can store the collected data (Systems Management: Application Response, 1998).
The ARM API could be implemented for a Web application. Many Web applications
have a client-server relationship with other components in the Web site and the
information collected by ARM would be useful for understanding the inter-application
response. ARM might also be useful for applications that reach out across the Web.
However, since ARM is not strong in the measurement of applications with a broad
distributed scope, the data collected might not help solve the detailed questions that often
arise when investigating response time problems.
The Common Object Request Broker Architecture (CORBA) is a computing
infrastructure that has been used by management applications. The architecture, although
not specifically targeted at management applications, is supported and promoted by the
Object Management Group (OMG). CORBA is a tool that makes it possible to realize the
benefits of object technology rapidly. CORBA automates many common programming
tasks like object registration, location and activation. It also manages error handling and
has interfaces for common facilities like object services that make it possible to like a
spreadsheet object into a report document (Schmidt, 2001). CORBA is popular with
management applications because object-oriented technology is valued by some in the
network-management community. Researchers and developers, in their search for a
productive way to use objects, turned to CORBA for help. Many implementations of
CORBA are available to be used by any application. Examples include ILU from Xerox
Parc (free implementation), Orbix from Iona (fully compliant commercial

54
implementation), ObjectBroker from Digital, and HP's Distributed Smalltalk (Keahey,
2000).
It is not clear that CORBA or object technology in general has any special implications
for applications management. Object technology emerged in the late 1980s as an
important new way upon which to develop applications. Object technology can be very
complex to implement and that is why, even today, it is avoided by some in the system
management community. Awareness of CORBA and object-technology is nevertheless
important because a new application-management toolset will likely need to interact with
legacy systems that use CORBA like Tivoli's Distributed Monitoring (Gaffaney and
Carlin, 1998) or network management systems that are object-based like IBM's Resource
Object Data Manager (RODM) implementation with NetView (Finkel and Calo, 1992).
The Common Information Model (CIM) is a standard that is a work product of the
DMTF. CIM is a follow on standard to the DMTF's earlier work that used Management
Information Files (MIFs) to define and capture the management characteristics of an
application. CIM is a conceptual model that is not tied to a particular implementation. It
allows for the interchange of management information between management system and
applications (Cover, 2000). Because of its focus on applications, CIM is potentially a
very significant standard for application management.
CIM is deliberately narrow in its focus. CIM operates in an application context that
supports six steps in the life cycle of an application. These steps are purchase, deploy,
advertise, configure, execute, and remove/uninstall. Both installation and operational data
are maintained about the application. Installation data includes information about the
product, the software features, and the elements that make it up. Operational data
55
includes settings, start and stop information, and information about associations. Some
CIM implementations support views that result from queries on classes that are
represented in tables (Applications and Namespaces, 2001). This capability makes it
possible to view and change the data that supports the life cycle of the application.
CIM is designed in a way that makes immediate implementation possible. Microsoft
has an implementation that is based on CIM version 2 and is intended to represent the
state of the local environment (Applications and Namespaces, 2001). Intel's Wired for
Management (WfM) initiative includes CIM as a key tool of its asset-management
approach. WfM's baseline version 2.0 specifies that a server system must support CIM,
DMI or SNMP. It considers all three as key management information frameworks
(Overview of Wired, 2000). CIM is a key part of other products like Manage.Com's
FrontLine Manager. FrontLine Manager uses CIM to support functions like automatic
discovery and locate. FrontLine Manager also diagnoses and correct problems like
electronic commerce transaction bottlenecks (Horwitt, 2000).
The Lightweight Directory Access Protocol (LDAP) is rooted in an overall directory
service called X.500. X.500 is an OSI entity that consists of a namespace and protocol for
querying and updating it. The protocol is called Director Access Protocol (DAP). DAP
requires the OSI protocol stack that results in a rather large client due to the richness of
the implementation. LDAP is both an information model and protocol and it runs directly
over the TCP/IP protocol stack (Hodges, 2000). LDAP contains strongly typed and
structured information that can be provided in a highly distributed manner. Its core
schema is fixed and usually controls the directory hierarchy and the schema for individual
objects is highly extensible. In addition, LDAP is powerful because it can be integrated

56
with other technologies like relational databases (Kille, 1998). An applications-
management toolset should be aware of LDAP since it is being used as a part of more and
more Web sites.
Ensuring the availability of LDAP services and namespaces should be the task of a
management toolset. In addition, the toolset itself might consider the use of LDAP in the
same way a management tool like NetView uses a RDBMS to support its management
information repository. LDAP is not a RDBMS, but it is suited for high-performance
access to hierarchical data. LDAPv3 is specifically targeted at management applications
and browser applications that provide read/write access to directories. LDAPv3 is
designed to provide key function while not incurring the resource requirements of the
X.500 Directory Access Protocol (Wahl, Howes, & Kille, 1997).
The Reference Model for Open Distributed Processing (RM-ODP) is a standard that is
a joint effort of ISO and ITU-T. This standard serves as a framework for the specification
for various aspects of an open distributed system that is useful for systems management.
Related to RM-ODP is a specification language called Viewpoint. The concepts and
structures of Viewpoint support five areas of interest for enterprise modelers. These
include enterprise, informational, computational, engineering, and technology views
(Enterprise Distributed Computing, 2000).
RM-ODP and viewpoint are useful for application management because the standard
has the flexibility required to handle the complexities of managing applications. RM-ODP
and viewpoint were used by Neumair (1998) to provide an umbrella management
approach to complex systems, networks, and applications. Neumair used RM-ODP and
Viewpoint, as well as Generic Application Managed Objects Classes (OSI constructs) to
57
interface with and manage applications that executed in environments supported by
CORBA, SNMP, and OSI/TNM agents. The umbrella-management idea is very useful for
providing an overall management framework where different legacy management systems
are in use. In this situation, the alternative to the umbrella-management approach is to
convert the legacy management systems to a single standard system. In many
circumstances, this is a very costly and impractical alternative.
The International Organization for Standardization conceived and implemented the
Open System Interconnection Protocols (Open System Interconnection, 1999). There are
many Open System Interconnection (OSI) protocols that are organized in suites. An
example is the CMOT protocol suite that contains seven protocols including ISO ASCE,
ISO DIS ROSE, ISO CMIP, the lightweight presentation protocol (LPP), UDP, TCP, and
IP (Warrier, Besaw, LaBarre, & Handspicker, 1990). These protocols were developed to
facilitate multivendor equipment interoperability. They grew out of the need for
communication between different hardware and software systems even when the
underlying architectures were different. One of the ISO protocol groups is Common
Management-Information Protocol (CMIP). CMIP is a management protocol that is
similar to SNMP (Open Systems Interconnection, 1999). Actually, CMIP was designed to
replace SNMP by making up for its shortcomings. CMIP was designed to be a more
robust and detailed manager containing complex and sophisticated data structures with
many attributes suited to the management of diverse networks. Compared to SNMP,
CMIP is a more efficient network management system requiring less work on the part of
the user to keep updated on the status of the network (Vallillee, n.d.).

58
The CMIP protocol has been used as the architectural underpinnings for some
applications-management research projects. Hong, Katchabaw et al. (1995) used the OSI
management framework for monitoring, analyzing, and controlling networks and their
devices. Their scope included management of the applications running in a networked
environment. Maltinti, Mandorino, Mbeng, and Sgamma (1996) discussed a system that
was built for an Italian Public Administration department whose scope included system
functions and application services like TP monitor, file transfer, software distribution,
activity scheduler, and terminal emulator.
The Java Management Extensions are a product of the leadership activities of Sun
Microsystems and leading companies in the management field. The extensions manage
Java applications using Java technology (Java Management Extensions Home, 1999).
The Java language was introduced by Sun Microsystems in 1994. Sun Microsystems
claimed that Java, because of its ability to imbed applications (applets) into a Web page,
would make the content of Web pages alive and dynamic (Yang, Linn, & Quadrato,
1998). Since that time, the language has grown and acceptance has been widespread. The
functional capabilities of the language have grown to include internationalization, 2D
graphics, sound, JavaBeans, JDBC database access, servlets, security, and the extension
mechanism. These language capabilities are "specialized trails" in the Java Tutorial that
can be accessed on the Sun Microsystems Web site (The Java Tutorial, 1999).
Key elements of the Java Management Extensions include its architecture,
components, and APIs. JMX Architecture is organized using a three-level model. The
levels include manager, agent, and instrumentation. The JMX components work within
this architecture. The main components include a JMX manageable resource, a JMX

59
Agent, and a JMX Manager. The Java Manageable Extensions also include services for
management. These include support for polling and forwarding information between
agents and managers. APIs are also a key part of JMX. APIs are included so that there is
a standard way for Java management agents to work with existing management
technologies like SNMP, WBEM, and TMN. Also included are APIs to generate alarms
and to provide topology information (Java Management Extensions White, 1999). JMX is
a natural choice when developing a toolset to manage Java applications.
SNMP is a network-management protocol that has implications for application
management. SNMP was developed by the Internet Engineering Task Force (IETF) that
defines itself as "a large open international community of network designers, operators,
vendors, and researchers concerned with the evolution of Internet architecture and smooth
operation of the internet" (Joining the IETF, 2000, p.1). The IETF deals largely with
network and security topics through working groups, but since 1997 has had some focus
on applications. The area directors define applications as "things that are not security
(part of the security area), nor networks (most of the other areas), but rather things that
use the networks and security services to provide things of benefit to the end-user" (The
IETF Application Area, 2000, p.1).
The IETF has had a number of efforts specific to the management of applications. Not
all of them have resulted in standards. RFC 1514, Host Resources MIB was an early
applications-management effort. This RFC did not become a standards-track document.
RFC 1697, Relational Database Management MIB, was another early effort. RFC 1697
was focused on database management, but it did not become a standards-track document
(Sturm & Bumpus, 1999). RFC 2248, Network Services Monitoring MIB, contained two

60
applications-management groups. As of January 1998, it was still a standards-track
document (Freed & Kille, 1998). RFC 2287, Definition of System-Level Managed
Objects for Applications, was proposed as a standard in 1998 (Krupczak & Superia,
1998). RFC 2564, Application Management MIB, was a standards track RFC that had to
do with managing applications using SNMP and a MIB that includes considerable
capabilities (Kalbfleisch, Krupczak, & Presuhn, 1999). Since 1999, the IETF has started
to move beyond SNMP as a management information structure. A recent draft, SMIng -
Next Generation Structure of Management Information, was focused on an object-
oriented data definition language for the specification of various kinds of management
information (Straus, Schoenwaelder, Braunschweig, & McCloghrie, 2001).
As early as 1995, researchers Sturm and Weinstock (1995) tested a prototype
application MIB with a variety of SNMP managers including OpenView and NetView.
Bellcore, a communications research company, was planning to introduce products that
used the MIB in 1996. Whether the MIB was adopted by the IETF or not, the
attractiveness of the Bellcore implementation was that it used standard SNMP facilities
with its own information base. This is just what a hardware vendor does when they
introduce a new device to be managed--they supply a MIB and use their existing SNMP
manager. Currently, a number of products manage applications using a MIB. An example
is the SNMP MIB support for the IBM HTTP Server. This server uses three MIBS--
SNMPv2-MIB, WWW-MIB, and APACHE-MIB, to support the server software and its
related applications (SNMP MIB Support, 2001).
The original Portable Operating System Interface (POSIX) standard was published in
1986 and was actually called IEEE-IX, a name that reflected the strong UNIX influence

61
on the standard. The convention at the time for naming UNIX-related software was to
have the name end in an X like HPUX, AIX, and PNX (The Portable Application
Standards Committee, 2000). The base of POSIX standards contains over 70 documents in
various states from Project Authorization Request (PAR) approval to final IEEE
approved. The scope of these standards is application service interfaces and includes
documents covering system interfaces, real-time extensions, threads, security, protocol
independent interfaces, fault tolerance, checkpoint/restart, tracing, and utilities. This is a
small subset of the POSIX titles.
POSIX standard 1387.2 (Information Technology - Portable, 1995) is an important
applications-management specification. This standard, approved in March of 1997, had a
scope that included a standard layout for software, a definition for information about
installed software, and a standard set of commands for manipulating software (DCE-RPC
Interoperability, 1997). POSIX 1387.2 makes possible the orderly and automated
management of software. This powerful standard has found acceptance in the marketplace
as it is not hard to find products that advertise 1387.2 compliance. Software distributor
from HP (Software Distributor, 2001) and SysMan Software Manager from DEC
(Overview and Installation, 2001) are two examples of products that proudly announce
their acceptance of this Open Group specification.
The Tivoli Application Management Specification (AMS) provided a way to specify
management information about an application that is required for management. The data
was in a standard format that was machine-readable and supported a number of life-cycle
related tasks including application distribution and installation. It also supported
monitoring and operations control of the application including support for the

62
visualization of application component relationships (Applications Management
Specification, 1997). AMS had support from several Tivoli products like Distributed
Monitoring and Software Distribution and provided a toolkit called Tivoli Module
Designer that was used to build the definition files (Tivoli Module Designer, 1998). AMS
is less important than it was just a few years ago as it has failed to get support from major
software development companies other than Tivoli. Tivoli's own products never fully
embraced AMS and unlike the Application Response Measurement standard that was
adopted by the Open Group, AMS has not been adopted by any standards group.
Web-Based Enterprise Management (WEBM) is an initiative of the Distributed
Management Task Force to define a set of management and Internet standard technologies
to make it easier to manage computing environments in the enterprise (WEBM Initiative,
2001). Specifically, WEBM is an open industry standard for enterprise-wide systems
management that is rooted in existing Web technology. Its goal is to deliver management
functionality for systems, network, and applications independent of protocol or supporting
management framework. WEBM has three basic components--schemata, instrumentation,
and clients. The WEBM schemata are provided by CIM. The instrumentation can take
many forms. Typically, the data model is populated by software agents provided by
vendors like BMC, Cisco, Intel, and Microsoft. The clients provide the console capability
that is needed to manage the applications. Typically, the management data is displayed
using a Web page (Spuler, 2000).
WEBM appears to have the good chance to provide a significant management base to
support applications. It has a schema that is specific to applications, as well as systems
and networks and it has the ability to utilize data from legacy sources like SNMP and

63
ARM. It also leverages existing Web technology for the presentation of data. Finally,
there is considerable vendor support with marketplace products from BMC Software,
Cisco Systems, Compaq Computer Corporation, IBM Corporation, Intel Corporation and
Microsoft Corporation.
Management Information Repository A MIR provides database support for management applications and supports their
integration into a single management environment (Martin, 1996). The MIR is the heart of
the management system. The management data support can involve the use of a database
management system like Oracle or DB2 or can be provided by one or more simple files.
The database management systems used are often relational and sometimes tied to a
specific product implementation. Such was the case for LAN Network Manager for OS/2
and IBM’s DataBase2 (DB2) product (LAN Network Manager, 1997). A MIR can also be
called a Management Database or a Management Information File.
Management Databases often have specific names like Generic Topology Database.
They can also have generic names like Object Database. The specific and generic names
can be combined in the same product to name different physical components of the
Management Database. This is the case for the Generic Topology and Object Database
examples used with the LAN Management Utilities product (AIX LAN Management,
1995). The Management Information File (MIF) is an open standard from the DMTF.
The DMTF MIF has a specific format that can be used by any vendor thereby encouraging
ease of integration between different management products (Tivoli Module Builder,
1998).

64
The CORDS project at Queen’s University Database Systems Laboratory had a
research focus on MIRs. The main theme of the research conducted by the database group
was efficient access to distributed data. The research had previously covered various
aspects of this problem including remote procedure calls, distributed full text retrieval,
distributed query processing, and multi-database systems. CORDS research projects
included Management Information Repository for Distributed Applications Management,
Data Warehouse for Distributed Applications and Systems Management, Networked
Multimedia Systems, Dynamic Tuning of DBMSs, and WWW-CM: Querying the Web
using a Conceptual Model (Queen’s University Database, n.d.).
Bauer, Finnigan et al. (1994) defined distributed-systems management architecture
with four sets of functional components (see Table 2). The functions used tools such as
fault viewing programs, provided services such as configuration management, leveraged
management agents that had monitoring and control capabilities, and managed resources
such as applications using object data stored in a MIR.
Table 2. Reference Architecture Components for CORDS Project
Function Consists of
Operation and management tools
Configuration, performance, fault, modeling and simulation, report generation, and visualization
Management services
Configuration, monitoring, control, and MIR (X.500, databases, files, etc.) subsystems
Management agents System and network layers with monitoring and control
capabilities
Managed resources Managed objects, for example, servers and applications

65
The MIR was an important subsystem of the CORDS architecture. The repository
dealt with static and dynamic management information. Static information included
SNMP or CMIP data whereas dynamic information included performance information or
fault (events or traps) data. The repository integrated this data and information to provide
meaningful support to the management applications.
MIRs have often been discussed in the context of the Managing Distributed
Applications and Systems (MANDAS) project. The MANDAS project was documented
on the Web (Queen’s University MANDAS, n.d.) and in a number of detailed articles.
Bauer et al. (1997) identified the MIR as an important part of the management–services
component and is called the repository subsystem. The repository subsystem was
explained in the context of an overall system that contained management applications,
management services, management agents, and managed objects.
The focus of the MIR work for MANDAS was understanding the requirements of
management applications including configuration, performance, fault, and modeling and
building prototypes that exploit current technology to address those needs. The MIR
work in MANDAS was focused on the integration of data that is needed by the
management application. Implementation of management services was also important in
this work.
MIRs are discussed by software vendors when they are describing the components of
their products. They are also discussed as a feature of their systems as data collected in
MIRs can be used to generate reports. A good example is Digital Equipment Corp.’s
Polycenter Framework (Muller, 1998). Polycenter’s MIR is an object-oriented database
system that contains real-time status and performance information. The Polycenter MIR

66
supports a large number of applications including Network Management, Storage
Management, Configuration/Change Management, Fault/Problem Management,
Performance/Capacity Management, Automation, Security Management, and
Accounting/Billing Management. Digital’s TeMIP is another example of a product where
the MIR is discussed by the vendor. TeMIP provides a platform for the integrated
management of heterogeneous networks. Its architecture allows the platform to support,
simultaneously or separately, the element management, network management and service
management dimensions of a Telecommunications Management Network. The TeMIP
MIR is a component of this architecture called common and basic services. Common and
basic services include security services, TeMIP name service, data dictionary (a metadata
repository), management information repository, and distributed event forwarding
(TeMIP OSS Framework, 2001).
Product information manuals are a great source of information about a given product’s
implementation of the MIR. The LAN Network Manager for OS/2 Reference (1997) is a
detailed reference that contains a chapter on the LAN Network manager database. All
thirty-two-product tables are explained. The NetView Database Guide (1997) discusses
the relational database that supports TME 10 NetView and its network-management
applications. Fifteen database tables are used by the product. AIX LAN Management
Utilities (1995) describes various aspects of this utility and its use of a MIR. The AIX
LAN Management Utilities product supports configuration, performance, and fault data.
Most standards efforts in network, systems, or application management define a MIR.
The Applications Management Specification, which is focused on the emerging discipline
of Applications Management, defines a way to capture, in one place, information about an

67
application that is useful in managing it deployment, availability, and change. AMS
captures information about the application in files called Application Definition Files
(ADFs) that use a MIF format (Applications Management Specification, 1995). These
files are placed in a MIR that is used by a number of different management applications.
Recently, the DMTF announced the introduction of the Common Information Model. The
main idea of the Model is help with the exchange of management information between the
management applications and the resources they are managing. CIM is organized in such
a way that the managed environment can be viewed as a collection of interrelated systems.
CIM data is defined and stored in objects (Thompson & Sweitzer, 1997).
Open Software Interconnection (OSI) Management framework supports the use of a
MIR. With OSI, a set of managed objects within a system, together with their attributes,
constitutes a system’s management information base (Hong, Katchabaw et al., 1995).
SNMP is a management system that uses a MIB. Tschichholz, Hall, Abeck, and Wies
(1995) pointed out that SNMP has a much greater market share as compared to OSI
implementations like CMIP because SNMP is easier to implement. The MIB is stored
locally as a file that can be queried and updated through a simple programming interface.
The SNMP MIB can be adapted for a variety of uses. Sturm and Weinstock (1995) made a
convincing case for using the SNMP MIB for applications-management uses. In their
implementation, the MIB would focus on information like installed unit, installed process,
distributed application, configured unit, realizable process, business function, process,
files, and mailbox variables.
The MIR implementation of a number of products are now discussed. A summary of
the products can be found in Table 3. The management applications were chosen because
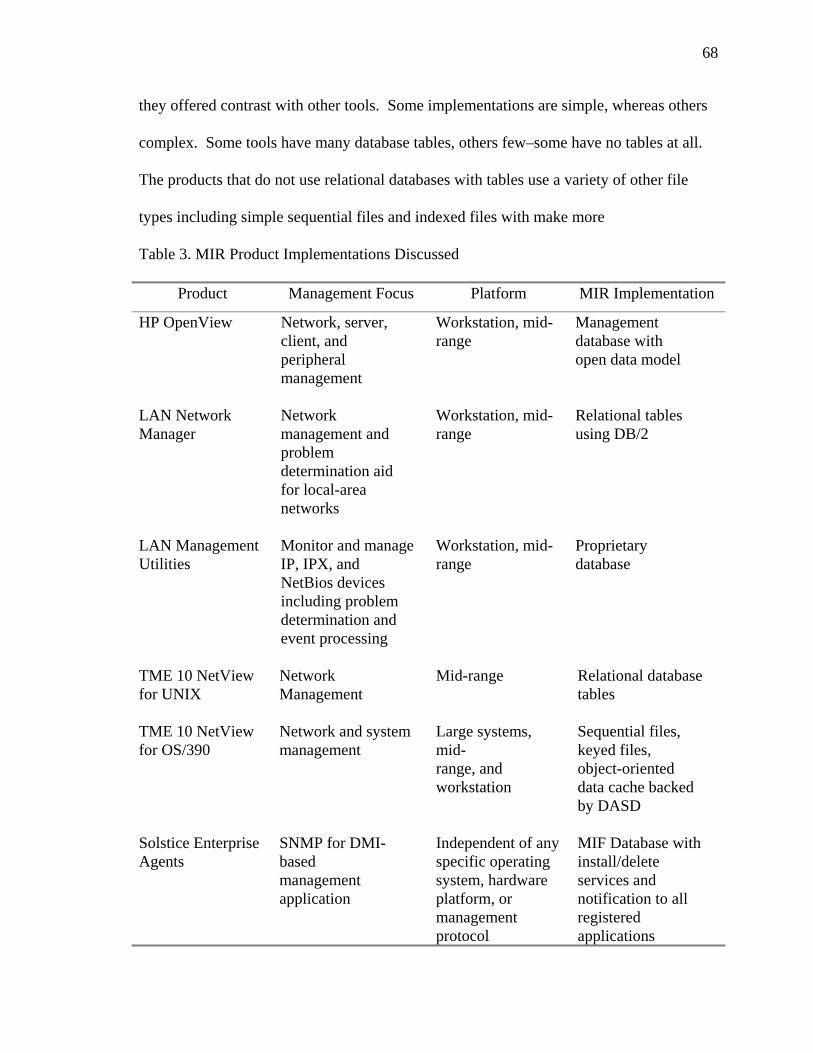
68
they offered contrast with other tools. Some implementations are simple, whereas others
complex. Some tools have many database tables, others few–some have no tables at all.
The products that do not use relational databases with tables use a variety of other file
types including simple sequential files and indexed files with make more
Table 3. MIR Product Implementations Discussed
Product Management Focus Platform MIR Implementation
HP OpenView Network, server, client, and peripheral management
Workstation, mid- range
Management database with open data model
LAN Network Manager
Network management and problem determination aid for local-area networks
Workstation, mid- range
Relational tables using DB/2
LAN Management Utilities
Monitor and manage IP, IPX, and NetBios devices including problem determination and event processing
Workstation, mid- range
Proprietary database
TME 10 NetView for UNIX
Network Management
Mid-range Relational database tables
TME 10 NetView for OS/390
Network and system management
Large systems, mid- range, and workstation
Sequential files, keyed files, object-oriented data cache backed by DASD
Solstice Enterprise Agents
SNMP for DMI- based management application
Independent of any specific operating system, hardware platform, or management protocol
MIF Database with install/delete services and notification to all registered applications

69
HP OpenView is a tool for network, server, client, and peripheral management. HP
OpenView supports a variety of platforms including HP-US, Sun Solaris, Microsoft
Windows 95 and Windows NT systems. The common services provided by HP
OpenView include a user interface, event management, discovery, management database
(storage of network data), communications infrastructure, integration services, and node
management. The management database is a central repository for storing network-
management data. HP OpenView uses a MIR that is open, not proprietary thus allowing
users to utilize the database of their choice. The database holds real-time and historical
data. The real-time data supports availability management of the systems whereas the
historical data can be used to graph and analyze information and produce reports
(Network Management, 2001).
LAN Network Manager is a network management and problem determination aid for
local-area networks. The MIR implementation for this product consists of thirty-two
tables that contain information on alerts, events, and network resources like bridges, rings,
and controlled access units. The tables are designed to serve different roles. Some tables,
like the Alert Cause Text Table and Alert Filters Table contain static data. For the static
tables, some of the data is supplied by the software manufacturer whereas other data is
defined when the management software is configured. Other tables contain dynamic data
like the Event Log Table and Bridge Performance Data. In the case of the Event Log
Table, one entry is created for each event that is generated in the system. There are many
event sources in a system including bridges, routers, and hubs. Application programs can
also be sources for events.

70
There are many sources of performance data in the system. LAN Network Manager
tables are used to capture this data. The chief performance-related tables are the Bridge
Performance Table, Multiport Bridge Performance Table, and Ring Performance Tables 1
& 2. LAN Network Manager has many commands that interact with the MIR. There are
a number of event-related commands that work with the Event Log Table. Event Delete is
used to remove unwanted events. To set up filters to eliminate the recording of certain
kind of events, several commands are supplied including log filter add, delete, list, query,
and set (LAN Network Manager, 1997).
LAN Management Utilities (LMU) is a tool to monitor and manage IP, IPX, and
NetBios devices from a single workstation. Problem determination and event processing
are also centralized with this product. The MIR implementation for this product has three
parts. The components are an object database, a topology database, and a MIB. The
object database contains global object information used by the graphical user interface.
The topology database, called Generic Topology Database, stores LMU topology
information, as well as information about submap groupings and content. The XXMAP
application queries both this database and the object database. The MIB database is
called the LMU Subagent MIB. This collection of management information contains
system configuration data, performance data, and PF2 data. PF2 data is data collected by
the System Performance Monitor/2 product (AIX LAN Management, 1995).
TME 10 Global Enterprise Manager (GEM) is a tool to monitor and manage
applications and business systems. The MIR for GEM is a collection of files in DMTF
MIF format that conform to AMS. AMS is an open standard that defines the management
characteristics of applications. This information in the MIF is used by the management

71
tool to monitor and operate the application system. GEM has many utilities that
contribute information to the MIR. Module Builder is a tool that is used to create AMS-
based management files. One important management file is the Component Description
File (CDF) that contains information about the components that make up the system to be
managed like IP hosts, deamons, and routers. Other management files are used to show
the content of and relationships between the business components.
Figure 8 indicates the main sources necessary to build and use the GEM MIR. Two
main utilities are used to create files in the MIR. Module Builder and Module Designer
are used to create application definition files and executable instrumentation. Both
application definition files and executables can be built manually without the use of the
Builder and Designer utilities.
_______________________________________________________________________
Figure 8. Builders and users of the GEM MIR
________________________________________________________________________
The files in the MIR are used by a variety of management applications. The GEM
Server is used to build business system views that monitor the availability of applications.
G E MM I R
B u i l d U s e
M o d u l eB u i l d e r
M o d u l eD e s i g n e r
O t h e rS o u r c e s
G E MS e r v e rS o f t w a r eD i s t r i b u t i o nO p e r a t i o n a lT a s k sD i s t r i b u t e dM o n i t o r i n g
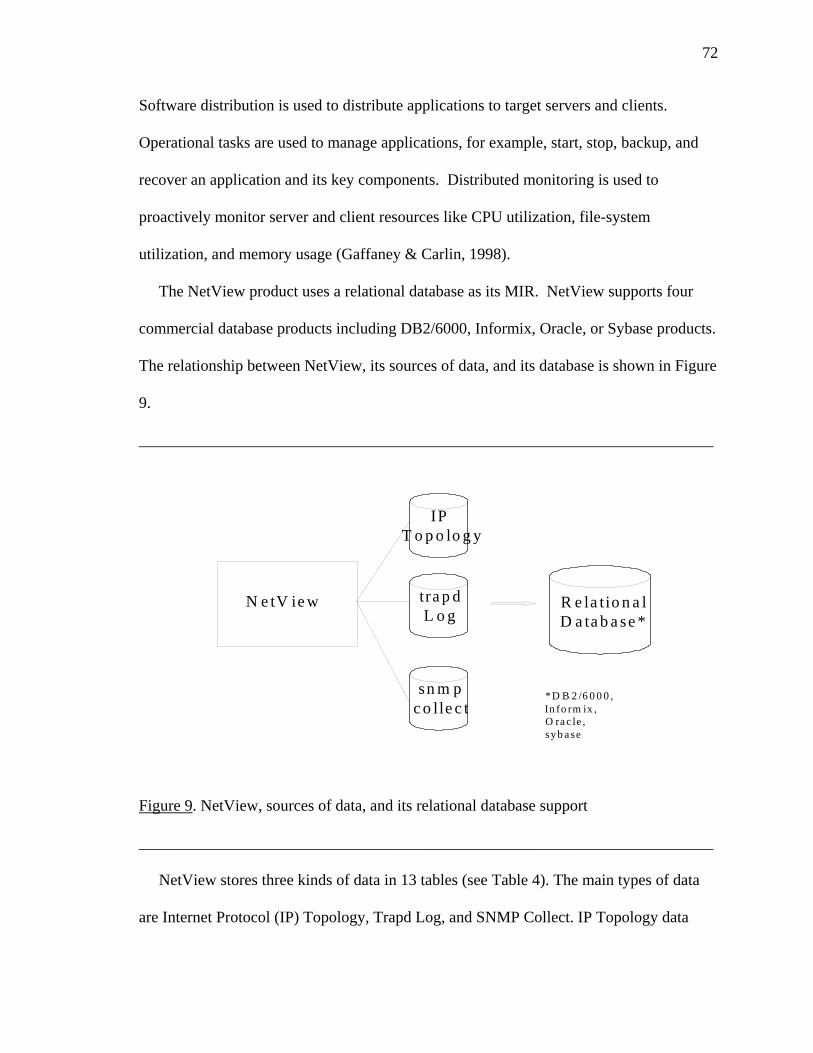
72
Software distribution is used to distribute applications to target servers and clients.
Operational tasks are used to manage applications, for example, start, stop, backup, and
recover an application and its key components. Distributed monitoring is used to
proactively monitor server and client resources like CPU utilization, file-system
utilization, and memory usage (Gaffaney & Carlin, 1998).
The NetView product uses a relational database as its MIR. NetView supports four
commercial database products including DB2/6000, Informix, Oracle, or Sybase products.
The relationship between NetView, its sources of data, and its database is shown in Figure
9.
________________________________________________________________________
N e tV ie w
IPT o p o lo g y
tra p dL o g
R e la tio n a lD a ta b a se *
sn m pc o lle c t
*D B 2 /6 0 0 0 ,In fo rm ix ,O ra c le ,syb a se
Figure 9. NetView, sources of data, and its relational database support
________________________________________________________________________
NetView stores three kinds of data in 13 tables (see Table 4). The main types of data
are Internet Protocol (IP) Topology, Trapd Log, and SNMP Collect. IP Topology data

73
covers a variety of aspects of the network such as information about each network and
segment that is managed by NetView. Trapd Log data is typically exception information
such as a node down alert. SNMP Collect data pertains to the MIB variables that are
managed and controlled by NetView. The tables are created using utilities supplied with
the product. The product also supplies commands that are used to create reports.
Table 4. NetView Data Including Type, Table Name, and Description
Type of data Table name Description
IP Topology Topoinfo Summary information about the entire IP topology.
Networkclass Information about each network in the IP topology.
Segmentclass Information about each segment in the IP topology.
Nodeclass Information about each node in the IP topology.
Interfaceclass Information about each interface in the IP topology. Objecttable Information about the objects of the network, segment,
node, and interface classes.
Classtable Information about each objectclass.
Memberof Information about objects in a one-way member-of relationship.
Coupledwith Information about objects in a two-way coupled-with relationship.
Trapd Log Trapdlog Describes the types of information found in the trapdlog table.
SNMP Collect ColData Information about data collection activities.
Varinfo Information about MIB variable data.
Expinfo Information about MIB expression data.
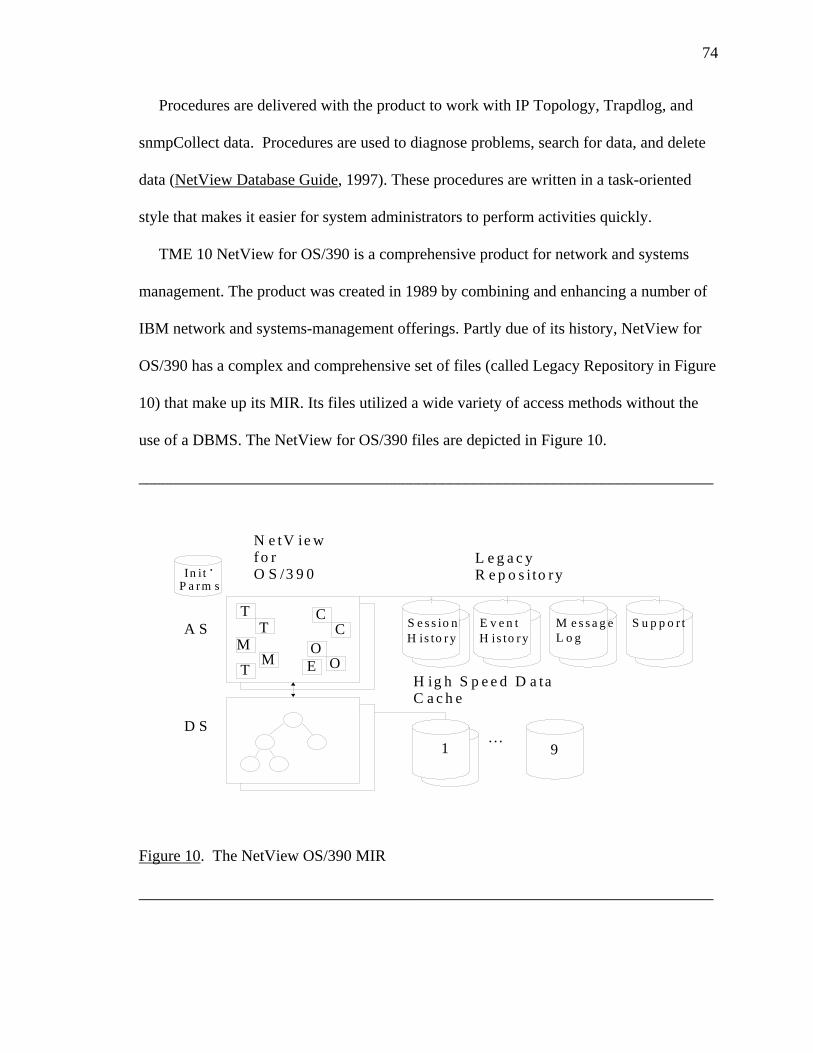
74
Procedures are delivered with the product to work with IP Topology, Trapdlog, and
snmpCollect data. Procedures are used to diagnose problems, search for data, and delete
data (NetView Database Guide, 1997). These procedures are written in a task-oriented
style that makes it easier for system administrators to perform activities quickly.
TME 10 NetView for OS/390 is a comprehensive product for network and systems
management. The product was created in 1989 by combining and enhancing a number of
IBM network and systems-management offerings. Partly due of its history, NetView for
OS/390 has a complex and comprehensive set of files (called Legacy Repository in Figure
10) that make up its MIR. Its files utilized a wide variety of access methods without the
use of a DBMS. The NetView for OS/390 files are depicted in Figure 10.
________________________________________________________________________
9
In i t .P a r m s
N e tV ie w f o r O S /3 9 0
T
M
T
TC
E
CO
S e s s io nH is to r y
E v e n tH is to r y
M e s s a g eL o g
S u p p o r t
L e g a c y R e p o s i to ry
H ig h S p e e d D a ta C a c h e
. . .1
A S
D S
OM
Figure 10. The NetView OS/390 MIR
________________________________________________________________________
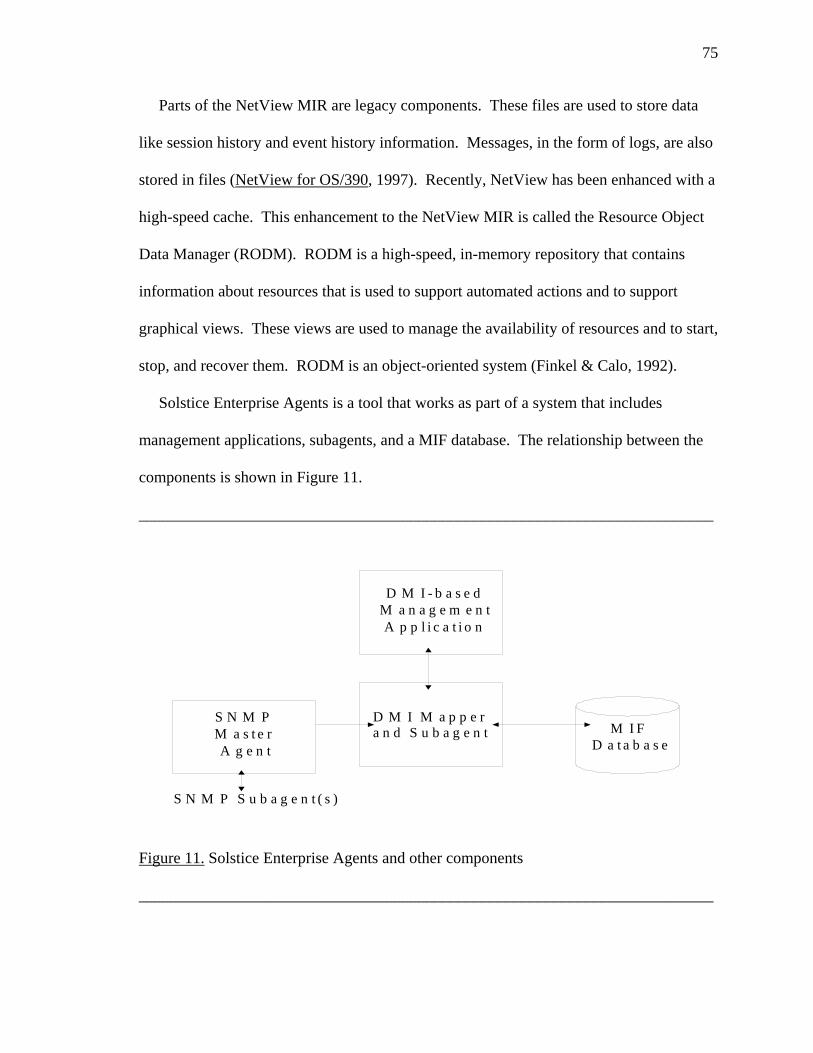
75
Parts of the NetView MIR are legacy components. These files are used to store data
like session history and event history information. Messages, in the form of logs, are also
stored in files (NetView for OS/390, 1997). Recently, NetView has been enhanced with a
high-speed cache. This enhancement to the NetView MIR is called the Resource Object
Data Manager (RODM). RODM is a high-speed, in-memory repository that contains
information about resources that is used to support automated actions and to support
graphical views. These views are used to manage the availability of resources and to start,
stop, and recover them. RODM is an object-oriented system (Finkel & Calo, 1992).
Solstice Enterprise Agents is a tool that works as part of a system that includes
management applications, subagents, and a MIF database. The relationship between the
components is shown in Figure 11.
________________________________________________________________________
S N M P M a s t e r A g e n t
M I FD a t a b a s e
D M I - b a s e dM a n a g e m e n tA p p l i c a t i o n
D M I M a p p e r a n d S u b a g e n t
S N M P S u b a g e n t ( s )
Figure 11. Solstice Enterprise Agents and other components
________________________________________________________________________
76
The DMI-based Management Application is used to display network topology and to
take management actions against network resources. The SNMP Master Agent is a
process on a node that exchanges protocol messages with managers and its subagents to
monitor resources. The Mapper and DMI Subagent use the Desktop Management
Interface (DMI) to interface with the Management Application, Master Agent, and MIF
database. The MIF database is associated with each Mapper and DMI Subagent as these
components contain a function called the Service Provider (SP). The SP controls all
access to the MIF database (Solstice Enterprise Manager 2.1, 1997).
Most of the product publications contain some information on maintaining or
improving MIR performance. NetView for UNIX contains a chapter on performance. In
addition to explaining how to increase table size, the chapter explains the importance of
updating table statistics to improve data retrieval from the database (NetView Database
Guide, 1997). LAN Network Manager contains more information on improving database
performance including reorganizing data, optimizing the DB2/2 configuration, isolating
database log files, avoiding database maintenance when LAN Network Manager is
running, and backing up the database (LAN Network Manager, 1997).
Improving performance is not the same as having an architecture that is high-speed,
and in-memory as part of its initial design. RODM has several features that make it
unique among MIRs. RODM runs as a privileged OS/390 subsystem, keeps its objects
and classes stored in data spaces, and does not commit all changes to disk. A commit
request is supported and this capability makes a warm-start possible that is much quicker
that a cold-start operation (Finkel & Calo, 1992). Mohan, Pirahesh, Tang, and Wang

77
(1994) discussed parallelism that is an important issue when considering the performance
needs of large MIRs.
MIRs are an interesting area of study in systems, network and application
management. MIRs were proprietary and are now evolving to open systems embracing
relational technology. Some MIRs are object oriented in their structure and exploit high-
speed, in-memory implementations. The schema and data for this toolset's MIR will be the
heart of the Web application management toolset.
Classes of Products A four-point classification system was developed by Sturm and Bumpus (1999) for
understanding the depth and functionality of existing applications-management products.
The classification system includes:
1. Point products - perform a specialized function
2. Targeted products - broader than point, but focused at a specific environment
3. General solutions - broad stand-alone or integrated product suite
4. Framework solutions - platform and components
This classification system offers a real-world mechanism to discuss the existing
products. However, software vendors have some different models. OpenVision
technologies has a strategy that segments its products into four tiers. Their point product
is called PointSolutions. The other three classifications are product suites
(SuiteSolutions); products designed for specific third-party business applications
(SolutionsPlus), and combined products and services offerings for database, network, and
systems management (QuickConnect Services). Professional services are often a
component of the highest tier offerings (OpenVision Tech Unveil, 1994). A survey of

78
applications management products follows that is based on a review of the literature and a
detail examination of the specific products.
Point solutions or products are discussed extensively in the literature. The term point
product is widely accepted. Richardson (1998) discussed Picture Taker, a product from
Lanovation's that takes a snapshot of a Windows 95 or NT system's setup. From this we
learn that point products perform a specific and often narrow function. Another point
solution from the literature is Full Armor software. This product prevents desktop users
from changing settings, installing software, and deleting components (Mazurek, 1998).
Both of these products could fit into the change dimension of a broader applications
management strategy. Change control or management is a vital applications management
functional perspective.
Point solutions are available that support other functional perspectives like performance
and configuration. Allot Communication's AC 2000 product is a network performance
tool that helps Web managers manage expensive wide-area network bandwidth. This
point product can be configured to control traffic by source address, destination address,
time-of-day, access control, or class of service (Anderson & James, 1998). This
capability could be exploited to give preferred service to certain application servers
thereby insuring better performance to that application. Another point product in this
category is the offering from Copper Mountain Networks and Xedia Corporation. This
network performance offering is a tool that can be used to offer improved performance to
Internet applications through a technology called Class-Based Queuing (CBQ). This
technology makes it possible to allocate and prioritize bandwidth according to subnet, IP

79
address, port number or URL. This capability could be used to assist in meeting service
level agreements (DSL: Copper Mountain, 1998).
Configuration management is a great challenge and one that is costly in time and
effort. In Ready, set, deploy! (Sturdevant, 1999) the author detailed how GTE
Internetworking deployed ON Technology's Comprehensive Client Manager product to
automate the entire life cycle of PC software. With that point product, GTE is able to
remotely configure and manage a variety of desktop and laptop systems. They use it to
install the operating system and application software and to manage the software through
its life cycle. This tool provided direct application support and could be a key part of the
configuration component of an applications-management strategy.
Targeted products are broader in scope than point products, but focused at a specific
environment. A targeted product might focus on the end-to-end management of SAP R/3
or the Windows operating system. The NetIQ's AppManager Suite is a tool to proactively
manage the performance and availability of the Windows NT and 2000 systems. The
product has a central console that can be used to monitor many components of these
systems ranging from physical hardware to applications like Microsoft Exchange, Citrix
WinFrame, Lotus Domino, and Oracle (NetIQ AppManager Suite Overview, 2001). In
addition to the central console, the architecture of the product includes a Repository,
Manager Server, Agent, and Web Management Server (NetIQ AppManager Suite
Architecture, 2001).
Patrol for SAP R/3 is a product from BMC Software. This product manages SAP with
four key components including a knowledge module, a console, agents, and an event
manager. The product's knowledge module monitors critical processes like dialog, batch,

80
enqueue, update, and spool. It does this using a server profile that makes it possible to
automatically discover all processes defined on the SAP server. The product also
monitors and manages database servers, CCMS alerts, response time, and users (BMC
Solutions, 2001).
General solutions are broad stand-alone products or integrated product suites. Many
product suites in this category are close to the framework products in approach and
marketing. Platinum technology's ProVision was labeled "The Unframework" by
Information Week (Gallagher, 1998) because its products share a common set of services
yet each component can stand on its own. Its products are like a series of point solution
yet they combine to create an integrated solution. ProVision is a general-purpose network
and systems-management tool. It handles security administration, help desk, desktop
configuration management, database, and application management (Planinum Technology
Emerges, 1998). As if to cover all possibilities, ProVision integrates with the framework
solutions including Hewlett-Packard's OpenView and Tivoli Systems' TME 10
(Gallagher, 1998). At least one publication, Network Computing, awarded ProVision
finalist category for its enterprise systems management framework noting the addition of a
common graphical user interface (Boardman, 1999).
BMC's Patrol is another example of a general solution. BMC's approach with Patrol
was to create knowledge modules that specialize in the monitoring and management of a
specific area like network management or SAP systems. The knowledge modules
leverage the basic Patrol architecture that includes a common user interface and an agent-
manager structure. Knowledge modules (sometimes called Solutions) were available for
network products like Cabletron hubs, ERP products like SAP and PeopleSoft, servers
81
like Digital Equipment's AlphaServers, and database like Informix, Sybase, and Adabas
(Patrol Enterprise Manager, 2001). The wide variety and depth of the knowledge modules
make Patrol an attractive tool to manage key technology areas.
The systems management field is changing. Nash (1999) indicated that IT
organizations have a choice of implementing solutions that use point solutions or
framework-based offerings however there are fewer vendors to choose from these days as
there has been considerable consolidation in the industry. He also points out that new
technologies like the Internet are driving the need for organizations to offer their users
complete solutions. This drive favors the suppliers of framework-based products.
However, the situation is not completely favorable for these software companies.
Boardman (1999) commented on recent tests that his lab completed on both framework
and point products. Regarding the framework products, he said, "the cost in equipment
and human resources to implement these systems is still daunting" (Boardman, 1999,
p.26). He also mentioned other challenges with the implementation of framework
products including the need to abandon familiar and well-liked tools.
The framework-based products provide management functions that make use of a
functional framework. What is a functional framework? Bauer, Coburn et al. (1994,
p.405) defined it as "the definition and organization of logical services and functions that
satisfy a set of requirements for a system". What services and functions make up the
frameworks of a typical systems management software product?
The Computer Associates product Unicenter TNG is a good one to examine and
describe. It contains common services and cross-platform support. The common services
are a common GUI, object repository, distributed services, communication facilities, and

82
event services. The cross-platform support includes Novell NetWare, IBM OS/400, MVS,
HP/UX, Sun Solaris, IBM AIX, Digital UNIX, ICL Unixware, Sequent Dynix/PTX, DG-
UX, NCR MP-RAS, SCO Unixware, SGI Irix, Tandem/NSK, Digital OpenVMS,
Windows NT, Java, Linux and other platforms. Other technologies include a cross-
enterprise calendar, virus detection, reporting, hands-free management, and partnerships
with software, hardware, and services organizations (Karpowski, 1999). This functional
framework provides services that the management applications use. For example, the
event viewing application uses the same GUI services as the network management
application. This not only reduces the development and maintenance cost of the
application for the vendor, but also makes the product easier to use because there is one
graphical user interface convention.
What functional perspectives can you expect a framework-based management solution
to support? Using Unicenter as an example, the scope is broad. Unicenter has support for
traditional disciplines like database, network, security, operations, help desk, storage, and
desktop and server management. It also supports applications, Internet, and real world
management. Real world management includes the management of devices like vending
machines, vehicle fleets, and environmental control systems (Karpowski, 1999). What are
some of the other important framework-based products and how are they organized?
Table 5 contains summary information for five important framework products
including Hewlett Packard's OpenView, Solstice Enterprise Manager, Spectrum
Enterprise Manager, Tivoli Management Software, and Computer Associates' Unicenter
TNG.
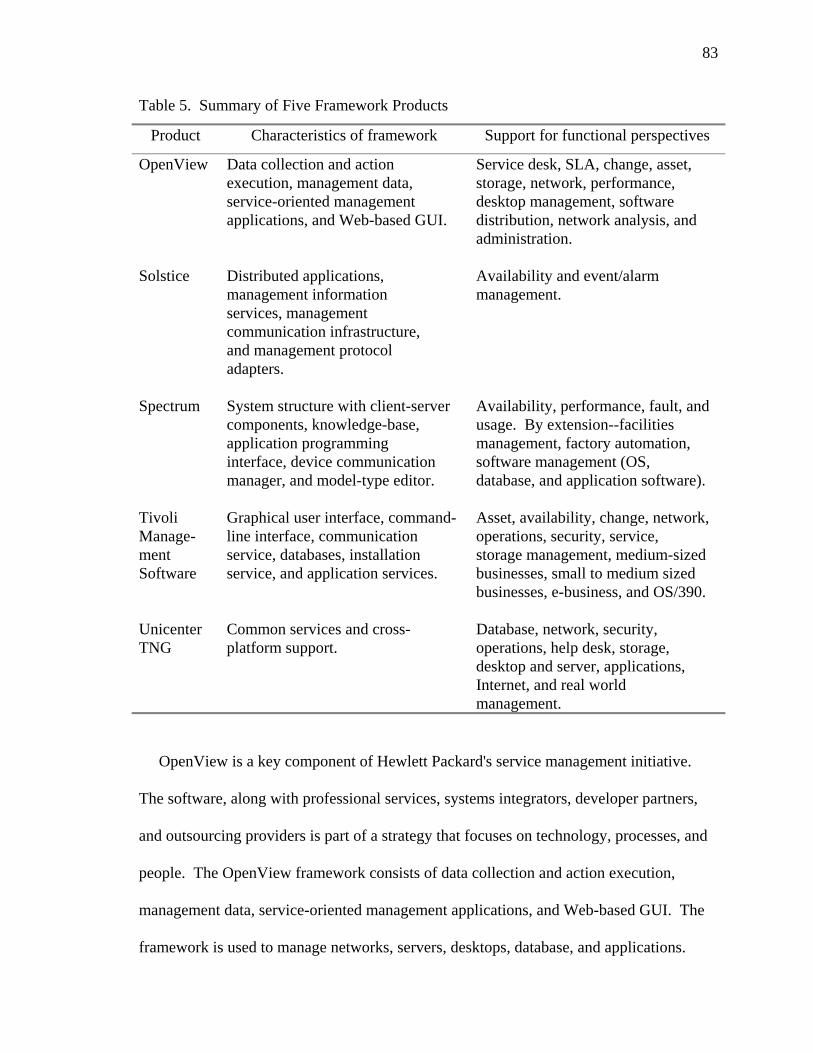
83
Table 5. Summary of Five Framework Products
Product Characteristics of framework Support for functional perspectives
OpenView Data collection and action execution, management data, service-oriented management applications, and Web-based GUI.
Service desk, SLA, change, asset, storage, network, performance, desktop management, software distribution, network analysis, and administration.
Solstice Distributed applications, management information services, management communication infrastructure, and management protocol adapters.
Availability and event/alarm management.
Spectrum
System structure with client-server components, knowledge-base, application programming interface, device communication manager, and model-type editor.
Availability, performance, fault, and usage. By extension--facilities management, factory automation, software management (OS, database, and application software).
Tivoli Manage- ment Software
Graphical user interface, command- line interface, communication service, databases, installation service, and application services.
Asset, availability, change, network, operations, security, service, storage management, medium-sized businesses, small to medium sized businesses, e-business, and OS/390.
Unicenter TNG
Common services and cross- platform support.
Database, network, security, operations, help desk, storage, desktop and server, applications, Internet, and real world management.
OpenView is a key component of Hewlett Packard's service management initiative.
The software, along with professional services, systems integrators, developer partners,
and outsourcing providers is part of a strategy that focuses on technology, processes, and
people. The OpenView framework consists of data collection and action execution,
management data, service-oriented management applications, and Web-based GUI. The
framework is used to manage networks, servers, desktops, database, and applications.

84
The management approach is end-to-end management of technology. The framework
supports three levels of abstraction--element, task, and service. The framework also
works within a service-management life cycle that includes commit, deploy, and operate
dimensions. This framework supports management applications that support 11
functional perspectives. These include service desk, SLA, change, asset, storage,
network, performance, and desktop management, software distribution, network analysis,
and administration (HP OpenView Directions, 1998).
Like Spectrum, Solstice is a sophisticated network-management tool that can be
extended to other disciplines. Its framework has four components--distributed
applications, distributed management information services, management communication
infrastructure, and management protocol adapters. Its supports the availability and
event/alarm management functional perspectives (Solstice Enterprise Manager 2.1, 1997).
Spectrum is primarily advanced network-management software (Spectrum Enterprise
Manager, 1998). Additionally, Spectrum can be extended to provide broader functional
support. Spectrum is a client-server system that includes a knowledge base. This
knowledge base is object-oriented and is built upon a tool called db_VISTA from Raima
Corporation. Spectrum has an application-programming interface that can be used to
broaden the support for the software beyond its network focus. Other key components
include a device communication manager, model type editor, and programming language
that can be used to create reports. The out-of-the-box functional scope of the product is
somewhat narrow. It includes support for availability, performance, fault, and resource
usage functional perspectives. The product publications point out that the product can be
extended to support other areas like facilities management and factory automation.

85
Software management can also be supported including management of the operating
system, database, and application software (Spectrum Concepts, 1996).
Tivoli management software consists of a framework and management applications.
The Tivoli Framework consists of a graphical user interface, command-line interface,
communication service, databases, installation service, and application services. The
software and hardware platform support for the manager is broad including AIX, HP-UX,
Solaris, SunOS, and Windows. The management agent support includes DOS, NetWare,
OS/2, and Windows (Lendenmann et al., 1997). The management application support is
impressive with sixty-five products that leverage the framework. Appendix D contains
the complete list.
The functional perspectives supported by the Tivoli management applications includes
asset, availability, change, network, operations, security, service, storage management,
medium-sized businesses, small to medium sized businesses, e-business, and OS/390
management (Tivoli Solutions, 2001). This is a change for Tivoli as previously, the
framework and management applications were discussed in a four-discipline model that
included:
1. Deployment management,
2. Availability management,
3. Security management, and
4. Operations and Administration (Lendenmann et al., 1997).
An example of a Tivoli management application that builds on the framework is Tivoli
Manager for MCIS. According to the Tivoli Manager for MCIS (1998), this product
provides comprehensive management of Microsoft's Commercial Internet Servers.
86
Comprehensive means support for IIS, Proxy, News, Mail and Directory components that
includes monitoring resources, managing events, automating routine tasks, and deploying
software (software distribution) for Microsoft Internet Explored (browser) clients. This
product utilizes the Tivoli framework and leverages other framework-based products like
Distributed Monitoring and Software Distribution.
Many system, network, and application management-product vendors have
professional service personnel that implement their products for customers for a fee. For
most, this is not a requirement when you purchase the product. Tivoli has sixty-five
partners listed on their partner Web page (Tivoli Business Partners, 2001). The list of
Computer Associates Consulting partners is too big to count (Consulting Partners, 2000).
Hewlett-Packard has a link from their home page that makes it very easy to find a reseller
that performs implementation services. They will even provide a map with directions that
will get you from your place to theirs (Welcome to Hewlett-Packard, 2000). There are a
number of reasons why products are implemented with services. In some cases, the
products are immature and successful implementation would be impossible without highly
skilled and experienced implementation personnel. This situation was discussed in The
Double Edged Side of ESM (Boardman, 1999). In some cases, the involvement of service
personnel is part of a strategic set of activities whose goal is to control the customer
choices and influence where the implementation budget is spent.
Groupe Bull and its approach to implementation of the Integrated System Management
(ISM) product involves the strategic use of personnel. ISM was a collection of integrated
system and network management products developed and managed by Evidian that was a
Group Bull subsidiary (Evidian Products, 2001). When combined with professional

87
services, these products cover a broad set functions including systems, network, PC
workgroup, application, database, security, and telco management. Groupe Bull has its
worldwide headquarters in Paris France. Groupe Bull operates in 100 countries and has
approximately 27,900 employees that provide the consulting and implementation-services
(Integrated Systems Management, 2000).
ISM is standards-based including functions defined by Network Management Forum's
Omnipoints, Open Software Foundation's Distributed Management Environment, Object
Management Group's CORBA, X-Open's XMP-API, and Telco-defined TMN standards.
ISM has a programming language environment called System Management Language that
is used describe the management objects and actions to be taken for specific exceptions
like faults and performance problems (Miller, 1994). ISM is an unusually complete
network and systems management product that is backed by a large group of consultants
and implementation personnel.
Keynote Perspective is a Web site performance tool that is bundled with professional
services. It requires no specialized software on the customer machines or network.
Keynote provides a worldwide network of monitoring agents to keep track of response
times and it provides daily emails that contain useful comparison information
(Performance Monitoring Software, 2001). Customers can engage Keynote to perform
detailed analysis of the performance data and prepare reports that can be used in a variety
of ways. The analysis reports could be used to determine the best city from which to host
a Web application. The reports could also be used to uncover configuration problems in a
set up of an application hosted in a dual-site mode. Keynote's focus is performance as
88
slow response is costing e-commerce Web sites as much as $4.35 billion annually in lost
revenue (Keynote Perspective, 2000).
Summary of What is Known and Unknown About this Topic Much of what is known about applications management can be discussed in the context
of a functional perspective. One of the challenges in using this approach is to devise a
commonly understood list of functions. As is the case with some many aspects of
information technology, there are many different sources of information from which to
derive a list. These sources include standards organizations, systems-management
software companies, systems-management process consultants, and researchers.
According to Sturm and Bumpus (1999), the list of functions that is needed should
include fault, performance, configuration, security, and accounting. Their list is taken
directly from the ISO work on the subject called the ISO Management Model. This model
is widely known and referenced in network-management articles and books. An example
is a book on network management by Udupa (1996). This list of functions is a good
starting point, but it has a network-management bias. What about the applications
management standards organizations? What do the thought leaders in this emerging
discipline think regarding the functional perspective? The three main organizations that
have applications-management as a focus are the IETF, the DMTF, and POSIX of the
IEEE Computer Society. In general, these organizations are creating standards that are at
an implementation level. These standards can be used as a starting point by researchers or
used in software products and offerings.
The IETF has included an application focus in its standards work since 1993 (Sturm &
Bumpus, 1999). Application MIBs or application components imbedded in other types of

89
MIBs have been the focus of activity and some approved standards. An example of this
work, Application Management MIB (1999), defines objects used for the management of
applications. A functional perspective is not stated in the standard, but can be derived
through careful examination of the scope of the document. The scope includes throughput
measurements, support for units of work, application response time monitoring and
support, resource management (files in use, I/O statistics, etc.) and control of applications.
The implied scope of this standard is application availability and performance. One
reason for this limited functional perspective is the design decision that the management
of the application would be done without the cooperation of the software being managed.
The DMTF, through the CIM provides an application life cycle that has characteristics
like a functional perspective. The CIM life cycle includes six stages--purchase, deploy,
advertise, configure, execute, and remove. Each stage has an associated state, for
example, the purchase stage has an associated state of deployable. The stage/state
relationship is important, as the focus of the CIM standard is the support of installation
and operational data. The scope of the data includes product, software features, and
software elements. Other data includes configuration and service point that supports
initiate, start, and stop functions (Learn CIM, 1999). The implied scope of this model is
administration, configuration, availability, and change. Like the IETF Application
Management MIB standard, CIM provides a model that is ready to be used by researchers
and software developers.
The POSIX committee was focused on creating formal standards regarding the
administration of software. The POSIX standard (Information Technology - Portable,
1995) focused on administration of software across distributed systems. This included
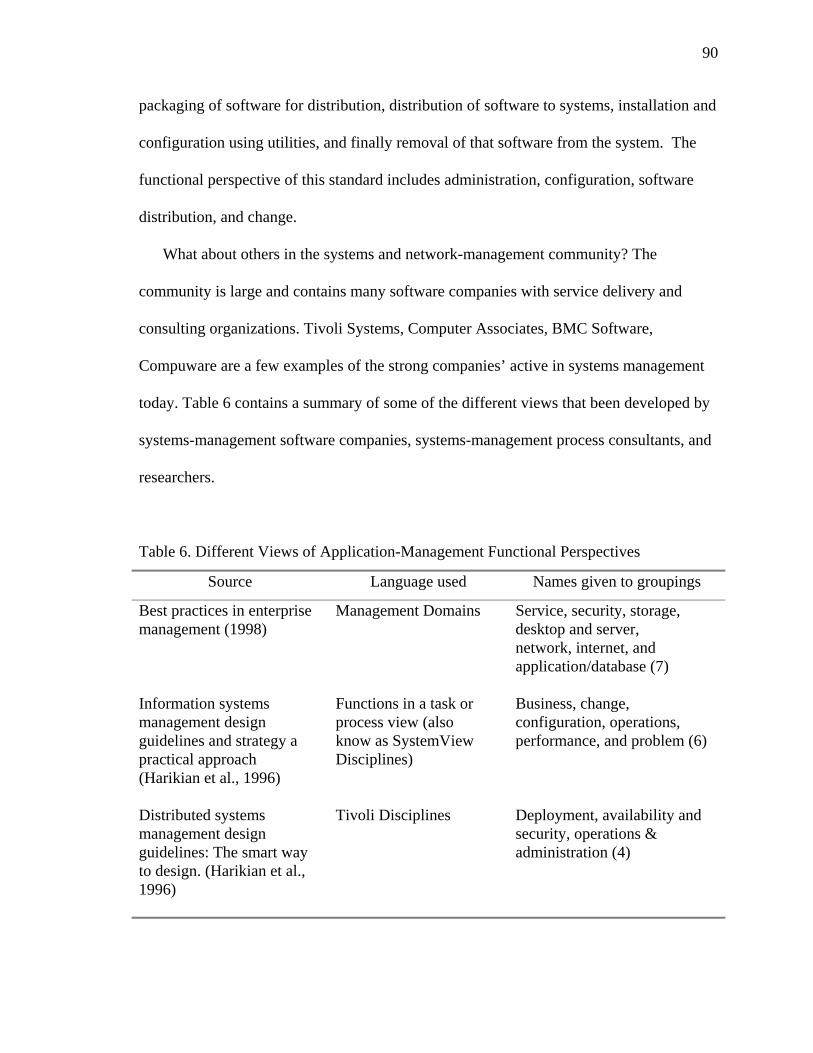
90
packaging of software for distribution, distribution of software to systems, installation and
configuration using utilities, and finally removal of that software from the system. The
functional perspective of this standard includes administration, configuration, software
distribution, and change.
What about others in the systems and network-management community? The
community is large and contains many software companies with service delivery and
consulting organizations. Tivoli Systems, Computer Associates, BMC Software,
Compuware are a few examples of the strong companies’ active in systems management
today. Table 6 contains a summary of some of the different views that been developed by
systems-management software companies, systems-management process consultants, and
researchers.
Table 6. Different Views of Application-Management Functional Perspectives
Source Language used Names given to groupings
Best practices in enterprise management (1998)
Management Domains Service, security, storage, desktop and server, network, internet, and application/database (7)
Information systems management design guidelines and strategy a practical approach (Harikian et al., 1996)
Functions in a task or process view (also know as SystemView Disciplines)
Business, change, configuration, operations, performance, and problem (6)
Distributed systems management design guidelines: The smart way to design. (Harikian et al., 1996)
Tivoli Disciplines Deployment, availability and security, operations & administration (4)

91
Table 6. (continued)
Source Language used Names given to groupings
Distributed systems management design guidelines: The smart way to design. (Harikian et al., 1996)
Information Systems Management Architecture (ISMA) Processes
Business, data, service level, recovery, security, audit, capacity, problem, and distribution (9)
Distributed systems management design guidelines: The smart way to design. (Harikian et al., 1996)
Information Technology Process Model (ITPM) Processes
Business, data, service level, recovery, security, audit, capacity, problem, and distribution (9) Note: this subset derived from a complete list of 42 processes
Delivering IT Services (Bladergroen at al., 1998)
Information Technology Infrastructure Library (ITIL) Services
Configuration, help desk, problem management, change, software control and distribution, service level, capacity, availability, contingency, and cost (10)
Distributed Computing Environment (Cerutti & Pierson, 1993)
Systems Fault, performance, configuration, accounting, billing, and software distribution (6)
These functional perspectives (disciplines, processes, services, or systems), although
written about widely, are not implemented in any uniform way within management
products in the marketplace. This statement can be easily be proven by gathering
information from systems, network, and application management software companies.
Few of them use precise terminology to categorize their products. Certainly, one can
perform analysis regarding some products and put them in a category like availability or
security. Others, however, are hard to categorize using a conventional functional label.
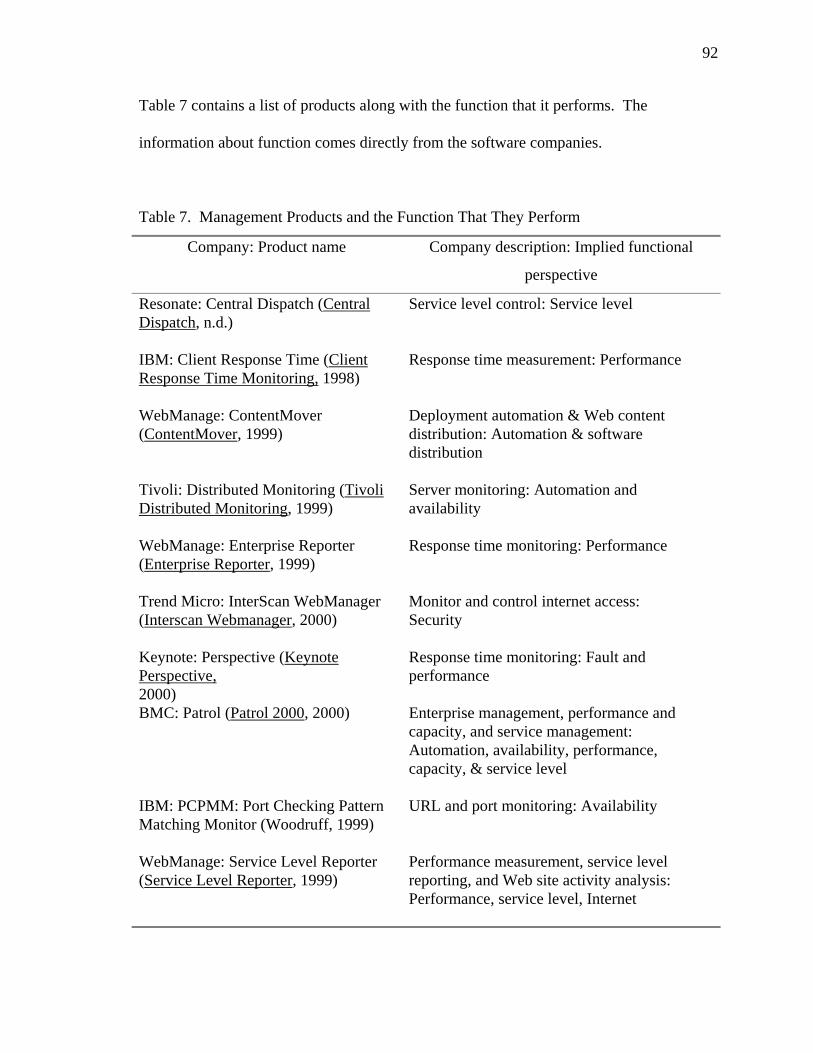
92
Table 7 contains a list of products along with the function that it performs. The
information about function comes directly from the software companies.
Table 7. Management Products and the Function That They Perform
Company: Product name Company description: Implied functional
perspective
Resonate: Central Dispatch (Central Dispatch, n.d.)
Service level control: Service level
IBM: Client Response Time (Client Response Time Monitoring, 1998)
Response time measurement: Performance
WebManage: ContentMover (ContentMover, 1999)
Deployment automation & Web content distribution: Automation & software distribution
Tivoli: Distributed Monitoring (Tivoli Distributed Monitoring, 1999)
Server monitoring: Automation and availability
WebManage: Enterprise Reporter (Enterprise Reporter, 1999)
Response time monitoring: Performance
Trend Micro: InterScan WebManager (Interscan Webmanager, 2000)
Monitor and control internet access: Security
Keynote: Perspective (Keynote Perspective, 2000)
Response time monitoring: Fault and performance
BMC: Patrol (Patrol 2000, 2000) Enterprise management, performance and capacity, and service management: Automation, availability, performance, capacity, & service level
IBM: PCPMM: Port Checking Pattern Matching Monitor (Woodruff, 1999)
URL and port monitoring: Availability
WebManage: Service Level Reporter (Service Level Reporter, 1999)
Performance measurement, service level reporting, and Web site activity analysis: Performance, service level, Internet
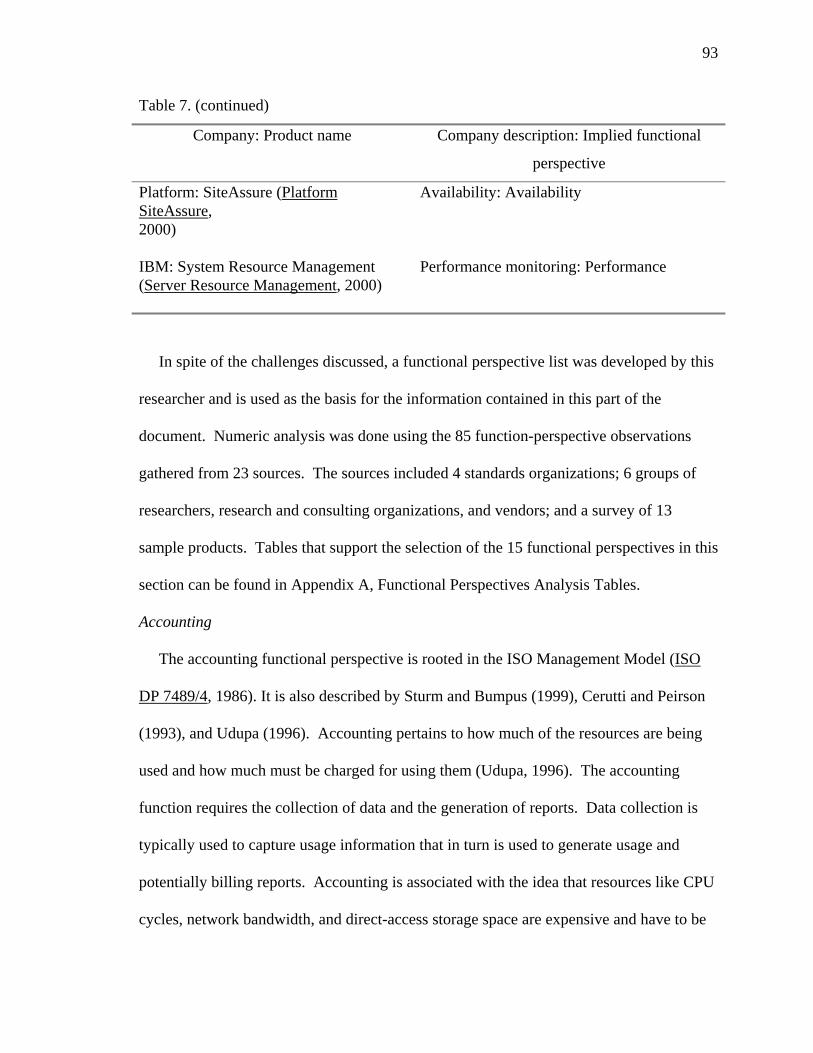
93
Table 7. (continued)
Company: Product name Company description: Implied functional
perspective
Platform: SiteAssure (Platform SiteAssure, 2000)
Availability: Availability
IBM: System Resource Management (Server Resource Management, 2000)
Performance monitoring: Performance
In spite of the challenges discussed, a functional perspective list was developed by this
researcher and is used as the basis for the information contained in this part of the
document. Numeric analysis was done using the 85 function-perspective observations
gathered from 23 sources. The sources included 4 standards organizations; 6 groups of
researchers, research and consulting organizations, and vendors; and a survey of 13
sample products. Tables that support the selection of the 15 functional perspectives in this
section can be found in Appendix A, Functional Perspectives Analysis Tables.
Accounting The accounting functional perspective is rooted in the ISO Management Model (ISO
DP 7489/4, 1986). It is also described by Sturm and Bumpus (1999), Cerutti and Peirson
(1993), and Udupa (1996). Accounting pertains to how much of the resources are being
used and how much must be charged for using them (Udupa, 1996). The accounting
function requires the collection of data and the generation of reports. Data collection is
typically used to capture usage information that in turn is used to generate usage and
potentially billing reports. Accounting is associated with the idea that resources like CPU
cycles, network bandwidth, and direct-access storage space are expensive and have to be

94
allocated and managed. This functional perspective is rooted in the mainframe computer
when many users shared one machine and its associated resources. Interestingly, today's
high-end Web servers are so expensive that it is starting to make sense to IT departments
to manage them like mainframes. This phenomena is reported by Olsen (1998) where the
author described how UNIX JobAcct software was used to bill users for their CPU
connect time and disk activity. Olsen's research involved an implementation with the
Army Corps of Engineers What is the relevance of the accounting perspective to the
management of applications?
Most of the references to the accounting perspective in the research literature stem
from the initial ISO work and the network management discipline. Numerous articles
simply explain the ideas that can be found in the original ISO standard (ISO DP 7489/4)
from 1986. There are however, a number of product implementations. EcoTools from
Computerware Corporation has a resource accounting capability that is linked to charge
back. The software handles a somewhat diverse set of application products and runtime
environments including various Unix platforms running Oracle, Sybase, and Informix
database software (Systems Management Tools, 1996).
Olsen (1998) reported that the Army Corps of Engineers uses UniSolutions Associates
JobAcct software to bill its districts for their CPU connect time and disk activity on their
Unix servers. The utility is just one of several components of a layered charge-back
system. Other components include Awk and Unix shell scripts that create sequential files
that are used to supply information needed by the Army's charge-back and billing
application. Aragon (1997), Rennhackkamp (1997), and Fosdick (1998) highlighted the
functionality of Computer Associates Unicenter TNG that is attractive to many
95
companies. Jones International choose Unicenter TNG due to its strengths in resource
accounting, as well as software distribution, asset management, event management,
workload management, and report management (Aragon, 1997). Fosdick (1998) discussed
the comprehensive list of Unicenter TNG's capabilities including resource accounting--a
major functional capability.
Another example of resource accounting software is Platinum Technologies CIMS, a
multi-platform product to enterprise resource management. The product focus was
enterprise-wide resource management including charge back and capacity planning
reporting supporting MVS, VSE, UNIX, Windows NT and OpenVMS systems (System
Software, 1997).
Administration The administration functional perspective is the focus of POSIX standard. POSIX
centered on standardizing system administration utilities--an area where there are no
formal standards. The narrow focus was software administration, a subset of the tasks and
tools used by the system administrator. Within this focus, POSIX defined a software-
packaging layout, a set of information maintained about the software, and a set of utility
programs to work with that software and information (Information Technology - Portable,
1995). More than a decade earlier, IBM dealt with the issue of mainframe software
administration by creating a system of procedures, information, and data utilizing a tool
that it created called System Modification Program (OS/VS2 MVS Overview, 1980). This
utility, with its standard sequence of receive, apply, and accept, became a standard for
large systems whereby every software vendor used the utility to install and administer
their product.

96
Administration is also an aspect of the DMTF's CIM. This model has a life-cycle state
named deploy that means installing the application on a server so it can be administered
over the network (Applications and Namespaces, 2001). Deploying the application is an
administration activity in the same way that POSIX frames it. CIM has a bigger focus
than just administration. Intel's Wired for management initiative is looking to CIM to
help with asset management. CIM 2.0 has the ability to receive and manage
instrumentation from devices, like USB cards, and to maintain information about static
resources like platform BIOS (Overview of Wired, 2000).
The software developer Tivoli, which constructed a new set of disciplines from
SystemView, has Administration as one of its primary focus areas (Lendenmann et al.,
1997). Tivoli, an IBM Company, is not the thought leader that SystemView was in the
marketplace. The Tivoli Management Environment is the management framework that
replaced SystemView in the IBM portfolio. Instead, Tivoli focuses on products like
Workload Scheduler, Operations Planning and Control, Remote Control, Distributed
Storage Manager, and modules that provide integration of third-party products (Tivoli
Product Index, 2001)
Automation The automation functional perspective is complex to describe as it is both a stand-
alone function and one that is imbedded in other functional perspectives like operations
and problem. As a stand-alone function, automated operations has been in the literature
for over 10 years. Irlbeck (1992) wrote an important article in the IBM Systems Journal
that described automation in the context of network, system and remote system operation.
This article announced new capabilities in IBM's NetView product.
97
Many vendors, including IBM (Irlbeck's employer), have developed products to
automate the processing of large-scale systems (Desmond, 1990). OPS/MVS, AutoMate
(Anthes, 1992), and Operations Planning and Control (Tivoli Operations, 2001) are
products, that place under software control, the operations of large systems including
subsystems like the Customer Information Control System (CICS) and the Information
Management System (IMS). These subsystems support the daily operations of hundreds of
thousands of users (Ryan, 1993). Researchers like Flanagan (1996) wrote about the
importance of automation for effective network management. Linked with a policy-
directed approach, automation could be used to manage legacy environments, intelligent
agents, and application integration.
Products are beginning to become available to automate activities on smaller systems
like NT clusters and UNIX complexes. Welter (1999) used the Summit OnLine forum to
explain how the automation capabilities of Freshwater Software's family of products
leverages automation to watch local processes, network connections, and machine
resources to prevent and detect problems. As these smaller systems get larger and more
expensive, the economic benefits of labor savings become more attractive.
Automation has a relationship to other functional perspectives in that it is often a key
supporting activity. For operations, automation products and thinking has made it possible
to automate the start up, shutdown, and restart of system, network, and application-
support resources. Free from some routine activities, personnel are available to handle
operational exceptions that cannot be easily automated (Day, 1992). For problem
management, automation is important to the creation and updating of problem records.
Many software tools exist to use problem event data to automatically create problem
98
records (Universal Server Farm, 2000). Automation is used to support configuration
management by soliciting inventory scans from all user devices that are part of a network
(Remedy Discovery Services, 2000). Automation supports security management when a
procedure executes and compares the security profile on a server to a predefined
specification and resets it, if necessary, to the required configuration (Windows NT,
2000).
Availability Bladergroen et al. (1998) defined availability as part of a process called availability
management. This process makes possible the optimum utilization of resources, methods,
and techniques to achieve the agreed upon level of service. In contrast, researchers like
Hariri and Mutlu (1995) have examined the topic of availability and have modeled it in a
numeric fashion. Their attention to availability treated it as one of several important
parameters to evaluate and optimally engineer in regards to cost effective distributed
systems.
Availability was also the focus of the DMTF through projects like CIM. This project
represents an approach to the management of systems, software, users, and networks that
use a model that is object-oriented. In the model, availability is a state construct that is
managed at the logical-device level along with device identification, last error code, and
other key device-level fields. It is ironic that one of the major uses of CIM is to manage
the availability of managed objects yet the word availability hardly appears in a 54-page
white paper on the model (Westerinen & Strassner, 2000).
There are a large number of availability products in the marketplace. Tivoli Systems
and predecessor IBM products, have a long history of focus on system and network

99
availability. NetView, which appeared in the marketplace in 1989, was a tool to manage
the availability of network devices like terminals, control units, lines, front-end processors
as well as the application systems that made these devices useful including software like
the CICS and IMS (Szabat & Meyer, 1992). CICS and IMS are still used today as
application environments for banking, insurance, and many other industries. Netscape,
through a programming extension, supported seamless integration of its application server
with legacy CICS and IMS application systems. This integration allowed customers to
leverage their existing investments in the new Internet and Extranet application
environments that use Netscape's technology (New Netscape Extension, 1998).
Many other Web products were centered on availability. Platform SiteAssure used a
view containing Web, application, and database servers as a tool to monitor the
availability of these resources. Actions were taken directly from the availability views
(Platform - SiteAssure, 2000). The Tivoli Distributed Monitoring product had a "plug in"
module called Tivoli Manager for MCIS that was an availability tool specifically targeted
at Microsoft's Commercial Internet Servers. With this module, availability was managed
as a life-cycle activity. Automation and software distribution were also key functional
capabilities (Tivoli Manager for MCIS, 1998). These are a few of the legacy and
emerging availability products.
Business The business functional perspective is one that is typically broad in its capability. In
fact, it has overlap with other functional perspectives depending on what definition is
used. Mangold and Brandner (1993) described the SystemView definition of business
management. The scope included accounting, security, service agreement planning and

100
control, and service marketing. Most of these activities are administrative in nature with
some support being provided by software. The SystemView discipline of business
management came about or was derived from the broader set of functions described in the
Information Technology Process Model (The Information Technology, 1995).
Harikian et al. (1996) had a somewhat different definition of the business functional
perspective. Their definition of business management had a scope that included inventory
and security management, as well as financial administration, business planning, and
management services. Implementation of the Harikian definition is a management
function, again, supported by key software for inventory and security management.
The business functional perspective is one area where there is a significant difference
between the strategist's view of the function and the implementations of the perspective as
evidenced in vendor products. There are a number of products that advertise business
management functionality. Tivoli's Global Enterprise Manager product focused on the
management of a business system that was described as a logical collection of
management-ready applications (Gulla & Warren, 1998). The GEM paradigm for
management of the business system consisted of business-system views, application
monitors, and commands to take actions to control the business system. The views
contained a variety of objects that represented the components of the business system.
With these components as a launching point, the IT specialist could graphically monitor
the status of components (up, down, degraded, etc.) and issue commands like start, stop,
restart, and events (Tivoli Global Enterprise, 1998).
Like Tivoli, Computer Associates has business systems management as a key part of
their generally available products. The flagship systems management product to support
101
the business management functional perspective is Unicenter TNG (Karpowski, 1999).
Their implementation had tools that focused on business process views. These views
helped to answer questions relevant to the business community like "why is order
fulfillment processing slow?" The technology they used logically overlapped resource
views like those containing applications, databases, systems, and networks with business
views organized by geography, application, or functional role (Computer Associates:
Enterprise, 1997). Tivoli and Computer Associates used their business systems
management software as a basis for their competition for new customers in the late 1990s
(Kay, 1999).
Capacity Capacity management is a long-standing functional perspective. Capacity
management, which has as its goal the effective and efficient use of resources, is often
linked to performance management. This is the case with the IBM IT Process Model
where the Manage Performance and Capacity Process is a component of the Support IT
Services and Solutions Process Group (Harikian et al., 1996). Capacity management is
also part of ITIL Services. It is also linked to performance. In addition to performance,
the ITIL capacity service also includes modeling of resources, demand, and workload
management. It also includes application sizing. The sizing of the application is a
statement of minimums. Examples include "at least 4 MB RAM" and "a VGA screen".
However, the ITIL method includes an examination of these minimums to make sure that
they continue to result in satisfactory performance. This is very important when the
application or workload changes (Bladergroen et al., 1998).

102
The literature is dominated by papers on Web server capacity. Menasce and Armeida
(1999) focused on cost-effective configurations for Web servers based on a formal
capacity planning approach. Banga and Druscher (1999) concentrated on a new method
for Web traffic generation that generated bursty traffic with peaks that exceeded the
capacity of the servers. Their focus was realistic loads. Christensen and Javagal (1997) put
their attention on understanding traffic as it relates to capacity planning. Their focus made
it possible to determine if additional network capacity was needed to support the
application. Other capacity papers exist that focus higher in the application-dependency
stack, but there are far fewer of them compared to Web server capacity papers. The
capacityplanning.com Web site contains thirty-four white papers--only one directly relates
to application sizing. The paper (Application sizing, capacity planning, 1996) was a
detailed description of a proposed research project. It is not clear if the project was
funded or completed, but the scope and tasks outlined were substantial.
Many capacity products are available with a large number of them narrowly focused
point products. Any example of the point products available was described in Capacity
Management Software (Loyola, 1998). The author reviewed four different capacity-
management tools that ran under Windows NT and were designed to provide support for
network-capacity analysis. Capacity management products and simple tools available with
many software systems are often used by capacity planners. These capacity-planning
professionals perform services internally for their companies and externally for customers.
An example of this is a white paper where BMC professional services personnel explain
how they use BMC capacity planning tools to consolidate multiple servers into fewer
instances to save costs and to reduce points of failure (Server Consolidation Methodology,

103
2001). The main product used was BMC Patrol. The consultants focused on CPU,
transition I/O rates, and disk utilization.
Many companies with capacity planning software utilize their own professional
services groups and partners to deploy and use the software to provide value to their
customers. Examples include Unisys, Hewlett Packard, Oracle, and IBM. Many other
capacity-planning consultants, like CapaciTeam Inc. and Veritechs Solutions, have no
built-in affinity to a software company (Yahoo! Search Results, 2001).
Change Change management has been an important focus in information technology since
mainframes started to provide services that companies found critical. Since change
introduces risk to a system, change management was developed as a tool to reduce the
risk of failed changes by requiring a written back-out procedure. IBM's change-
management focus was developed during the early years of the mainframe and has
continued to remain important. Specifically, for the IBM IT process model, change is
reflected in the Deploy Solutions Process Group. This group has several change-related
components including Define Change Management Practices and Administer Changes
and Plan Change Deployment. These processes are explained in detail and have a broad
scope including management of changes to software, hardware, control mechanisms,
configurations, environments, facilities, databases, and business applications (Harikian et
al., 1996). The ITIL methodology, another key process methodology like the IBM IT
Process Model, identified change management as a key support service along with
configuration, helpdesk, problem, and software control and distribution (Bladergroen et
al., 1998).
104
The focus of the literature on change management is the challenges created by Web
applications with frequently changing content. Cochran (2000) explained the alternatives
that companies have regarding changing content. They indicated that companies can
implement a change-management system or almost guarantee an influx of corrupt and
unauthorized data. Huh and Bae (1999) proposed a Web-based change management
framework that can verify change success and support synchronous collaboration. The
prototype of the framework implementation supported a commercial object oriented
database management system and utilized programs written in C++. A number of change-
management applications were developed specifically for the Web. Huang, Yee, and Mak
(2001) developed a system to manage engineering changes in forms, fits, functions,
materials, and dimensions. Their system, actually a framework, was designed to provide
better information sharing, simultaneous data access, and more timely communication.
There are many change-management products in the marketplace. Some legacy
software, like IBM's Information Management product (now caller Service Desk for
OS/390), is still used for its change-management application. The program is over 20
years old (Tivoli Service Desk - INFOMAN, 2001). This tool has the ability to support
thousands of concurrent users--an ability lacked by Windows NT or UNIX-based
solutions. It has recently been updated to support up to 400 gigabytes of data storage and
now has a Web interface (Tivoli Service Desk - Datasheet, 2001). Newer products are
focused on change management of applications with integration of other tools. An
example is StarSync for Starbase inc. StarSync is used to deploy digital components to
servers as part of a managed change. It can work with StarSweeper, another Starbase
product, to sweep Web content for defects. It can also work with StarTeam Test Director

105
to synchronize defects between the change system and the defect-tracking module
(Starbase Corporation, 2001).
Change management is like capacity management in that it often takes a skilled
professional to implement it in an effective manner. Because of this, many software firms
have highly skilled professional services personnel to assist customers with their product
implementations. A good example is Telelogic, a global provider of solutions for
advanced software development. Telelogic has an integrated change and configuration
management product suite and utilizes their professional-services personnel to deliver the
solutions. Telelogic consultants present frequently at conferences like the Annual
Workshop on Software Configuration Management and have published many white
papers. Weber (1999) explained that Source Control Maintenance (SCM) provided many
well-known benefits for traditional software development. However, RAD users are
reluctant to use SCM because it slows them down. Weber's paper explained strategies to
successfully use SCM with RAD providing powerful and strategic direction to the reader.
In another paper (Continuus/CM: Change Management, 2001) the author explained the
drivers for change management including the growing diversity of development and
delivery platforms, the use of parallel development strategies, application size and
complexity, team size, distributed development teams, quality and time to market
demands, and modern integrated development environments.
Configuration Configuration management is one of the OSI Systems Management Functional Areas
(SMFAs). Configuration is important in regards to networks because it can support the
location of resources like routers, hubs, switches, and hosts. Details about these resources

106
can be modeled as objects and these objects can be stored in directories. Configuration
management is also important because the information it maintains is needed to start, stop,
add, and delete resources from the network (Udupa, 1996). ITIL views configuration
management as a key support service like helpdesk, problem management, change
management, and software control and distribution (Bladergroen et al., 1998). For the
IBM IT Process model, configuration management (called maintain configuration
information) is part of the Support IT Services and Solutions Process Group. The broad
goal of Maintain Configuration Information is to identify, capture, organize, and maintain
configuration information for use by other processes. One of the big challenges associated
with configuration management is the dynamic nature of systems, networks, and
applications (Harikian et al., 1996).
Some of the key configuration-management issues in the literature involved
automation in network configuration, the role of software distribution for Web sites, and
Web-based configuration applications. Ku, Forslow, and Park (2000) discussed the
importance of some level of automation in network configuration and management. Their
Java-based tool automatically populated a centralized database with key network-
configuration data. Leoni, Trainotti, & Valerio (1999) explained the results of an
experiment designed to understand the impact of a process-improvement activity
involving configuration management in the software development process. The focus of
this study was development projects for Web sites. A number of Web-based configuration
applications were discussed. Attardi, Cisternino, and Simi (1998) wrote of a Web-based
configuration assistant useful in electronic commerce and information services. In their
paper, the researchers described a generalized approach for building Web-based
107
application assistants. The Web was the focus of a paper that described a Web based
configuration control application. Curtis (1997) described a Web-based application to
manage the configuration of team programming projects. Web-based tools are described
by Hahn and Bruck (1999) in the context of micro electromechanical systems process
configuration. PCFONFIG is a tool used to manage initial configurations for build-to-
order products. It is especially suited for machines with complex configuration
requirements (Slater, 1999).
Like so many other functional perspectives, configuration management software got its
start on mainframe systems. Initially, mainframe configuration information was
maintained by a programmer and processed by the system control program and stored in
machine-readable Unit Control Blocks (Elder-Vass, 2000). Over time, more of the
configuration information was delivered as part of the microcode or logic included with
the device itself (Microcode, 2001). When networks were attached to mainframe
computers, these devices already had considerable functional capability including some
configuration-management capability. An example is the Vital Product Data (VPD)
command that was used to query the device and store the results in a file that could be
used to produce configuration reports. The data returned included general product data
(hardware or software), data for modems, data for DSU/CSUs, link configuration data,
sense data, attached device configuration data, and product set attributes (NetView for
OS/390 Application, 2001). VPD is still used today by IBM and products from other
networking companies like Cisco (Router Products, 2001)
Today, configuration software is much broader in scope. In addition to host and
network configuration, products like Code Co-op from Reliable Software provide a

108
distributed software version control system. Version-control software is used to manage
application configurations (Reliable Software, 2001). Other software configuration
management products include PCMS from SQL Software (Merant PVCS, 2001) and
Continuus/CM (Text-based configuration, 2001). Telelogic North America Inc. (formerly
Continuus Software Corporation) employees have authored many white papers on
configuration management that are available on the Continuus Web site. Dart and
Krasnov (1995) explained how the discipline associated with configuration management
can significantly reduce the risk associated with the adoption of a new tool or process
reengineering. Dart (1994) also wrote about the challenges of adopting an automated
configuration-management solution and the strategies to successfully implement the
technology. These employee-written documents are used by customers to help with their
own software implementations. They also demonstrate the skills and previous success of
the company's professional-services team.
Fault Fault management is rooted in OSI. It is one of the five SMFAs. The other SMFAs
include configuration, performance, accounting, and security. Fault management is
generally concerned with detection, isolation, and correction of unusual operation of
systems (Udupa, 1996). Fault management is not a specific focus of ITIL, but a part of
availability management where it is used as part of a methodology called fault tree
analysis (FTA). FTA is used to examine the sequence of events disrupting an IT service
(Bladergroen et al., 1998). In the IBM IT Process Model, fault management, also called
alert or trap management, is part of a subgroup called Manage Problems and is part of the
109
support IT Service and Solutions process group. The scope of Manage Problems is
detection, analysis, recovery, resolution, and tracking (Harikian et al., 1996).
The literature on fault is like a tree with a number of strong branches. One branch is
centered on policy and reasoning approaches to fault management. Katchabaw, Lutfiyya,
Marshall, and Bauer (1996) defined a fault as a violation of policy. This definition is in
contrast to the domain-specific work that dominates the literature and product
implementations. Network-level faults are an example of a domain-specific exception. In
this work, the researchers proposed a policy-driven system that detects application faults
and isolates them and corrects them using a predefined policy. The researchers
implemented a prototype that utilized the MANDAS components called configuration
management. The prototype required instrumentation, that when added to the application
processes, provided detailed information about application faults.
Yun, Ahn, & Chung (2000) defined fault conditions and rules and the related recovery
mechanisms to handle them. They investigated fault conditions like process fault, server
overload, network interface fault, and configuration and performance fault. Another
branch of the fault tree has as its focus fault tolerance in Web servers. Aghdale and Tamir
(2001) made this a focus of their work that was centered on client transparent recovery
actions. Their work was concentrated on completing the user's transaction at the time of
the failure instead of the typical outcome which is to leave the user unsure if the process
completed successfully. Chin, Ramachandran, and Chong (2000) and Yang and Luo
(2000) also focused on server fault tolerance.
There are many fault-management products in the marketplace. Fault-management
software originated with mainframe computers. Early examples were the Environmental

110
Record Editing and Printing Program (EREP) (Environmental Record Editing, 1999).
EREP was a tool that reported on hardware faults that were recorded in a key system file
called SYS1.LOGREC. EREP and SYS1.LOGREC are still in use today (Elder-Vass,
2000). When networks were connected to mainframes, devices were outfitted with logic to
detect errors and report those errors to "upstream" devices in the network. Eventually, the
data made its way to the mainframe computer. Initially, this data was stored in system
files, but new tools like Network Problem Determination Aid (NPDA) were developed to
collect the data, store it on-line, and offer operators assistance with the faults it recorded
(called events and alerts) in the form of probable cause and recommended action advice
(NetView User's Guide, 2001).
Today, NPDA remains a common interface point for software vendors who want to
consolidate fault data, from a variety of devices, in one place with considerable storage
and processing capacity. A typical example is the Spectrum/NV-S Gateway software
from Cabletron systems. The product user's guide explains how to forward Spectrum-
detected faults to NPDA for viewing and reporting (Spectrum/NV-S, 1998). Fault
detection and management is a challenge in distributed environment as evidenced by the
large number of products produced by major software companies. Veritas Software
Corporation produces NerveCenter, a fault management tool targeted at UNIX and NT
systems (Veritas NerveCenter, 2001). Tivoli has a number of modules for systems and
applications like CATIA, BEA Tuxedo, Domino, R/3, DB2, MCIS, and others that have a
strong focus on fault (event) management (Tivoli Product Index, 2001).
Quest software has I/Watch for Oracle event management. A focus on Oracle and the
databases that support an application give the management software a window into many

111
applications. Computer Associates has legacy mainframe fault-management products, but
also has Unicenter TNG with a number of fault-management and automation plug-in
modules (Mason, 2001). BMC has Patrol for event management and, like Tivoli, has plug-
in modules (called knowledge modules) to handle the fault management requirements for
a variety of environments like SAP R/3 and Oracle (Event Management, 2000).
Operations Operations management was not the focus of any major standards efforts. OSI, for
example, did not include operations as one of its SMFAs. ITIL does not identify it as a
specific discipline, but rather discusses operations management as part of availability
management--"Good availability management is founded on adequate performance of the
operational management processes" (Bladergroen et al., 1998, p.49). Operations was a
major focus of phase four of the IBM Systems Management Solution Life Cycle. The
main goal of operation was to ensure that the ongoing delivery of IT services is efficient,
effective, and consistent. The other phases of the Systems Management Solution Life
Cycle were define the solution approach, design the solution, and implement the solution.
The methodology was independent of the tools used to deliver the service. This life-cycle
approach comes directly from the IBM IT Process Model and is focused exclusively on
systems-management activities (Fearn, Berlen, Boyce, and Krupa, 1999).
Tivoli Systems combined operations and administration. The scope of the products
they produced included job scheduling, help desk, backup/restore, and output
management (Lendenmann et al., 1997). Tivoli inherited operations management from
SystemView when IBM purchased Tivoli and the two architectures and products merged.

112
SystemView's focus was purely related to the operational aspects of computing resources
(Udupa, 1996).
The literature contains the work of a number of researchers active in operations
management. Tsaoussidis and Liu (1998) explained a knowledge-based management
system that offers dynamic service to distributed applications. The services included
determining the processor allocation approach to be used, choosing applications to be
executed next, and invoking the best parallel processing method. Tanaka and Ishii (1995)
explained a service-management architecture they developed that was focused on
providing reliable telecommunications and operations services. The architecture consisted
of application software elements, a manager, a database, and an installer and remover. The
focus was smooth operation of the target application. Shukla and McCann (1998) created
an operation support system focused on systems management using the World Wide Web
and intelligent agents. The main goals of the system were to provide continuous
monitoring of critical computing resources and problem detection and notification
utilizing intelligent agents. Other goals focused on the use of a Web browser like
configuration management and centralized control of applications.
Operation-management software is an especially broad category. It is broad because so
many different products support IT operations. There are many representative job-
scheduling programs. Job Scheduling Server for Windows 2000 from Microworks handles
the scheduling of work on a single machine or a networked version that can serve multiple
machines including load balancing. It has a rich set of features including a monitor-
program service, job logging, a schedule window, a calendar, conditional job scheduling,
and job priority (Job Scheduling Server, 2001).

113
Sys*ADMIRAL, from TIDAL Software, has a rich set of functions that operate on a
broad set of platforms--UNIX, Windows, AS/400, and OS/390 machines. Its wide
platform support makes seamless management of applications possible using a centralized
approach. Sys*ADMIRAL also has integration with applications including SAP,
PeopleSoft, and Oracle applications (TIDAL Software, 2001). For help desk, another
focus of operations-management software, a large number of products are available.
Footprints, a product from UniPress Software, was 100% Web-based. Its features
provided the ability to centralize tracking, improve workflow, and enable Web-based
collaboration (UniPress Software, 2001).
SDS HelpDesk V4, from SDS HelpDesk Solutions, was a feature-laden tool built for
the Windows platform. It utilized Microsoft Access, a database program, to support issue
management, service contracts, contract management, time tracking, work-group
management, and reporting (SDS HelpDesk Software, 2001). There are several
alternatives to these tradition software products. Host Help Desk, from Hostedware
Corporation, is a Web-based product that is completely hosted by the software vendor--
there is no hardware to purchase (Hosted Help Desk, 2000). Another alternative is open-
source software. FREE DESK, offered through http://freedesk.wlu.edu, is completely free
and can be used with few stipulations (FREE DESK, 2000).
Many backup/restore products are available to support operations management.
NovaStor Backup software is a solution for Windows, Novell, DOS, and Mac Platforms
(NovaStor, 2001). Amanda Backup Software, an open-source archiving and compression
program from the University of Maryland, can be used to administer a local-area network
from a single master backup software tool (Amanda, 2002). UNIX backup solutions are
114
available from Syncsort, a company that got its start by creating a high-performance
mainframe sort program (UNIX and Windows, 2001). For output management, the final
operations-management area, there is a rich collection of products. TUSS, from Square
Software, is a program that makes printers symbolically available for both TCP/IP and
Windows/NT networks. This NT based tool, supports printers on a wide variety of OS
Platforms (TUSS System, 2001).
Whereas TUSS is a generalized tool, other products like SAP Output Management
from Cypress Software target the specific needs of the SAP application and operating
environment (SAP Output Management, 2001). StreamServe Corporation, like Cypress,
has output management tool for specific applications. StreamServe has modules for
Oracle, QAD, as well as SAP (StreamServe Overview, 2001).
Performance Performance is one of the OSI SMFAs. It is a key component of the ISO Reference
Model Entities (Modiri, 1991) and has as its focus the effectiveness of communication
activities. Udupa (1996) pointed out that through performance reports, the utilization of a
station can be observed. Once detected, performance problems can be address by adding
capacity or making other adjustments. The ITIL literature does not single out performance
as a discipline however it is identified as a key part of capacity management (Bladergroen
et al., 1998). It is not unusual to find performance and capacity in close association. The
IBM IT Process model also links performance and capacity management. The Manage
Performance and Capacity process is part of the Support IT Service and Solutions Process
Group (Harikian et al., 1996).

115
The performance literature is vast! Performance management topics offer researchers
many opportunities to create and test models. Rhee, Park, and Kim (2000) proposed a
heuristic connection-management approach that maximizes the use of key server
resources. The work was started when the HTTP 1.1 standard reduced the closing and
reestablishing of connections by supporting persistent connections as a default. As with
some of the other functional perspectives, the literature has examples of the Web as a new
area of focus for performance management. Ahn, Yoo, & Chung (1999) focused on the
analysis of data from Internet networks (TCP/IP) in conjunction with other Web
technologies like Java. A Web-based tool was created to view and analyze the data
collected in the MIB. Goedicke and Meyer (1999) focused their research on a lightweight
approach to using multiple distributed collaborating agents to improve the real-time
performance of Web-based applications.
There are many performance products in the marketplace. Jander (1998) surveyed the
types of products available in the marketplace. These products ranged from measuring the
speed of traffic whereas others simulated traffic. Still others ran from within the
application itself. This is what the industry calls intrusive. BMC Software's products
include Patrol and Best/1 Performance Assurance Series. These tools gather data and
provide performance reports that can be used by performance professionals to detect
problems and to assist longer-term with capacity planning activities (Patrol 2000, 2000).
Candle Corporation has legacy mainframe products like Omegamon. Recently, they have
developed tools like ETEWatch for the performance management of distributed systems.
This tool measures application performance from a customer perspective. ETEWatch has
116
many features including application response-time monitoring, real-time alerts, and
application usage reports (CandleNet ETEWatch, n.d.).
Tivoli Systems had a performance-monitoring tool that used the ARM API to gather
data about the applications performance. ARM is an example of an intrusive approach.
With ARM, the application is instrumented to include API calls that interface directly
with the management system to create response-time data (System Management:
Application Response, 1998). Measuring and improving the performance of Web sites
has been a focus as more and more companies are engaged in commerce over the Web.
Keynote Perspective is a service offering available from the Internet Performance
Authority that can be used for simple performance measurement and for diagnosing
performance problems. The Internet Performance Authority has probes all over the globe
that collect real-time performance data for the customers that pay for the service. Daily
reports are emailed to the administrators of the Web applications that are used to view
Web-based performance reports (Keynote Systems Services, 2000).
Problem Problem management is not one of the OSI SMFAs. However, managing problems is
an action that is commonly associated with networks that are the focus of the OSI SMFAs.
For ITIL, problem management is an important service support element. ITIL is
concerned with overall IT service management therefore managing problems is important
because timely correction of problems is a typical user expectation (Bladergroen et al.,
1998). The IBM IT Process model includes a significant focus on problem management.
Manage Problems is part of the Support IT Service and Solutions Process Group. For the
IT Process Model, the goals are to reduce problem quantity, impact, and costs (Harikian et
117
al., 1996). Problem management became a focus when companies started to depend on IT
services to run their businesses. Minimizing the impact of problems became a goal that
was measured (and still is) in many organizations.
The problem management literature contains some research on projects that are using
the Web for problem solving research. In another researchers Hellerstein, Zhang, &
Shahabuddin (1998) described a systematic, statistical approach to characterizing normal
system operation. The researcher's interface to problem management used the
characterizations to remove known behavior thus better detecting anomalies. These
anomalies are the true problems to be managed. In general, however, little research is
being done to improve problem management as it is a mature discipline. Kundtz (1996)
found that companies could realize a greater return on investment of a helpdesk solution if
they applied the business process method to the implementation of the problem
management process. Talluru and Deshmukh (1995) took a knowledge-based approach as
they created a problem-management model in the context of a decision support system.
The model was built using Prolog and Visual Basic and utilized a natural-language
interface.
The marketplace offers many problem-management products. Some products offer
problem-management as one of many integrated functional perspectives. Impact, from
Allen Systems, offers problem management as well as service desk, change, asset, and
service level management--all in the same product. The software also has automation
capabilities that can be used to detect and resolve problems (Products - ASG, 2001). The
Action Request System software from Remedy Corporation offers problem management
in the context of a workflow automation tool (Remedy Action Request, 2001).
118
Compuware offers VantageView, which is part of a family of products called Vantage.
VantageView is focused on the disciplines of availability, performance, and serviceability.
Problem management is improved by rapid detection and recovery of application failures
(Compuware Vantage, 2002). Support.com is an example of a non-traditional problem-
management tool. The support.com healing system utilized probe technology to detect and
repair problems without user intervention. Support.com's problem-management assistance
is provided by its remote help desk. The product is both software and remote service
(Help desk, 2001).
Security Security management is one of the OSI SMFAs. Udupa (1996) pointed out that
security management has become an important issue because of the thousands of
workstations that have come about due to the developments associated with distributed
computing. Security management was not identified as an ITIL service support element
(Bladergroen et al., 1998). It is not even mentioned in the basic literature. The IBM IT
Process model includes Manage IT Security as part of the Manage IT Assets and
Infrastructure Group. Three important areas were identified for security--security within a
local system, security of distributed processes and data, and security of networks and
communications (Harikian et al., 1996).
The literature on Security has vitality. Security research regarding the Web is
significant in size and scope as it is generally recognized that security concerns are one of
the major inhibitors to the use of the Internet for commerce (Rubin, Geer, & Ranum,
1997). Its importance is so great that security training is required for the growing
profession. Horrocks (2001) noted that the Security Industries Training Organization, the

119
International Institute of Security, and the Society for Industrial Security Safety are the
leaders in the development of education for professionals. He noted that some in the IT
industry do not yet believe that security management is a profession.
Researchers are exploring many aspects of the security-management challenge.
Barruffi, Milano, and Montanari (2001) focused on intrusion-detection systems. Their
tool, called PlanNet, was a constraint-based system that used artificial intelligence
techniques to perform security-management functions in a network of computer systems.
Devices are not the only focus in the security literature. Eloff and Von Solms (2000)
focused on information not devices or networks. Security management is the focus on
both industry and government. Verton (2000) explained what the Department of Defense
(DOD) was doing in the area of security training. The DOD offered more than 1,044 IT
and security-related courses at the time of the paper.
There are a large number of security products and many of them are updated frequently
to keep up with security threats. In April 2001, Symantec software, maker of Norton
AntiVirus and Enterprise Security Manager, updated its programs to deal with a false
digital certificate. The certificate, which was issued in error by VeriSign, was given to an
individual who fraudulently claimed to be a representative of Microsoft Corporation. The
story was documented in a Software Industry Report (Symantec First to Provide, 2001).
Other security changes and updates are needed because of new technologies. Check Point
software, a company that makes firewall software, has had to improve its firewall security
because of the emergence of Virtual Private Networks (VPNs). The emergence of VPNs
as an alternative to older forms of back-end connectivity has caused vendors of software
for key devices like firewalls to expand security policies to handle the unique security

120
exposures associated with these types of networks (Krapf, 2001). Technologies like VPNs
emerge rapidly and create challenges for the security software and consulting
communities and the customers that they support.
Service Level The service level functional perspective has as its focus the quality of IT services
provided to the users of the computer system. Service level is described in the Merit
Project Report (Best Practices, 1998). It is a key part of the Information Systems
Management Architecture Processes (Harikian et al., 1996) and Information Technology
Infrastructure Library Services (Bladergroen et al., 1998). Both are methodologies that
focus on providing comprehensive management services. Service level management is
also part of Integrated System Management--software and services from Groupe Bull.
Integrated System Management defines service management as the handling of resources
like central and distributed processors, networks, and related technologies. It also
includes services like voice, data, and video. Both resources and services are managed
using a service level agreement that is focused on the client's business and expectations.
The service level agreement measures the performance while budgets measure the cost
(Miller, 1994). Service level agreements are part of a broader concept called service level
management. Lewis and Ray (1999) describe a framework that can serve as a baseline
against which one can situate and evaluate service-level agreement proposals. The
framework integrates business processes, service, service parameters, service level,
service level profile, service level agreement, and service level management into a
coherent system. In this framework, a service level "is some mark by which to qualify
acceptability of a service parameter" (Lewis & Ray, 1999, p.1974). The authors noted that
121
the marking schemes can be binary (language like, "is acceptable only if never more than
40%") or fuzzy (language like, is acceptable only if it is very good to excellent"). Service
level management is sometimes administered in very specialized domains. Puka, Penna,
and Prodocimo (2000) wrote about a management system for ATM networks that is
tightly aligned with technology characteristics like quality of service parameters and
ATM traffic management specifications. The service level model created by the authors
could be applied to other networking technologies, but is not a good match for the
management of applications.
For Web applications, both service level agreements and service level objectives apply.
Among Web hosting service providers, most contracts specify service level objectives.
An example of the language used might include --"Web hosting provider strives to make
the Web Hosting Environment available for access by Internet users and the customer’s
authorized representatives or agents 24 hours per day, each day of the year, except during
periods of scheduled maintenance. Web hosting provider's availability objective for the
Web Hosting Environment is less than four hours per calendar month of downtime,
subject to specific exclusions" (Universal Server Farm, 2000, p. 17). Although the
language is specific, it is still just an objective and carries with it no penalties for not
meeting the objectives.
Service level agreements contain very specific language that often includes a penalty
notice for failure to perform. UUNet, a Internet Service Provider, has a powerful SLA.
The commitments are in three areas--network quality ("the latency (speed) of core
sections of UUNET's network will not fall below specified levels"), service quality ("the
UUNET network will be available 100% of the time"), and customer care quality (should

122
a fault cause the network to become unavailable, UUNET will notify the customer within
specified timescales. In certain countries, circuit install time commitments are also
available"). UUNet also states "should these specified levels of service fail to be
achieved, UUNET will credit the customer's account" (Service Level Agreements, 2001,
p.1).
Software Distribution Software distribution is about getting files from one place to another. It is made
complicated by different machine configurations running different operating systems,
brief update time windows, and frequency of software maintenance and updates (TME 10
Software Distribution, 1998). Software distribution became an important functional
perspective in the 1990s after de-centralization of computing resources became an
established trend. At that time, reliable distribution of software was accomplished using
different approaches like manual distribution, ad hoc solutions, and electronic
distribution. Electronic distribution became popular because many distributions involved
a broad geography and required timeliness of execution (Vangala, Cripps, & Varadarajan,
1992).
Software distribution is a focus of POSIX. Its software administration standard
includes utilities that facilitate software distribution including swcopy (copy distribution),
swpackage (package distribution), and swverify (verify software). These utilities along
with software structures like bundles and filesets make standardized software distribution,
used for software installation, possible (Information Technology - Portable, 1995).
Software distribution is used by ITIL as part of its Service Support Set. It is a peer activity
to change, configuration, helpdesk, and problem (Bladergroen et al., 1998). Software
123
distribution has been the focus of many research activities. Gumbold (1996) described
software distribution by reliable multicast that involves an end-to-end application layer
protocol built on top of a thin transport layer (UDP) and a best effort network layer
multicast service (IP). Osel and Gansheimer (1995) described the use of the OpenDist
toolset to synchronize file servers. They described the difficulties associated with
performing daily updates on a large number of servers. Since network bandwidth can be
an important consideration, data compression for software distribution can help lessen the
impact of large distributions and improve the effectiveness of the management activity
(Tong, 1996).
Start and Patel (1995) focused their work on the distribution of telecommunications
service software. Software distribution is the focus for software companies like Tivoli
Systems. This company has software that is designed to distribute an application to its
clients and servers (TME 10 Software Distribution, 1998). Tivoli's software distribution
service is also used to support system-management products by distributing their elements
like commands and monitors. The popularity of the Web has created an explosion in
software-distribution utilities. Levitt (1997) discussed nine products that stream updated
Web-page content from a Web server to a browser. The products are used to deliver news
and information.
The Contribution This Study Makes to the Field This study makes a contribution to the field of systems management in three significant
ways. This study expands knowledge and capability in the full life-cycle management of
applications, it provides the design of an innovative toolset for the management of

124
applications, and it expands the capabilities of 15 key functional perspectives in the area
of application management.
Expand Knowledge and Capability in Full Life-Cycle Management of Applications One focus of the researcher in this study was on applications-management support for
the full life cycle of the application. The life cycle includes design, construction,
deployment, operation and change. Creating an application with management support has
considerations throughout its design, construction, deployment, and operation.
Management support is also a consideration when the application undergoes change.
Design, construction and operation activities were described by Kramer, Magee, Ng, and
Sloman (1993). It is helpful to explain the application operation phase by using a concept
called the application stack, which is shown in Table 8.
Table 8. The Applications Dependency Stack and Application-Management Support
Stack Component Description Application Management
Support
Application The programs and processes that make up the application.
Deployment of the application; monitoring and operation of application tasks.
Database The files and database used by the application.
Monitoring and operation of database resources that are used by the application.
Network The network components like protocols and services used by the application.
Monitoring and operation of network resources that support the application.
Operating System
The operating system and its services used by the application.
Monitoring and operation of operating system resources that support the application.

125
This construct provides a framework for the monitoring of the application and its
components. The application stack was described by Hurwitz (1996) and is a collection
of resources that provide support to the application. The main stack components are the
operating system, network, database, and the application itself.
Change is a phase that has activities that are used to coordinate the handling of
modifications to the application after it has been deployed. These activities are often
assisted by software. An example of this software support is CONTROL from Eventus
Software. This product is designed to address Web application management challenges
and has strong change-management capabilities including real-time Web application
metadata. This metadata includes information on link-management problems and
deployment history, as well as the ability to check in and check out application content.
Also supported are move, rename, and delete capabilities (CONTROL Overview, 1999).
These capabilities provide basic support for a Web application's change-management
process. The toolset design and prototype implementation will expand the body of
knowledge in all life-cycle areas.
Provide the Design of an Innovative Toolset for the Management of Applications The toolset is an innovation exploration of the management of applications. Toolset
components include procedures that are used to give the task-oriented steps to complete
application-management activities. Programs are also part of this management toolset.
They perform task-oriented activities will little or no human intervention. Views are also a
key part of the toolset. Views are used to assist system administrators and operators in
visualizing activities like deploying a new application or monitoring a running
application. Schema and Data/Information are tightly linked as components of the toolset.
126
Schema defines the application management data and information that is stored in the
MIR. This innovative approach expands the knowledge and practice associated with the
management of applications.
Expand the Capabilities of 15 Key Functional Perspectives in Application Management Fifteen functional perspectives were explored deeply in this study. The perspectives
included Accounting, Administration, Automation, Availability, Business, Capacity,
Change, Configuration, Fault, Operations, Performance, Problem, Security, Service Level,
and Software Distribution. Many of these functional perspectives are legacy network and
systems management disciplines. Some of these perspectives have received recent focus
with applications. Some software vendors, for example Continuus Corporation, provide
powerful change and configuration software backed by professional-services personnel
who work directly with customers and write detailed papers to tell others about it. They
also present at conferences. This helps to bring their story to the marketplace. This study
expands the uses of the functional perspectives and links them directly to the management
of applications.
Integrate with Existing Products in a Seamless Fashion The toolset is part of a computing environment that consists of two domains. Figure 12
shows the application and the management domains. The application domain consists of
application clients and servers running Web applications. These applications use a
browser as a front-end Web interfaces for HTML documents. Often these applications
use back-end database systems rooted in legacy, sometimes mainframe systems (Turner,
1998). The management domain exists to provide management support to the
applications to make it easier to deploy and change them. This management infrastructure

127
can also help improve the application's availability. The management domain contains
management clients that are used to gather availability and performance data. An example
of a product implementation is Global Enterprise Manager (Tivoli Global Enterprise,
1998). Typically, management clients can also issue commands and receive responses.
Management servers provide support for this function.
________________________________________________________________________
Applica tionC lient
Applica tionC lient
Applica tionC lient
Applica tionC lient
Applica tionC lient
B rowser
B rowser
Arch ie
G opher
O ther
Applica tionServer
Applica tionServer
M anagem entS erver
Toolsetfor W ebA pplications M anagem ent
M anagem entC lien t
Applica tion D om ain
M anagem ent D om ain
M IR
issue com m ands,receive responses
pu llinstrum entation sto re
instrum en ta tion
dep loyinstrum enta tion
insta lltoo ls
Figure 12. The toolset and its relationship to the management and application domains ________________________________________________________________________
The toolset integrates with existing management servers and frameworks. It also uses a
Management Information Repository. The MIR provides database support for the
management applications and supports their integration into a single management
environment (Martin, 1996). The database support for this toolset was a relation database
that supports SQL. The toolset works with the management servers to install application
128
instrumentation in a push or pull fashion. It also stores the instrumentation and other
management information like message logs in the MIR.
Summary This chapter contained a review of the literature focused on systems, network, and
applications management. The systems and network management literature provides a
launching point for defining, redefining, and expanding the role of applications
management. The historical overview discussed applications management as an emerging
discipline, the history of applications management, and major research efforts and projects
in the area of the management of applications. The theory portion of the survey explained
management infrastructure such as alerts and toolkits, management standards such as
CORBA and SNMP, management information repositories, and classes of products such
as point or framework. Many standards efforts carried out by the IETF and DMTF are
focused on aspects of applications management, but no comprehensive research project,
consulting methodology or vendor product is available that addresses full life-cycle
management of applications. Some groups and companies have placed focus on the
management of applications during key life-cycle phases like operations and change. ITIL
and the IBM IT Process Model are examples of methodologies that focus on these phases.
This chapter also contained a summary of what is known and unknown about the
management of applications, organized by functional perspectives, starting with
accounting and administration and ending with service level and software distribution.
Some vendor products provide strong availability support for the application. BMC Patrol
has knowledge modules that provide deep availability support for a wide variety of
129
applications like SAP and People Soft. Many other products support key functional
perspectives like configuration, change, problem, security, and service level.
The last major part of this chapter discussed the contribution that this study makes to
the field of applications management. The main contributions are in the areas of
expanding knowledge and capability in full life cycle management, providing the design
of an innovative toolset, expanding the capabilities of 15 functional perspectives such as
accounting and service level, and integrating with existing management products. The
design and prototype work for this toolset is built upon the work of researchers,
consultants, and software vendors.

130
Chapter 3
Methodology Research Methods Employed This study involved the design and implementation of a prototype toolset. The scope of
the design included procedures, programs, views, schema, and data for the research
questions identified in Chapter 1. The implementation of the prototype included the five
detailed scenarios that are documented below and supported the Toolset Evaluation
Survey in Appendix B. This project used ideas from Joint Application Design and Rapid
Application Development methodologies. JAD was used to devise and validate a list of
toolset components that were developed. RAD was used to determine the manner that the
prototype toolset components were developed. The use of these two techniques fostered
an effective design and rapid development experience. After the toolset was designed and
implemented, it was evaluated using data collected from 33 participants.
Specific Procedures Employed This research was completed using three main steps. During the design step, a
comprehensive design of the toolset was created. Next, the prototype toolset was created
and tested during the implementation step. Finally, the toolset was assessed during the
evaluation step. Each of these steps is explained in detail in the paragraphs that follow.
Design the Toolset Using JAD techniques described in Chin (1995), a comprehensive design of the toolset
was created. The design was created through JAD sessions conducted by the researcher
with participants skilled in application, middleware, and database management. The JAD
technique, as reported by Purvis and Sambamurthy (1997), was used because that
131
methodology was expected to promote richer design interactions among the participants
during the design process. Jackson and Embley (1996) incorporated the use of an analysis
model, specification language, and tools to create a JAD variant with a technology focus.
Structured analysis techniques were used to explore and analyze the requirements for
the prototype toolset using the research questions documented in the section labeled
Hypotheses and Research Questions to Be Investigated in Chapter 1. Specifically, there
were twenty-three research questions that were explored during the design step. These
research questions served as a starting point for the design and were expanded upon as
required. The design sessions were conducted using a series of conference calls. The
sessions leveraged an electronic TeamRoom that was a repository for all design step work
products. The TeamRoom fostered collaboration among the participants. The TeamRoom
was the repository of documents in the following five key categories:
1. Design meeting agenda
Two design meetings were conducted. Each meeting had a detailed agenda. The focus
of the first meeting was to introduce the team to the basic project concepts and to review
the primary and secondary research questions. The research questions were used to
identify toolset components that were later designed. The second meeting was used to
continue the work started in the first session and to complete the conversion of research
questions into toolset components. At the completion of the design meetings, a
comprehensive list of toolset components was identified. These programs, procedures, and
views were the toolset components that were designed by this researcher in a detailed
manner.
132
2. Design meeting minutes
Minutes were documented after each of the two design meetings and distributed for
review to the design team. The minutes contained a record of the detailed ideas and
recommendations that were discussed during the meetings. The minutes served as a tool to
connect the meetings until the preliminary toolset components were completely identified.
3. Design documentation for the toolset
The design documentation consisted of one document in the TeamRoom for each
toolset component. This design documentation was created by the researcher and
reviewed by the design team until it reached its final form. The researcher collaborated
on the design with the design team members and typically received input from at least one
design team member for each component before it was finalized. A summary table for
each type of toolset component was also created. The summary table included all the
toolset components and was organized by subsystem within application perspective as this
was the main organizational approach used for the development of the toolset.
4. Comprehensive design document
After the toolset component documentation was completed, it was organized into a
single comprehensive document. The document was called Comprehensive Design for a
Prototype Toolset for Full Life-Cycle Management of Web-Based Applications. This
design document is summarized in Chapter 4. The design document included the detailed
design of the toolset components as well as other information that is usually found in a
design document including system background, system overview and technical
architecture (External Design, 1996).

133
5. Log of key correspondence and other work products
A log of important e-mail correspondence was also stored in the TeamRoom (see Table
9). This included copies of e-mail associated with the design of specific toolset
components and other intermediate work products associated with the design of the
toolset.
Table 9. Proposed Category and Documents for the TeamRoom
Category Document
Design meeting agenda
Agenda for first design session and second design session
Design meeting minutes
Minutes from the first and second design sessions
Design documentation for the toolset
Summary and detailed documents for programs, procedures, views, schema, and data
Log of key correspondence and other work products
E-mail correspondence associated with toolset elements, presentation used for first design meeting, and presentation used for second design meeting
Additional design work products were stored there including materials used for the design
meetings and reviews. A summary of the categories used and key document names are
shown in Table 9.
After the design was completed, the next step was to transform the design into logical
entities called application segments. Segmentation is focused on function and sequence
and allows the application to be used in the order delivered (Hough, 1993). A segment
strategy was developed because it was needed to determine the order in which the
prototype toolset components were developed. This was particularly important because
134
only a subset of the toolset components designed were developed in a prototype manner.
The subset of toolset components were those toolset components necessary to complete
the toolset evaluation goals of the project. Application segmentation provided a way to
organize the components that were developed into groups that were straightforward to
develop, test, and deploy. Hough (1993) recommended that the user interface be built first
to reduce the risk associated with changing requirements. This advice was followed and
other activities like database design followed the development of the user interface. The
segment strategy is discussed in Chapter 4.
Implement the Toolset The first implementation step was to create a plan for the development steps. The
researcher was the primary developer of the prototype toolset so an elaborate plan was not
required. However, the importance of project planning and management in the success of
a project is well documented in the literature (Cleland & Gareis, 1994) so this step was
not eliminated. Next, RAD techniques, as described by Hough (1993) were used to
develop, deliver, and integrate the procedures, programs, views, schema, and data for the
prototype toolset. Initially, it was anticipated that the toolkit programs were to be
developed using scripting languages to handle grouping of commands and platform-
dependent operations. It was anticipated that a scripting language such as Awk would be
used (Gilly, 1994). It was also expected that some programs would be developed in Java
because Java is built on familiar constructs and is a portable language (Jackson &
McClellan, 1996). Almost no scripting was required to complete the implementation
work because of the built in capabilities of the database software and the HTML editor
used to build the toolset. Procedures were developed using plain text and placed directly

135
into the HTML views. For a commercial implementation of this toolset they would be
placed in the Application MIR. It was originally anticipated that the toolset views would
be prototyped using a NetView client system. Although NetView is a network-
management tool, the graphical user interface had the flexibility necessary to build
application views. This approach was discarded and a HTML editor was substituted so
that the browser that is built into every computer system today could be used. Schema was
developed using relational database software. The dictionary for the schema was
documented and can be found in Appendix H. Data and information was stored in tables
and accessed using Microsoft SQL. The toolkit components of each segment were tested
in a unit fashion as testing is an important step in the development process (Kroenke &
Dolan, 1987). The toolset components developed to support the five scenarios and related
toolset evaluation are summarized in Chapter 4.
Evaluate the Toolset
Evaluation of the toolset was an important task in this project. The evaluation
methodology for the project was based on concepts adapted from Boloix and Robillard
(1995). The researchers' article explained an evaluation approach that involved three
dimensions--project, system, and environment. The project dimension characterized
project efficiency using three factors. The factors were process, agent, and tool. Since the
development of the toolset was not a large development effort involving many
individuals, the project dimension was not used in this project's evaluation survey.
The system dimension focused on the product, its performance, and the technology it
utilizes. The first question in the evaluation survey for this project was derived from the

136
product factor. The product factor was used to assess the intrinsic software system
attributes regarding product understandability. The first survey question was:
1. Which best characterizes how easy it was to understand how the toolset handles this
scenario?
_ A lot of effort to understand
_ A moderate amount of effort to understand
_ A minimum effort to understand
The second question in the evaluation survey for this project was derived from the
technology factor. The technology factor was used to assess how well operators and
system administrators have mastered the technology used by the system. The second
survey question was:
2. Which best characterizes the level of sophistication of the toolset in the way it
handled this scenario?
_ Low
_ Sufficient
_ High
The last dimension discussed in the paper was the environment dimension. This
dimension focused on the level of satisfaction with the software system and the
contribution that the system can make to the organization. An important factor is
compliance which measures how well the software system meets requirements. The third
survey question in the evaluation survey for this project was derived from the compliance
factor. The third survey question was:
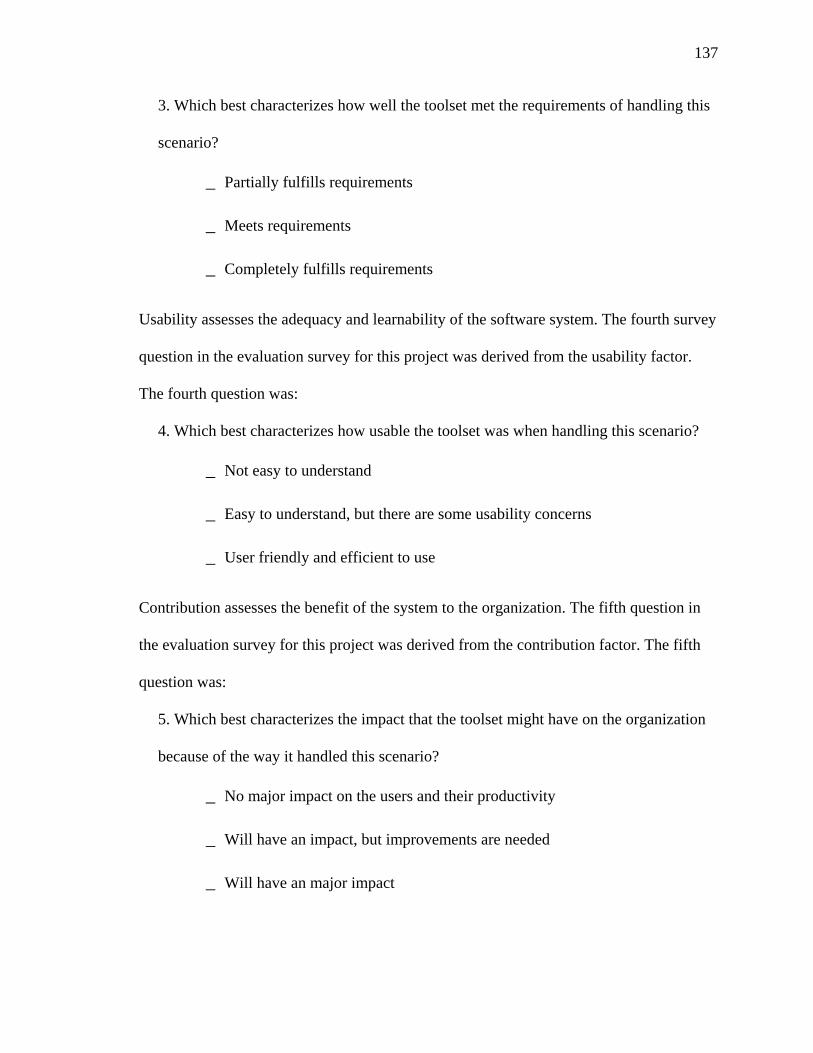
137
3. Which best characterizes how well the toolset met the requirements of handling this
scenario?
_ Partially fulfills requirements
_ Meets requirements
_ Completely fulfills requirements
Usability assesses the adequacy and learnability of the software system. The fourth survey
question in the evaluation survey for this project was derived from the usability factor.
The fourth question was:
4. Which best characterizes how usable the toolset was when handling this scenario?
_ Not easy to understand
_ Easy to understand, but there are some usability concerns
_ User friendly and efficient to use
Contribution assesses the benefit of the system to the organization. The fifth question in
the evaluation survey for this project was derived from the contribution factor. The fifth
question was:
5. Which best characterizes the impact that the toolset might have on the organization
because of the way it handled this scenario?
_ No major impact on the users and their productivity
_ Will have an impact, but improvements are needed
_ Will have an major impact
138
The evaluation survey for this study was reviewed and approved by the IRB
representative (J. Cannady, personal communication, September 24, 2001). The complete
survey can be found in Appendix B. Appendix C contains the Institutional Review Board
Documents including the letter of approval and consent form that was used with each
participant. The survey was administered to personnel who are familiar with the operation
and management of Web sites. Prior to completing the survey, participants were shown a
a collection of materials for each scenario, such as Web application operational fault, and
were then asked to complete a series of questions. The materials were taken directly from
the toolset procedures, program outputs, views, and data. The five scenarios included:
1. Web application operational fault
In this scenario, the Web application experiences a database failure and an event is
generated and captured by the toolset. The failing application has been instrumented to
invoke a toolset program that gathers failure data and makes it available to the system
administrator and support personnel.
2. Web application deployment is unsuccessful
In this scenario, the deployment of the Web application is initiated by the
administrator. The deployment is unsuccessful and the failure is detected by the toolset.
After detection, the toolset procedure guides the administrator through the steps to resolve
the problem and transfers the fault to the problem-management system as a closed
problem.
3. Web application change results in poor performance
139
In this scenario, new functionality is installed for a Web application. After the change,
the new function is operational, but poor application performance results. The
administrator uses toolset views to get a clear understanding of the problem and transfers
the problem to the development team for resolution.
4. Web application experiencing bottlenecks as some queries take a long time
In this scenario, certain inquiry functions of the Web application are taking a long time
to complete. The toolset is used to detect the database functions that were performing
poorly and the problem is transferred to the developers who must change the application
source code or modify the underlying database structure to improve the performance of
the SQL commands.
5. Overall response for the Web application is slow, but the application is still functional
In this scenario, the Web application is performing slowly, but all components are
available. The toolset's deep availability capability is used to determine the root cause of
the overall poor performance. In this scenario, several simultaneous problems are the
cause of the slow overall response.
Formats for Presenting Results The results of this study are included in four main work products. The first work
product is the primary design document of this project called Comprehensive Design for a
Prototype Toolset for Full Life-Cycle Management of Web-Based Applications. This
document is summarized in Chapter 4 of this Final Dissertation Report. This document
contains the design for all toolset components that resulted from the primary and
secondary research questions. The second work product is the segment strategy, which

140
explains what components were developed and in what order, is also included in Chapter
4. The segment strategy narrative was an important RAD work product in this project.
The third work product is the toolset components developed to support the five
scenarios and related toolset evaluation. These items are also summarized in Chapter 4.
The fourth and last work product of this study is the analysis of the data collected during
the toolset evaluation survey. The survey contained five questions that were administered
to participants each time they reviewed one of the five scenarios. The data for the survey
are also discussed in Chapters 4 and 5.
Projected Outcomes It is expected that the toolset components that resulted from this study will be used as
the basis for several service capabilities to be offered as part of IBM's Web Hosting
offerings. These offerings will focus on improving the availability of Web applications,
middleware, and database components of a customer's Web site. The work to improve the
availability of components high in the application dependency stack (Hurwitz, 1996) is
also expected to be linked to problem-determination procedures and tools.
It is also expected that results of this research will continue to generate technical
papers that will improve the way that Web sites are monitored and managed. Early in
2001, two papers were published that were the direct result of this research. Gulla and
Hankins (2001) defined a framework that can be used to evaluate the quality and
completeness of the monitoring and management of a Web site. The approach, which was
supported by a methodology was based on a series of "perspectives" that incorporated a
comprehensive view of tools, processes, organizational structure, and staff skills. In
another paper, Gulla and Siebert (2001) explained an activity that makes it possible to
141
plan for the successful implementation of monitoring for a customer's Web site. The
method, called Monitoring Implementation Planning, was put into practice in the South
Service Delivery Center for fully managed Universal Server Farm customers.
In 2002, two other papers were published based on ideas from this research. Ahrens,
Birkner, Gulla, and McKay (2002) documented case studies in Web application
availability and problem determination. The simple tools used in those case studies are
similar to the toolset programs and procedures used for the full life-cycle prototype. Gulla
and Hankins (2002) expanded the ideas contained in Figure 4, applications management
as part of a comprehensive approach, into a framework to address the challenges of
managing high availability environments.
Resource Requirements The facilities that were used to complete the dissertation included hardware, software,
data, procedures, and people. The method used to describe the required resources is based
on Kroenke and Dolan (1987).
Hardware The hardware that was used to complete the project included a personal computer to
develop and run the toolset and function as both an application and management client
(see Table 10). The personal computer was a ThinkPad 760 EL machine with 64
megabytes of RAM and a 2.1 Gigabyte disk (IBM ThinkPad, 1996). A Sun workstation
was used as a management server. The Sun workstation was a SPARCstation V with 64
megabytes of RAM and a 2-Gigabyte disk (SPARCstation 5, 1996).

142
Table 10. Hardware Used for the Creation of the Toolset
Hardware Activity Role
ThinkPad Unit development and testing
Management client and server
Sun workstation Integration and testing Management server and application server Software A variety of software was used in this dissertation project. A summary of the software
used is shown in Table 11. Microsoft Word was used to document requirements and to
create design documentation. For toolset design, Microsoft PowerPoint was used to create
drawings that were imbedded in Word documents. For toolset development, a Web
development tool which included an HTML editor was used. For database development,
database utilities that are part of Microsoft Access were used. TCP/IP was used for the
network protocol, as it is native to Web applications and contains many powerful
commands like Telnet and FTP.
Table 11. Software Used for the Creation of the Toolset
Software Activity Role
Microsoft Word Design through evaluation
Create documentation
Microsoft PowerPoint Design through evaluation Create drawings
Scripting Tool Development Create toolset
TCP/IP Development through integration
Transfer files and other network utilities
Tivoli Framework Development Toolset support
Tivoli Distributed Monitoring Development
Toolset support

143
Table 11. (continued)
Software Activity Role
Tivoli Software Distribution Development
Toolset support
Microsoft Access Development
Toolset support
Domino Server Development
Toolset support
E-Commerce Construction Kit Development
Toolset support
Netscape Navigator Development
Toolset support
The Tivoli Framework and systems management applications were used including
Distributed Monitoring and Software Distribution. These applications provided a base for
the toolset development. Distributed Monitoring was used as a general purpose
monitoring engine. Software Distribution was used as the utility that supported the
Automated Installation and Configuration subsystem. Microsoft Access, a relational
database was used for the MIR. For the Web environment, the server software used was
Domino Server. Application pages were composed using the E-Commerce Construction
Kit and displayed using Netscape Navigator.
Data Data for this project were stored in a repository called the Full Life-Cycle Toolset
MIR. Microsoft Access, a relational database, was used for this purpose. Data stored in
the database included toolset components, event logs, component descriptions, component
relationships, and other items identified during the design sessions. The use of this
database allowed SQL queries to be written to extract data from the MIR.

144
Procedures Procedures were developed and used in the prototype toolset scenarios. These
procedures were used in each of the five scenarios that can be found in Appendix E,
Survey Materials Used for the Toolset Evaluation. The scope of the procedures included
the full life-cycle support of the management of the application, as well as toolset
operation, integration with other software, and problem determination. Procedure
requirements and design were documented in the Comprehensive Design for a Prototype
Toolset for Full Life-Cycle Management of Web-Based Applications which are
summarized in Chapter 4.
People For this project, a team of Web professionals assisted through participation in the JAD
sessions. The design team also provided support during the implementation of the
prototype toolset. The design team was skilled in application, middleware, and database
availability and problem determination. Web operations support personnel and system
administrators were also the subjects who participated in the toolset evaluation.
Reliability and Validity A statistically significant number of observations were gathered during the toolset
evaluation step. Thirty three of 40 participants responded to the survey. The sample
population was diverse and experienced as shown by Figures 15 and 16 as well as Table
35 which can be found in Chapter 4. Analysis of the sample was performed using
descriptive statistics for an opinion/fact survey as part of a summative evaluation. Two
approaches were taken to the organization of the data for analysis. The first approach
examined the data in a scenario-by-scenario manner. Descriptive statistics were used in
145
the analysis including count, cumulative percentages, and ranking. Ranking was used to
determine the toolset prototype scenarios that were more successful than others. This
analysis can be found in Tables 36, 37, 38, 39, and 40 in Chapter 4.
The second approach that was used examined the data based on the survey questions
across all the scenarios. This approach made it possible to examine the participant's
response to questions about the toolset's ease of understanding, level of sophistication,
meeting of requirements, usability, and potential impact of its use independent of the
scenario that was used to demonstrate toolset functionality. Descriptive statistics were
used in the analysis including average, minimum, maximum, and ranking. Ranking was
used to determine the toolset characteristics, like ease of understanding, that were more
successful than others. This analysis can be found in Table 42 in Chapter 4.
Summary The main steps used to carry out the project included design, implementation, and
evaluation. The design activities leveraged JAD techniques and involved the researcher
leading several design sessions with participants skilled in application, middleware, and
database management. After the JAD activity was completed, a RAD approach was used
to plan and implement the toolset prototype that was used in the evaluation step. A RAD
planning tool called a segment strategy was used to organize the work that would be done
to implement the toolset. The segment strategy made it straightforward to use the JAD
design outputs to create a prototype toolset that was a meaningful subset of the
comprehensive design that was created. The design work products are summarized in
Chapters 4 and 5 along with the segmentation strategy that was developed during the
implementation step.

146
After the segment strategy was completed, toolset components were developed to
support the five scenarios and the related toolset evaluation. Web pages (toolset views)
used for the management of Web applications were built using a HTML editor called E-
Commerce Construction Kit. Toolset procedures were developed and documented in the
Web pages that were used for the prototype toolset. These procedures provided structure
and organization to the toolset scenarios. The procedures were used early in each scenario
to explain the approach to be taken and then were used throughout the scenario. See
Appendix E, Survey Materials Used for the Toolset Evaluation, for a view of the
procedures developed for the prototype. A MIR was built using Microsoft Access, a SQL
database that contained the 15 database tables that were needed to support the prototype.
The prototype was developed on a personal computer (Thinkpad) that was supported by a
Sun server running the UNIX operating system. The project's hardware provided the
necessary support for the software chosen and was sufficiently powerful to develop and
test a prototype with a large number of Web pages, framesets, and database tables.
A survey was used during the evaluation step to gather data from the survey
participants about their understanding of the prototype toolset. The data collected was
analyzed in a scenario-by-scenario approach and a question-by-question approach to
determine the scenarios and characteristics of the toolset that were more effective than
others. The results of the analysis are discussed in detail in Chapter 4. Chapter 5 also uses
the results of the analysis in a detailed way in the context of the research questions and
hypotheses of this study.

147
Chapter 4
Results Introduction This study was conducted during the period from February 2001 to May 2002. During
that period, activities were carried out and work products were produced that focused on
the design, development, testing, and evaluation of a prototype toolset for the full life-
cycle management of Web applications. The prototype toolset that was developed was a
subset of the full toolset that was designed during this project. Specifically, the toolset
components that were developed were those components needed to support one of the five
scenarios that were used during the toolset-evaluation phase of this project. Although only
a subset of the toolset components were developed and tested, all programs, procedures,
views, and schema were designed.
The complete toolset design was documented in a design notebook called
Comprehensive Design for a Prototype Toolset for the Full-Life Cycle Management of
Web-Based Applications. This design document is summarized in this chapter. The
participants in the study evaluated the prototype toolset that was developed and tested.
More than 40 study participants were asked to review five scenarios and complete a five-
question survey for each of the five scenarios. The review of the scenarios was completed
using a package of materials that consisted of printed versions of toolset components
including procedures, views, and data. The results of the survey are discussed in detail in
this chapter. The key parts of the survey materials are included in Appendix E of this
document.

148
In order to manage the transition from comprehensive design to subset implementation,
a segment strategy was developed. The segment strategy is a RAD technique used to
develop the approach to deliver a usable segment or subset of a system’s functionality to a
community of users (Hough, 1993). For this development project, a subset was needed
which specifically met the needs of the study scenarios. The segment strategy for this
project also explained the development sequence that was used and identified the toolset
components needed for each study scenario. As described by RAD researchers, one of the
first activities typically involves the creation of the user interface (Carter, Whyte,
Birchall, & Swatman, 1997). The complete segment strategy is documented in this chapter
of the document.
Presentation of Results The presentation of results for this dissertation is directly related to the specific
procedures employed in Chapter 3. The toolset design portion of this chapter documents
and summarizes the specific procedure from Chapter 3 called Design the Toolset. The
summary explains the programs, procedures, views, schema, and data that were designed
to create a comprehensive toolset for the full life-cycle management of Web applications.
The toolset implementation portion of this chapter documents the implementation
activities and the toolset components that were developed to support the five scenarios.
This is directly related to the procedure in Chapter 3 called Implement the Toolset. This
portion of the report also documents the experiences and techniques using commands,
view-building tools, and database software.
The toolset evaluation portion of this chapter documents and explains the results of the
activity that was focused on gathering data from survey participants regarding toolset
149
performance, technology, and level of satisfaction with the software and the contribution
that the system will make to the organization. This part is directly related to the procedure
in Chapter 3 called Evaluate the Toolset. This chapter also contains a detailed discussion
of the findings of this study. The chapter concludes with a summary of results.
Analysis This part of the chapter contains three sections. The three sections are toolset design,
toolset implementation, and toolset evaluation. Each section relates to the specific
procedures employed as described in Chapter 3.
Toolset Design Three parts make up this summary of the toolset design. Part 1, Overall System
Summary, explains the toolset components in the context of a single system containing 19
subsystems providing functionality in support of 15 functional perspectives. Part 2,
Subsystem Summary, explains in detail the components that make up the individual
subsystems. This part is organized by functional perspective as each perspective is
supported by one or more subsystems. Part 3, Segment Strategy, contains the segment
strategy that was used to guide the development and testing of the prototype toolset.
Overall System Summary The design for the toolset was created using a series of Joint Application Design
sessions. The design sessions were conducted with a number of participants who are
familiar with the challenges of developing and managing applications. Prior to the design
sessions, research was done to identify the functional perspectives that would be the focus
of the design activities. The term functional perspective was used by Sturm and Bumpus
(1999) and means roughly the same thing as discipline and process. Both discipline and
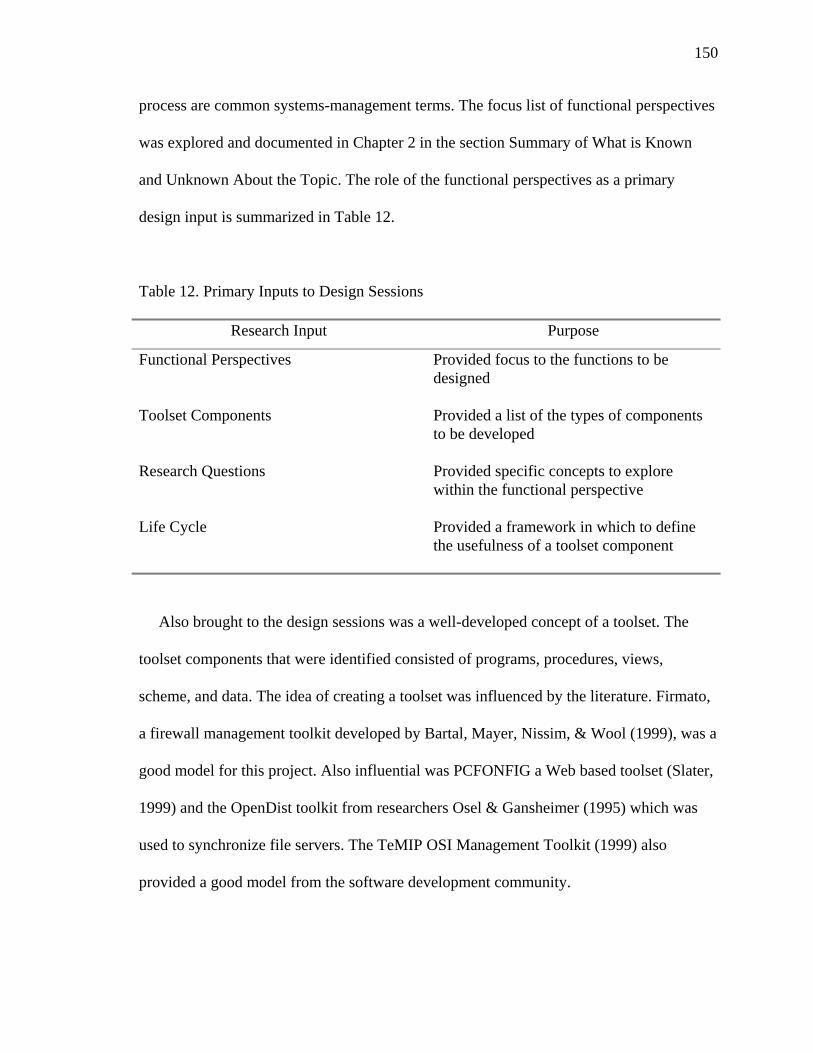
150
process are common systems-management terms. The focus list of functional perspectives
was explored and documented in Chapter 2 in the section Summary of What is Known
and Unknown About the Topic. The role of the functional perspectives as a primary
design input is summarized in Table 12.
Table 12. Primary Inputs to Design Sessions
Research Input Purpose
Functional Perspectives Provided focus to the functions to be designed
Toolset Components Provided a list of the types of components to be developed
Research Questions Provided specific concepts to explore within the functional perspective
Life Cycle Provided a framework in which to define the usefulness of a toolset component
Also brought to the design sessions was a well-developed concept of a toolset. The
toolset components that were identified consisted of programs, procedures, views,
scheme, and data. The idea of creating a toolset was influenced by the literature. Firmato,
a firewall management toolkit developed by Bartal, Mayer, Nissim, & Wool (1999), was a
good model for this project. Also influential was PCFONFIG a Web based toolset (Slater,
1999) and the OpenDist toolkit from researchers Osel & Gansheimer (1995) which was
used to synchronize file servers. The TeMIP OSI Management Toolkit (1999) also
provided a good model from the software development community.

151
The toolset components themselves were chosen for their appropriateness for the
management of Web applications. The toolset components and their relationship to one
another was explained in Chapter 1 and summarized in Figure 3. The role of the toolset
components as a primary design input is summarized in Table 12. The other important
inputs that helped to structure the design activities were the twenty-three research
questions documented in Chapter 1. These research questions, in particular the secondary
research questions numbered 4 through 23, were used to explore the creation of the
subsystems which provided support to the functional perspectives. The role of the
research questions as a primary design input is summarized in Table 12.
Finally, the well-known concept of the application life cycle was considered during the
design sessions. The life cycle explored consisted of design, construction, deployment,
operations, and change phases. These life-cycle steps are sometimes given different
names, but the activities are fundamentally the same. During the design phase, the
application is explained in a detailed design document. Sometimes, a prototype is created
to make it easier to understand the proposed application. During construction the
application is developed and tested. During deployment the application is installed on
servers and made available to its users after training is conducted. The operations phase
begins when the application is available for regular use. Finally, the change phases is
invoked when an operational application is changed to fix errors or to make new
application function available to its users. The role of the application life cycle as a
primary design input is summarized in Table 12.
The design sessions were conducted as a series of meetings with the design
participants. These meetings were JAD sessions. Between meetings, communication was

152
facilitated by electronic mail that made use of a shared documentation database used
exclusively for this project. Project communications, meeting agendas, meeting minutes,
presentations, and design work elements were stored in a document database called a
TeamRoom. Using the important ideas from the design sessions, a comprehensive design
was created. An example of the JAD materials that were used in the first JAD session
called Background and Brainstorming JAD Materials can be found in Appendix F.
The comprehensive design for the toolset was collected in a design notebook called
Comprehensive Design for a Prototype Toolset for Full Life-Cycle Management of Web-
Based Applications. From a system point of view, the design contains a large number of
toolset components organized by subsystems within functional perspectives. Some
functional perspectives are supported by more that one subsystem. The subsystem
approach was used because a subsystem is usually capable of operating independently or
asynchronously (Dictionary of Computing, 1987) and this common way of organizing a
system was a particularly good match for this toolset.
The system that resulted from the design was called the toolset for full life-cycle
management of Web-based applications. The system contains 19 subsystems. Table 13
summarizes the subsystems in support of the 15 functional perspectives.
Table 13. Functional Perspectives and Related Subsystems
Functional Perspective Subsystem (s)
Accounting Resource Modeling Resource Accounting
Administration Automated Installation and
Configuration Configuration Verification
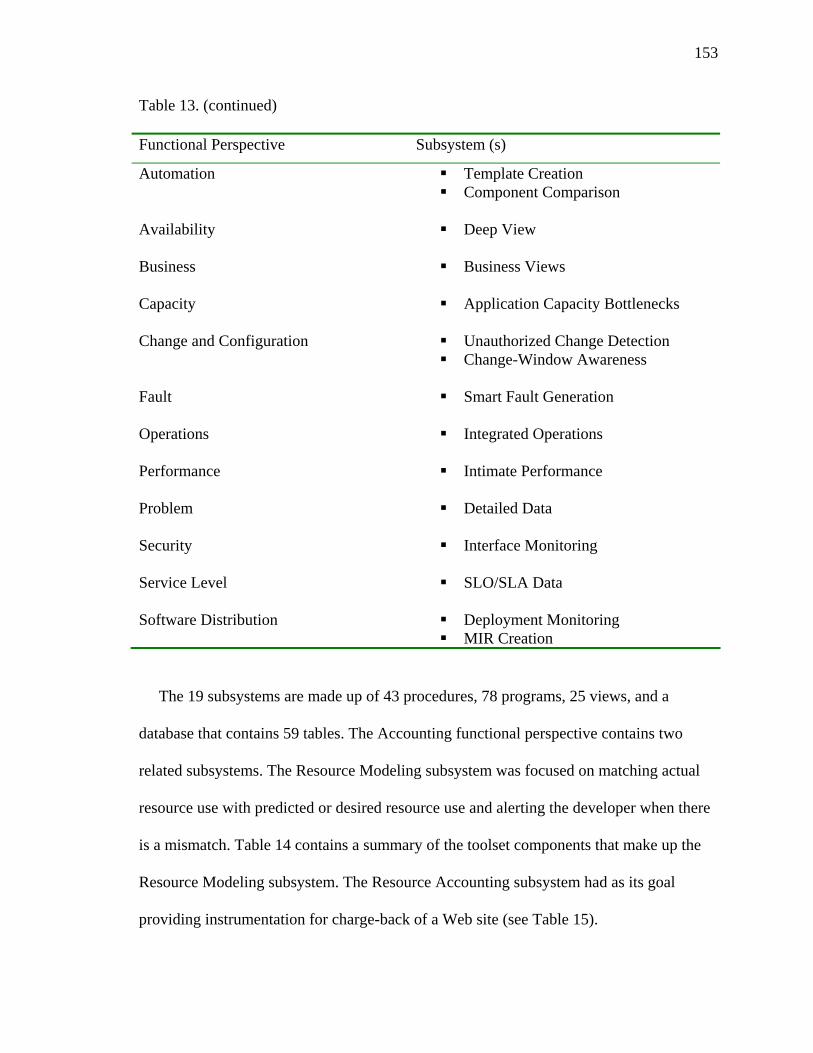
153
Table 13. (continued)
Functional Perspective Subsystem (s)
Automation Template Creation Component Comparison
Availability Deep View
Business Business Views
Capacity Application Capacity Bottlenecks
Change and Configuration Unauthorized Change Detection
Change-Window Awareness
Fault Smart Fault Generation
Operations Integrated Operations
Performance Intimate Performance
Problem Detailed Data
Security Interface Monitoring
Service Level SLO/SLA Data
Software Distribution Deployment Monitoring MIR Creation
The 19 subsystems are made up of 43 procedures, 78 programs, 25 views, and a
database that contains 59 tables. The Accounting functional perspective contains two
related subsystems. The Resource Modeling subsystem was focused on matching actual
resource use with predicted or desired resource use and alerting the developer when there
is a mismatch. Table 14 contains a summary of the toolset components that make up the
Resource Modeling subsystem. The Resource Accounting subsystem had as its goal
providing instrumentation for charge-back of a Web site (see Table 15).

154
The Administration functional perspective has two subsystems. The Automated
Installation and configuration subsystem was designed to completely automate the
installation and configuration of a Web application (see Table 16). The Configuration
Verification subsystem was designed to verify the administrative settings of a Web
application in support of problem solving (see Table 17). The Automation functional
perspective has two subsystems. The Template Creation subsystem was focused on
productivity through the creation of operational templates like start, stop, and restart
scripts and management schema (see Table 18). The Component Comparison subsystem
was designed to compare designed to actually installed components as an aid in finding
implementation errors or omissions (see Table 19).
The Availability functional perspective has one subsystem. The Deep View subsystem
was designed to provide a deep treatment of availability to include responsiveness,
stability, and usage measurements (see Table 20). The Business functional perspective has
one subsystem. The Business Views subsystem was focused on representing a logical
collection of applications as a business system (see Table 21). The Capacity functional
perspective has one subsystem. The Application Capacity Bottlenecks subsystem
examined the application, database, and middleware components necessary to determine
application capacity (see Table 22).
The Change and Configuration functional perspectives have two subsystems. The
Unauthorized Change Detection subsystem was centered on creating a capability for the
application to detect unauthorized changes to itself (see Table 23). The Change-Window
Awareness subsystem was designed to make it possible for an application to suppress
certain kinds of application-generated faults (see Table 24). The Fault functional

155
perspective has one subsystem. The Smart Fault Generation subsystem was designed to
optimize the creation of application faults utilizing minimal inputs (see Table 25).
The Operations functional perspective has one subsystem. The Integrated Operations
subsystem was designed to have an application view for helpdesk personnel that included
job scheduling, backup status and history, and status of key print and file outputs (see
Table 26). The Performance functional perspective has one subsystem. The Intimate
Performance subsystem utilized a proxy to gather performance data instead of modifying
the application to make calls to a performance-measurement tool (see Table 27). The
Problem functional perspective has one subsystem. The Detailed Data subsystem was
focused on providing meaningful and detailed data to the problem-management system
(see Table 28).
The Security functional perspective has one subsystem. The Interface Monitoring
subsystem was designed to provide a view with supporting probes to monitor and report
on key security interfaces (see Table 29). The Service Level functional perspective has
one subsystem. The SLO/SLA Data subsystem was designed to provide an application-
independent tool to collect and report service-level objective and service-level agreement
information (see Table 30). The Software Distribution functional perspective has two
subsystems. The Deployment monitoring subsystem was centered on monitoring mission-
critical distributions (see Table 31). The MIR Creation subsystem was a design for a set of
tools to populate the MIR with information in support of package distributions (see Table
32).
156
Subsystem Summary This part of the report contains a summary of each subsystem that was created as part
of the comprehensive toolset design. Each subsystem is summarized in the context of the
functional perspective that it supports. A description is included of each program,
procedure, view, and table component that was part of the design of the subsystem.
Support for the Accounting Functional Perspective The Resource Modeling and the Resource Accounting subsystems support the
Accounting perspective. The purpose of the Resource Modeling subsystem is to allow a
developer or user to specify the resources they intend the Web application to use and the
toolset will alert them when the threshold is exceeded. In this way, this subsystem
supports a high-level modeling activity involving resources like memory and processors.
Fosdick (1998) described the resource accounting capability of a commercial product
called Unicenter TNG. The Resource Modeling subsystem is similar to Unicenter TNG in
that it tracks resource usage, but the focus is workload modeling not simple accounting for
resource consumption for charge back purposes.
Toolset components from this subsystem can be used during design, construction,
deployment, operations, and change phases. For example, the Resource Utilization
Optimization procedure is useful for providing strategies for making the best use of disk,
memory, processor, and I/O at the design phase of developing the Web application. The
Resource Modeling subsystem is supported by eight toolset components including two
programs, two procedures, one view, and three required database tables. Two optional
database tables are also included as part of this subsystem. A summary of the components
that were designed for this subsystem is shown in Table 14.
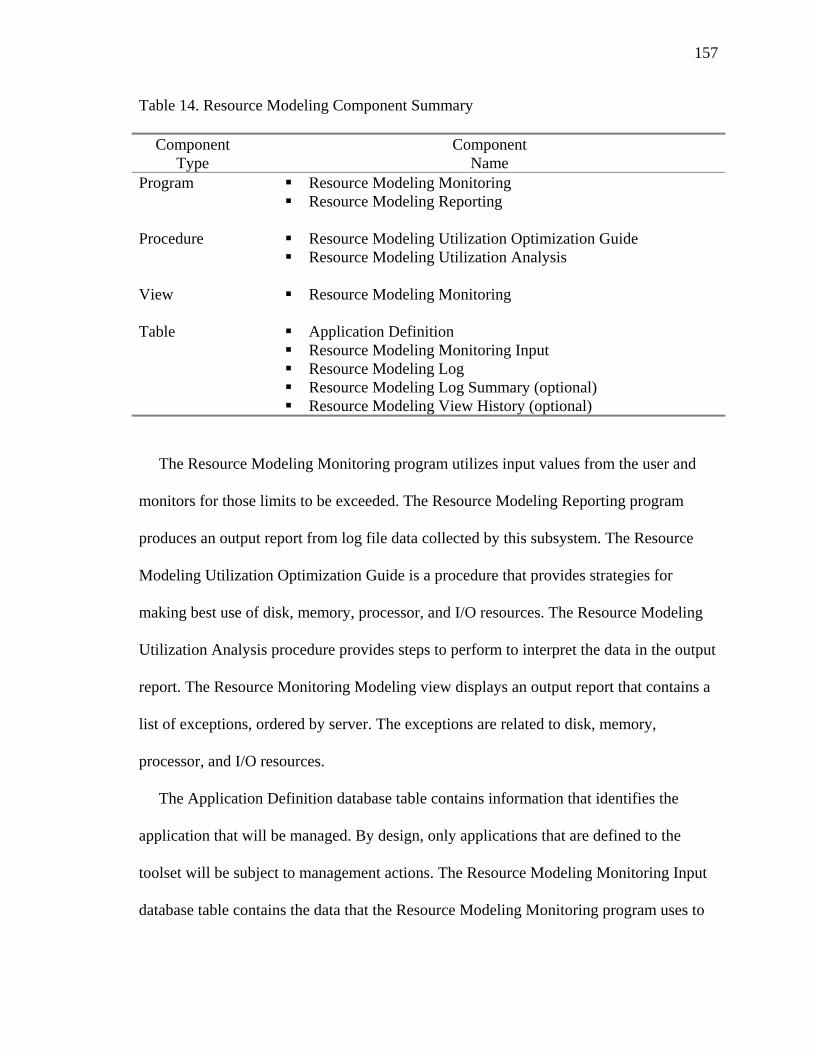
157
Table 14. Resource Modeling Component Summary
Component Type
Component Name
Program Resource Modeling Monitoring Resource Modeling Reporting Procedure Resource Modeling Utilization Optimization Guide Resource Modeling Utilization Analysis View Resource Modeling Monitoring Table Application Definition Resource Modeling Monitoring Input Resource Modeling Log Resource Modeling Log Summary (optional) Resource Modeling View History (optional)
The Resource Modeling Monitoring program utilizes input values from the user and
monitors for those limits to be exceeded. The Resource Modeling Reporting program
produces an output report from log file data collected by this subsystem. The Resource
Modeling Utilization Optimization Guide is a procedure that provides strategies for
making best use of disk, memory, processor, and I/O resources. The Resource Modeling
Utilization Analysis procedure provides steps to perform to interpret the data in the output
report. The Resource Monitoring Modeling view displays an output report that contains a
list of exceptions, ordered by server. The exceptions are related to disk, memory,
processor, and I/O resources.
The Application Definition database table contains information that identifies the
application that will be managed. By design, only applications that are defined to the
toolset will be subject to management actions. The Resource Modeling Monitoring Input
database table contains the data that the Resource Modeling Monitoring program uses to

158
control its operations. The Resource Modeling Log database table is used as a repository
of output messages that contain the details associated with modeling exceptions.
Two optional database tables are included as part of this subsystem and are represented
in many of the other toolset subsystems. The Resource Modeling Log Summary database
table contains information about the data contained in the Resource Monitoring log. This
summary information is updated periodically by a toolset support utility that makes it
possible to query about the start and end dates of data in the MIR, as well as the number
of specific types of exceptions, by simply accessing the summary information. The
Resource Modeling View History database table is another optional database table. This
database table contains the information that was displayed in previously examined HTML
views. This database table functions as a view history mechanism. A view history is
automatically saved upon each use of the reporting programs. The default number of
saved views is 99. If necessary, as a new view is added, an older saved view is discarded.
The second subsystem, Resource Accounting, is used to instrument an application for
accountability so that the application usage can be charged-back to the internal groups
that use the application. A variety of event types can be used to generate charge back data
including log on, log off, query, update, and browse. User defined event types are also
supported. The idea of creating a utility to support charge back was influenced by the
Application Response Measurement API as described by Sobel (1996c). The application
Response Measurement API is a performance tool that provided a model for how a simple
API could be used to gather application-specific data. Other products influenced the
design of the Resource Accounting subsystem like UniSolutions Associates JobAcct
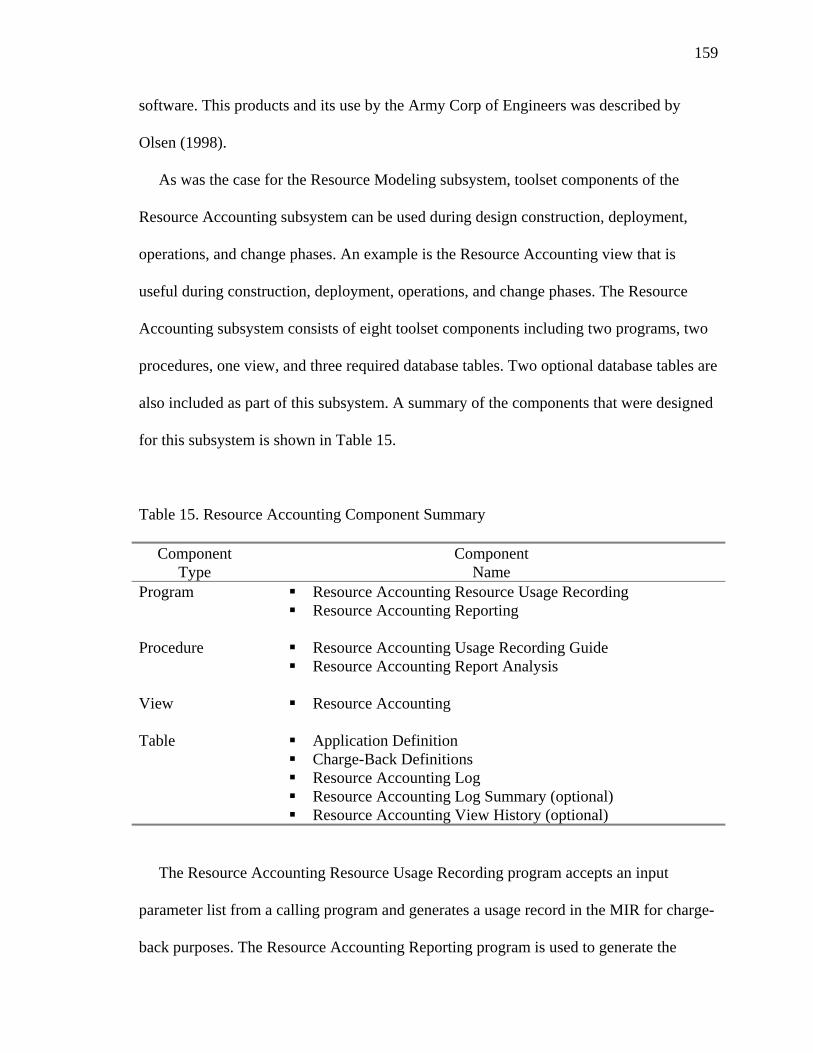
159
software. This products and its use by the Army Corp of Engineers was described by
Olsen (1998).
As was the case for the Resource Modeling subsystem, toolset components of the
Resource Accounting subsystem can be used during design construction, deployment,
operations, and change phases. An example is the Resource Accounting view that is
useful during construction, deployment, operations, and change phases. The Resource
Accounting subsystem consists of eight toolset components including two programs, two
procedures, one view, and three required database tables. Two optional database tables are
also included as part of this subsystem. A summary of the components that were designed
for this subsystem is shown in Table 15.
Table 15. Resource Accounting Component Summary
Component Type
Component Name
Program Resource Accounting Resource Usage Recording Resource Accounting Reporting Procedure Resource Accounting Usage Recording Guide Resource Accounting Report Analysis View Resource Accounting Table Application Definition Charge-Back Definitions Resource Accounting Log Resource Accounting Log Summary (optional) Resource Accounting View History (optional)
The Resource Accounting Resource Usage Recording program accepts an input
parameter list from a calling program and generates a usage record in the MIR for charge-
back purposes. The Resource Accounting Reporting program is used to generate the
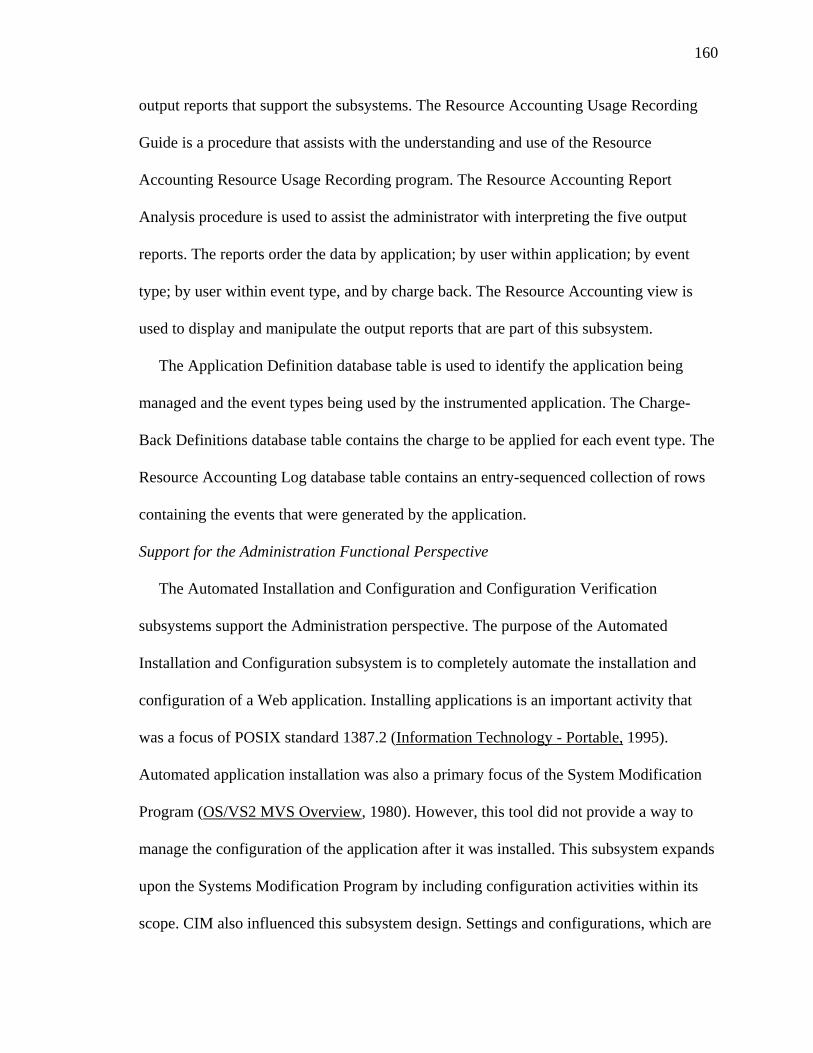
160
output reports that support the subsystems. The Resource Accounting Usage Recording
Guide is a procedure that assists with the understanding and use of the Resource
Accounting Resource Usage Recording program. The Resource Accounting Report
Analysis procedure is used to assist the administrator with interpreting the five output
reports. The reports order the data by application; by user within application; by event
type; by user within event type, and by charge back. The Resource Accounting view is
used to display and manipulate the output reports that are part of this subsystem.
The Application Definition database table is used to identify the application being
managed and the event types being used by the instrumented application. The Charge-
Back Definitions database table contains the charge to be applied for each event type. The
Resource Accounting Log database table contains an entry-sequenced collection of rows
containing the events that were generated by the application.
Support for the Administration Functional Perspective The Automated Installation and Configuration and Configuration Verification
subsystems support the Administration perspective. The purpose of the Automated
Installation and Configuration subsystem is to completely automate the installation and
configuration of a Web application. Installing applications is an important activity that
was a focus of POSIX standard 1387.2 (Information Technology - Portable, 1995).
Automated application installation was also a primary focus of the System Modification
Program (OS/VS2 MVS Overview, 1980). However, this tool did not provide a way to
manage the configuration of the application after it was installed. This subsystem expands
upon the Systems Modification Program by including configuration activities within its
scope. CIM also influenced this subsystem design. Settings and configurations, which are

161
part of the CIM Core Model (Westerinen & Strassner, 2000), are the kind of definitions
that are the primary focus of the automated configuration portion of this toolset.
In addition to providing completely automated installation support, this subsystem
also supports hybrid installation activities like those that automate the application
installation, but use manual configuration tasks. Application developers and
administrators often need this flexibility. Automated Installation and Configuration
programs have implications for the design and construction phases because the Web
application should be designed and constructed for automated installation and
configuration. Modules, for example, should be placed in libraries that are platform
specific. This makes distributing them for installation more straightforward. Automated
Installation and Configuration programs are useful for the deployment, operations, and
change phases.
The Automated Installation subsystem consists of twelve toolset components including
four programs, three procedures, two views, and three required tables. Two optional tables
are also included as part of this subsystem. A summary of the components that were
designed for this subsystem is shown in Table 16.
Table 16. Automated Installation and Configuration Component Summary
Component Type
Component Name
Program Automated Installation (Silent Install) Automated Configuration (Silent Configuration) Automated Application Installation Reporting Automated Application Configuration Reporting
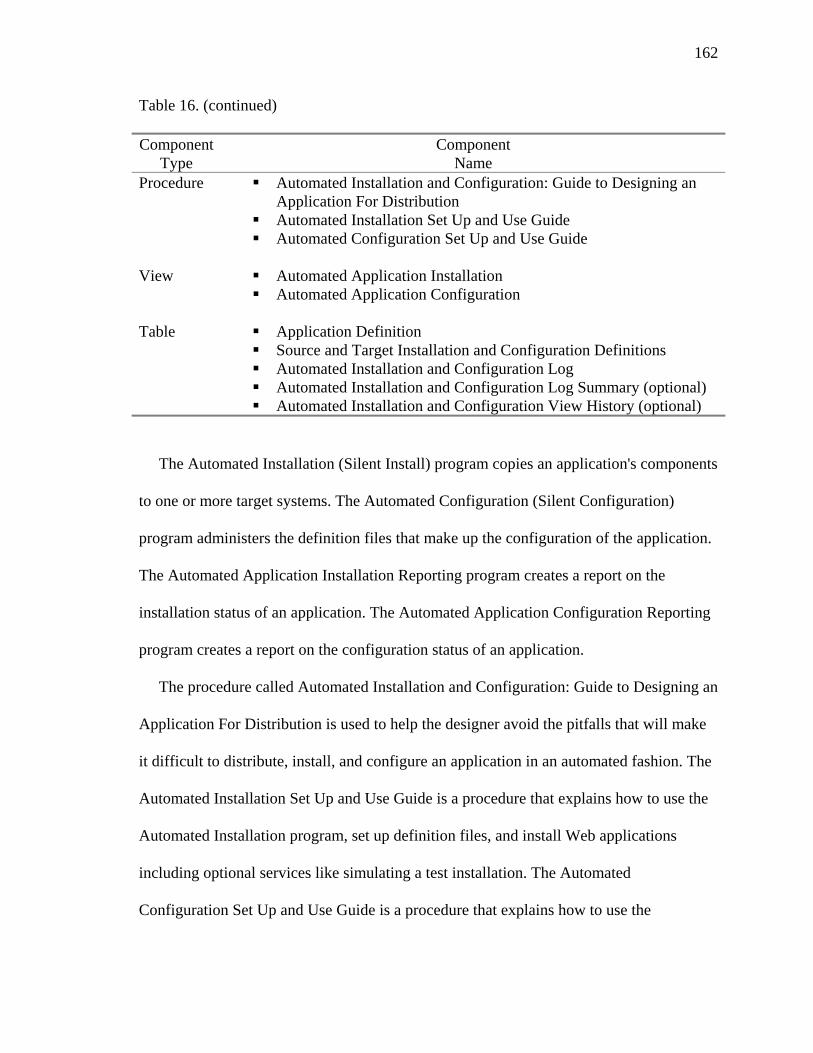
162
Table 16. (continued) Component
Type Component
Name Procedure Automated Installation and Configuration: Guide to Designing an
Application For Distribution Automated Installation Set Up and Use Guide Automated Configuration Set Up and Use Guide View Automated Application Installation Automated Application Configuration Table Application Definition Source and Target Installation and Configuration Definitions Automated Installation and Configuration Log Automated Installation and Configuration Log Summary (optional) Automated Installation and Configuration View History (optional)
The Automated Installation (Silent Install) program copies an application's components
to one or more target systems. The Automated Configuration (Silent Configuration)
program administers the definition files that make up the configuration of the application.
The Automated Application Installation Reporting program creates a report on the
installation status of an application. The Automated Application Configuration Reporting
program creates a report on the configuration status of an application.
The procedure called Automated Installation and Configuration: Guide to Designing an
Application For Distribution is used to help the designer avoid the pitfalls that will make
it difficult to distribute, install, and configure an application in an automated fashion. The
Automated Installation Set Up and Use Guide is a procedure that explains how to use the
Automated Installation program, set up definition files, and install Web applications
including optional services like simulating a test installation. The Automated
Configuration Set Up and Use Guide is a procedure that explains how to use the

163
Automated Configuration program, set up definition files, and configure applications
including optional services like delete a target component when an error occurs.
Two views are part of this subsystem design. The Automated Application Installation
view is used to display the reports associated with the installation process. The reports
contain primary installation information like target system name and target servers as well
as many details associated with the installation activities like options used and log file
data. The Automated Application Configuration view is used to display the reports
associated with the configuration process.
The Application Definition database table is used to associate the application and its
servers. The Source and Target Installation and Configuration Definitions database table
is used to store definitions that identify source file name and location. It also contains
installation options that determine the actions of the programs for this subsystem. An
example is what actions are taken when an installation error occurs. The actions could be
to keep or delete the target files. The Source and Target Installation and Configuration
Definitions database table also contains definitions specific to the configuration of the
application. The Automated Installation and Configuration Log database table is used for
messages associated with the installation and configuration processes.
The second subsystem that supports the administration perspective is the Configuration
Verification subsystem. The Configuration Verification subsystem was designed to verify
the administrative settings of a Web application. This verification allows for the
comparison of the settings of the same application in different environments or domains
like test, verification, and production. Since inconsistent or incorrect configuration setting
can cause problems with Web applications this subsystem could be helpful in problems
164
solving situations when application behaviors are different between test and production
systems. It could also be helpful solving problems after a recent application change. The
idea of a subsystem to verify configurations is rooted in several sources. Start and Patel
(1995) included configuration management as a key part of their distribution management
service. Their configuration management system was essential to verifying the current
state of the service node in the network.
The MVS utility program IEBCOMPR was used to compare two files and report on the
differences (Elder-Vass, 2000). The Configuration Verification subsystem expands this
idea from the file to the application level. Arcade Skipper, a software configuration and
verification management tool for AS/400 systems also influenced this subsystem through
its source compare and merge utility. This utility is used in application environments
where modifications of commercial packages are maintained separate from the base
software (AS/400 and iSeries, 2001). The Configuration Verification subsystems uses this
utility idea and leverages it across all file types that make up the application.
Toolset components from this subsystem can be used during the deployment phase to
ensure that environments are the same. They can be used to answer the question--is the
test system the same as the verification system? They can also be used during operations
when an application does not exhibit the same behavior that it did in the test system.
Additionally, toolset components can be used during the change phases to make sure that
important components where not omitted during the change window. The Configuration
Verification subsystem is supported by seven toolset components including two programs,
one procedure, one view, and three required database tables. Two optional database tables

165
are also included as part of this subsystem. A summary of the components that were
designed for this subsystem is shown in Table 17.
Table 17. Configuration Verification Component Summary
Component Type
Component Name
Program Configuration Verification Configuration Verification Reporting Procedure Configuration Verification Install, Configure, and Use Guide View Configuration Verification Table Application Definition Source and Target Installation and Configuration Definitions Configuration Verification Log Configuration Verification Log Summary (optional) Configuration Verification View History (optional)
The Configuration Verification program is used to physically compare, file by file, the
configuration of one application domain with that of another. The Configuration
Verification Reporting program creates reports that summarize an individual environment
or compares two environments and reports on the differences using data collected in the
MIR. The Configuration Verification Install, Configure, and Use Guide is a procedure that
explains how to install and configure (set up) the Configuration Verification program. The
Configuration Verification view is used displays configuration reports.
Three database tables are important to the operation of the subsystem. The Application
Definition database table is used to identify the application specific servers that make up
the test, verification, and production environments. The Source and Target Installation
and Configuration Definitions database table is the same database table that was used for
166
the Automated Installation and Configuration Subsystem. It is used to define the baseline
configuration to be verified for each application domain. The Configuration Verification
Log database table is used to store verification messages, both normal and exception in
nature.
Support for the Automation Functional Perspective The Automation perspective is supported by the Template Creation and Component
Comparison subsystems. The purpose of the Template Creation subsystem is to improve
the productivity of the developer and operations support staff by automatically creating
operational tools to be used in the day-to-day management of the Web application. An
example of an operational tool is a script that could be used to create standard file systems
for verification and production environments. The Template Creation subsystem design
was influenced by the productivity commands and automated capabilities of NetView.
Irlbeck (1992) wrote of the network and system automation capabilities of NetView
Version 2 and the impact on network operations. The Template Creation subsystem
extends the NetView models to include application-specific commands.
The Global Enterprise Manager product also had an influence on the Template
Creation subsystem as this product supplied generic commands like start, stop, and restart
that could be tailored for the management of an application (Tivoli Global Enterprise,
1998). The Template Creation subsystem extends the Global Enterprise Manager
examples to include a broader set of application-specific functions.
This subsystem is useful during the construction, deployment, operations, and change
phases. For example, the outputs of the Template Creation Template Build program can
be used to operate the Web application during the construction, deployment, operations,

167
and change phases. It should be noted that this subsystem has an impact on the design
phase of the application in two ways. The Web application design must be placed in a
common format whereby formal sections of the design document can be used to extract a
list of application components. The design must also be placed in the design documents
table and a design definition record must be created in the MIR to identify the document.
The Template Creation subsystem is supported by thirteen toolset components
including four programs, two procedures, two views, and five required database tables.
Two optional database tables are also included as part of this subsystem. A summary of
the components that were designed for this subsystem is shown in Table 18.
Table 18. Template Creation Component Summary
Component Type
Component Name
Program Template Creation Design Extract Template Creation Template Build Template Creation Extract Reporting Template Creation Build Reporting Procedure Template Creation: Utilizing Common Components Template Creation Install and Use Guide View Template Creation Extract Template Creation Build Table Application Definition Design Definitions Design Documents Template Models Template Creation Log Template Creation Log Summary (optional) Template Creation View History (optional)

168
The Template Creation Design Extract program is used to read the Web application
design document and extract the names of components that will be the target of template
operational commands. The Template Creation Template Build program is used to create
templates for components that were discovered to be part of the Web application design.
The Template Creation Extract Reporting program is used to create a report that lists the
components that were isolated from the Web application design. The Template Creation
Build Reporting program is used to create a report that lists the templates that were built
for each application. The procedure called Template Creation: Utilizing Common
Components describes what templates are created and how these templates can be used in
daily operations. The Template Creation Install and Use Guide explains how to install and
configure the Template Creation programs. It also discusses the design extract
prerequisites.
Five database tables are important to the function of this subsystem. The Application
Definition database table is used to identify and name the application as well as to assign
a unique build target file name for this application. The build target file is the repository
for the template commands that will be used to assist in the operation of the Web
application. The Design Definitions database table is used to contain the names of the
design documents that should be used by the Template Creation subsystem to generate
commands and scripts. The Design Documents database table is used to hold the physical
design documents named in the Design Definitions database table. The Template Models
database table contains initial files or starting points for operational commands like
display, start, and stop. The Template Creation Log database table is used to store
169
messages, both normal and exception in nature, that are generated during the process of
automatically generating operational tools.
The second subsystem to support the automation perspective is the Component
Comparison subsystem. The purpose of the Component Comparison subsystem is to
compare designed components (using the design extract provided by the Template
Creation subsystem) with the components deployed on an operational system. Information
about the deployed components is provided by the Automated Installation and
Configuration subsystem. The idea of comparing designed components with those that
were deployed was influenced by a number of existing utilities and products. Visio, a well
know tool for creating Web application architecture diagrams, has a documented
capability of storing data from diagrams in a database (Developing Visio Solutions,
1997). This built in capability to export component information makes it easier to devise a
list of elements to compare to elements in a target Web application environment.
In recent years, many commercial products have greatly enhanced their capability to
read and write files in many formats. Microsoft Word, a tool used by many Web
application designers, has extensive capability to exchange information with other
applications (Microsoft Word, 1994). The Component Comparison subsystem exploits
this capability that is built into Word and other popular programs. Models also exist to
extract information from running systems. The Tivoli Inventory program is an example of
a tool that is used to extract data about the components that are installed on a device like a
Web server (TME 10 Inventory, 1998). The Component Comparison subsystem extends
this capability by linking it directly to the Web application. The Component Comparison
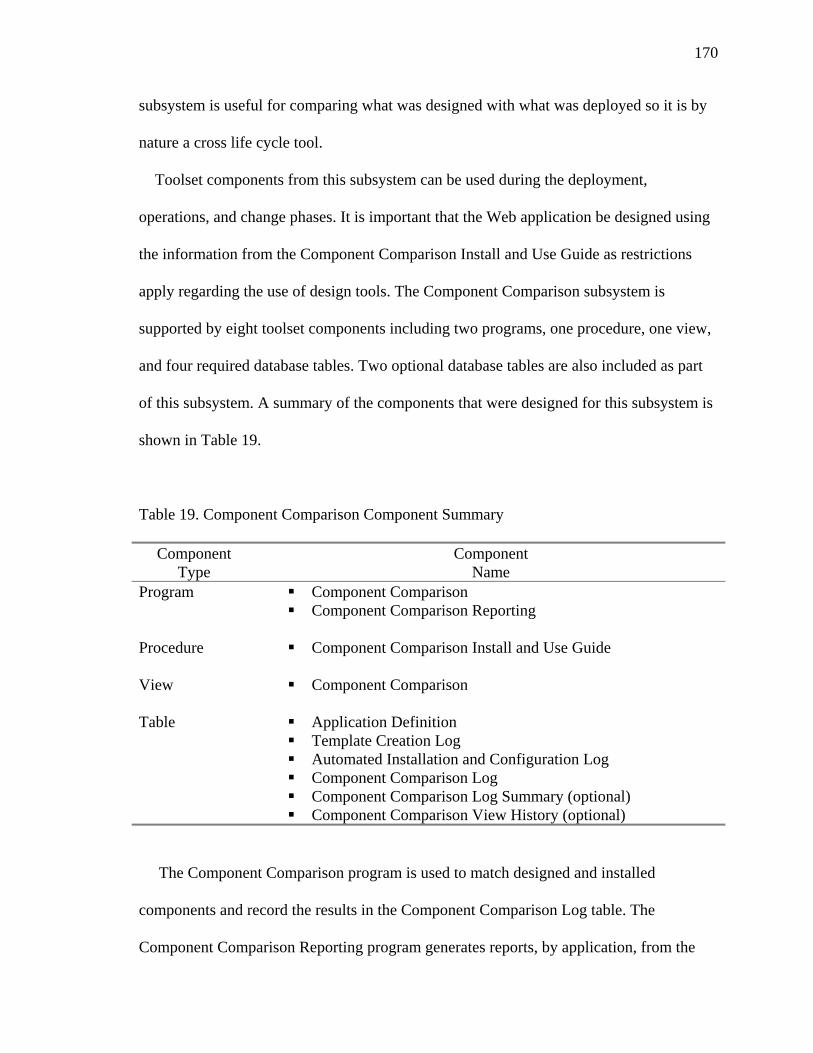
170
subsystem is useful for comparing what was designed with what was deployed so it is by
nature a cross life cycle tool.
Toolset components from this subsystem can be used during the deployment,
operations, and change phases. It is important that the Web application be designed using
the information from the Component Comparison Install and Use Guide as restrictions
apply regarding the use of design tools. The Component Comparison subsystem is
supported by eight toolset components including two programs, one procedure, one view,
and four required database tables. Two optional database tables are also included as part
of this subsystem. A summary of the components that were designed for this subsystem is
shown in Table 19.
Table 19. Component Comparison Component Summary
Component Type
Component Name
Program Component Comparison Component Comparison Reporting Procedure Component Comparison Install and Use Guide View Component Comparison Table Application Definition Template Creation Log Automated Installation and Configuration Log Component Comparison Log Component Comparison Log Summary (optional) Component Comparison View History (optional)
The Component Comparison program is used to match designed and installed
components and record the results in the Component Comparison Log table. The
Component Comparison Reporting program generates reports, by application, from the

171
Component Comparison Log table. The Component Comparison Install and Use Guide is
a procedure designed to explain how to install, set up, and use the Component
Comparison program. The Component Comparison view is used to display the reports that
are generated as part of the Component Comparison subsystem.
The Application Definition database table is used to describe the applications that are
candidates for component comparison and reporting. The Template Creation Log database
table, which was created by the Template Creation subsystem, contains information about
application components that are used by this subsystem. The Automated Installation and
Configuration Log database table is also used by this subsystem because it contains
information about installed and configured application components. The Component
Comparison Log database table is used to store the results of comparisons that were done.
The data in this database table is stored in the form of messages.
Support for the Availability Functional Perspective The Availability perspective is supported by the Deep View subsystem. The purpose of
the Deep View subsystem is to provide a comprehensive treatment of availability to
include information pertaining to responsiveness, stability, and usage measurement. This
subsystem uses data and information from all the functional perspectives explored in this
toolset design. Typically, availability information is limited to information about the
logical state of a resource or component. Examples of network resource states reported by
the NetView program include ACTIV, NORMAL, and INACT (NetView User's Guide,
2001). The Deep View subsystem was designed to be the subsystem where all availability
information about the Web application could be examined in one place using one view.

172
The range of availability information included covered as many functional
perspectives as possible. For example, for the change perspective, information about the
last change is displayed. Change information can help an operator understand something
about the stability of the Web application. For the problem perspective, the most recent
problem record is displayed. Problem records are another stability factor that can yield
information on the availability of the Web application. For the automation perspective, the
most recent information about attempted recovery actions is displayed. Automation
history, especially information about failed attempts to recover resources like network
interface cards or message queues, is an important availability information source. In
summary, data associated with many of the perspectives has information that contributes
to the full understanding of the availability of a Web application.
Toolset components from this subsystem can be used during design, construction,
deployment, operations, and change phases. For example, the Deep View Application
Design Considerations procedure is useful for providing strategies for making the best use
of the Deep View subsystem in the construction through change phases. The Deep View
Real-Time Update program is useful during construction and deployment phases to assist
the developers and support personnel with understand the root cause of problems during
application testing or application deployment to other domains.
The Deep View subsystem is supported by eight toolset components including three
programs, two procedures, one view, and two required database tables. Two optional
database tables are also included as part of this subsystem. A summary of the components
that were designed for this subsystem is shown in Table 20.

173
Table 20. Deep View Component Summary
Component Type
Component Name
Program Deep View Initialize Deep View Real-Time Update Deep View Application Resource Reporting Procedure Deep View Application Design Considerations Deep View Install, Definition, and Use View Application Resources Table Application Definition Deep View Application Resources Application Resources Log Summary (optional) Application Resources View History (optional)
The Deep View Initialize program is used to discover initial values for the perspectives
that apply to this Web application and update the MIR with these initial settings. The
Deep View Real-Time Update program is used to gather availability data and update the
MIR in real time. It support requests for data on individual aspects, for example,
automation status. It can also perform mass update operations for all availability data for a
specific application. The Deep View Application Resource Reporting program is used to
create a report containing an availability snapshot using data stored by other programs
about this subsystem. The Deep View Application Design Considerations procedure
explains the prerequisites for using Deep View facilities to manage an application and the
impact its use has on the design of the application. The Deep View Install, Definition, and
Use procedure describes how to install, set up, and operate the Deep View subsystem.
The Application Definition table is used to identify the applications that are subject to
Deep View processing. A detailed set of Deep View definitions are also added to the
Application Definition database table that is used by most of the other subsystems. The

174
Deep View Application Resources database table contains definitions of the application-
specific resources that are reported about by the subsystem. Examples of application
resources are application programs, application processes, and other (user specified)
application components.
Support for the Business Functional Perspective The Business perspective is supported by the Business Views subsystem. The purpose
of the Business Views subsystem is to explore the possibilities of managing a collection
of related applications in a business-system context as compared to the usual network or
server centric focus. The Unicenter TNG and Tivoli Global Enterprise Manager products
first defined the business-system context. The Unicenter product utilized a graphical user
interface that garnered a lot of attention because it was different from anything else in the
marketplace and could be used to depict objects in context like computers and buildings
(Karpowski, 1999). Unlike Unicenter TNG, the Business Views subsystem is focused on
depicting relationships like parents, children, and peers in a tabular fashion. It also
supports different view types like logical and physical views. The subsystem is different
from Unicenter in that it is mainly centered on the relationship between applications that
make up a business system.
The Business Views subsystem is related to Tivoli Global Enterprise Manager in that
both can depict application, database, middleware, network, and server resources. Tivoli
Global Enterprise Manager is capable of representing an extremely broad list of resources
as shown by the tremendous variety that are part of the USAA Internet Member Services
management design (Turner, 1998). The Business Views subsystem does not have the
graphical richness of Tivoli Global Enterprise Manager. However, when paired with the
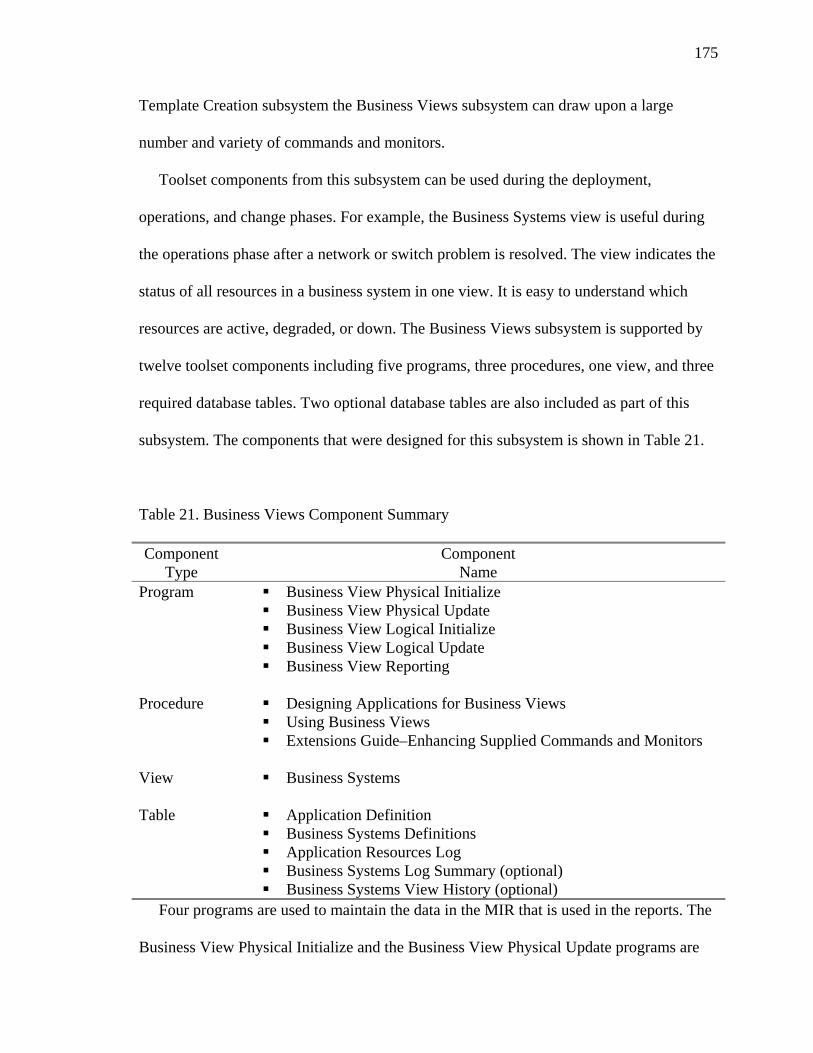
175
Template Creation subsystem the Business Views subsystem can draw upon a large
number and variety of commands and monitors.
Toolset components from this subsystem can be used during the deployment,
operations, and change phases. For example, the Business Systems view is useful during
the operations phase after a network or switch problem is resolved. The view indicates the
status of all resources in a business system in one view. It is easy to understand which
resources are active, degraded, or down. The Business Views subsystem is supported by
twelve toolset components including five programs, three procedures, one view, and three
required database tables. Two optional database tables are also included as part of this
subsystem. The components that were designed for this subsystem is shown in Table 21.
Table 21. Business Views Component Summary
Component Type
Component Name
Program Business View Physical Initialize Business View Physical Update Business View Logical Initialize Business View Logical Update Business View Reporting Procedure Designing Applications for Business Views Using Business Views Extensions Guide–Enhancing Supplied Commands and Monitors View Business Systems Table Application Definition Business Systems Definitions Application Resources Log Business Systems Log Summary (optional) Business Systems View History (optional) Four programs are used to maintain the data in the MIR that is used in the reports. The
Business View Physical Initialize and the Business View Physical Update programs are

176
responsible for initializing and maintaining information on the physical devices associated
with Web applications that are shown in the Business Views. The Business View Logical
Initialize and Business View Logical Update programs do the same to manage the logical
relationships like parent, child, and peer that exist between applications and their
components. The Business View Reporting program is used to create the reports for this
subsystem.
The Designing Applications for Business Views procedure explains the items that
should be considered during the design of the Web application. For example,
consideration should be given to the relationship of a new Web application with others
that are already part of the business suite of applications. The Using Business Views
procedure is an operator’s guide to the subsystem. The Extensions Guide–Enhancing
Supplied Commands and Monitors is a procedure that can be used to better understand
how to make changes to the commands and monitors that are part of the subsystem.
Application specific commands and monitors can significantly enhance the usability of
this subsystem especially if they are powerful and specific to the Web application. The
Business Systems view is used to display the main Business Views report and to move
between the report selections.
The Application Definition database table is used to define the applications that can be
monitored using Business System views. The Business Systems Definitions database table
is used to contain the parameters that define the parent and peer relationships between the
applications that make up the Business System. The Application Resources Log database
table is used as a repository for key messages that are created during Business View
subsystem processing. The data in this log is used by the subsystem's reporting program.
177
Support for the Capacity Functional Perspective The Capacity perspective is supported by the Application Capacity Bottlenecks
subsystem. The purpose of the Application Capacity Bottlenecks subsystem is to provide
a focus on the demanding area of application, database, and middleware capacity with
specific attention paid to detecting operational limitations or bottlenecks. There are
significant challenges with designing a subsystem with this focus. What are the typical
bottleneck areas? Is there technology that can be exploited to monitor these areas? Britton
(2001) identified eight elements that make up a middleware system. They include the
communication link, the middleware protocol, the API, a common data format, server
process control, naming/directory services, security, and administration.
Of these eight only a subset can be monitored on a regular basis without adding
significant overhead to the overall operation of the application. Considering the overhead
of using an API as a method of checking the availability of the API, it is easily understood
that the act of monitoring can contribute to causing the subject of the monitoring activity
to back up or slow down. Database management systems present similar challenges.
Informix, a commercial database product, provides a management interface called the
System Monitoring Interface (SMI). The SMI can be used to get information regarding
processing bottlenecks, resource usage, session, and server activity (Mattison, 1997).
Using this interface to gather information results in database queries to the system master
database, which like the situation with middleware monitoring, may be adding an
unintentional burden to the specific subsystem being checked for bottlenecks.
Toolset components from this subsystem can be used during design, construction,
deployment, operations, and change phases. For example, the Strategies to Reduce
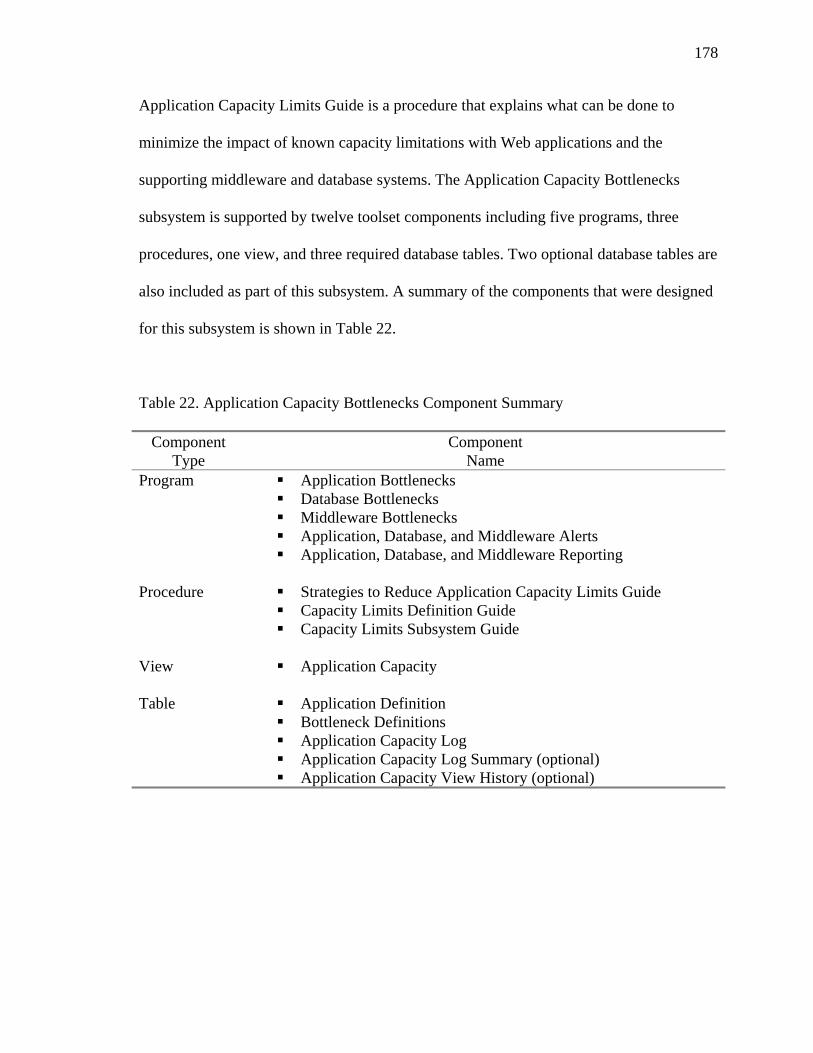
178
Application Capacity Limits Guide is a procedure that explains what can be done to
minimize the impact of known capacity limitations with Web applications and the
supporting middleware and database systems. The Application Capacity Bottlenecks
subsystem is supported by twelve toolset components including five programs, three
procedures, one view, and three required database tables. Two optional database tables are
also included as part of this subsystem. A summary of the components that were designed
for this subsystem is shown in Table 22.
Table 22. Application Capacity Bottlenecks Component Summary
Component Type
Component Name
Program Application Bottlenecks Database Bottlenecks Middleware Bottlenecks Application, Database, and Middleware Alerts Application, Database, and Middleware Reporting Procedure Strategies to Reduce Application Capacity Limits Guide Capacity Limits Definition Guide Capacity Limits Subsystem Guide View Application Capacity Table Application Definition Bottleneck Definitions Application Capacity Log Application Capacity Log Summary (optional) Application Capacity View History (optional)

179
Three programs focus on monitoring for specific bottlenecks. The Application
Bottlenecks program monitors for missing and stuck application processes. It also
monitors for the situation where more than a specified number of processes are running
simultaneously. The Database Bottlenecks and Middleware Bottlenecks programs perform
monitoring functions for their respective areas. In addition to process monitoring, both
programs can also detect long running activities like SQL queries and queue puts or gets.
The Application, Database, and Middleware Alerts program is a common interface
module used by the other programs in the subsystem to format and present alerts to the
management infrastructure. The Application, Database, and Middleware Reporting
program produces the application-focused bottleneck report. The report contains data
gathered by the monitoring programs like application and database process status. It also
indicates if the application utilizes voice, video, audio, graphics, email, FTP, and HTTP
services.
The Strategies to Reduce Application Capacity Limits Guide is a procedure for
application designers that helps them reduce or eliminate practices that artificially inhibit
the effective operation of the Web application. The Capacity Limits Definition Guide
explains the parameters that guide the operation of the programs in the subsystem. The
Capacity Limits Subsystem Guide is a procedure that is an operational guide to the use of
the subsystem. The Application Capacity view is used to display the subsystem's main
report.
The Application Definition database table contains the parameters that define the
application to be monitored for bottlenecks. The Bottleneck Definitions database table
contains definitions of the bottlenecks and threshold that are specific to the application.

180
The toolset administrator places these definitions in the database table. It is anticipated
that after a period of trial and error, the threshold values will change to better match the
operation profile of the Web application. The Application Capacity Log database table is
used to hold the data that is used in the reports of this subsystem.
Support for the Change and Configuration Functional Perspectives The Change and Configuration perspectives are supported by the Unauthorized Change
Detection and Change-Window Awareness subsystems. The purpose of the Unauthorized
Change Detection subsystem is the detection of changes made to an application that are
not formally authorized. Authorized changes apply to applications that are deployed,
operational, or subject to change. A formally authorized change is one that is approved
through the organization's change control process. Ideas for this subsystem are based on
functionality that is build into all operating systems. UNIX systems, for example,
maintain a time stamp that is the date and time when the file was last modified (UNIX
Unleashed, 1994). Windows 95 maintains three dates that can be viewed by displaying the
properties of the selected item. The dates are when the resource was created, modified,
and last accessed (Introducing Windows 95, 1995).
This subsystem compares MIR data that defines approved change windows with the
change dates for key application resources like files. Changes to resources on specified
systems that are outside approved change windows are considered unauthorized. Toolset
components from this subsystem can be used during the construction, deployment,
operations, and change phases. For example, the Change Detection program can be used
on a monthly basis during the operations phase as a method to meet security audit
requirements. The Building and Maintaining Applications Configuration Guide can be

181
used during the change phase to add new resources to the definition list for monitoring of
unauthorized changes.
The Unauthorized Change Detection subsystem is supported by sixteen toolset
components including five programs, five procedures, two views, and four required tables.
Four optional tables are also included as part of this subsystem. A summary of the
components that were designed for this subsystem is shown in Table 23.
Table 23. Unauthorized Change Detection Component Summary
Component Type
Component Name
Program Change Definition Change Detection Application Configuration Change Reporting Application Configuration Reporting Procedure Change Definition Guide Understanding Change Detection Building and Maintaining Applications Configuration Guide Using Application Configuration Using Change Detection View Application Configuration Change Detection Table Application Definition Application Configuration Change Definition Unauthorized Change Detection Log Application Configuration Log Summary (optional) Unauthorized Change Detection Log Summary (optional) Application Configuration View History (optional) Change Detection View History (optional)
The Change Definition program is used to build and maintain data that identifies
authorized change periods. The Change Detection program analyzes predefined physical

182
elements on a periodic basis to see if they have been changed during periods that are not
authorized. The Application Configuration program is used to define resources for an
application that is subject to change monitoring. There are two reporting programs that are
part of this subsystem. The Change Reporting program is used to produce the report for
the Change Detection view. The Application Configuration Reporting program is used to
produce the report for the Application Configuration view.
The Change Definition Guide is a procedure that explains how the Change Definition
program utilizes existing change-management records to create a change definition. The
Understanding Change Detection procedure describes how change detection compares the
last changed dates of physical elements of an application to authorized changes. The
Building and Maintaining Applications Configuration Guide is a procedure that explains
how this subsystem utility builds a useful application configuration using existing MIR
data. Also explained is how unique application-specific components can be supplied. The
Using Application Configuration procedure explains how to use the data and information
supplied in the Application Configuration view. The Using Change Detection procedure
explains how to use the data and information supplied in the Change Detection view.
The Application Configuration view is used to display the configuration data for a
specific application. This view can also be used to update the settings displayed. The
Change Detection view is used to display the unauthorized changes that have been
detected and stored in the MIR. The Application Definition database table is used to
identify the application for which unauthorized change detection will be performed. The
Application Configuration database table is used to contain the list of application
resources that will be monitored by the subsystem. The Change Definition database table

183
is used to contain the valid change periods that will be used in the analysis to determine if
a change is authorized. The Unauthorized Change Detection Log database table is a data
repository that contains data on all the unauthorized changes that have been discovered.
by the subsystem.
The second subsystem in support of the Change and Configuration perspectives is the
Change Window Awareness subsystem. The purpose of the Change-Window Awareness
subsystem is to maintain normal operations and management of an application while it is
undergoing change that is taking place during a predefined period called a change
management window. A change management window is a common term used by
individuals in the IT industry as well as hardware and software vendors. The hardware
vendor Cisco suggested that polling MIB objects after a change management window was
an ideal to get an up-to-date and accurate inventory of your network (How To Collect,
2002). The change management window is an element of the change management process
that is one of the disciplines described in ITIL (Bladergroen et al., 1998) and IBM
(Harikian et al., 1996).
Toolset components from this subsystem are used primarily during the change phase. If
change management disciplines are used during the construction phase this subsystem
could be used there as well. The Change-Window Awareness subsystem is supported by
eight toolset components including two programs, one procedure, two views, and three
required database tables. Two optional database tables are also included as part of this
subsystem. A summary of the components that were designed for this subsystem is shown
in Table 24.
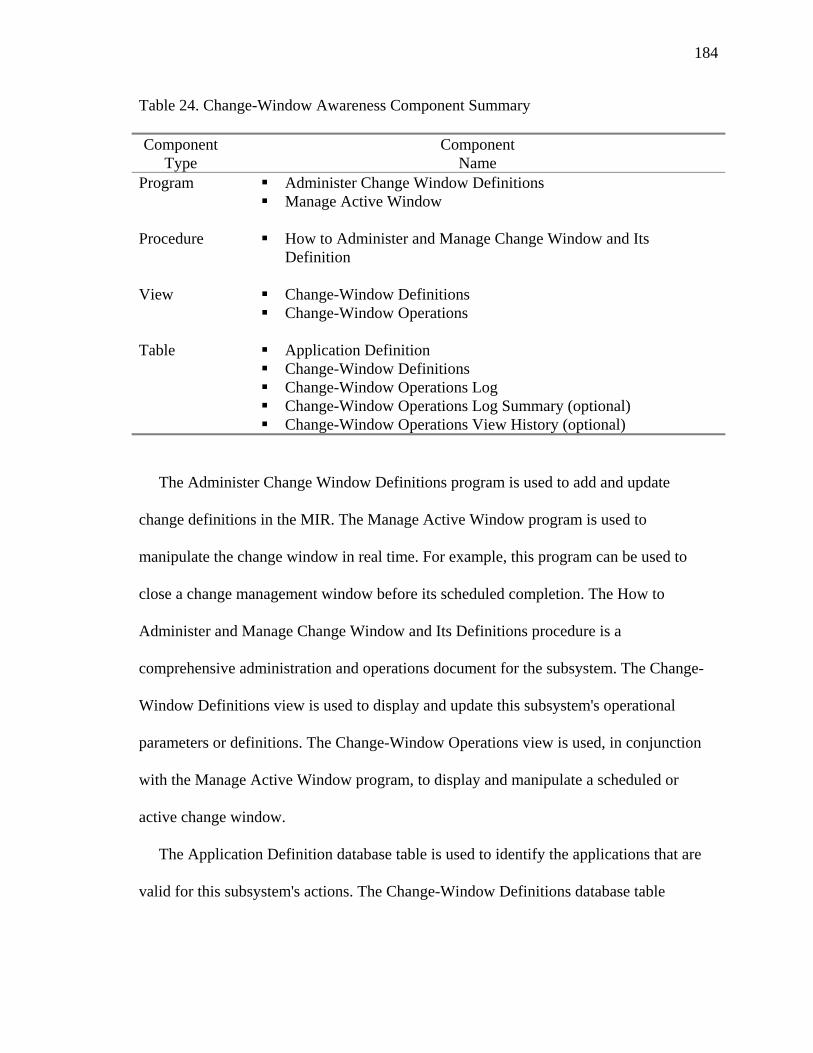
184
Table 24. Change-Window Awareness Component Summary
Component Type
Component Name
Program Administer Change Window Definitions Manage Active Window Procedure How to Administer and Manage Change Window and Its
Definition View Change-Window Definitions Change-Window Operations Table Application Definition Change-Window Definitions Change-Window Operations Log Change-Window Operations Log Summary (optional) Change-Window Operations View History (optional)
The Administer Change Window Definitions program is used to add and update
change definitions in the MIR. The Manage Active Window program is used to
manipulate the change window in real time. For example, this program can be used to
close a change management window before its scheduled completion. The How to
Administer and Manage Change Window and Its Definitions procedure is a
comprehensive administration and operations document for the subsystem. The Change-
Window Definitions view is used to display and update this subsystem's operational
parameters or definitions. The Change-Window Operations view is used, in conjunction
with the Manage Active Window program, to display and manipulate a scheduled or
active change window.
The Application Definition database table is used to identify the applications that are
valid for this subsystem's actions. The Change-Window Definitions database table
185
contains the change definitions for this subsystem. The Change-Window Operations Log
database table is used to contain a history of the change window activities.
Support for the Fault Functional Perspective The Fault perspective is supported by the Smart Fault Generation subsystem. The
purpose of the Smart Fault Generation subsystem is to optimize the creation of application
faults, events, alarms, or alerts utilizing minimal inputs. Typically, fault data consists of
the source of the event, IP address of the source system, hostname, status, severity, date,
and message text. Often, it is desirable to have additional information that adds context to
the primary fault. This subsystem adds this additional detail by harvesting information
that is available at the time of the fault. The structure of the faults from this subsystem
was influenced by the content of Tivoli Event Console events (Lendenmann et al., 1997).
The notion of gathering addition data at the time of the error came from a Compuware
product called Abend-AID. The tools is used to quickly resolve and manage the
application failure resolution process. It is designed to reduce critical application
downtime and achieve service level agreements (Compuware Abend-AID, 2002).
Toolset components from this subsystem can be used during the construction,
deployment, operations, and change phases. For example, the Smart Fault View is useful
in providing application development support during the construction of the application.
Since the Fault Generation program is called by the Web application, its use has
implications on the design of the application as the designer must decide when and under
what circumstances the program is to be invoked. The Smart Fault Generation subsystem
is supported by seven toolset components including two programs, two procedures, one
view, and two required database tables. Two optional database tables are also included as

186
part of this subsystem. The components that were designed for this subsystem is shown in
Table 25.
Table 25. Smart Fault Generation Component Summary
Component Type
Component Name
Program Fault Generation Fault Reporting Procedure How to Use Smart Fault Generation Working With Specific Fault Data View Specific Fault Table Application Definition Specific Fault Data Specific Fault Data Summary (optional) Specific Fault View History (optional)
The Fault Generation program is called by the Web application with a parameter list
that directs the program's processing. The Fault Reporting program is used to retrieve and
format the information contained in the fault. How to Use Smart Fault Generation is a
procedure that explains how to call the Fault Generation program and how to request
support for specific data like application, database, and middleware. The Working With
Specific Fault Data procedure explains how to analyze and manipulate the specific fault
data collected by the Fault Generation module.
The Specific Fault view is used to display a report that contains primary fault
information and additional detailed information if it has been requested by the calling
Web application. The Application Definition database table is used to name the Web
applications that can use the Smart Fault subsystem. It also contains application specific

187
parameters that are used to control some aspects of the subsystem's processing. The
Specific Fault Data database table is the main output repository for the faults that are
generated by the subsystem.
Support for the Operations Functional Perspective The Operations perspective is supported by the Integrated Operations subsystem. The
purpose of the Integrated Operations subsystem is to provide an integrated operational
framework for the activities that are central to computer operations. These activities focus
on job scheduling; backup and restore status and history; print output status; and other
outputs like file transfers and print to file operations. The notion of integrating these
activities into a single framework is the main idea behind this subsystem. This focus was
strongly influenced by the IBM IT Process Model processes that are centered on systems-
management activities (Fearn, Berlen, Boyce, and Krupa, 1999).
Integration has not taken place in the marketplace because the operations software
products are produced by a wide variety of vendors that do not share a common approach
or framework. The Integrated Operations subsystem was designed to be independent of a
specific vendor helpdesk or print output utility. Toolset components from the Operations
Integration subsystem can be used during construction, deployment, operations, and
change phases. For example, the Integrated Operations view can be used during the
change phase to monitor the backup jobs that are often run early in a change window to
provide a data or software copy to be used if a restore operation is needed. This subsystem
should be installed and used during the construction phase to make sure that it useful and
can be maintained during later life cycle phases.

188
The Integrated Operations subsystem is supported by ten toolset components including
five programs, two procedures, one view, and two required database tables. Two optional
database tables are also included as part of this subsystem. The components that were
designed for this subsystem is shown in Table 26.
Table 26. Integrated Operations Component Summary
Component Type
Component Name
Program Job Monitor Backup/Recover Interface Print Interface Other Output Interface Integrated Operations Reporting Procedure How to Set up Integrated Operations How to Use Integrated Operations View Integrated Operations Table Application Definition Integrated Operations Data Integrated Operations Data Summary (optional) Integrated Operations View History (optional)
The Job Monitor program is used to track the execution of Web application
background programs. The Backup/Recover Interface program is used to monitor backup
and recover operations. The program manages active operations and keeps history
information from recent executions in the MIR. The Print Interface program tracks real-
time print activities for queues it has been defined to manage. The Other Output Interface
189
program monitors and manages non-print output including print-to-file and file transfer
objects. The Integrated Operations Reporting program is used to create reports that
include primary subsystem information from job, task, and other services.
Two procedures are part of this subsystem. The How to Set up Integrated Operations
procedure explains the steps that are required to set up the subsystem using its main
configuration definitions which are stored in the Application Definition database table.
The How to Use Integrated Operations procedure explains how to use the Integrated
Operations view to manage an application's background units of work as well as
backup/restore, print, and other output resources. The Integrated Operations view is used
to display and manipulate the data that is gathered to support the subsystem.
The Application Definition database table contains the parameters that identify the
Web application and its components that are to be managed by this subsystem. The
Integrated Operations Data database table stores the operational data that is required to
support the processing needs of the subsystem in its management of the Web application.
Support for the Performance Functional Perspective The performance perspective is supported by the Intimate Performance subsystem. The
purpose of the Intimate Performance subsystem is to explore both intrusive and non-
intrusive techniques to instrument an application for manageability. Intrusive techniques
are currently available like ARM (System Management: Application Response, 1998).
ARM is effective, but costly to implement, as it requires source code changes to the
application. An alternative to modifying the application is to create a proxy for the
application and instrument the proxy. The instrumented proxy would be used in place of

190
managing the application itself. This technique was explored during a project to manage
the USAA Internet Member Services management application (Turner, 1998).
Toolset components from this subsystem can be used during design, construction,
deployment, operations, and change phases. For example, the Non-Intrusive Performance
Techniques and Intrusive Performance Programming and Testing procedures are useful
for providing strategies that can be used during the design of the Web application. The
Intimate Performance subsystem is supported by twelve toolset components including
four programs, three procedures, two views, and three required database tables. Three
optional database tables are also included as part of this subsystem The components that
were designed for this subsystem is shown in Table 27.
Table 27. Intimate Performance Component Summary
Component Type
Component Name
Program Proxy Performance Proxy Reporting Non-Intrusive Performance Non-Intrusive Reporting Procedure Non-Intrusive Performance Techniques Intrusive Performance Programming and Testing How to Set Up and Use Proxy Performance View Intimate Performance Proxy Performance Table Application Definition Performance Definitions Performance Data Performance Data Summary (optional) Intimate Performance View History (optional) Proxy Performance View History (optional)
191
The Proxy Performance program supports the execution of the proxy application. This
program is used to schedule the execution of the proxy application and to store its data in
the MIR. The Proxy Reporting program builds and manages the reports associated with
the proxy application. The Non-Intrusive Performance program schedules non-intrusive
performance probes and monitors. It also records the appropriate data in the MIR. The
Non-Intrusive Reporting program builds and manages the reports associated with the data
collected from the probes and monitors. The Non-Intrusive Performance Techniques
procedure explains how to make use of monitors and commands to better understand the
availability and performance of the Web application. The procedure references already-
existing, non-intrusive tools that are available from software vendors. The Intrusive
Performance Programming and Testing procedure explains how to modify and test the
Web application program that has been instrumented with calls to the Intimate
Performance subsystem. The How to Set Up and Use Proxy Performance procedure is a
guide to the administration of the software associated with the Intimate Performance
subsystem.
The Intimate Performance view is used to display performance data from instrumented
Web applications. The Proxy Performance view is used to display performance data from
instrumented proxies for Web applications. The Application Definition database table
contains the parameters that identify the Web application that is to be managed by this
subsystem. The Performance Definitions database table contains the definitions that
support the subsystem, for example relationships between Web applications and their
proxies. The Performance Data database table contains the data that is collected and used
to create the subsystem reports.
192
Support for the Problem Functional Perspective The problem perspective is supported by the Detailed Data subsystem. The purpose of
the Detailed Data subsystem is to provide a data repository of information for operators
and administrators that is related to problem solving. This subsystem contains static
problem solving information including a cause description, specified action, long term
recommendation, and contact information. Although the information is static, links in the
form of URLs, are placed in the information to reference material that is more dynamic in
nature. The design of this subsystem was influenced by NetView's Network Problem
Determination Application (NetView User's Guide, 2001). This application contained a
description of both the probable cause and recommended actions for a problem. However,
unlike the Network Problem Determination Application this subsystem's information is
focused on solving application, middleware, and database problems.
Toolset components from this subsystem can be used during the construction,
deployment, operations, and change phases. For example, the Detailed Data view can be
used during the change phase to diagnose a problem that may have occurred as a result of
a difference between the test and production application domains. The Detailed Data view
is useful because the large number of elements that make up and support an application
are a significant challenge to compare without the support of a software tool. The Detailed
Data subsystem is supported by eight toolset components including two programs, two
procedures, one view, and three required database tables. Two optional database tables are
also included as part of this subsystem. A summary of the components that were designed
for this subsystem is shown in Table 28.

193
Table 28. Detailed Data Component Summary
Component Type
Component Name
Program Generate Detailed Problem Handling Data Detailed Problem Handling Reporting Procedure How to Define Cause and Action Information How to Utilize Detailed Problem Handling Data View Detailed Data Table Application Definition Detailed Data Definitions Detailed Data Detailed Data Summary (optional) Detailed Data View History (optional)
The Generate Detailed Problem Handling Data program is used to place information in
the MIR about a specific problem situation. The Detailed Problem Handling Reporting
program is used to retrieve detailed problem information from the MIR and present it in
the Detail Data view. The How to Define Cause and Action Information procedure
describes the steps to use to define the information in the MIR. The How to Utilize
Detailed Problem Handling Data procedure is an operation guide for the subsystem. The
Detailed Data view is designed to be used in a context where faults are being investigated
and resolved. It is designed to be used in conjunction with the Specific Fault view.
The Application Definition database table identifies applications for which detailed
data can be displayed. The Detailed Data Definitions database table contains the
parameters which control the operation of the subsystem. The Detailed Data database
table is the main repository for this subsystem containing all the detailed data for each
known problem.

194
Support for the Security Functional Perspective The Security perspective is supported by the Interface Monitoring subsystem. The
purpose of the Interface Monitoring subsystem is to provide a single point from which to
view all security related exceptions. The security exceptions are collected by this
subsystem from all main points of potential exposure including the application, database,
middleware, firewall, network protocol, back-end, front-end, load balancing, gateway, and
mail interfaces. The basic idea for this subsystem is that it is more straightforward to
collect and report all security exceptions using one MIR and report instead of many
different log files and databases.
To implement this idea, utilities are needed to gather security exceptions and transport
them to a fault management system. Many management frameworks have utilities to
extract key messages from files and insert them into the critical message flow or
databases. An example is the Tivoli Event Adapter which is a utility that receives log
messages from various sources like the syslogd daemon running on a mail or load
balancing computer. This utility reformats the messages into Tivoli Event Console events
and forwards them to the event server for processing (Lendenmann et al., 1997). This
same interface can be exploited by the Interface Monitoring subsystem. The Load-
Balancing Data Collection and Mail Data Collection programs can gather these exceptions
and store the information into the subsystem's MIR.
The toolset components from this subsystem can be used during the construction,
deployment, operations, and change phases. For example, the Interface Monitoring view
can be used to see if a development system has been hacked during the construction
phase. Viruses imbedded during program construction might inflict their worst damage

195
during later phases like operations or change. The Interface Monitoring subsystem is
supported by eighteen toolset components including eleven programs, three procedures,
one view, and three required database tables. Two optional database tables are also
included as part of this subsystem. A summary of the components that were designed for
this subsystem is shown in Table 29.
Table 29. Interface Monitoring Component Summary
Component Type
Component Name
Program Application Data Collection Database Data Collection Middleware Data Collection Firewall Data Collection Network Protocol Data Collection Back-End Data Collection Front-End Data Collection Load-Balancing Data Collection Gateway Data Collection Mail Data Collection Interface Monitoring Reporting Procedure Planning for Interface Monitoring Installing and Configuring Interface Monitoring Modules Using Interface Monitoring Data View Interface Monitoring Table Application Definition Interface Monitoring Definitions Interface Monitoring Log Interface Monitoring Log Summary (optional) Interface Monitoring View History (optional)
Ten resource specific data collection programs are part of the subsystem including the
Application Data Collection, Database Data Collection, Middleware Data Collection,
Firewall Data Collection, Network Protocol Data Collection, Back-End Data Collection,

196
Front-End Data Collection, Load-Balancing Data Collection, Gateway Data Collection,
and Mail Data Collection programs. Each of these programs works with a specific type of
resource and collects security data using published interfaces or less direct means like
harvesting messages from program log files. The Interface Monitoring Reporting program
is used to produce reports from the MIR data collected by the other subsystem programs.
Three procedures are part of this subsystem. The Planning for Interface Monitoring
procedure is used during the design phase to ensure that the Web application is built to
generate application security messages if it detects such an exception. The Installing and
Configuring Interface Monitoring Modules procedure explains how to install and set up
the subsystem's data collection programs. The Using Interface Monitoring Data procedure
explains the meaning of the data that is collected from the different collection points like
firewalls and back-end network connections. The Interface Monitoring view is the single
view that is used to display the information from all the collection modules. This view
displays the report data for specific Web applications.
Three database tables are used by this subsystem. The Application Definition database
table identifies the application that is to be monitored by this subsystem. The Interface
Monitoring Definitions database table contains the parameters the control the processing
actions of the subsystem. The Interface Monitoring Log database table is used to contain
the messages associated with the subsystem's monitoring processes. This database table is
the primary source of data for the subsystem's reports.
197
Support for the Service Level Functional Perspective The service-level perspective is supported by the SLO/SLA Data subsystem. The
purpose of the SLO/SLA Data subsystem is to gather and report information that
describes the level of service that the application is providing to its users. In the Web
industry, two levels of service are usually supported. An application with a service level
objective is one that provides application availability or performance at a level that is not
guaranteed to its users. The service level objective might be stated in terms like--"Web
hosting provider's availability objective for the Web Hosting Environment is less than
four hours per calendar month of downtime, subject to specific exclusions" (Universal
Server Farm, 2000, p. 17). This objective is simply a goal. If the goal is not achieved there
are typically no penalties
A service level agreement is more like a contract as compared to a service level
objective. The agreement will specify a specific goal like--"the UUNET network will be
available 100% of the time". In this situation, UUNet also stated "should these specified
levels of service fail to be achieved, UUNET will credit the customer's account" (Service
Level Agreements, 2001, p.1). In other cases, if agreements are not met then penalties
might be paid to the organization that relies on the application.
Tools and products in the marketplace influenced the design for this subsystem. The
notion of monitoring Web URLs in a service level context was influenced by the Port
Checking Pattern Matching Monitor program which can be invoked on a periodic basis to
launch a URL and load the first 256 characters of the page (Woodruff, 1999). The
Keynote Perspective service also influenced the design of this subsystem as it has a
number of built-in functions that support its use as a service level tool (Keynote
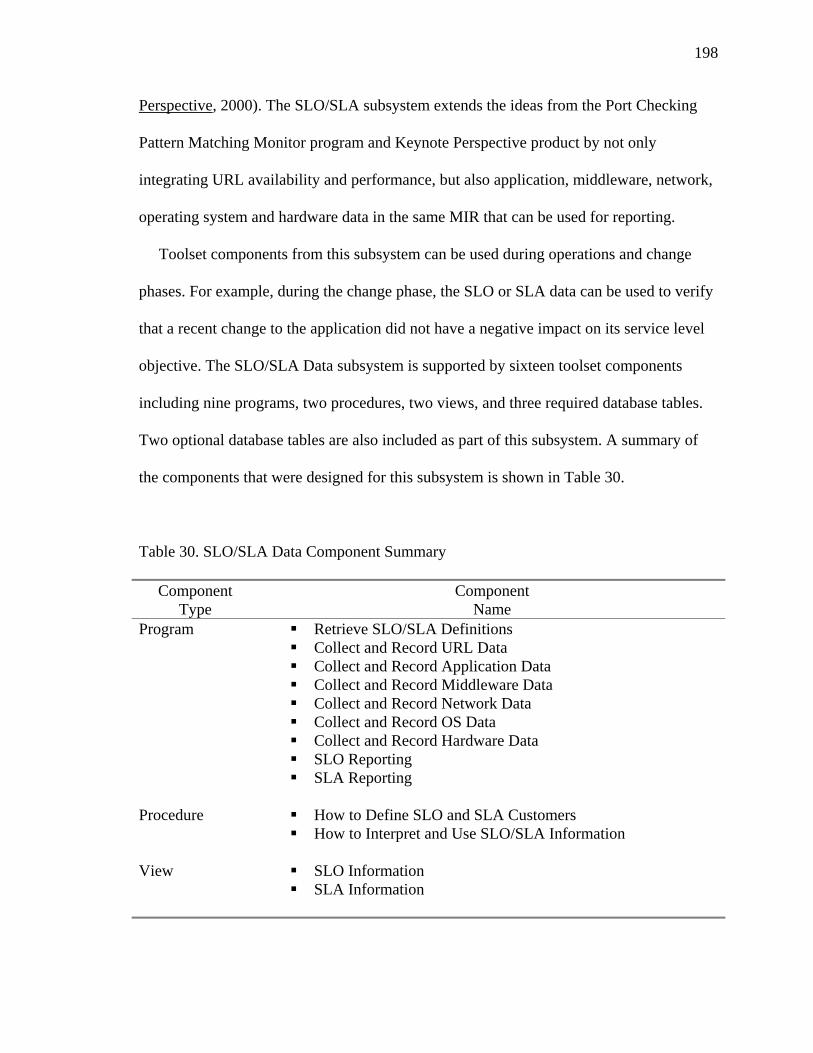
198
Perspective, 2000). The SLO/SLA subsystem extends the ideas from the Port Checking
Pattern Matching Monitor program and Keynote Perspective product by not only
integrating URL availability and performance, but also application, middleware, network,
operating system and hardware data in the same MIR that can be used for reporting.
Toolset components from this subsystem can be used during operations and change
phases. For example, during the change phase, the SLO or SLA data can be used to verify
that a recent change to the application did not have a negative impact on its service level
objective. The SLO/SLA Data subsystem is supported by sixteen toolset components
including nine programs, two procedures, two views, and three required database tables.
Two optional database tables are also included as part of this subsystem. A summary of
the components that were designed for this subsystem is shown in Table 30.
Table 30. SLO/SLA Data Component Summary
Component Type
Component Name
Program Retrieve SLO/SLA Definitions Collect and Record URL Data Collect and Record Application Data Collect and Record Middleware Data Collect and Record Network Data Collect and Record OS Data Collect and Record Hardware Data SLO Reporting SLA Reporting
Procedure How to Define SLO and SLA Customers How to Interpret and Use SLO/SLA Information View SLO Information SLA Information

199
Table 30. (continued)
Component Type
Component Name
Table Application Definition SLO/SLA Definitions SLO/SLA Log SLO/SLA Log Summary (optional) SLO/SLA View History (optional)
The Retrieve SLO/SLA Definitions program performs a control function for the other
programs in this subsystem by coordinating and synchronized their collection operations.
The actions of this program are controlled by the contents of the SLO/SLA Definitions
database table. There are six programs that are used to collect and record specific data.
These programs are the Collect and Record URL Data program, the Collect and Record
Application Data program, the Collect and Record Middleware Data program, the Collect
and Record Network Data program, the Collect and Record OS Data program, and the
Collect and Record Hardware Data program. The specific data they record is described in
their names. Two other programs, the SLO Reporting and SLA Reporting programs
generate the reports that are needed to make use of the data from this subsystem.
The How to Define SLO and SLA Customers procedure describes the basic definitions
that are needed by the subsystem. The How to Interpret and Use SLO/SLA Information
procedure is focused on the operational aspects of the subsystem. A significant focus of
this procedure in understanding and using the information that is in the subsystem reports.
Two views are supplied with this subsystem. The SLO Information and SLA Information
views display reports that contain information about a specific service level objective or
service level agreement Web application.
200
The Application Definition database table is used to identify the SLO or SLA Web
application. The SLO/SLA Definitions database table is used to contain the parameters
that the subsystem needs to support its operation. The SLO/SLA Log database table
contains message data that documents the operation of the subsystem over a period of
time.
Support for the Software Distribution Functional Perspective The software distribution perspective is supported by the Deployment Monitoring and
MIR Creation subsystems. The purpose of the Deployment Monitoring subsystem is to
monitor and manage mission-critical software distributions of Web applications. The
concept of deployment that is used in this subsystem makes it possible to take an already
installed and configured application and copy it into a completely new environment. For
example, an application that is running in a verification environment could be copied with
a single deployment action into a new or existing production environment.
Several existing products influenced the design of this subsystem. The POSIX.
standard, which includes utilities that facilitate software distribution, were building blocks
for this subsystem. POSIX includes copy distribution, package distribution, and verify
software utilities. It also has software structures like bundles and filesets that make
standardized software distribution possible (Information Technology - Portable, 1995).
This subsystem can use the POSIX utilities as it manages the deployment of an
application to a target domain. Gumbold (1996) described software distribution by
reliable multicast that involved an end-to-end application layer protocol. That researcher's
work utilized a thin transport layer and a best effort network layer multicast service which

201
could be integrated into a deployment approach that ensured successful delivery to the
target system.
Osel and Gansheimer (1995) described the use of the OpenDist toolset to synchronize
file servers. OpenDist is another example of a utility that could be used and managed as
part of a Web application deployment. The added value of domain management provided
by the Deployment Monitoring subsystem could heighten the usefulness of utilities like
OpenDist. Toolset components from this subsystem are most useful during deployment,
operations, and change phases. However, the procedure How to Design for Deployments
would be useful to application developers during the design phase.
The Deployment Monitoring subsystem is supported by twelve toolset components
including five programs, three procedures, one view, and three required database tables.
Two optional database tables are also included as part of this subsystem. A summary of
the components that were designed for this subsystem is shown in Table 31.
Table 31. Deployment Monitoring Component Summary
Component Type
Component Name
Program Start Deployment Stop Deployment Restart Deployment Coordinate Deployment Deployment Monitoring Procedure How to Set Up for Deployments How to Manage Deployments How to Design for Distribution View Deployment Management

202
Table 31. (continued)
Component Type
Component Name
Table Application Definition Deployment Definitions Deployment Status Log Deployment Status Log Summary (optional) Deployment Status View History (optional)
The Start Deployment, Stop Deployment, and Restart Deployment programs are all
utilities that support the actions implied by their program names. These actions are
selected from a operator-action view supported by the toolset. The Coordinate
Deployment program is the main module that supports the subsystem. It invokes the other
utility functions as required and ensures that actions are logical. For example, the
Coordinate Deployment program will not start an already started deployment and will
only restart and deployment that has a previously unsuccessful start operation. The
Deployment Monitoring program is used to proactively support active deployments by
continuously examining the utility logs of dependent programs for messages upon which
it relies to determine the success or failure of software distributions.
The How to Set Up for Deployments procedure explains the main concepts regarding
deployment and how to set up subsystem files to best support the needs of the Web
application. The How to Manage Deployments procedure is a guide to operations for the
subsystem. The target audience is support personnel. The How to Design for Distribution
procedure is written for the application designer and focuses on key items that should be
considered during the design of the Web application. The Deployment Management view
is the focal point for information about a specific deployment of a Web application. The
report in the Deployment Management view explains if the deployment was successful
203
and provides the ability to browse logs to examine key messages associated with the
utilities that were used.
Three database tables are used by the Deployment Monitoring subsystem. The
Application Definition database table is used to identify the applications that can be used
by this subsystem. The Deployment Definitions database table is used to hold the
parameters that control the subsystem. An example is the setting to simulate deployment.
This setting has a yes or no value. If set to yes, the Deployment Monitoring subsystem
will try all operation and utility functions in a non-permanent way making it possible for
the administrator to discover and fix problems before they occur during a real change
window. The Deployment Status Log database table is used to store messages that
indicate the success or failure of deployment actions.
The MIR Creation subsystem is the second subsystem in support of the software
distribution perspective. The purpose of the MIR Creation subsystem is to populate the
MIR with information in support of packaged distributions. This subsystem directly
supports other subsystems like Automated Installation and Configuration by reducing the
burden of predefining the files, programs, and other objects needed to support automated
actions. The idea of a MIR creation utility is based on a number other utilities and this
researcher's experiences working with software tools. In the early 1990's, a powerful
object-based system called the Resource Object Data Manager was delivered by IBM as a
component of NetView (Finkel and Calo, 1992). The Resource Object Data Manager was
complex to use and it was not until utilities were supplied to populate its MIR that it
became popular and more useful. BLDVIEWS is an example of a Resource Object Data
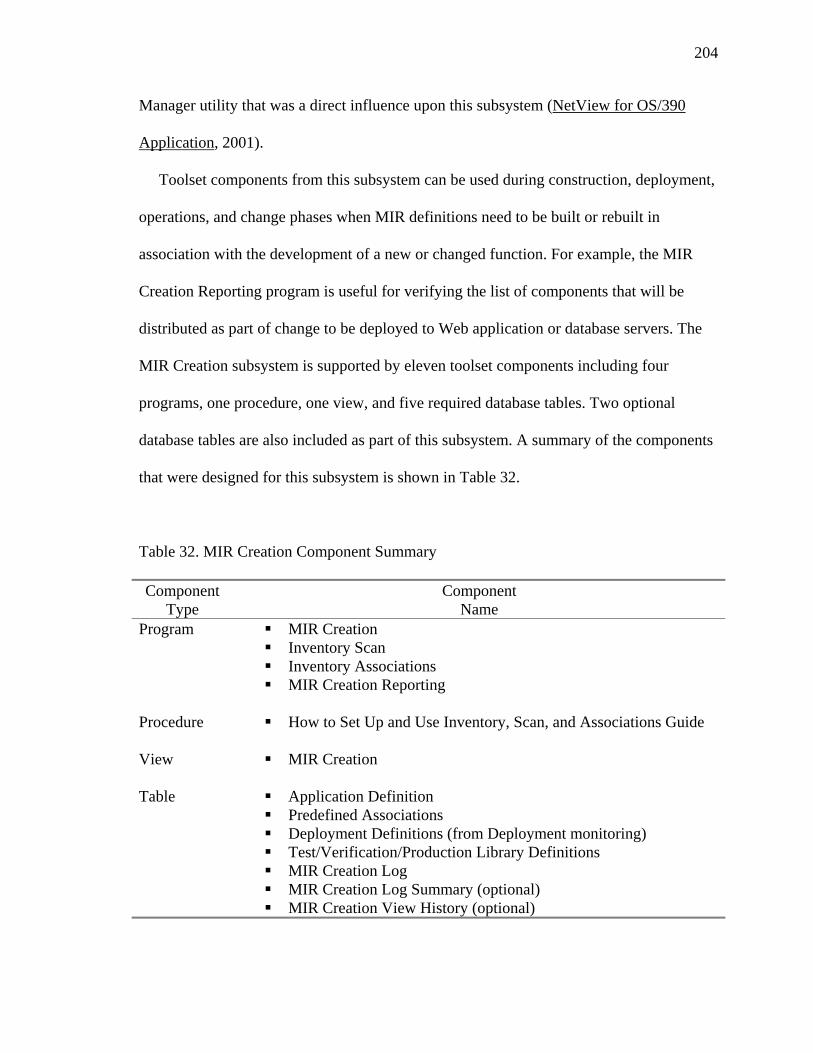
204
Manager utility that was a direct influence upon this subsystem (NetView for OS/390
Application, 2001).
Toolset components from this subsystem can be used during construction, deployment,
operations, and change phases when MIR definitions need to be built or rebuilt in
association with the development of a new or changed function. For example, the MIR
Creation Reporting program is useful for verifying the list of components that will be
distributed as part of change to be deployed to Web application or database servers. The
MIR Creation subsystem is supported by eleven toolset components including four
programs, one procedure, one view, and five required database tables. Two optional
database tables are also included as part of this subsystem. A summary of the components
that were designed for this subsystem is shown in Table 32.
Table 32. MIR Creation Component Summary
Component Type
Component Name
Program MIR Creation Inventory Scan Inventory Associations MIR Creation Reporting Procedure How to Set Up and Use Inventory, Scan, and Associations Guide View MIR Creation Table Application Definition Predefined Associations Deployment Definitions (from Deployment monitoring) Test/Verification/Production Library Definitions MIR Creation Log MIR Creation Log Summary (optional) MIR Creation View History (optional)

205
The MIR Creation program is the main utility of this subsystem that is used to build
tables that are used by other subsystems in the toolset. The history of creation activities is
kept in the MIR Creation Log database table. The Inventory Scan program is used to read
files, based on predefined library definitions that contain Web application elements. This
program provides a utility function to the other programs in the subsystem. The Inventory
Associations program is another utility program. This program is used to define
associations between elements at the file level and a specific Web application. This
program uses input specifications that are flexible, for example, a specification of
BLG*/B2B-EzTran can be used to associate any file name beginning with BLG and
ending with any characters with the B2B-EzTran Web application. The MIR Creation
Reporting program uses the data in the MIR Creation Log database table to create reports
about MIR creation activity. The How to Set Up and Use Inventory, Scan, and
Associations Guide is used to explain how to use the MIR Creation subsystem. The MIR
Creation view is used to display the reports associated with the subsystem.
Five database tables are used with this subsystem. The Application Definition database
table is used here as it is used with other subsystems to identify Web applications upon
which the toolset can perform actions. The Predefined Associations database table is used
to associate files and other Web application components with a specific Web application.
The Deployment Definitions database table, which was created by the Deployment
Monitoring subsystem, is used by this subsystem as it contains some key data that can be
used for MIR creation activities. The Test/Verification/Production Library Definitions
database table is used to identify files or collection of files (libraries) that are needed to
206
support the MIR Creation programs. The MIR Creation Log database table is used to
contain messages that record the results of the MIR Creation subsystem's activities.
Other Support for the Functional Perspectives In addition to the 19 subsystems, support was needed for functions like data transfer to
legacy problem-management systems and seamless interface to existing tools and
products. Support for these functions was created for the prototype toolset as needed and
not the focus of significant design activity.
Application Segment Strategy and Planning for Scenario Development This part of the chapter describes the application segment strategy and scenario
planning that was developed for the five scenarios for the prototype and related study.
Hough (1993) explained that RAD or Rapid Delivery is a method for developing
applications that can evolve over time. A key step in the Rapid Delivery approach is
application segmentation, a technique that makes it possible to break applications into a
variety of functional capabilities. The application segment strategy for this toolset was to
develop a subset of the fully designed toolset. The subset to be developed was determined
by the functions required by the five scenarios. Unlike some segment strategies, this
strategy had a fixed amount of function to be developed in order to create the prescribed
amount of function that was to be evaluated by the survey participants. The other aspect
of this strategy was the approach to be used to develop the prototype. The approach that
was used involved the creation of the user interface, the creation of the supporting
database tables, and the exploitation of the database and data through the user interface.
These three steps in this sequence were used to create the prototype toolset. Each scenario
is now explored in detail. The information in this part of the segment strategy acted as a
207
roadmap for the development of the HTML views. This part of the application sequence
strategy focuses primarily on the user interface.
Web Application Operational Fault
In this first scenario, the Web application failed and an event was generated and
captured by the toolset. The failing application, which supports the General Ledger
function, has been instrumented to gather fault data and make it available to the system
administrator and support personnel. The root cause of the application failure was a
database problem that first evidenced itself with a Structured Query Language (SQL)
error. The application responded to the application error by invoking the Smart Fault
Generation subsystem.
A number of toolset subsystems were used in this scenario. Smart Fault Generation
was used to examine the primary fault data as well as additional information captured by
that subsystem. The Detailed Data subsystem was used to examine the cause description,
specified action, and long term recommendation, and contact information associated with
the fault record. The Resource Modeling subsystem was used to determine if the Web
application was exceeding disk, memory, processor, and I/O resources. Finally, the
Administrator’s Action view of the Specific Fault subsystem was used to transfer the fault
to the problem management system.
The planned flow of activities that supported the development of this scenario was as
follows:
- An event was generated by the application and appears on the Specific Fault View.
This view was part of the Smart Fault Generation subsystem.

208
- The Detailed Data subsystem was invoked from the Specific Fault View to
determine what actions are to be taken.
- Vendor recommended actions were taken (see details on the specific error, below)
using the Telnet utility to access the database server.
- Additional site-specific actions were taken. Since this error was probably memory
related the resource modeling subsystem was checked to see if exceptions were
recorded. Finally, the actions taken were recorded using the Administrator’s
Action view of the Specific Fault subsystem and the fault data was transfered to
the problem-management system.
The specific error that was the root cause of the fault is SQL10003C. This error is
generated when there are not enough system resources to process the request. The request
is aborted because it cannot be processed. The cause is the database manager could not
process the request due to insufficient system resources. The resources that can cause this
error are the amount of memory in the system or the number of message queue identifiers
available in the system. The action to be taken when this error occurs is to stop the
application. Possible solutions to this problem include remove background processes or
terminate other applications using the needed resources. If Remote Data Services are in
use, it is recommended to increase the Remote Data Services heap size (rsheapsz) in the
server and client configuration because at least one block is used per application. It is also
recommented to decrease the values of the configuration parameters that define allocation
of memory, including udf_mem_sz if UDFs are involved in the failing statement. When
209
this error occurs a sqlcode of -10003 and a sqlstate of 57011 are also created and returned
to the program (Database 2 Messages Reference, 1995).
Web Application Deployment is Unsuccessful
In this scenario, the deployment of the Web application was unsuccessful and the
failure was detected by the toolset. The deployment was part of a sequence of activities
that included application installation and configuration activities initiated by the
administrator. The application that failed supported Human Resources Benefits
Administration. After detection of the deployment failure, the administrator worked with
the development team to correct the problem and then transferred the fault to the problem
management system for problem tracking and close out. Several reports were created that
contain information about the installation, configuration, and deployment outcomes.
A number of subsystems were used in this scenario. Automatic Installation and
Configuration were used to install and configure the Web application. Deployment
Monitoring was used to initiate the deployment and to monitor and manage the Web
application software distribution including the possibility of restoring the previous version
of the application if appropriate. The Specific Fault and Detailed Data subsystems were
used to view specific exceptions and detail data. Finally, actions taken by the
administrator were recorded and the fault was transferred to the problem management
system.
The planned flow of activities that supported the development of this scenario was as
follows:
210
- The Automated Installation view was used to verify a successful installation of the
application. This view was part of the Automated Installation and Configuration
subsystem.
- Next, the Automated Configuration View was used see if configuration actions
previously performed were successful. Successful installation and configuration
was required before deployment could begin.
- Deployment Monitoring was used to initiate the deployment to the verification
system, but it failed.
- Vendor recommended actions were taken by the support team (see details on the
specific error, below) using the Telnet utility to access an application server and to
fix the problem. Deployment Monitoring was used to restart the deployment to the
verification system and it was now successful.
- The actions taken were recorded in the Specific Fault view and the fault data
(generated when original deployment failed) was transfered to the problem-
management system as a closed record.
The specific error that was the root cause of the fault is--DIS:SENG:0033 Error:
Cannot create temporary file 'path'. The explanation for this error is the system is not able
to create a temporary or backup file in the service area. The variable 'path' in the message
will contain the actual directory path name of the temporary or backup file which failed to
be created. The system action is that the operation failed. The suggested operator response
is to check for space availability in the service area or the existence of a file with the same
name, then try the operation again (TME 10 Software Distribution, 1998).

211
Web Application Change Results in Poor Performance In this scenario, new functionality was installed for a Web application. The application
was a Business-to-Business site called OrderMarketplace. After the application change,
poor application performance was detected by the toolset and a problem component was
identified. The root cause of the problem was a middleware definition file that was
changed and tested for this release of the application, but not migrated as part of the
planned change.
A number of subsystems were used in this scenario. The Change-Window Awareness
subsystem was used to see if there was an active change window or to examine the status
of the last change. The Unauthorized Change subsystem was used to check for
unauthorized changes. The Configuration Verification subsystem was used to check if the
system with the problem matches the verification system after which it is modeled. The
Deep View subsystem was used to look for other potential impacts of the problem.
The planned flow of activities was as follows:
- Web application monitoring reveals that the Web application is operating, but
performing more slowly than expected after an application change.
- The Change Window Awareness view was used to see if there was an active
window. The administrator was wondering--perhaps the change is still in
progress?
- Next, the Unauthorized Change view was used to check for any unauthorized
changes. An unauthorized change might be the reason for the performance
problems.
212
- The Configuration Verification view was used to see if the system with the
problem was configured properly as compared to other versions of the application
installed in other domains.
- When the configuration problem was found, the application support analyst was
notified and took responsibility for correcting the problem. The actions taken were
recorded in the Specific Fault view and the fault data was transfered to the
problem-management system as a open record.
This error was related to the WebLogic Properties file and the WebLogic System
Execute Thread Count. This value in the WebLogic Properties file equals the number
of simultaneous operations that can be performed by the WebLogic Server. As work
enters a WebLogic Server, it is placed on an execute queue while waiting to be
performed. This work is then assigned to a thread that performs the work. In this
problem scenario, the thread count in the active definition was too low for the manner
in which the application was designed and work was backing up due to this artificially
low setting (Tuning the WebLogic Server, 2000).
Web Application Experiencing Bottlenecks as Some Queries Take a Long Time In this scenario, certain inquiry functions of the Web application were taking a long
time to complete. The application in this scenario supported business to business
transactions. The brand name of the application was b2b-EzTran. The toolset was used to
detect and correct the database functions that were performing poorly. The database was
performing poorly because of the way that the application programmer had written the
SQL statement. In the test system, this coding technique did not present a problem
because the volume of application data was low. When the program was migrated into the

213
production system it performed poorly due to the greatly increased volume of application
data in the database tables.
A number of subsystems were used in this scenario. The Application Bottleneck
subsystem was used to look for specific application, database, and middleware
bottlenecks. Support services were used to interface with a database deep-analysis tool.
This tool used DB2 Event Monitor trace records to identify long running SQL statements.
The Fault Generation subsystem was used to manage the fault detected by the database
deep-analysis tool as was the Detailed Data subsystem get detailed information on the
fault. The SLO/SLA subsystem was used to determine the impact of the bottleneck on
customer satisfaction (and contractural implications). Finally, support services were used
to transfer the fault to the problem-management system.
The planned flow of activities was as follows:
- Software that is monitoring the customer experience with the application records
long responses with some transactions within the application.
- The Application Bottleneck view was used to see if the toolset has detected any
slowdowns with the application itself or the supporting database or middleware
systems.
- Support services were used to interface with a database deep-analysis tool. This
tool was used because application bottlenecks indicated that there was a problem
in the database.

214
- The Fault Generation view was used to manage the fault detected by the database
deep-analysis tool. The fault contains considerable detail on the database-related
problem.
- The Detailed Data view was used to examine and understand the details associated
with the fault
- The SLO/SLA subsystem was used to determine the contractural impact of the
bottleneck and then the actions taken were recorded in the Specific Fault view and
the fault data was transfered to the problem-management system as a open record.
This error was caused when a recently implemented SQL query in the Web application
performed poorly because a search field was not indexed. The problem did not evidence
itself in testing because the system contained a small volume of data. The problem was
solved quickly using several Create Index commands. A Create Index command is
typically executed when the database is defined, but the dynamic nature of today's
database systems allows this function and others to be performed on a running production
system (Pratt, 1990).
Overall Response for the Web Application is Slow, but the Application is Still Functional In this scenario, the Web application was performing slowly, but all components were
available. The toolset's deep availability capability was used to determine the root cause
of the overall poor performance. This problem situation was particularly challenging
because several problems were detected at about the same time. The problems include
degraded application and database functions involving stalled application programs and
database table deadlocks. Sample transactions that were used to simulate human users

215
were running slowly and completing in times that were greater than the thresholds that
were set for them.
A number of subsystems were used in this scenario. The Deep View subsystem was
used to take a comprehensive look at the operational status of the application. Next, the
Business Views subsystem was used to see what business system the application was part
of and what applications may be affected. The Intimate Performance subsystem was used
to examine both application-specific and proxy performance data. The Smart Fault
Generation subsystem was used to manage the fault detected by the Intimate Performance
subsystem. Also, the Detailed Data subsystem was used to get details on the fault. Finally,
support services were used to transfer the fault to the problem-management system.
The planned flow of activities was as follows:
- Users of the Value Market application report slow response with the application.
They tell the help desk that "everything is working, but taking much more time
than usual".
- The Deep Information view was used to get a comprehensive view of the
application--everything that has been recorded for availability, automation,
capacity, and the other perspectives. This view gave some clues regarding what to
examine next to determine the root cause of the problem.
- Business Views was used to look for degraded application resources. Degraded
indicates that servers or databases are working, but something is limiting their
productivity or throughput.

216
- The Intimate Performance view was used to confirm what was found in the other
views about degraded resources.
- The Specific Fault view was used to manage the fault detected by the Intimate
Performance subsystem. Also, the Detailed Data view was used to examine and
understand the details associated with the fault.
- Since there were so many problems--failed restarts, switch faults, and processor
faults the development team was contacted and the actions taken were recorded in
the Specific Fault view and the fault data was transfered to the problem-
management system as a open record.
These errors were caused by a number of unrelated problems. Although they are
unrelated, they nevertheless have a collectively negative impact on the application. The
failed restarts were related to a resource shortage that was inhibiting the restarting of a
failed application task or supporting middleware or database component. The notion of
automatically restarting failed components is well established in some domains. In
parallel systems with high levels of concurrent processing the first monitor that finds a
component missing restarts it (Overview of Parallel, 2002). Only recently, have software
developers begun to implement automation at the application level. The switch faults in
this scenario were the result of human error in the configuration of these network devices.
Devices on the same network interface card should be set to the same speed. If they are
not, errors will result on that port. This can impact the performance of the site, especially
if that is the only connection from the Web servers to the Internet (I. Ahad, personal
communication, December 15, 2000). The processor faults were generated because the
CPU on the Web servers were running at greater than 95% utilization for an extended

217
period of time. Menasce and Almeida (1999) wrote about the capacity challenges
associated with the unpredictable characteristics of Web service requests. The processor
faults in this situation could be the result of a peak load or a basic mismatch between the
everyday needs of the application and the CPU capacity of its servers.
Toolset Implementation Utilizing the Segment Strategy The toolset components developed to support the five scenarios and related toolset
evaluation are summarized in this part of the chapter. The discussion focuses on the
subsystems, graphical interface, and database implementation used in the five scenarios.
The five scenarios exploited the functionality of 15 of the 19 subsystems that made up the
toolset design (see Table 33).
Table 33. Subsystems and Related Scenarios
Subsystem Name Scenario Number
Resource Modeling 1
Resource Accounting N/A
Automated Installation and Configuration 2
Configuration Verification 3
Template Creation 5
Component Comparison N/A
Deep View 5
Business Views 5
Application Bottlenecks 4

218
Table 33. (continued)
Subsystem Name Scenario Number
Unauthorized Change Detection 3
Change-Window Awareness 3
Smart Fault Generation 1, 2, 3, 4, 5
Integrated Operations N/A
Intimate Performance 5
Detailed Data 1, 2, 3, 4, 5
Interface Monitoring N/A
SLO/SLA data 4
Deployment monitoring 2
MIR Creation 3, 4
Subsystem support facilities for the functional perspectives were also exploited. These
facilities were used to interface with utilities and other systems like a legacy problem
management system. Table 33 contains a list of the subsystems and the scenarios that used
them. The Smart Fault and Detailed Data subsystems were used in all five scenarios.
The graphical user interface that was developed consisted of 12 independent Web
pages and 37 framesets consisting of 74 frames. The Web pages were designed using a
consistent layout throughout. For the Web pages that were not part of a frameset the
layout consisted of the full life cycle graphic in the upper left side with text left justified
prominently displayed on the page. All the Web pages contain the current date, time, and
used a consistent color scheme. A sample Web page is shown in Figure 13.
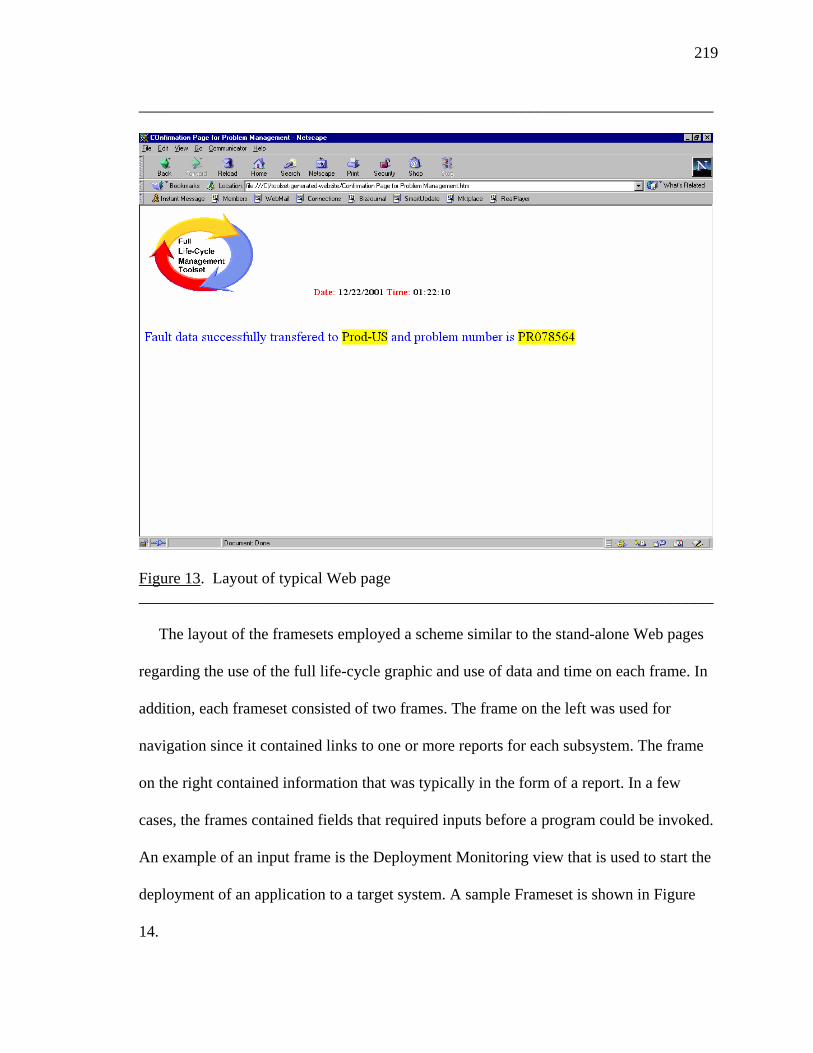
219
________________________________________________________________________
Figure 13. Layout of typical Web page ________________________________________________________________________
The layout of the framesets employed a scheme similar to the stand-alone Web pages
regarding the use of the full life-cycle graphic and use of data and time on each frame. In
addition, each frameset consisted of two frames. The frame on the left was used for
navigation since it contained links to one or more reports for each subsystem. The frame
on the right contained information that was typically in the form of a report. In a few
cases, the frames contained fields that required inputs before a program could be invoked.
An example of an input frame is the Deployment Monitoring view that is used to start the
deployment of an application to a target system. A sample Frameset is shown in Figure
14.

220
________________________________________________________________________
Figure 14. Layout of typical frameset ________________________________________________________________________
The database for the toolset was developed using a relational database management
system. Fifteen unique tables were defined to support the prototype toolset. A data
dictionary was created in support of these tables and can be found in Appendix H - Data
Dictionary for Full Life-Cycle Toolset. The Data Dictionary contains definitions for the
dozens of numeric, text, and date/time fields that were created to support the prototype.
The tables that were created in support of the prototype are summarized in Table 34.

221
Table 34. Subsystems and Related Tables to Support the Prototype
Subsystem Name Table Name
Resource Modeling Application Definition Resource Modeling Log Resource Modeling Monitoring Input
Resource Accounting N/A
Automated Installation and Configuration
Application Definition Automated Installation and
Configuration Log
Configuration Verification Application Definition Configuration Verification Log
Template Creation Application Definition
Component Comparison N/A
Deep View Application Definition
Deep View Application Resources
Business Views Application Definition Business Systems Definitions Application Resources Log
Application Bottlenecks Application Definition
Application Capacity Data
Change-Window Awareness Application Definition Change-Window Operations Log
Smart Fault Generation Application Definition
Specific Fault Data
Integrated Operations N/A
Intimate Performance Application Definition
Detailed Data Application Definition Detailed Data

222
Table 34. (continued)
Subsystem Name Table Name
SLO/SLA data Application Definition SLO/SLA Definitions SLO/SLA Log
Deployment monitoring Application Definition
Deployment Status Log
Toolset Evaluation The evaluation of the toolset is discussed in this part of the chapter. The focus is
information about the data collected during the evaluation step. The findings from the
survey are discussed including a profile of the participants, responses to the survey, and
written comments on the strengths and weaknesses of the toolset.
Findings from the Survey The development effort to create the toolset began using the software tools described
in Chapter 3. The first challenge was developing a large number of framesets and stand-
alone HTML Web pages. Initially Netscape Composer was used for this purpose, but the
limitations of the tool regarding a prototype of this size were quickly met. Missing from
Netscape Composer were facilities that would automatically name and store objects, a
database interface, and a library structure. To address the needs of a development project
of this size, a tool that provided a productive development environment was needed. E-
Commerce Construction Kit was chosen because it had a frame generator, database
support, and site promotion capability and a cost of around $50. The program is
distributed by Macmillan Software and is developed by Boomerang Software of Belmont
MA (E-Commerce Construction Kit, 2001). Although there were some technical problems
223
with this software, it was useful in producing the prototype HTML pages and framesets
what were needed to satisfy the technical requirements of the design.
The toolset evaluation involved collecting data from the survey participants using two
instruments. The first instrument, the toolset survey, contained five questions for each
scenario. There were five scenarios in the survey resulting in twenty-five data elements
collected from each participant. The survey also contained three open-ended questions
that were included in the back of the survey to solicit information that might provide some
addition insights into the toolset's strengths and weaknesses. The second instrument, the
survey participant profile questions, was given to the participant after they returned the
toolset survey. In total, the data collected included the participant’s profile information,
responses to the survey questions, and written comments on the strengths and weaknesses
of the toolset. The findings for all of this data are now discussed.
Profile of Participants Thirty-three of 40 individuals that were asked to complete the survey actually
completed it for a participation rate of 83%. The participants were given two weeks to
complete the survey. One out of three participants had to be reminded that the results of
the survey were overdue. The participants were chosen from the large group of
professionals who specialize in the hosting of customer Web applications. The
participants were geographically located in North Carolina, Illinois, Florida, and Georgia
although they generally work in support of the same line of business called IBM e-
Business Hosting. Experienced participants were selected from a broad set of professions
including project management, database support, offering management, system
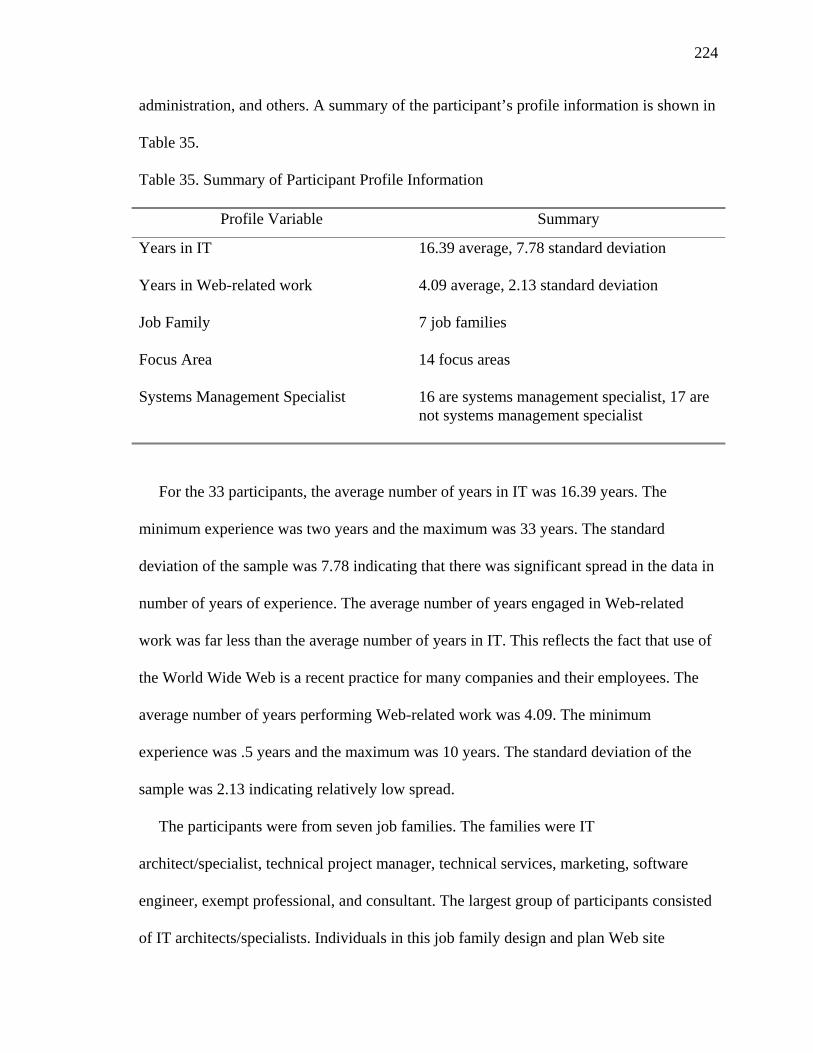
224
administration, and others. A summary of the participant’s profile information is shown in
Table 35.
Table 35. Summary of Participant Profile Information
Profile Variable Summary
Years in IT
16.39 average, 7.78 standard deviation
Years in Web-related work
4.09 average, 2.13 standard deviation
Job Family
7 job families
Focus Area
14 focus areas
Systems Management Specialist 16 are systems management specialist, 17 are not systems management specialist
For the 33 participants, the average number of years in IT was 16.39 years. The
minimum experience was two years and the maximum was 33 years. The standard
deviation of the sample was 7.78 indicating that there was significant spread in the data in
number of years of experience. The average number of years engaged in Web-related
work was far less than the average number of years in IT. This reflects the fact that use of
the World Wide Web is a recent practice for many companies and their employees. The
average number of years performing Web-related work was 4.09. The minimum
experience was .5 years and the maximum was 10 years. The standard deviation of the
sample was 2.13 indicating relatively low spread.
The participants were from seven job families. The families were IT
architect/specialist, technical project manager, technical services, marketing, software
engineer, exempt professional, and consultant. The largest group of participants consisted
of IT architects/specialists. Individuals in this job family design and plan Web site
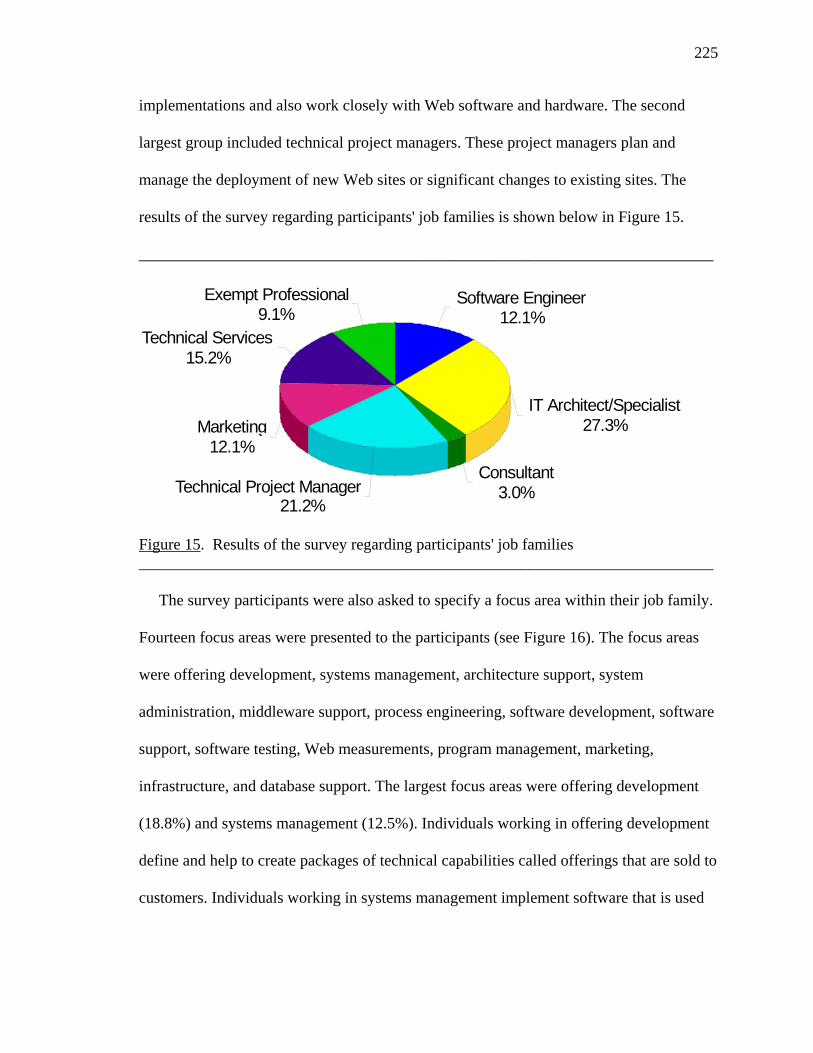
225
implementations and also work closely with Web software and hardware. The second
largest group included technical project managers. These project managers plan and
manage the deployment of new Web sites or significant changes to existing sites. The
results of the survey regarding participants' job families is shown below in Figure 15.
________________________________________________________________________
Software Engineer12.1%
IT Architect/Specialist27.3%
Consultant3.0%Technical Project Manager
21.2%
Marketing12.1%
Technical Services15.2%
Exempt Professional9.1%
Figure 15. Results of the survey regarding participants' job families ________________________________________________________________________
The survey participants were also asked to specify a focus area within their job family.
Fourteen focus areas were presented to the participants (see Figure 16). The focus areas
were offering development, systems management, architecture support, system
administration, middleware support, process engineering, software development, software
support, software testing, Web measurements, program management, marketing,
infrastructure, and database support. The largest focus areas were offering development
(18.8%) and systems management (12.5%). Individuals working in offering development
define and help to create packages of technical capabilities called offerings that are sold to
customers. Individuals working in systems management implement software that is used
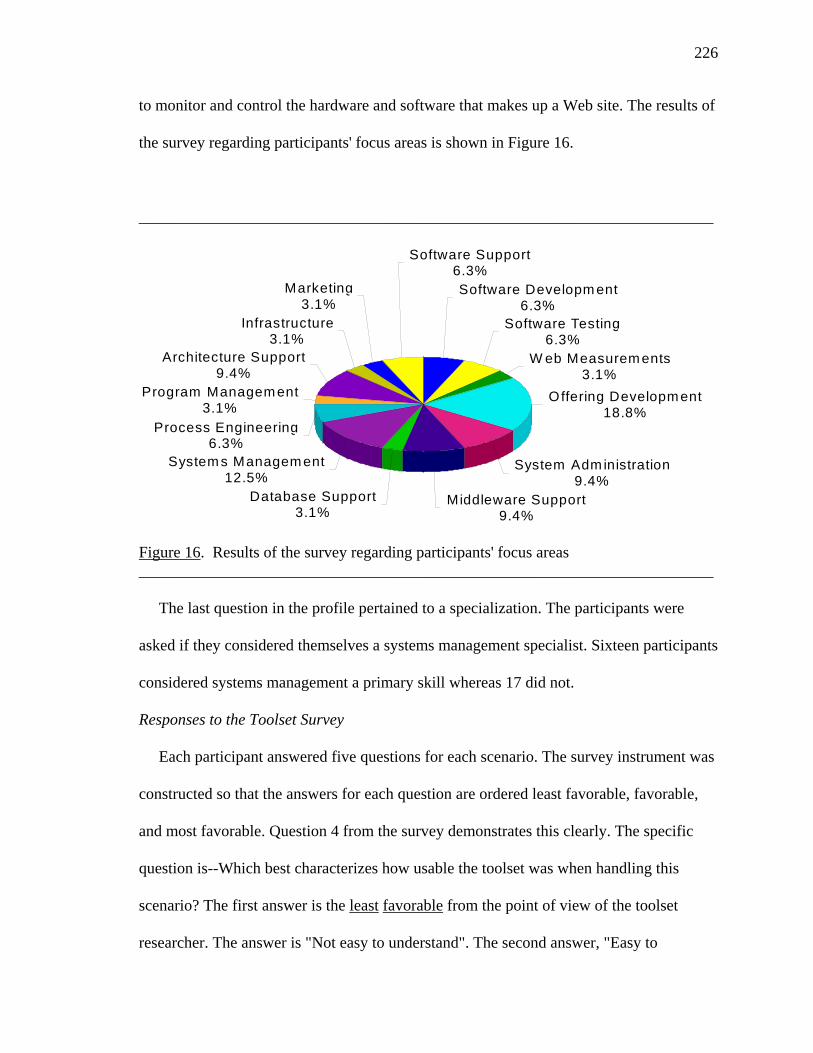
226
to monitor and control the hardware and software that makes up a Web site. The results of
the survey regarding participants' focus areas is shown in Figure 16.
________________________________________________________________________
Software Developm ent6.3%
Software Testing6.3%
W eb Measurem ents3.1%
Offering Development18.8%
System Adm inistration9.4%
Middleware Support9.4%
Database Support3.1%
System s Management12.5%
Process Engineering6.3%
Program Management3.1%
Architecture Support9.4%
Infrastructure3.1%
Marketing3.1%
Software Support6.3%
Figure 16. Results of the survey regarding participants' focus areas ________________________________________________________________________
The last question in the profile pertained to a specialization. The participants were
asked if they considered themselves a systems management specialist. Sixteen participants
considered systems management a primary skill whereas 17 did not.
Responses to the Toolset Survey Each participant answered five questions for each scenario. The survey instrument was
constructed so that the answers for each question are ordered least favorable, favorable,
and most favorable. Question 4 from the survey demonstrates this clearly. The specific
question is--Which best characterizes how usable the toolset was when handling this
scenario? The first answer is the least favorable from the point of view of the toolset
researcher. The answer is "Not easy to understand". The second answer, "Easy to
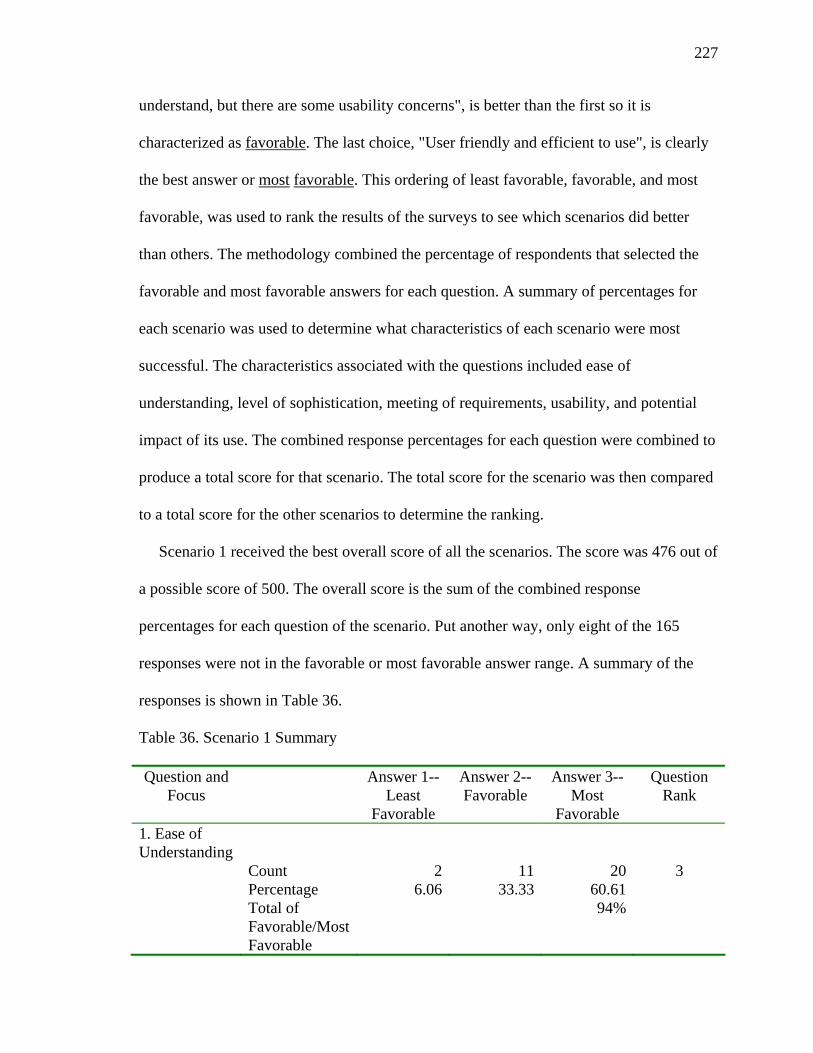
227
understand, but there are some usability concerns", is better than the first so it is
characterized as favorable. The last choice, "User friendly and efficient to use", is clearly
the best answer or most favorable. This ordering of least favorable, favorable, and most
favorable, was used to rank the results of the surveys to see which scenarios did better
than others. The methodology combined the percentage of respondents that selected the
favorable and most favorable answers for each question. A summary of percentages for
each scenario was used to determine what characteristics of each scenario were most
successful. The characteristics associated with the questions included ease of
understanding, level of sophistication, meeting of requirements, usability, and potential
impact of its use. The combined response percentages for each question were combined to
produce a total score for that scenario. The total score for the scenario was then compared
to a total score for the other scenarios to determine the ranking.
Scenario 1 received the best overall score of all the scenarios. The score was 476 out of
a possible score of 500. The overall score is the sum of the combined response
percentages for each question of the scenario. Put another way, only eight of the 165
responses were not in the favorable or most favorable answer range. A summary of the
responses is shown in Table 36.
Table 36. Scenario 1 Summary
Question and Focus
Answer 1--Least
Favorable
Answer 2--Favorable
Answer 3--Most
Favorable
Question Rank
1. Ease of Understanding
Count 2 11 20 3 Percentage 6.06 33.33 60.61 Total of
Favorable/Most Favorable
94%
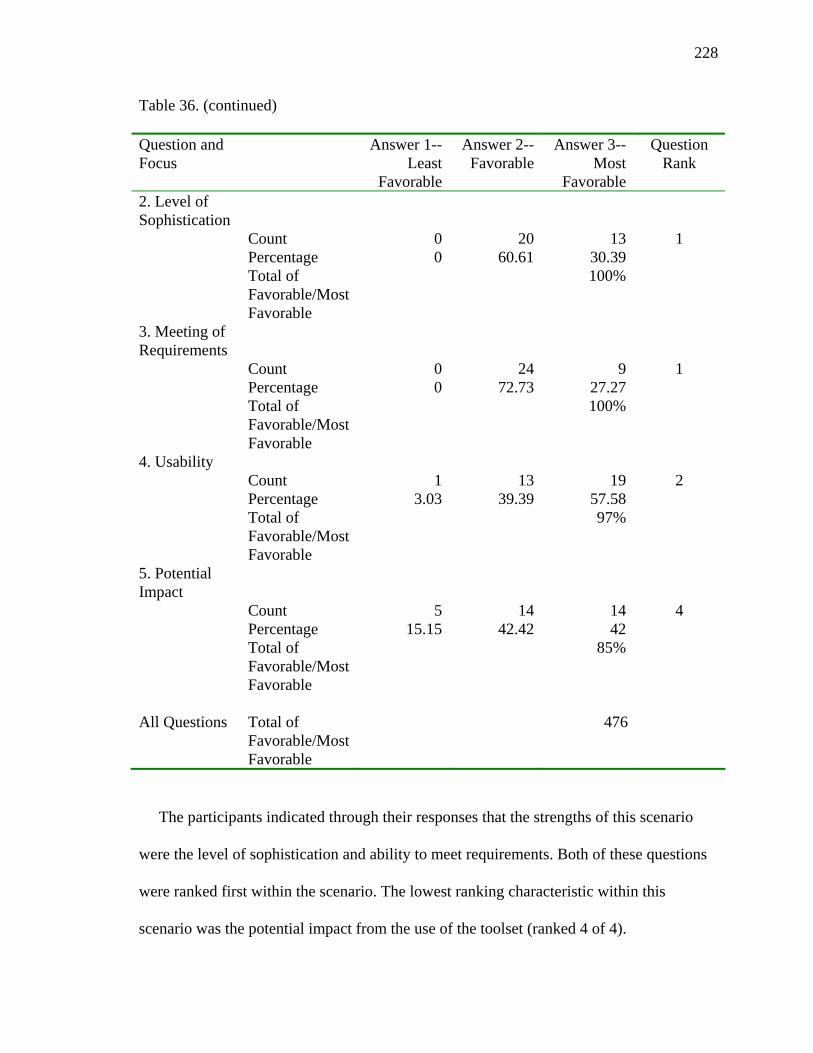
228
Table 36. (continued) Question and Focus
Answer 1--Least
Favorable
Answer 2--Favorable
Answer 3--Most
Favorable
Question Rank
2. Level of Sophistication
Count 0 20 13 1 Percentage 0 60.61 30.39 Total of
Favorable/Most Favorable
100%
3. Meeting of Requirements
Count 0 24 9 1 Percentage 0 72.73 27.27 Total of
Favorable/Most Favorable
100%
4. Usability Count 1 13 19 2 Percentage 3.03 39.39 57.58 Total of
Favorable/Most Favorable
97%
5. Potential Impact
Count 5 14 14 4 Percentage 15.15 42.42 42
Total of Favorable/Most Favorable
85%
All Questions Total of Favorable/Most Favorable
476
The participants indicated through their responses that the strengths of this scenario
were the level of sophistication and ability to meet requirements. Both of these questions
were ranked first within the scenario. The lowest ranking characteristic within this
scenario was the potential impact from the use of the toolset (ranked 4 of 4).
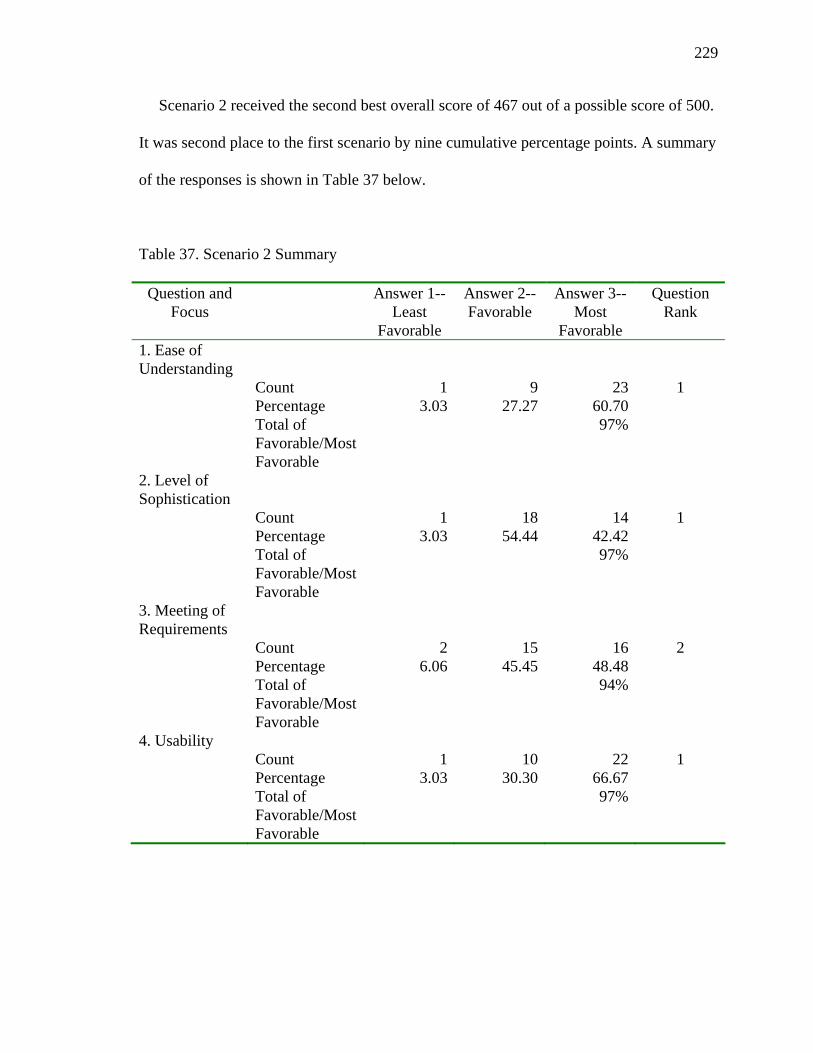
229
Scenario 2 received the second best overall score of 467 out of a possible score of 500.
It was second place to the first scenario by nine cumulative percentage points. A summary
of the responses is shown in Table 37 below.
Table 37. Scenario 2 Summary
Question and Focus
Answer 1--Least
Favorable
Answer 2--Favorable
Answer 3--Most
Favorable
Question Rank
1. Ease of Understanding
Count 1 9 23 1 Percentage 3.03 27.27 60.70 Total of
Favorable/Most Favorable
97%
2. Level of Sophistication
Count 1 18 14 1 Percentage 3.03 54.44 42.42 Total of
Favorable/Most Favorable
97%
3. Meeting of Requirements
Count 2 15 16 2 Percentage 6.06 45.45 48.48 Total of
Favorable/Most Favorable
94%
4. Usability Count 1 10 22 1 Percentage 3.03 30.30 66.67 Total of
Favorable/Most Favorable
97%

230
Table 37. (continued)
Question and Focus
Answer 1--Least
Favorable
Answer 2--Favorable
Answer 3--Most
Favorable
Question Rank
5. Potential Impact
Count 6 14 13 3 Percentage 18.18 42.42 39.39
Total of Favorable/Most Favorable
82%
All Questions Total of Favorable/Most Favorable
467
The participants indicated through their responses that the strengths of this scenario
were the ease of understanding, the level of sophistication and usability. The responses to
these three questions were tied for the first ranking. The lowest ranking was the potential
impact of the use of the toolset (ranked 3 of 3).
Scenario 3 received the fourth best overall score of 443 out of a possible score of 500.
It was 33 cumulative percentage points less favorable than the first place scenario. A
summary of the responses is shown in Table 38.

231
Table 38. Scenario 3 Summary
Question and Focus
Answer 1--Least
Favorable
Answer 2--Favorable
Answer 3--Most
Favorable
Question Rank
1. Ease of Understanding
Count 3 16 14 1 Percentage 9.09 48.48 42.42 Total of
Favorable/Most Favorable
91%
2. Level of Sophistication
Count 5 4 24 3 Percentage 15.15 12.12 72.73 Total of
Favorable/Most Favorable
85%
3. Meeting of Requirements
Count 4 13 16 2 Percentage 12.12 39.39 48.48 Total of
Favorable/Most Favorable
88%
4. Usability Count 4 11 18 2 Percentage 12.12 33.33 54.55 Total of
Favorable/Most Favorable
88%
5. Potential Impact
Count 3 10 20 1 Percentage 9.09 30.30 60.61
Total of Favorable/Most Favorable
91%
All Questions Total of Favorable/Most Favorable
443
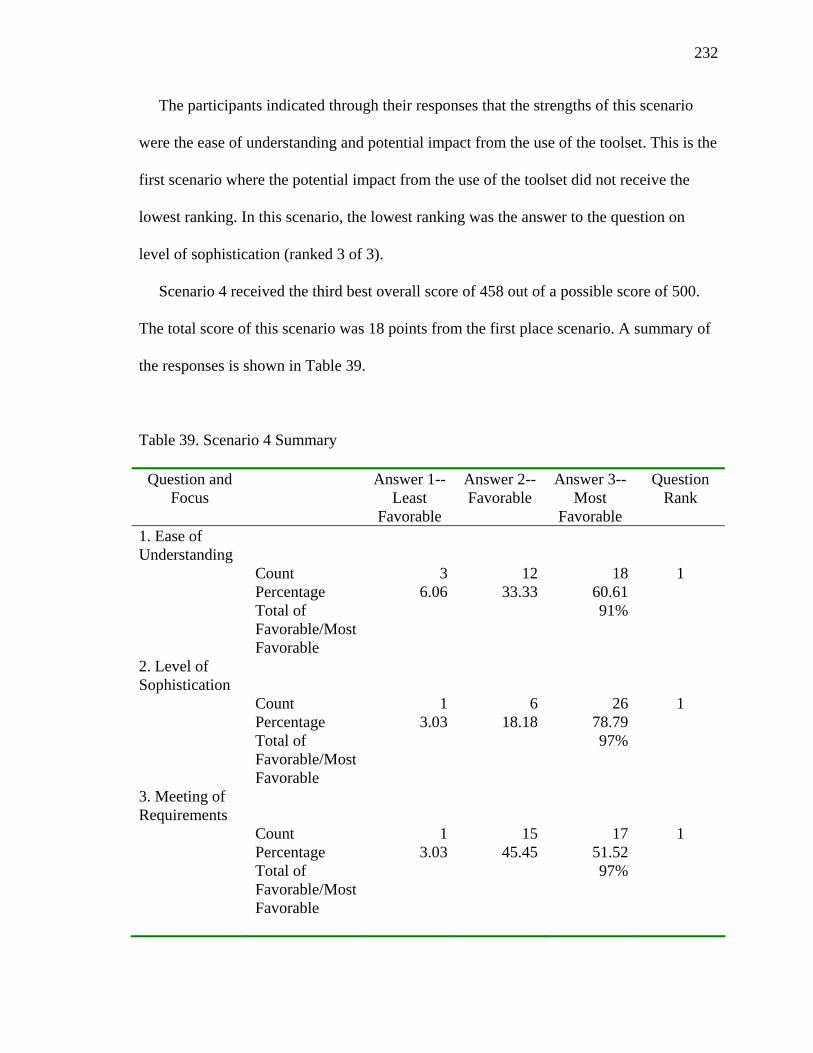
232
The participants indicated through their responses that the strengths of this scenario
were the ease of understanding and potential impact from the use of the toolset. This is the
first scenario where the potential impact from the use of the toolset did not receive the
lowest ranking. In this scenario, the lowest ranking was the answer to the question on
level of sophistication (ranked 3 of 3).
Scenario 4 received the third best overall score of 458 out of a possible score of 500.
The total score of this scenario was 18 points from the first place scenario. A summary of
the responses is shown in Table 39.
Table 39. Scenario 4 Summary
Question and Focus
Answer 1--Least
Favorable
Answer 2--Favorable
Answer 3--Most
Favorable
Question Rank
1. Ease of Understanding
Count 3 12 18 1 Percentage 6.06 33.33 60.61 Total of
Favorable/Most Favorable
91%
2. Level of Sophistication
Count 1 6 26 1 Percentage 3.03 18.18 78.79 Total of
Favorable/Most Favorable
97%
3. Meeting of Requirements
Count 1 15 17 1 Percentage 3.03 45.45 51.52 Total of
Favorable/Most Favorable
97%
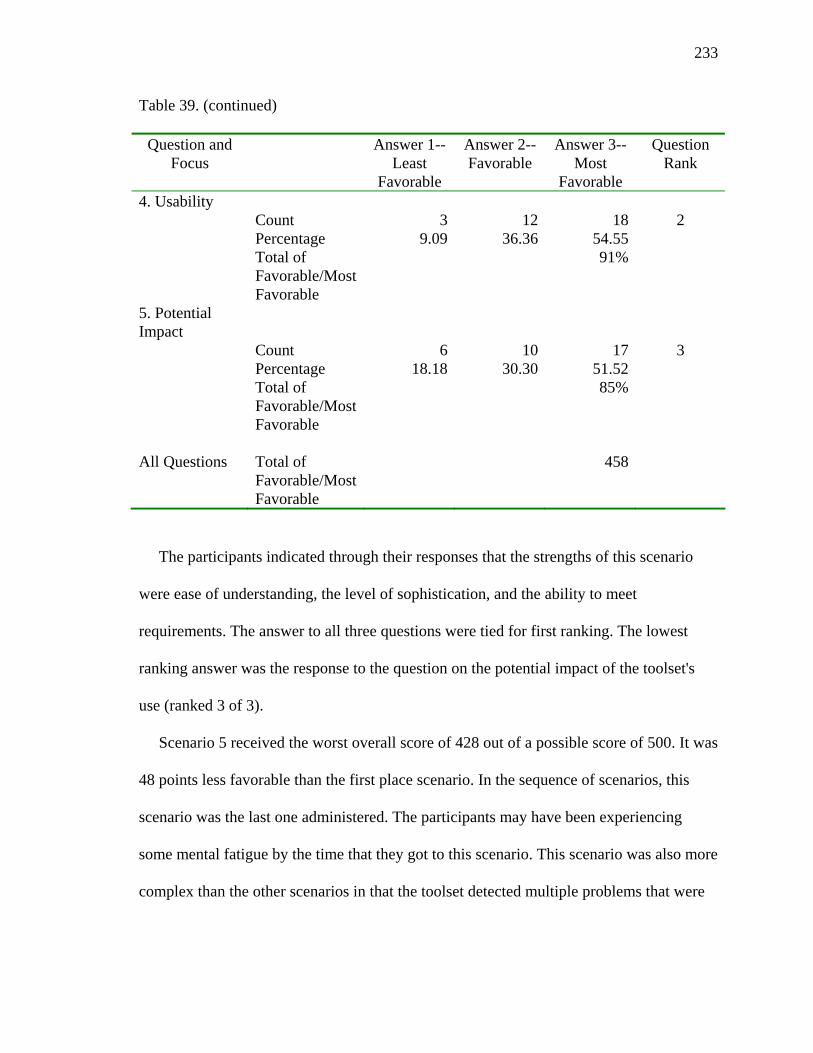
233
Table 39. (continued)
Question and Focus
Answer 1--Least
Favorable
Answer 2--Favorable
Answer 3--Most
Favorable
Question Rank
4. Usability Count 3 12 18 2 Percentage 9.09 36.36 54.55 Total of
Favorable/Most Favorable
91%
5. Potential Impact
Count 6 10 17 3 Percentage 18.18 30.30 51.52
Total of Favorable/Most Favorable
85%
All Questions Total of Favorable/Most Favorable
458
The participants indicated through their responses that the strengths of this scenario
were ease of understanding, the level of sophistication, and the ability to meet
requirements. The answer to all three questions were tied for first ranking. The lowest
ranking answer was the response to the question on the potential impact of the toolset's
use (ranked 3 of 3).
Scenario 5 received the worst overall score of 428 out of a possible score of 500. It was
48 points less favorable than the first place scenario. In the sequence of scenarios, this
scenario was the last one administered. The participants may have been experiencing
some mental fatigue by the time that they got to this scenario. This scenario was also more
complex than the other scenarios in that the toolset detected multiple problems that were
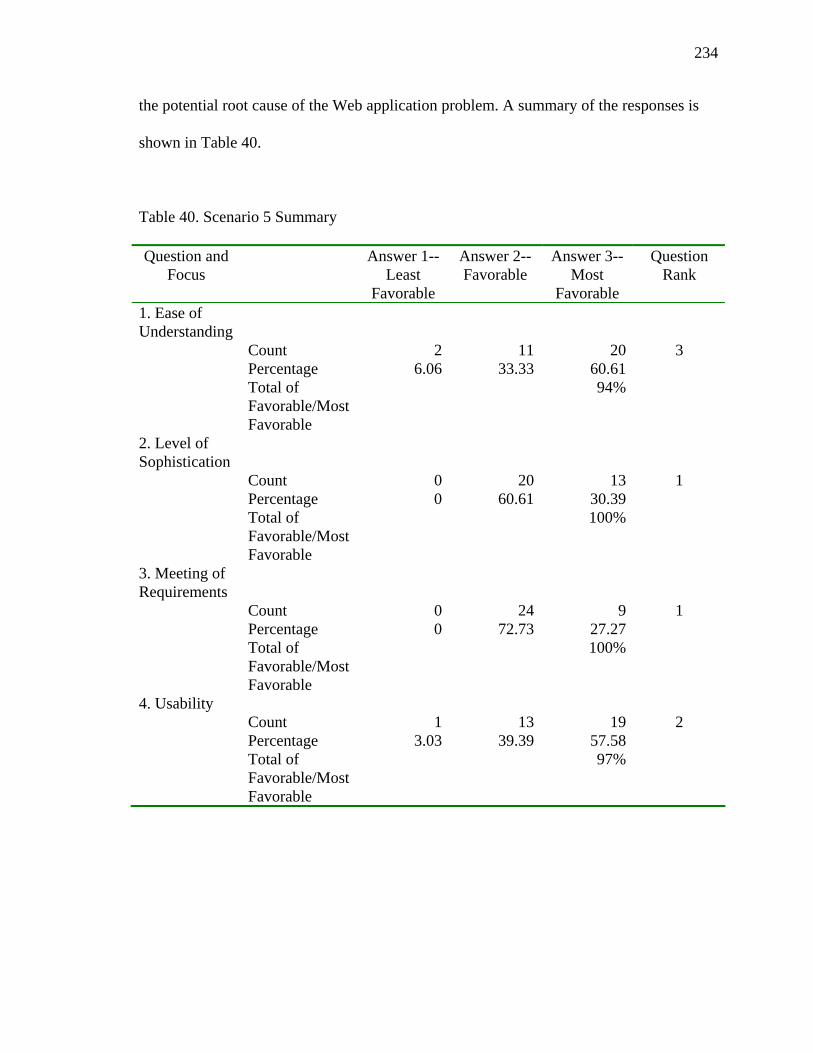
234
the potential root cause of the Web application problem. A summary of the responses is
shown in Table 40.
Table 40. Scenario 5 Summary
Question and Focus
Answer 1--Least
Favorable
Answer 2--Favorable
Answer 3--Most
Favorable
Question Rank
1. Ease of Understanding
Count 2 11 20 3 Percentage 6.06 33.33 60.61 Total of
Favorable/Most Favorable
94%
2. Level of Sophistication
Count 0 20 13 1 Percentage 0 60.61 30.39 Total of
Favorable/Most Favorable
100%
3. Meeting of Requirements
Count 0 24 9 1 Percentage 0 72.73 27.27 Total of
Favorable/Most Favorable
100%
4. Usability Count 1 13 19 2 Percentage 3.03 39.39 57.58 Total of
Favorable/Most Favorable
97%

235
Table 40. (continued)
Question and Focus
Answer 1--Least
Favorable
Answer 2--Favorable
Answer 3--Most
Favorable
Question Rank
5. Potential Impact
Count 5 14 14 4 Percentage 15.15 42.42 42
Total of Favorable/Most Favorable
85%
All Questions Total of Favorable/Most Favorable
428
The participants indicated through their responses that the strength of this scenario was
the level of sophistication and meeting of requirements. The lowest ranking answer for
this scenario was relating to the question of the potential impact of the toolsets use
(ranked 4 of 4).
A summary of the ranking and total scores for the five scenarios is shown in Table 41.
Table 41. Ranking of Scenarios
Rank Scenario Total Score
1 1 476 2 2 467 3 4 458 4 3 443 5 5 428
The first few scenarios were the most straightforward from the point of view of simplicity
of the problem and the prototype solution. Scenario 1, for example, was a simple
operational fault where a SQL error was detected by the Web application and the Smart
236
Fault subsystem was invoked to record the error and gather context information. The
scenario was easy to understand and the toolset displayed seven HTML views or
framesets that explained the scenario. This scenario received the best overall score and
ranked first among the scenarios. In contrast, Scenario 5 was a much more complex
problem situation that used ten HTML views or framesets to show the problem solution.
The root cause of the problem was complex and this probably contributed to the lower
score. Unlike the first scenario where the problem was a straightforward SQL error,
Scenario 5 involved unsuccessful automated actions, switch faults, processor faults, table
deadlocks, and slow performing buy transactions.
A second approach was taken to the analysis of the data using a question-by-question
approach. The goal of this analysis was to rank the responses to the questions,
independent of the scenarios, to determine what characteristics of the toolset as a whole
where more highly valued by the survey participants. The technique used was similar to
the approach taken for the scenario-by-scenario analysis. The responses were totaled by
question and the average, minimum, and maximum values were computed. Next, on a
question-by-question basis the count of favorable plus most favorable was computed as
well as the favorable plus most favorable percentage. This percentage was then used to
rank the questions. A summary of this analysis is shown below in Table 42.
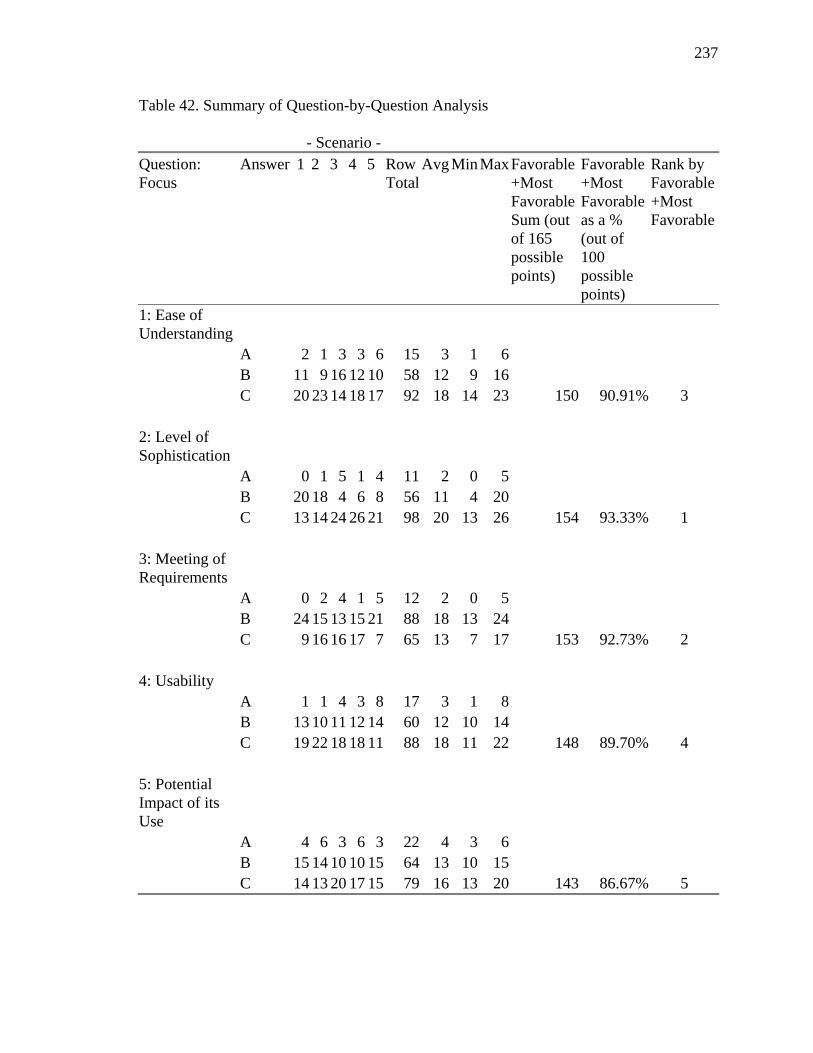
237
Table 42. Summary of Question-by-Question Analysis
- Scenario - Question: Focus
Answer 1 2 3 4 5 Row Total
Avg MinMaxFavorable +Most Favorable Sum (out of 165 possible points)
Favorable +Most Favorable as a % (out of 100 possible points)
Rank by Favorable+Most Favorable
1: Ease of Understanding A 2 1 3 3 6 15 3 1 6
B 11 9 16 12 10 58 12 9 16 C 20 23 14 18 17 92 18 14 23 150 90.91% 3
2: Level of Sophistication A 0 1 5 1 4 11 2 0 5
B 20 18 4 6 8 56 11 4 20 C 13 14 24 26 21 98 20 13 26 154 93.33% 1
3: Meeting of Requirements A 0 2 4 1 5 12 2 0 5
B 24 15 13 15 21 88 18 13 24 C 9 16 16 17 7 65 13 7 17 153 92.73% 2
4: Usability A 1 1 4 3 8 17 3 1 8
B 13 10 11 12 14 60 12 10 14 C 19 22 18 18 11 88 18 11 22 148 89.70% 4
5: Potential Impact of its Use A 4 6 3 6 3 22 4 3 6
B 15 14 10 10 15 64 13 10 15 C 14 13 20 17 15 79 16 13 20 143 86.67% 5

238
A summary of the ranking and total scores for the five questions is shown in Table 43.
Table 43. Ranking of Questions
Rank Question Total Score (out of 100
possible % points)
1 2 93.33 2 3 92.73 3 1 90.91 4 4 89.70 5 5 86.67
Regarding the question ranking, question 2, which related to level of sophistication,
received the highest ranking among the participants. This question received 154 out of
165 possible points in the combined favorable plus most favorable categories. There are
165 possible points because each of the 33 participants answered 5 questions each for a
total of 165 possible points. Question 3, regarding the meeting of requirements, ranked
second among the questions. The least successful aspect of the toolset based on the
question ranking was question 5 that related to the potential impact of the toolset's use.
This question received 11 fewer responses from the combined favorable plus most
favorable categories as compared to question 2.
Written Comments on the Strengths and Weaknesses of the Toolset This summary of the written comments on the strengths and weaknesses of the toolset
was taken from the comments that are documented in their entirety in Appendix G -
Comment Sheet Details for Full Life-Cycle Toolset. Seven attributes were the focus of the
comments on the strengths of the toolset. The attributes were integrated data and
information, ease of use, improvements to problem determination, process assistance,
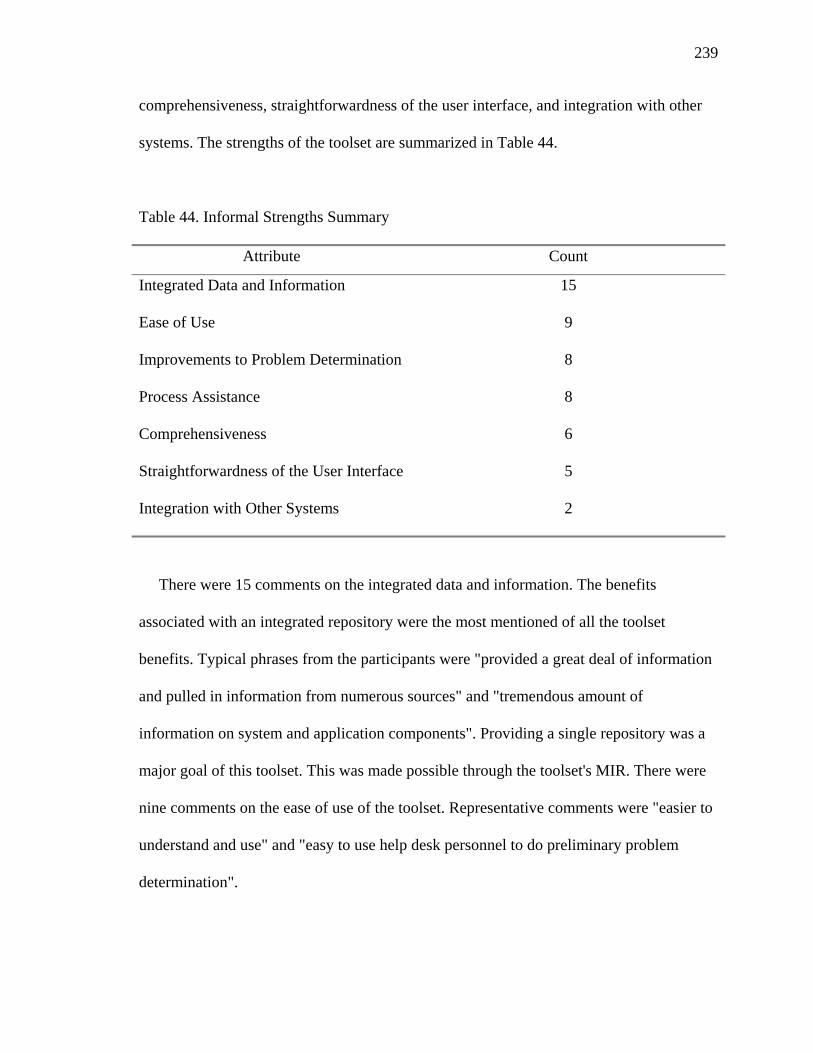
239
comprehensiveness, straightforwardness of the user interface, and integration with other
systems. The strengths of the toolset are summarized in Table 44.
Table 44. Informal Strengths Summary
Attribute Count
Integrated Data and Information
15
Ease of Use
9
Improvements to Problem Determination
8
Process Assistance
8
Comprehensiveness
6
Straightforwardness of the User Interface
5
Integration with Other Systems
2
There were 15 comments on the integrated data and information. The benefits
associated with an integrated repository were the most mentioned of all the toolset
benefits. Typical phrases from the participants were "provided a great deal of information
and pulled in information from numerous sources" and "tremendous amount of
information on system and application components". Providing a single repository was a
major goal of this toolset. This was made possible through the toolset's MIR. There were
nine comments on the ease of use of the toolset. Representative comments were "easier to
understand and use" and "easy to use help desk personnel to do preliminary problem
determination".

240
There were eight comments on how the toolset would help improve problem
determination. Typical phrases were "Makes problem determination easier since data
required to debug is available without additional runs to capture the data" and "I like the
concept of having some of the problem determination assistance views (like Check for
Configuration Differences/Mismatches) generating faults which can then be investigated
further using the mainline processing views (Specific Fault and Detailed Data)". A focus
of the toolset was improving problem determination and this is reflected in the comments.
There were eight comments relating to the usefulness of the process assistance provided
by the toolset. One participant commented "leads the technician in a methodical way to
evaluate the situation" whereas another wrote, "Having the procedures page initially to
guide the support personnel through the toolset is very helpful".
There were six comments on the comprehensiveness of the toolset. "Covers most of the
common Web application issues" and "Very sophisticated and comprehensive" were
typical comments. There were five comments regarding the user interface. Most
commented that it was straightforward. One reviewer commented "Relatively intuitive,
common look and feel". There were two comments on the toolsets ability to integrate with
other systems like the problem management systems.
Five attributes were the focus of the comments on the weaknesses of the toolset. The
attributes were suggestions for improvement, information overload, difficult to follow,
information maintenance burden, and process deficiencies. The weaknesses of the toolset
are summarized in Table 45.
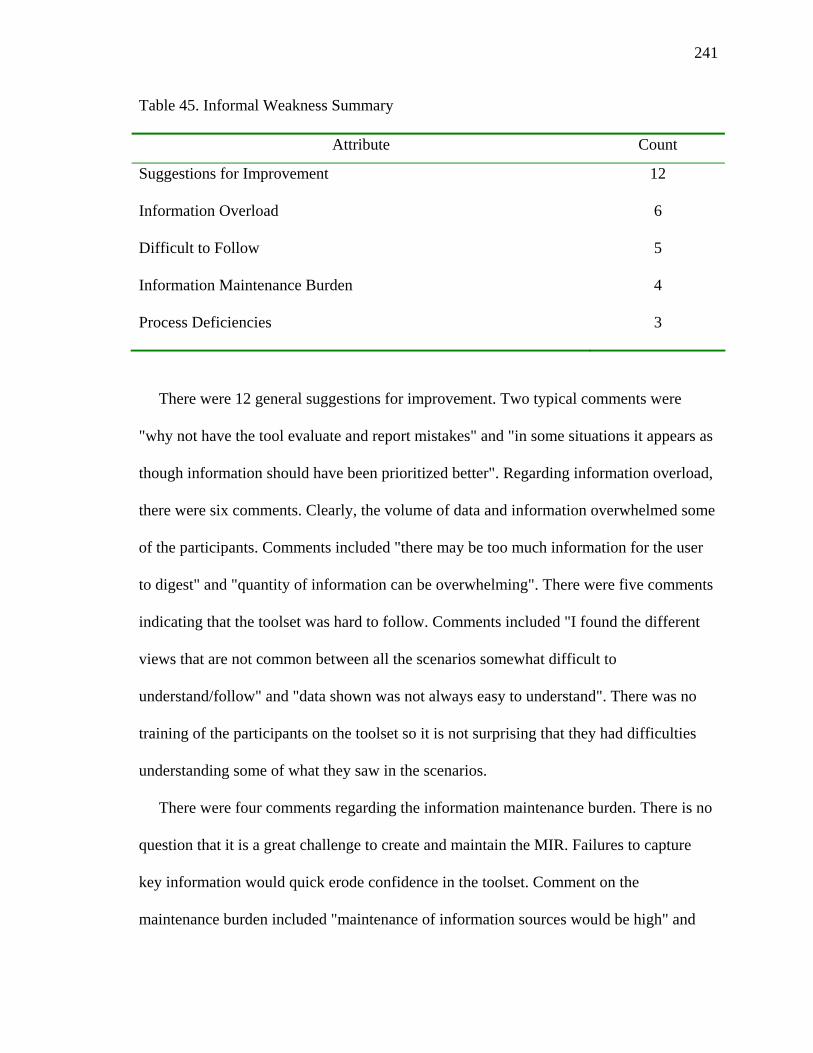
241
Table 45. Informal Weakness Summary
Attribute Count
Suggestions for Improvement
12
Information Overload
6
Difficult to Follow
5
Information Maintenance Burden
4
Process Deficiencies
3
There were 12 general suggestions for improvement. Two typical comments were
"why not have the tool evaluate and report mistakes" and "in some situations it appears as
though information should have been prioritized better". Regarding information overload,
there were six comments. Clearly, the volume of data and information overwhelmed some
of the participants. Comments included "there may be too much information for the user
to digest" and "quantity of information can be overwhelming". There were five comments
indicating that the toolset was hard to follow. Comments included "I found the different
views that are not common between all the scenarios somewhat difficult to
understand/follow" and "data shown was not always easy to understand". There was no
training of the participants on the toolset so it is not surprising that they had difficulties
understanding some of what they saw in the scenarios.
There were four comments regarding the information maintenance burden. There is no
question that it is a great challenge to create and maintain the MIR. Failures to capture
key information would quick erode confidence in the toolset. Comment on the
maintenance burden included "maintenance of information sources would be high" and

242
"may be difficult to update tool based upon new software/documentation". Lastly, there
were three comments about process deficiencies. Samples include "a more detailed
breakdown of the possible problems" and "maybe a little more explanation on
functionality".
Four attributes were the focus of the comments of the other comments or observations
on the toolset. The attributes were positive endorsement, suggestions for improvement,
higher skill level requirement, and confusing interface with other systems. One participant
mentioned the performance impact of the toolset and another brought up the missing
definition of support roles. The additional informal comments and observations are
summarized in Table 46.
Table 46. Other Informal Comments and Observations Summary
Attribute Count
Positive Endorsement
12
Suggestions for Improvement
7
Higher Skill Level Requirement,
3
Confusing Interface With Other Systems
2
There were 12 comments that are best characterized as positive endorsements of the
toolset. Examples include "Overall, even including the more complicated scenarios, it is
easy to pinpoint problems or problem areas" and "This is a well thought out
comprehensive set of tools. The level of sophistication is definitely leading edge". There
were seven comments that are suggestions for improvement for the toolset. "When more

243
than one possible solution is available, I'd like to see the tool recommend a course of
action" and "I'd suggest you distinguish between proprietary applications, especially those
owned by the customer and shrink-wrap applications like MS Outlook" are both examples
of comments that represent suggestions for improvements. There were three comments
indicating that the toolset required a higher skill level of the operations staff. "The
sophistication of this toolset seems to imply a higher level skill in the operations role than
traditional" was a typical comment.
There were two comments indicating that the interface between the toolset and other
systems was confusing. The comment "The tie-in with the problem management systems
is a bit confusing" points out the difficulty. The relationship between the toolset and other
systems like legacy problem-management systems is well defined, but it is difficult to
completely understand this relationship from the scenarios. In summary, the toolset
gathers faults. These faults are transferred to the problem-management system for
reporting and tracking after investigation of the fault has begun. Faults can be transferred
to the problem management system as open or closed problems.
Summary of results In this chapter, the researcher discussed the results of the research project that was
conducted during the period February 2001 to May 2002. The results of the project
focused on the work products that were produced during the design, development, testing,
and evaluation of a prototype toolset for the full life-cycle management of Web
applications. The design of the toolset was summarized in this chapter. The design was
brought about using JAD activities. The JAD sessions resulted in a comprehensive design
244
for 19 subsystems that consisted of 43 procedures, 78 programs, 25 views, and a database
containing 59 tables. The design was used as an input to help create a segment strategy.
The segment strategy, an important RAD tool, was used to develop the prototype. The
development and testing of a prototype toolset was completed so that survey participants
could evaluate the work. The prototype toolset was developed using a framework that
consisted of five scenarios. The scenarios offered the opportunity to develop toolset
components for 15 of the 19 subsystems. A user interface was developed which consisted
of 12 Web pages and 37 framesets.
The evaluation of the toolset was carried out using an instrument that gathered data on
the ease of understanding, level of sophistication, meeting of requirements, usability, and
potential impact of the toolset's use. Two techniques were used to analyze the data
collected for the survey. The first technique analyzed the data using a scenario-by-
scenario approach. The data revealed that the scenarios that were simpler were rated more
highly that the later ones which were larger in size and more complex in problem
structure. The second technique used to analyze the data utilized a question-by-question
approach. The data also revealed that the toolset was considered to be sophisticated and
that it met the requirements of managing Web applications. The toolset was weakest when
it came to the question of the potential impact of its use on an organization.
A wide variety of informal comments were gathered and discussed pertaining to the
toolset's strengths and weaknesses. Seven attributes were the focus of the comments on
the strengths of the toolset including integrated data and information, ease of use,
improvements to problem determination, process assistance, comprehensiveness,
straightforwardness of the user interface, and integration with other systems. These are

245
summarized in Table 44. Five attributes were the focus of the comments on the
weaknesses of the toolset including suggestions for improvement, information overload,
difficult to follow, information maintenance burden, and process deficiencies. These
comments are summarized in Table 45. Other informal comments and suggestions were
collected and are summarized in Table 46. The various data gathering tools made it
possible to collect a variety of information about the prototype toolset.

246
Chapter 5
Conclusions, Implications, Recommendations, and Summary Introduction In this chapter, the dissertation research is presented in the context of four main
sections. The sections are conclusions, implications, recommendations, and summary. In
the conclusions section, 23 research questions and four hypotheses are stated and the
conclusions associated with each are presented. The conclusions are stated based on the
analysis performed for the study. In the implications section, the contribution of the work
to the field of study is presented. The potential applications of the research are also
presented. In the recommendations section, the suggestions for future research and
changes in academic and professional practice are presented. In the summary section, at
the end of the chapter, the entire dissertation project and study are reviewed.
Conclusions The conclusions of the study are presented below using the research questions and
hypotheses as a framework. The first three research questions are the primary research
questions and are as follows:
1. What are the appropriate procedures, programs, views, schema, and data that would
improve the manageability of Web-based applications?
2. How do these toolset components fit in the context of the application's life cycle
including design, construction, deployment, operation, and change?
3. How do these toolset components round out the functional perspectives of
accounting, administration, automation, availability, business, capacity, change,

247
configuration, fault, operations, performance, problem, security, service level, and
software distribution?
These three primary research questions are summarized by the first hypothesis. The
first hypothesis contains all the elements of the primary research questions including
toolset components, life-cycle context, and functional perspectives. The first hypothesis is
as follows:
The manageability of Web-based applications is improved by a toolset (procedures,
programs, views, schema and data) implemented in a full life-cycle context, aligned
with key functional perspectives.
The conclusions for the primary research questions and first hypothesis are stated below.
Conclusions for the Primary Research Questions and the First Hypothesis The first primary research question is focused on the specific components that make up
a toolset that will improve how a Web application is managed. It is centered on the type of
components that are shown in Figure 3 that can be found in Chapter 1. The question is as
follows:
Question 1 - What are the appropriate procedures, programs, views, schema, and data
that would improve the manageability of Web-based applications?
One of the outcomes of this research was to define a well-balanced and comprehensive
collection of toolset components, that when used as a system, would have a significant
and positive impact on the manageability of the Web application. The scope of the
challenge of managing Web applications is so broad and challenging that it is difficult to
confirm with certainty that a given solution like this toolset is an appropriate solution.
(Conclusion 1) It was confirmed during the prototype toolset development that more that

248
one solution can be designed and implemented to meet the challenge of managing Web
applications.
(Conclusion 2) The fact that this toolset represents a reasonable approach is supported
by the survey data collected during the evaluation phase. Skilled IT professionals,
averaging 16 years of experience, gave "most favorable" evaluations 50% of the time.
This percentage uses an average for all questions for all scenarios. Integration of data and
information and ease of use were the top two strengths noted about the toolset. These
strengths are documented in Table 45. (Conclusion 3) There are data to support findings
that the volume of information and the burden of maintaining that information are
weaknesses in the toolset. The weaknesses are documented in Table 46. In these two
areas, the toolset may have fallen short regarding the appropriate level of data, but the
support for the toolset was nevertheless strong.
The second primary research question focused on the relationship of the toolset
components to the life cycle of the Web application. Design, construction, deployment,
operation, and change were identified as life-cycle phases and described in the Definition
of Terms that can be found in Chapter 1. The question is as follows:
Question 2 - How do these toolset components fit in the context of the application's life
cycle including design, construction, deployment, operation, and change?
Another outcome in this research was to carefully identify the toolset components that
could have a powerful impact on all phases of the application including design,
construction, deployment, operation, and change. Historically, focus has been on
managing the application after it is deployed. Deployment is an important phase because
it is during this phase that the users of the system gain from its use. (Conclusion 4)

249
However, other phases are important as well and should receive an appropriate level of
the benefits of improved applications management.
The design of the toolset and prototype toolset implementation were deliberately
focused on all phases of the application's life cycle. A considerable number of procedures
were designed that provided support to the design phase so that the application that was
developed would be more manageable. Many examples are described in Chapter 4. One
example is the Resource Utilization Optimization procedure which is part of a subsystem
in support of the Accounting functional perspective. Another example is the Strategies to
Reduce Application Capacity Limits Guide which is from a subsystem in support of the
Capacity functional perspective.
Several toolset programs were planned to work with design-phase work products with
a goal of reducing the burden associated with integrating the life cycle phases. For
example, definitions needed in the construction phase, could be extracted from design
documents eliminating the need to redefine them when the phase boundaries were
crossed. This example is from Chapter 4. Please see the MIR Creation subsystem which is
summarized in Table 32. This subsystem is in support of the Software Distribution
functional perspective.
The third primary research question focused on the relationship of the toolset
components to the functional perspectives that have been identified as appropriate to the
management of Web applications. Accounting, administration, automation, availability,
business, capacity, change, configuration, fault, operations, performance, problem,
security, service level, and software distribution were used as key functional perspectives

250
and were described in the Summary of What is Known and Unknown About this Topic
which can be found in Chapter 2. The question is as follows:
Question 3 - How do these toolset components round out the functional perspectives of
accounting, administration, automation, availability, business, capacity, change,
configuration, fault, operations, performance, problem, security, service level, and
software distribution?
Another important outcome in this research was to identify and address gaps that exist
for the management of applications in the identified functional perspectives. (Conclusion
5) It was found that some of the perspectives like automation, which have subsystems
summarized in Tables 18 and 19, had a long history and needed only a modest amount of
work to give that perspective an application focus. (Conclusion 6) Other perspectives like
capacity (see Table 22) needed much more analysis and investigation to make them a
compelling perspective for application management. For the capacity functional
perspective, the application bottleneck subsystem was a challenge to design and
implement requiring a complex monitoring strategy. (Conclusion 7) In an unexpected
way, the integration of these functional perspectives or disciplines was also explored and
this resulted in some powerful combinations. For example, once the data were collected
relating to all the functional perspectives, it was very useful to have summary or key
indicators presented in one toolset view. This was the approach taken with the Deep View
subsystem (see Table 20 for a summary of this subsystem) with its focus on availability
management of the Web application. This subsystem used data and information collected
by many of the other subsystems like change and problem and brought this data together
in one view to give depth and texture to the issue of application availability.
251
The first hypothesis is a summary or synthesis of the primary research questions. This
hypothesis includes the notion of the toolset (from the first primary research question),
full life-cycle focus (from the second primary research question), and functional
perspectives (from the third primary research question). The hypothesis is as follows:
Hypothesis 1 - The manageability of Web-based applications is improved by a toolset
(procedures, programs, views, schema and data) implemented in a full life-cycle
context, aligned with key functional perspectives.
The data collected from survey question 5 (Which best characterizes the impact that
the toolset might have on the organization because of the way it handled this scenario?)
reveal that 87% of the participants responded favorably to the toolset (see Table 42). They
responded either that the toolset will have an impact, but improvements are needed or that
the toolset will have a major impact. Only 13% of the participants responded that the
toolset would have no major impact on the users and their productivity. This favorable
response from the participants, regarding this specific survey question, supports the
hypothesis that the manageability of Web-based applications is improved by a toolset. By
nature, this toolset is a full life cycle entity and its design and prototype implementation
leveraged a context that included 15 functional perspectives.
Furthermore, considering the averages over all scenarios, 9% of the participants rated
the toolset least favorable whereas favorable responses were given 41% of the time and
most favorable responses were given 50% of the time. These averages were computed
using the data summarized in Tables 36, 37, 38, 39, and 40 which can be found in Chapter
4. It is clear from these survey results that the response to the toolset were generally in the
favorable or most favorable category. (Conclusion 8) This favorable response from the

252
participants, for the overall toolset, supports the hypothesis that the manageability of
Web-based applications is improved by a toolset.
Conclusions for the Secondary Research Questions Research questions 4 thought 23 are the secondary questions. These secondary
research questions were explored during the design and implementation of the prototype
toolset. The secondary research questions have an almost one-to-one relationship to the
subsystems that were designed in support of the 15 functional perspectives. Please see
Table 13 in Chapter 4 for a complete list of the toolset subsystems. The nineteen
secondary research questions are summarized by hypotheses 2, 3, and 4. In this section,
the strengths, weaknesses, and limitation of the study are also discussed.
Question 4, a secondary research question, is focused on the accounting functional
perspective. The question examines if it is possible to instrument or change an application
in order to understand details of its operation such as the resources that it expends during
operation. The question is as follows:
Question 4, Part A - For the accounting functional perspective (as it relates to Web
application management), is it possible to instrument an application whereby the
developer or user specifies the resources they intend to use and the toolset alerts them
when the limit is exceeded? Part B - Are simple messages the appropriate alert
mechanism for this tool?
To address this question, including parts A and B, a detailed design was completed for
the Resource Modeling subsystem. This subsystem, which is summarized in Table 14,
was designed in support of the accounting functional perspective. In addition, this
subsystem was used in Scenario 1 with an implementation of the Resource Modeling

253
view. Scenario 1 can be found in Appendix E. The subsystem design focused on disk,
memory, processor, and input/output resources and used simple monitors to periodically
compare the actual state of these resources with the thresholds specified by the
programmer or administrator.
Specific to part A of the research question, it was discovered that it is not necessary to
instrument the Web application as the processing that is required to support the function
can be retrieved externally through non-intrusive monitors. (Conclusion 9) No changes to
the application programs are required. However, the programmer or administrator does
need an accurate understanding of the performance characteristics of the Web application
otherwise their lack of knowledge may result in false indications that the application is
exceeding normal thresholds. False indications or alerts are a significant challenge for
many system management teams. For some Web sites, as many as three out of four alerts
are false (N. Knight, personal communication, June 10, 2002).
Relative to part B of this research question, simple messages were generated when a
threshold was triggered and these messages were used to supply the data displayed in the
subsystem reports. (Conclusion 10) The simple message mechanism was sufficient to
meet the needs of the subsystem.
Question 5, a secondary research question, is another two-part question relating to the
accounting functional perspective. This question is focused on accounting and charge
back of the application and its supporting resources. The question is as follows:
Question 5, Part A - Another accounting research question is--is it possible to
instrument an application for accountability? Part B - Could this instrumentation be
used for the charge back of the Web site to the internal groups that use it?
254
To address this question, a detailed design which addressed both parts A and B of the
research question, was completed for the Resource Accounting subsystem. This
subsystem, which is summarized in Table 15, was designed in support of the accounting
functional perspective. Specific to part A of the research question, a notion that was
explored in the subsystem design was the idea that charge back could be achieved using
an event model. The main idea for the event model was that certain key application events
like sign on, sign off, browse, and update would each be assigned a cost. This cost would
be used as a basis to charge the organization for use of the Web application servers,
network connectivity, and backup and restore. (Conclusion 11) The event model
demonstrated that it is possible to instrument an application for accountability in this
fashion.
Specific to part B of the research question, flexibility was build into the design so the
costs associated with each event could be adjusted in a trial-and-error fashion until the
desired level of charge back was achieved. (Conclusion 12) Based on this design, it is
feasible that this instrumentation could be used for the charge back of the Web site to the
internal groups that use it. Although the design was completed, this subsystem was not
explored in detail in the prototype. However, charge-back data was displayed in Scenario
5 (see Appendix E) on the Deep Information view, but the specific Resource Accounting
views were not developed.
Question 6, a secondary research question, is a two-part question relating to the
administration functional perspective. This question is focused on automating the
installation of a Web application. It also explores the notion of doing it completely
without human intervention. The question is as follows:

255
Question 6, Part A - For the administration functional perspective, is it possible to
completely automate the key administration activities for the installation of a Web
application? Part B - Is it possible to install a Web application without human
intervention?
To address this question, a detailed design was completed for the Automated
Installation and Configuration subsystem. This design, which is summarized in Table 16,
addresses both parts of the research question. This subsystem was designed in support of
the administration functional perspective. In addition, this subsystem was explored in
detail in Scenario 2 (see Appendix E) where the HR Benefits Plus application was
installed, configured, and deployed using the Automated Installation and Configuration
subsystem.
(Conclusion 13) Specific to part A of the research question, it is possible to
completely automate the key administration activities for the installation of a Web
application. A prototype of this automation was shown in Scenario 2 where views
containing status information for installation, configuration, and deployment activities
were shown. In this prototype, the first two steps were automated and the third step
(deployment) required manual intervention although this activity could also have been
automated.
(Conclusion 14) Specific to part B of the research question, it is possible to install an
application without human intervention, but it was discovered through the design process
that human intervention is a desired feature in some circumstances. A developer may
install a Web application to a number of systems using automated procedures, but the
administrator may desire to complete the process by configuring the application manually.

256
Question 7, a secondary research question, is also focused on the administration
functional perspective. This question explores a different approach to solving problems
with Web applications that are related to administrative or configuration settings. The
question is as follows:
Question 7 - Another administration research question is--in a problem-solving
context, is it possible to verify the administrative settings of key Web application
software parameters using previously stored values?
To address this question, a design was completed for the Configuration Verification
subsystem. Table 17 summarizes the design for this subsystem. Additionally, this
subsystem was explored in detail in Scenario 3 (see Appendix E) where the configurations
for two domains were compared to look for differences in the Order Marketplace
application. The Configuration Verification subsystem was designed to support the
administration functional perspective.
(Conclusion 15) It is not necessary, but may be desirable to verify administrative
settings, using previously stored values. Using previously stored values can dramatically
reduce the time it takes to perform the verification. However, using previously stored
values can raise the question--do these previously stored values reflect the current
configuration of the administrative settings? Achieving a balance between accuracy and
performance is a significant challenge particularly when the Web application has a large
number of components.
Question 8, a secondary research question, is the first of two questions focused on the
automation functional perspective. The question explores the idea of using design phase
257
work products like design documents as input to a utility that would produce elements like
templates that would be used in later life-cycle phases. The question is as follows:
Question 8 - For the automation functional perspective, is it possible to read design-
phase work products and automatically produce templates to be used in subsequent
phases? Examples might include start, stop, and restart scripts or schema that describe
the key Web application components that make up the Web site.
To address this question, a detailed design was completed for the Template Creation
subsystem. This subsystem, which is summarized in Table 18, was one of the two
subsystems designed to support the automation functional perspective. (Conclusion 16) It
was confirmed through the design process that it is possible to electronically read design
documents, extract lists of application components, and match components with templates
to create functional programs or scripts.
Of these three activities, the greatest technical challenge is creating a functional
program or script because of the large number of variables needed by the program or
script. A design decision was made to use subsystems definitions to supply this input.
This creates a time burden for the administrator. The alternative approach, which was not
explored, was to create a program or script that requires administration and tailoring
before it can be used. In the case where the administrator is supplying definitions, the
administrator has the option to use the generated program or script as a starting point that
can be enhanced or extended through modification and testing.
This subsystem was not explored in detail in the prototype, however automated
information about the programs created from templates was displayed in Scenario 5 on the
Deep Information view. Scenario 5 can be found in Appendix E.
258
Question 9, a secondary research question, is also focused on the automation functional
perspective. As was the case with research question 8, this research question is examining
the possibility of crossing life-cycle boundaries in order to gain some benefit during
problem determination or during the analysis activities associated with a major change.
The question is as follows:
Question 9 - Another automation research question is--is it possible to create a tool
that automatically compares designed versus actual installed Web application
components?
To address this question, a detailed design was completed for the Component
Comparison subsystem that supports the automation functional perspective. (Conclusion
17) The design for this subsystem, which is summarized in Table 19, indicated that it is
possible to compare designed components with those that are actually installed.
The programming support exists that makes it possible to electronically read design
documents, extract lists of application components, and match these components with the
components from an actual running system. The volume of data processing required to do
this comparison makes it unlikely that this activity could be achieved in real time. In
addition, if the system that is the subject of the comparison was a production system the
comparison process would create contention that might impact the performance of the
system being used by humans.
Although this subsystem explored bridging the design and construction life cycle
phases with technology an obstacle remains in that designers do not always update the
design of an application with changes made during the construction phase. (Conclusion
18) Discipline over multiple phases would be required in order for this subsystem to
259
produce useful results. Perhaps this functionality would be useful to an audit team for
financial Web applications. Although this subsystem was part of the comprehensive
toolset design, this subsystem was not explored in detail in the prototype.
Question 10, a two part secondary research question, is focused on the availability
functional perspective. The question explores availability measures that are more detailed
than the logical state of the resource. The question is as follows:
Question 10, Part A - For the availability functional perspective, what are the
characteristics of "deep" availability? Often, availability is centered on the
management of the state of a logical resource--the symbolic representation of a system
or a user. Part B - How would a deeper treatment of availability be managed? Would
it automatically include responsiveness, stability, and usage measurements?
To address both parts of this question, a detailed design was completed for the Deep
View subsystem. This subsystem design is summarized in Table 20. Additionally, this
subsystem was explored in detail in Scenario 5 (see Appendix E) where availability
information was displayed for the Value Market application using information for the
fourteen other functional perspectives as the context. To address part A of the research
question, information about the Web application was utilized as characteristics or
dimensions of availability. This information was supplied by the subsystems supporting
the accounting, administration, automation, business, capacity, change, configuration,
fault, operations, performance, problem, security, service level, and software distribution
functional perspectives. (Conclusion 19) This information provided a sufficiently detailed
understanding of the actual availability of the Web application.
260
Specific to part B of the research question, linking the other functional perspectives
with availability supplied the deeper treatment of availability and automatically included
measures of responsiveness, stability, and usage. For example, responsiveness measures
were supplied through performance data including the value of the current and previous
performance indicators. Stability measures were supplied through automation data
including automation actions attempted, both successful and unsuccessful. Usage
measures were supplied through fault data like total faults, transferred closed, transferred
open, examined, not yet examined, and average per day.
Question 11, a secondary research question, is focused on the business functional
perspective. This question is seeking functional capabilities beyond simply visualizing the
collection of related applications in a view supported by monitors and commands. The
question is as follows:
Question 11 - For the business functional perspective, what additional substance or
depth can be created in support of business-systems views, in addition to the current
focus on specific component monitors and commands?
To address this question, a detailed design was completed for the Business Views
subsystem. A summary of this design can be found in Table 21. This subsystem was also
explored in detail in Scenario 5 where business system information was displayed for the
Value Market application. The complete scenario can be found in Appendix E.
The focus of the design and scenario was to show relationships, both peer and parent,
and the status of the application including its middleware and database components. The
subsystem design included both physical and logical components in an attempt to provide
flexibility and richness in the functional possibilities of the subsystem. If a Web
261
administrator wanted to focus primarily on the tracking of physical components like
servers they could use the subsystem whereas another Web administrator might have a
preference to organize the views logically using a business system hierarchy. The design
was completed in such a way to be able to satisfy the needs of both kinds of
administrators.
The additional substance or depth, which was sought in the research question, was
supplied by three key design elements. These elements included relationships (peer and
parent); application, middleware, and database status; and the depiction of both physical
and logical components. (Conclusion 20) These design elements were provided in
addition to monitors and commands and provided more robust capabilities than are
typically available with business views.
Question 12, a secondary research question, is focused on the capacity functional
perspective. This multiple-part question concentrates on application capacity bottlenecks
that are in the middleware and database layers. The question is also concerned with how
these bottlenecks evidence themselves when server-centric and network-centric capacity
models are used. The question is as follows:
Question 12, Part A - For the capacity functional perspective, from the point of view of
the application (not the server), is it possible to determine the components of the
application that are important to understanding its potential for capacity bottlenecks?
Part B - Which application, middleware, and database components are essential to
understanding the capacity of the application and how does that relate to server and
network-based models and approaches?
262
To address this question, a detailed design was completed for the Application Capacity
Bottleneck subsystem. The design for this subsystem is summarized in Table 22. This
subsystem was explored in detail in Scenario 4, which can be found in Appendix E, where
bottlenecks were detected and displayed for application, database, middleware
components.
Specific to part A of the research question, the main bottlenecks analyzed were process
and input/output related. Specifically, five bottlenecks were explored including process
hung, too many processes, long SQL query, long get/put request, and missing processes.
(Conclusion 21) This collection of capacity bottlenecks were identified as the key
inhibitors to the capacity throughput of an application regarding middleware and database
operations.
Specific to part B of the research question, this subsystem design was developed to
complement server and network-based models and approaches not to replace them.
Current approaches to capacity analysis do not typically include a detailed examination of
application processes, database queries, and queue responses. (Conclusion 22) Since this
is the specific focus of this subsystem, it makes an attractive and useful addition to the
capacity functional perspective.
Question 13, a secondary research question, is focused on the combined change and
configuration functional perspectives. Change and configuration perspectives are often
combined in practice because their functions are closely related in that there is typically a
configuration update for every change. The main focus of the question has to do with
authorized changes, but the question has a security dimension as well, because some

263
unauthorized changes may also be violations of security policy. The question is as
follows:
Question 13, Part A - For the change and configuration functional perspectives, is it
possible for an application to detect unauthorized changes to itself? Part B - What
would be required to detect and notify these unauthorized modifications?
To address this question, a detailed design was completed for the Unauthorized
Change Detection subsystem. The design for this subsystem is summarized in Table 23.
This subsystem was explored in detail in Scenario 3 where all unauthorized changes were
examined for the Order Marketplace application. This scenario is included with the other
scenarios in Appendix E.
(Conclusion 23) Specific to part A of the research question, it is possible for an
application to detect unauthorized changes to itself if an authorization mechanism is used.
The design for this subsystem used the concept of the change window to implement the
authorization-mechanism idea. Using the change window as a rule, all changes to
application components could be evaluated based on if they occurred within or outside of
a change window. Changes to application components outside of a change window would
automatically be considered unauthorized.
Specific to part B of the research question, to detect and notify regarding these
unauthorized modifications, the design for the subsystem relied heavily on the time
stamps maintained by the operating system for files, directories, and programs.
(Conclusion 24) Change mechanisms, like time stamps, are sufficient to support the needs
of change and configuration subsystems.

264
Question 14, a secondary research question, is also focused on the change and
configuration functional perspectives. This question probes the usefulness of change-
window awareness to teams that support Web applications. The question is as follows:
Question 14, Part A - Another change and configuration question is--would
application-level change-window awareness be useful to the team or process making
the changes? Part B - Would this make possible the suppression of certain kinds of
application-generated faults, that often occur during planned change periods?
To address this question, a detailed design was completed for the Change-Window
Awareness subsystem which is summarized in Table 24. The Change-Window Awareness
subsystem was explored in detail in Scenario 3 where previous, current, and proposed
change-window data was displayed for the Order Marketplace application. This scenario
can be found in Appendix E.
Specific to part A of the research question, the notion of a change window is useful
because most Web applications are not continuously available so an authorized period is
needed when the application can be maintained and updated. Continuous availability is
possible, but expensive to implement so its use is limited. It is also useful for the
application to have knowledge of the window so it can modify its processing accordingly
as administrators would not want an application to generate alerts indicating that the
database is down if the application could be made aware of the fact that the database is
unavailable due to scheduled maintenance.
Specific to part B of the research question, the administrators of the problem
management system would want to suppress problem records during a change window for
an application in order to reduce costs. Researching and closing problem records is time

265
consuming and usually results in a charge to the owners of the application. A mechanism
is needed to make suppression possible during a change window. The Change-Window
Awareness subsystem created and maintained data in the MIR that made it possible for an
application to determine if a change window was in effect. (Conclusion 25) In the
prototype (demonstrated in Scenario 3), the implementation of this subsystem made
possible the suppression of certain kinds of application-generated faults that occur during
planned change periods.
Question 15, a secondary research question, is focused on the fault functional
perspective. The question explores what could be done to improve fault creation and
management. Specifically, the question examines what could be doe to improve the
quality of fault data without putting an increased burden on the application developer. The
question is as follows:
Question 15, Part A - For the fault functional perspective--is there an optimal
technique for generating application faults? Part B - Is a smart fault-generating
module possible? A smart module might be one that takes minimal input from the
application and makes intelligent choices regarding selections for the target-systems.
To address this question, a detailed design was completed for the Smart Fault
subsystem. The design for this subsystem is summarized in Table 25. The Smart Fault
subsystem was explored in detail in Scenario 1 (see Appendix E) where context data was
gathered to support a database error that stopped the execution of a Web application.
Specific to part A of the research question, there are several challenges to generating
application faults in an optimal manner. These challenges were noted during the
implementation of the Smart Fault subsystem. One significant challenge is gathering

266
problem context data from multiple servers in real time and recording that data in a single
MIR record. At times, this process cannot be completed in a timely enough manner
because of the delay associated with inter-server communication. (Conclusion 26) When
this data gathering process is not completed quickly, the data gathered is not as current as
it needs to be to be helpful to the person who will use it later to solve a problem.
Another significant challenge is the volume of context data. Many Web applications
rely on a large number of supporting middleware and database components and these
components have many tasks and processes. For example, a middleware messaging
component may have 15 queues and 30 processes to manage those queues. When the
context data is gathered, 45 resources names including status, are gathered by the toolset.
This data may be useful, but it can put a strain on the administrator who is examining the
data looking for information. Several survey participants remarked that the toolset
generated too much data for the administrator to review and understand. (Conclusion 27)
Balance is needed between the data that is possible to gather and display and the ability of
the administrator to understand and make use of it.
The Smart Fault subsystem was also used in all the scenarios as a common service for
gathering and formatting ordinary fault data. This common service was useful as the fault
data created for any problem situation formed a foundation for the problem solving
activities. Each scenario documented in Appendix E concludes with views that show the
fault data being transferred to the problem management system where it can be used for
problem tracking and reporting.
Question 16, a secondary research question, is focused on the operations functional
perspective. This question examines the idea of making it possible for the helpdesk

267
personnel to improve their ability to manage an application. This improved ability would
be made possible through a view and related tools that integrate functions that currently
lack integration like job scheduling, data backups, and print outputs. These functions are
related to one another, but are difficult to manage as a collection due to current tool
limitations. The question is as follows:
Question 16 - For the operations functional perspective, is there a way to have an
application view for the helpdesk that integrates key functions like job scheduling,
backup status and history, and the status of key print or file outputs?
To address this question, a detailed design was completed for the Integrated Operations
subsystem which is summarized in Table 26. Although this subsystem was designed it
was not explored in detail in the scenarios. However, job scheduling, output management,
helpdesk, and backup/restore information was displayed in Scenario 5 (see Appendix E)
on the Deep Information view.
The design explored this research question in detail. The technical challenge of
displaying this data in one application specific view is associated with the situation that
most of the commercial products used by customers in this area come from multiple
vendors who primarily use non standard interfaces. (Conclusion 28) This problem is
overcome when a common MIR is used and HTML is used for presenting data in
application specific views. The primary strength of this subsystem was collecting the key
operational data in a MIR and displaying the data on a view that used the specific Web
application as the context.
Question 17, a secondary research question, is focused on the performance functional
perspective. This question examines the alternatives to modifying the Web application

268
directly and explores the notion of a performance proxy that might be in the form of a
instrumented application robot. The question is as follows:
Question 17, Part A - For the performance functional perspective, is there an
alternative to gathering intimate application performance data by modifying the
application itself to insert calls to a performance-measurement tool? Part B - Is there
a proxy for this that is possible using an instrumented application robot?
A detailed design was completed for the Intimate Performance subsystem (see Table
27) and this subsystem was explored in detail in Scenario 5 (see Appendix E) where proxy
performance data was examined for the Value Market application. The Intimate
Performance View was effective in displaying the past, present, and future schedule of
operations of the robots or proxies. It also displayed the result of the proxy execution in
the same view.
Specific to part A of the research question, work on the Intimate Performance
subsystem was centered on the use of a performance proxy as modifications to the Value
Market application were not possible. Source code changes to the application to support
the gathering of performance data was determined to be too risky. During the design
sessions, JAD participants were supportive of the approach to using a performance proxy
and research after the design sessions did not discover other approaches that could be
explored.
(Conclusion 29) Specific to part B of the research question, the approach of using a
proxy is technically feasible and resulted in performance data that was more compelling
than the data produced by simple non-intrusive performance monitors. The proxy-based
approach has the benefit of producing application-specific performance data without

269
modifying the Web application itself. One limitation of this approach is the labor it takes
to both design and implement the performance proxy application. It is anticipated that this
burden can be overcome to a high degree by good procedures, models, and templates to
assist with the creation of the performance proxy programs.
Question 18, a secondary research question, is focused on the problem functional
perspective. This question examines the challenge of improving the quality of the data
that is provided to the problem-management system. Like Question 15, this research
question is concerned with improving the situation without increasing the burden on the
developer of the Web application. The question is as follows:
Question 18, Part A - For the problem functional perspective, most of the focus is on
the problem-management tools. Is it possible to instrument an application to provide
more meaningful and detailed data to the problem management system? Part B - What
would the instrumentation be that would minimize the programming burden yet
maximize the data collected and recorded?
To address this question, a detailed design was completed for the Detailed Data
subsystem. The design for this subsystem is summarized in Table 28. In addition, this
subsystem was explored in detail in all five scenarios (see Appendix E). Detailed data was
collected and stored in the MIR and was displayed in views that supported each of the
scenarios.
(Conclusion 30) Specific to part A of the research question, it is not appropriate to
instrument an application to provide real-time detailed data. This data needs to be
collected before the Web application is placed in use and maintained during the life of the
application. This data should be static data that is supported by detailed operations

270
procedures when human activities are required to take a remedial action. For this toolset,
the Smart Fault subsystem was designed to help create and store more meaningful and
detailed event data for the Web application. The Detailed Data subsystem was created, as
a complement to the Smart Fault subsystem, to provide assistance and analysis to the
human operators and administrators who are viewing the event data.
Specific to part B of the research question, the Smart Fault subsystem should be
effective in lowering the burden on the programmer. However, the Detailed Data
subsystem creates a considerable challenge, as it requires data in the MIR for the common
problems that can occur during the normal operation of a Web application. Much of this
detailed data is available from the vendors who create the common support software
systems like relational databases, but it is not in a form that can be directly imported into
the MIR. (Conclusion 31) An industry-standard approach is needed to make this data
accessible to the systems and users that need it.
Question 19, a secondary research question, is focused on the security functional
perspective. This question explores the idea of a comprehensive approach to monitoring
security for an application. This approach examines the common software interfaces like
sign on and sign off and hardware interface points like routers. The question is as follows:
Question 19 - For the security functional perspective, is it possible to build a view
(with probes) that would be used to monitor key security interfaces for an application?
These interfaces might include traditional access points like application sign on
attempts, failures, and retries as well as information from application dedicated
routers, firewalls, and network interface cards.
271
To address this question, a detailed design was completed for the Interface Monitoring
subsystem (see Table 29), but this subsystem was not explored in detail in the scenarios.
However, security violations, unauthorized changes, front-end and back-end
administrative access information was displayed in Scenario 5 (see Appendix E) on the
Deep Information view.
It is technically feasible to gather security information from systems like routers and
firewalls, however most of these operations are privileged in nature and require special
authorizations. Access to data from security devices like firewalls is typically controlled
closely in most organizations. (Conclusion 32) The privileges required are a significant
barrier to gathering the data that is necessary to support an Interface Monitoring
subsystem. In spite of these challenges, it would be useful to have the ability to display in
one view, security information from multiple sources for a specific Web application.
Since this data is privileged and sensitive in nature, using a view like the Interface
Monitoring view (see Table 29) would require special access privileges.
Question 20, a secondary research question, is focused on the service level functional
perspective. This question examines the possibility of creating a non-intrusive service
level capability that can we useful for reporting both service-level objective and service-
level agreement data. The question is as follows:
Question 20 - For the service level functional perspective, is it possible to architect a
service-level management tool that is independent of the application, yet it records
specific information, that can be used for both service-level objective and service-level
agreement reporting?

272
To address this question, a detailed design was completed for the SLO/SLA Data
subsystem (see Table 30) and this subsystem was explored in detail in Scenario 4 (see
Appendix E) where history and statistics data was examined for the b2b-EzTran
application.
(Conclusion 33) It is possible to architect a tool that is independent of the application
itself using a collection of application-centered monitors involving URLs and key
application, middleware, database, network, and operating system processes. Special
functions like file transfers can also be included in the monitoring activities. The output of
the monitoring activity can be stored in the MIR as a sample and can be used for SLO or
SLA evaluation as needed. (Conclusion 34) The sample should include as many kinds of
monitors as possible otherwise a service failure in an area where there is no monitoring
will go undetected. An undetected service failure for a service level agreement customer
could result in a dispute for a refund between a customer and a service provider.
Question 21, a secondary research question, is also focused on the service level
functional perspective. This question examines the possibility of gathering both
availability and performance metrics in the service-level context. Gathering availability
data is commonly done, but gathering performance data could add another dimension to
the understanding of the service level of the Web application. The question is as follows:
Question 21 - Another service level question is--is it possible for a toolset to gather
availability and performance metrics as they relate to service level?
The detailed design that was completed for the SLO/SLA Data subsystem also
addresses this question. As previously described, this subsystem was explored in detail in
Scenario 4 where history and statistics data were examined for the b2b-EzTran
273
application. (Conclusion 35) It is possible to gather both availability and performance
data for service level use. Availability data is easier to gather as the monitors that gather
this data are simply testing to determine if a resource is up or down. Performance data is
more of a challenge because the monitors that gather this data need to be more detailed
and may have to execute Web application functions to take the necessary measurements.
(Conclusion 36) It would be less costly to use a robot or proxy, like those from the
Intimate Performance subsystem, to gather the performance data as this approach would
put less of a burden on the system supporting the Web application.
Question 22, a secondary research question, is focused on the software distribution
functional perspective. This question is directed at the challenge of providing a useful
mechanism for monitoring the distributions of the software for Web applications. The
question explores what can be done to make this monitoring a simple and straightforward
activity. The question is as follows:
Question 22 - For the software distribution functional perspective, is it possible to
create deployment-phase views that allow software distribution to be monitored on an
application component-by-component basis? Would it be helpful for the monitoring of
mission-critical distributions?
A detailed design was completed for the Deployment Monitoring subsystem (See
Table 31) and this subsystem was explored in the Scenario 2 (see Appendix E). In that
scenario, the deployment function was started and a problem with the deployment was
reported on the Deployment Monitoring view. The deployment was restarted after the
problem was resolved. The deployment function was useful and allowed the administrator
to start, stop, or restart a deployment for a Web application. The subsystem provided the
274
flexibility to handle multiple domains with a variety of different options to handle
situations that might arise including deployment errors. (Conclusion 37) This approach
was successful with products like the System Modification Program (OS/VS2 MVS
Overview, 1980) and it would be useful for Web applications as well where there is a
need to transfer installed and configured application to a target system for day-to-day
operations.
Question 23, a secondary research question, is focused on another aspect of the
software distribution functional perspective. This question examines the usefulness of
productivity tools that would save administration and setup time by gathering data and
building packages in anticipation of their use in distribution of the Web application. The
question is as follows:
Question 23 - Another software distribution question is--would it be useful to have a
tool that reads a directory structure and builds schema and data to populate the
Management Information Repository? These data, once loaded, could be used to build
packages for distribution, objects for distribution views, and storage for data or
information relating to distributions.
To address this question, a detailed design was completed for the MIR Creation
subsystem (see Table 32), but this subsystem was not explored in detail in the scenarios.
This subsystem was designed to perform a utility service for the software distribution
functional perspective and to the other subsystems by making it easier to populate the
MIR with the required data. Considering the number of elements that that are part of a
typical Web applications, it is impractical not to have a MIR creation subsystem.

275
The MIR Creation subsystem would decrease the labor required to meet the definition
needs of the toolset. One of the challenges of the toolset is configuring it to operate
effectively. (Conclusion 38) Some manual configuration is required for all software, but
leveraging the utility program from this subsystem, would achieve a balance between high
labor costs, the need for timely implementation, and the software's need for application-
specific input specifications.
Conclusions for Hypotheses 2, 3, and 4 The second, third, and fourth hypotheses will now be discussed. Hypothesis 1 can be
found earlier in this chapter as it is associated with the primary research questions. The
second hypothesis is a summary or synthesis of a number of secondary research questions.
This hypothesis includes the notion of the data sources which were an aspect of secondary
research questions 5, 15, 17, 18, 19, 20, and 21. This hypothesis also relates to the use of
the MIR. The effective use of the MIR was a consideration of secondary research
questions 4 through 23.
As previously stated, the secondary research questions were explored during the design
and implementation of the prototype toolset. The secondary research questions have an
almost one-to-one relationship to the subsystems that were designed in support of the 15
functional perspectives. Every subsystem that was designed made use of the MIR as its
primary data repository. The hypothesis is as follows:
Hypothesis 2 - Existing data sources like alerts, traps, and messages are sufficient to
build and maintain an effective management information repository for the
management of Web-based applications.

276
(Conclusion 39) This hypothesis is partially supported by the data from the survey, but
some participants questioned the viability of maintaining up-to-date information from
these data sources in the toolset's MIR. Some participants also commented that the data
maintenance burden might prove overwhelming. See Table 45 in Chapter 4 for a summary
of the weaknesses that were noted by the survey participants.
Existing data sources were an important source of information for the Full Life-Cycle
Toolset MIR. The sources of data for the prototype toolset are shown in the Table 47.
Table 47. Data Sources Used in the Toolset Scenarios
Scenario Primary Data Source Existing Source Only?
1 Messages and Monitors Yes
2 Messages No, mixed
3 Faults, Problems, and Command Responses
Yes
4 Monitors and Specialized Commands
No, mixed
5 Monitors, Faults, Problems, and Command Responses
No, mixed
In Scenario 1, an existing database message was used by the Web application to invoke
the Smart Fault subsystem. Other data for this scenario, specifically exception data, was
generated from monitors that detected exceptions with disk, memory, processors, and I/O
using conventional means. In Scenario 2, the primary data source was a message from a
software-distribution utility. Secondary sources were toolset generated and cannot be
characterized as an existing data source. In Scenario 3, the primary data sources are
generated by faults, problems, and command responses. The data sources are all from
existing methods and interfaces.
277
In Scenario 4, the data sources are monitors, but some specialized commands were
used. Existing data sources were important, but not used exclusively. In Scenario 5, data
was gathered using monitors, faults, problems, and command responses. As was the case
with Scenarios 2 and 4, existing data sources were utilized, but were not done so
exclusively. Appendix E contains the narrative and views that were presented to the
survey participants for all of the scenarios.
(Conclusion 40) The toolset data is inconclusive regarding the hypothesis that existing
sources are sufficient, as the prototype toolset did not exclusively exploit existing sources,
but leveraged them only to a significant extent. In a number of instances, toolset unique
function generated the data necessary to support the management function.
The third hypothesis is also a summary or synthesis of a number of secondary research
questions. This hypothesis is focused on problem determination which is an important
dimension of secondary research questions 4, 7, 8, 9, 10, 11, 12, 13, 14, 15, 17, 18, 19,
and 22. Every subsystem that was designed made use of the MIR as its primary data
repository, but these fourteen secondary research questions involve subsystems that have
a strong potential use for solving problems. The hypothesis is as follows:
Hypothesis 3 - Problem determination is significantly improved by a toolset that
utilizes views to display information from a comprehensive management information
repository of data about the Web-based application.
This hypothesis links three variables--improved problem determination, views to
display information, and a comprehensive information repository. These three attributes
with their count and rank are shown in the Table 48 below.

278
Table 48. Three Attributes of Significance to Hypothesis 3
Attribute Count Rank (1-7)
Improvements to problem determination
8 3
Straightforwardness of the User interface
5 6
Integrated data and information
15 1
Table 44, the informal strength summary from Chapter 4 contains information that was
gathered on all three variables. Improvements to problem determination was indicated by
8 of the 33 survey participants as a strength of the toolset. This was the third most
common benefit noted by the participants. Straightforwardness of the User Interface was
indicated by 5 of the 33 survey participants as a strength of the toolset. This was the sixth
most common benefit noted by the participants. Lastly, integrated data and information,
which was the highest ranking comment from the participants, was noted by 15 of the 33
survey participants as a strength of the toolset.
The 28 comments about these three attributes represent 53% of the strengths that were
indicated by the participants in the informal data gathering process. (Conclusion 41) The
data supports the hypothesis that problem determination is significantly improved by a
toolset that utilizes views to display information from a comprehensive management
information repository of data about the Web-based application.
The fourth hypothesis is also a summary or synthesis of a number of secondary
research questions. This hypothesis is focused on availability and performance which is an
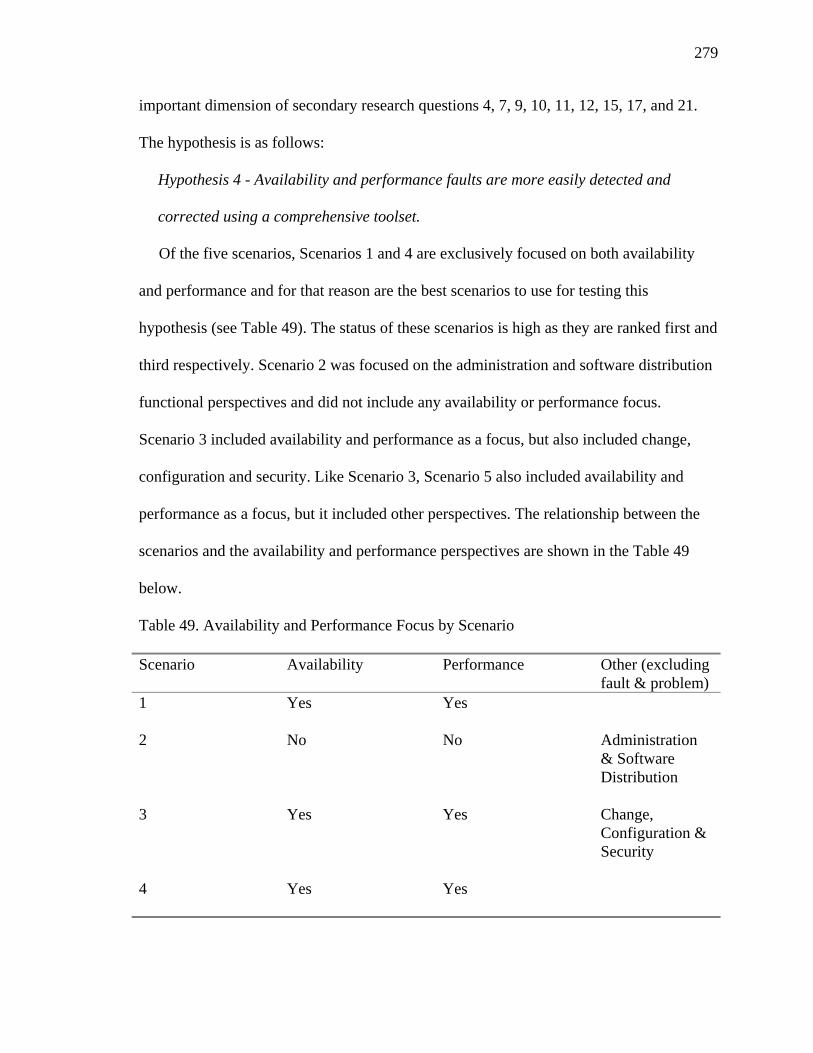
279
important dimension of secondary research questions 4, 7, 9, 10, 11, 12, 15, 17, and 21.
The hypothesis is as follows:
Hypothesis 4 - Availability and performance faults are more easily detected and
corrected using a comprehensive toolset.
Of the five scenarios, Scenarios 1 and 4 are exclusively focused on both availability
and performance and for that reason are the best scenarios to use for testing this
hypothesis (see Table 49). The status of these scenarios is high as they are ranked first and
third respectively. Scenario 2 was focused on the administration and software distribution
functional perspectives and did not include any availability or performance focus.
Scenario 3 included availability and performance as a focus, but also included change,
configuration and security. Like Scenario 3, Scenario 5 also included availability and
performance as a focus, but it included other perspectives. The relationship between the
scenarios and the availability and performance perspectives are shown in the Table 49
below.
Table 49. Availability and Performance Focus by Scenario
Scenario Availability Performance Other (excluding fault & problem)
1 Yes Yes
2 No No Administration & Software Distribution
3 Yes Yes Change, Configuration & Security
4 Yes Yes

280
Table 49. (continued)
Scenario Availability Performance Other (excluding fault & problem)
5 Yes Yes Accounting, Administration, Automation, Business, Capacity, Change, Configuration, Operations, Security, Service Level, & Software Distribution
(Conclusion 42) Since the scenarios that were primarily focused on availability and
performance ranked highly, the data supports the hypothesis that availability and
performance faults are more easily detected and corrected using a comprehensive toolset.
Strengths, Weaknesses, and Limitations of the Study The results from this research increase the focus on the management of applications. In
so doing, that helps to develop and grow the emerging discipline of applications
management by expanding the body of knowledge. The results of this research will foster
a change in approach from a narrow focus, like application availability or distribution, to a
broader, full life-cycle approach to address the challenges of managing applications. This
research, with its broader view, has focused on the connections and relationships between
life-cycle phases such as design and operations and functional perspectives like business
and service level.
This toolset helps to improve the productivity of application developers, operations
personnel, and management software administrators by providing them with ready-made

281
toolset components or samples that can easily be adapted for specialized use. Toolset
procedures provide a framework to handle the management of applications. These
procedures can be used to help design more manageable applications when used early in
the application life cycle. During operation and change phases, procedures help maintain
smooth day-to-day operations.
Toolset views provide improved ways to understand availability, capacity,
performance, and service level perspectives of applications management. Schema that
were developed defined the collection of data and information that is essential to full life-
cycle management of applications. These schema provided the definition of the data and
information that is important for the management of applications. It is expected that
effective use of the data and information that pertains to the management of applications
will enhance activities associated with many phases of the life cycle of a Web application.
It is also expected that application design will improve, since it will include design
points for functional perspectives like availability, change, configuration, and service
level. Operation phase activities will be more effective because applications that have
been designed for manageability will be easier to keep available and performing well for
the users who need them.
Problem resolution will be streamlined because diagnostic capabilities are improved
due to methods explored in the toolset. The application MIR will make it easier to find
data associated with failures by providing the data itself or a reference to the location that
contains the data. Information contained in the MIR will make it easier to answer
questions like--how has the application been performing over the last week or what is the
average number of problem records created a month for this application? This
282
information will save time for personnel working in performance, capacity, or problem
management roles.
Over the long term, the toolset will save labor by providing models and reduce the skill
level needed to instrument and operate a Web application. It will also result in higher
availability of Web applications, more rapid understanding of the impact of component
failures, more timely resolution of problems, and a high success rate for Web application
changes. Finally, the toolset will be the basis for improvements to existing products or a
new product or service offering.
There are some limitations associated with this research. This project resulted in a
prototype and not a production system. The focus of the prototype toolset effort was on
creating a significant number and variety of toolset elements so that the overall system
could be evaluated. Because of this focus, the development tools employed favored ease
of development and not the creation of a robust production-ready solution.
The prototype toolset implementation focused specifically on the management of Web
applications, not applications in general. Because of this, the toolset focused on Web-
specific aspects of monitoring, commands, operations interface, automation, and interface
to management systems like problem and change. The research did not focus on the
management of servers, networks, or hardware. A limitation exists in that the work of this
prototype implementation did not fully integrate data from these other important Web site
components.
Implications This section of the Final Report includes the implications of the results for the field of
study. (Implication 1) The schema for the application MIR could be used as a basis for a

283
Web application MIR. Many commercial products have data repositories, but few
products work with one another in an integrated manner. The schema from this toolset
design, when combined with data-gathering utilities, could be used by a variety of tools
and products to provide a powerful data repository to support the management of Web
applications.
(Implication 2) Data reduction techniques used in conjunction with the MIR could
provide a useful solution to many of the challenges of working with high-volume Web
files like activity logs. The number of logs and the volume of data they contain make it
difficult to use them. Several toolset components from this study can provide help in
transforming log data into meaningful information stored in a central repository. This
transformation of data would improve the availability and usefulness of these logs.
(Implication 3) Toolset prototype views, and the tools used to create and maintain
them, are useful to researchers who are working with user interfaces and the difficulties of
displaying large numbers of related components. Although this project was not focused on
the human-computer interface of a management system for Web applications, it did
reinforce the importance of surveying the users of the prototype before it was used as the
basis for a fully developed system. The views developed for this prototype toolset
contained usability problems that would need to be improved before the management
system could be used as the basis for a comprehensive system for the management of Web
applications.
(Implication 4) The exploration of the relationship between procedures and programs
is helpful to researchers working to understand and improve approaches to documenting
activities and maintaining accuracy between task-oriented procedures, their related
284
programs, and the ability of humans to backup automated procedures when needed. The
toolset that was designed for the full life-cycle management of Web applications made use
of automation whenever possible yet included procedures to keep the human operator
informed and knowledgeable about the management activities.
(Implication 5) The important role of the toolset evaluation of this study is useful to
researchers who focus on techniques that improve the effectiveness of systems developed
for human use. The evaluation from this toolset reinforces the benefits of presenting a
prototype to participants who stand to benefit from the use of the new system.
Recommendations This section includes recommendations for future research and for changes in
academic and professional practice. Additional research has already begun to flow from
this dissertation. As discussed in Chapter 3, Projected Outcomes, two papers were
published in 2001 on topics explored in this research. Please see Gulla and Hankins
(2001) and Gulla and Siebert (2001). Two more papers were published in 2002 on ideas
developed while completing this research. Please see Ahrens, Birkner, Gulla, and McKay
(2002) and Gulla and Hankins (2002). The research topics discussed below are proposed
as a continuation of this initial research activity.
The impact of visualization tools on application management: Does seeing the application-management data really help? (Recommendation 1) For this research topic, a study would be developed that would
focus on making application-management views available to key deployment, operation,
or change activity personnel and measuring the effect of the views on the efficiency and
effectiveness of the personnel. It is expected that use of application support views would

285
reduce problems or lessen their impact. It is also expected that the use of application
support views would improve the success rate of changes.
The application MIR as a real-time repository: Challenges of providing a high performance facility for applications management for users and programs (Recommendation 2) For this research topic, a study would be conducted that would
build upon this dissertation research by making the application MIR available in a high-
performance environment by leveraging a data-in-virtual tool like RODM (Finkel and
Calo, 1992) or a RDBMS with significant high-performance facilities. With this
environment in place, the researcher would test various situations where a real-time MIR
was needed and document the results of the efforts including lessons learned. It is
anticipated that making this data available in a high performance environment would
make the data useful in a broader number of circumstances.
Procedures and the programs that support them: Ideas on how to better integrate manual and automated technologies and the people who use them (Recommendation 3) For this research topic, a study would be conducted that would
build upon the dissertation project by exploring automated ways to combine written
procedures with the programs that support them. For example, a tool might be created that
automatically updates a procedure, when the program it uses is changed. Another
example is a tool, which creates a manual backup procedure, and automatically schedules
a test by a human, for an automated program-based task.
Marketplace view: The emerging disciplines for the management of applications (Recommendation 4) For this research topic, an investigation would be conducted and
a report written that would contain an examination of the product marketplace, derive a

286
set of new and emerging application-management disciplines, and discuss the key
technologies used by the most interesting products in these emerging areas.
The role of application management in the automated recovery of Web failures (Recommendation 5) For this research topic, a study would be conducted that would
design, implement, and test automated application recovery scenarios for a variety of Web
failures. Toolset work products could be leveraged to define a common approach to
handling these failures included automated actions like recovery and notification.
(Recommendation 6) Regarding changes in academic and professional practice,
researchers are encouraged to explore the management of applications using a full life-
cycle approach as this has the greatest potential to have an impact on the manageability of
Web applications. The full life-cycle approach is a new area of focus. (Recommendation
7) Researchers are also encouraged to continue to explore approaches that are focused on
disciplines or functional perspectives as this also holds great promise to more completely
address the challenges of managing Web applications.
This research supports the idea that administering a survey at the completion of a
development project can yield important and useful data about the prototype of production
systems. (Recommendation 8) Developers of application-management solutions are
encouraged to create prototypes and to measure their usefulness with the users of those
solutions. (Recommendation 9) Application developers should be encouraged to consider
the manageability of the Web application during the design process. Many of the
procedures developed as part of the toolset were focused on helping Web application
developers design manageability into their applications.

287
(Recommendation 10) Designers and developers should do a more effective job of
collecting and providing fault data to operators and administrators when Web applications
experience significant failures. A small investment in the design of the Web application
can have a important impact on the availability of the application after it is deployed.
(Recommendation 11) Management software companies should consider a full range
of management perspectives when developing products including accounting,
administration, automation, availability, business, capacity, change, configuration, fault,
operations, performance, problem, security, service level, and software distribution. This
scope will improve the effectiveness of products through increased depth and
functionality. (Recommendation 12) They should also build functionality into their
products that address the challenges associated with the management of an application
during all the phases of the application's life cycle including design, construction,
deployment, operation, and change. Consideration should be given other life-cycle phases
besides operation, which has historically received the most focus.
Summary In this research, the author completed a study that incorporated a broad range of
activities including design, development, testing, and evaluation. The design was
completed using a JAD approach that leveraged the skills of a group of individuals
experienced in the management and support of Web applications. Appendix F contains the
materials that were used in the first of two JAD sessions. After the JAD sessions, a
comprehensive design was completed that consisted of 19 subsystems. The subsystems
were supported by 43 procedures, 78 programs, 25 views, and a database that contained
59 tables.
288
The scope of the design included the accounting, administration, automation,
availability, business, capacity, change, configuration, fault, operations, performance,
problem, security, service level, and software distribution functional perspectives. The
scope of the design also embraced the application life cycle including design,
construction, deployment, operation, and change. This design was summarized in Chapter
4. Tables 13 through 32 contain the comprehensive list of procedures, programs, views,
and database tables that make up the 19 subsystems.
A RAD segment strategy was developed and documented and used as a framework to
translate the comprehensive design into a prototype containing a representative subset of
the total functionality of the toolset. The segment strategy was used to group the toolset
components into scenarios that would make them easier develop and evaluate. The
segment strategy is contained in Chapter 4. Using the segment strategy, the researcher
developed the prototype toolset using a HTML generator for the toolset views and
procedures. The graphical interface that was developed consisted of 12 independent Web
pages and 37 framesets consisting of 74 frames. Figure 13 contains an example of the
layout of a typical Web page.
A relational database was used for the MIR and a subset of database tables were
created in support of the prototype toolset. Appendix H contains the data dictionary that
was used for the development of the prototype toolset. The toolset views were collected
into a document that explained the scenarios in detail and this package was given to 33
survey participants. The complete toolset scenarios can be found in Appendix E. The
survey participants answered five questions for each scenario and supplied written

289
comments on the strengths and weaknesses of the toolset. Appendix B contains the toolset
evaluation survey questions.
The survey participants also supplied demographic information about themselves like
years of IT experience and their current job responsibility. A summary of this profile
information can be found in Table 35. The data collected was analyzed to determine if the
toolset was effective and to see if the data supported the hypotheses. Two approaches
were used to analyze the data. The approaches were the scenario-by-scenario approach
and the question-by-question approach.
For the scenario-by-scenario approach, the data revealed that the simpler scenarios
were more successful than the larger and more complex scenarios. The data for the
scenario-by-scenario approach can be found in Tables 36 through 40. For the question-by-
question approach, the data revealed that the participants thought that the toolset was
sophisticated and that it met the requirement for management of Web applications. The
data for the question-by-question approach can be found in Tables 42 and 43. However,
the toolset appears to have fallen short regarding its potential impact on the organization
that it was intended to support.
The toolset research explored three primary research questions and 20 secondary
research questions. The complete discussion for the research questions can be found in
this chapter. The research also examined four hypotheses. Regarding the hypotheses, the
data from the study supported hypothesis 1, 3, and 4, but was inconclusive regarding
hypothesis 2. The author has published four papers relating to this research and there are a
number of opportunities for additional papers and studies. It is expected that this
dissertation will have an impact on the management of applications because it has

290
explored and demonstrated the usefulness of a full life-cycle approach to the management
of applications. It also examined the association of 15 functional perspectives within the
context of the application life cycle while leveraging a toolset that consisted of
procedures, programs, views, schema, and data.

291
Appendixes
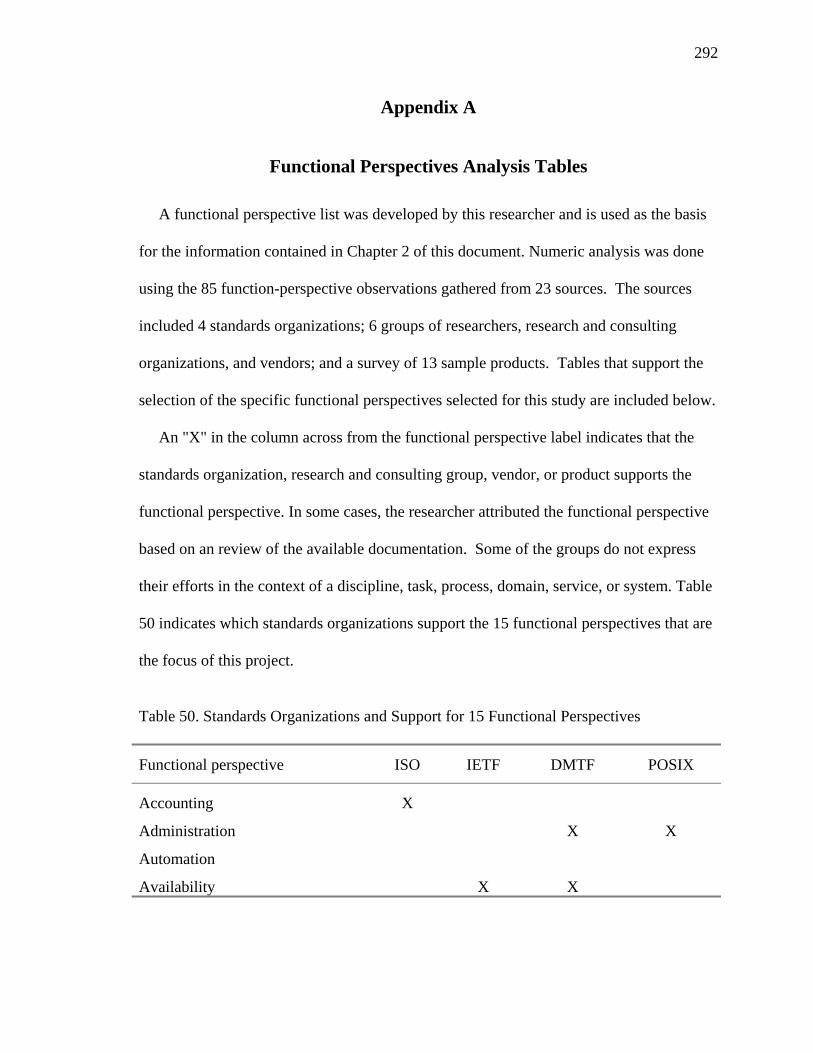
292
Appendix A
Functional Perspectives Analysis Tables A functional perspective list was developed by this researcher and is used as the basis
for the information contained in Chapter 2 of this document. Numeric analysis was done
using the 85 function-perspective observations gathered from 23 sources. The sources
included 4 standards organizations; 6 groups of researchers, research and consulting
organizations, and vendors; and a survey of 13 sample products. Tables that support the
selection of the specific functional perspectives selected for this study are included below.
An "X" in the column across from the functional perspective label indicates that the
standards organization, research and consulting group, vendor, or product supports the
functional perspective. In some cases, the researcher attributed the functional perspective
based on an review of the available documentation. Some of the groups do not express
their efforts in the context of a discipline, task, process, domain, service, or system. Table
50 indicates which standards organizations support the 15 functional perspectives that are
the focus of this project.
Table 50. Standards Organizations and Support for 15 Functional Perspectives
Functional perspective ISO IETF DMTF POSIX
Accounting X
Administration X X
Automation
Availability X X
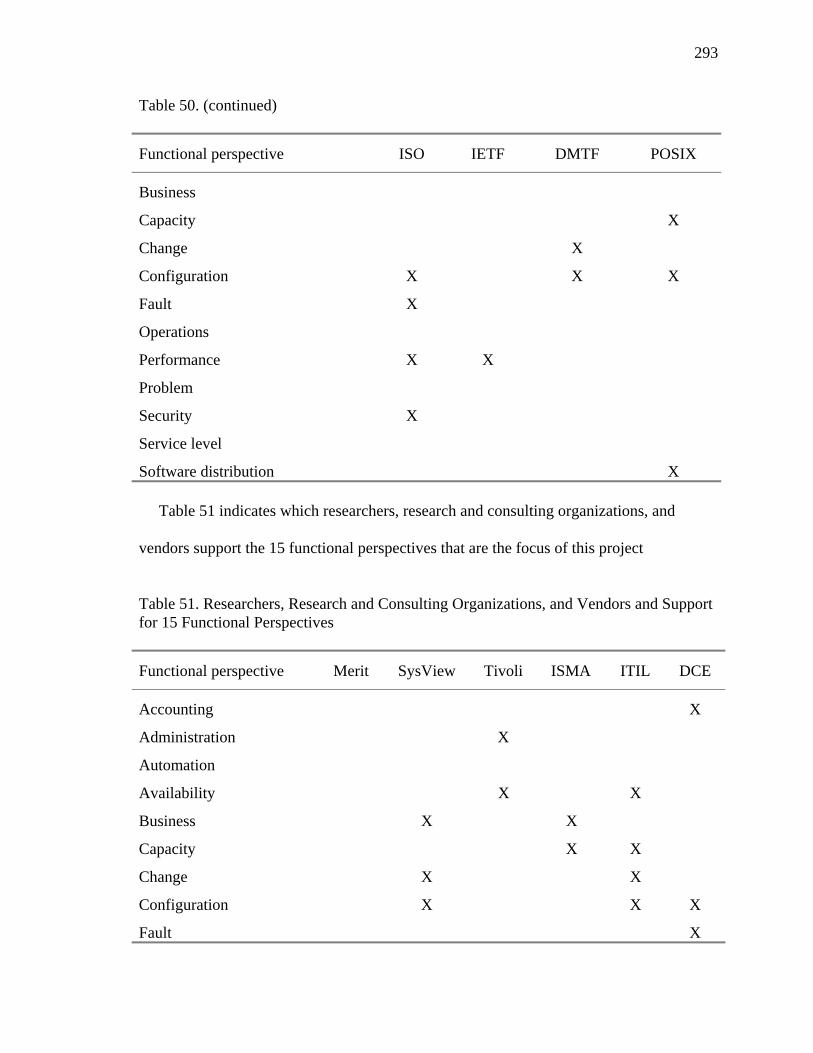
293
Table 50. (continued)
Functional perspective ISO IETF DMTF POSIX
Business
Capacity X
Change X
Configuration X X X
Fault X
Operations
Performance X X
Problem
Security X
Service level
Software distribution X Table 51 indicates which researchers, research and consulting organizations, and
vendors support the 15 functional perspectives that are the focus of this project
Table 51. Researchers, Research and Consulting Organizations, and Vendors and Support for 15 Functional Perspectives
Functional perspective Merit SysView Tivoli ISMA ITIL DCE
Accounting X
Administration X
Automation
Availability X X
Business X X
Capacity X X
Change X X
Configuration X X X
Fault X
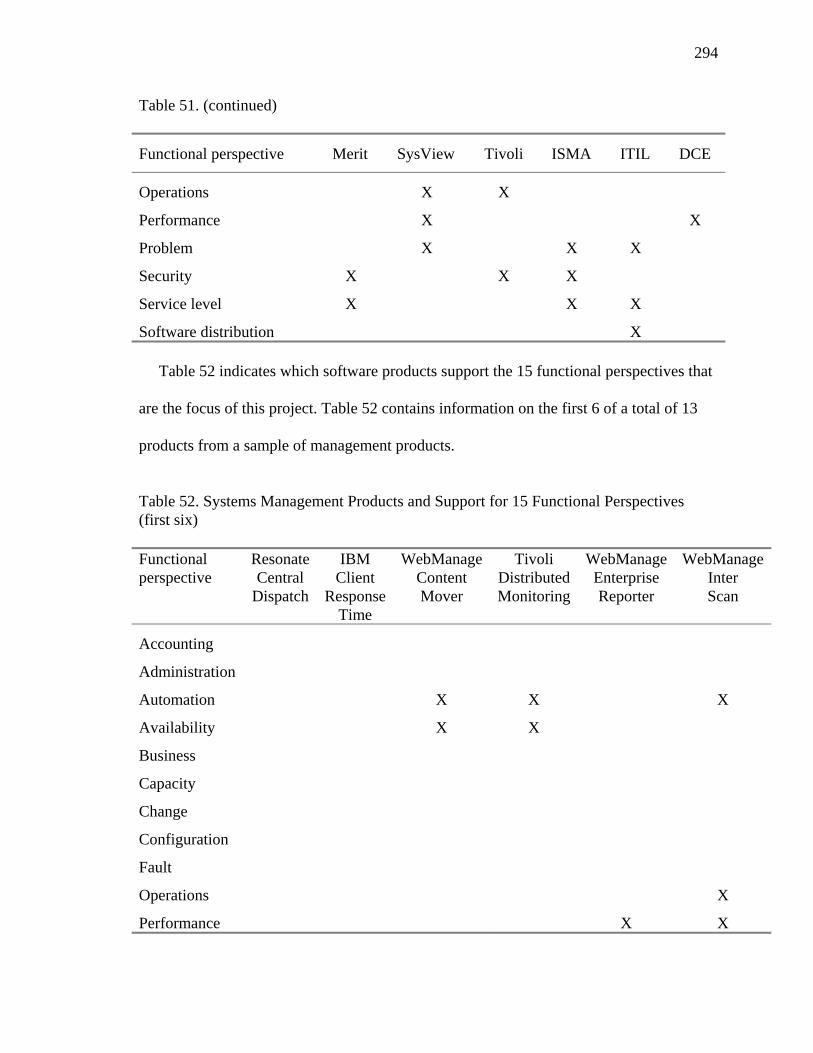
294
Table 51. (continued)
Functional perspective Merit SysView Tivoli ISMA ITIL DCE
Operations X X
Performance X X
Problem X X X
Security X X X
Service level X X X
Software distribution X Table 52 indicates which software products support the 15 functional perspectives that
are the focus of this project. Table 52 contains information on the first 6 of a total of 13
products from a sample of management products.
Table 52. Systems Management Products and Support for 15 Functional Perspectives (first six) Functional perspective
Resonate Central
Dispatch
IBM Client
Response Time
WebManage Content Mover
Tivoli Distributed Monitoring
WebManage Enterprise Reporter
WebManage Inter Scan
Accounting
Administration
Automation X X X
Availability X X
Business
Capacity
Change
Configuration
Fault
Operations X
Performance X X

295
Table 52. (continued) Functional perspective
Resonate Central
Dispatch
IBM Client
Response Time
WebManage Content Mover
Tivoli Distributed Monitoring
WebManage Enterprise Reporter
WebManage Inter Scan
Problem
Security
Service level X X
Software Distribution
X
Table 53 indicates which software products support the 15 functional perspectives that
are the focus of this project. Table 53 contains information on the final seven of a total of
13 products from a sample of management products.
Table 53. Systems Management Products and Support for 15 Functional Perspectives (last seven) Functional perspective
Trend Micro
IS Web
Manager
Keynote Perspective
BMC Patrol
IBM PCPMM
Web Manage Service Level Report
Platform Site
Assure
IBM Server
Resource Manage-
ment
Accounting
Administration
Automation X
Availability X X X
Business
Capacity X X
Change
Configuration
Fault X
Operations
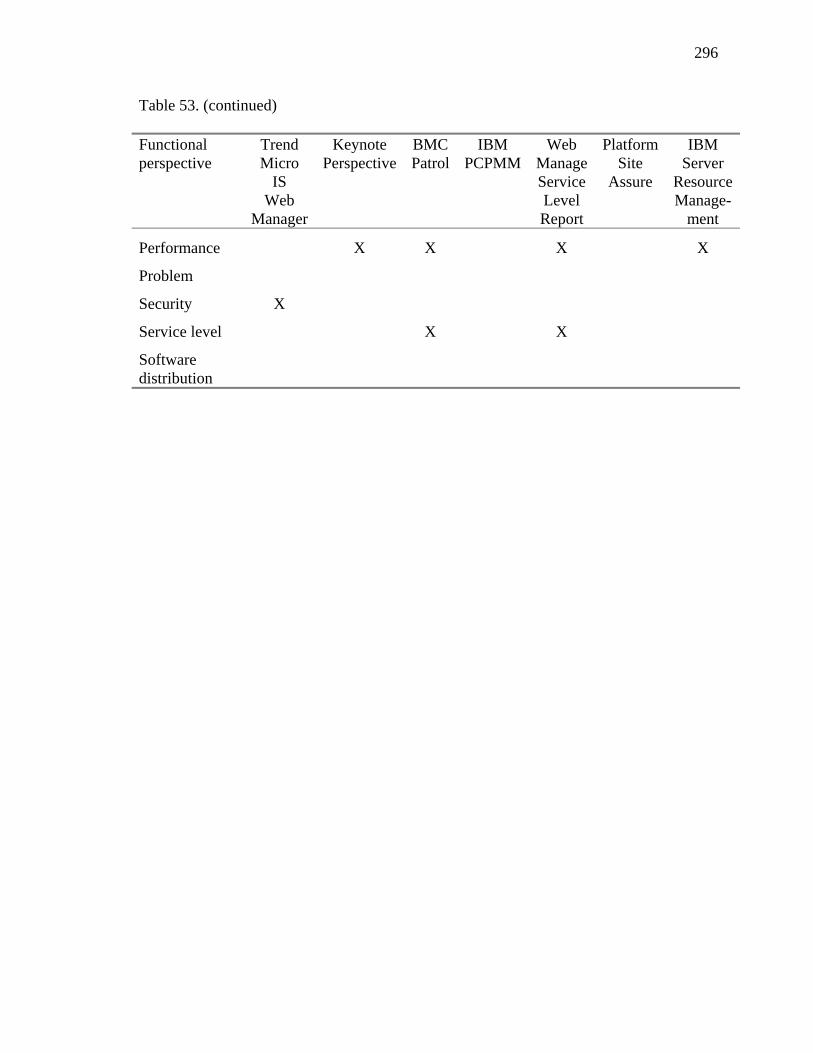
296
Table 53. (continued) Functional perspective
Trend Micro
IS Web
Manager
Keynote Perspective
BMC Patrol
IBM PCPMM
Web Manage Service Level Report
Platform Site
Assure
IBM Server
Resource Manage-
ment
Performance X X X X
Problem
Security X
Service level X X
Software distribution
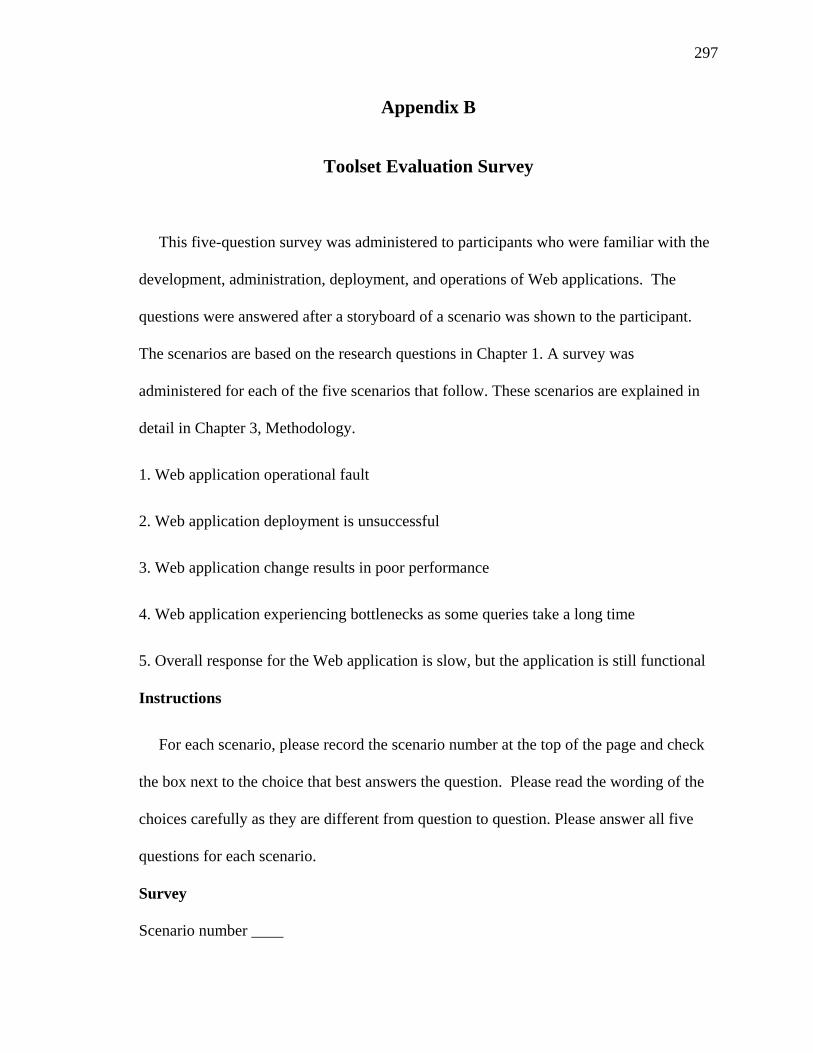
297
Appendix B
Toolset Evaluation Survey
This five-question survey was administered to participants who were familiar with the
development, administration, deployment, and operations of Web applications. The
questions were answered after a storyboard of a scenario was shown to the participant.
The scenarios are based on the research questions in Chapter 1. A survey was
administered for each of the five scenarios that follow. These scenarios are explained in
detail in Chapter 3, Methodology.
1. Web application operational fault
2. Web application deployment is unsuccessful
3. Web application change results in poor performance
4. Web application experiencing bottlenecks as some queries take a long time
5. Overall response for the Web application is slow, but the application is still functional
Instructions
For each scenario, please record the scenario number at the top of the page and check
the box next to the choice that best answers the question. Please read the wording of the
choices carefully as they are different from question to question. Please answer all five
questions for each scenario.
Survey Scenario number ____

298
1. Which best characterizes how easy it was to understand how the toolset handles this
scenario?
_ A lot of effort to understand
_ A moderate amount of effort to understand
_ A minimum effort to understand
2. Which best characterizes the level of sophistication of the toolset in the way it handled
this scenario?
_ Low
_ Sufficient
_ High
3. Which best characterizes how well the toolset met the requirements of handling this
scenario?
_ Partially fulfills requirements
_ Meets requirements
_ Completely fulfills requirements
4. Which best characterizes how usable the toolset was when handling this scenario?
_ Not easy to understand
_ Easy to understand, but there are some usability concerns
_ User friendly and efficient to use
5. Which best characterizes the impact that the toolset might have on the organization
because of the way it handled this scenario?

299
_ No major impact on the users and their productivity
_ Will have an impact, but improvements are needed
_ Will have an major impact

300
Appendix C
Institutional Review Board Documents
Three forms are included in this appendix--Submission, Research Protocol, and Consent. These forms were submitted and approved by the Nova Southeastern Institution Review Board representative for the SCIS. The electronic letter of approval is also included in this appendix. Submission Form
Institutional Review Board for Research with Human Subjects (IRB)
Submission Form To be completed by IRB/Center/College Representative: Date Received _______Center/College___________________________________ Representative________________________________________________________ *Protocol Number_______________________________________________________ *(To be assigned by the Office of Grants & Contracts) Protocol Qualifies for: Full Review____ Expedited Review____ Exemption____ Instructions: In order to comply with federal regulations as well as to conform with guidelines of the University's Institutional Review Board (IRB), the principal investigator is required to complete all of the following items contained in the Submission Form and the IRB Protocol. Upon completion of all information, the principal investigator must submit the original Submission Form and one copy of the IRB Protocol, including all consent forms and research instruments (questionnaires, interviews, etc.) to the appropriate IRB College/ Center Representative for review and action. Once reviewed and signed off by the Center Representative, the principal investigator is responsible for submitting the original Submission Form along with 22 copies of the Submission Form, IRB Protocol, and consent forms to the Office of Grants and Contracts. In addition, one copy of all research instruments (questionnaires, interviews, etc.) must be submitted to the Office of Grants and Contracts. The completed package must be received by the Office of Grants and Contracts by the last business day of the month prior to the next scheduled IRB meeting. The Office of Grants and Contracts' Web site should be consulted for IRB meeting dates. Incomplete forms may delay review by the IRB. For further information, refer to the Policy and Procedure Manual for Research with Human Subjects. I. General Information A. Project Title_ This study is the evaluation activity for the dissertation titled Design and Implementation of a Prototype Toolset for Full Life-Cycle Management of Web-Based Applications __

301
New__X___ Continuation/Renewal_____ Revision_____ Proposed Start Date__ November 15, 2001_________ Proposed Duration of Research___One month__________________________ Performance Site(s)__IBM Web-Hosting Facility in Research Triangle Park North Carolina __ B. Principal Investigator__Joseph Gulla__________________________________ Faculty _____ Staff _____ Student __X___
Center/College/Department __PhD Candidate, Graduate School of Computer and Information Sciences Home Mailing Address_201 Orchard Lane______________________________ City__Carrboro_______ State_____NC__________ Zip___27510__________ Home Phone Number __(919) 968-6101_ Office Phone Number__(919) 254-4683__ Co-Investigator(s) __Under the guidance of Dissertation Chair John A. Scigliano, Professor School of Computer and Information Sciences______________________ Principal Investigator's Signature_(Signed electronically by) Joseph Gulla _Date_09/19/2001__ II. Funding Information If this protocol is part of an application to an outside agency, please provide: A. Source of Funding __________N/A______________________________ B. Project Title (if different from above)___________________ C. Principal Investigator (if different from above)__________ D. Type of Application: E. Grant_____ Subcontract_____ Contract_____ Fellowship______ F. Date of Submission ______________________________________ III. Cooperative Research Cooperative research projects are those that involve more than one institution and can be designed to be both multi-site and multi-protocol in nature. Each participating institution is responsible for safeguarding the rights and welfare of human subjects and for complying with all regulations. If this proposal has been submitted to another Institutional Review Board please provide: Name of Institution __________N/A_______________________________

302
Date of Review ___________ Contact Person __________________ IRB Recommendation __________________________________________ IV. Subject/patient Information A. Types of Subjects/Patients (check all that apply) Fetus in Utero/non-viable fetues/abortuses Newborns/Infants Children (aged 2-12) Adolescents (aged 13-18) X Adults (over 18) Pregnant Women Special populations (e.g., prisoners, mentally disabled) Specify ____________ B. Other (Check all that apply) Use of investigational drugs or devices Information to be collected may require special sensitivity (e.g. substance abuse, sexual behavior) C. Number of Subjects/Patients ___40______ D. Approximate time commitment for each subject/patient ___60 minutes____ E. Compensation to subjects/patients : Yes_____ No__X___ F. Form (e.g. cash, taxi fare, meals) _____ Amount_____ V. Continuation or Renewals A. Attach a copy of the original IRB protocol B. Indicate all proposed changes in the IRB protocol affecting subjects C. Progress Report * Indicate the number of subjects entered in the study, including their group status, whether they are active or completed, the number of subjects still pending, and the time frame of subject participation. * Indicate adverse or unexpected reactions or side effects that have occurred or are expected. If none, state none. * Summarize the results of the investigation to date (in terms of subjects entered, in process, completed, and pending). D. Attach consent form(s) to be used and indicate if any changes have been made.
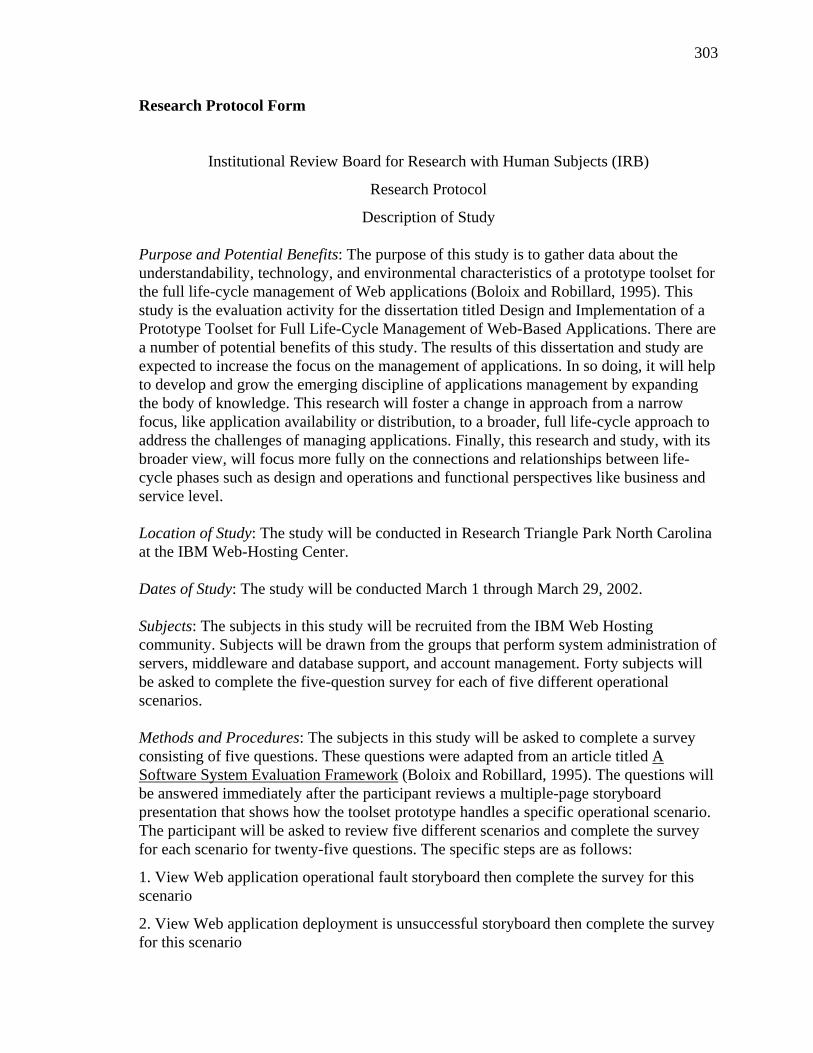
303
Research Protocol Form
Institutional Review Board for Research with Human Subjects (IRB)
Research Protocol
Description of Study Purpose and Potential Benefits: The purpose of this study is to gather data about the understandability, technology, and environmental characteristics of a prototype toolset for the full life-cycle management of Web applications (Boloix and Robillard, 1995). This study is the evaluation activity for the dissertation titled Design and Implementation of a Prototype Toolset for Full Life-Cycle Management of Web-Based Applications. There are a number of potential benefits of this study. The results of this dissertation and study are expected to increase the focus on the management of applications. In so doing, it will help to develop and grow the emerging discipline of applications management by expanding the body of knowledge. This research will foster a change in approach from a narrow focus, like application availability or distribution, to a broader, full life-cycle approach to address the challenges of managing applications. Finally, this research and study, with its broader view, will focus more fully on the connections and relationships between life-cycle phases such as design and operations and functional perspectives like business and service level. Location of Study: The study will be conducted in Research Triangle Park North Carolina at the IBM Web-Hosting Center. Dates of Study: The study will be conducted March 1 through March 29, 2002. Subjects: The subjects in this study will be recruited from the IBM Web Hosting community. Subjects will be drawn from the groups that perform system administration of servers, middleware and database support, and account management. Forty subjects will be asked to complete the five-question survey for each of five different operational scenarios. Methods and Procedures: The subjects in this study will be asked to complete a survey consisting of five questions. These questions were adapted from an article titled A Software System Evaluation Framework (Boloix and Robillard, 1995). The questions will be answered immediately after the participant reviews a multiple-page storyboard presentation that shows how the toolset prototype handles a specific operational scenario. The participant will be asked to review five different scenarios and complete the survey for each scenario for twenty-five questions. The specific steps are as follows:
1. View Web application operational fault storyboard then complete the survey for this scenario
2. View Web application deployment is unsuccessful storyboard then complete the survey for this scenario
304
3. View Web application change results in poor performance storyboard then complete the survey for this scenario
4. View Web application availability is limited (some functions not working) storyboard then complete the survey for this scenario
5. View Web application experiencing bottlenecks (some queries take a long time) storyboard then complete survey for this scenario The scenarios and survey questions will be available electronically or in paper form to support the preferences of the participant. Participants who are part of the Web-hosting community, but in locations other than Research Triangle Park North Carolina will also be invited to participate using electronic or paper form. Participant Payments or Costs: There will be no cost to the participant to participate in the survey. Participations will not receive payment to complete the survey, however, they will receive a token of appreciation for participating in the survey. Subject Confidentiality: Confidentially will be maintained by the numeric coding and stripping of identifying information of all data. All subjects will be assigned ID numbers which will be used in place of names on all assessment materials. The list linking the ID numbers and names will be maintained in locked and secured files by the primary investigator. Additionally, all data will be stored in locked file drawers at each stage of data transfer. Moreover, all data obtained will be accessible only to the researcher, and no subject will be identified in any report of the project. Potential Risks to Subjects: The likelihood of loss of confidentially and privacy to the subjects is rare. Techniques to minimize this risk are explained in Subject Confidentiality above. Risk/Benefit Ratio (if required for funded project): This project is not funded. Informed Consent: Subjects will be shown an informed consent form. The form is included in this package. Reference: Boloix, G. & Robillard, P. (1995). A software system evaluation framework. Computer, 28(12), 17-26.
305
Consent Form
Informed Consent Form for a Study Supporting the Dissertation Titled
Design and Implementation of a Prototype Toolset for Full Life-Cycle Management of Web-Based Applications
Funding Source: Not a funded project as study is in support of PhD dissertation
IRB approval # _________________
Joseph Gulla 201 Orchard Lane Carrboro, NC 27510 Institutional Review Board, Office of Grants and Contracts, Nova Southeastern University: (954) 262-5369 Description of the Study: The purpose of this study is to gather data about the understandability, technology, and environmental characteristics of a prototype toolset for the full life-cycle management of Web applications. This study is the evaluation activity for the dissertation titled Design and Implementation of a Prototype Toolset for Full Life-Cycle Management of Web-Based Applications. There are a number of potential benefits of this study. The results of this dissertation and study are expected to increase the focus on the management of applications. In so doing, it will help to develop and grow the emerging discipline of applications management by expanding the body of knowledge. This research will foster a change in approach from a narrow focus, like application availability or distribution, to a broader, full life-cycle approach to address the challenges of managing applications. Finally, this research and study, with its broader view, will focus more fully on the connections and relationships between life-cycle phases such as design and operations and functional perspectives like business and service level. Costs and Payments to the Participant: There is no cost for participation in this study. The participant will, however, receive a token of appreciation for participating in the study. There is no penalty for withdrawal from the study. Risks /Benefits to the Participant: There are no risks involved with your participation in the study. You will be completing a survey with five questions after you review each of five Web application operational scenarios. The main benefit to be derived from your involvement is the satisfaction that might come from helping a student complete the assessment aspects of his research. This research and study may influence future IBM products, but there is no guarantee that the prototype toolset developed for this study will result in an IBM product, offering, or service.

306
Confidentiality: Information obtained in this study is strictly confidential. You will be assigned a study number, and this number, rather than your name, will be recorded on the various assessments you receive. Only Joseph Gulla will have a record of which person has been assigned what number, and this information will be secured in a locked filing cabinet in his office. Your name will not be used in the reporting of information in publications or conference presentations. Your anonymity and confidentiality will be protected. Participant's Right to Withdraw from the Study: You may choose not to participate or to stop participation in the research program at any time without penalty. If you choose not to participate, the information collected about you will be destroyed. Voluntary Consent by Participant: Participation in this research project is voluntary, and your consent is required before you can participate in the research program. I have read the preceding consent form, or it has been read to me, and I fully understand the contents of this document and voluntarily consent to participate. All of my questions concerning the research have been answered. I hereby agree to participate in this research study. If I have any questions in the future about this study Joseph Gulla who can be reached at (919) 413-3274 will answer them. A copy of this form has been given to me. Participant's Signature:__________________________ Date:__________________ Witness's Signature:_____________________________ Date: __________________
307
Electronic Letter of Approval "James Cannady" <[email protected]> 09/24/2001 09:43 AM Please respond to j.cannady To: Joseph Gulla/Raleigh/IBM@IBMUS cc: "John Scigliano" <[email protected]> Subject: IRB Documentation Joe, After reviewing your revised IRB Submission Form, Research Protocol, and the additional documentation that you submitted I have approved your proposed research for IRB purposes. Your research has been determined to be exempt from further IRB review based on the following conclusion: Research using survey procedures or interview procedures where subjects' identities are thoroughly protected and their answers do not subject them to criminal and civil liability. Please note that while your research has been approved, additional IRB reviews of your research will be required if any of the following circumstances occur: 1. If you, during the course of conducting your research, revise the research protocol (e.g., making changes to the informed consent form, survey instruments used, or number and nature of subjects). 2. If the portion of your research involving human subjects exceeds 12 months in duration. Please feel free to contact me in the future if you have any questions regarding my evaluation of your research or the IRB process. Dr. James Cannady Assistant Professor/IRB Representative School of Computer and Information Sciences Nova Southeastern University

308
Appendix D
Tivoli Management Applications
This appendix contains a comprehensive list of applications that are part of the Tivoli
management suite. This appendix is referenced in Chapter 2 of this report.
- Tivoli Application Performance Management
- Tivoli Applications Management Suite
- Tivoli Asset Management
- Tivoli Availability Management Suite
- Tivoli Cable Data Services Manager
- Tivoli Change Management
- Tivoli Change Management Suite
- Tivoli Cross-Site™ for Availability
- Tivoli Cross-Site for Deployment
- Tivoli Cross-Site for Security
- Tivoli Data Protection for Workgroups
- Tivoli Database Management
- Tivoli Device Manager for Palm™ Computing Platform
- Tivoli Decision Support for OS/390® (formerly Tivoli Performance Reporter for
OS/390) Accounting Feature
- Tivoli Decision Support for OS/390 AS/400® System Performance Feature
- Tivoli Decision Support for OS/390 CICS® Performance Feature
- Tivoli Decision Support for OS/390 Distributed System Feature

309
- Tivoli Decision Support for OS/390 IMS Performance Feature
- Tivoli Decision Support for OS/390 Network Performance Feature
- Tivoli Decision Support for OS/390 Performance Reporter Base
- Tivoli Decision Support for OS/390 System Performance Feature
- Tivoli Distributed Monitoring
- Tivoli Distributed Monitoring for Windows NT®/2000
- Tivoli Enterprise Console
- Tivoli Global Enterprise Manager
- Tivoli Inventory
- Tivoli IT Director
- Tivoli Manager for BEA Tuxedo
- Tivoli Manager for CATIA
- Tivoli Manager for Domino
- Tivoli Manager for Domino - IT Director Edition
- Tivoli Manager for MCIS
- Tivoli Manager for Microsoft® Exchange
- Tivoli Manager for Microsoft Exchange - IT Director Edition
- Tivoli Manager for Microsoft SQL Server - IT Director Edition
- Tivoli Manager for MQSeries®
- Tivoli Manager for Network Connectivity
- Tivoli Manager for OS/390®
- Tivoli Manager for PeopleSoft
- Tivoli Manager for Retail

310
- Tivoli Manager for R/3
- Tivoli Manager for SuiteSpot
- Tivoli Manager for Network Hardware
- Tivoli NetView®
- Tivoli NetView - IT Director Edition
- Tivoli NetView for OS/390
- Tivoli NetView Performance Monitor (NPM)
- Tivoli Operations Planning and Control
- Tivoli Output Manager
- Tivoli Problem Management
- Tivoli Remote Control
- Tivoli SANergy™ File Sharing
- Tivoli SecureWay® Global Sign-On
- Tivoli SecureWay Policy Director&
- Tivoli SecureWay Risk Manager
- Tivoli SecureWay Security Manager
- Tivoli SecureWay User Administration
- Tivoli Security Management Suite
- Tivoli Service Desk
- Tivoli Service Desk for OS/390
- Tivoli Software Distribution
- Tivoli Storage Manager
- Tivoli Workload Scheduler for Baan

311
- Tivoli Workload Scheduler for Oracle
- Tivoli Workload Scheduler for R/3 (Tivoli Product Index, 2001)
312
Appendix E
Survey Materials Used for the Toolset Evaluation This appendix contains the snapshot material that was used for the toolset evaluation.
This material is ordered by scenario. Each scenario was given to the participants as part of
a package that contained a cover letter, an informed consent form, survey questions, and
the scenario materials in two parts. The first part contained narrative and screen captures
of the toolset views. This part was used to help the participant to understand the "big
picture" of each scenario. The second part of the scenario package contained a print out of
the right side of each frameset. The right side contained more detail than could be seen in
a screen capture and was easier to read. In this appendix, only the material for the first
part in included.

313
Scenario 1 - Web Application Operational Fault
This Web page is the starting point for all the scenarios to be evaluated. Scenario 1,
Web application operational fault, is the first link on the Web page below.
The General Ledger application has been instrumented to generate faults when it
detects a significant problem. In this scenario, a database fault (SQL error) is experienced
by the application and a fault is created to help the database administrator to diagnose and
fix the problem.

314
This Procedure Page Guides the Administrator's Actions
This page is taken from the toolset procedures. It guides the person handling the
problem through the steps to take to manage the fault that has been generated by the
application.
This procedure outlines the main steps and views to use to handle the fault including --
1. The Specific Fault view is used to get a snapshot of information about the fault 2. The Detailed Data view contains a description, action, recommendation, and contact information for this specific fault 3. Vendor Recommended Actions (not explored here) can be used to take recovery actions 4. The Resource Modeling view is used to see if any disk, memory, processor, or I/O exceptions have been reported 5. Administrator Action View is used to record actions and transfer the fault to the problem-management system.

315
Step 1 - Examine the Specific Fault View
The frame on the right side of this Web page contains primary and additional fault
information. The information was gathered by a subsystem called Specific Fault. The
information is designed to make it clear to individuals how to handle the fault. The fault
itself determines the group that should handle it, for example, Database Administration.
The primary fault information is the information that is usually part of a Tivoli Event
Console (T/EC) Event. The additional information was gathered by the Smart Fault
subsystem and includes detailed information to help the database administrator diagnose
the root cause of the fault. This information may also be useful if the root cause of the
fault is a defect in the application or database software.

316
Step 2 - Examine the Detailed Data for this Fault
The frame on the right side of this Web page contains detailed information about the
fault like cause description and the technical actions to be taken. This data is from a
subsystem called Detailed Data. The Smart Fault Generation and Detailed Data
subsystems were designed to work together. Every fault has associated detail data.
Step 3 - Vendor Recommended Actions
The handling of recommended actions is not shown here, as the person handing the
fault at this time is not a database subject matter expert. When the database administrator
takes over the resolution of the fault, they will use the specific action (above) as a starting
point for handling the problem.

317
Step 4 - Site-Specific Actions Require the use of the Resource Modeling View
The frame on the right side of this Web page displays information about exceptions
that have been recorded for the servers that make up the General Ledger application. This
information was gathered by a subsystem called Resource Modeling.
This view was used because the SQL error involved a problem with system resources.
The resource modeling view displays exceptions that were detected from the production
General Ledger system. These exceptions were recorded when the production system did
not operate in the way that the developer modeled it to run. Put another way, its operation
was inconsistent with its operational model.

318
Step 5 - Make the Required Updates Then Transfer Fault Data to the Problem-
Management System
The frame on the right side of this Web page is used to update information about the
fault and to transfer the data to the problem-management system.
Since the person handling the fault at this time was the primary customer-care person
and not the database administrator for general ledger, their responsibility was to record the
information found and any actions taken and transfer the fault to the problem-management
system as quickly as possible. The database administrator for the application was also
paged for a quick response to the problem.

319
Confirmation Web page
This Web page indicates that the fault data has been successfully transferred to the
problem-management system. The database administrator for General Ledger will use the
problem-management system to close the problem after the problem that caused the fault
is resolved.
This is the end of Scenario 1. Please review the detailed views that follow and complete
the first survey. The detailed views are printed versions of the right-side frames of all the
views used in this scenario. The left-side frames are used only for navigation and contain
links to additional reports and views.

320
Scenario 2 - Web Application Deployment is Unsuccessful
This Web page is the starting point for all the scenarios to be evaluated. Scenario 2,
Web application Deployment is Unsuccessful, is the second link on the page below.
The HR Benefits application is tested and ready to be installed, configured, and
deployed to the verification domain. In this scenario, a problem is detected during the
deployment of the application. The specific fault and detailed data views are used to
understand the fault and take the specified actions. The fault is transferred to the problem-
management system as a closed problem.

321
This Procedure Page Guides the Administrator's Actions
This page is taken for the toolset procedures. It guides the person handling the problem
through the steps to take to monitor the installation, configuration, and deployment of the
application. It is during the deployment that a problem occurs that the administrator needs
to handle.
This procedure outlines the main steps and views to be used to deploy the application
and handle any problems that may arise. To deploy the application, the authorized
installation, automated configuration, and deployment monitoring action views are used.
To handle the deployment failure, the specific fault, detailed data, and administrator
action views are used.

322
Step 1 - Check on the Status of the Automated Installation
The frame on the right side of this Web page contains information on the status of the
automated installation that was run by the development group. The Installation of HR
Benefits on the target systems was a success.
Automated installation and automated configuration are part of the same subsystem.
The convention is to install the application, configure that application, and then deploy it.
The steps were divided up in this way to provide flexibility during processing like
automated installation and manual configuration or manual installation and automated
configuration. In all cases, the deployment to build the application domain (test,
verification, and production) is done using automated processes.

323
Step 2 - Check on the Status of the Automated Configuration
The frame on the right side of this Web page contains detailed information about the
Status of the configuration of the HR Benefits application. Like the installation, the
configuration actions were successful.
From this view, it is possible to browse the configuration definitions. Also, this view
can be used to browse the logfile that was build during the automated configuration
actions. Taking a detailed look at the definitions and the logfile can give the administrator
a deeper understanding of what actions took place during the configuration step.

324
Step 3 - Start the Deployment of the Application to the Target Systems
This view is used to start the deployment of the application to the target domain. The
administrator initiates this action as the installation and configuration activities were a
success. The administrator selects the action (start), the domain to deployment into
(verification), and the options to use during the deployment.
This view can also be used to restart or stop a deployment. The list of domains can vary
depending on the application configuration. The options selected influence the creation of
faults and the detail level of the logging. The simulate option can be used to test the
deployment without actually performing the deployment. This is useful to determine if
there is sufficient space on the target domain before actually attempting a deployment.
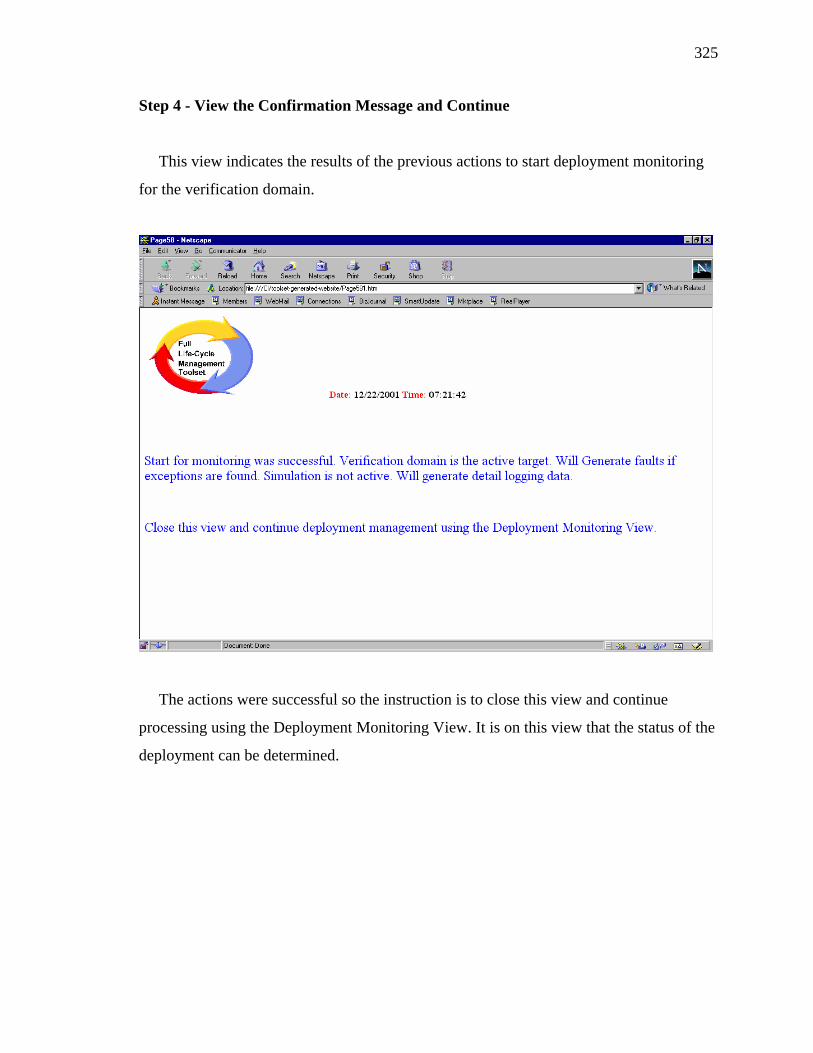
325
Step 4 - View the Confirmation Message and Continue
This view indicates the results of the previous actions to start deployment monitoring
for the verification domain.
The actions were successful so the instruction is to close this view and continue
processing using the Deployment Monitoring View. It is on this view that the status of the
deployment can be determined.

326
Step 5 - Monitor the Deployment to the Verification Domain
The frame on the right side of this Web page displays information about the
deployment of the HR Benefits application. The information indicates that the deployment
was unsuccessful. Specifically, there was a copy problem building the application on
server hrveras002.
This view also gives other important information including the name of the target
system (there can be a variety of different target systems like test or production) and
details on the last operation that was completed for the deployment.

327
Step 6 - View the Fault Generated During the Unsuccessful Deployment
The frame on the right side of this Web page displays information about the fault that
was generated during the deployment of the HR Benefits application.
The fault text is DIS SENG 0033 Error: Cannot create temporary file. The Tivoli
utility program that was being used to support the deployment of the application created
the message.

328
Step 7 - Examine the Detail Data for the Fault
The frame on the right side of this Web page displays detailed information about the
fault that was generated during the deployment of the HR Benefits application.
This Web page gives a long-term recommendation as well as a direct link to the Tivoli
book with more information and contact information for the development team in White
Plains.

329
Step 8 - Make the Required Updates Then Transfer Fault Data to the Problem-
Management System
The frame on the right side of this Web page is used to update information about the
fault and to transfer the data to the problem-management system.
The HR Benefits support person contacted the development team in White Plains and
they use SMIT to increase /TMP size. After that, he successfully restarted the deployment
and the roll out was successful. This Fault data is being transferred to Prod-US problem -
management system as a closed record.

330
Confirmation Web page
This Web page indicates that the fault data has been successfully transferred to the
problem-management system.
This is the end of Scenario 2. Please review the detailed views that follow and complete
the second survey. The detailed views are printed versions of the right-side frames of all
the views used in this scenario. The left-side frames are used only for navigation and
contain links to additional reports and views.
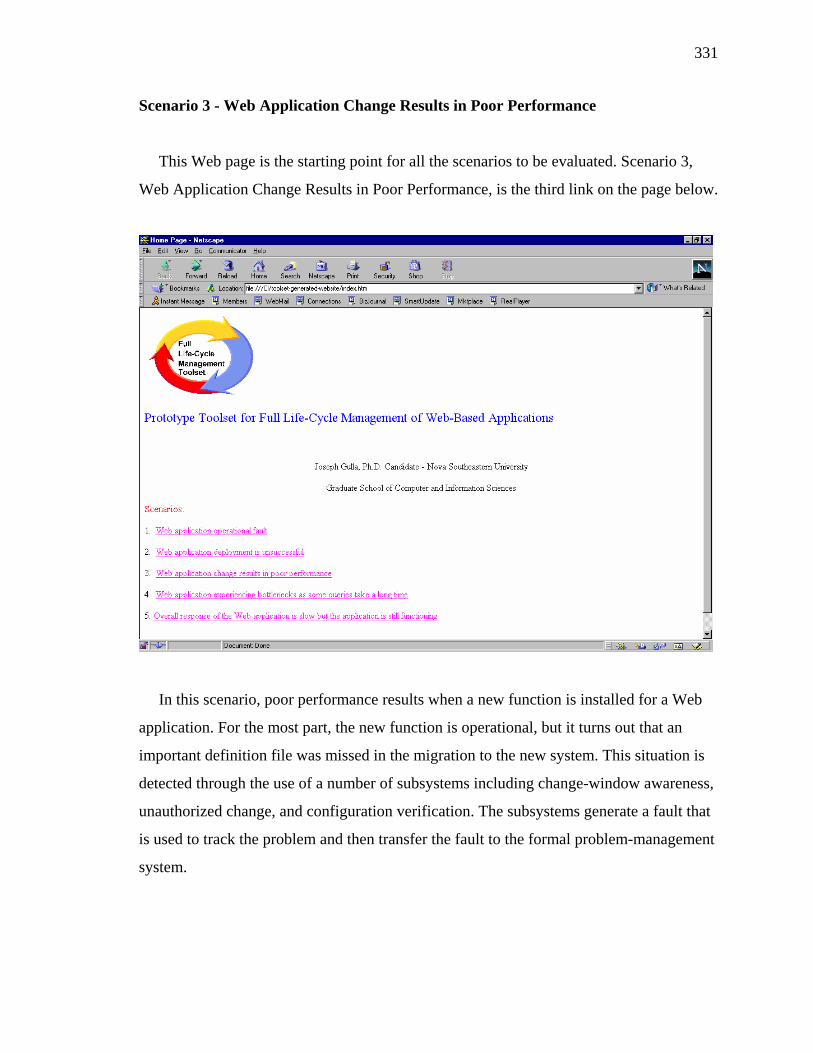
331
Scenario 3 - Web Application Change Results in Poor Performance
This Web page is the starting point for all the scenarios to be evaluated. Scenario 3,
Web Application Change Results in Poor Performance, is the third link on the page below.
In this scenario, poor performance results when a new function is installed for a Web
application. For the most part, the new function is operational, but it turns out that an
important definition file was missed in the migration to the new system. This situation is
detected through the use of a number of subsystems including change-window awareness,
unauthorized change, and configuration verification. The subsystems generate a fault that
is used to track the problem and then transfer the fault to the formal problem-management
system.

332
This Procedure Page Guides the Administrator's Actions
This page is taken from the toolset procedures. It guides the person handling the
problem through the steps to take to understand why the application is performing poorly
after a recent change.
This procedure outlines the main steps to follow to handle the problem with
performance. Since the problem happened after a recent change, the starting point for the
procedure is to check on the status of the last change window. Next, a check is made for
unauthorized changes. The configuration of the application is then checked to see if
something was missed during the change that may have caused a problem. When the
problem is found, the fault and detailed data views are used to better understand the
problem and transfer the fault to the problem-management system.

333
Step 1 - Check to See if There is an Active Window
The frame on the right side of this Web page contains information on the status of the
change windows for this application. This view indicates that there is no active window
and the previous window, which ended on 12/23/2001, completed normally.
The previous three windows and the next three planned change windows are shown.
Also shown are counts of faults that occurred during the windows and problem records
that were suppressed.
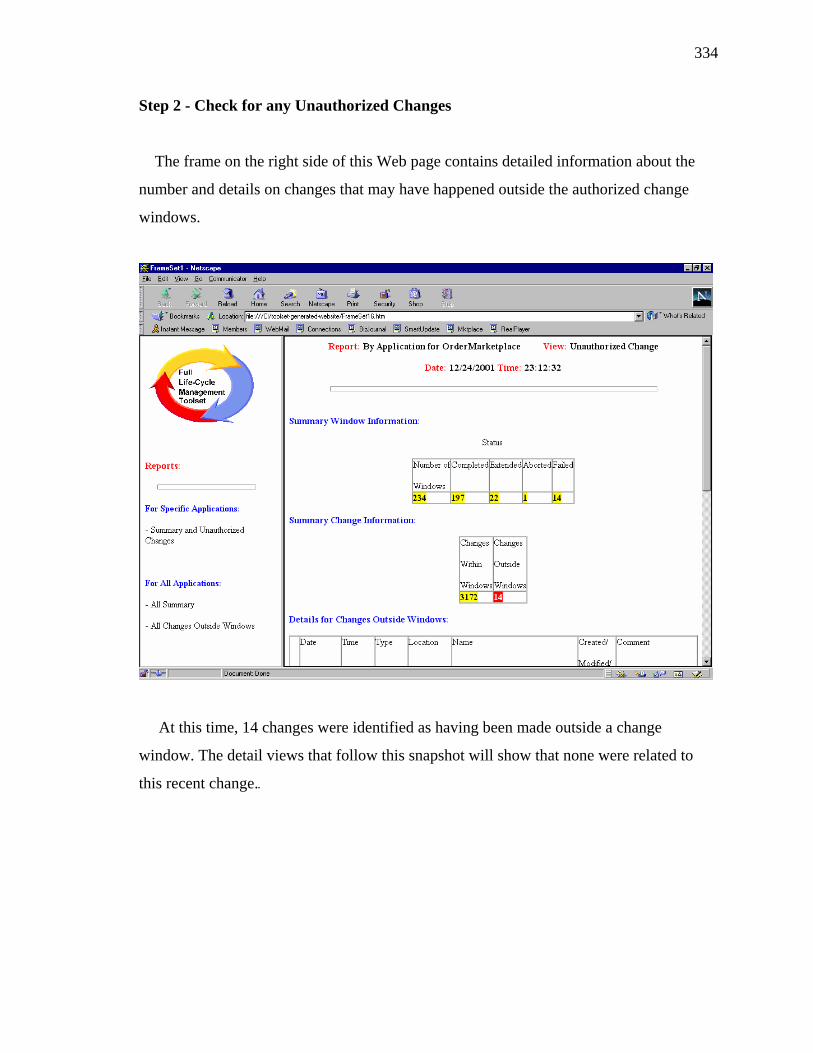
334
Step 2 - Check for any Unauthorized Changes
The frame on the right side of this Web page contains detailed information about the
number and details on changes that may have happened outside the authorized change
windows.
At this time, 14 changes were identified as having been made outside a change
window. The detail views that follow this snapshot will show that none were related to
this recent change.

335
Step 3 - Check for Configuration Differences/Mismatches
This view is used to check to see if the system having the performance problem is
significantly different that the other systems to which is it related. The comparison is done
using a comparison of test, verification, and production systems.
One difference, a file mismatch, is found. The mismatch is between verification and
production. Details regarding the difference are shown in the next view.

336
Step 4 - Examine the Configuration Verification Detail
The frame on the right side of this Web page displays information about the specific
error that was found during the configuration verification check.
It appears that the difference is in regards to an important file, the Weblogic properties
file. The ThreadCount parameter relates to the number of simultaneous operations
performed by the WebLogic server. This could be the cause of the performance problem.

337
Step 5 - View the Configuration Verification Fault
The frame on the right side of this Web page displays detailed information about the
fault that was generated during the configuration verification check that found that the
verification application domain did not match the production system.
This fault is used to gather the key information about the problems so that it can be
resolved on the spot or transferred to another team to investigate the cause of the problem
and fix it.

338
Step 6 - View the Detailed Data for the Configuration Verification Fault
The detailed data for this fault gives both a action to take as well as a long-term
recommendation.
The detailed data confirms the potential seriousness of the difference and gives
information on how to contact the development team in Boulder.
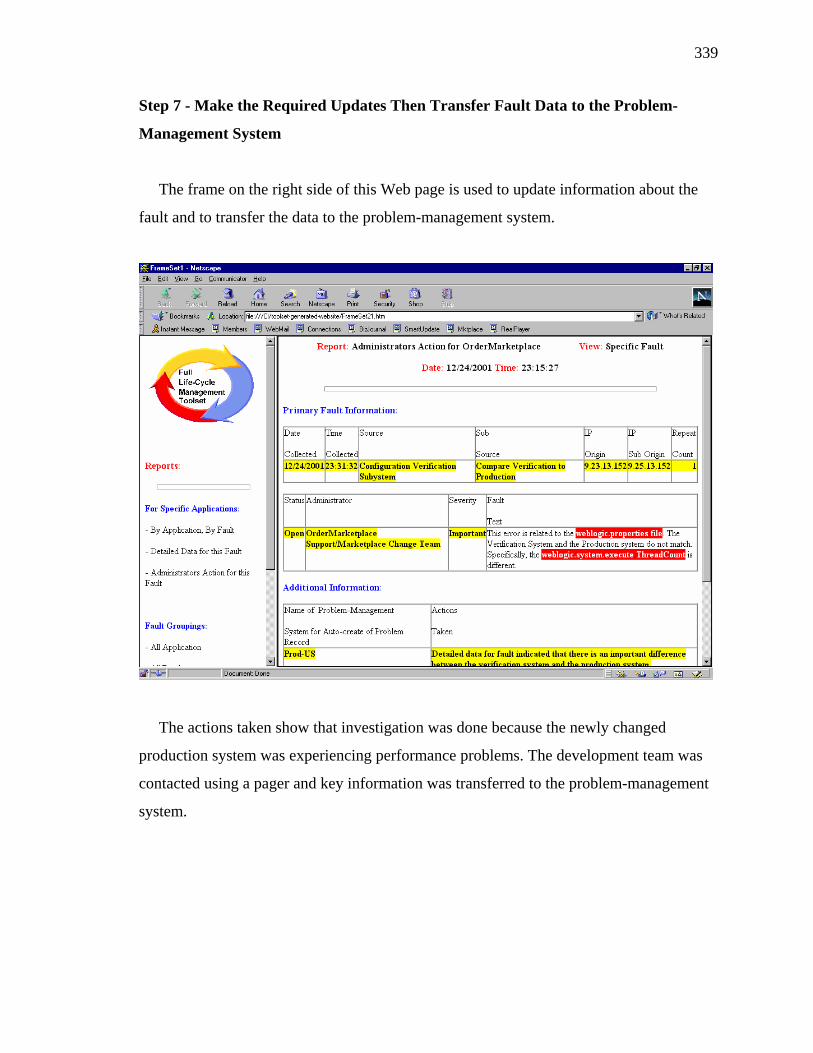
339
Step 7 - Make the Required Updates Then Transfer Fault Data to the Problem-
Management System
The frame on the right side of this Web page is used to update information about the
fault and to transfer the data to the problem-management system.
The actions taken show that investigation was done because the newly changed
production system was experiencing performance problems. The development team was
contacted using a pager and key information was transferred to the problem-management
system.

340
Confirmation Web page
This Web page indicates that the fault data has been successfully transferred to the
problem-management system.
This is the end of Scenario 3. Please review the detailed views that follow and complete
the third survey.
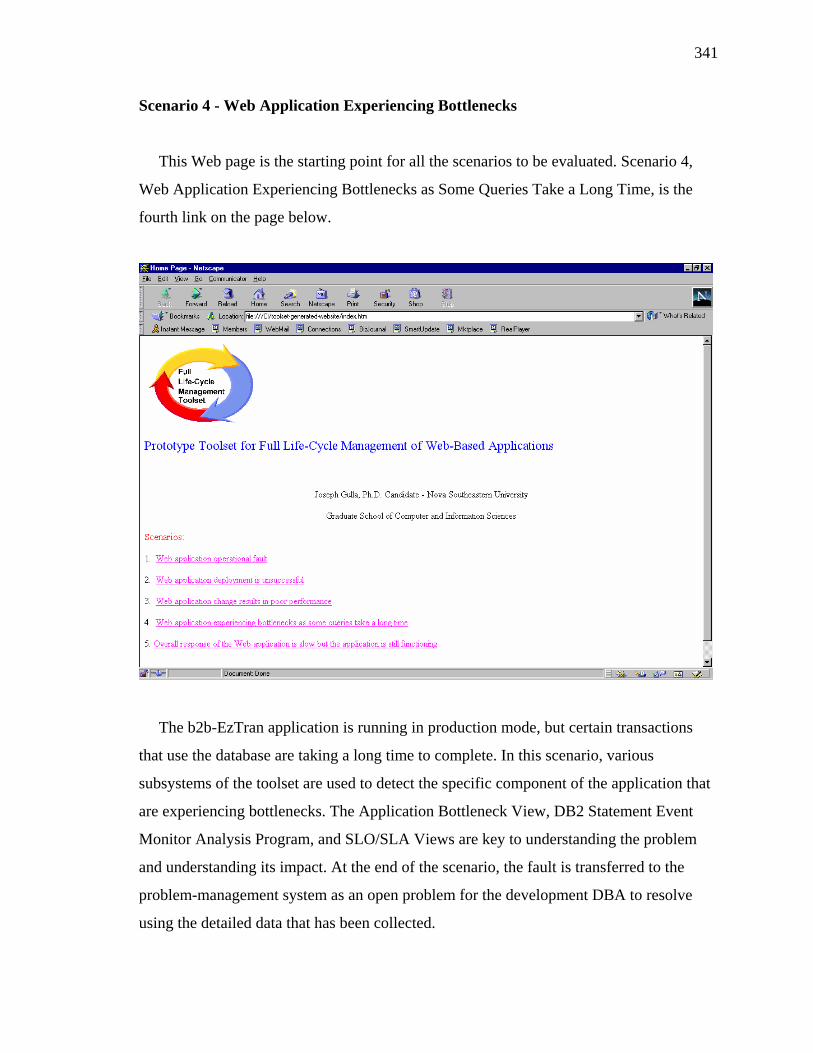
341
Scenario 4 - Web Application Experiencing Bottlenecks
This Web page is the starting point for all the scenarios to be evaluated. Scenario 4,
Web Application Experiencing Bottlenecks as Some Queries Take a Long Time, is the
fourth link on the page below.
The b2b-EzTran application is running in production mode, but certain transactions
that use the database are taking a long time to complete. In this scenario, various
subsystems of the toolset are used to detect the specific component of the application that
are experiencing bottlenecks. The Application Bottleneck View, DB2 Statement Event
Monitor Analysis Program, and SLO/SLA Views are key to understanding the problem
and understanding its impact. At the end of the scenario, the fault is transferred to the
problem-management system as an open problem for the development DBA to resolve
using the detailed data that has been collected.
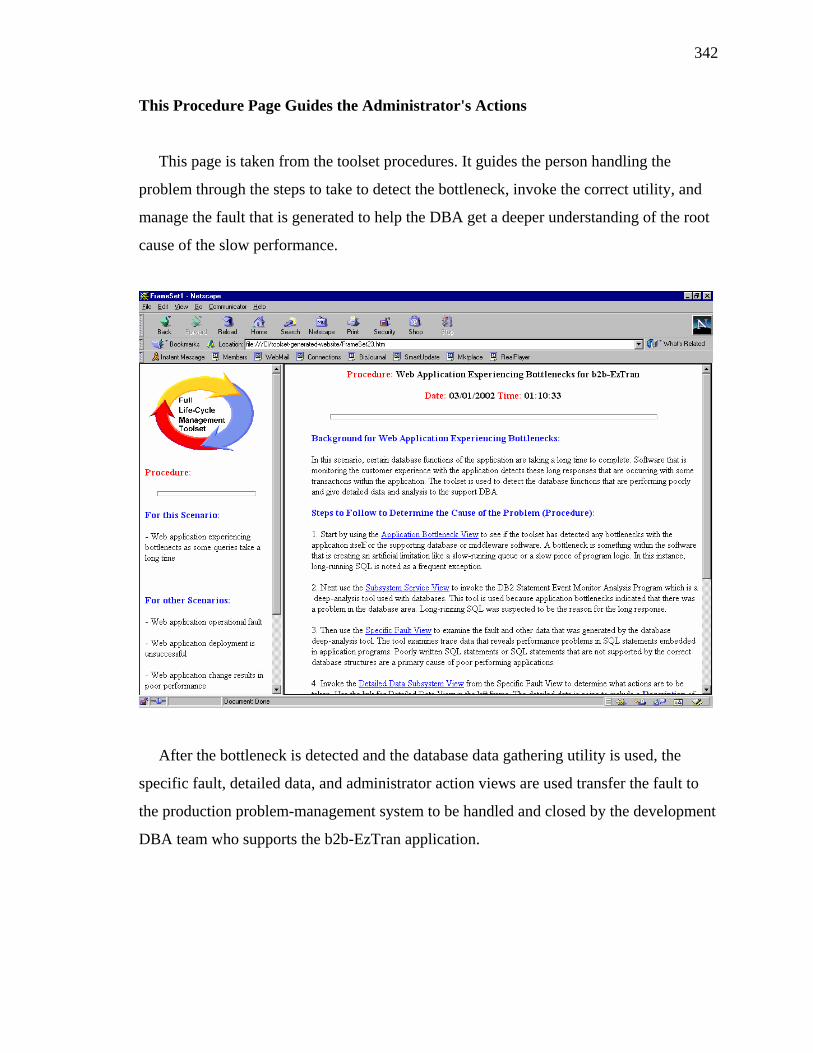
342
This Procedure Page Guides the Administrator's Actions
This page is taken from the toolset procedures. It guides the person handling the
problem through the steps to take to detect the bottleneck, invoke the correct utility, and
manage the fault that is generated to help the DBA get a deeper understanding of the root
cause of the slow performance.
After the bottleneck is detected and the database data gathering utility is used, the
specific fault, detailed data, and administrator action views are used transfer the fault to
the production problem-management system to be handled and closed by the development
DBA team who supports the b2b-EzTran application.

343
Step 1 - Look for a Bottleneck That is the Cause of the Slow Response
The frame on the right side of this Web page contains information on status of any
application bottlenecks. Bottlenecks are defined as being conditions involving the
application, database, or middleware that are keeping the application from processing
successfully.
Primary information is gathered about conditions like process hung, too many
processes, missing processes, long queue gets and puts, long SQL query, and long reads
and writes. This data is collected through sampling and monitoring techniques and
reported in the management repository. In this situation, monitoring has detected 231 long
SQL queries.

344
Step 2 - Use the Subsystem Service View to Create Data and Invoke the DB2
Statement Event Monitor Analysis Program
The frame on the right side of this Web page contains actions that can be selected to
start the DB2 Event Monitor Trace for a specific domain and then to start the utility with
options.
The key options pertain to generating faults if there is an error, reporting, performing
analysis, and logging of details that can be use for browsing. Logging facilitates a closer
examination of the details of a related series of exceptions.
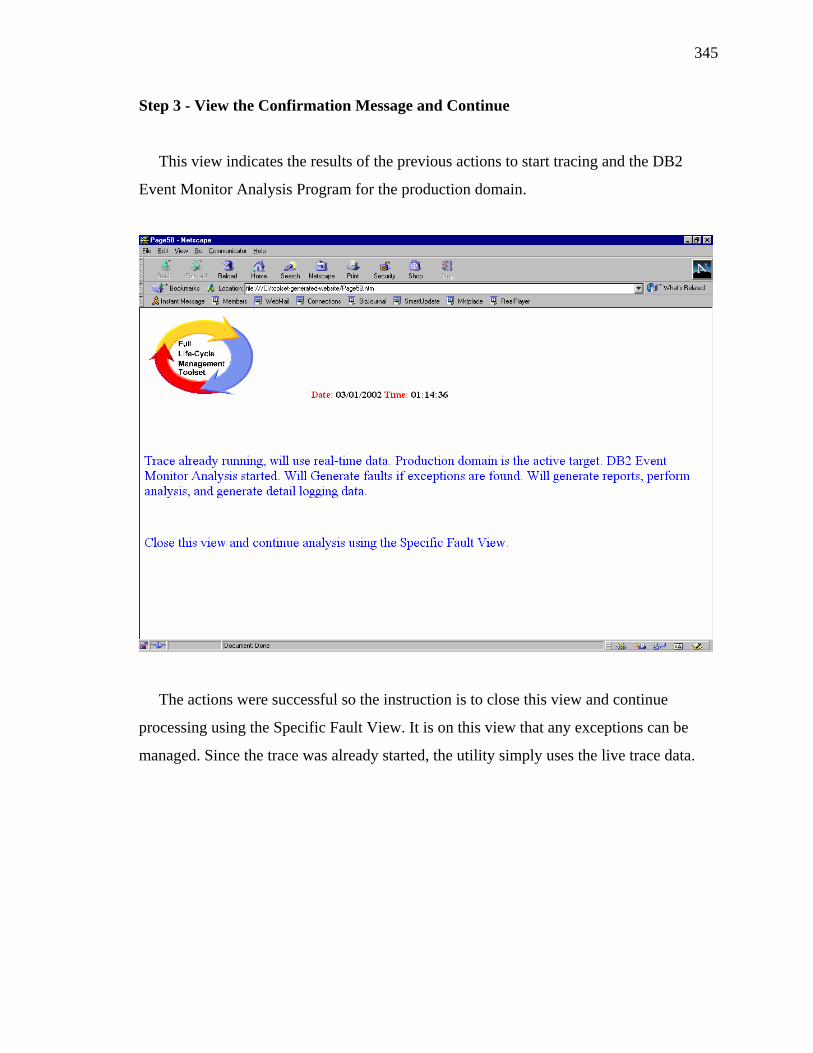
345
Step 3 - View the Confirmation Message and Continue
This view indicates the results of the previous actions to start tracing and the DB2
Event Monitor Analysis Program for the production domain.
The actions were successful so the instruction is to close this view and continue
processing using the Specific Fault View. It is on this view that any exceptions can be
managed. Since the trace was already started, the utility simply uses the live trace data.
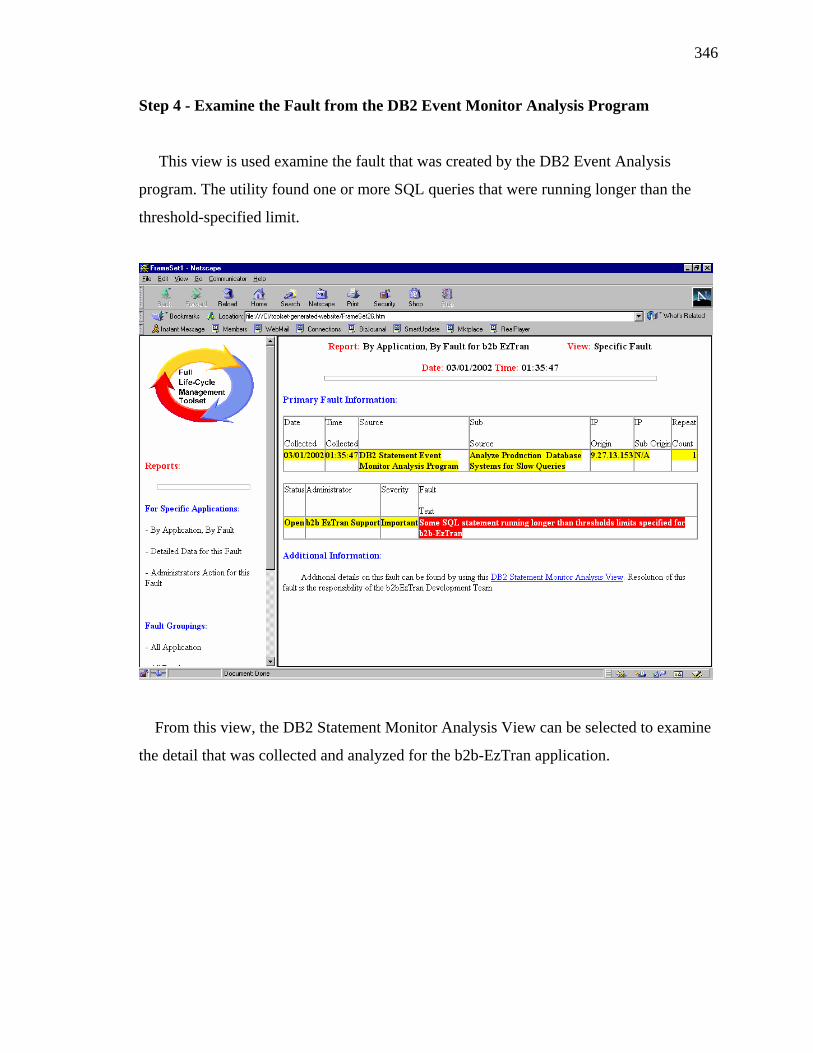
346
Step 4 - Examine the Fault from the DB2 Event Monitor Analysis Program
This view is used examine the fault that was created by the DB2 Event Analysis
program. The utility found one or more SQL queries that were running longer than the
threshold-specified limit.
From this view, the DB2 Statement Monitor Analysis View can be selected to examine
the detail that was collected and analyzed for the b2b-EzTran application.
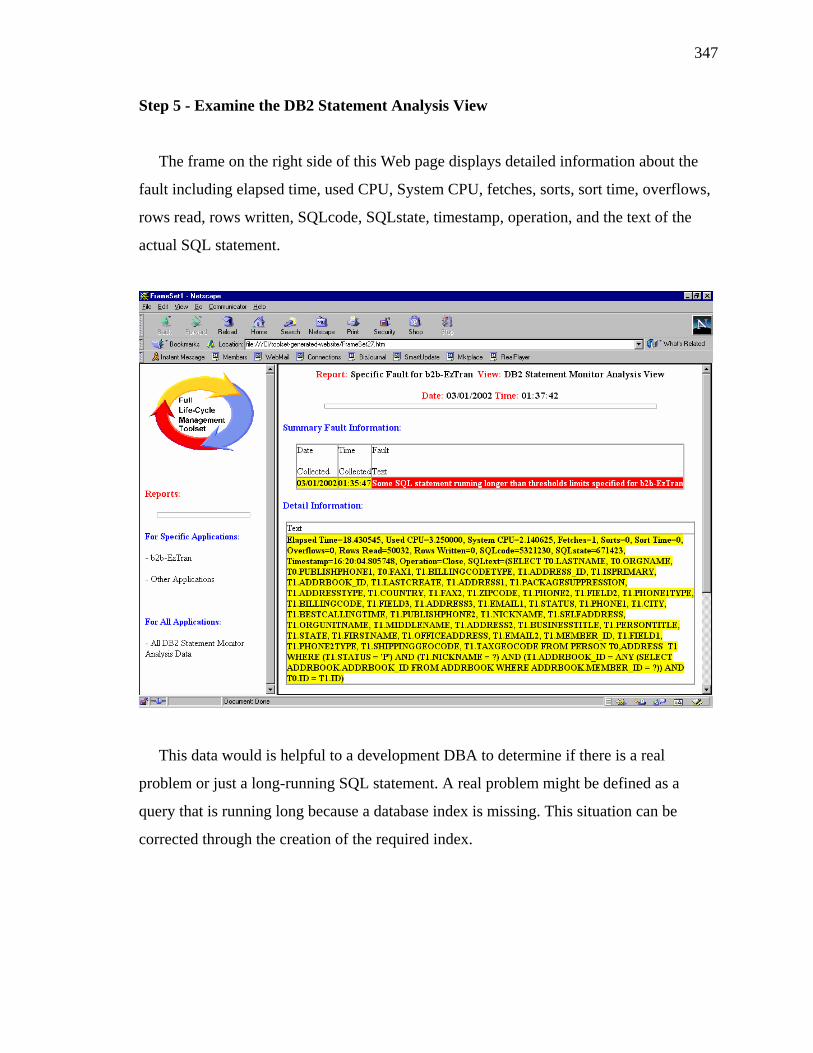
347
Step 5 - Examine the DB2 Statement Analysis View
The frame on the right side of this Web page displays detailed information about the
fault including elapsed time, used CPU, System CPU, fetches, sorts, sort time, overflows,
rows read, rows written, SQLcode, SQLstate, timestamp, operation, and the text of the
actual SQL statement.
This data would is helpful to a development DBA to determine if there is a real
problem or just a long-running SQL statement. A real problem might be defined as a
query that is running long because a database index is missing. This situation can be
corrected through the creation of the required index.

348
Step 6 - Examine the Detail Data for the Fault
The frame on the right side of this Web page displays detailed information about the
fault that was generated by the DB2 Statement Analysis utility.
This Web page gives information about the fault including a long-term
recommendation to continue sampling on a regular basis. This sampling can give
important perspective on the nature of the SQL statement that are used to access the
application database.

349
Step 7 - Examine the SLO/SLA Data for the Application
The frame on the right side of this Web page tells if whether the b2b-EzTran
application is a SLO or SLA application. The view states that the application is a SLO
application with a 95% goal.
The recent history shows 8 weeks of history as well as detail information on the
collections defined and the log records that are available for browsing.

350
Step 8 - Make the Required Updates Then Transfer Fault Data to the Problem-
Management System
The frame on the right side of this Web page is used to update information about the
fault and to transfer the data to the problem-management system.
The b2b-EzTran support person contacted the development team in Charlotte and they
will use the detailed data collected to handle the long SQL queries by changing the
database structure or working with the application developers to rework the SQL
statements so they perform better.

351
Confirmation Web page
This Web page indicates that the fault data has been successfully transferred to the
problem-management system.
This is the end of Scenario 4. Please review the detailed views that follow and complete
the second survey. The detailed views are printed versions of the right-side frames of all
the views used in this scenario. The left-side frames are used only for navigation and
contain links to additional reports and views.

352
Scenario 5 - Overall Response for the Application is Slow, but the Application is Still
Functional
This Web page is the starting point for all the scenarios to be evaluated. Scenario 5,
Overall Response for the Application is Slow, but the Application is Still Functional, is
the fifth link on the page below.
The Value Market Web application is performing slowly, but all components are
available. The toolset's deep availability capability is used to determine the root cause of
the overall poor performance. Deep View is used to take a comprehensive look at the
operational status of the application. Business Views are used to see what business system
the application is part of and what applications may be affected. Intimate performance was
used to examine both application-specific and proxy performance data.

353
This Procedure Page Guides the Administrator's Actions
This page is taken from the toolset procedures. It guides the person handling the
problem through the steps to take to detect the root cause of the performance problems
that are being experienced with the Value Market Application.
The scenario begins with a call to the Customer Care Center (CCC). The CCC
personnel are told that this performance problem has been going on for some time. They
have tried to get the development team to look into the problems and there has been no
progress so now that are asking for help from the CCC.
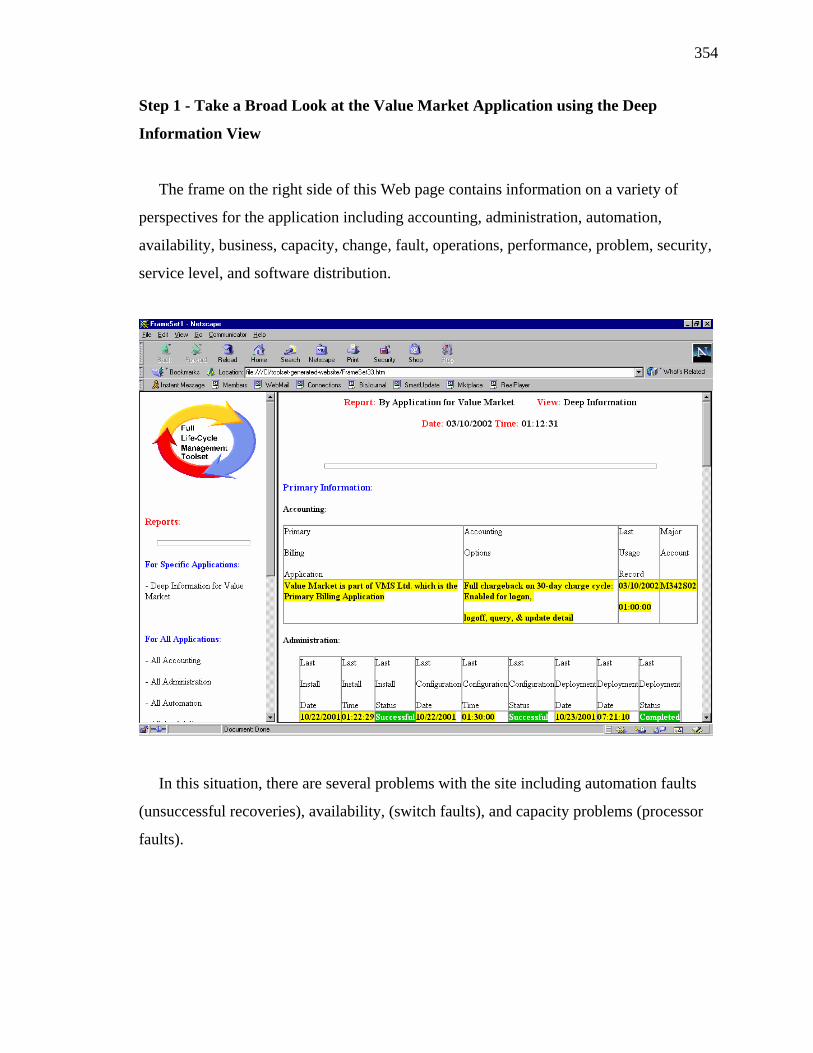
354
Step 1 - Take a Broad Look at the Value Market Application using the Deep
Information View
The frame on the right side of this Web page contains information on a variety of
perspectives for the application including accounting, administration, automation,
availability, business, capacity, change, fault, operations, performance, problem, security,
service level, and software distribution.
In this situation, there are several problems with the site including automation faults
(unsuccessful recoveries), availability, (switch faults), and capacity problems (processor
faults).

355
Step 2 - Use the Business View to Gather More Information on the Application's
Context
The frame on the right side of this Web page contains summary information about the
business systems with which Value Markets is associated. The parent view is VMS
Systems Limited that contains the status of hundreds of application, database, and
middleware resources.
The Value Markets business system contains 31application, 26 database, and 6
middleware resources. 20 application resources are in a degraded status. On the next page,
the details for the Value Markets logical view are displayed.
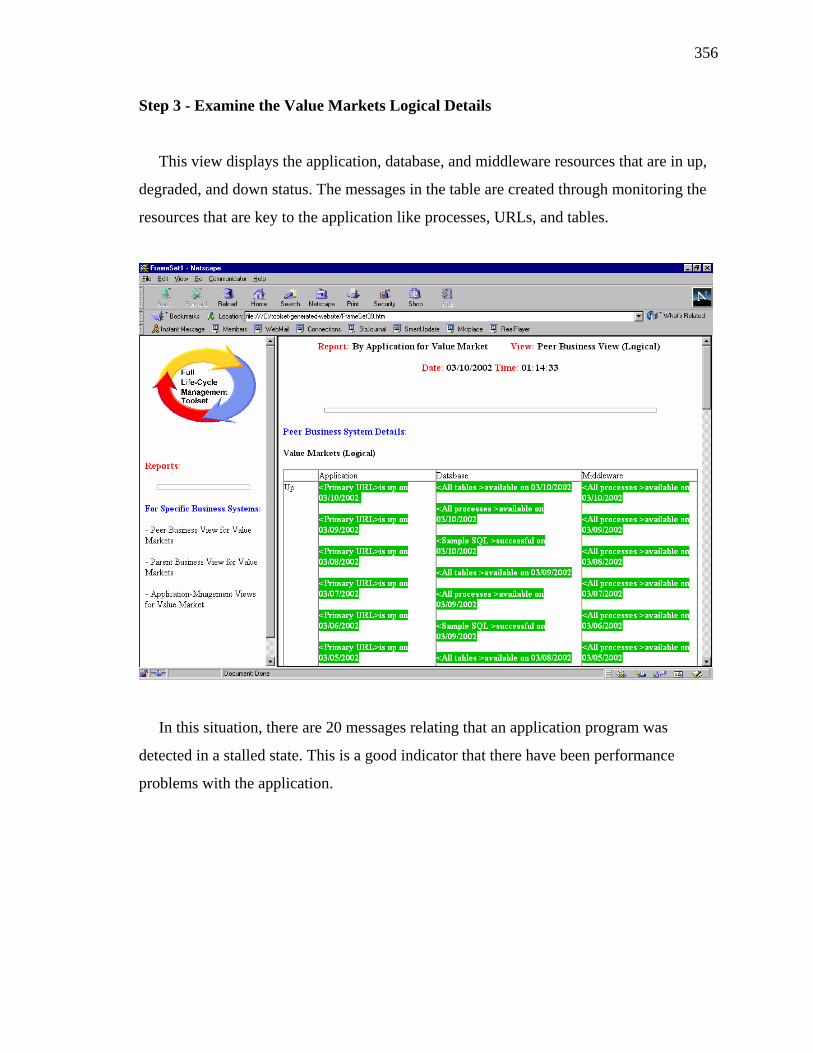
356
Step 3 - Examine the Value Markets Logical Details
This view displays the application, database, and middleware resources that are in up,
degraded, and down status. The messages in the table are created through monitoring the
resources that are key to the application like processes, URLs, and tables.
In this situation, there are 20 messages relating that an application program was
detected in a stalled state. This is a good indicator that there have been performance
problems with the application.

357
Step 4 - Examine the Intimate Performance Data
This view is used to examine the two kinds of performance data that is available for
applications--application specific and proxy. Application specific data comes directly
from an application that is instrumented to create its own performance data. Proxy data is
often created by a robot application that is a stand-in or substitute for the actual
application.
In this situation, there is only proxy data. The proxy data implies that some executions
of the BuyRobotDaily proxy transaction have been experiencing long response times.
This is a good indication that there are response-time problems with the application.

358
Step 5 - Examine the Fault
The frame on the right side of this Web page displays detailed information about the
fault including its source (Multiple Sources Impacting Performance) and Sub Source
(Failed Restarts, Switch Faults, and Processor Faults).
This data indicates that this is a complex problem. Independent of one another, these
problems are potentially serious to the application. These problems may also be related to
one another and may need to be resolved through careful analysis in order not to cause
even more serious problems with the application.

359
Step 6 - Examine the Detail Data for the Fault
The frame on the right side of this Web page displays detailed information about the
fault that was generated that includes information from multiple sources affecting the
performance of the application.
This Web page gives information about three different aspects of the fault that include
failed restarts, switch faults, and Processor faults. As these problems may be related they
should be investigated more fully and the root causes should be identified and resolved.
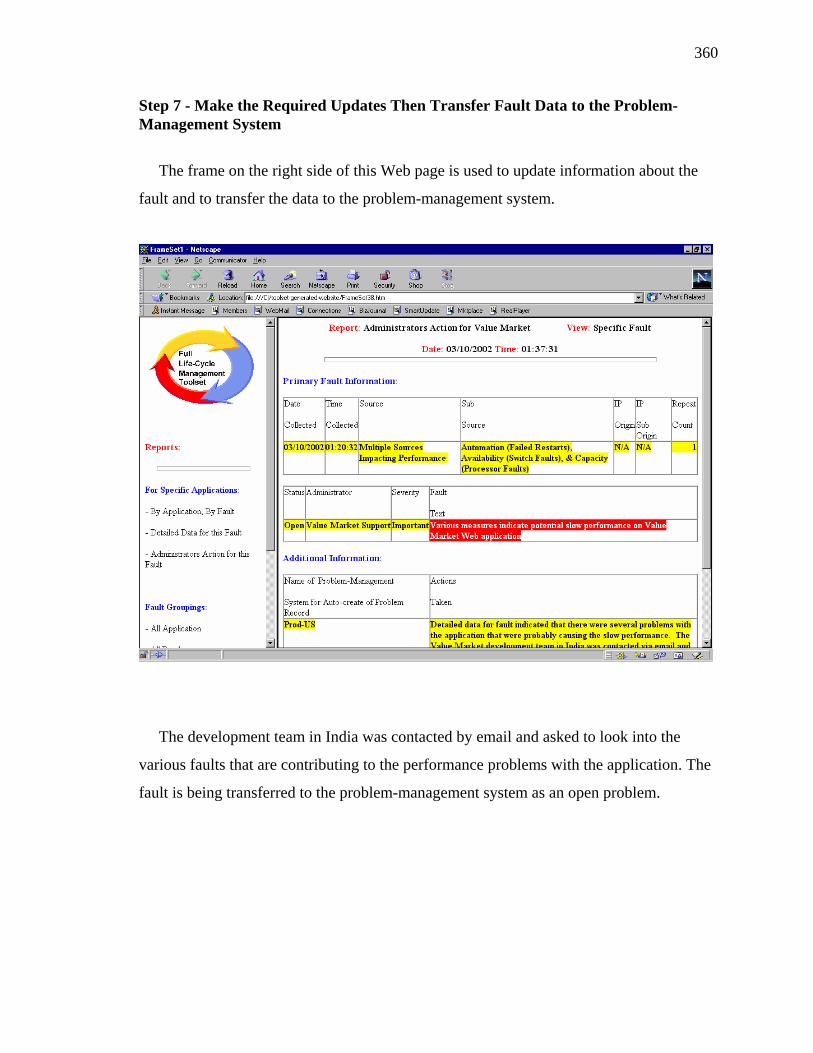
360
Step 7 - Make the Required Updates Then Transfer Fault Data to the Problem-Management System
The frame on the right side of this Web page is used to update information about the
fault and to transfer the data to the problem-management system.
The development team in India was contacted by email and asked to look into the
various faults that are contributing to the performance problems with the application. The
fault is being transferred to the problem-management system as an open problem.
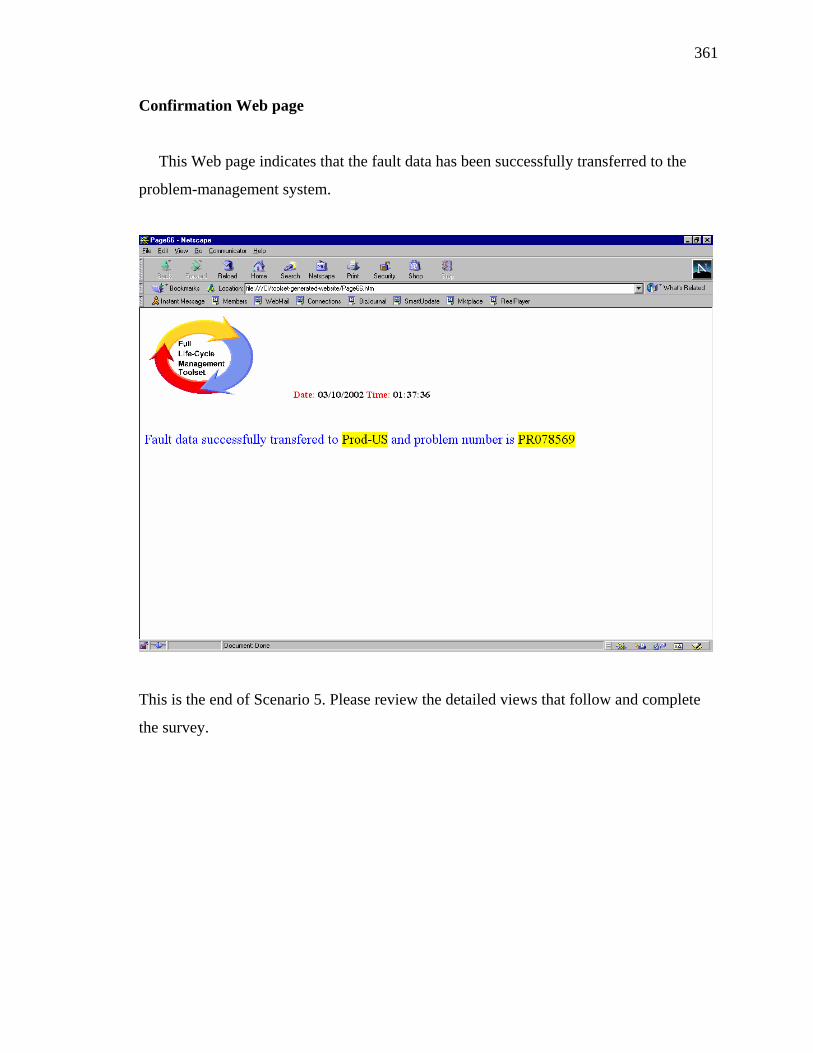
361
Confirmation Web page
This Web page indicates that the fault data has been successfully transferred to the
problem-management system.
This is the end of Scenario 5. Please review the detailed views that follow and complete
the survey.

362
Appendix F
Background and Brainstorming JAD Materials This appendix contains materials that were used in the first JAD session. This is the
first presentation page in the set of materials. This chart was used to launch the JAD
session. The session was used to share some background materials on the project and then
to brainstorm with the participants to get their best ideas.
_______________________________________________________________________
Design and Implementation of a
Prototype Toolset forFull Life-Cycle Management of Web-Based Applications
Background and BrainstormingJAD Materials
Figure 17. Cover page from the JAD kickoff presentation
_______________________________________________________________________

363
Agenda From the JAD Kickoff Presentation The agenda indicated that there were two major topic areas. The participants were
experienced with Web-application management however, the conventions of the project
needed to be explained and discussed.
________________________________________________________________________
The agenda includes a background topic which is needed so we can brainstorm the toolset components
1. Background2. Brainstorming
Figure 18. Agenda from the JAD kickoff presentation
________________________________________________________________________

364
Background From the JAD Kickoff Presentation This presentation page was used to indicate the beginning of the background
materials.
________________________________________________________________________
Background
Figure 19. Background from the JAD kickoff presentation
________________________________________________________________________

365
Design Background From the JAD Kickoff Presentation This page was used to share with the information with the participants about how the
design for the toolset was going to be managed during this phase. The basic approach was
JAD activities that leveraged technology like conference calls, email, and a document
database.
________________________________________________________________________
Design is an important first step for this project -- your ideas and input are key
Joint Application Design (JAD)Leverage technology
Conference callsDocumentation databaseElectronic collaboration via Notes
Figure 20. Design background from the JAD kickoff presentation
________________________________________________________________________

366
Implementation Background From the JAD Kickoff Presentation This page was used to share with the information with the participants about how the
implementation for the toolset was going to be handled. The basic approach was to create
working versions of the elements needed to support the toolset scenarios.
________________________________________________________________________
Implementation is limited to a prototype of working versions of toolset components
Rapid Application Design (RAD)Prototype
Working versions of most designed elements of the toolsetToolset elements include procedures, programs, views, scheme, and data/information
Figure 21. Implementation background from the JAD kickoff presentation
________________________________________________________________________

367
Toolset Information From the JAD Kickoff Presentation This page was used to explain to the participants how the toolset components work
together to solve the challenge of managing Web applications.
________________________________________________________________________
Schema
Views
Data
Procedures
Programs
Figure 22. Toolset information from the JAD kickoff presentation
________________________________________________________________________

368
Procedures Information From the JAD Kickoff Presentation This page was used to share information with the participants about the role of
procedures. The basic idea is that procedures are for humans to use in the management of
an application. Procedure can be automated by turning them into programs.
________________________________________________________________________
Manual procedures can be automated with programs and can then be used for manual fallback
Manual procedures -- used to direct human activityAutomatic procedures -- programs to perform manual function
Figure 23. Procedures information from the JAD kickoff presentation
________________________________________________________________________
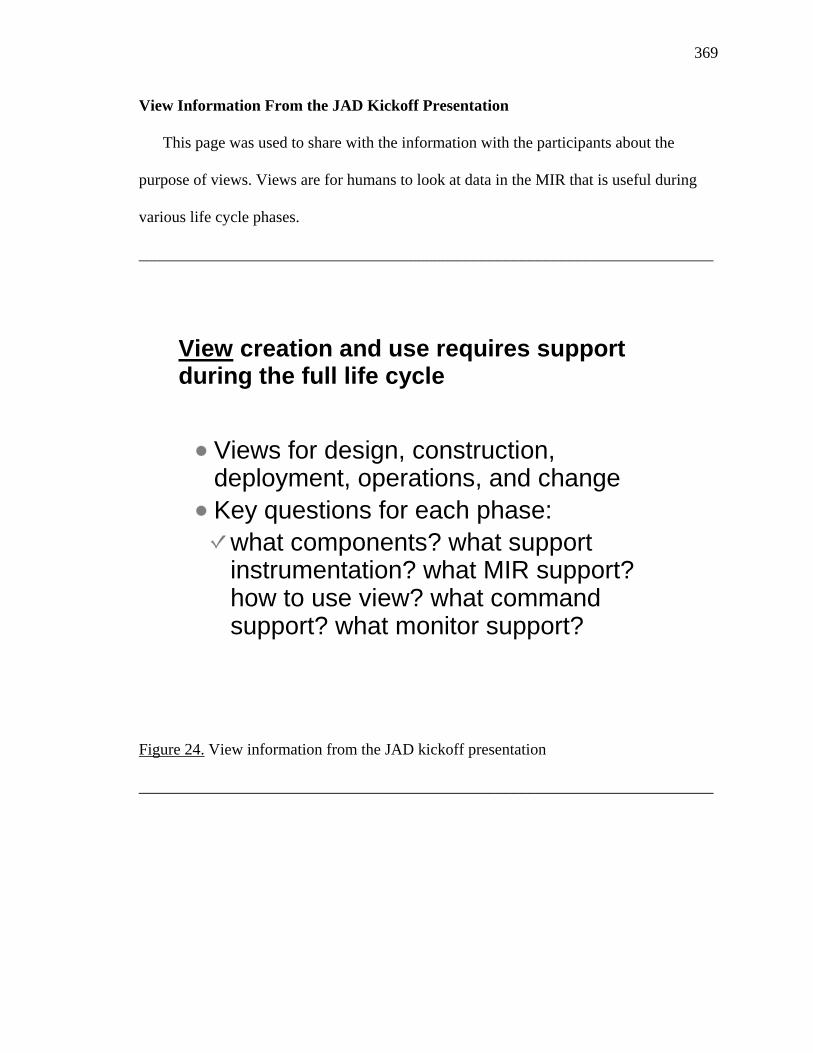
369
View Information From the JAD Kickoff Presentation This page was used to share with the information with the participants about the
purpose of views. Views are for humans to look at data in the MIR that is useful during
various life cycle phases.
________________________________________________________________________
View creation and use requires support during the full life cycle
Views for design, construction, deployment, operations, and changeKey questions for each phase:
what components? what support instrumentation? what MIR support? how to use view? what command support? what monitor support?
Figure 24. View information from the JAD kickoff presentation
________________________________________________________________________

370
Program Information From the JAD Kickoff Presentation This page was used to explain the role and importance of programs to the toolset.
________________________________________________________________________
Programs are an important part of the toolset and are used in every life-cycle phase
Life cycle examples:Design - script to load MIR with component information from design documents Construction - script to test Web application function exceptionsDeployment - script to distribute Web application Operation - script to monitor Web applicationChange - script to stop/start Web application components
Figure 25. Program information from the JAD kickoff presentation
________________________________________________________________________

371
MIR Information From the JAD Kickoff Presentation This page explains that the MIR is the heart of the management system.
________________________________________________________________________
Management Information Repository (MIR) is the heart of the Web application management system
Used during full Web application life cycleContains all life cycle work products:
Designs, procedures, programs, mapping of key software logs, summary information from key sources, application component information, exception messages, events, and alarms, ...
Figure 26. MIR information from the JAD kickoff presentation
________________________________________________________________________
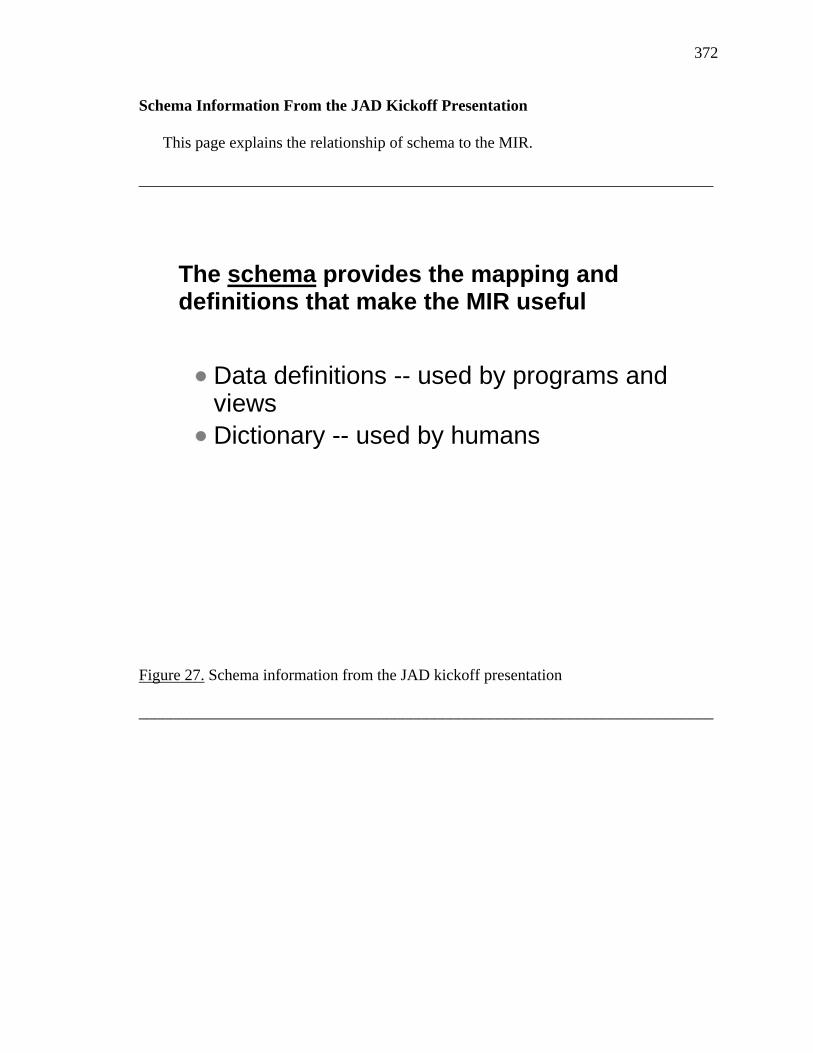
372
Schema Information From the JAD Kickoff Presentation This page explains the relationship of schema to the MIR.
________________________________________________________________________
The schema provides the mapping and definitions that make the MIR useful
Data definitions -- used by programs and viewsDictionary -- used by humans
Figure 27. Schema information from the JAD kickoff presentation
________________________________________________________________________

373
Data and Information for the MIR Concepts From the JAD Kickoff Presentation This page was used to explain that data and information will be stored in the MIR.
________________________________________________________________________
Both detail data and information will be stored in the MIR
Full life-cycle data and information will be stored for the Web applicationOperations-phase challenges will require transforming log data into summary information
Figure 28. Data and information for the MIR concepts from the JAD kickoff presentation
________________________________________________________________________
374
Brainstorm Page From the JAD Kickoff Presentation This presentation page was used to indicate the beginning of the brainstorming
materials.
________________________________________________________________________
Brainstorm
Figure 29. Brainstorm page from the JAD kickoff presentation
________________________________________________________________________
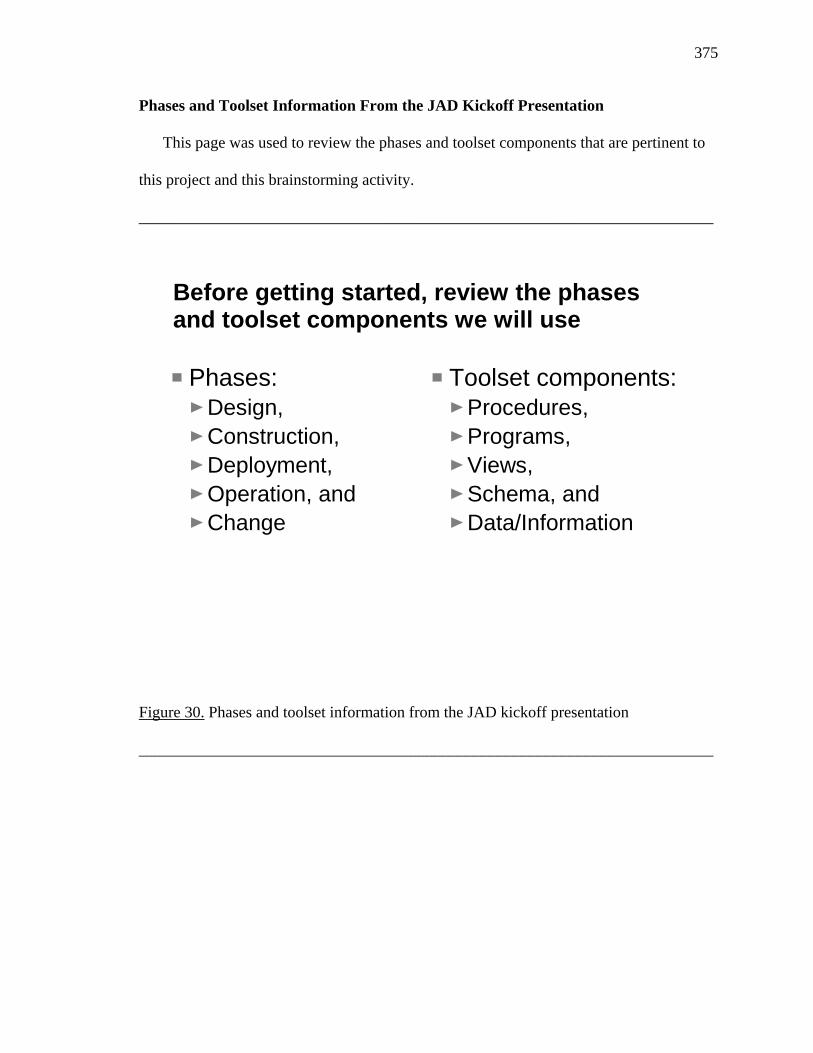
375
Phases and Toolset Information From the JAD Kickoff Presentation This page was used to review the phases and toolset components that are pertinent to
this project and this brainstorming activity.
________________________________________________________________________
Before getting started, review the phases and toolset components we will use
Phases:Design,Construction,Deployment,Operation, andChange
Toolset components:Procedures,Programs,Views,Schema, andData/Information
Figure 30. Phases and toolset information from the JAD kickoff presentation
________________________________________________________________________
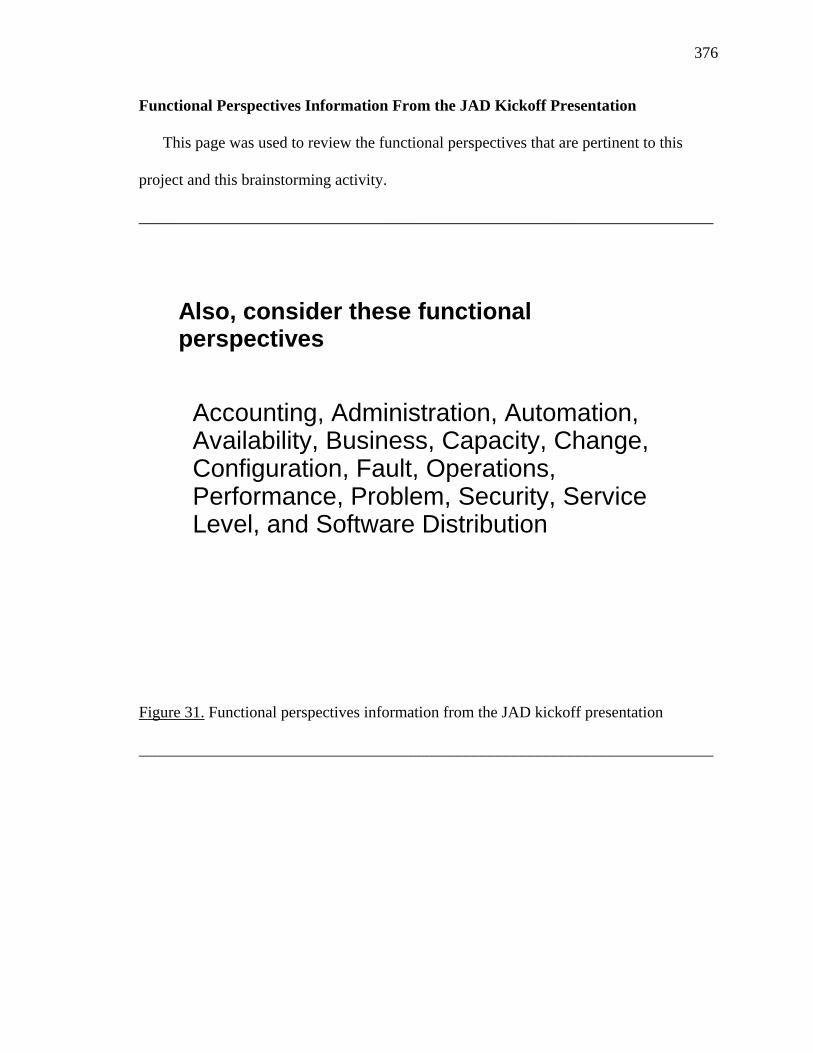
376
Functional Perspectives Information From the JAD Kickoff Presentation This page was used to review the functional perspectives that are pertinent to this
project and this brainstorming activity.
________________________________________________________________________
Also, consider these functional perspectives
Accounting, Administration, Automation, Availability, Business, Capacity, Change, Configuration, Fault, Operations, Performance, Problem, Security, Service Level, and Software Distribution
Figure 31. Functional perspectives information from the JAD kickoff presentation
________________________________________________________________________

377
Design Brainstorming Template From the JAD Kickoff Presentation This page was used to support the brainstorming activity for design-phase toolset
components.
________________________________________________________________________
Design brainstorming template
Name (Perspective) FunctionProcedure
Program Script to load MIR with component information from design documents (3,4,9)
View
Schema mapping and dictionary for component information from design
documents (3,4,9)
Data/Information
Perspectives: (1)Accounting, (2)Administration, (3)Automation, (4)Availability, (5)Business, (6)Capacity, (7)Change, (8)Configuration,(9)Fault, (10)Operations, (11)Performance, (12)Problem, (13)Security, (14)Service Level, and (15) Software Distribution
Figure 32. Design brainstorming template from the JAD kickoff presentation
________________________________________________________________________

378
Construction Brainstorming Template From the JAD Kickoff Presentation This page was used to support the brainstorming activity for construction-phase
toolset components.
________________________________________________________________________
Construction brainstorming template
Name (Perspective) FunctionProcedure
Program
View
Schema
Data/Information
Perspectives: (1)Accounting, (2)Administration, (3)Automation, (4)Availability, (5)Business, (6)Capacity, (7)Change, (8)Configuration,(9)Fault, (10)Operations, (11)Performance, (12)Problem, (13)Security, (14)Service Level, and (15) Software Distribution
Figure 33. Construction brainstorming template from the JAD kickoff presentation
________________________________________________________________________

379
Deployment Brainstorming Template From the JAD Kickoff Presentation This page was used to support the brainstorming activity for deployment-phase toolset
components.
________________________________________________________________________
Deployment brainstorming template
Name (Perspective) FunctionProcedure
Program
View
Schema
Data/Information
Perspectives: (1)Accounting, (2)Administration, (3)Automation, (4)Availability, (5)Business, (6)Capacity, (7)Change, (8)Configuration,(9)Fault, (10)Operations, (11)Performance, (12)Problem, (13)Security, (14)Service Level, and (15) Software Distribution
Figure 34. Deployment brainstorming template from the JAD kickoff presentation
________________________________________________________________________

380
Operations Brainstorming Template From the JAD Kickoff Presentation This page was used to support the brainstorming activity for operation-phase toolset
components.
________________________________________________________________________
Operation brainstorming template
Name (Perspective) FunctionProcedure
Program
View
Schema
Data/Information
Perspectives: (1)Accounting, (2)Administration, (3)Automation, (4)Availability, (5)Business, (6)Capacity, (7)Change, (8)Configuration,(9)Fault, (10)Operations, (11)Performance, (12)Problem, (13)Security, (14)Service Level, and (15) Software Distribution
Figure 35. Operations brainstorming template from the JAD kickoff presentation
________________________________________________________________________
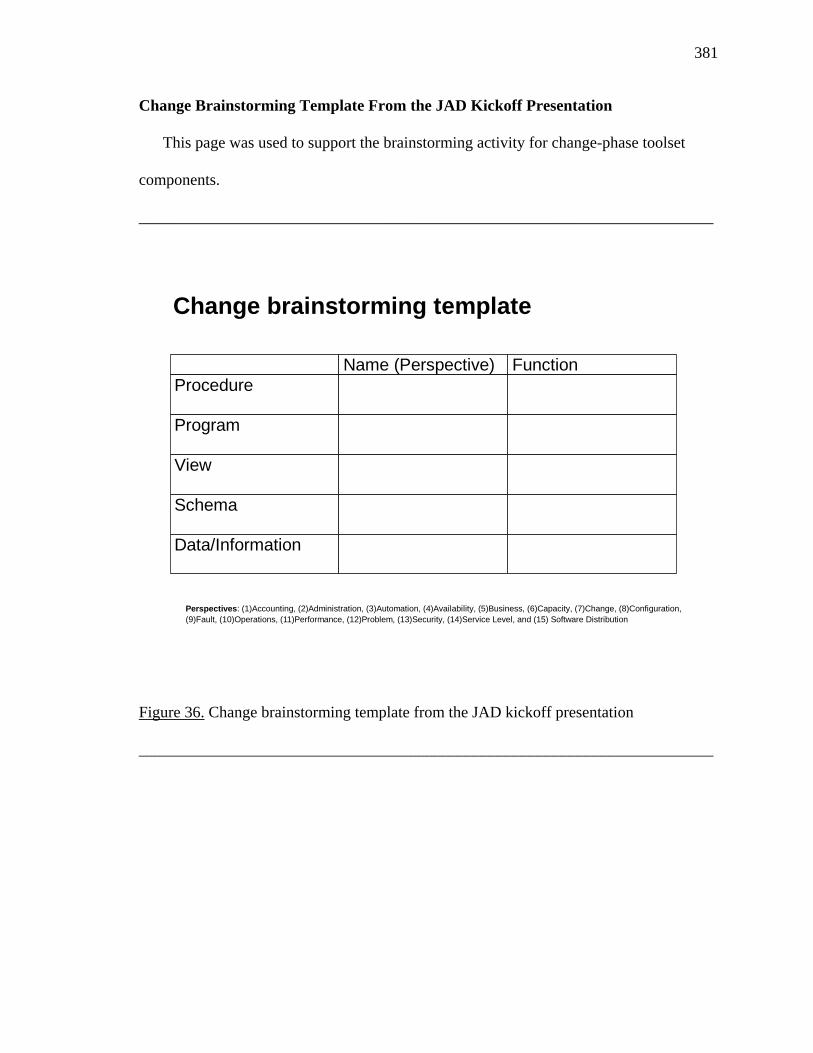
381
Change Brainstorming Template From the JAD Kickoff Presentation This page was used to support the brainstorming activity for change-phase toolset
components.
________________________________________________________________________
Change brainstorming template
Name (Perspective) FunctionProcedure
Program
View
Schema
Data/Information
Perspectives: (1)Accounting, (2)Administration, (3)Automation, (4)Availability, (5)Business, (6)Capacity, (7)Change, (8)Configuration,(9)Fault, (10)Operations, (11)Performance, (12)Problem, (13)Security, (14)Service Level, and (15) Software Distribution
Figure 36. Change brainstorming template from the JAD kickoff presentation
________________________________________________________________________

382
Next Steps From the JAD Kickoff Presentation
This page was used to explain the next steps for the JAD activities.
________________________________________________________________________
Here are the next steps
Document session, post in documentation database, distribute for:
Correctness, clarity, and detailMore ideas are welcome!
Follow up session in 2 weeks
Figure 37. Next steps from the JAD kickoff presentation
________________________________________________________________________

383
Appendix G
Comment Sheet Details for Full Life-Cycle Toolset This appendix contains the comments from the survey participants. The survey
participants in response to three open ended questions wrote the comments. These three
questions appeared on a page after the five sets of survey questions for the toolset
scenarios. The questions and the comments from the survey participants are included
below.
Question 1 - What were the strengths of the toolset as implemented in these scenarios? Survey Participant 1 Makes problem determination easier since data required to debug is available without making additional runs to capture the data. Survey Participant 2 Provided a great deal of detail on problems and pulled in information from numerous sources. Survey Participant 3 Easier to understand and use, documents faults to production problem system. Survey Participant 4 Significant amount of analysis data collected and available-simplifies the effort needed to correlate cause and effect-leads the technician in a methodical way to evaluate the situation. Survey Participant 5 Walks you through the repair or possible resolutions. Gets very detailed. Covers most of the common Web application issues.

384
Survey Participant 6 Tremendous amount of information on system and application components. Built in analysis capability and detailed recommendation for immediate and long term actions very helpful for persons when understand the application or OS environment. Survey Participant 7 Having the procedure page initially to guide the support personnel through the toolset is very helpful. Being able to get at different statuses and records from disparate sources and bringing them all together, accessible from one common toolset, is very beneficial. Tying in detailed error message descriptions (like the DB2 message explanations) and presenting them via the toolset (so the support people don’t have to go off to other manuals) is useful. I like the concept of having some of the “problem determination assistance” views (like Check for Configuration Differences/Mismatches) generating faults that can then be investigated further using the mainline processing views (Specific Fault and Detailed Data). Survey Participant 8 Relatively intuitive, common look and feel. Easy to use help desk personnel to do preliminary problem determination. A good job of compiling all of this data into one place! Survey Participant 9 No comments. Survey Participant 10 Easy to navigate from start to closure. Consistency among scenarios. Survey Participant 11 Very sophisticated and comprehensive. Usability levels were appropriate for the intended audience. Survey Participant 12 The idea that the tools and problem management can be connected automatically. As well as the integration of the log information. Survey Participant 13 No comments.
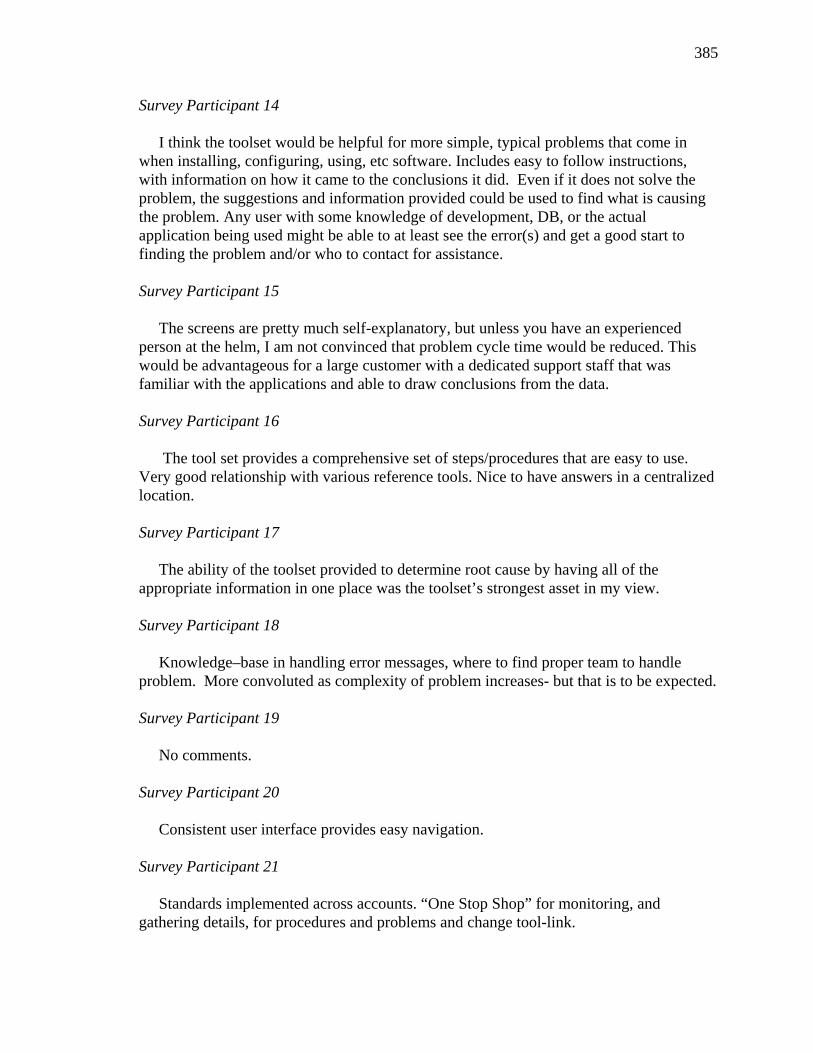
385
Survey Participant 14 I think the toolset would be helpful for more simple, typical problems that come in when installing, configuring, using, etc software. Includes easy to follow instructions, with information on how it came to the conclusions it did. Even if it does not solve the problem, the suggestions and information provided could be used to find what is causing the problem. Any user with some knowledge of development, DB, or the actual application being used might be able to at least see the error(s) and get a good start to finding the problem and/or who to contact for assistance. Survey Participant 15 The screens are pretty much self-explanatory, but unless you have an experienced person at the helm, I am not convinced that problem cycle time would be reduced. This would be advantageous for a large customer with a dedicated support staff that was familiar with the applications and able to draw conclusions from the data. Survey Participant 16 The tool set provides a comprehensive set of steps/procedures that are easy to use. Very good relationship with various reference tools. Nice to have answers in a centralized location. Survey Participant 17 The ability of the toolset provided to determine root cause by having all of the appropriate information in one place was the toolset’s strongest asset in my view. Survey Participant 18 Knowledge–base in handling error messages, where to find proper team to handle problem. More convoluted as complexity of problem increases- but that is to be expected. Survey Participant 19 No comments. Survey Participant 20 Consistent user interface provides easy navigation. Survey Participant 21 Standards implemented across accounts. “One Stop Shop” for monitoring, and gathering details, for procedures and problems and change tool-link.

386
Survey Participant 22 Comprehensive and thorough. I thought the scenarios were well thought out and represented what would actually happen in reality. The amount of information and the user interface is consistent and easily understood. The design also flowed in a logical pattern. Survey Participant 23 No comments. Survey Participant 24 Comprehensive and easy to understand and flowing user interface. Survey Participant 25 The toolset is user friendly, easy to navigate and does not require technical expertise. Survey Participant 26 Documentation to support operations-detailed. Identification of the application, sub-component and failing component clearly. Integrated information on application, infrastructure and human resources Survey Participant 27 The strengths included easy to follow instructions, quick “at a glance” summaries, as well as detail when the administrator or end user needs to see them. Also, sophisticated features such as long term recommendations, actions to take, as well as integration with problem management system. Survey Participant 28 The step by step approach was very good. The steps were clearly delineated. Survey Participant 29 Logical approach to analyzing data extracted by toolset allowing for quicker reaction and recovery. Will be a very good toolset to more proactively detect problems that plague Web hosted applications. Survey Participant 30 No comments.

387
Survey Participant 31 No comments. Survey Participant 32 It is robust, and organized well to allow for ease of use. It is effective, and employs problem determination techniques that allow for systematic resolution. It adds value to the business by connecting an administrator to other appropriate teams via links; this yields interdependence and team work. Survey Participant 33 The strengths of the toolset as the inherent benefits of an integrated system that covers the aspects of a full-life cycle enterprise. If used correctly the tool would be good for keeping track of the status of a problem through resolution. What were the weaknesses of the toolset as implemented in these scenarios? Survey Participant 1 I was unclear how the information being displayed was gathered. Survey Participant 2 Maintenance of information sources would be high. For instance, updating the SLO information. Survey Participant 3 There may be to much information for the user to digest. Survey Participant 4 Appears that a tremendous amount of customization will be needed to make the toolset functions work for each application environment. Also the tools seem to have the capability of identifying defects and in a pro-active fashion. Example is last scenario- tool identifies high number of switch faults only when queried as a result of customer complaint, then suggests possible speed mismatch. Why not have tool either a. evaluate and report on mismatches or b. generate a fault whenever high number of switch errors are detected (before customer
has to complains)?

388
Survey Participant 5 My only complaint is format is busy. In some cases, I just want to see the root of the problem bullet pointed, and drill down to the solution. I would like to see an external system connectivity breakage scenario. Survey Participant 6 Quantity of information can be overwhelming. In some situations it appeared as though information would have been prioritized better (i.e. SLA/SLO info.) Survey Participant 7 I found the different views that are not common between all the scenarios somewhat difficult to understand/follow (i.e. the views other than Procedure Page, Specific Fault, Detailed Data and Administrator Action). This might just be my lack of understanding of the overall architecture and what all the components/views are that make up the toolset. Having the procedure page definitely overcomes this weakness and points out when it is necessary or desirable to go to a view that is not one of the mainline views. Some of the scenarios seem like they should have been triggered via automation instead of “a call to the help desk.” For example, in Scenario 5, if there were multiple faults generated, a monitoring threshold should probably have been exceeded somewhere indicating a problem much earlier than having to have someone call the help desk and complain of a performance problem. Not understanding fully the methodology of how these views and procedures are created, I guess its possible that after someone discovers this data and “pattern” of problems, in addition to looking into the problems themselves, someone puts in automation and/or monitors to watch for those conditions automatically going forward. I think it would be useful to “run” certain of the views on a regular basis via automation. For example, the Check for Configuration Differences/Mismatches view should probably be run every day or every few days to try to catch those unauthorized configuration changes before they are a problem in the system. Survey Participant 8 Some highly detailed screens were hard to understand. Survey Participant 9 No comments.

389
Survey Participant 10 None that I saw. Survey Participant 11 Scenario 5- Perhaps more analysis info would be helpful for the development team. Survey Participant 12 I am concerned that the alerts in the first example will get to the administration before the record is recorded. The usability needs vast improvement, layout is not well throughout (tables and rows). Requiring a close to continue is not usable. Logs can get rather large, concerned that will have a negative impact in the real world. Survey Participant 13 No comments. Survey Participant 14 Why is calling necessary? Why doesn't the tool open a problem ticket with the appropriate group and give the phone number to follow-up if necessary? Difficult issues like performance issues typically are very difficult to find, and they are not usually one problem. In these examples, only one resolution is given for each problem. Is it possible for the tool to give multiple possible resolutions? Survey Participant 15 Scenario 1- The actual SQL statement isn’t displayed- that would be of value. The fault should initiate a problem ticket as soon as the fault is detected. That doesn’t appear to be the case. Scenario 2- Why not have the tool check space prior to installing the application? Scenario 4- Limit who can start the event monitor- should be a DBA. Survey Participant 16 May be difficult to update tool set based upon new software/new documentation. Survey
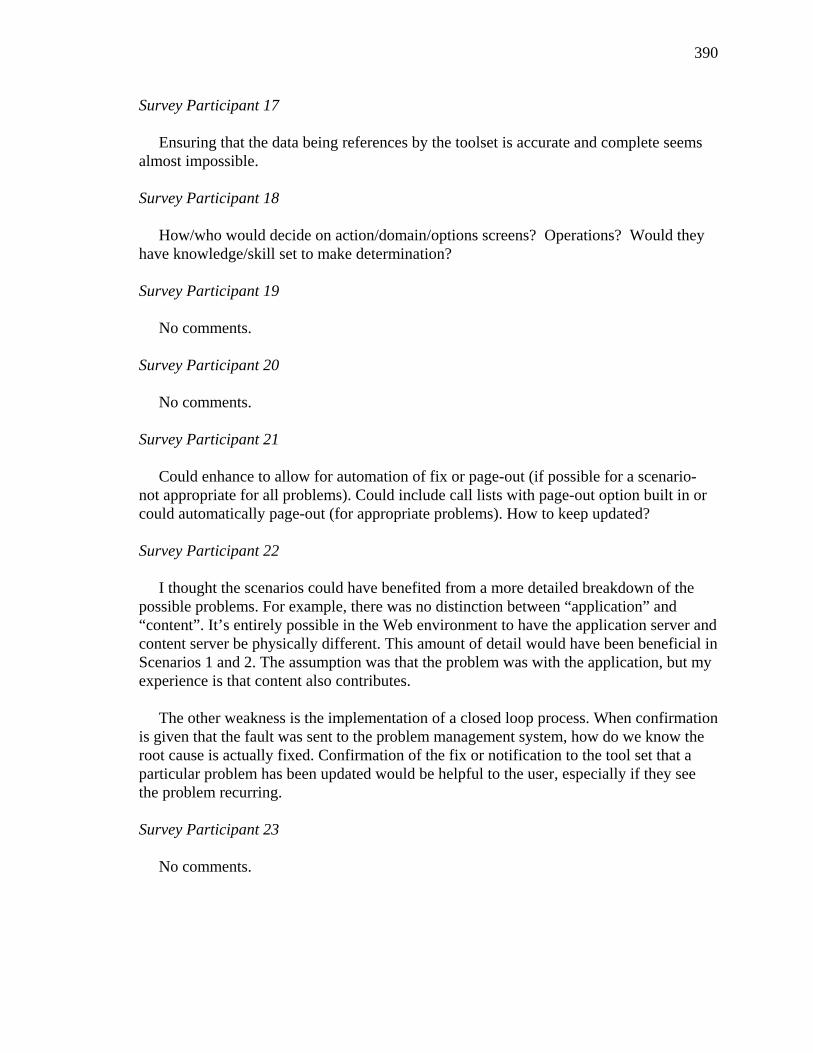
390
Survey Participant 17 Ensuring that the data being references by the toolset is accurate and complete seems almost impossible. Survey Participant 18 How/who would decide on action/domain/options screens? Operations? Would they have knowledge/skill set to make determination? Survey Participant 19 No comments. Survey Participant 20 No comments. Survey Participant 21 Could enhance to allow for automation of fix or page-out (if possible for a scenario- not appropriate for all problems). Could include call lists with page-out option built in or could automatically page-out (for appropriate problems). How to keep updated? Survey Participant 22 I thought the scenarios could have benefited from a more detailed breakdown of the possible problems. For example, there was no distinction between “application” and “content”. It’s entirely possible in the Web environment to have the application server and content server be physically different. This amount of detail would have been beneficial in Scenarios 1 and 2. The assumption was that the problem was with the application, but my experience is that content also contributes. The other weakness is the implementation of a closed loop process. When confirmation is given that the fault was sent to the problem management system, how do we know the root cause is actually fixed. Confirmation of the fix or notification to the tool set that a particular problem has been updated would be helpful to the user, especially if they see the problem recurring. Survey Participant 23 No comments.
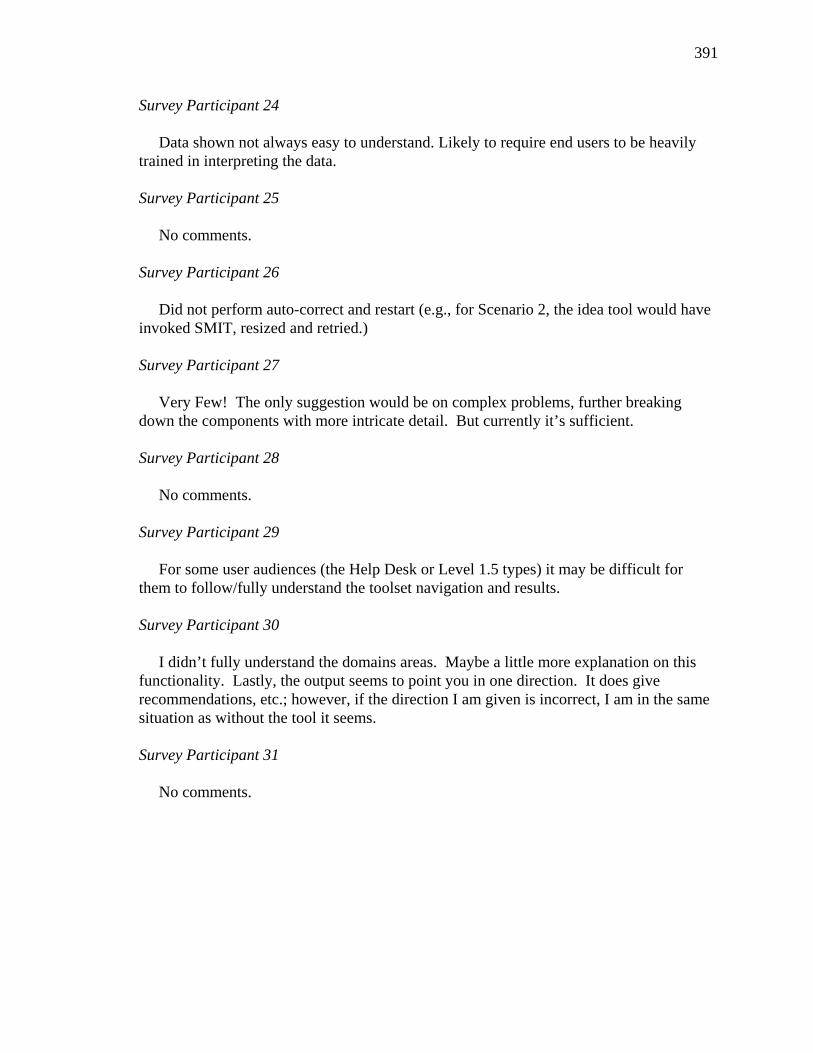
391
Survey Participant 24 Data shown not always easy to understand. Likely to require end users to be heavily trained in interpreting the data. Survey Participant 25 No comments. Survey Participant 26 Did not perform auto-correct and restart (e.g., for Scenario 2, the idea tool would have invoked SMIT, resized and retried.) Survey Participant 27 Very Few! The only suggestion would be on complex problems, further breaking down the components with more intricate detail. But currently it’s sufficient. Survey Participant 28 No comments. Survey Participant 29 For some user audiences (the Help Desk or Level 1.5 types) it may be difficult for them to follow/fully understand the toolset navigation and results. Survey Participant 30 I didn’t fully understand the domains areas. Maybe a little more explanation on this functionality. Lastly, the output seems to point you in one direction. It does give recommendations, etc.; however, if the direction I am given is incorrect, I am in the same situation as without the tool it seems. Survey Participant 31 No comments.

392
Survey Participant 32 There were no glaring problems to render the tool unsuccessful by any means. However, there is a lot of information on the screen at one time, which may be put in pull down format to allow someone to see only what they need at one time. This makes it even more accessible to an administrator (i.e. top gun, contractor, etc.) who is less familiar with it’s format. Survey Participant 33 The tool does not seem to account for problems that do not have a specific error code from an application or problems that result from a combination of problems. As with Tivoli, the expert will still be in demand to make use of the system. Any other comments or observations?
Survey Participant 1 What is the performance impact of the toolkit gathering this real-time data? Survey Participant 2 No comments. Survey Participant 3 Nice piece of work. Wish I had this type of tool when supporting errant Web applications. Survey Participant 4 The sophistication of this toolset seems to imply a higher level skill in the operations role than traditional. The direction has been to simply and put lowest skill possible at the monitor console. Does this toolset imply a paradigm shift? Survey Participant 5 I recommend explaining SLA/SLO if you are going to use those concepts. Not a problem for IBMers. Although I understand why these packages were distributed the way they were, the use of color greatly enhances understanding and impact of the toolset. Assumption: Tivoli Framework is running underneath. What would happen if there no Tivoli? What other products could interface with the toolset? Assumption: Each of these products (e.g. DB2) can sent the types of alerts that the

393
toolset is looking for, with adequate detail. Survey Participant 6 Nicely integrated with other systems, communications tools (email, pager) and external information resources. Survey Participant 7 I found it confusing that the toolset didn’t really distinguish what each support role was supposed to do and how each person performing each role would know. Is that something in their work instructions or job description??? E.g. for scenario 1, the customer care person was working the problem and was supposed to know not to do the vendor recommended actions because they were not a database SME. The Specific Fault view does identify the problem as needing to go to the database group to be worked, but the customer care person also has to go through the scenario to gather data and transfer the problem to the problem management system. The tie-in with the problem management system is a bit confusing. In cases where the customer care person researches the problem and gathers info and then opens a problem ticket with that data…I understand. But in other cases the problem is seemingly fixed before a problem record is opened (or opened as a closed problem). Survey Participant 8 Overall, even including the more complicated scenarios, it was easy to pinpoint problems or problem areas. Utilizing this tool will/would enable companies to leverage lower cost personal to achieve problem resolution. A side benefit would be freeing the more experienced, highly trained personnel from performing late night problem resolutions. Survey Participant 9 No comments. Survey Participant 10 Where’s my Demo?

394
Survey Participant 11 This is a well thought-out comprehensive set of tools. The level of sophistication is definitely leading edge. In today’s competitive Web-hosting environment it provides an excellent solution for driving down cost (through labor) while improving quality and availability. Survey Participant 12 Overall I understand the concept and it’s goal’s but more work needs to be done in two areas − Process management − Usability
Survey Participant 13 No comments. Survey Participant 14 I would have liked to have a little more info on how the toolset worked to get this information. (i.e. Was this supposed to be Tivoli installing, running, etc. the applications it was diagnosing the problem for? I am not sure if my Tivoli & DB background made this easier or harder for me to judge.:-). I am curious how you are going to use this info in your final project. Survey Participant 15 I think this would be a benefit for large, complex customers. The Web Application deployment could probably be expanded upon to hold a version library- that would be nice. It appears that there is quite a bit of initial set-up required (servers, IPs, etc)- is this done through Tivoli, or is some of it manual? Seems like a major effort to set up all the specified actions and recommendation texts, and they’d need to be maintained. Change management is a hot issue- reports that show change history by server would be a value add. Scenario 5 is too complex for an operator, unless he’s very familiar with this particular customer’s environment. (Because I don’t know the history of the applications, how would I draw any conclusions about the completion times?)

395
Survey Participant 16 The first 3 tools were very powerful and easy to understand for the help desk level personnel. The first 3 tools also provided enough detail for the admin. to easily resolve the issue. The last 2 tools would be too complex for a help desk level person to use easily. Survey Participant 17 I believe the toolset can be very valuable if the data can be collected in a reasonable fashion. Survey Participant 18 Excellent tool for Ops/others to teach reasons for problems- can see as usable to root cause analysis! Survey Participant 19 No comments. Survey Participant 20 No comments. Survey Participant 21 Operations has a procedure database with this data, but this tool would pull all of that data together with the (SMC) tool, and call list database. FYI- A company called 7th wave has a resource/request tool that is similar. Instead of being driven on faults, it is driven on requests, determines the resource (person) work queue to assign the request, and the provides the procedure to perform/do the task. You can see a demo on the Web of the tool. (seventh wave) Would have chosen “will have impact” even without the phrase “but improvements are needed.” I am not sure the degree of impact on operations or maintenance teams due to current toolsets, but feel it would have impact. I like the “standard” procedures approach. Probably could lower Band level using tool in operations. Survey Participant 22 When more than one possible solution is available, I’d like to see the tool set recommend a course of action; for example, do procedure 1, if OK then go to procedure 2, if not, then go to procedure 3.

396
I’d suggest you distinguish between proprietary applications, especially those owned by the customer, and “shrink-wrap” applications like MS Outlook. The problem determination and the course of action could be customized for each. In the scenarios where the performance is slow, you might want to think about distinguishing technical problems from those problems caused by an increase in usage, or traffic, at the Website or the Website page design itself (performance problems could be caused by having large graphics files). Survey Participant 23 No comments. Survey Participant 24 No comments. Survey Participant 25 No comments. Survey Participant 26 Although I noted a desire for more automation, this is a giant leap forward from today’s operational environments. The integration of the various data stores coupled with powerful views supporting the problem determination efforts and enabling lower skilled people to solve more problems at the point of interrupt, significantly improving service level by dramatically reducing MTTR. Survey Participant 27 Excellent tool set and appears to be greatly beneficial to any team or organization that would use! I wish I had these tools when I was a system administrator. Survey Participant 28 Since I am unfamiliar with Help Desk Fault analysis processes and procedures, I could not compare with other existing processes and in addition, it took moderate effort for me to understand the steps. Since the toolset is very consistent throughout and takes a well defined step by step process, I believe someone with a little training could very easily use this tool set.

397
Survey Participant 29 Need to check spelling within context in scenarios. Found several errors. (i.e. ‘end’ where should have been ‘and’. etc) Survey Participant 30 I’m worried about the usability of the tool as compared to the complexity of the issue. Will the tool truly point one in a direction when the issue is very complex. Another concern is the knowledge of each user in regard to the information presented with the tool. Does the user fully understand the output to direct it to the appropriate ‘fixers’. Survey Participant 31 Why is the fault transferred as closed in scenarios? What happens if the installation/configuration stalls or fails? Survey Participant 32 Outstanding toolset was presented well and solves real problems in and efficient and effective manner. Survey Participant 33 You used the Tivoli product set extensively to get your point across. Tivoli already has a host of products to do exactly what your toolset does. Will your toolset be used to integrate other vendor products that may not integrate as well as the Tivoli product set? Is your toolset merely proposing a methodology or is it proposing a new product line? The full Life Cycle Approach can be very effective with buy-in from all involved stakeholders. Also, it would require that this groundwork be laid before any other systems/applications are in place. This would make the system most effective. The problem you are solving with this toolset is not clearly defined. Also, since other products exist that solve the same problem, how does your product differ? The impact of the toolset would have on an organization would not be limited to the efficiency of the tool itself. However, the tool does a good job of trying multiple events of the same problem together: Correlation. The interface is very simple and easy for a user to grasp the functionality. I am sure that any graphical features were missed because of he black and white copies, but if not it could be more exciting using various color schemes. The requirement for the overall product need to be clarified. The scenarios were realistic and straightforward. But in the scope of the whole system, I am unable to quantify if the requirements are met. How is the toolset configured to detect various vendor/application errors? Is there

398
some way to update the system when new tools/apps/hardware/software, etc. are added to the environment? Addressing these questions will speak to the adaptability of the toolset. This is crucial for the dynamic would to appreciate your toolset. Good Work!

399
Appendix H
Data Dictionary for Full Life-Cycle Toolset This appendix contains the data dictionary for the full life-cycle toolset. The scope of
this appendix is limited to the database tables and fields that were used to implement the
prototype toolset scenarios. The database tables named in this appendix are part of a
single database called the Full Lifecycle Toolset MIR.
Table 54. Application Capacity Log
Field Name Description Type
Application Names the application for which this data applies. For example, b2b-EzTran. This is the first of five fields that make up the primary key.
Text
Domain Names the domain for which this data applies. For example, Verification. This is the second of five fields that make up the primary key.
Text
Type of Bottleneck
Indicates the general kind of bottleneck data. Values include: - Application - Database - Middleware - Network - System This is the third of five fields that make up the primary key.
Text

400
Table 54. (continued)
Field Name Description Type
Verification Date Date for this verification data. This is the fourth of four fields that make up the primary key.
Date/Time
Verification Time Time for this verification data. This is the last of five fields that make up the primary key.
Date/Time
Bottleneck Subtype
Indicates the specific kind of data. Values include: - Long Read - Long Queue Get/Put - Long SQL Query - Long Write - Process Hung - Process Missing
Text
Table 55. Application Definition
Field Name Description Type
Application Name Names the application that can be managed using the full life-cycle toolset. This is the primary key.
Text
Accounting Support Indicates if this application has support for the specified subsystem. Values are yes or no.
Text
Administration Support Indicates if this application has support for the specified subsystem. Values are yes or no.
Text

401
Table 55. (continued)
Field Name Description Type
Automation Support Indicates if this application has support for the specified subsystem. Values are yes or no.
Text
Availability Support
Indicates if this application has support for the specified subsystem. Values are yes or no.
Text
Business Support Indicates if this application has support for the specified subsystem. Values are yes or no.
Text
Capacity Support Indicates if this application has support for the specified subsystem. Values are yes or no.
Text
Change Support Indicates if this application has support for the specified subsystem. Values are yes or no.
Text
Fault Support Indicates if this application has support for the specified subsystem. Values are yes or no.
Text
Operations Support Indicates if this application has support for the specified subsystem. Values are yes or no.
Text
Performance Support Indicates if this application has support for the specified subsystem. Values are yes or no.
Text

402
Table 55. (continued)
Field Name Description Type
Problem Support Indicates if this application has support for the specified subsystem. Values are yes or no.
Text
Security Support Indicates if this application has support for the specified subsystem. Values are yes or no.
Text
Service Level Support Indicates if this application has support for the specified subsystem. Values are yes or no.
Text
Software Distribution Support
Indicates if this application has support for the specified subsystem. Values are yes or no.
Text
Table 56. Automated Installation and Configuration Log
Field Name Description Type
Automated Record Type Contains the type of data. Values are Installation or Configuration. This is the first of four fields that make up the primary key.
Text
Target System Names the application for which this data applies. For example, HR Benefits. This is the second of four fields that make up the primary key.
Text

403
Table 56. (continued)
Field Name Description Type
Date Date for this installation or configuration activity. This is the third of four fields that make up the primary key.
Date/Time
Time Time for this installation or configuration activity. This is the last of four fields that make up the primary key.
Date/Time
Target Servers Host names of the servers that make up the target system.
Text
Status Indicates the standing of this activity. Values include: - Successful - activity completed normally. - Unknown - status of this activity is unknown. - Unsuccessful - activity did not completed normally.
Text
Definitions Used Key of the definitions associated with this installation or configuration activity.
Text
Options Used Key of the options associated with this installation or configuration activity.
Text
Message Text Text of the message associated with this installation or configuration activity.
Text

404
Table 57. Business Systems Definitions
Field Name Description Type
Business System
Names the business systems for which this data applies, for example, VMS Systems Limited. This is the primary key.
Text
Application Names the applications that are part of this business system, for example, two applications would be defined--Value Markets/Markets Management.
Text
Views Names the application views that are part of this business system.
Text
Table 58. Change-Window Operations Log
Field Name Description Type
Name Contains the descriptive name given to the defined change window. This is the first of three fields that make up the primary key.
Text
Window Start Date Date for the start of this change window. This is the second of three fields that make up the primary key.
Date/Time
Window Start Time Time for the start of this change window. This is the last of three fields that make up the primary key.
Date/Time
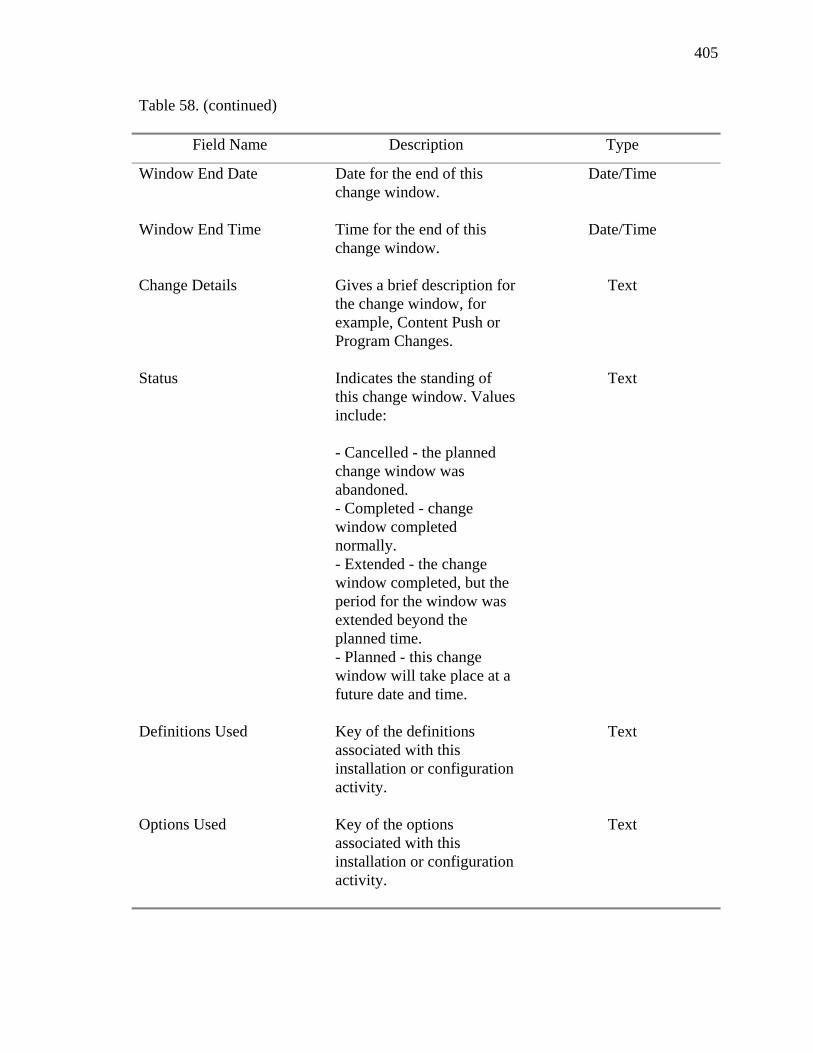
405
Table 58. (continued)
Field Name Description Type
Window End Date Date for the end of this change window.
Date/Time
Window End Time Time for the end of this change window.
Date/Time
Change Details Gives a brief description for the change window, for example, Content Push or Program Changes.
Text
Status Indicates the standing of this change window. Values include: - Cancelled - the planned change window was abandoned. - Completed - change window completed normally. - Extended - the change window completed, but the period for the window was extended beyond the planned time. - Planned - this change window will take place at a future date and time.
Text
Definitions Used Key of the definitions associated with this installation or configuration activity.
Text
Options Used Key of the options associated with this installation or configuration activity.
Text

406
Table 58. (continued)
Field Name Description Type
Message Text Text of the message associated with this installation or configuration activity.
Text
Table 59. Configuration Verification Log
Field Name Description Type
Application Names the application for which this data applies. For example, Order Marketplace. This is the first of four fields that make up the primary key.
Text
Domain Pair Names the domains for which this data applies. For example, Test-Production. This is the second of four fields that make up the primary key.
Text
Verification Date Date for this verification data. This is the third of four fields that make up the primary key.
Date/Time
Verification Time Time for this verification data. This is the last of four fields that make up the primary key.
Date/Time
Total Number of Exceptions
Count of the total number of exceptions.
Number
Program Mismatch Number of programs that do not match between these domains.
Number
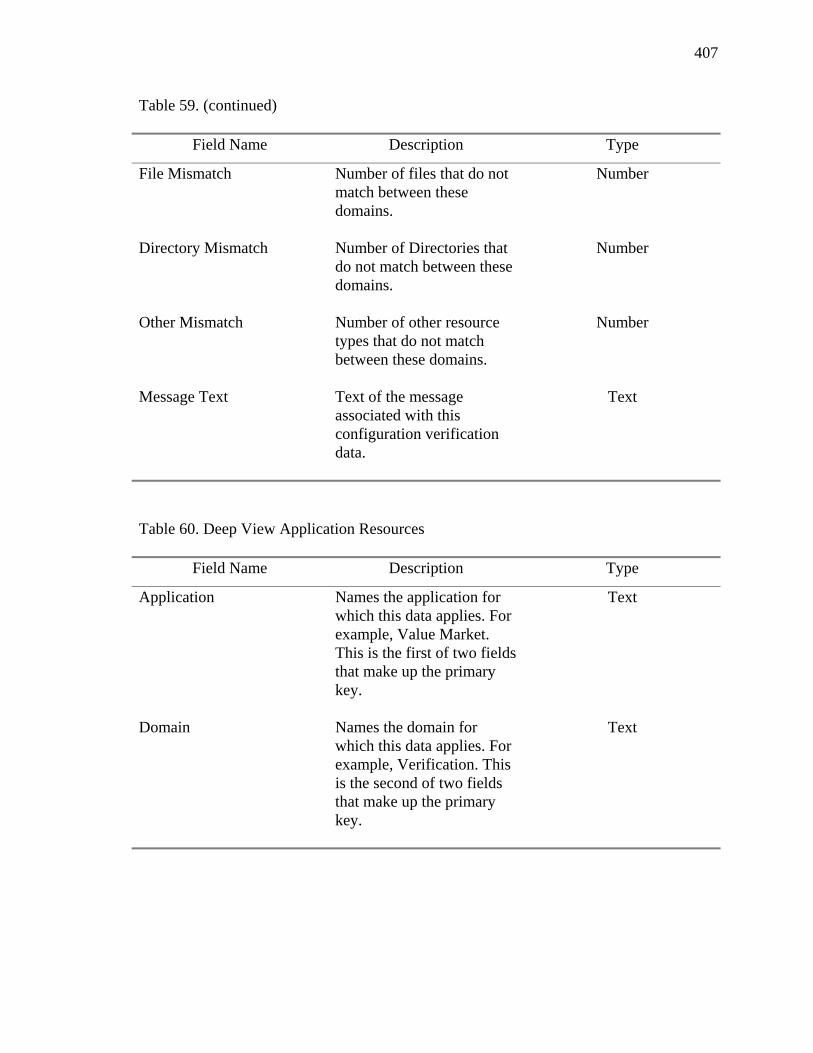
407
Table 59. (continued)
Field Name Description Type
File Mismatch Number of files that do not match between these domains.
Number
Directory Mismatch Number of Directories that do not match between these domains.
Number
Other Mismatch Number of other resource types that do not match between these domains.
Number
Message Text Text of the message associated with this configuration verification data.
Text
Table 60. Deep View Application Resources
Field Name Description Type
Application Names the application for which this data applies. For example, Value Market. This is the first of two fields that make up the primary key.
Text
Domain Names the domain for which this data applies. For example, Verification. This is the second of two fields that make up the primary key.
Text

408
Table 60. (continued)
Field Name Description Type
Accounting: Primary Billing Application
Host names of the servers that make up the deployment domain.
Text
Accounting: Accounting Options
Indicates the standing of this activity. Values include: - Successful - activity completed normally. - Unknown - status of this activity is unknown. - Unsuccessful - activity did not completed normally.
Text
Accounting: Last Usage Record
Name of the utility that is associated with this deployment operation.
Text
Accounting: Major Account Operation performed by the utility program associated with this deployment activity.
Text
Administration: Last Install Date
Date of last installation activity.
Date/Time
Administration: Last Install Time
Time of last installation activity.
Date/Time
Administration: Last Install Status
Status of last installation activity, for example, Successful.
Text
Administration: Last Configuration Date
Date of last configuration activity.
Date/Time
Administration: Last Configuration Time
Time of last configuration activity.
Date/Time
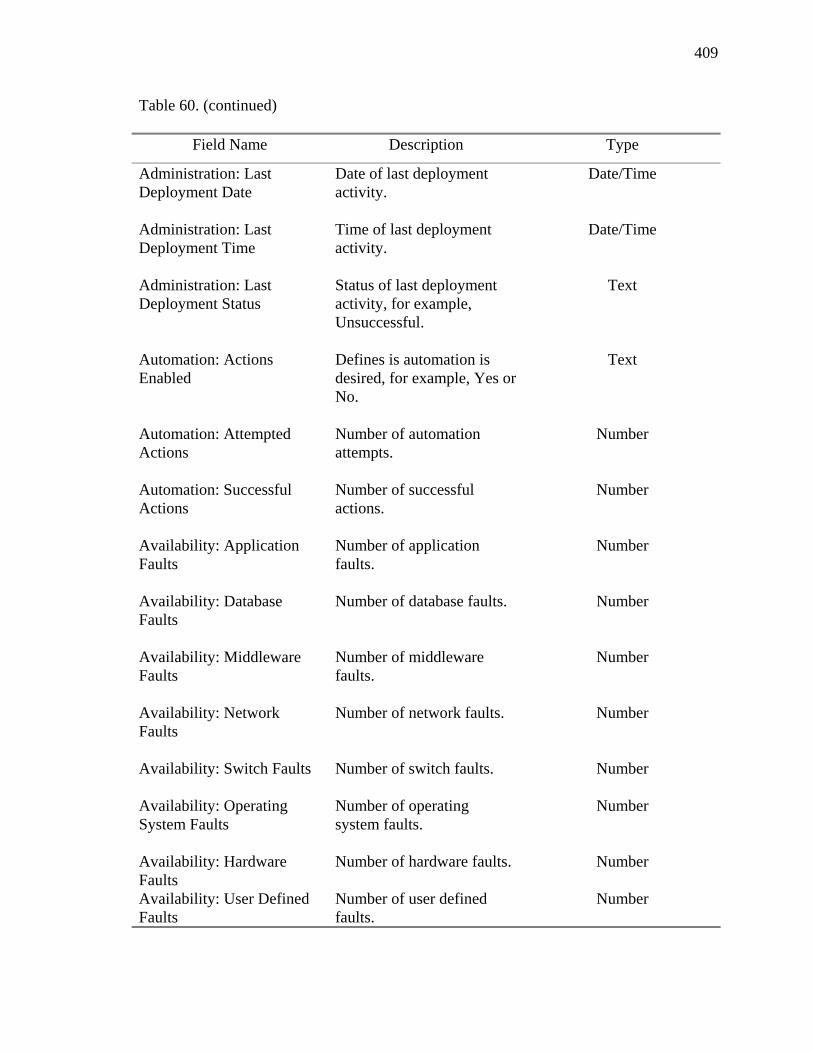
409
Table 60. (continued)
Field Name Description Type
Administration: Last Deployment Date
Date of last deployment activity.
Date/Time
Administration: Last Deployment Time
Time of last deployment activity.
Date/Time
Administration: Last Deployment Status
Status of last deployment activity, for example, Unsuccessful.
Text
Automation: Actions Enabled
Defines is automation is desired, for example, Yes or No.
Text
Automation: Attempted Actions
Number of automation attempts.
Number
Automation: Successful Actions
Number of successful actions.
Number
Availability: Application Faults
Number of application faults.
Number
Availability: Database Faults
Number of database faults. Number
Availability: Middleware Faults
Number of middleware faults.
Number
Availability: Network Faults
Number of network faults.
Number
Availability: Switch Faults Number of switch faults.
Number
Availability: Operating System Faults
Number of operating system faults.
Number
Availability: Hardware Faults
Number of hardware faults.
Number
Availability: User Defined Faults
Number of user defined faults.
Number
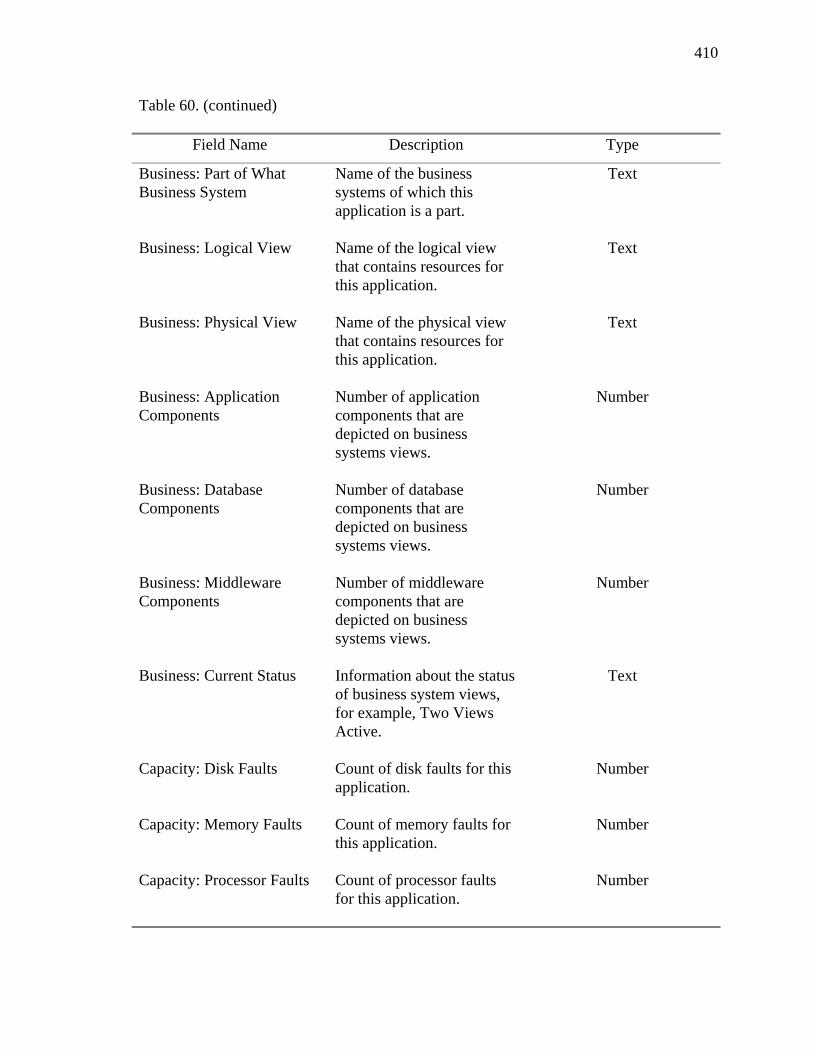
410
Table 60. (continued)
Field Name Description Type
Business: Part of What Business System
Name of the business systems of which this application is a part.
Text
Business: Logical View Name of the logical view that contains resources for this application.
Text
Business: Physical View Name of the physical view that contains resources for this application.
Text
Business: Application Components
Number of application components that are depicted on business systems views.
Number
Business: Database Components
Number of database components that are depicted on business systems views.
Number
Business: Middleware Components
Number of middleware components that are depicted on business systems views.
Number
Business: Current Status Information about the status of business system views, for example, Two Views Active.
Text
Capacity: Disk Faults Count of disk faults for this application.
Number
Capacity: Memory Faults Count of memory faults for this application.
Number
Capacity: Processor Faults Count of processor faults for this application.
Number
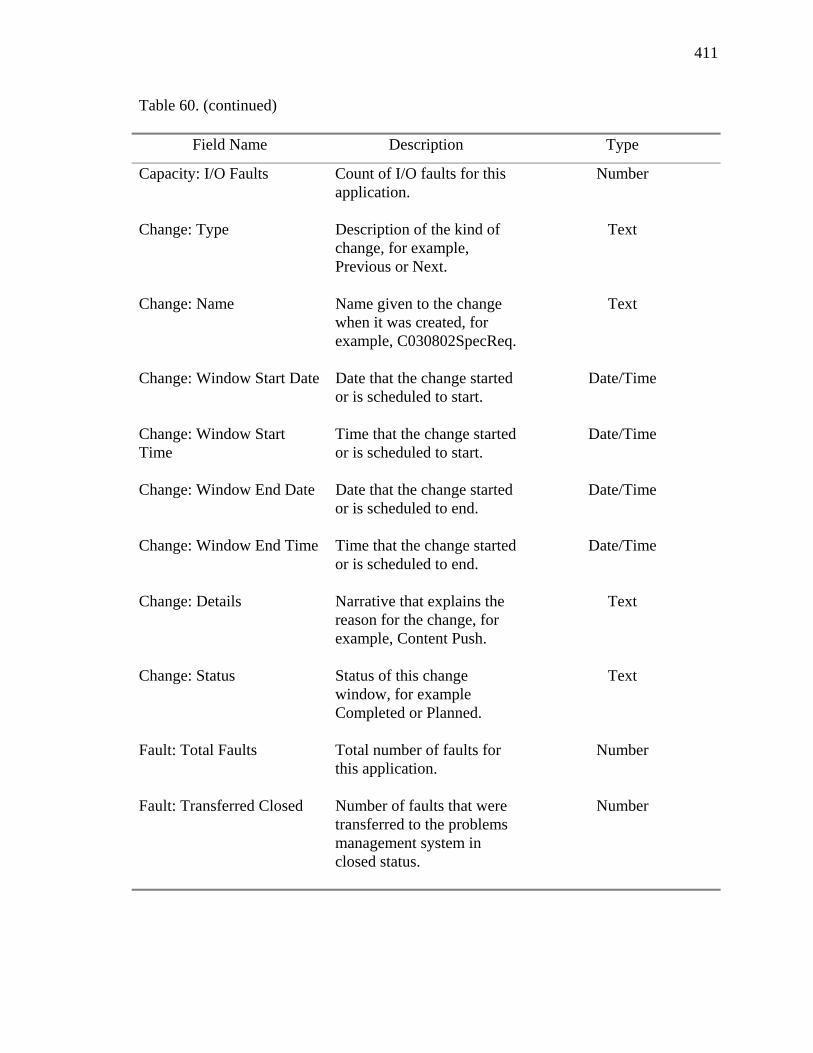
411
Table 60. (continued)
Field Name Description Type
Capacity: I/O Faults Count of I/O faults for this application.
Number
Change: Type Description of the kind of change, for example, Previous or Next.
Text
Change: Name Name given to the change when it was created, for example, C030802SpecReq.
Text
Change: Window Start Date Date that the change started or is scheduled to start.
Date/Time
Change: Window Start Time
Time that the change started or is scheduled to start.
Date/Time
Change: Window End Date Date that the change started or is scheduled to end.
Date/Time
Change: Window End Time Time that the change started or is scheduled to end.
Date/Time
Change: Details Narrative that explains the reason for the change, for example, Content Push.
Text
Change: Status Status of this change window, for example Completed or Planned.
Text
Fault: Total Faults Total number of faults for this application.
Number
Fault: Transferred Closed Number of faults that were transferred to the problems management system in closed status.
Number

412
Table 60. (continued)
Field Name Description Type
Fault: Transferred Open Number of faults that were transferred to the problems management system in open status.
Number
Fault: Examined Number of faults examined using the Specific Fault view.
Number
Fault: Not Yet Examined Number of faults not yet examined using the Specific Fault view.
Number
Fault: Average Per Day Average number of faults per day for this application.
Number
Operations: Job Scheduling Name of job scheduling software in use.
Text
Operations: Output management
Name of output management software in use.
Text
Operations: Help Desk Name of primary help desk view.
Text
Operations: Backup and Restore
Status of last three backup and restore operations.
Text
Performance: Current Indicator
Summarizes the current performance status, for example, Switch+Processor, which indicated that there have been recent performance exceptions regarding switches and processors.
Text
Performance: Previous Indicator
Summarizes the previous performance status.
Text
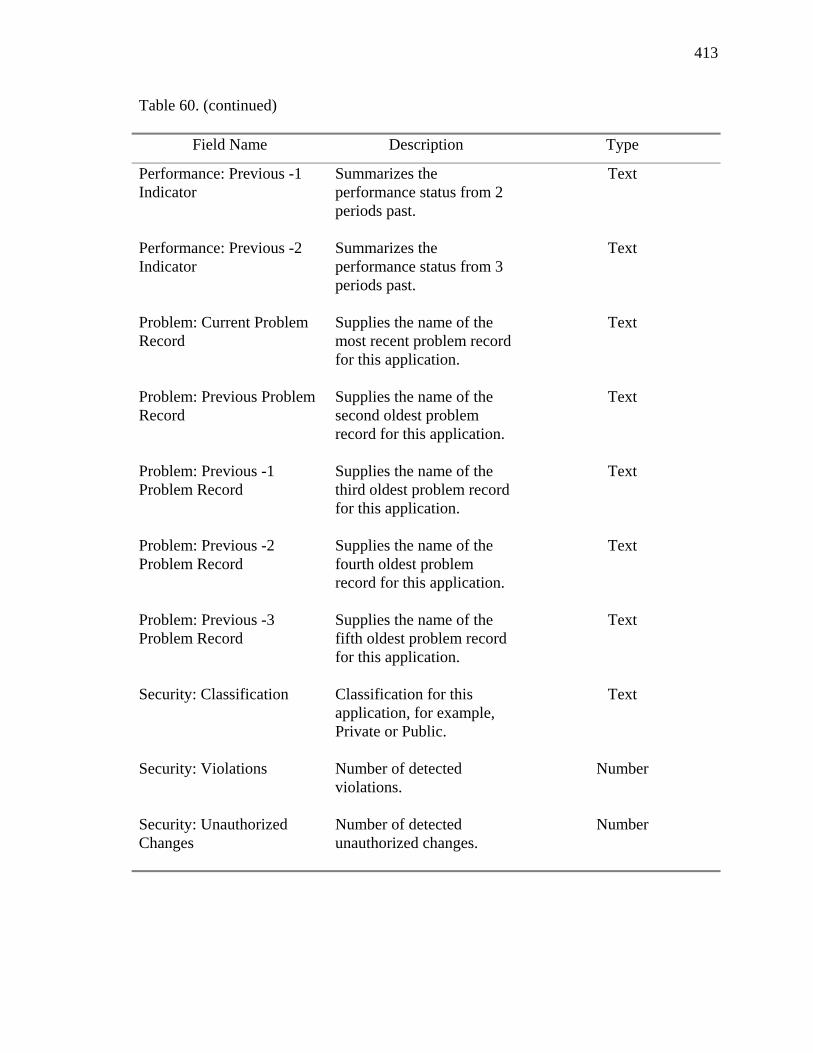
413
Table 60. (continued)
Field Name Description Type
Performance: Previous -1 Indicator
Summarizes the performance status from 2 periods past.
Text
Performance: Previous -2 Indicator
Summarizes the performance status from 3 periods past.
Text
Problem: Current Problem Record
Supplies the name of the most recent problem record for this application.
Text
Problem: Previous Problem Record
Supplies the name of the second oldest problem record for this application.
Text
Problem: Previous -1 Problem Record
Supplies the name of the third oldest problem record for this application.
Text
Problem: Previous -2 Problem Record
Supplies the name of the fourth oldest problem record for this application.
Text
Problem: Previous -3 Problem Record
Supplies the name of the fifth oldest problem record for this application.
Text
Security: Classification Classification for this application, for example, Private or Public.
Text
Security: Violations Number of detected violations.
Number
Security: Unauthorized Changes
Number of detected unauthorized changes.
Number

414
Table 60. (continued)
Field Name Description Type
Security: Back End Administrative Access
Indicates if administrative access is utilized over a dedicated leased line or Virtual Private Network (VPN).
Text
Service Level: Type of Application
Indicates if the agreement for this application is a service level objective or service level agreement contract.
Text
Software Distribution: Usage
Specifies if software distribution is supported for this application.
Text
Table 61. Deployment Status Log
Field Name Description Type
Application Names the application for which this data applies. For example, HR Benefits. This is the first of four fields that make up the primary key.
Text
Domain Names the domain for which this data applies. For example, Verification. This is the second of four fields that make up the primary key.
Text
Date Date for this deployment activity. This is the third of four fields that make up the primary key.
Date/Time
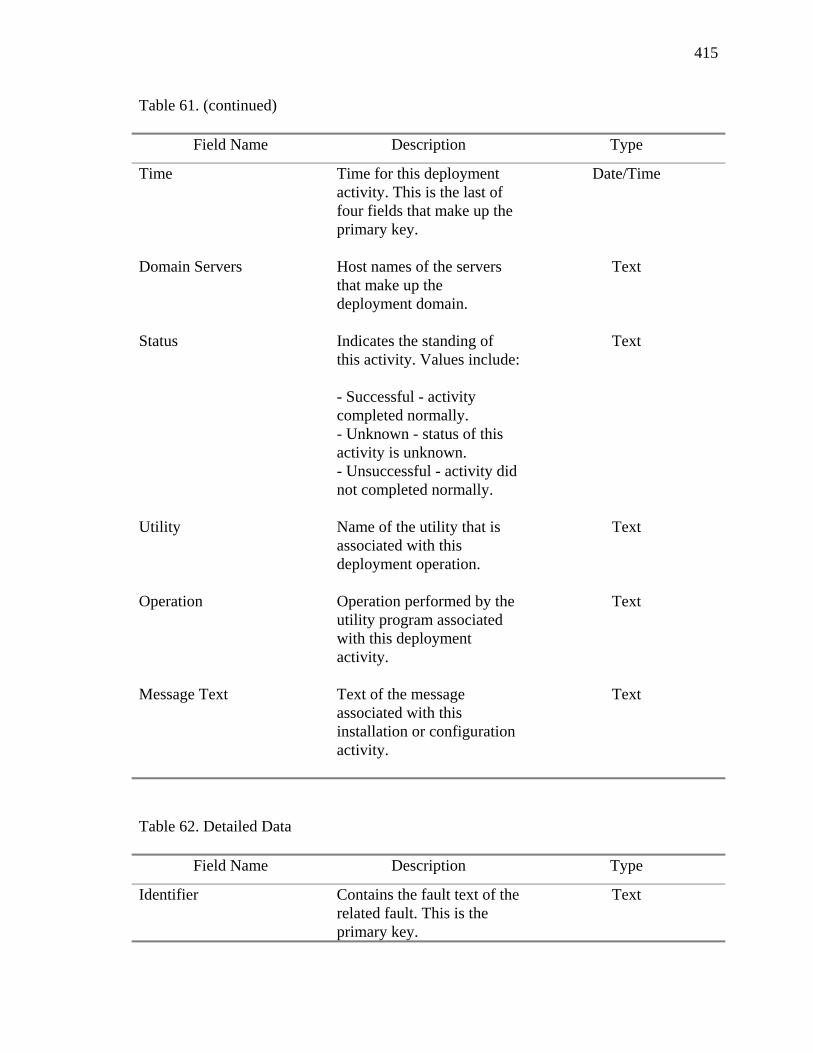
415
Table 61. (continued)
Field Name Description Type
Time Time for this deployment activity. This is the last of four fields that make up the primary key.
Date/Time
Domain Servers Host names of the servers that make up the deployment domain.
Text
Status Indicates the standing of this activity. Values include: - Successful - activity completed normally. - Unknown - status of this activity is unknown. - Unsuccessful - activity did not completed normally.
Text
Utility Name of the utility that is associated with this deployment operation.
Text
Operation Operation performed by the utility program associated with this deployment activity.
Text
Message Text Text of the message associated with this installation or configuration activity.
Text
Table 62. Detailed Data
Field Name Description Type
Identifier Contains the fault text of the related fault. This is the primary key.
Text
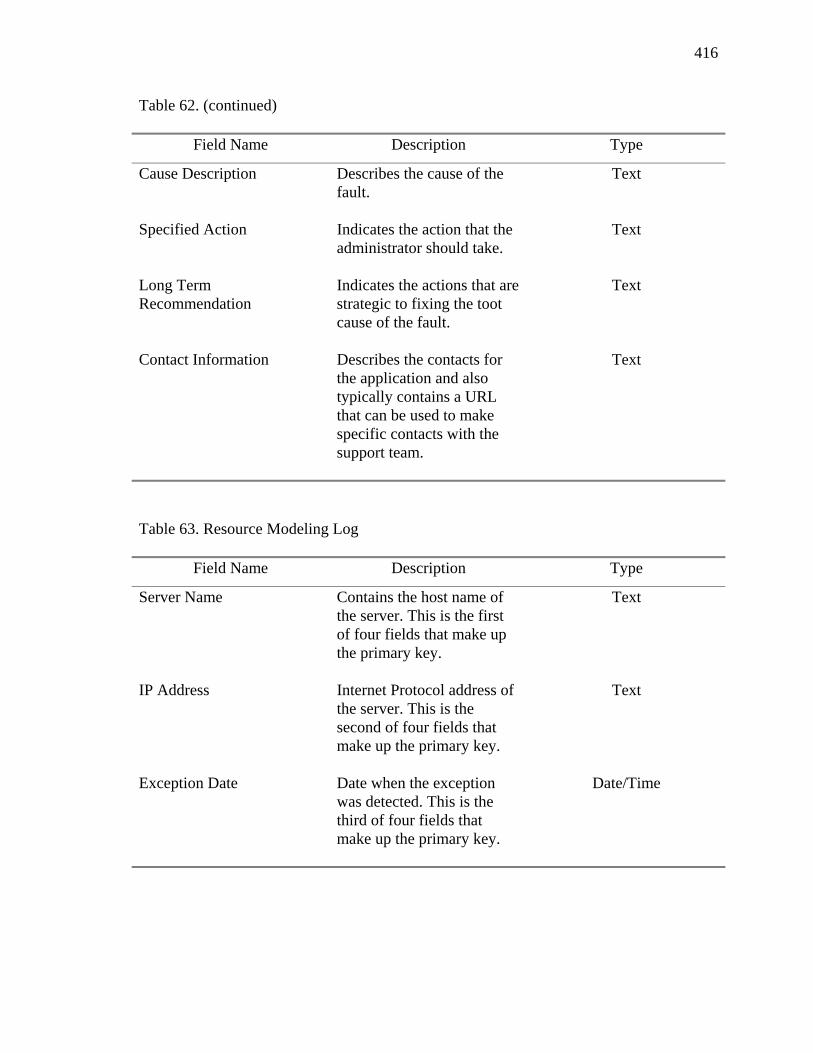
416
Table 62. (continued)
Field Name Description Type
Cause Description Describes the cause of the fault.
Text
Specified Action Indicates the action that the administrator should take.
Text
Long Term Recommendation
Indicates the actions that are strategic to fixing the toot cause of the fault.
Text
Contact Information Describes the contacts for the application and also typically contains a URL that can be used to make specific contacts with the support team.
Text
Table 63. Resource Modeling Log
Field Name Description Type
Server Name Contains the host name of the server. This is the first of four fields that make up the primary key.
Text
IP Address Internet Protocol address of the server. This is the second of four fields that make up the primary key.
Text
Exception Date Date when the exception was detected. This is the third of four fields that make up the primary key.
Date/Time

417
Table 63. (continued)
Field Name Description Type
Exception Time Time when the exception was detected. This is the last of four fields that make up the primary key.
Date/Time
Exception Type Indicates the specific type of exception. Values include: - Disk - Memory - Processor - I/O
Text
Table 64. Resource Modeling Monitoring Input
Field Name Description Type
Application Name Contains the name of the application for which this definition applies. This is the primary key.
Text
Disk Exception Definition Describes a disk exception, for example, Total Of 80 Percent Full.
Text
Memory Exception Definition
Describes a memory exception, for example, Total Of 90 Percent Full.
Text
Processor Exception Definition
Describes a processor exception, for example, Total Of 50 Percent Busy.
Text
I/O Exception Definition Describes an I/O exception, for example, Total Of 50 Percent Busy.
Text

418
Table 65. SLO/SLA Definitions
Field Name Description Type
Application Name Contains the name of the application for which this definition applies. This is the primary key.
Text
Application Type Defined the kind of support, SLO or SLA, for this application.
Collections Defined Indicates the type of this observation. Values include: - URL=Yes/No - Application=Yes/No - Database=Yes/No - Middleware=Yes/No - Network=Yes/No - Server=Yes/No - Hardware=Yes/No - Detailed Logging=Yes/No - External Logging=Yes/No
Text
Table 66. SLO/SLA Log
Field Name Description Type
Application Name Contains the name of the application for which this data applies. This is the first of four fields that make up the primary key.
Text
Date Date of this observation. This is the second of four fields that make up the primary key.
Date/Time

419
Table 66 (continued)
Field Name Description Type
Time Time of this observation. activity. This is the third of four fields that make up the primary key.
Date/Time
Observation Type Indicates the type of this observation. Values include: - URL - Application - Database - Middleware - Server - Hardware This is the last of four fields that make up the primary key.
Text
Observation State Indicates the status of this observation. Values include: - Available - Unavailable - Unknown
Text
Table 67. Specific Fault Data
Field Name Description Type
Application Contains the name of the Web application. This is the first of three fields that make up the primary key.
Text
Fault Date Date when the fault was detected. This is the second of three fields that make up the primary key.
Date/Time

420
Table 67. (continued)
Field Name Description Type
Fault Time Time when the fault was detected. This is the third of three fields that make up the primary key.
Date/Time
Source Indicates the primary basis for the fault.
Text
Sub Source Indicates the secondary basis for the fault.
Text
IP Origin Specifies the primary Internet Protocol address of the host for this fault.
Text
IP Sub Origin Specifies the secondary Internet Protocol address of the host for this fault.
Text
Repeat Count Specifies the number of duplicate faults of the same type for this application.
Number
Status Indicates the standing of this fault. Values include: - Closed - fault is not longer active. - Open - fault is actively being investigated. - TSME - fault has been transferred to a subject matter expert. - Unassigned - fault has not yet been reviewed.
Text
Administrator Contains the name of the individual or group that is handling the fault.
Text

421
Table 67. (continued)
Field Name Description Type
Severity Indicates the importance of this fault. Values include: - Critical - fault is a significant problem for the application. - Important - fault is most probably a significant problem for the application. - Informational - fault is presented as general interest information. - Unknown - the importance of this fault to the application is not ranked in importance.
Text
Fault Text Descriptive text that explains the fault.
Text
Application Programs Contains 5 text sub fields including: - Name of first active program. - Name of second active program. - Name of third active program. - Name of fourth active program. - Name of fifth active program.
Text

422
Table 67. (continued)
Field Name Description Type
Application Processes
Contains 5 text sub fields including: - Process name/status of first process. - Process name/status of second process. - Process name/status of third process. - Process name/status of fourth process. - Process name/status of fifth process.
Text
Database Programs Contains 5 text sub fields including: - Name of first active program. - Name of second active program. - Name of third active program. - Name of fourth active program. - Name of fifth active program.
Text
Database Processes Contains 5 text sub fields including: - Process name/status of first process. - Process name/status of second process. - Process name/status of third process. - Process name/status of fourth process. - Process name/status of fifth process.
Text
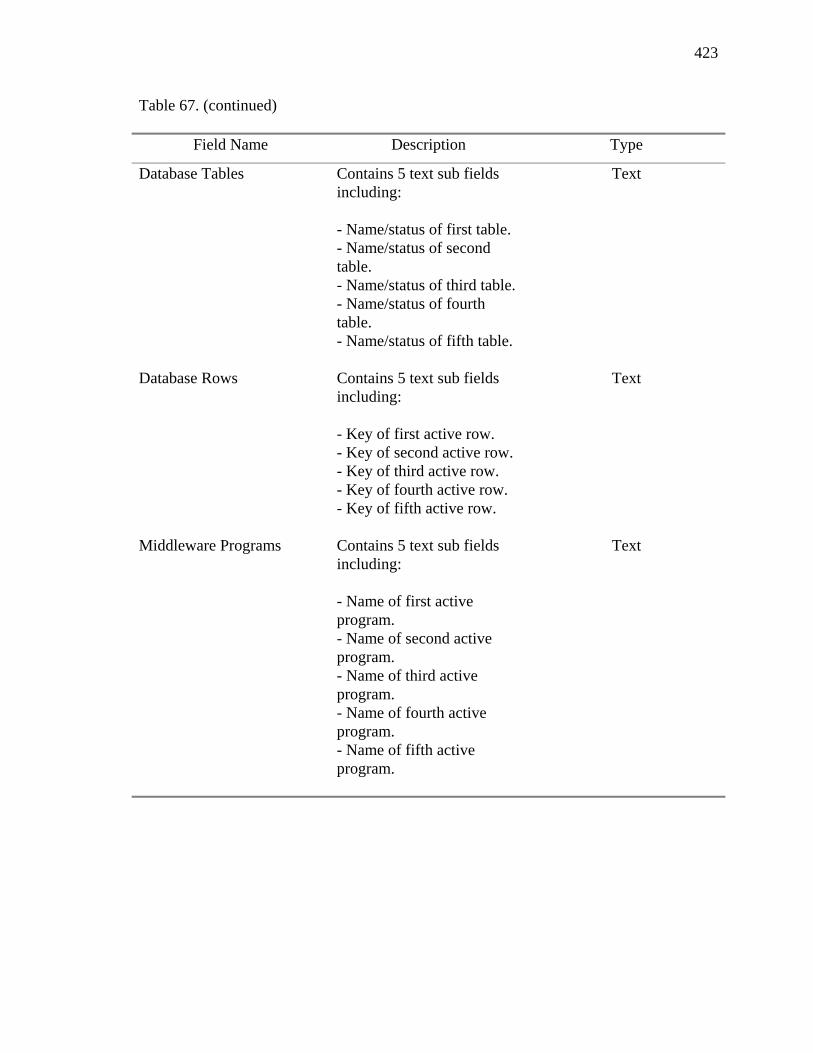
423
Table 67. (continued)
Field Name Description Type
Database Tables Contains 5 text sub fields including: - Name/status of first table. - Name/status of second table. - Name/status of third table. - Name/status of fourth table. - Name/status of fifth table.
Text
Database Rows Contains 5 text sub fields including: - Key of first active row. - Key of second active row. - Key of third active row. - Key of fourth active row. - Key of fifth active row.
Text
Middleware Programs Contains 5 text sub fields including: - Name of first active program. - Name of second active program. - Name of third active program. - Name of fourth active program. - Name of fifth active program.
Text
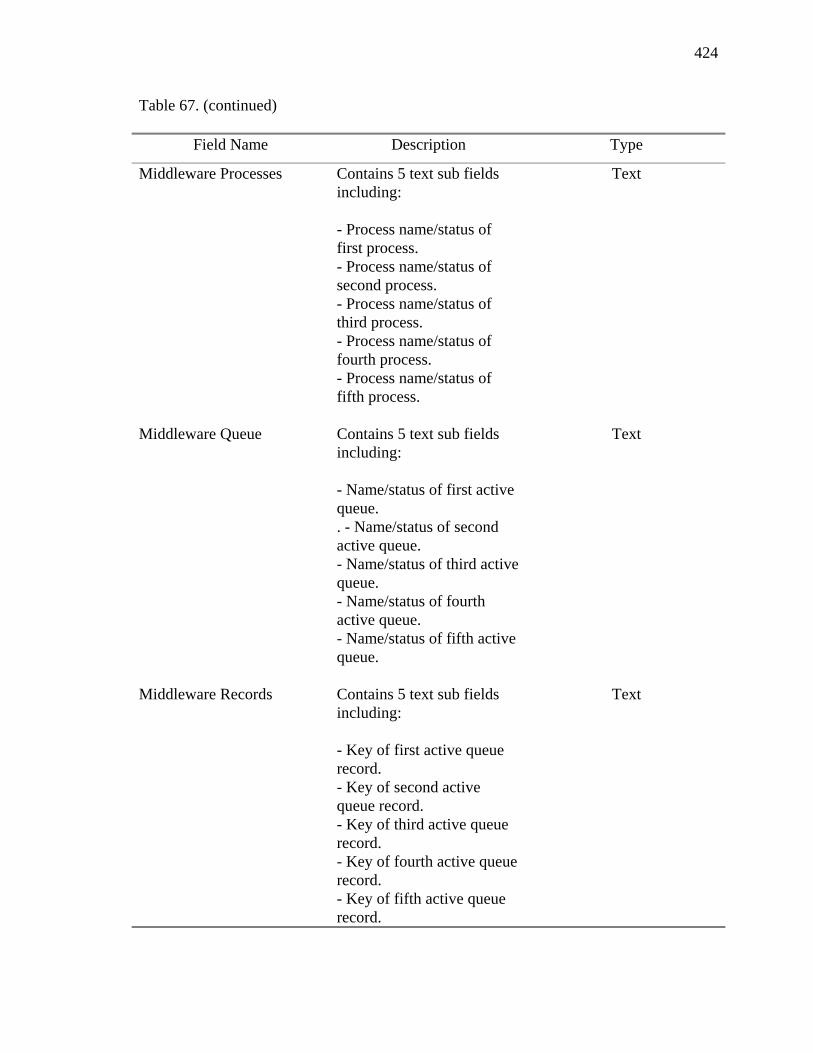
424
Table 67. (continued)
Field Name Description Type
Middleware Processes Contains 5 text sub fields including: - Process name/status of first process. - Process name/status of second process. - Process name/status of third process. - Process name/status of fourth process. - Process name/status of fifth process.
Text
Middleware Queue Contains 5 text sub fields including: - Name/status of first active queue. . - Name/status of second active queue. - Name/status of third active queue. - Name/status of fourth active queue. - Name/status of fifth active queue.
Text
Middleware Records Contains 5 text sub fields including: - Key of first active queue record. - Key of second active queue record. - Key of third active queue record. - Key of fourth active queue record. - Key of fifth active queue record.
Text
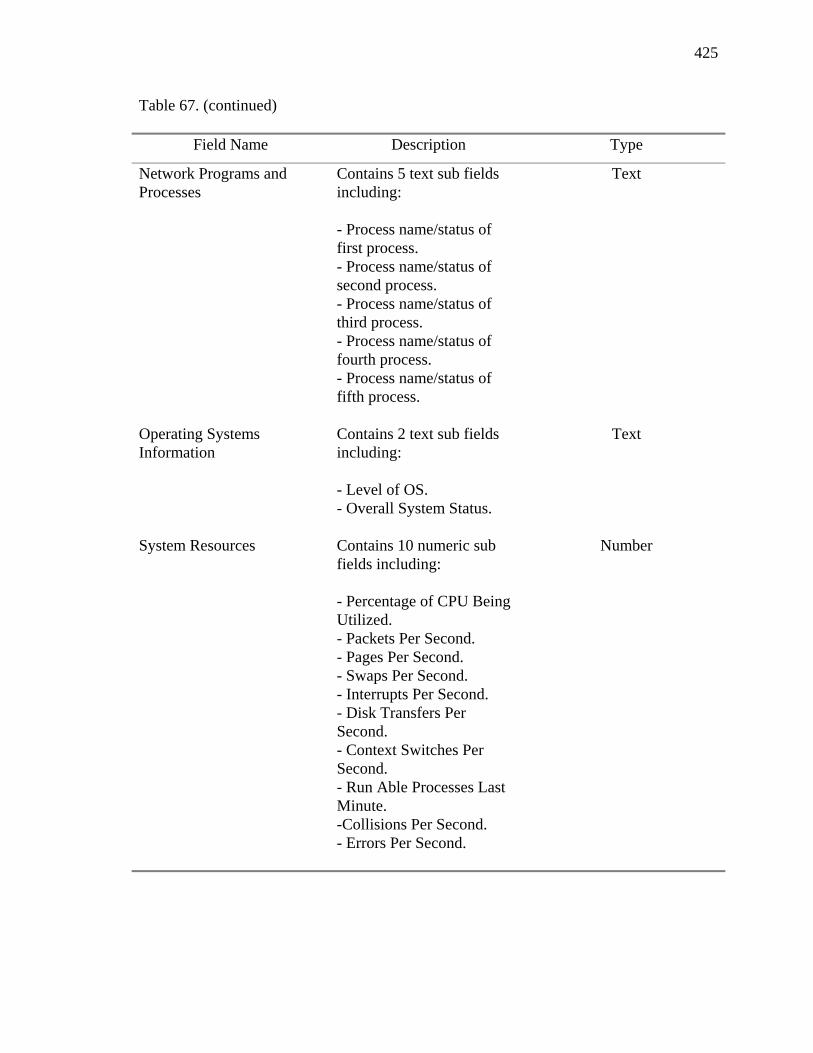
425
Table 67. (continued)
Field Name Description Type
Network Programs and Processes
Contains 5 text sub fields including: - Process name/status of first process. - Process name/status of second process. - Process name/status of third process. - Process name/status of fourth process. - Process name/status of fifth process.
Text
Operating Systems Information
Contains 2 text sub fields including: - Level of OS. - Overall System Status.
Text
System Resources Contains 10 numeric sub fields including: - Percentage of CPU Being Utilized. - Packets Per Second. - Pages Per Second. - Swaps Per Second. - Interrupts Per Second. - Disk Transfers Per Second. - Context Switches Per Second. - Run Able Processes Last Minute. -Collisions Per Second. - Errors Per Second.
Number
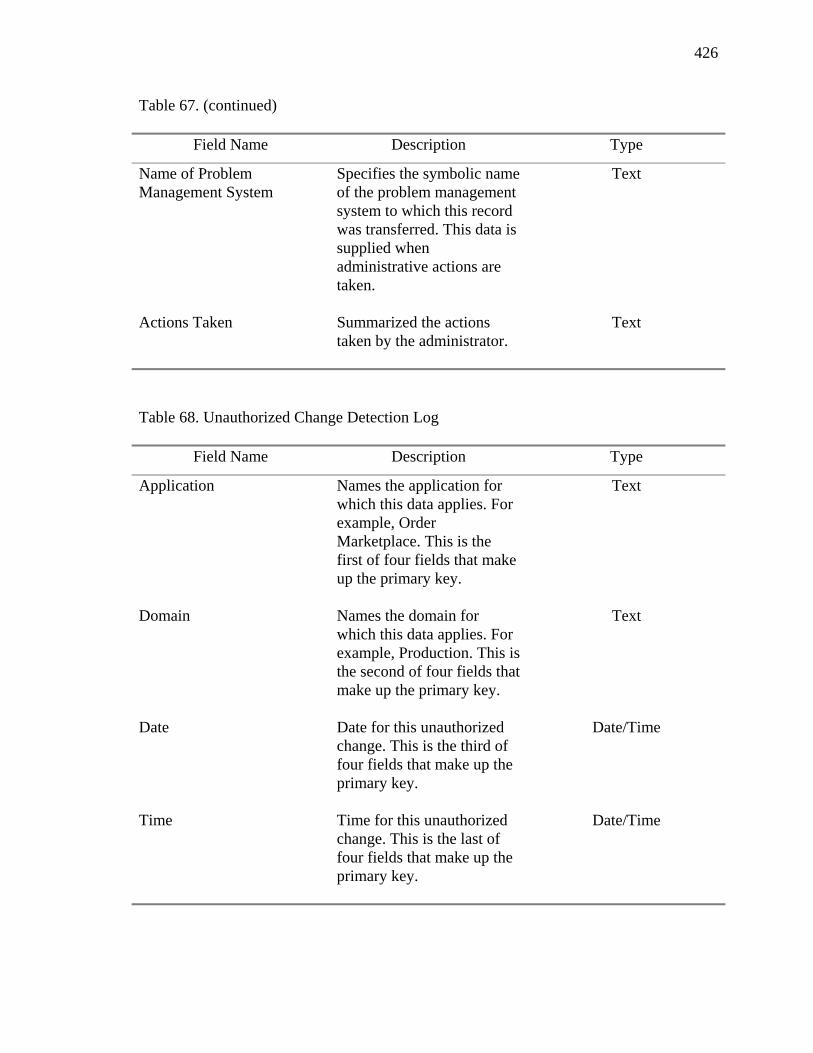
426
Table 67. (continued)
Field Name Description Type
Name of Problem Management System
Specifies the symbolic name of the problem management system to which this record was transferred. This data is supplied when administrative actions are taken.
Text
Actions Taken Summarized the actions taken by the administrator.
Text
Table 68. Unauthorized Change Detection Log
Field Name Description Type
Application Names the application for which this data applies. For example, Order Marketplace. This is the first of four fields that make up the primary key.
Text
Domain Names the domain for which this data applies. For example, Production. This is the second of four fields that make up the primary key.
Text
Date Date for this unauthorized change. This is the third of four fields that make up the primary key.
Date/Time
Time Time for this unauthorized change. This is the last of four fields that make up the primary key.
Date/Time

427
Table 68. Unauthorized Change Detection Log
Field Name Description Type
Type Indicates the kind of resource associated with this unauthorized change. Values include: - Dir - Program - File - User supplied
Text
Name Physical name of the Dir, Program, File, or User supplied resource.
Text
Created/Modified/Accessed Date
Dates, if available, from the operating system for the specific resource.
Date/Time
Comment Brief narrative manually added after research performed on this unauthorized change.
Text
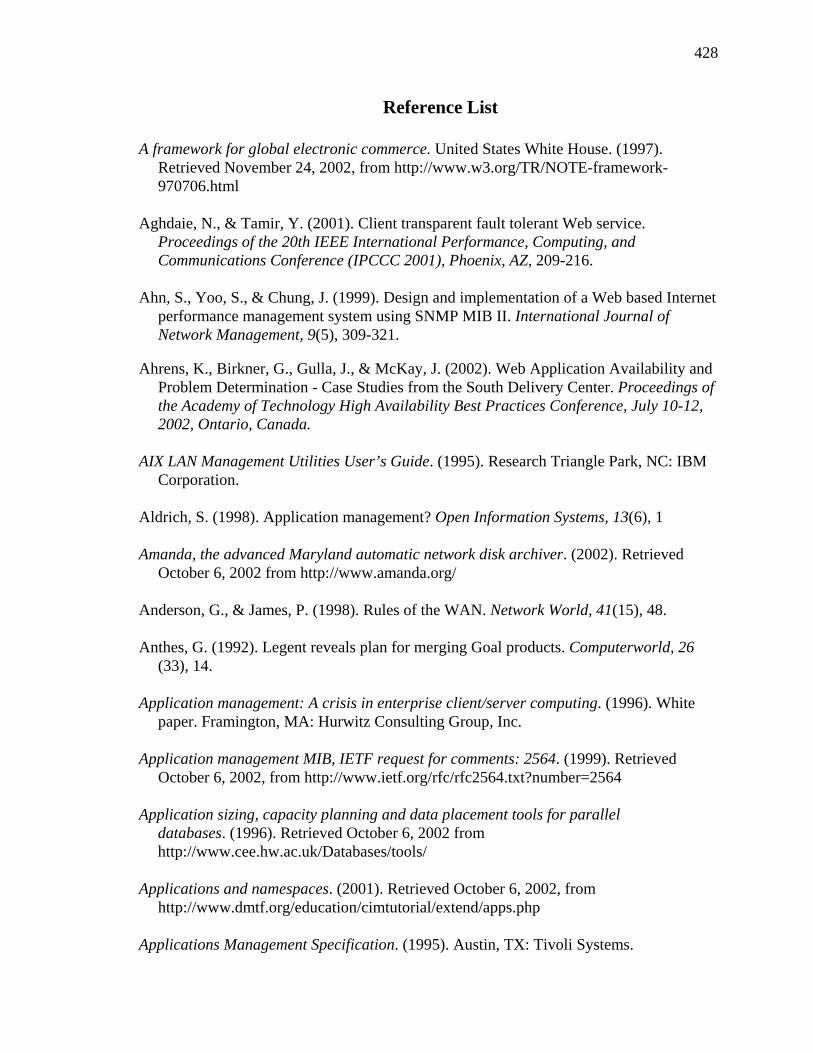
428
Reference List
A framework for global electronic commerce. United States White House. (1997). Retrieved November 24, 2002, from http://www.w3.org/TR/NOTE-framework- 970706.html
Aghdaie, N., & Tamir, Y. (2001). Client transparent fault tolerant Web service. Proceedings of the 20th IEEE International Performance, Computing, and Communications Conference (IPCCC 2001), Phoenix, AZ, 209-216.
Ahn, S., Yoo, S., & Chung, J. (1999). Design and implementation of a Web based Internet
performance management system using SNMP MIB II. International Journal of Network Management, 9(5), 309-321.
Ahrens, K., Birkner, G., Gulla, J., & McKay, J. (2002). Web Application Availability and
Problem Determination - Case Studies from the South Delivery Center. Proceedings of the Academy of Technology High Availability Best Practices Conference, July 10-12, 2002, Ontario, Canada.
AIX LAN Management Utilities User’s Guide. (1995). Research Triangle Park, NC: IBM
Corporation. Aldrich, S. (1998). Application management? Open Information Systems, 13(6), 1 Amanda, the advanced Maryland automatic network disk archiver. (2002). Retrieved
October 6, 2002 from http://www.amanda.org/ Anderson, G., & James, P. (1998). Rules of the WAN. Network World, 41(15), 48. Anthes, G. (1992). Legent reveals plan for merging Goal products. Computerworld, 26
(33), 14. Application management: A crisis in enterprise client/server computing. (1996). White
paper. Framington, MA: Hurwitz Consulting Group, Inc. Application management MIB, IETF request for comments: 2564. (1999). Retrieved October 6, 2002, from http://www.ietf.org/rfc/rfc2564.txt?number=2564 Application sizing, capacity planning and data placement tools for parallel
databases. (1996). Retrieved October 6, 2002 from http://www.cee.hw.ac.uk/Databases/tools/
Applications and namespaces. (2001). Retrieved October 6, 2002, from
http://www.dmtf.org/education/cimtutorial/extend/apps.php Applications Management Specification. (1995). Austin, TX: Tivoli Systems.

429
Applications Management Specification Version 2.0: A DMTF Common Information Model Based Approach to Application Management. (1997). Austin, TX: Tivoli Systems. Aragon, L. (1997). Take the plunge with ESD. PC Week, 32A(14), 5-6. AS/400 and iSeries. (2001). Retrieved October 6, 2002, from http://www.arcadsoftware.com/index.php?lang=en&page=skipper_suite Atkinson, R., Hawkins, P., Hills, P., Woollons, D., Clearwaters, W., & Czaja, R. (1994). Application management in a distributed, object-oriented condition monitoring system.
Proceedings of the 1994 Engineering Systems Design and Analysis Conference, London, England, 64(6), 167-174.
Attardi, G., Cisternino, A., & Simi, M. (1998). Web based configuration assistants.
Artificial Intelligence Engineer Design Analysis and Manufacturing, 12(4), 321-331. Banga, G., & Druschel, P. (1999). Measuring the capacity of a Web server under realistic
loads. World Wide Web, 2(1-2), 69-83. Barruffi, R., Milano, M., & Montanari, R. (2001). Planning for security management.
IEEE Intelligent Systems, 16(1), 74-80.
Bartal, Y., Mayer, A., Nissim, K., & Wool, A. (1999). Firmato: A novel firewall management toolkit. Proceedings of the 19th IEEE Computer Society Symposium on Security and Privacy, Oakland, CA, 17-31.
Bauer, M., Bunt, R., El Rayess, A., Finnigan, P., Kunz, T., Lutfiyya, H., Marshall, A., Martin, P. Oster, G., Powley, W., Rolia, J., Taylor, D., & Woodside, M. (1997). Services supporting management of distributed applications and systems. IBM Systems Journal, 36(4), 508-526. Bauer, M., Coburn, N., Erickson, D., Finnigan, P., Hong, J., Larson, P., Pachi, J., Slonim, J., Taylor, D., & Teorey, T. (1994). A distributed system architecture for a distributed application environment. IBM Systems Journal, 33(3), 399-425. Bauer, M., Finnigan, P., Hong, J., Rolia, J., Teorey, T., & Winters, G. (1994).
Reference architecture for distributed systems management. IBM Systems Journal, 33(3), 426-444.
Bauer, M., Lutfiyya, H., Black, J., Kunz, T., Taylor, D., Bunt, R., Eager, D., Rolia, J., Woodside, C., Hong, J., Martin, T., Finnigan, P. & Teorey, T. (1995) MANDAS: Management of distributed applications. Proceedings of the 5th IEEE Computer Society Workshop on Future Trends of Distributed Computing Systems, Cheju Island, Republic of Korea, 200-206.

430
Best practices in enterprise management. (1998). White paper. Retrieved October 6, 2002 from http://www.meritproject.com/white_papers.htm
Bladergroen, D., Maas, B., Dullaart, L., Kalfsterman, J., Koppens, A., Mameren, A., &
Veen, R. (1998). Delivering IT Services. Utrecht, The Netherlands: Kluwer BedrijfsInformatie.
BMC software solutions for SAP environments. (2001). White paper. Houston, TX: BMC Software, Inc. Boardman, B. (1999). Managing your enterprise piece by piece. (1999). Retrieved
October 6, 2002, from http://www.networkcomputing.com/1010/1010f177.html Boardman, B. (1999). The double edged side of ESM. CMP Media Ltd., 4(20), 26, 28-29. Boloix, G., & Robillard, P. (1995). A software system evaluation framework. Computer,
28(12), 17-26. Britton, C. (2001). IT Architectures and Middleware. Upper Saddle River, NJ: Addison
Wesley. Byrd, J. (1997). A basic UNIX tutorial. Retrieved October 6, 2002, from
http://www.isu.edu/comcom/workshops/unix/index.html CandleNet ETEWatch. (n.d.). Retrieved October 6, 2002, from
http://www.candle.com/www1/cnd/portal/CNDportal_Channel_Master/0,2179,2683_2919,00.html
Carter, C., Whyte, I., Birchall, S., & Swatman, D. (1997). Rapid integration and testing of business solutions. BT Technology, 15(3), 37-47. Central dispatch. (n.d.). Retrieved October 6, 2002 from
http://www.resonate.com/news/press_releases/10_23_01cd40.php Cerutti, D., & Pierson, D. (1993). Distributed Computing Environments. New York:
McGraw-Hill, Inc. Chin, K. (1995). JAD experience. Proceedings of the ACM SIGCPR Conference, New
York, 235-236. Chin, W., Ramachandran, V., & Cheng, C. (2000). Evidence sets approach for Web fault
diagnosis. Malaysian Journal of Computer Science, 13(1), 84-89.
Christensen, K., & Javagal, N. (1997). Prediction of future world wide Web traffic characteristics for capacity planning. International Journal of Network Management, 7(5), 264-276.
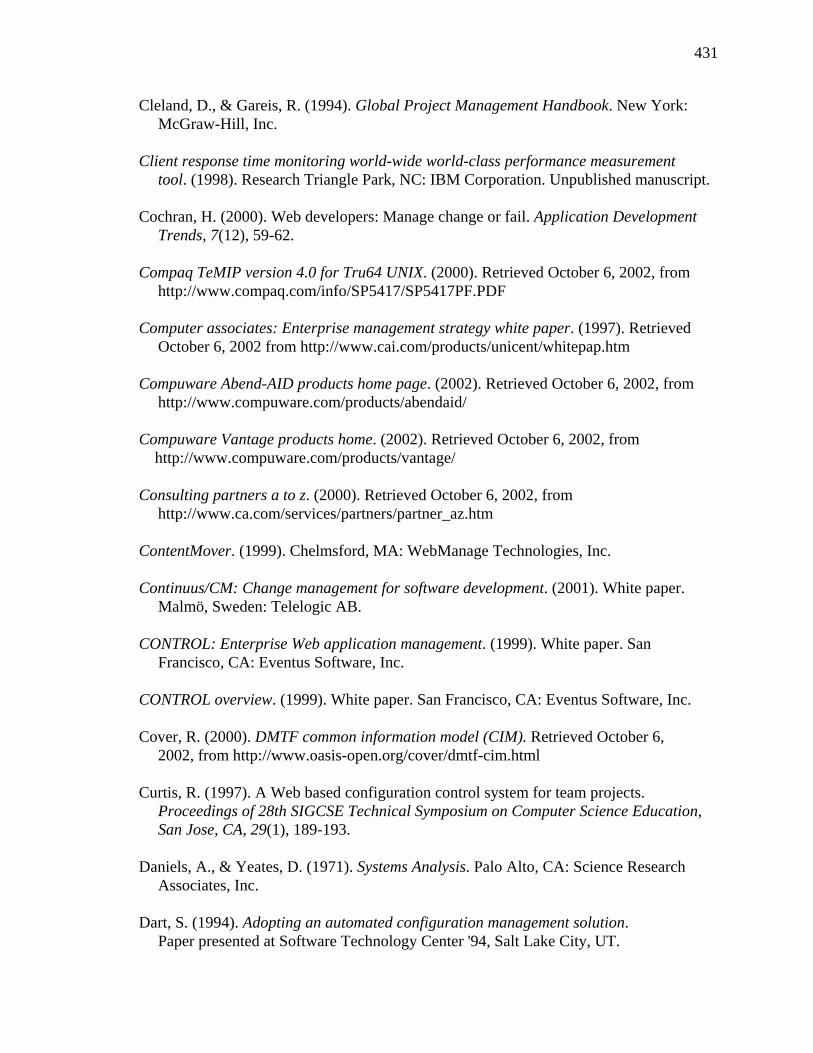
431
Cleland, D., & Gareis, R. (1994). Global Project Management Handbook. New York: McGraw-Hill, Inc.
Client response time monitoring world-wide world-class performance measurement
tool. (1998). Research Triangle Park, NC: IBM Corporation. Unpublished manuscript. Cochran, H. (2000). Web developers: Manage change or fail. Application Development
Trends, 7(12), 59-62.
Compaq TeMIP version 4.0 for Tru64 UNIX. (2000). Retrieved October 6, 2002, from http://www.compaq.com/info/SP5417/SP5417PF.PDF
Computer associates: Enterprise management strategy white paper. (1997). Retrieved October 6, 2002 from http://www.cai.com/products/unicent/whitepap.htm Compuware Abend-AID products home page. (2002). Retrieved October 6, 2002, from http://www.compuware.com/products/abendaid/ Compuware Vantage products home. (2002). Retrieved October 6, 2002, from http://www.compuware.com/products/vantage/ Consulting partners a to z. (2000). Retrieved October 6, 2002, from
http://www.ca.com/services/partners/partner_az.htm
ContentMover. (1999). Chelmsford, MA: WebManage Technologies, Inc. Continuus/CM: Change management for software development. (2001). White paper.
Malmö, Sweden: Telelogic AB. CONTROL: Enterprise Web application management. (1999). White paper. San
Francisco, CA: Eventus Software, Inc. CONTROL overview. (1999). White paper. San Francisco, CA: Eventus Software, Inc. Cover, R. (2000). DMTF common information model (CIM). Retrieved October 6,
2002, from http://www.oasis-open.org/cover/dmtf-cim.html Curtis, R. (1997). A Web based configuration control system for team projects.
Proceedings of 28th SIGCSE Technical Symposium on Computer Science Education, San Jose, CA, 29(1), 189-193.
Daniels, A., & Yeates, D. (1971). Systems Analysis. Palo Alto, CA: Science Research
Associates, Inc. Dart, S. (1994). Adopting an automated configuration management solution.
Paper presented at Software Technology Center '94, Salt Lake City, UT.
432
Dart, S. & Krasnov, J. (1995). Experiences in risk mitigation with configuration management. Paper presented at the 4th Conference on Software Risk, Monterey, CA.
Database 2 Messages Reference. (1995). New York: IBM Corporation.
Day, B. (1992). Implementing automated operations - A user's experience. Capacity Management Review, 20(11), 5-7.
DCE-RPC interoperability (XDSA-DCE) - Introduction. (1997). Retrieved October 6,
2002 from http://www.opengroup.org/onlinepubs/009656999/chap1.htm DCE overview. (1996). Retrieved October 6, 2002, from
http://www.opengroup.org/dce/info/papers/tog-dce-pd-1296.htm Debar, H., Huang, M., & Donahoo, D. (1999). Intrusion detection exchange format
data model. Retrieved October 6, 2002, from http://www.ietf.org/proceedings/99nov/I-D/draft-ietf-idwg-data-model-00.txt
Desmond, J. (1990). Culture clash at Research Triangle Park. Software Magazine, 10(14), 47-51.
Developing Visio Solutions. (1997). Seattle, WA: Visio Corporation. Dictionary of Computing. (1987). Poughkeepsie, NY: IBM Corporation. Distributed management task force, inc. (1999). Retrieved November 24, 2002, from http://www.dmtf.org/about/index.php DMTF standards and specifications: Understanding the application management
model. (1998). Retrieved February 24, 2002, from http://www.dmtf.org/standards/index.php
Dr. ecommerce answers your questions - European commission information society
directorate general. (2000). Retrieved February 24, 2002, from http://europa.eu.int/ISPO/ecommerce/drecommerce/answers/000014.html
DSL: Copper mountain and Xedia partner to deliver traffic shaping and management control in digital subscriber line networks. Offers carriers and DSL service providers IP quality of service for Internet access. (1998). EDGE: Work-Group Computing Report, 31(8), 1-3.
E-Commerce Construction Kit User's Guide. (2001). Belmont MA: Boomerang
Software, Inc.
433
Elder-Vass, D. (2000). MVS Systems Programming. Retrieved February 24, 2002, from http://www.mvsbook.fsnet.co.uk/index.htm
Eloff, M., & Von Solms, S. (2000). Information security management: A hierarchical
framework for various approaches. Computers and Security, 19(3), 243. Endler, M., & Souza, A. (1996) Supporting distributed application management in Sampa.
Proceedings of the Third International Conference on Configurable Distributed Systems, Annapolis, MD, 177-184.
Enterprise distributed computing. (2000). Retrieved February 24, 2002, from http://www.dstc.edu.au/Research/Projects/EDOC/ODPEL.html Enterprise reporter. (1999). Chelmsford, MA: WebManage Technologies, Inc. Environmental Record Editing and Printing Program. (1999). Poughkeepsie, NY: IBM
Corporation.
Event management and notification - White paper. (2000). Houston, TX: BMC Software, Inc. Evidian products. (2001). Retrieved February 24, 2002 from
http://www.ism.bull.net/products/
Fearn, P., Berlen, A., Boyce, B. & Krupa, D. (1999). The Systems Management Solution Life Cycle. Research Triangle Park, NC: IBM Corporation.
Feit, S. (1996). TCP/IP Architecture, Protocols, and Implementation with IP v6 and IP
Security. New York: McGraw-Hill. Finkel, A., & Calo, S. (1992). RODM: A control information base. IBM Systems Journal,
31(2), 252-269. First annual report. United States Government Working Group on Electronic Commerce (1998). Retrieved February 20, 2002, from http://www.ecommerce.gov/usdocume.htm Flanagan, P. (1996). 10 hottest technologies in telecom. Telecommunications, 30(5),
29-38. Foote, S. (1997a). Managing applications. DBMS, 10(11), 52-54, 56, 60, 62. Foote, S. (1997b). Managing applications in a wired world. Retrieved November 14,
2002 from http://www.novadigm.com/pdf/hurwitz.pdf Fosdick, H. (1998). Performance monitoring's cutting edge. Database Programming & Design, 5(11), 50-56.

434
FREE DESK - Help desk software. (2000). Retrieved February 24, 2002, from http://freedesk.wlu.edu/
Freed, N., & Kille, S. (1998). Network services monitoring MIB. Retrieved February 24,
2002 from http://www.faqs.org/rfcs/rfc2248.html Frick, Vaughn. (2000). Transforming the enterprise to embrace e-business. (Available
from Gartner, Inc. 56 Top Gallant Road, Stamford, CT 06904) Gaffaney, N., & Carlin, N. (1998). Implementing business systems management with
global enterprise manager. The Managed View, 2(2), 55-70. Gallagher, S. (1998). ProVision: The unframework. Retrieved February 28, 2002, from
http://www.informationweek.com/673/73olplt.htm Garg, A. (1998). Is it the network or the application? (Available from Enterprise
Management Associates 2108 55th Street, Suite 110 Boulder, CO 80301) Garg, A., & Schmidt, R. (1999). Get proactive (network performance management).
Communication News, 36(9), 73-74. Geschickter, C. (1996a). Applications management: An unmet user requirement. Framington, MA: Hurwitz Group, Inc. Geschickter, C. (1996b). Application management defined: The application dependency
stack. Framington, MA: Hurwitz Group, Inc. Gillooly, C. (1999). E-business management: Solving the next management challenge.
White paper. Framington, MA: Hurwitz Consulting Group, Inc. Gilly, D. (1994). UNIX in a Nutshell. Sebastopol, CA: O'Reilly & Associates. Goedicke, M., & Meyer, T. (1999). Web based tool support for dynamic management of
distribution and parallelism in integrating architectural design and performance evaluation. Proceedings of the International Symposium on Software Engineering for Parallel and Distributed Systems, Los Angeles, CA, 156-163.
Gulla, J. (1991). Multiple virtual storage (MVS) concepts, job control language (JCL),
and utilities: Student handout. Wayne, PA: International Business Machines. Unpublished educational materials.
Gulla, J. (1997). Ethernet local area networks - Their relationship to network management in the context of a computer network. Unpublished manuscript.
Gulla, J., & Hankins, J. (2001). Web site monitoring and management perspectives: A
readiness-evaluation methodology. Retrieved November 24, 2002, from http://www.isoc.org/inet2001/CD_proceedings/index.shtml
435
Gulla, J. & Hankins, J. (2002). Ensuring High Web Application Availability Through An Effective Monitoring Framework That Combines Both Empirical and Experiential Dimensions. Proceedings of the IBM Academy of Technology High Availability Best Practices Conference, July 10-12, 2002, Ontario, Canada.
Gulla, J., & Siebert, E. (2001). Monitoring implementation planning: A key activity to
bridge engagement and transition for the monitoring of a customer's Web site. Poster Session presented at the IBM Professional Leadership Technical Exchange, San Francisco, CA.
Gulla, J., & Warren, R. (1998). Deploying a business system solution. Proceedings of the
Planet Tivoli Conference, May 18-21, 1998, Orlando, FL. Gumbold, M. (1996). Software distribution by reliable multicast. Proceedings of LCN -
21st Annual Conference on Local Computer Networks, Minneapolis, MN, 222-231. Hahn, K., & Bruck, R. (1999). Web based design tools for MEMS process configuration.
Proceedings of International Conference on Modeling and Simulation of Microsystems, San Juan, Puerto Rico, 346-349.
Harikian, V., Blust, B., Campbell, M., Cooke, S., Foley, R., Gulla, J., Gayo, F., Howlette, M., Mosher, L., & O'Mara, M. (1996). Distributed Systems Management Design Guidelines: The Smart Way to Design. Research Triangle Park: International Business Machines. Hariri, S., & Mutlu, H. (1995). Hierarchical modeling of availability in distributed systems. IEEE Transactions on Software Engineering, 21(1), 50-56. Hellerstein, J., Zhang, F., & Shahabuddin, P. (1998). Characterizing normal operation of a
Web server: Application to workload forecasting and problem detection. CMG Proceedings, Turnersville, NJ, 1, 150-160.
Help desk, Web call center and diagnostic software. (2001). Retrieved February 27,
2002, from http://www.support.com/solutions/products/productsoverview.asp Hodges, J. (2000). An LDAP roadmap & FAQ. Retrieved February 20, 2002, from
http://www.kingsmountain.com/ldapRoadmap.shtml Hong, J., Gee, G., & Bauer, M. (1995). Towards automating instrumentation of systems
and applications for management. Proceedings of GLOBECOM '95, Communications for Global Harmony, Singapore, 1, 107-111.
436
Hong, J., Katchabaw, M., Bauer, M., & Lutfiyya, H. (1995). Modeling and management of distributed applications and services using the OSI management framework. Proceedings of Information Highways from a Smaller World and Better Living '95, 12th Annual International Conference on Computer Communication, Seoul, South Korea, 215-220.
Horrocks, I. (2001). Security training: Education for an emerging profession (Is security
management a profession?). Computers and Security, 20(3), 219-226. Horwitt, E. (2000). CIM creeps ever closer. Retrieved February 26, 2002, from
http://www.nwfusion.com/news/1999/0621cim.html Hosted help desk - Web-based help desk software application service provider.
(2000). Retrieved February 26, 2002, from http://www.hostedhelpdesk.com/ Hough, D. (1993). Rapid delivery: an evolutionary approach for application development. IBM Systems Journal, 32(3), 397-419. How to collect Chassis information (including the Chassis serial number) for routers and
Catalyst switches using SNMP. (2002). Retrieved May 18, 2002, from http://www.cisco.com/warp/public/477/SNMP/chassis.shtml
HP OpenView directions. (1998). Retrieved February 26, 2002, from
http://www.openview.hp.com:80/pdfs/22.pdf Huang, G., Yee, W., & Mak, K. (2001). Development of a Web-based system for
engineering change management. Robotic Computer Integrated Manufacturing, 17(3), 255-267.
Huh, S., & Bae, K. (1999). Dynamic Web server construction on the Internet using a
change management framework. International Journal of Intelligent Systems in Accounting, Finance and Management, 8(1), 45-60.
Hurwitz, J. (1996). The application dependency stack. DBMS, 13(9), 8-9. Hurwitz, J. (1997). Not just technology: Organizational issues in developing an
applications management strategy. DBMS, 3(10), 10, 12. Hurwitz, J. (1998). World class business requires 100% application availability. White
paper. Framington, MA: Hurwitz Consulting Group, Inc. Hussain, D., & Hussain, K. (1985). Information Processing Systems for Management.
Homewood, IL: Richard D. Irwin, Inc. IBM Thinkpad 760 EL User's Guide. (1996). New York: IBM Corporation.

437
Information technology - Portable operating system interface - POSIX (r) - System administration. Part 2: Software administration. (1995). Retrieved February 20, 2002, from http://standards.ieee.org/reading/ieee/std_public/description/posix/1387.2-1995_desc.html
Integrated systems management. (2000). (Available from Global Communications,
Hanson Cooke, 1-3 Highbury Station Road, London N1 1SE, UK) Integration overview. (2001). Retrieved February 27, 2002
from http://www.tivoli.com/products/documents/whitepapers/io.html International Business Machines. (1996, May). External design specification. (Document
Number: D138.DOC). Quezon City, Philippines: Angelica Salvacion-Bala. Interscan Webmanager. (2000). Retrieved February 27, 2002, from
http://www.antivirus.com/products/Webmanager Introducing Windows 95. (1995). Seattle, WA: Microsoft Corporation. Irlbeck, B. (1992). Network and system automation and remote system operation. IBM
Systems Journal, 31(2), 206-222. ISO DP 7489/4: Information processing systems--ISO reference model--Part 4:
Management framework. (1986). Geneva, Switzerland: International Organization for Standardization.
ISO - International organization for standardization. (1999). Retrieved February 25,
2002, from http://www.iso.ch/iso/en/aboutiso/introduction/achievements.html Jackson, J., & McClellan, A. (1996). JAVA by Example. Mountain View, CA: Sun Microsystems, Inc. Jackson, R., & Embley, D. (1996). Using joint application design to develop readable formal specifications. Information and Software Technology, 38(10), 615-631. Jander, M. (1998). Clock watchers. Data Communications, 27(13), 75-80. JAVA management extensions home page. (1999). Retrieved February 20, 2002, from http://java.sun.com/products/JavaManagement/ JAVA management extensions white paper. (1999). Retrieved February 27, 2002, from http://java.sun.com/products/JavaManagement/wp/ Job scheduling server for Windows NT. (2001). Retrieved February 27, 2002, from
http://members.home.net/microwork/
438
Joining the IETF. (2000). Retrieved February 27, 2002, from http://www.ietf.org/join.html Jutla, D., Ma, S., Bodorik, P., & Wang, Y. (1999). WebTP: A benchmark for Web-based order management systems. Proceedings of the 32nd Hawaii International
Conference of System Sciences, HICSS-32, 341-351. Kalbfleisch, C., Krupczak, C., & Presuhn, R. (1999). Application management MIB.
Retrieved February 27, 2002, from http://www.faqs.org/rfcs/rfc2564.html Karpowski, W. (1999). Computer associates Unicenter TNG framework. White paper.
Retrieved February 20, 2002 from http://www.neccomp.com/servers/osservmanage/TNGFrameworkWhitePaper.pdf
Katchabaw, M., Lutfiyya, H., Marshall, H., & Bauer, M. (1996). Policy-driven fault management in distributed systems. Proceedings of the Seventh International Symposium on Software Reliability Engineering, White Plains, NY, 236-245. Kay, A. (1999, September 13). Bottom-line management--Companies seek a business-
oriented view of their enterprise information systems. Information Week, 124. Keahey, K. (2000). A brief tutorial on CORBA. Retrieved February 20, 2002, from
http://www.cs.indiana.edu/hyplan/kksiazek/tuto.html Keynote perspective brochure: Assuring peak Web-site performance and quality of
service. (2000). Retrieved February 20, 2002, from http://www.keynote.com/solutions/html/resource_product_research_libr.html
Keynote systems services. (2000). Retrieved February 27, 2002, from
http://www.keynote.com/services/downloads/whitepapers/wp_ecommerce.html Kille, S. (1998) Why do I need a directory when I could use a relational database?
Retrieved February 27, 2002, from the Stanford University Web site: http://www.stanford.edu/%7Ehodges/talks/EMA98-DirectoryServicesRollout/ Steve_Kille/index.htm
Kramer, J., Magee, J., Ng, K., & Sloman, M. (1993). The system’s architect’s assistant for design and construction of distributed systems. Proceedings of the Fourth Workshop on Future Trends of Distributed Computing Systems, Lisbon, Portugal,
284-290. Krapf, E. (2001). Check point beefs up security software. Business Communications
Review, 31(4), 77. Kroenke, D., & Dolan, K. (1987). Business Computer Systems. Santa Cruz, CA: Mitchell
Publishing, Inc.
439
Krupczak, C., & Saperia, J. (1998). Definition of system-level managed objects for applications. Retrieved February 20, 2002, from ftp://ftp.isi.edu/in-notes/rfc2287.txt
Ku, H., Forslow, J., & Park, J. (2000). Web based configuration management architecture
for router networks. Proceedings of Network Operations and Management Symposium, The Networked Planet: Management Beyond 2000, Honolulu, HI, 173-186.
Kundtz, J. (1996). Implementing problem management processes at the helpdesk using the
business process method. Proceedings of the 1996 8th Annual Quest for Quality and Productivity in Health Service Conference, Norcross, GA, 350-356.
LAN Network Manager for OS/2 Reference. (1997). Research Triangle Park, NC: IBM
Corporation.
Leadership for the new millennium, delivering on digital progress and prosperity. The third annual report of the electronic commerce working group. (2001). Retrieved February 28, 2002, from http://www.ecommerce.gov/
Learn CIM. (1999). Retrieved February 27, 2002, from http://www.dmtf.org/education/cimtutorial.php Lendenmann, R., Nelson, J., Lara, C., & Selby, J. (1997). An Introduction to Tivoli's
TME 10. Austin, TX: IBM Corporation. Leoni, M., Trainotti, M., & Valerio, A. (1999). Applying software configuration
management in Web site development. Proceedings of Systems Configuration Management, 9th International Symposium, Toulouse, France, 1675, 34-37.
Levitt, J. (1997). Rating the push products. Informationweek, 628(28), 53-59. Lewis, L., & Ray, P. (1999). Service level management definition, architecture, and
research challenges. Proceedings of Global Telecommunications Conference, GLOBECOM'99, Rio de Janeiro, Brazil, 1974-1978.
Long, L. (1989). Management Information Systems. Englewood Cliffs, NJ: Prentice Hall. Loyola, R. (1998). Capacity management software. Retrieved February 27, 2002, from
http://www.ntsystems.com/db_area/archive/1998/9807/207r2.shtml Maltinti, P., Mandorino, D., Mbeng, M., & Sgamma, M. (1996). OSI system and
application management: an experience in a public administration context. Proceedings of the 1996 IEEE Network Operations and Management Symposium, Kyoto, Japan, 2, 492-500.
Mangold, B., & Brandner, R. (1993). Systems and Network Management in Distributed
Environments. Research Triangle Park, NC: IBM Corporation.

440
Mark, R., & Nielsen, J. (1994). Usability Inspection Methods. New York: John Wiley & Sons.
Martin, P. (1996). A management information repository for distributed applications management. Proceedings of the 1996 International Conference on Parallel and Distributed Systems, ICPADS 1996, Tokyo, Japan, 472-477. Mason, R. (1998). WebSpectrive. White paper. Framington, MA: International Data
Corporation. Mason, R. (2001). Enterprise management becomes infrastructure management, an IDC
white paper. Framingham, MA: International Data Corporation. Mattison, R. (1997). Understanding Database Systems. New York: McGraw-Hill. Mazurek, G. (1998, August 31). Real reseller opportunity lies in services. Computer
Reseller News, 71. McQuillen, K. (1975). System/360-370 Assembler Language (OS). Fresno, CA:
Mike Murach & Associates, Inc. Menasce, D., & Almeida, V. (1999). Evaluating Web server capacity. Web Technology,
4(4), 47-51. Merant PVCS. (2001). Retrieved February 27, 2002, from http://www.merant.com/products/pvcs/ Microcode - Webopedia definition and links. (2001). Retrieved February 27, 2002, from http://Webopedia.internet.com/TERM/M/microcode.html Microsoft Word User's Guide. (1994). Seattle, WA: Microsoft Corporation. Miller, P. (1994). Integrated system management design considerations for a
heterogeneous network and system management product. IEEE Symposium Record on Network Operations and Management, NOMS'94, Kissimmee, FL, 2, 555-575.
Modiri, N. (1991). The ISO reference model entities. IEEE Network, 5(4), 24-33. Mohan, C., Pirahesh, H., Tang, W., & Wang, Y. (1994). Parallelism in relational database
management systems, IBM Systems Journal, 33(2), 349-371. Muller, N. (1998). Digital equipment corp.’s Polycenter framework. Retrieved
February 27, 2002, from http://www.ddx.com/polyctr.html Nash, E. (1999). Catch of the day. Unix NT News, 26, 39-40, 42.

441
NetIQ AppManager suite architecture overview. (2001). Retrieved February 20, 2002, from http://www.express.com.au/software/netiq/netiq_appmanager_architectural.html
NetIQ AppManager suite overview. (2001). Retrieved February 20,
2002, from http://www.netiq.com/products/am/default.asp NetView Database Guide. (1997). Research Triangle Park, NC: Tivoli Systems. NetView for OS/390 Application Programmer's Guide. (2001). Research Triangle Park,
NC: Tivoli Systems. NetView for OS/390 Planning Guide. (1997). Research Triangle Park, NC: Tivoli
Systems. NetView User's Guide. (2001). Research Triangle Park, NC: Tivoli Systems. Network management. (2001). Retrieved February 28, 2002, from
http://www.managementsoftware.hp.com/solutions/categories/networkmgmt/index.asp Neumair, B. (1998). Distributed application management based on ODP viewpoint
concepts and CORBA. IEEE Symposium Record on Network Operations and Management, NOMS'98, New Orleans, LA, 2, 559-569.
New Netscape extension enables seamless integration of Netscape application server with existing enterprise applications and systems. (1998). Retrieved February 28, 2002,
from http://home.netscape.com/newsref/pr/newsrelease606.html NovaStor - Backup, encryption, and data interchange software. (2001). Retrieved
February 28, 2002, from http://www.novastor.com/ Olsen, F. (1998). Army corps of engineers keeps tabs on data use. Government Computer
News, 29(17), 1. Open system interconnection (OSI) protocols. (1999). Retrieved February 28, 2002,
from http://www.cisco.com/univercd/cc/td/doc/cisintwk/ito_doc/osi_prot.htm OpenVision tech unveils C/S strategy. (1994, August 22). Computer Reseller News, 12. OS/VS2 MVS Overview. (1980). New York: International Business Machines. Osel, P., & Gansheimer, W. (1995). OpenDist incremental software distribution. Proceedings of the Ninth Systems Administration Conference, LISA IX, Monterey, CA,
181-193.

442
Overview and installation of the SysMan software manager. (2001). Retrieved February 28, 2002, from http://gatekeeper.dec.com/pub/SysManSwMgr/00README.txt
Overview of parallel concurrent processing. (2002). Retrieved May
17, 2002, from http://sandbox.aiss.uiuc.edu/oracle/nca/fnd/parallel.htm
Overview of wired for management (WfM) baseline 2.0. (2000). Retrieved February 27, 2002, from http://developer.intel.com/ial/WfM/wfmover.htm
Patrol enterprise manager - White paper. (2001). Retrieved February 27, 2002, from
http://www.bmc.com/products/document/00039757/09003201804f386f.html Patrol 2000 by BMC software. (2000). Retrieved February 28, 2002, from
http://www.bmc.com/products/esm/index.html Platform SiteAssure. (2000). Retrieved February 28, 2002, from http://www.platform.com/products/rm/siteassure/index.asp Platinum technology emerges as enterprise management leader with major expansion
of platinum provision. (1998). Retrieved February 28, 2002, from http://ca.com/press/platinum_archive/provpf.htm
Pratt, P. (1990). A Guide to SQL. Boston, MA: Boyd & Fraser Publishing Company. Products - ASG-impact product details. (2001). Retrieved February 28, 2002, from
http://www.asg.com/products/product_details.asp?id=31 Puka, D., Penna, M., & Prodocimo, V. (2000). Service level management in ATM
networks. Proceedings of the International Information Technology Conference on Coding and Computing, Las Vegas, NV, 324-329.
Purvis, R., & Sambamurthy, V. (1997). Examination of designer and user perceptions of JAD and the traditional IS design methodology. Information and Management, 32(3), 123-135. Queen’s University database systems laboratory. (n.d.). Retrieved March 1,
2002, from the Queen's University Web site: http://www.qucis.queensu.ca/home/cords/database_lab.html
Queen’s University MANDAS research WWW server. (n.d.). Retrieved March 1,
2002, from the Queen's University Web site: http://www.qucis.queensu.ca/home/cords/mandas-queens.html
443
Reliable software. (2001). Retrieved February 28, 2002, from http://www.relisoft.com/ Remedy action request system. (2001). Retrieved February 28, 2002, from
http://www2.remedy.com/solutions/core/datasheets/arsystem.htm Remedy discovery services for Intel LANdesk.. (2000). Retrieved February 28, 2002,
from http://www2.remedy.com/solutions/ebis/itsm/datasheets/discovery-landesk.htm
Rennhackkamp, M. (1997). System sprawl: New tools for managing distributed enterprises. DBMS, 5(10), 67-75. Rhee, Y., Park, N., & Kim, T. (2000). Heuristic connection management for improving
server side performance. Proceedings of Open Hypermedia Systems and Structural Computing, San Antonio, TX, 1903, 31-37.
Richardson, R. (1998, April 1). Software distribution: Does it deliver? Network World, 1-9. Router products configuration guide. (2001). Retrieved February 28, 2002, from
http://www.cisco.com/univercd/cc/td/doc/product/software/ios11/cbook/cdspu.pdf Rubin, A., Geer, D., & Ranum, M. (1997). Web Security Sourcebook. New York:
John Wiley & Sons, Inc. Russinovich, M. (1999). NT vs. UNIX: Is one substantially better. Retrieved
February 28, 2002, from http://www.winntmag.com/Articles/Index.cfm?IssueID=97&ArticleID=4500
Ryan, K. (1993). Six ways to boost mainframe productivity. Datamation, 39(10), 72-74. Rymer, J. (1995). Direct application management: Direct management of application modules solves a crucial need. Boston, MA: Patricia Seybold Group. Sandoval, G. & Dignan, L. (2001). Amazon analyst say fourth quarter real test. Retrieved
February 28, 2002, from http://www.zdnet.com/zdnn/stories/news/0,4586,5098607,00.html
SAP output management, forms overlay, report distribution, archiving, and retrieval.
(2001). Retrieved February 28, 2002, from http://www.cypressdelivers.com/sap.htm Schade, A., Trommler, P., & Kaiserswerth, M. (1996). Object instrumentation for
distributed applications management. Proceedings of the IFIP/IEEE International Conference on Distributed Platforms: Client/Server and Beyond: DCE, CORBA, ODP, and Advanced Distributed Applications, ICDP'96, Dresden, Germany, 173-185.

444
SCIS help: HTML and your Web page. (1999). Retrieved February 28, 2002, from the the Nova Southeastern University Web site:
http://scis.nova.edu/NSS/Help/Webpage.html SDS helpdesk software. (2001). Retrieved February 28, 2002, from
http://www.ScottDataSystems.com/ Server consolidation methodology. (2001). White paper. Houston, TX: BMC Software,
Inc. Server resource management fact sheet. (2000). Retrieved February 28, 2002, from
http://srmWeb.raleigh.ibm.com/servlet/com.ibm.srm.servlet.gui.SrmBeginHere? Service level agreements. (2001). Retrieved February 28, 2002 from
http://www.uu.net/customer/sla/ Service level reporter. (1999). Chelmsford, MA: WebManage Technologies, Inc. Schmidt, D. (2001). Overview of CORBA. Retrieved February 28, 2002 from
http://www.cs.wustl.edu/~schmidt/corba-overview.html Shukla, R., & McCann, J. (1998). TOSS: TONICS for operation support systems: System
management using the world wide Web and intelligent software agents. Proceedings of Network Operations and Management Symposium, NOMS'98, New Orleans, Louisiana, 1, 100-109.
Siyan, K. (2000). Network management for Microsoft networks using SNMP. Retrieved
February 28, 2002, from http://www.microsoft.com/technet/treeview/default.asp?url=/TechNet/prodtechnol/win ntas/maintain/featusability/networkm.asp
Slater, P. (1999). PCFONFIG: A Web based configuration tool for build to order
products. Proceedings of ES98, the 18th Annual International Conference of the British Computer Society Specialist, Applications and Innovations in Expert Systems, Cambridge, England, 27-41.
Snell, M. (1997). Spec puts applications management in arm's reach. LANTIMES, 14(15),
1. SNMP MIB support: IBM HTTP server. (2001). Retrieved February 20, 2002, from
http://www-4.ibm.com/software/Webservers/appserv/doc/v35/ae/ infocenter/ihssun/9acmib.htm
Sobel, K. (1996a). Application management: It's not just technology. Framington, MA:
Hurwitz Group, Inc.
445
Sobel, K. (1996b). Creating an applications management strategy. Framington, MA: Hurwitz Group, Inc.
Sobel, K. (1996c). HP and Tivoli announce performance management API. Framington,
MA: Hurwitz Group, Inc. Sobel, K. (1996d). Navigating the application management hype. Framington, MA:
Hurwitz Group, Inc. Sobel, K. (1997). Application management standards: Instrumenting applications for
management. Framington, MA: Hurwitz Group, Inc. Software Distributor Administration Guide. (2001). Retrieved February 28, 2002, from
http://docs.hp.com/hpux/onlinedocs/B2355-90740/B2355-90740.html Solstice Enterprise Manager. (2001). Mountain View, CA: SunSoft, Inc. Solstice enterprise manager 2.1: A technical white paper. (1997). Palo Alto, CA: Sun Microsystems, Inc. SPARCstation 5 Installation Guide. (1996). Palo Alto, CA: Sun Microsystems. Spectrum Concepts Guide. (1996). Rochester, NH: Cabletron Systems. Spectrum Enterprise Manager: Getting Started with Spectrum for Operators. (1998). Rochester, NH: Cabletron Systems. Spectrum/NV-S Gateway User's Guide. (1998). Rochester, NH: Cabletron Systems. Spuler, D. (2000). Web-based enterprise management for a standardized world.
Retrieved February 28, 2002, from http://www.bmc.com/products/whitepapers.cfm Starbase corporation: Configuration management. (2001). Retrieved March 3,
2002, from http://www.starbase.com/products/starteam/ Start, K., & Patel, A. (1995). The distribution management of service software. Computer Standard Interfaces, 17(3), 291-301. Straus, F., Schoenwaelder, J., Braunschweig, T., & McCloghrie, K. (2001). SMIng - Next generation structure of management information. Retrieved February 28, 2002,
from http://search.ietf.org/internet-drafts/draft-ietf-sming-02.txt StreamServe overview. (2001). Retrieved February 28, 2002, from http://www.streamserve.com/default.asp?ItemID=498 Sturdevant, C. (1999). Ready, set, deploy! PC Week, 22(16), 70-75.

446
Sturm, R. & Bumpus, W. (1999). Foundations of Application Management. New York: John Wiley & Sons.
Sturm, R., & Weinstock, J. (1995). Application MIBs: Taming the software beast. Data
Communications, 24(15), 85-92. Symantec first to provide anti-virus and enterprise security management protection against recently issued fraudulent VeriSign digital certificates. (2001). Software Industry Report, 33(7), 1. System management: Application response measurement (ARM) API. (1998). Retrieved
February 20, 2002, from http://www.opengroup.org/publications/catalog/c807.htm System management tools. (1996). DBMS, 6(9), 87-88. System software: Product intros. (1997, October 8). ENT, 2(15), 42. Szabat, M., & Meyer, G. (1992). IBM network management strategy. IBM Systems
Journal, 31(2), 154-160. Szymanski, R., Szymanski, D., Morris, N., & Pulschen, D. (1988). Introduction to
Computers and Information Systems. Columbus, OH: Merrill Publishing Company. Talluru, L., & Deshmukh, A. (1995). Problem management in decision support systems: a
knowledge-based approach. Proceedings of the IEEE International Conference on Systems, Man and Cybernetics, Vancouver, BC, 3, 1957-1962.
Tanaka, H., & Ishii, H. (1995). Service operation and management architecture using
surveillance of application software elements. Proceedings of Global Telecommunications Conference, GLOBECOM'95, Singapore, 3, 13-17.
TeMIP OSS framework overview. (2001). Retrieved November 24, 2002, from http://www.openview.hp.com/products/tmpfw/index.asp TeMIP OSI management toolkit. (1999). Retrieved February 28, 2002, from
http://apache.ethz.ch/docu/sysman/dllgzaa3.html Text-based configuration management. (2001). White paper. Malmö Sweden: Teleogic
AB. The IETF application area. (2000). Retrieved February 28, 2002, from
http://www.apps.ietf.org/apps-area.html The Information Technology Process Model: A New Model for Managing the
Information Technology Business. (1995). New York: IBM Corporation.

447
The Java tutorial. (1999). Retrieved February 28, 2002, from http://www.javasoft.com/docs/books/tutorial/index.html.
The open group adopts the ARM API as its standard for application instrumentation. (1999). Retrieved February 28, 2002, from
http://www.tivoli.com/news/press/pressreleases/en/1999/opengroup_adopts_arm.html The portable applications standards committee. (2000). Retrieved February 28, 2002,
from http://www.pasc.org Thompson, P., & Sweitzer, J. (1997). Successful practices in developing a complex
information model. Proceedings of the Conceptual Modeling – ER ’97 Conference, 16th International Conference on Conceptual Modeling, Los Angeles, CA, 376-393.
TIDAL software - Sys*ADMIRAL. (2001). Retrieved February 27, 2002,
from http://www.tidalsoft.com/products/sysadmiral/index.htm Tisdale, C. (1998). JOPES design and project plan. Research Triangle Park, NC: Tivoli
Systems, Inc. Unpublished manuscript. Tivoli business partners (2001). Retrieved February 27, 2002 from
http://www.tivoli.com/Tivoli_Channels/WebPartners.nsf/Tivoli+Partner?OpenForm. Tivoli developer kit for PowerBuilder concepts and facilities white paper. (1996). Austin, TX: Tivoli Systems, Inc. Tivoli distributed monitoring. (1999). Retrieved February 27, 2002, from
http://www.tivoli.com/products/index/distmon/. Tivoli Global Enterprise Manager Instrumentation Guide. (1998). Raleigh, NC: Tivoli Systems. Tivoli Manager for MCIS User's Guide. (1998). Austin, TX: Tivoli Systems. Tivoli Manager for Oracle Reference Guide V2.0. (2000, December). Austin, TX: Tivoli
Systems. Tivoli Module Builder User’s Guide. (1998). Research Triangle Park, NC: IBM
Corporation. Tivoli module designer. (1998). Retrieved February 27, 2002, from http://www.tivoli.com/products/index/module_designer/ Tivoli operations planning and control. (2001). Retrieved February 17, 2002 from
http://www.tivoli.com/products/index/opc/index.html

448
Tivoli product index. (2001). Retrieved February 27, 2002, from http://www.tivoli.com/products/index/
Tivoli service desk for OS/390 - INFOMAN. (2001). Retrieved February 27, 2002, from
http://www.tivoli.com/products/index/service_desk_390/infoman.html Tivoli service desk for OS/390 - Datasheet. (2001). Retrieved February 27, 2002, from
http://www.tivoli.com/products/index/service_desk_390/sd390_driection.html Tivoli solutions. (2001). Retrieved March 3, 2002 from
http://www.tivoli.com/products/solutions/ TME 10 Inventory User's Guide. (1998). Austin, TX: Tivoli Systems. TME 10 Software Distribution. (1998). Austin, TX: Tivoli Systems.
Tong, L. (1996). Data compression for PC software distribution. Software Practical Experience, 26(11), 1181-1195. Tsaoussidis, V., & Liu, K. (1998). Network management and operations: Application
oriented management in distributed environments. Proceedings of Third Symposium on Computers and Communications, ISCC'98, Athens, Greece, 130-134.
Tschichholz, M., Hall, J., Abeck, S., & Wies, R. (1995). Information aspects and future
directions in an integrated telecommunications and enterprise management environment. Journal of Network and Systems Management, 3(1), 111-138.
Tuning the WebLogic Server. (2000). Retrieved May 14, 2002 from http://www.Weblogic.com/doc51/admindocs/tuning.html Turner, R. (1998). USAA Internet member services business system specification.
Research Triangle Park, NC: Tivoli Systems, Inc. Unpublished manuscript. Turner, R. (1999). IBM REQCAT Web business system. Research Triangle Park, NC:
Tivoli Systems, Inc. Unpublished manuscript. TUSS system specifications. (2001). Retrieved November 24, 2002, from
http://www.outputmanagement.com/html/aboutproduct12.html Udupa, D. (1996). Network Management Systems Essentials. New York: McGraw-
Hill. Understanding the digital economy. (1999). Retrieved February 28, 2002, from the
World Wide Web: http://www.digitaleconomy.gov/

449
UniPress software - Web-based help desk software, CRM and issue management software, development tool. (2001). Retrieved February 27, 2002, from http://www.unipress.com/footprints/
Universal server farm base services. (2000). Somers, NY: IBM Global Services. UNIX and Windows centralized backup solutions for restoring and recovering data on
the network. (2001). Retrieved February 27, 2002, from http://www.syncsort.com/bex/infobex.htm
UNIX Unleashed. (1994). Indianapolis, IN: Sams Publishing. Using Tivoli software installation service for mass installation. (1998). Retrieved
February 27, 2002, from http://publib-b.boulder.ibm.com/Redbooks.nsf/ RedbookAbstracts/sg245109.html?Open
Vallillee, T. (n.d.). SNMP & CMIP an introduction to network management.
Retrieved November 24, 2002, from http://www.geocities.com/SiliconValley/Horizon/4519/snmp.html
Vamgala, R., Cripps, M., & Varadarajan, R. (1992). Software distribution and
management in a networked environment. Proceedings of the Sixth System Administration Conference (LISA VI), Long Beach, CA, 163-170.
Veritas NerveCenter. (2001). Retrieved March 3, 2002 from
http://techupdate.cnet.com/enterprise/0-6133362-720-1885931.html Verton, D. (2000). Security survival training. Federal Computer Week, 14(8), 30-31. Wahl, M., Howes, T., & Kille, S. (1997). Lightweight directory access protocol (V3).
Retrieved November 24, 2002, from ftp://ftp.isi.edu/in-notes/rfc2251.txt Warrier, U., Besaw, L., LaBarre, L., & Handspicker, B. (1990). The common
management information services and protocols for the Internet. Retrieved February 27, 2002, from http://andrew2.andrew.cmu.edu/rfc/rfc1189.html
Weber, D. (1999). CM strategies for RAD. System Configuration Management. 9th
International Symposium, SCM 9. Proceedings (Lecture Notes in Computer Science Vol. 1675), 204-216
Webster's New International Dictionary. (1955). Springfield, MA: G. & C. Merriam
Company. WEBM initiative. (2001). Retrieved February 27, 2002, from http://www.dmtf.org/standards/standard_wbem.php/index.html

450
Welcome to Hewlett-Packard. (2000). Retrieved November 24, 2002, from http://www.hp.com/country/us/eng/welcome.htm
Welter, P. (1999). Web server monitoring white paper. (Available from Enterprise Management Associates 2108 55th Street, Suite 110 Boulder, CO 80301)
Westerinen, A., & Strassner, J. (Eds.). (2000). CIM core model white paper. Retrieved February 17, 2002, from http://www.dmtf.org/var/release/Whitepapers/DSP0111.pdf
Windows NT and Windows 2000 FAQ - How do I use the security configuration and analysis snap-in?. (2000). Retrieved November 24, 2002, from
http://www.windows2000faq.com/Articles/Print.cfm?ArticleID=15290 Woodruff, S. (1999). PCPMM: Port checking and pattern matching monitor documentation and configuration. Schaumburg, IL: IBM Corporation. Yahoo! search results for "capacity management services". (2001). Retrieved November
24, 2002, from http://google.yahoo.com/bin/query?p=%22capacity+management+services%22&hc=0&hs=0
Yang, A., Linn, J., & Quadrato, D. (1998). Developing integrated Web and database applications using JAVA applets and JDBC drivers. Proceedings of the 1998 29th SIGCSE Technical Symposium on Computer Science Education, SIGCSE, New York, 302-306.
Yang, C., & Luo, M. (2000). Building an adaptable, fault tolerant, and highly manageable
Web server on clusters of non dedicated workstations, Proceedings of 2000 International Conference on Parallel Processing, Toronto, Canada, 413-420.
Yemini, A., Kliger, S., Mozes, E., Yemini, Y., & Ohsie, D. (1996). High speed and robust event correlation. IEEE Communications Magazine, 34(5), 82-90. Yucel, S., & Anerousis, N. (1999). Event aggregation and distribution in Web-based management systems. Proceedings of the Sixth International Symposium on Integrated Network Management, IM'99, Boston, MA, 35-48. Yun, J., Ahn, S., & Chung, J. (2000). Fault diagnosis and recovery scheme for Web
server using case based reasoning. Proceedings of the IEEE ICON International Conference on Networks 2000, ICON'2000, Singapore, 495.