Embed Size (px)
Citation preview

RSC Advances
PAPER
Ope
n A
cces
s A
rtic
le. P
ublis
hed
on 2
1 Se
ptem
ber
2020
. Dow
nloa
ded
on 1
/19/
2022
12:
53:3
4 A
M.
Thi
s ar
ticle
is li
cens
ed u
nder
a C
reat
ive
Com
mon
s A
ttrib
utio
n-N
onC
omm
erci
al 3
.0 U
npor
ted
Lic
ence
.
View Article OnlineView Journal | View Issue
Design and form
aDepartment of Pharmaceutics, College of Ph
Hail, Saudi ArabiabDepartment of Pharmaceutics, JSS Colleg
Education and Research, S S Nagar, Mys
[email protected] of Clinical Nutrition, College o
Hail, PO Box 2440, Hail, Saudi ArabiadDepartment of Biology, College of Science
Saudi Arabia. E-mail: drmohdadnan@gmaieBapalal Vaidya Botanical Research Centre,
South Gujarat University, Surat, Gujarat, InfJuggat Pharma, Anchepalya, Kumbalgodu
Karnataka, India
Cite this: RSC Adv., 2020, 10, 34869
Received 30th July 2020Accepted 6th September 2020
DOI: 10.1039/d0ra06611g
rsc.li/rsc-advances
This journal is © The Royal Society o
ulation of polymeric nanospongetablets with enhanced solubility for combinationtherapy
Afrasim Moin, a N. K. Famna Roohi,b Syed Mohd Danish Rizvi,a Syed Amir Ashraf,c
Arif Jamal Siddiqui, d Mitesh Patel, e S. M. Ahmed,f D. V. Gowda*b
and Mohd Adnan *d
Three drugs namely caffeine, paracetamol, and aceclofenac are commonly used for treating various acute
and chronic pain related ailments. These 3 drugs have varied solubility profiles, and formulating them into
a single tablet did not have the desired dissolution profile for drug absorption. The objective of the present
research was to tailor the drug release profile by altering drug solubility. This was achieved by loading the
drug into nanosponges. Here, three-dimensional colloidal nanosponges were prepared using b-
cyclodextrin with dimethyl carbonate as a cross-linker using the hot-melt compression method. The
prepared nanosponges were characterized by FTIR, 1H NMR spectroscopy, DSC, XRPD studies and SEM.
The FTIR and DSC results obtained indicated polymer-drug compatibility. The 1H NMR spectroscopy
results obtained indicated the drug entrapment within nanosponges with the formation of the inclusion
complex. XRPD studies showed that the loaded drug had changed crystalline properties altering drug
solubility. SEM photographs revealed the porous and spongy texture on the surface of the nanosponge.
Box–Behnken experimental design was adopted for the optimization of nanosponge synthesis. Among
the synthesized nanosponges containing paracetamol, aceclofenac and caffeine, batch F3–P31, F3–A31
and F3–C31 were considered optimized. Their particle size was 185, 181 and 199 nm with an entrapment
efficiency of 81.53, 84.96, and 89.28% respectively. These optimized nanosponges were directly
compressed into tablets and were studied for both pre and post-compression properties including in
vitro drug release. The prepared tablet showed desired drug dissolution properties compared to the pure
drug. The above outcomes indicated the applicability of nanosponges in modulating the drug release
with varied solubility for combination therapy.
Introduction
Nanosponges are colloidal structures that can encapsulatea wide variety of substances such as antineoplastic drugs,proteins and peptides, volatile oil, DNA, etc. Nanosponges haveadvantages over microsponges, because the diameter of theformer is less than 1 mm and that of the latter is approximately
armacy, University of Hail, PO Box 2440,
e of Pharmacy, JSS Academy of Higher
uru, 570015, Karnataka, India. E-mail:
f Applied Medical Sciences, University of
, University of Hail, PO Box 2440, Hail,
l.com; [email protected]
Department of Biosciences, Veer Narmad
dia
Post, Mysore Road, Bengaluru, 560074,
f Chemistry 2020
10–25 mmwith a void size of 5–300 mm. Nanosponges are strongand stable up to temperature of 300 �C, while microsponges arestable up to temperature of 130 �C and are fragile.1 They arelipophilic in nature, and spread in water as a moving mediumhelping mask unpleasant avors and shiing the compound'sphysical state from liquid to solid. Biodegradable polyesterssuch as polyglycolic acid (PGA) and cyclodextrin-dependentitems measure the benecial charge of the medication.2
The nanosponge is about the size of a virus, and a naturallydegradable polyester providing a backbone to a substance (ascaffolding structure). In solution, the long polyester threadsare combined with small molecules, called cross-linkers, whichare preferred for certain polyester parts.3 They cross-connect thepieces of polyester to create a spherical shape, that has manyspaces or cavities. These nanosponges are a series of novelnanoparticles, that are typically extracted from natural deriva-tives. They are porous, non-toxic and insoluble in water andorganic solvents, as compared to the other nanoparticles.4
Nanosponges can be used as a tool for therapeutic ideas toimprove the lipophilic aqueous solubility, maintain degradable
RSC Adv., 2020, 10, 34869–34884 | 34869
RSC Advances Paper
Ope
n A
cces
s A
rtic
le. P
ublis
hed
on 2
1 Se
ptem
ber
2020
. Dow
nloa
ded
on 1
/19/
2022
12:
53:3
4 A
M.
Thi
s ar
ticle
is li
cens
ed u
nder
a C
reat
ive
Com
mon
s A
ttrib
utio
n-N
onC
omm
erci
al 3
.0 U
npor
ted
Lic
ence
.View Article Online
molecules, and build pathways for the transmission of medi-cines for different routes of administration in addition to oral.5
Preparation is simple with slight manipulation, basic chemistryof polymers and appropriate use of cross-linkers. Hence, thisapproach is easy for commercial production scale-up. Nano-sponges are soluble in water, but under sunlight, they are notbiologically breakable. It can be used to cover up undesirablearomas, turning oils into solids. The chemical connectionsallow the nanosponges to attach favorably to the target site.6
Chemical structures of excipients used for nanospongesynthesis is depicted in Fig. 1.
Cyclodextrin can produce molecules of size and polarity inline with its internal lipophilic cavity. Natural cyclodextrincannot contain other hydrophilic compounds or large mole-cules. Therefore, many native cyclodextrin chemical modica-tions have been recorded to address those limitations.7 Amongseveral solutions to the synthesis of cyclodextrin polymers usingcross-linking agents, literature has suggested cyclodextrinpolymers using cross-linking agents, or cyclodextrin-basednanosponges. Several cyclodextrin interlinks with the connec-tors throughout the cyclodextrin nanosponge (CD-NS). A centralinner cavity serves as a pore of a natural sponge capable ofdrawing liquids into it, so-called “CD-NS”.8
Insoluble cyclodextrin polymers synthesized with parentcyclodextrin reactions have long been reported with cross-linkers such as epichlorohydrin, dialdehydes, diacyl chlorides,epoxides, etc., but the term CD-NS was rst used by DeQuan Liand Min Ma in 1998.9 CD-NS shows very high efficiency inhandling the poorly soluble molecules by incorporation andnon-inclusion complexes. The existence of the lipophilic cavi-ties of cyclodextrin monomers and the porous nature ofhydrophilic CD-NS channels allows the introduction of a widevariety of compounds. Besides, the CD and cross-linker rationeeds to be changed to obtain a polymer with a specic productload capacity and an ideal release prole. Nanosponge hasa unique property of forming nanosuspension, when vapor isdispersed.10
Paracetamol is world's most widely over-the-counterprescribed analgesic. It is the rst step of medication in the
Fig. 1 Chemical structures of excipients used for nanospongesynthesis.
34870 | RSC Adv., 2020, 10, 34869–34884
WHO pain scale, and is widely prescribed through many inter-national recommendations as rst-line pharmacological treat-ment for acute and chronic painful conditions.11 On the otherhand, aceclofenac is the diclofenac pro-drug, a non-steroidalanti-inammatory drug (NSAID), widely used for treating bothacute and chronic pain.12 There are no current systematicstudies on its analgesic effects in acute post-operative pain. Itfunctions by inhibiting the COX (cyclooxygenase) enzymes thatfurther hinder prostaglandin's secretion. Furthermore, caffeineis a methylxanthine derivative, called IUPAC 3, 7-dihydro-1,3,7-trimethyl-1H-purine-2,6-dione. In many plants, it is a naturalalkaloid that has the most important sources: guarana seeds,coffee seeds, tea leaves, cola nuts, and cacao beans. The regularuse of caffeine are in tea, coffee, energy drinks, and othercaffeine-based so drinks. The caffeine is also used to enhancethe solubility of the drug as aceclofenac and paracetamol ispoorly soluble.13 Present study aims to develop a nanospongetablet, that can increase the solubility of the class II drugs.There are no other combination of these triple drugs (para-cetamol, aceclofenac and caffeine), which can be used for rapidonset of action against severe pain. Hence, these dosage formcan be considered as the best anti-inammatory drug.14
ExperimentalMaterials
Paracetamol, aceclofenac, caffeine (Merck® Specialties PrivateLimited, Mumbai, India), b-cyclodextrin (Mengzhou Hauxing,China), dimethyl carbonate (DMC) and cross povidone (LobaChemie® Private Limited, Mumbai, India).
0.01 M phosphate buffer solution (PBS)
6.80 g of potassium dihydrogen phosphate was correctlyweighed and dissolved in sufficient puried water to achieve anamount of 1000 ml. Glacial acetic acid was added to adjust thepH to 5.5.
Methods
Synthesis of b-cyclodextrin nanosponge. b-Cyclodextrin (b-CD) was cross-linked using cross-linking polymer namelyDMC to prepare the nanosponge. Specic polymer-to-crosslinker molar ratios were used for the nanosponge prepara-tion. The polymer-to-cross linker mixture was taken asmentioned in Table 1 and allowed to react for 5–7 h at around90 �C. To collect the resulting solid, the reaction mixture waskept aside to cool, and then ltered. Subsequently, the formed
Table 1 Ingredients used for preparing nanosponges with thedifferent amount
Ingredients F1 F2 F3 F4
b-Cyclodextrin (mg) 600 600 600 600Dimethyl carbonate (ml) 1.2 2.4 4.8 6
This journal is © The Royal Society of Chemistry 2020

Paper RSC Advances
Ope
n A
cces
s A
rtic
le. P
ublis
hed
on 2
1 Se
ptem
ber
2020
. Dow
nloa
ded
on 1
/19/
2022
12:
53:3
4 A
M.
Thi
s ar
ticle
is li
cens
ed u
nder
a C
reat
ive
Com
mon
s A
ttrib
utio
n-N
onC
omm
erci
al 3
.0 U
npor
ted
Lic
ence
.View Article Online
solid particles were broken down by gentle grinding, andSoxhlet installed extraction using ethanol for around 30 min toremove unreacted cross-linkers and other impurities. Thereaction was conducted with an excess DMC, and the resultingnanosponge was deposited at 25 �C aer purication untilfurther use.8
Aer nanosponges synthesis, three varied formulations wereprepared aer drug loading into the nanosponge. Then, loadednanosponge formulations were directly compressed into tabletformulation and nally characterized and evaluated.
Characterization of active ingredient
Fourier-transform infrared spectroscopy (FTIR). FTIR spec-troscopic analysis was carried out for pure drugs, polymersused, and their physical mixture for the compatibility evalua-tion of drugs and polymers. FTIR spectrophotometer (8400S,Shimadzu®, Kyoto, Japan) was used to obtain the spectra.2
Differential scanning calorimetry (DSC). DSC studies wascarried out for pure drugs, polymers used, and their physicalmixture for the compatibility evaluation of drugs and polymers.It was conducted with Shimadzu®, DSC 60 thermal analyzer,Japan, using a liquid nitrogen cooling accessory.8
X-ray diffraction studies (XRD). Drug XRD patterns wererecorded at ambient temperature, using an X-ray diffractometer(Rigaku®, Japan). Ni-ltered Cu Ka radiation at intervals 2 ¼10–50�, 40 kV voltage, 20 mA current, and 2 s scanning speed of0.01� s�1 were used to record diffraction patterns.15
Evaluation of nanosponge
Production yield (%). All formulations of the preparednanosponge were correctly weighed and noted. The output yieldfor the nanosponge was then calculated using the followingequation.16
Production yield (%) ¼ practical mass of nanosponge
� 100/theoretical mass (polymer + drug) (1)
Nanosponge drug loading. The aqueous nanospongesuspensions was taken, which is mentioned in the Table 2.Allowed to stir in a magnetic stirrer for 24 h.17 These suspen-sions were then centrifuged at 2000 rpm for 10 min to isolatethe non-complexed content as a residual. Freeze-drying wasapplied to the colloidal supernatants to remove the drug-loadedNS.
Table 2 Different formulations used for preparing the drug-loadednanosponges
Ingredients FA1 FA2 FA3
Paracetamol (mg) 325 325 325Aceclofenac (mg) 125 125 125Caffeine (mg) 50 50 50Nanosponge (mg) 263 525 1050Ethanol (ml) 25 25 25
This journal is © The Royal Society of Chemistry 2020
Design of experiment
Design Expert® (Version 12.0.2, Stat-Ease Inc., Minneapolis,MN, USA) soware was used for the illustration of the responsesurface model by getting the combination of values. A three-factor, three-level Box–Behnken experimental design wasadopted for the optimization of nanosponge synthesis. A designof three parts, each of two fully leveled factors, and a third factorset at zero level. The quadratic response surfaces were repre-sented by the second-order polynomial model.18 The indepen-dent and dependent variables selected are presented in Table 3,and the results of the trial are generated by the quadraticequation:
Y ¼ b0 + b1X1 + b2X2 + b3X3 + b12X1X2 + b13X1X3
+ b23X2X3 + b11X12 + b22X22 + b33X32 (2)
where,Y is a determined result correlated with the combination
each of the factor level; b0 is an intercept; b1 to b33 are coeffi-cients of regression derived from Y's observed experimentalvalues; X1, X2, and X3 are marked levels of independentvariables.
The terms XiXj i¼ 1, 2 or 3 and j¼ 1, 2 or 3 and Xi2 (i¼ 1, 2 or
3) symbolize the relation and the quadratic terms, respectively.Three factors and just twelve runs, plus three replicates ata center point are required. Thereby, indicating the less time aswell as energy consumption.19 Additionally, each factor isstudied and coded at three basic levels. It does not concern thefactors at extremely high or extremely low levels for avoiding theexperiments in extreme conditions which may lead to undesir-able results.
Checkpoint analysis and optimization of nanosponge
Provided that our reasoning was to maximize both nanospongeparticle size and trap efficiency concurrently, multi-criteriadecision analysis (MCDA) was used in the output data tomerge the responses obtained of two responses into a singleunied response system. It offers a systemic solution byrequiring options to be chosen depending on several parame-ters, and thus overcoming the drawbacks of unstructureddecision-making. The desired points were selected for eachresponse based on importance, which may affect the charac-teristics of a set goal.20 Graphical optimization has also beenfollowed post numerical optimization. Overlay plot, as well asdesirability plot, were then constructed for investigating therelationship between factors and response. The optimumformula was selected based on the criteria of optimum particlesize and maximum entrapment.
Table 3 Independent and dependent variables for analysis
Independent variables Dependent variables
Polymer concentration (mol) R1: Particle size (nm)Crosslinker concentration (mol) R2: Entrapment efficiency (%)Reaction time (h)
RSC Adv., 2020, 10, 34869–34884 | 34871
RSC Advances Paper
Ope
n A
cces
s A
rtic
le. P
ublis
hed
on 2
1 Se
ptem
ber
2020
. Dow
nloa
ded
on 1
/19/
2022
12:
53:3
4 A
M.
Thi
s ar
ticle
is li
cens
ed u
nder
a C
reat
ive
Com
mon
s A
ttrib
utio
n-N
onC
omm
erci
al 3
.0 U
npor
ted
Lic
ence
.View Article Online
Evaluation of drug-loaded nanosponge
Drug content (%). Extracted from the prepared paracetamol,aceclofenac and caffeine formulation with 30 ml of ethanolcontaining 1 g of drug equivalent to 10 mg. This was taken ina volumetric ask and made upto 100 ml using pH 5.5 acetatebuffer. Using UV spectrophotometer 1800, Shimadzu®, Japan,the absorption of the resulting solution was measured atdifferent nm aer appropriate dilutions.20 The formulation'sdrug content was calculated using the following equation:
%Drug content¼ actual concentration of drug in the formulation
� 100/theoretical concentration of drug (3)
Entrapment efficiency. Accurately weighed drug-loadednanosponges were crushed in a mortar and pestle. 5 ml ofethanol was added to the standard 100 ml ask and made upthe volume using acetate buffer with pH 5.5. Mixture was keptaside for 1 h with regular shaking to remove if any undissolvedparticulate of nanosponge. It was then ltered and the ltrateabsorbance was estimated at 243, 275, and 273 nm, aer suffi-cient dilutions. Calibration curve was then plotted and thesubstance content was expressed as actual drug content innanosponge. The efficiency percentage of nanosponge drugtrapping was calculated using the following equation.21
Drug entrapment efficiency (%) ¼ experimental drug loading
� 100/theoretical drug loading (4)
Scanning electron microscope (SEM). SEM was used toreport the surface morphology of nanosponges. Suitable testswere mounted on a double-sided adhesive tape stub made ofaluminum. Firstly, the tape was rmly attached to the stub, andsample powder was carefully dispersed over its surface. To keepthe specimens conductive, the stub with the substance was thensputter-coated with a thin layer of gold.22
1H NMR spectroscopy. To establish the formation of inclu-sion complex between drug and CD-NS, 1H NMR spectroscopyhas been done. 1H NMR allows for a clear disparity betweeninclusion and any other possible external interaction with thelarge effects observed on protons inside the hydrophobic CDcavity (H-3 and H-5, with H-5, more pronouncedly affected),thus clearly proving the inclusion. Besides, the internal protonschemical environment varies, resulting in a change in theprotons chemical shis due to the effects of shielding or de-shielding.
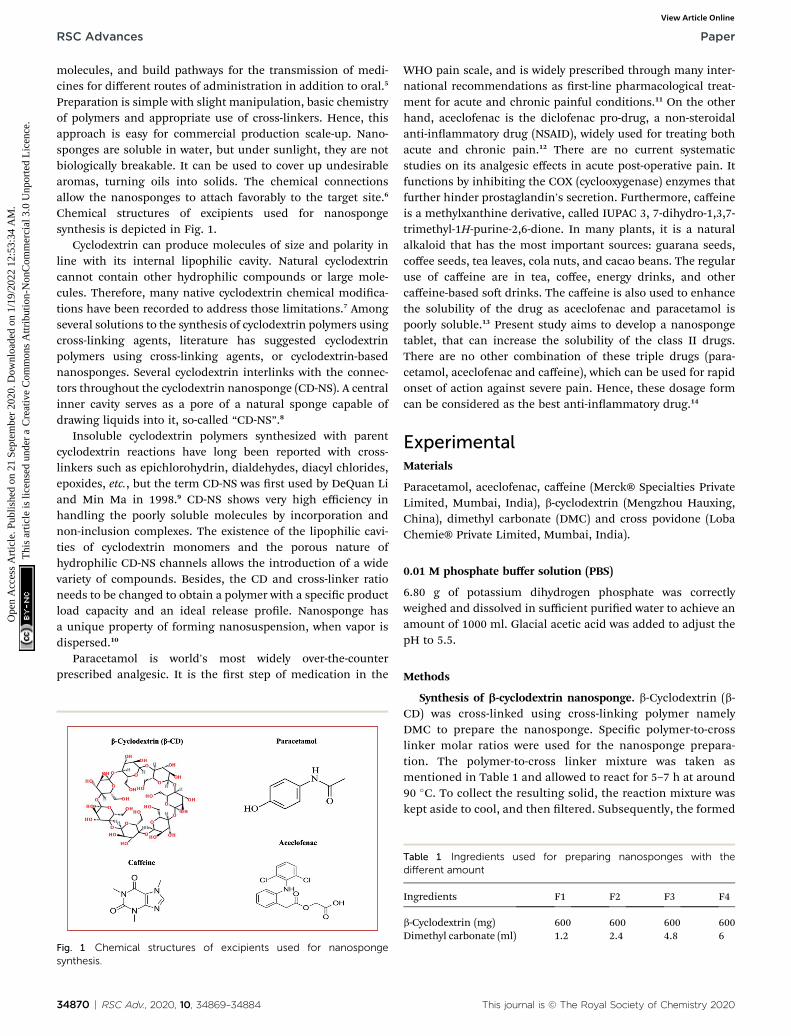
Table 4 Tablets compression with the list of ingredients and excipientused
IngredientsQuantity(mg)
Paracetamol, aceclofenac and caffeine loadednanosponge
525
Cross povidone 25
34872 | RSC Adv., 2020, 10, 34869–34884
Preparation of nanosponge loaded tablets. Nanospongeloaded with paracetamol, aceclofenac and caffeine is equivalentto 500 mg distributed equally to the weigh excipients. Crosspovidone was taken in varied concentration for the bettersolubility (Table 4).23
Characterization and evaluation of drug loaded nanosponge
Physical properties. The prepared formulations for nano-sponge were inspected visually for their color and appearance(white colored nanosponge loaded with drug particles).
Particle size analysis. The mean particle size of the nano-sponge was calculated using an optical microscope. A stagemicrometer had been tted to the microscope to calibrate theeye piece micrometer. One eld estimated the diameter of 30particles on average. The mean size of the particles was deter-mined using the equation below.
Dmean ¼P
nd/P
n (5)
Pre-formulation study. The pre-formulation study wascarried out to show the good ow property and meeting thepharmacopeia specications.24
Angle of repose. Friction forces were measured by the restingangle in a loose powder. That is an indication of the owproperties of the powder. When possible, it is dened as themaximum angle between the surface of the powder pile and thehorizontal plane.
Angle of repose ¼ tan�1(2h/d) (6)
Bulk density. The powder was poured into the weighing jarand the volume was noted. It is called sample weight, separatedby untapped volume and transmitted as g cm�3.
Tapped density. The weighed powder amount was pouredinto the weighing jar, and the volume was measured. Thecylinder tapped at a height of 10 cm on a hard surface for 100times, until the gap volume was lowered and nal reading wastaken.
Carr's compressibility index. The Carr scale is an indicationof a compressibility of the powder. It can be calculated usinga formula that is mentioned below.
C ¼ 100 � (1 � bulk density/tap density) (7)
Hausner's ratio. This displays the properties of the powderow, and is expressed in the ratio of tapped and bulk mass. Ifthe value is less than 1.25, this shows good ow.
Porosity. The study of porosity was conducted to check theextent of the nanosponge. The tapped and untapped (bulk)densities were determined by marking a small cuvette withknown volume, then inserting a small known powder mass intothe cuvette (bulk density) and tapping it 50 times (tappeddensity) vertically against a padded benchtop. The mass wasbroken down by the initial and nal quantities.19 True density
This journal is © The Royal Society of Chemistry 2020

Fig. 2 Overlain FTIR spectra of paracetamol, aceclofenac and caffeinewith the b-cyclodextrin and physical mixture.
Paper RSC Advances
Ope
n A
cces
s A
rtic
le. P
ublis
hed
on 2
1 Se
ptem
ber
2020
. Dow
nloa
ded
on 1
/19/
2022
12:
53:3
4 A
M.
Thi
s ar
ticle
is li
cens
ed u
nder
a C
reat
ive
Com
mon
s A
ttrib
utio
n-N
onC
omm
erci
al 3
.0 U
npor
ted
Lic
ence
.View Article Online
has been calculated by dividing sample weight by volume of thesample. Nanosponge exhibits higher porosity compared to theparent polymer and co-polymers used to make the system, dueto their porous nature. Percent porosity is given by the equation.
Porosity ¼ bulk density
tap density� 100 (8)
Evaluation parameters of tablets dosage form
Friability test. Twenty tablets of each formulation wereweighed and abrasive by employing for 4 min at 25 revolutionsper min. The tablets were then measured and compared to theiroriginal weights and were obtained a percentage of friability.25
% Friability ¼ 1 � (final weight/initial weight) � 100 (9)
Tablet breaking force (hardness) test. The crushing strengthwas determined using Automatic Tablet Hardness Tester(Pzer® Hardness Tester). From each formulation, 3 tabletswere randomly selected, and the pressure at which each tabletcrushed was registered.26
Average weight. Ten tablets were randomly selected, andindividually measured. Average weight was then calculated, andequated of the actual tablet. Not more than two of the individualweights deviate by more than the limit. From the average weightnumber of tablet taken as 10 and none of the batch deviated bymore than twice the percent.
Average wt ¼ total wt of 10 tablets in gram � 1000/10 (10)
In vitro disintegration time test. The time test for in vitrodisintegration is a signicant feature needed for tablets that arereleased immediately. The time of dosage forms to disintegratemust be within 25 min. The time for complete disintegration ofthe tablet was measured in min, with no observable massremaining in the apparatus.27
In vitro dissolution. It was performed using the type II USPapparatus (ELECROLAB® TDT 06 T, Mumbai, India). At the pH5.5 buffer, the dissolution medium consisting 900 ml of bufferheld at 37 � 0.5 �C and stirred at 50 RPM. Samples (10 ml) wereremoved at predetermined 5, 10, 15, 20, 25 and 30 min timeintervals. Equal amount of the fresh dissolution medium,retained at the same temperature, was immediately replaced.The solution absorbance was measured against blank atapproximately 243, 274 and 273 nm. It has been made clear thatthe test did not interfere with any of the ingredients used in thematrix formulation. The percentage of drug release from theprepared standard curve was measured.16
Release kinetics. Release kinetic studies was carried outusing mathematical models for the cumulative drug release.The mathematical models used are zero, rst, Higuchi, andKorsmeyer–Pepas model that was done by using BCP soware.
Stability studies. Stability is characterized as the degree towhich a commodity retains the same properties and charac-teristics it possessed at the time of its manufacture, within
This journal is © The Royal Society of Chemistry 2020
dened limits, and over its complete storage and usageduration.28 The optimized formulation was packed ina tightly closed container and held in an InternationalCouncil of Harmonisation approved stability chamber at 40�2 �C and 75 � 5% RH for one month. The formulation wastested at periodic intervals before and aer, for theimprovement of appearance, pH, drug quality, and in vitrodrug release.
Results and discussionCompatibility study
Study on compatibility was performed to test for any specicinterference between the drug and excipients used. Drug–excipient interaction was assessed by FTIR and DSC analysis.
FTIR analysis
IR spectroscopic studies performed and results obtained arepresented in Fig. 2. No newpeaks, major shi or loss ofcharacteristic peaks was observed for drug–excipient physicalmixture spectra, in comparision to pure drug spectra indi-cating drug–excipient compatibility with all the excipients.
RSC Adv., 2020, 10, 34869–34884 | 34873

Table 5 Loading of the drug into nanosponge based on the differentratios
Ingredients FA1 FA2 FA3
Paracetamol (mg) 325 325 325Aceclofenac (mg) 125 125 125Caffeine (mg) 50 50 50Nanosponge (mg) 263 525 1050Ethanol (ml) 25 25 25
RSC Advances Paper
Ope
n A
cces
s A
rtic
le. P
ublis
hed
on 2
1 Se
ptem
ber
2020
. Dow
nloa
ded
on 1
/19/
2022
12:
53:3
4 A
M.
Thi
s ar
ticle
is li
cens
ed u
nder
a C
reat
ive
Com
mon
s A
ttrib
utio
n-N
onC
omm
erci
al 3
.0 U
npor
ted
Lic
ence
.View Article Online
The drug and excipients interaction between the drug para-cetamol, aceclofenac and caffeine was carried out with that ofthe excipients and the spectrum appeared found to be ofparacetamol as vibrational peak for O–H and CH3 at 3326 and3126 cm�1 and asymmetrical stretching C–H bond at1507 cm�1 and C–C stretching takes place as 1435 cm�1. Themixture of paracetamol with the excipient's forms peak at3437 cm�1, but there is no disappearing of the peaks. Ace-clofenac has a characteristic stretching at 965.21 cm�1 O–Hbond 3319.73 cm�1 at N–H stretching, C]O band at1577.9 cm�1 with the addition of excipients there found to beno interaction with the peaks or disappearing but new peaksformed at 3496.63 cm�1. Caffeine has the functional groupfound for C–H and CH3 wavelength at 3134 cm�1 and3850 cm�1, C]O at 1690 cm�1, C–N at 1240 cm�1 with that ofphysical mixture found to form extra peaks at 3356 cm�1 butfound to be no disappearing of the peak.
DSC analysis
The overlaying DSC thermograms of paracetamol, aceclofe-nac, caffeine and b-CD, with their physical mixture aredepicted in Fig. 3. Endotherm corresponding to melting ofparacetamol, aceclofenac, caffeine and b-CD were observedin respective thermograms at 169 �C, 156.1 �C and 236 �C,respectively. Compatibility analysis via DSC revealed thatparacetamol, aceclofenac, and caffeine dispersed in polymer,exhibited same thermal behavior as that of pure sample. Asthe corresponding endothermic peaks of the drug, as well aspolymer were adequately retained in their physical mixture.It was inferred that drug did not interact while in contactwith the polymer, suggesting good compatibility amongthem.
Fig. 3 Overlain DSC thermograms of (A1 and A2) paracetamol,physical mixture; (B1 and B2) aceclofenac, physical mixture; (C1 andC2) caffeine, physical mixture.
34874 | RSC Adv., 2020, 10, 34869–34884
Synthesis of CD-NS
The synthesis of CD-NS involves three steps: (i) synthesis of CD-based nanosponge via optimum cross-linking of polymer usingcross-linker, (ii) purication of nanosponge to remove unreac-ted cross-linker, and other chemical impurities, and (iii) drugloading into blank nanosponge. In this study, we have selectedb-CD as polymer and DMC as a cross-linker. In the nanospongesynthesis, the ratio of polymer to cross-linker plays a crucialrole. It should be such that, to lead the optimum cross-linkingamong CD molecule (neither to higher extent nor to lesser) andshould also aid in the formation of rigid, nano-sized, stablenanosponge. The higher percent of polymer with respect tocross-linker results in incomplete cross-binding of CD cups.Consequently, resulting in the formation of drug-CD complexinstead of nanosponge. Also, the inclusion and non-inclusioncomplexation of drugs in the resultant complex will be quiteless. On the contrary, if the cross-linker concentration isexcessively more to polymer; it leads to extremely high degree ofcross-linking, that ultimately ends in a lack of binding sites onnanosponge for the drug molecule to bind. Hence, an optimumbalance of the two is expected to attain nanosponge withsuperior drug entrapment and other best possible characteris-tics. Taking into consideration the underlying facts, trial anderror experiments, and available literature, the ratios of polymerand cross-linker were selected. Further, for statistical validationand optimization of the same, the QbD approach was embracedby applying Box–Behnken Design (BBD). The nanosponge wasprepared by the classical hot melt method as outlined in theMethodology section (Table 5).
Table 6 Box–Behnken design variables for drug-loaded nanosponge
Used level, actual (coded)
Factors Low Medium High
Independent variablesPolymer concentration (mg) (A) 200 400 500Cross-linker concentration (ml) (B) 400 800 1200Reaction time (h) (C) 2.5 5 7.5
Dependent variablesR1 ¼ particle size (nm)R2 ¼ entrapment efficiency (%)
This journal is © The Royal Society of Chemistry 2020
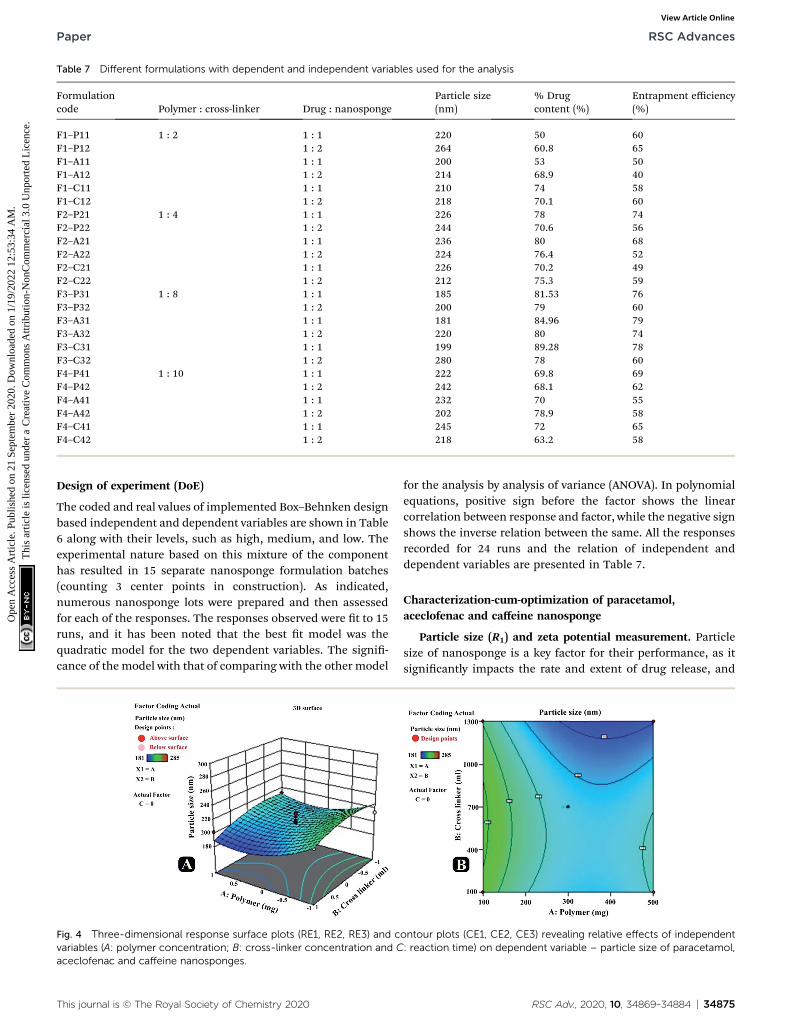
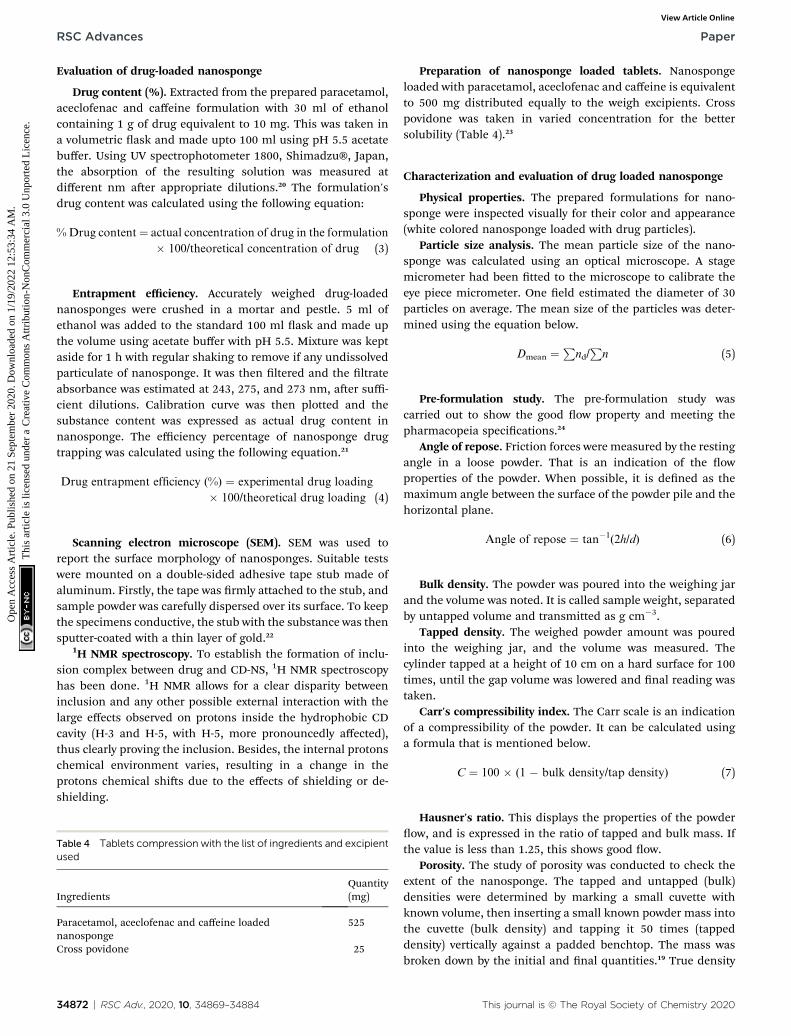
Table 7 Different formulations with dependent and independent variables used for the analysis
Formulationcode Polymer : cross-linker Drug : nanosponge
Particle size(nm)
% Drugcontent (%)
Entrapment efficiency(%)
F1–P11 1 : 2 1 : 1 220 50 60F1–P12 1 : 2 264 60.8 65F1–A11 1 : 1 200 53 50F1–A12 1 : 2 214 68.9 40F1–C11 1 : 1 210 74 58F1–C12 1 : 2 218 70.1 60F2–P21 1 : 4 1 : 1 226 78 74F2–P22 1 : 2 244 70.6 56F2–A21 1 : 1 236 80 68F2–A22 1 : 2 224 76.4 52F2–C21 1 : 1 226 70.2 49F2–C22 1 : 2 212 75.3 59F3–P31 1 : 8 1 : 1 185 81.53 76F3–P32 1 : 2 200 79 60F3–A31 1 : 1 181 84.96 79F3–A32 1 : 2 220 80 74F3–C31 1 : 1 199 89.28 78F3–C32 1 : 2 280 78 60F4–P41 1 : 10 1 : 1 222 69.8 69F4–P42 1 : 2 242 68.1 62F4–A41 1 : 1 232 70 55F4–A42 1 : 2 202 78.9 58F4–C41 1 : 1 245 72 65F4–C42 1 : 2 218 63.2 58
Paper RSC Advances
Ope
n A
cces
s A
rtic
le. P
ublis
hed
on 2
1 Se
ptem
ber
2020
. Dow
nloa
ded
on 1
/19/
2022
12:
53:3
4 A
M.
Thi
s ar
ticle
is li
cens
ed u
nder
a C
reat
ive
Com
mon
s A
ttrib
utio
n-N
onC
omm
erci
al 3
.0 U
npor
ted
Lic
ence
.View Article Online
Design of experiment (DoE)
The coded and real values of implemented Box–Behnken designbased independent and dependent variables are shown in Table6 along with their levels, such as high, medium, and low. Theexperimental nature based on this mixture of the componenthas resulted in 15 separate nanosponge formulation batches(counting 3 center points in construction). As indicated,numerous nanosponge lots were prepared and then assessedfor each of the responses. The responses observed were t to 15runs, and it has been noted that the best t model was thequadratic model for the two dependent variables. The signi-cance of the model with that of comparing with the other model
Fig. 4 Three-dimensional response surface plots (RE1, RE2, RE3) and cvariables (A: polymer concentration; B: cross-linker concentration and Caceclofenac and caffeine nanosponges.
This journal is © The Royal Society of Chemistry 2020
for the analysis by analysis of variance (ANOVA). In polynomialequations, positive sign before the factor shows the linearcorrelation between response and factor, while the negative signshows the inverse relation between the same. All the responsesrecorded for 24 runs and the relation of independent anddependent variables are presented in Table 7.
Characterization-cum-optimization of paracetamol,aceclofenac and caffeine nanosponge
Particle size (R1) and zeta potential measurement. Particlesize of nanosponge is a key factor for their performance, as itsignicantly impacts the rate and extent of drug release, and
ontour plots (CE1, CE2, CE3) revealing relative effects of independent: reaction time) on dependent variable – particle size of paracetamol,
RSC Adv., 2020, 10, 34869–34884 | 34875

RSC Advances Paper
Ope
n A
cces
s A
rtic
le. P
ublis
hed
on 2
1 Se
ptem
ber
2020
. Dow
nloa
ded
on 1
/19/
2022
12:
53:3
4 A
M.
Thi
s ar
ticle
is li
cens
ed u
nder
a C
reat
ive
Com
mon
s A
ttrib
utio
n-N
onC
omm
erci
al 3
.0 U
npor
ted
Lic
ence
.View Article Online
consequently its absorption. Smaller particle size improves thedrug release as it offers a larger interfacial area for diffusion ofthe drug. Particle size of all suggested trial runs were assessedusing size analyzer working on the basis of DLS technique, andobtained data were fed to DoE. Numerical and graphical anal-ysis of the data was done via soware. The derived equationfrom the best t mathematical model that can be related to theresponse R1 and factors (A, B, and C) was R1¼ +403.66 + 17.75A +10.00B + 1.50C + 2.00AB + 1.00AC � 0.50BC � 15.83A2 + 21.66B2
� 16.83C2. Diverse graphs were also plotted for predicting therelative inuence of factors on response R1. The 3D responsesurface (RE1, RE2, and RE3) and contour plots (CE1, CE2, CE3)of different factor combinations, affecting response particle size(R1) are shown in Fig. 4. It was evident from the polynomial
Fig. 5 Predicted vs. actual (A), perturbation (B), interaction (C–E) and cubconcentration; B: cross-linker concentration and C: reaction time) oncaffeine nanosponges.
34876 | RSC Adv., 2020, 10, 34869–34884
equation as well as graphs, that polymer concentration hada much dominant positive or direct inuence on particle size(R1), followed by cross-linker concentration, whereas, quitelesser inuence existed between R1 and the reaction time.
With an increase in the number of RSM factors, responsesurface visualization becomes tedious with graphical tools.Under such circumstances, ‘perturbation’ and ‘interaction’(special forms of response plots) are used for RSM data.Perturbation plot compares the effect of all factors at a partic-ular point in RSM design space, and on the perturbation plot,a curvature or steep slope in an input variable shows a relativelyhigher sensitivity of response. Whereas, using interaction plot,the effect of a combination of independent variables can betraced independently by keeping other all variables constant.
e (F) plots revealing relative effects of independent variables (A: polymerdependent variable – particle size of paracetamol, aceclofenac and
This journal is © The Royal Society of Chemistry 2020
Paper RSC Advances
Ope
n A
cces
s A
rtic
le. P
ublis
hed
on 2
1 Se
ptem
ber
2020
. Dow
nloa
ded
on 1
/19/
2022
12:
53:3
4 A
M.
Thi
s ar
ticle
is li
cens
ed u
nder
a C
reat
ive
Com
mon
s A
ttrib
utio
n-N
onC
omm
erci
al 3
.0 U
npor
ted
Lic
ence
.View Article Online
Fig. 5 presents predicted vs. actual, perturbation, factors inter-action, and cube graphs for particle size (R1). A higher degree oflinearity was reected by predicted vs. actual plot for all the trialrun formulations. Prominent positive impact on response R1
was noted in the case of factor A and factor B when deviatedfrom�1 to +1 (Table 6). Also, a slight positive effect on responseR1 had been noted by the factor C. Moreover, all interactionplots (revealing combined independent variables effect ona response) further established the impact of factor combina-tions on particle size and were in good agreement withoutcomes of the polynomial equation.
The results have depicted that with an increase in polymerconcentration from 1 to 3 (mol), the mean particle sizeincreased from 353 to 440 nm. This could be attributed to thefact that at higher concentrations, the mixed polymeric matrixleads to the formation of cross-linked aggregates; whichconsequently fallout to increase nanosponge particle size. Alsoat extreme higher polymer concentration devoid of appropriatecross-linker amount, there may be the only formation of CDcomplexes with drug instead of nanosponge (having size inmicro or macro range). As the cross-linker amount increases inthe reaction mix, it facilitates cross-linking and accelerates theformation of larger size cross-linked polymeric agglomerates.
Fig. 6 Particle size analysis report.
This journal is © The Royal Society of Chemistry 2020
The reaction time is equally crucial as it directly affects theextent or degree of cross-linking; hence affect particle size ina direct mode. ANOVA of equation has shown model F value36.68 and P-value <0.0005; indicating the signicance of themodel. Furthermore, predicted R-squared 0.9618 was ina reasonable concurrence with adjusted R-squared 0.9582,concluding that the obtained polynomial equation signies thegood t of response variables at diverse levels of factors (Table6).
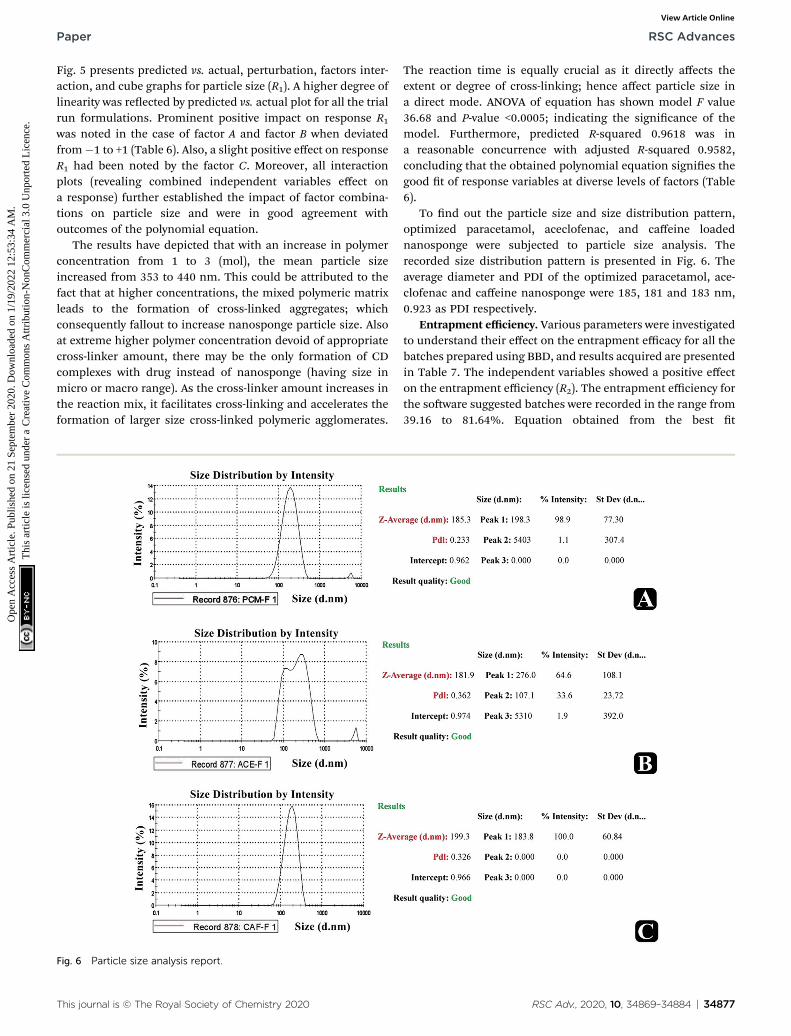
To nd out the particle size and size distribution pattern,optimized paracetamol, aceclofenac, and caffeine loadednanosponge were subjected to particle size analysis. Therecorded size distribution pattern is presented in Fig. 6. Theaverage diameter and PDI of the optimized paracetamol, ace-clofenac and caffeine nanosponge were 185, 181 and 183 nm,0.923 as PDI respectively.
Entrapment efficiency. Various parameters were investigatedto understand their effect on the entrapment efficacy for all thebatches prepared using BBD, and results acquired are presentedin Table 7. The independent variables showed a positive effecton the entrapment efficiency (R2). The entrapment efficiency forthe soware suggested batches were recorded in the range from39.16 to 81.64%. Equation obtained from the best t
RSC Adv., 2020, 10, 34869–34884 | 34877
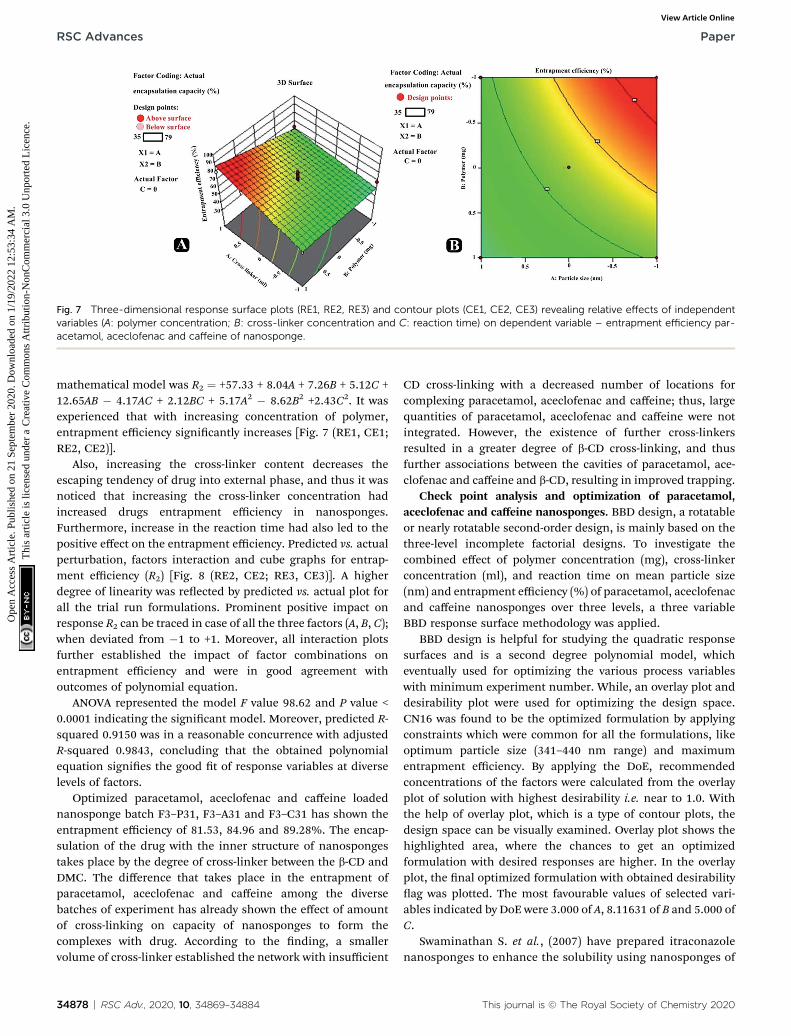
Fig. 7 Three-dimensional response surface plots (RE1, RE2, RE3) and contour plots (CE1, CE2, CE3) revealing relative effects of independentvariables (A: polymer concentration; B: cross-linker concentration and C: reaction time) on dependent variable – entrapment efficiency par-acetamol, aceclofenac and caffeine of nanosponge.
RSC Advances Paper
Ope
n A
cces
s A
rtic
le. P
ublis
hed
on 2
1 Se
ptem
ber
2020
. Dow
nloa
ded
on 1
/19/
2022
12:
53:3
4 A
M.
Thi
s ar
ticle
is li
cens
ed u
nder
a C
reat
ive
Com
mon
s A
ttrib
utio
n-N
onC
omm
erci
al 3
.0 U
npor
ted
Lic
ence
.View Article Online
mathematical model was R2 ¼ +57.33 + 8.04A + 7.26B + 5.12C +12.65AB � 4.17AC + 2.12BC + 5.17A2 � 8.62B2 +2.43C2. It wasexperienced that with increasing concentration of polymer,entrapment efficiency signicantly increases [Fig. 7 (RE1, CE1;RE2, CE2)].
Also, increasing the cross-linker content decreases theescaping tendency of drug into external phase, and thus it wasnoticed that increasing the cross-linker concentration hadincreased drugs entrapment efficiency in nanosponges.Furthermore, increase in the reaction time had also led to thepositive effect on the entrapment efficiency. Predicted vs. actualperturbation, factors interaction and cube graphs for entrap-ment efficiency (R2) [Fig. 8 (RE2, CE2; RE3, CE3)]. A higherdegree of linearity was reected by predicted vs. actual plot forall the trial run formulations. Prominent positive impact onresponse R2 can be traced in case of all the three factors (A, B, C);when deviated from �1 to +1. Moreover, all interaction plotsfurther established the impact of factor combinations onentrapment efficiency and were in good agreement withoutcomes of polynomial equation.
ANOVA represented the model F value 98.62 and P value <0.0001 indicating the signicant model. Moreover, predicted R-squared 0.9150 was in a reasonable concurrence with adjustedR-squared 0.9843, concluding that the obtained polynomialequation signies the good t of response variables at diverselevels of factors.
Optimized paracetamol, aceclofenac and caffeine loadednanosponge batch F3–P31, F3–A31 and F3–C31 has shown theentrapment efficiency of 81.53, 84.96 and 89.28%. The encap-sulation of the drug with the inner structure of nanospongestakes place by the degree of cross-linker between the b-CD andDMC. The difference that takes place in the entrapment ofparacetamol, aceclofenac and caffeine among the diversebatches of experiment has already shown the effect of amountof cross-linking on capacity of nanosponges to form thecomplexes with drug. According to the nding, a smallervolume of cross-linker established the network with insufficient
34878 | RSC Adv., 2020, 10, 34869–34884
CD cross-linking with a decreased number of locations forcomplexing paracetamol, aceclofenac and caffeine; thus, largequantities of paracetamol, aceclofenac and caffeine were notintegrated. However, the existence of further cross-linkersresulted in a greater degree of b-CD cross-linking, and thusfurther associations between the cavities of paracetamol, ace-clofenac and caffeine and b-CD, resulting in improved trapping.
Check point analysis and optimization of paracetamol,aceclofenac and caffeine nanosponges. BBD design, a rotatableor nearly rotatable second-order design, is mainly based on thethree-level incomplete factorial designs. To investigate thecombined effect of polymer concentration (mg), cross-linkerconcentration (ml), and reaction time on mean particle size(nm) and entrapment efficiency (%) of paracetamol, aceclofenacand caffeine nanosponges over three levels, a three variableBBD response surface methodology was applied.
BBD design is helpful for studying the quadratic responsesurfaces and is a second degree polynomial model, whicheventually used for optimizing the various process variableswith minimum experiment number. While, an overlay plot anddesirability plot were used for optimizing the design space.CN16 was found to be the optimized formulation by applyingconstraints which were common for all the formulations, likeoptimum particle size (341–440 nm range) and maximumentrapment efficiency. By applying the DoE, recommendedconcentrations of the factors were calculated from the overlayplot of solution with highest desirability i.e. near to 1.0. Withthe help of overlay plot, which is a type of contour plots, thedesign space can be visually examined. Overlay plot shows thehighlighted area, where the chances to get an optimizedformulation with desired responses are higher. In the overlayplot, the nal optimized formulation with obtained desirabilityag was plotted. The most favourable values of selected vari-ables indicated by DoE were 3.000 of A, 8.11631 of B and 5.000 ofC.
Swaminathan S. et al., (2007) have prepared itraconazolenanosponges to enhance the solubility using nanosponges of
This journal is © The Royal Society of Chemistry 2020
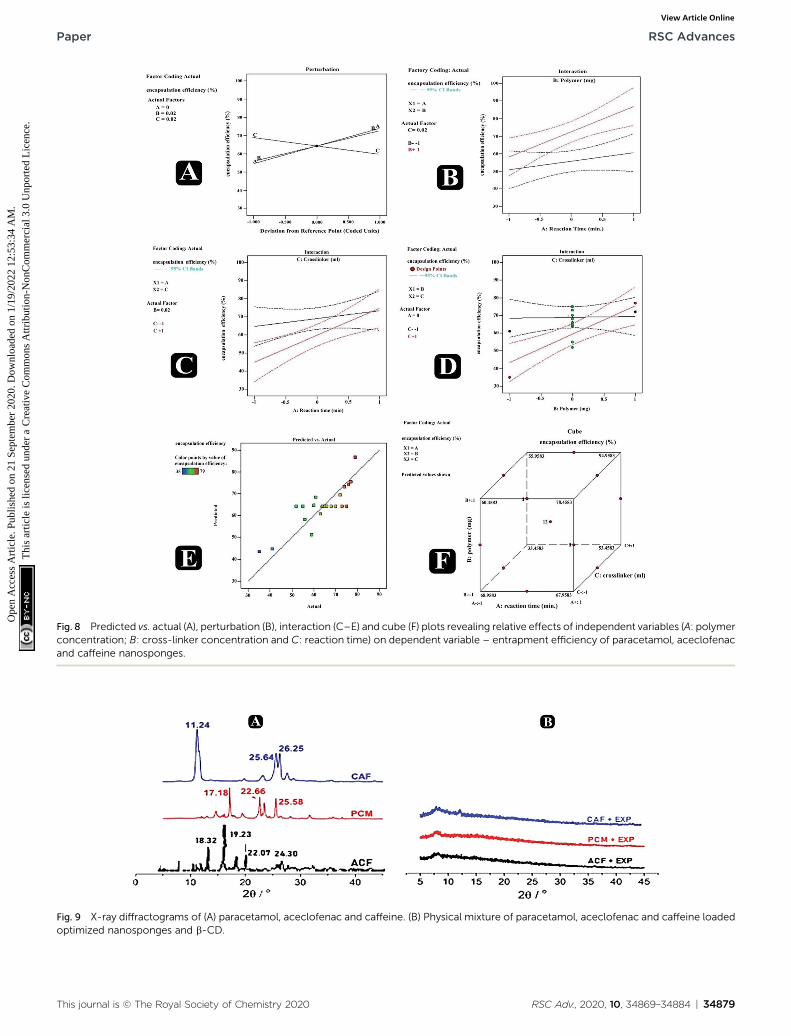
Fig. 8 Predicted vs. actual (A), perturbation (B), interaction (C–E) and cube (F) plots revealing relative effects of independent variables (A: polymerconcentration; B: cross-linker concentration and C: reaction time) on dependent variable – entrapment efficiency of paracetamol, aceclofenacand caffeine nanosponges.
Fig. 9 X-ray diffractograms of (A) paracetamol, aceclofenac and caffeine. (B) Physical mixture of paracetamol, aceclofenac and caffeine loadedoptimized nanosponges and b-CD.
This journal is © The Royal Society of Chemistry 2020 RSC Adv., 2020, 10, 34869–34884 | 34879
Paper RSC Advances
Ope
n A
cces
s A
rtic
le. P
ublis
hed
on 2
1 Se
ptem
ber
2020
. Dow
nloa
ded
on 1
/19/
2022
12:
53:3
4 A
M.
Thi
s ar
ticle
is li
cens
ed u
nder
a C
reat
ive
Com
mon
s A
ttrib
utio
n-N
onC
omm
erci
al 3
.0 U
npor
ted
Lic
ence
.View Article Online
RSC Advances Paper
Ope
n A
cces
s A
rtic
le. P
ublis
hed
on 2
1 Se
ptem
ber
2020
. Dow
nloa
ded
on 1
/19/
2022
12:
53:3
4 A
M.
Thi
s ar
ticle
is li
cens
ed u
nder
a C
reat
ive
Com
mon
s A
ttrib
utio
n-N
onC
omm
erci
al 3
.0 U
npor
ted
Lic
ence
.View Article Online
b-CD and also studied the effect of a ternary componentcopolyvidonum on the solubility. Because itraconazole innanosponges was effectively solubilised, it was immediatelyavailable, and the phase-to-phase transition which limitsbioavailability was eliminated. Solid dispersion technique hadbeen used to incorporate drug into nanosponges. It was foundthat the solubility of itraconazole was enhanced more than 50folds with a ternary solid dispersion system. Using copolyvi-donum in conjunction with nanosponges helped to increase
Fig. 10 Overlain NMR of physical mixtures of (A) paracetamol, (B) acecl
34880 | RSC Adv., 2020, 10, 34869–34884
the solubilisation efficiency of nanosponges as evident fromthe results of phase solubility studies.29
Characterization and evaluation of optimized nanosponges
Production yield. The production yield for optimized para-cetamol, aceclofenac and caffeine nanosponges formulation(F3–P31, F3–A31 and F3–C31) was 48.63 � 1.3%, 46.34 � 1.3%and 47.73.�1.3%, which was calculated based on theoretical
ofenac and (C) caffeine.
This journal is © The Royal Society of Chemistry 2020
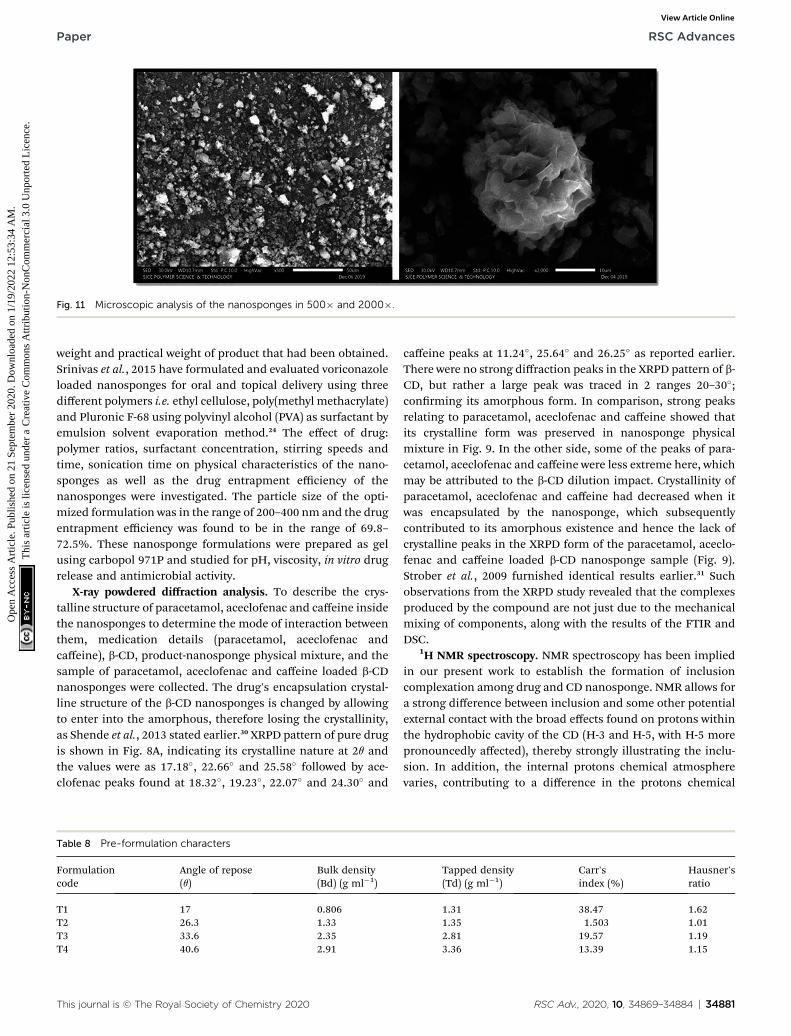
Fig. 11 Microscopic analysis of the nanosponges in 500� and 2000�.
Paper RSC Advances
Ope
n A
cces
s A
rtic
le. P
ublis
hed
on 2
1 Se
ptem
ber
2020
. Dow
nloa
ded
on 1
/19/
2022
12:
53:3
4 A
M.
Thi
s ar
ticle
is li
cens
ed u
nder
a C
reat
ive
Com
mon
s A
ttrib
utio
n-N
onC
omm
erci
al 3
.0 U
npor
ted
Lic
ence
.View Article Online
weight and practical weight of product that had been obtained.Srinivas et al., 2015 have formulated and evaluated voriconazoleloaded nanosponges for oral and topical delivery using threedifferent polymers i.e. ethyl cellulose, poly(methyl methacrylate)and Pluronic F-68 using polyvinyl alcohol (PVA) as surfactant byemulsion solvent evaporation method.24 The effect of drug:polymer ratios, surfactant concentration, stirring speeds andtime, sonication time on physical characteristics of the nano-sponges as well as the drug entrapment efficiency of thenanosponges were investigated. The particle size of the opti-mized formulation was in the range of 200–400 nm and the drugentrapment efficiency was found to be in the range of 69.8–72.5%. These nanosponge formulations were prepared as gelusing carbopol 971P and studied for pH, viscosity, in vitro drugrelease and antimicrobial activity.
X-ray powdered diffraction analysis. To describe the crys-talline structure of paracetamol, aceclofenac and caffeine insidethe nanosponges to determine the mode of interaction betweenthem, medication details (paracetamol, aceclofenac andcaffeine), b-CD, product-nanosponge physical mixture, and thesample of paracetamol, aceclofenac and caffeine loaded b-CDnanosponges were collected. The drug's encapsulation crystal-line structure of the b-CD nanosponges is changed by allowingto enter into the amorphous, therefore losing the crystallinity,as Shende et al., 2013 stated earlier.30 XRPD pattern of pure drugis shown in Fig. 8A, indicating its crystalline nature at 2q andthe values were as 17.18�, 22.66� and 25.58� followed by ace-clofenac peaks found at 18.32�, 19.23�, 22.07� and 24.30� and
Table 8 Pre-formulation characters
Formulationcode
Angle of repose(q)
Bulk density(Bd) (g ml�1)
T1 17 0.806T2 26.3 1.33T3 33.6 2.35T4 40.6 2.91
This journal is © The Royal Society of Chemistry 2020
caffeine peaks at 11.24�, 25.64� and 26.25� as reported earlier.There were no strong diffraction peaks in the XRPD pattern of b-CD, but rather a large peak was traced in 2 ranges 20–30�;conrming its amorphous form. In comparison, strong peaksrelating to paracetamol, aceclofenac and caffeine showed thatits crystalline form was preserved in nanosponge physicalmixture in Fig. 9. In the other side, some of the peaks of para-cetamol, aceclofenac and caffeine were less extreme here, whichmay be attributed to the b-CD dilution impact. Crystallinity ofparacetamol, aceclofenac and caffeine had decreased when itwas encapsulated by the nanosponge, which subsequentlycontributed to its amorphous existence and hence the lack ofcrystalline peaks in the XRPD form of the paracetamol, aceclo-fenac and caffeine loaded b-CD nanosponge sample (Fig. 9).Strober et al., 2009 furnished identical results earlier.31 Suchobservations from the XRPD study revealed that the complexesproduced by the compound are not just due to the mechanicalmixing of components, along with the results of the FTIR andDSC.
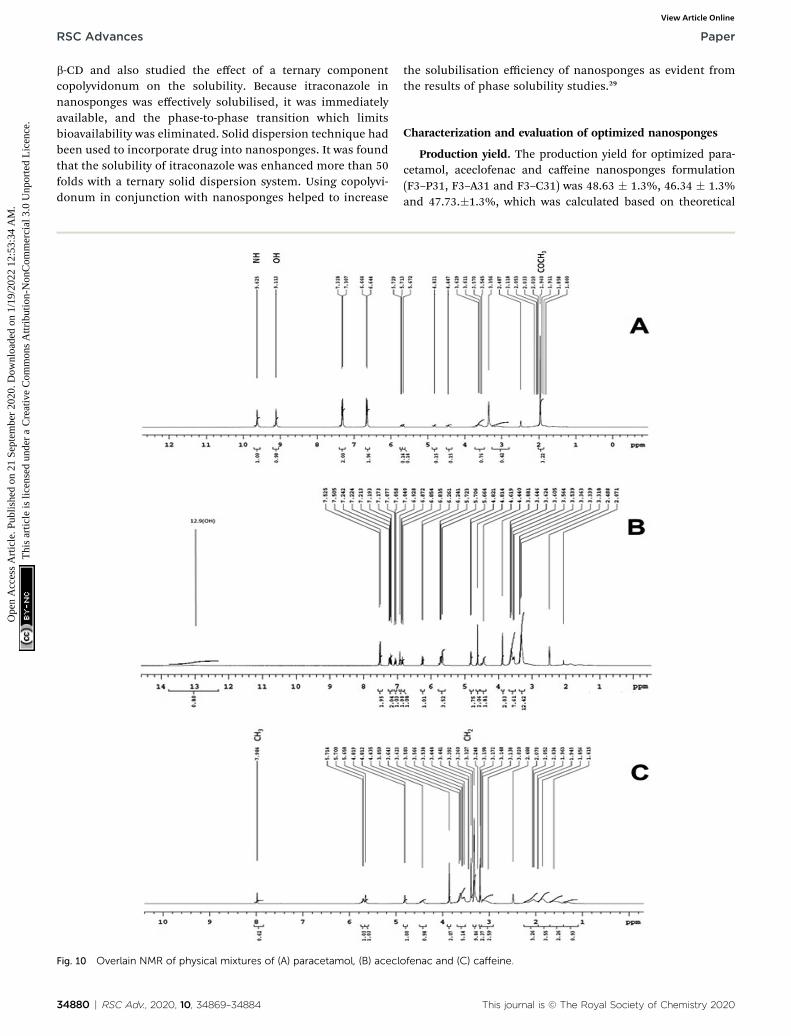
1H NMR spectroscopy. NMR spectroscopy has been impliedin our present work to establish the formation of inclusioncomplexation among drug and CD nanosponge. NMR allows fora strong difference between inclusion and some other potentialexternal contact with the broad effects found on protons withinthe hydrophobic cavity of the CD (H-3 and H-5, with H-5 morepronouncedly affected), thereby strongly illustrating the inclu-sion. In addition, the internal protons chemical atmospherevaries, contributing to a difference in the protons chemical
Tapped density(Td) (g ml�1)
Carr'sindex (%)
Hausner'sratio
1.31 38.47 1.621.35 1.503 1.012.81 19.57 1.193.36 13.39 1.15
RSC Adv., 2020, 10, 34869–34884 | 34881
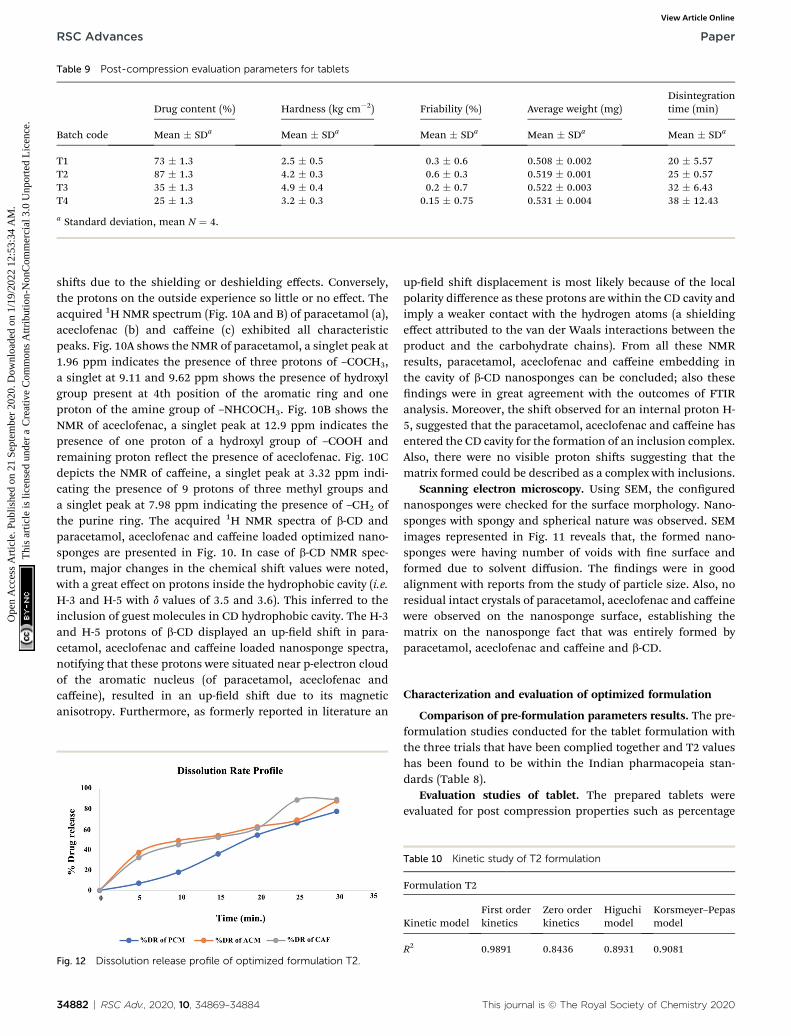
Table 9 Post-compression evaluation parameters for tablets
Batch code
Drug content (%) Hardness (kg cm�2) Friability (%) Average weight (mg)Disintegrationtime (min)
Mean � SDa Mean � SDa Mean � SDa Mean � SDa Mean � SDa
T1 73 � 1.3 2.5 � 0.5 0.3 � 0.6 0.508 � 0.002 20 � 5.57T2 87 � 1.3 4.2 � 0.3 0.6 � 0.3 0.519 � 0.001 25 � 0.57T3 35 � 1.3 4.9 � 0.4 0.2 � 0.7 0.522 � 0.003 32 � 6.43T4 25 � 1.3 3.2 � 0.3 0.15 � 0.75 0.531 � 0.004 38 � 12.43
a Standard deviation, mean N ¼ 4.
RSC Advances Paper
Ope
n A
cces
s A
rtic
le. P
ublis
hed
on 2
1 Se
ptem
ber
2020
. Dow
nloa
ded
on 1
/19/
2022
12:
53:3
4 A
M.
Thi
s ar
ticle
is li
cens
ed u
nder
a C
reat
ive
Com
mon
s A
ttrib
utio
n-N
onC
omm
erci
al 3
.0 U
npor
ted
Lic
ence
.View Article Online
shis due to the shielding or deshielding effects. Conversely,the protons on the outside experience so little or no effect. Theacquired 1H NMR spectrum (Fig. 10A and B) of paracetamol (a),aceclofenac (b) and caffeine (c) exhibited all characteristicpeaks. Fig. 10A shows the NMR of paracetamol, a singlet peak at1.96 ppm indicates the presence of three protons of –COCH3,a singlet at 9.11 and 9.62 ppm shows the presence of hydroxylgroup present at 4th position of the aromatic ring and oneproton of the amine group of –NHCOCH3. Fig. 10B shows theNMR of aceclofenac, a singlet peak at 12.9 ppm indicates thepresence of one proton of a hydroxyl group of –COOH andremaining proton reect the presence of aceclofenac. Fig. 10Cdepicts the NMR of caffeine, a singlet peak at 3.32 ppm indi-cating the presence of 9 protons of three methyl groups anda singlet peak at 7.98 ppm indicating the presence of –CH2 ofthe purine ring. The acquired 1H NMR spectra of b-CD andparacetamol, aceclofenac and caffeine loaded optimized nano-sponges are presented in Fig. 10. In case of b-CD NMR spec-trum, major changes in the chemical shi values were noted,with a great effect on protons inside the hydrophobic cavity (i.e.H-3 and H-5 with d values of 3.5 and 3.6). This inferred to theinclusion of guest molecules in CD hydrophobic cavity. The H-3and H-5 protons of b-CD displayed an up-eld shi in para-cetamol, aceclofenac and caffeine loaded nanosponge spectra,notifying that these protons were situated near p-electron cloudof the aromatic nucleus (of paracetamol, aceclofenac andcaffeine), resulted in an up-eld shi due to its magneticanisotropy. Furthermore, as formerly reported in literature an
Fig. 12 Dissolution release profile of optimized formulation T2.
34882 | RSC Adv., 2020, 10, 34869–34884
up-eld shi displacement is most likely because of the localpolarity difference as these protons are within the CD cavity andimply a weaker contact with the hydrogen atoms (a shieldingeffect attributed to the van der Waals interactions between theproduct and the carbohydrate chains). From all these NMRresults, paracetamol, aceclofenac and caffeine embedding inthe cavity of b-CD nanosponges can be concluded; also thesendings were in great agreement with the outcomes of FTIRanalysis. Moreover, the shi observed for an internal proton H-5, suggested that the paracetamol, aceclofenac and caffeine hasentered the CD cavity for the formation of an inclusion complex.Also, there were no visible proton shis suggesting that thematrix formed could be described as a complex with inclusions.
Scanning electron microscopy. Using SEM, the congurednanosponges were checked for the surface morphology. Nano-sponges with spongy and spherical nature was observed. SEMimages represented in Fig. 11 reveals that, the formed nano-sponges were having number of voids with ne surface andformed due to solvent diffusion. The ndings were in goodalignment with reports from the study of particle size. Also, noresidual intact crystals of paracetamol, aceclofenac and caffeinewere observed on the nanosponge surface, establishing thematrix on the nanosponge fact that was entirely formed byparacetamol, aceclofenac and caffeine and b-CD.
Characterization and evaluation of optimized formulation
Comparison of pre-formulation parameters results. The pre-formulation studies conducted for the tablet formulation withthe three trials that have been complied together and T2 valueshas been found to be within the Indian pharmacopeia stan-dards (Table 8).
Evaluation studies of tablet. The prepared tablets wereevaluated for post compression properties such as percentage
Table 10 Kinetic study of T2 formulation
Formulation T2
Kinetic modelFirst orderkinetics
Zero orderkinetics
Higuchimodel
Korsmeyer–Pepasmodel
R2 0.9891 0.8436 0.8931 0.9081
This journal is © The Royal Society of Chemistry 2020

Table 11 Stability tests conducted for optimized formulation
Formulationcode
Tested aertime (in days) Hardness (kg cm�2)
Disintegrationtime (min)
Drug release(%)
Drug content(%)
F3–P31 45 3.30 � 0.04 25 � 0.57 77.5 84.96F3–A31 87.84 84.96F3–C31 89.6 89.28
Paper RSC Advances
Ope
n A
cces
s A
rtic
le. P
ublis
hed
on 2
1 Se
ptem
ber
2020
. Dow
nloa
ded
on 1
/19/
2022
12:
53:3
4 A
M.
Thi
s ar
ticle
is li
cens
ed u
nder
a C
reat
ive
Com
mon
s A
ttrib
utio
n-N
onC
omm
erci
al 3
.0 U
npor
ted
Lic
ence
.View Article Online
drug content, hardness, friability, average weight, and disinte-gration time as per the Indian pharmacopeia. The results ob-tained are presented in the Table 9. The formulation T2 passesthe test as per the pharmacopeial specication for the postcompression evaluations.
Dissolution studies. The prepared nanosponge compressedinto tablet (formulation T2) was evaluated for % cumulativedrug release. It indicated rapid dissolution in pH 5.5 phosphatebuffer with 32.4% of drug released at 5th min and 89.6% of thedrug by the end of 30th minmeeting the excepted outcome. Thedissolution rate prole for the formulation T2 is presented inthe Fig. 12. The release data was tted into various equations tounderstand the order of release and mechanism. The data ob-tained with regression value (R2) is presented in the Table 10.The drug release follows rst order kinetics and is concentra-tion dependent as the regression value was found to be 0.9891.The release tted well in Higuchi equation indicating the drugrelease was by diffusion mechanism and follows Fickiankinetics as evident from the regression value of Korsmeyer–Pepas equation. The chemistry behind the drug loading, fol-lowed by its release is explained as follows; the fabricatednanocarriers were nanosponges that comprised of complexnetworks of cross-linked cyclodextrins with a roughly sphericalstructure, about the size of a protein, having channels, poresand numerous interconnected voids inside.32,33 The nano-sponges are made up of a ‘backbone’ (a scaffold structure) ofnaturally degradable polyester. The polyester strands are mixedin solution with small molecules called cross-linkers that havean affinity for certain portions of the polyester. They ‘cross link’segments of the polyester to form a porous structure that hasmany pockets (or cavities), where drugs gets entrapped. Thedrugs get inclusively complexed and/or molecularly dispersedinto these porous cages.34 Post administration, over the passingtime, the biodegradable cyclodextrin polymer gets slowlydegraded to release the entrapped drugs.
Torne S. J. et al., (2010), have prepared and evaluatedpaclitaxel-loaded nanosponges for pharmacokinetic parametersin rats and the intrinsic effect of the dosage form on improve-ment of paclitaxel oral bioavailability. Paclitaxel-loaded nano-sponges were prepared and characterized in terms of sizedistribution, drug solubilization and the kinetics of paclitaxelsedimentation. Taxol and paclitaxel loaded nanosponges wereadministered orally to rats. The relative oral bioavailability ofpaclitaxel-loaded nanosponges was found. Aer oral adminis-tration of loaded nanosponges, the area under the plasmaconcentration time curve was signicantly increased by 3 fold incomparison to the control group. This indicated paclitaxel-
This journal is © The Royal Society of Chemistry 2020
loaded nanosponges as promising new formulation toenhance the oral bioavailability of paclitaxel. It also showedpromising role in the solubility of the drug. Hence, nano-sponges can be considered as a better choice of dosage form toincrease the solubility and bioavailability.35
Stability studies. The formulation T2 was chosen for stabilitystudies, as it was considered as the optimized formulation. Thestability studies were conducted at temp 40 �C � 2 �C and 75 �2% RH for the formula selected up to 45 days. The results ob-tained indicated no signicant changes compared for parame-ters before and aer study period, indicating that theformulation F3 was stable and passed the stability test (Table11).
Conclusion
The drugs paracetamol, aceclofenac and caffeine had variedsolubility proles, and formulating them into single tablet didnot have the desired dissolution prole for drug absorption.Therefore, they were successfully loaded into the nanospongethat was prepared by the hot-melt method. The nanospongecharacterization studies conrmed the entrapment of the drugwithin the colloidal three-dimensional structure of b-CD withthe formation of an inclusion complex. The entrapped drugsproperties have been modied from crystalline to amorphousnature, which enhances drug solubility. The optimized nano-sponge loaded formulations obtained by computer-based opti-mization technique was directly compressed into tablets withsuitable diluents. The results of in vitro dissolution studies ofnanosponge tablets indicated rapid dissolution due to changedsolubility properties of the drug, compared to pure drugmeeting the set objective enhanced absorption. The stabilitystudies indicated the optimized formulation was stable at temp40 �C � 2 �C and 75 � 2% RH for the formula selected up to 45days. Thus, it can be concluded that drug with different solu-bility prole can be loaded into nanosponge that have opti-mized dissolution properties for combination therapy.
Conflicts of interest
The authors have no conict of interest to declare.
References
1 I. Krabicova, S. L. Appleton, M. Tannous, G. Hoti, F. Caldera,P. A. Rubin, C. Cecone, R. Cavalli and F. Trotta, Polymers,2020, 12(5), 1122.
RSC Adv., 2020, 10, 34869–34884 | 34883

RSC Advances Paper
Ope
n A
cces
s A
rtic
le. P
ublis
hed
on 2
1 Se
ptem
ber
2020
. Dow
nloa
ded
on 1
/19/
2022
12:
53:3
4 A
M.
Thi
s ar
ticle
is li
cens
ed u
nder
a C
reat
ive
Com
mon
s A
ttrib
utio
n-N
onC
omm
erci
al 3
.0 U
npor
ted
Lic
ence
.View Article Online
2 S. Pawar, P. Shende and F. Trotta, Int. J. Pharm., 2019, 565,333–350.
3 O. M. Amin, A. Ammar and S. A. Eladawy, J. Pharm. Invest.,2020, 50, 399–411.
4 R. Cavalli, A. K. Akhter, A. Bisazza, P. Giustetto, F. Trotta andP. Vavia, Int. J. Pharm., 2010, 402, 254–257.
5 A. Singireddy, S. R. Pedireddi and S. Subramanian, J. Polym.Res., 2019, 26(4), 93.
6 A. P. Sherje, B. R. Dravyakar, D. Kadam and M. Jadhav,Carbohydr. Polym., 2017, 173, 37–49.
7 S. Sapino, M. E. Carlotti, R. Cavalli, E. Ugazio, G. Berlier,L. Gastaldi and S. Morel, J. Inclusion Phenom. MacrocyclicChem., 2013, 75, 69–76.
8 H. V. Gangadharappa, S. M. Prasad and R. P. Singh, J. DrugDelivery Sci. Technol., 2017, 41, 488–501.
9 D. Li and M. Ma, Cyclodextrin polymer separation materials,WO 9822197, 1998 May 28.
10 M. F. Zidan, H. F. Ibrahim, M. I. Afouna and E. A. Ibrahim,Drug Dev. Ind. Pharm., 2018, 44, 1243–1253.
11 E. Roberts, V. Delgado Nunes, S. Buckner, S. Latchem,M. Constanti, P. Miller, M. Doherty, W. Zhang, F. Birrell,M. Porcheret, K. Dziedzic, I. Bernstein, E. Wise andP. G. Conaghan, Ann. Rheum. Dis., 2016, 75, 552–559.
12 J. Guo, Y. Xiao, Y. Lin, J. Crommen and Z. Jiang, J.Chromatogr. A, 2016, 1467, 288–296.
13 H. A. Hodali, R. S. Rawajfeh and N. A. Allababdeh, J.Dispersion Sci. Technol., 2017, 38, 1342–1347.
14 A. Vishwakarma, P. Nikam, R. Mogal and S. Talele, Int. J.Pharm. Tech. Res., 2014, 6, 11–20.
15 N. M. P. Habeeba, K. Gladisa, Y. Anithaa andS. Mohammedc, Int. J. Biopharm., 2013, 4(1), 10–17.
16 S. M. Omar, F. Ibrahim and A. Ismail, Saudi Pharm. J., 2020,28, 349–361.
17 C.-L. Lee, C.-C. Wu, H.-P. Chiou, C.-M. Syu, C.-H. Huang andC.-C. Yang, Int. J. Hydrogen Energy, 2011, 36, 6433–6440.
18 S. Honary, P. Ebrahimi and R. Hadianamrei, Pharm. Dev.Technol., 2014, 19, 987–998.
34884 | RSC Adv., 2020, 10, 34869–34884
19 V. Singh, J. Xu, L. Wu, B. Liu, T. Guo, Z. Guo, P. York, R. Grefand J. Zhang, RSC Adv., 2017, 7, 23759–23764.
20 A. E.-D. Omara, T. Elsakhawy, T. Alshaal, H. El-Ramady,Z. Kovacs and M. Fari, Environment, Biodiversity and SoilSecurity, 2019, 3, 29–62.
21 D. J. E. Francis and F. S. Yusuf, Univers. J. Pharm. Res., 2019,4(1), 24–28.
22 P. Jyoti, B. Tulsi, K. Popin and B. Chetna, Indo Global J.Pharm. Sci., 2016, 6, 59–64.
23 S. C. B. Penjuri, N. Ravouru, S. Damineni, S. BNS andS. R. Poreddy, Turk. J. Pharm. Sci., 2016, 13, 304–310.
24 P. Srinivas and K. Sreeja, Int. J. Drug Dev. Res., 2013, 5, 55–69.25 B. B. Karad and A. D. Shinde, Indo Am. J. Pharm. Res., 2017,
7(08), 471–479.26 P. N. Remya, T. S. Saraswathi, S. Sangeetha, N. Damodharan
and R. Kavitha, J. Pharm. Sci. Res., 2016, 8, 1258–1261.27 A. O. Abioye and A. Kola-Mustapha, Drug Dev. Ind. Pharm.,
2016, 42, 39–59.28 A. Vyas, S. Saraf and S. Saraf, J. Inclusion Phenom. Macrocyclic
Chem., 2008, 62, 23–42.29 S. Swaminathan, P. R. Vavia, F. Trotta and S. Torne, J.
Inclusion Phenom. Macrocyclic Chem., 2007, 57, 89–94.30 P. Shende, K. Deshmukh, F. Trotta and F. Caldera, Int. J.
Pharm., 2013, 456, 95–100.31 L. Strober, J. Englert, F. Munschauer, B. Weinstock-
Guttman, S. Rao and R. Benedict, Mult. Scler. J., 2009, 15,1077–1084.
32 S. D. Mhlanga, B. B. Mamba, R. W. Krause andT. J. Malefetse, J. Chem. Technol. Biotechnol., 2007, 82, 382–388.
33 F. Trotta and R. Cavalli, Compos. Interfaces, 2009, 16, 39–48.34 R. K. Sharma and A. E. Yassin, Indian J. Ophthalmol., 2014,
62, 768.35 S. J. Torne, K. A. Ansari, P. R. Vavia, F. Trotta and R. Cavalli,
Drug Delivery, 2010, 17, 419–425.
This journal is © The Royal Society of Chemistry 2020