Embed Size (px)
Citation preview
NASA Technical Paper 3418
Design and Evaluation of an ElectromagneticBeam Waveguide for Measuring ElectricalProperties of Materials
M. C. Bailey
February 1994
NASA Technical Paper 3418
Design and Evaluation of an ElectromagneticBeam Waveguide for Measuring ElectricalProperties of MaterialsM. C. BaileyLangley Research Center � Hampton, Virginia
National Aeronautics and Space AdministrationLangley Research Center � Hampton, Virginia 23681-0001
February 1994
National Aeronautics andSpace AdministrationCode JTTWashington, D.C.20546-0001
Official BusinessPenalty for Private Use, $300
B U L K R A T E
POSTAGE & FEES PAIDNASA Permit No. G-27
Postmaster: If undeliverable (Section 158 Postal Manual) Do Not Return
Abstract
A beam waveguide has been designed that is based upon the prop-
agation characteristics of the fundamental Gaussian beam and the
focusing properties of spherical dielectric lenses. The 20-GHz, two-
horn, four-lens system was constructed and experimentally evaluated
by probing the �eld in a plane perpendicular to the beam axis at
the center of the beam waveguide system. The critical parameters
were determined by numerical sensitivity studies, and the lens-horn
critical spacing was adjusted to better focus the beam at the probe
plane. The measured performance was analyzed by consideration of
higher order Gaussian-Laguerre beam modes. The beam waveguide
system was successfully used in the measurements of the electro-
magnetic transmission properties of Shuttle thermal-protection tiles
while the tile surface was being heated to reentry-level temperatures
with a high-power laser.
Introduction
In the determination of the electrical characteristics of materials, measuring the magnitude
and phase of the plane wave re ection and transmission coe�cients of the material at the
frequency of interest is often desirable. Interpretation of the electrical properties from these
measurements is greatly simpli�ed by using a planar sheet of the material; however, di�culties
are sometimes encountered in producing a plane wave through a sheet of material of very limited
surface area. One approach is to place a precision-machined sample of the material in a metal-
enclosed cavity or waveguide; however, cutting the material to obtain a sample destroys the
original sheet. Another approach is to transmit and receive plane waves with a horn antenna on
each side of the sheet. In the two-horn approach, di�ractions from the edges of the sheet can
cause signi�cant errors in the measurements. The present approach uses small horns and a series
of quartz lenses to focus the electromagnetic �eld on the surface of the sheet of test material, at
some distance from each horn aperture, to a small circular cross section and uniform phase.
The motivation for the present design was the need for measurement of the electrical
characteristics of Shuttle thermal-protection tile when the outer surface of the tile is heated to
very high temperatures, such as those encountered during atmospheric reentry. The technique
chosen for heating the tile surface was to utilize a high-output laser directed toward one side of
the tile. The heating of the tile surface could be controlled by the laser beam diameter and laser
output power. The laser beam diameter was adjusted to approximately 4 in. and was directed
toward the tile surface at an incidence angle of approximately 40�. This laser system allowed
essentially uniform heating of the 4-in. central portion of a 6- by 6-in. sample of tile material. A
detailed description of the experiment is contained in reference 1. The present report describes
the design of the 20-GHz beam waveguide system used in that experiment for transmission
measurements.
The design objective was to transmit an electromagnetic wave with a planar phase front
and more than 90 percent of the power contained within the heated portion of the tile surface.
Because of the requirement of an unblocked line of sight for the laser heating, all components of
the 20-GHz system were placed at some distance from the tile while producing an electromagnetic
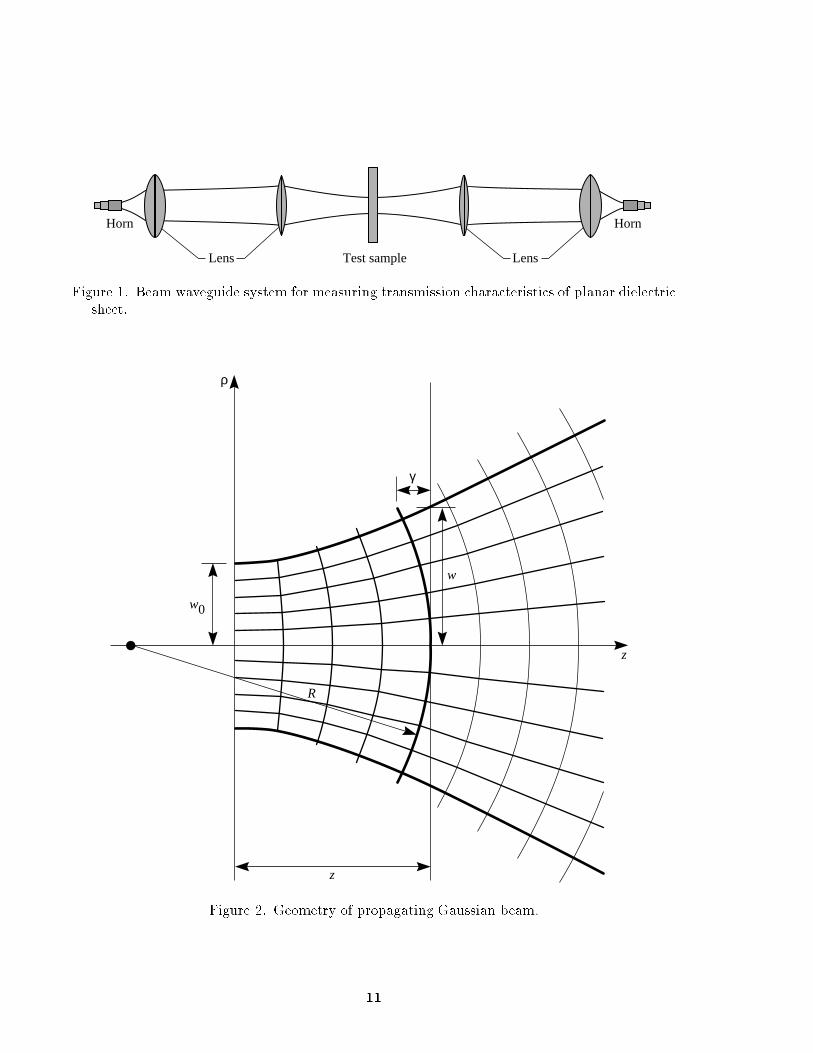
wave at normal incidence to the tile surface. The technique for achieving the objective is
illustrated in �gure 1. The 20-GHz system consists of two small horns and four quartz focusing
lenses in a Gaussian beam waveguide. The pertinent equations for Gaussian beam propagation
and the focusing properties of spherical lenses are reviewed in the next two sections. In later
sections, the fundamental Gaussian beam mode is used for the design and sensitivity studies ofthe present beam waveguide system and measured results are presented for evaluation.
Symbols
A�n amplitude of (�;n) Gaussian-Laguerre beam mode
a radius of horn aperture
D diameter of lens
d1 distance from input beam waist to entrance principal plane of �rst lens
d2 distance from exit beam waist to exit principal plane of �rst lens
d3 distance from entrance beam waist to entrance principal plane of second lens
d4 distance from exit beam waist to exit principal plane of second lens
e base of natural system of logarithms (e = 2:718281828459)
F1 focal length of �rst lens
F2 focal length of second lens
J0( ) Bessel function of �rst kind of order 0
j =p�1
k free-space propagation constant, 2�=�
L1 distance from entrance beam waist to center of �rst lens in beam waveguide
L2 center-to-center axial spacing between �rst and second lenses in beam waveguide
L3 distance along axis from center of second lens to center of beam waveguide
L(�)n generalized Laguerre polynomial
n index of radial variation in beam �eld distribution
R radius of curvature of beam phase front
R1 radius of curvature of lens nearest to horn (i.e., �rst lens)
R2 radius of curvature of lens farthest from horn (i.e., second lens)
r radius of curvature of lens entrance surface
r0 radius of curvature of lens exit surface
rms root mean square
T thickness of lens
T1 edge thickness of lens nearest to horn
T2 edge thickness of lens farthest from horn
u principal plane at entrance side of lens
u0 principal plane at exit side of lens
w half-width of beam (where �eld equals e�1 of on-axis value)
w0 half-width of beam at beam waist
w1 half-width of beam at entrance beam waist of �rst lens
2
w2 half-width of beam at exit beam waist of �rst lens and entrance beam waist ofsecond lens
w3 half-width of beam at exit beam waist of second lens
x; y rectangular coordinates
z cylindrical coordinate variable along axis of beam in direction of propagation
z0 axial distance from exit beam waist of second lens to probe plane
z0 axial distance from entrance Gaussian beam waist to horn aperture
� index of circumferential variation in beam �eld distribution
quadratic phase taper across width of beam
� quantity de�ned by equation (13)
� axial distance between lens entrance surface and lens entrance principal plane
�0 axial distance between lens exit surface and lens exit principal plane
"0 permittivity of vacuum
"1 permittivity of dielectric lens
"r relative dielectric constant of lens, "1="0
� wavelength of �eld
�1 spacing between principal planes for �rst lens
�2 spacing between principal planes for second lens
� cylindrical coordinate variable in radial direction
� reciprocal of standard deviation for Gaussian distribution
�00 propagation phase delay of fundamental Gaussian beam mode
��n propagation phase delay of (�; n) Gaussian-Laguerre beam mode
� cylindrical coordinate variable in circumferential direction
� argument of Laguerre polynomial
scalar �eld quantity
Gaussian Beam Characteristics
Since the late 1950's Gaussian beam theory has been extensively utilized in laser systems. Agood basic review of the theory of laser beams and resonators is contained in reference 2. Theconcept of electromagnetic wave beams was also introduced in the early 1960's (ref. 3) and wasutilized in a millimeter wave beam waveguide with phase-correcting lenses (ref. 4).
For a wave propagating in the z-direction, an approximate solution (ref. 2) to the waveequation, valid near the axis of propagation, can be rewritten in cylindrical coordinates as
(�; �; z) =
�w0
w (z)
�exp
"��
�
w (z)
�2#exp
��j�
k�2
2R (z)
��exp (�jkz)
�1Xn=0
1X�=0
A�n
�p2
�
w (z)
��
L(�)
n
(2
��
w (z)
�2)
� exp (�j��) exp
"j (2n + � + 1) tan�1
�z
�w2
0
!#(1)
3
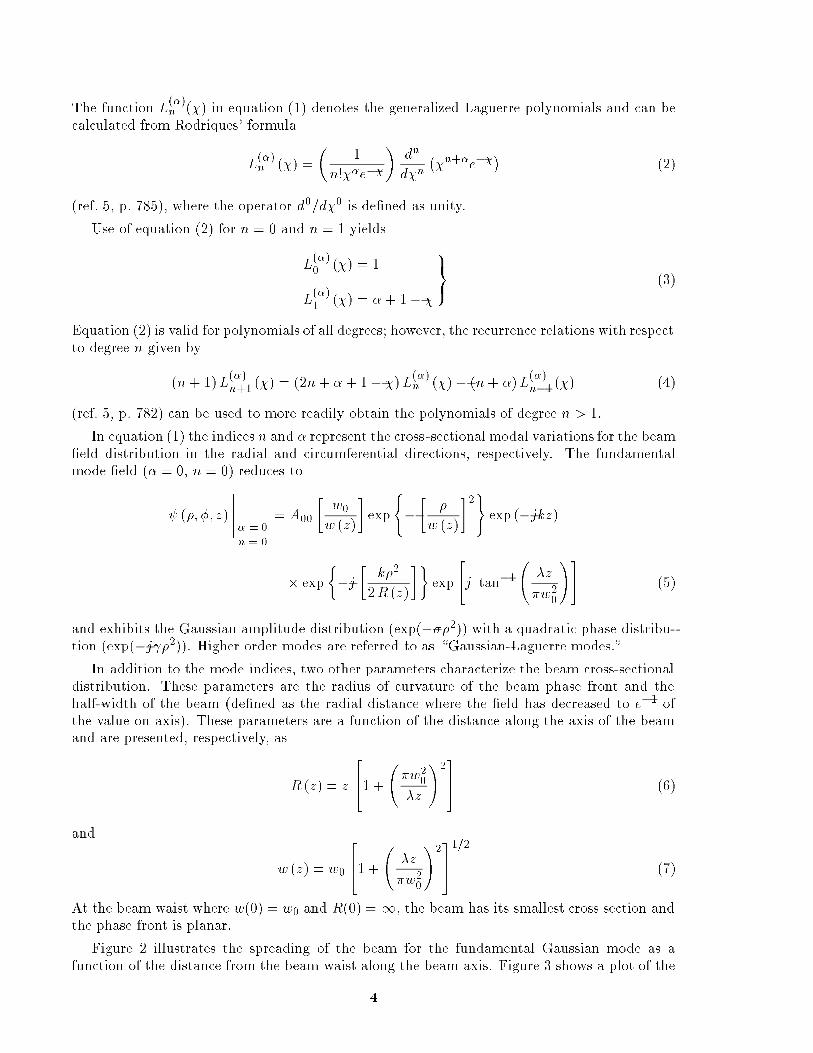
The function L(�)n (�) in equation (1) denotes the generalized Laguerre polynomials and can be
calculated from Rodriques' formula
L(�)n (�) =
�1
n!��e��
�dn
d�n
��n+�e��
�(2)
(ref. 5, p. 785), where the operator d0=d�0 is de�ned as unity.
Use of equation (2) for n = 0 and n = 1 yields
L(�)0 (�) = 1
L(�)1 (�) = �+ 1� �
9=; (3)
Equation (2) is valid for polynomials of all degrees; however, the recurrence relations with respectto degree n given by
(n+ 1)L(�)n+1 (�) = (2n+ � + 1� �)L
(�)n (�) � (n+ �)L
(�)n�1 (�) (4)
(ref. 5, p. 782) can be used to more readily obtain the polynomials of degree n > 1.
In equation (1) the indices n and � represent the cross-sectional modal variations for the beam�eld distribution in the radial and circumferential directions, respectively. The fundamentalmode �eld (� = 0, n = 0) reduces to
(�;�; z)
������ = 0n = 0
= A00
�w0
w (z)
�exp
(�
��
w (z)
�2)exp (�jkz)
� exp
��j
�k�2
2R (z)
��exp
"j tan�1
�z
�w20
!#(5)
and exhibits the Gaussian amplitude distribution (exp(���2)) with a quadratic phase distribu-tion (exp(�j �2)). Higher order modes are referred to as \Gaussian-Laguerre modes."
In addition to the mode indices, two other parameters characterize the beam cross-sectionaldistribution. These parameters are the radius of curvature of the beam phase front and thehalf-width of the beam (de�ned as the radial distance where the �eld has decreased to e�1 ofthe value on axis). These parameters are a function of the distance along the axis of the beamand are presented, respectively, as
R (z) = z
241 +
�w2
0
�z
!235 (6)
and
w (z) = w0
241 +
�z
�w20
!2351=2
(7)
At the beam waist where w(0) = w0 and R(0) = 1, the beam has its smallest cross section andthe phase front is planar.
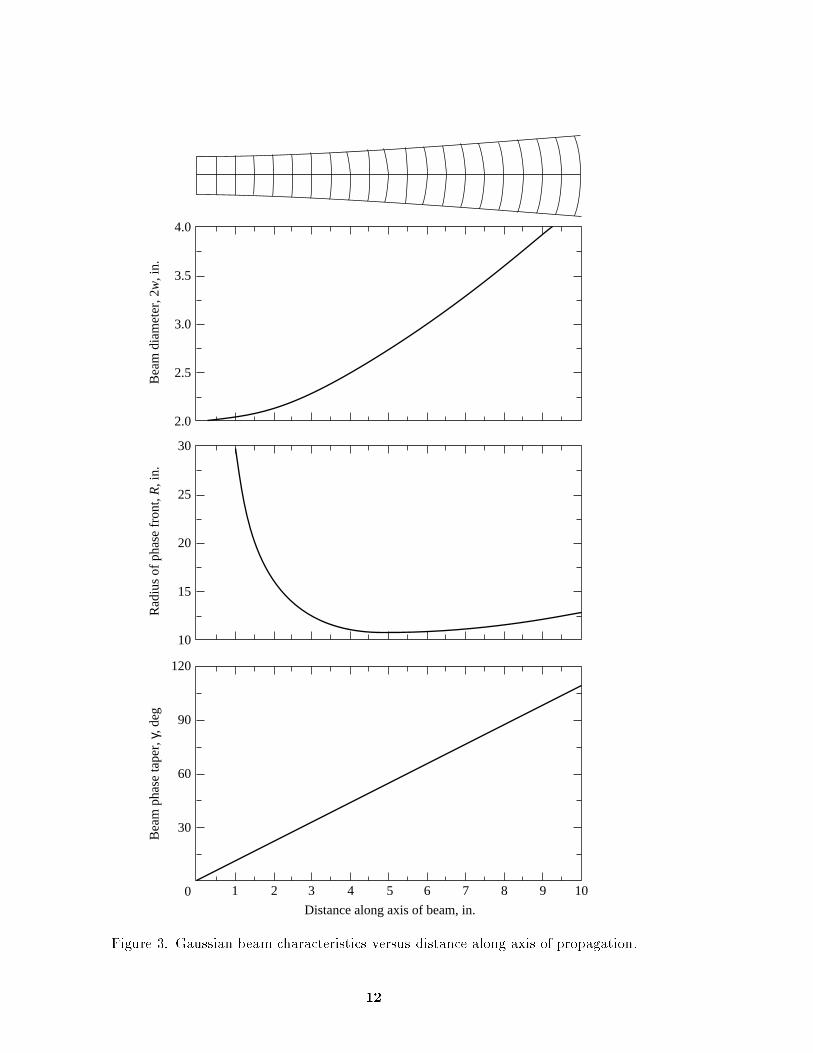
Figure 2 illustrates the spreading of the beam for the fundamental Gaussian mode as afunction of the distance from the beam waist along the beam axis. Figure 3 shows a plot of the
4
beam diameter (2w), radius of curvature of the phase front (R), and the beam quadratic phasetaper ( ) as a function of the distance (z) from the beam waist at a frequency of 20 GHz andbeam waist diameter of 2 in. The beam spot size of 2 in. is chosen as the objective of the systemdesign for measurements of tile properties (ref. 1).
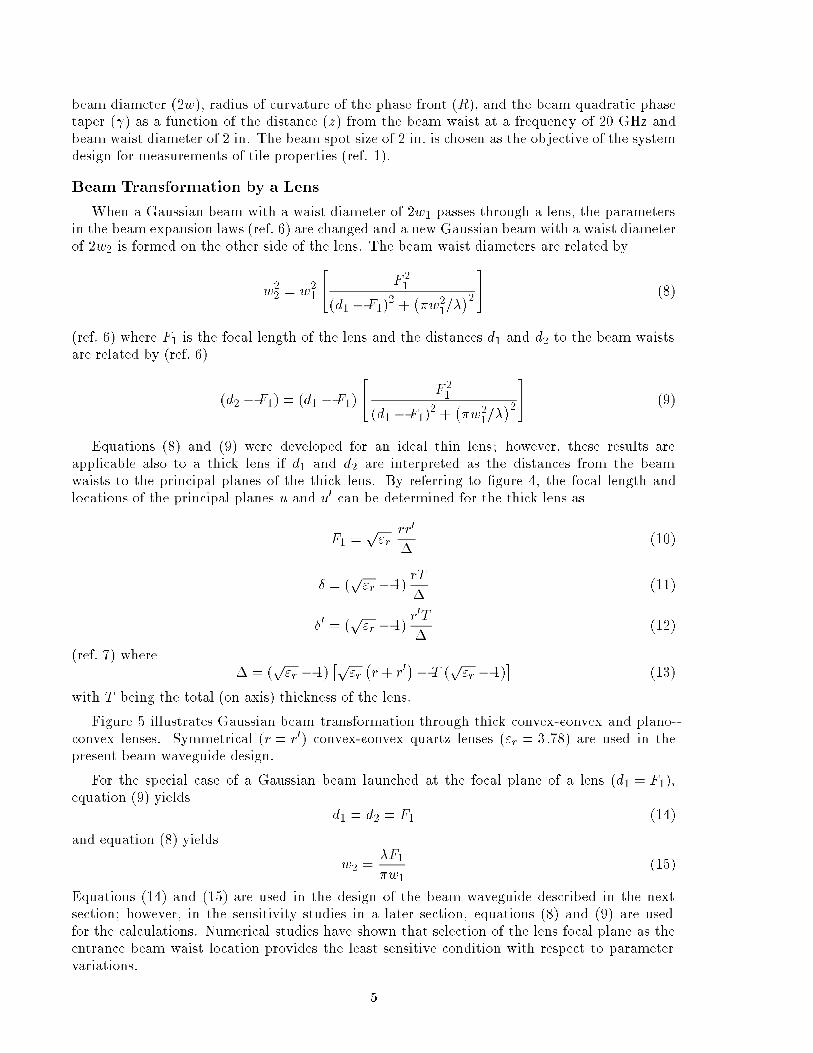
Beam Transformation by a Lens
When a Gaussian beam with a waist diameter of 2w1 passes through a lens, the parametersin the beam expansion laws (ref. 6) are changed and a new Gaussian beam with a waist diameterof 2w2 is formed on the other side of the lens. The beam waist diameters are related by
w2
2= w2
1
"F 2
1
(d1 � F1)2 +
��w2
1=�
�2#
(8)
(ref. 6) where F1 is the focal length of the lens and the distances d1 and d2 to the beam waistsare related by (ref. 6)
(d2 � F1) = (d1 � F1)
"F 2
1
(d1 � F1)2 +
��w2
1=�
�2#
(9)
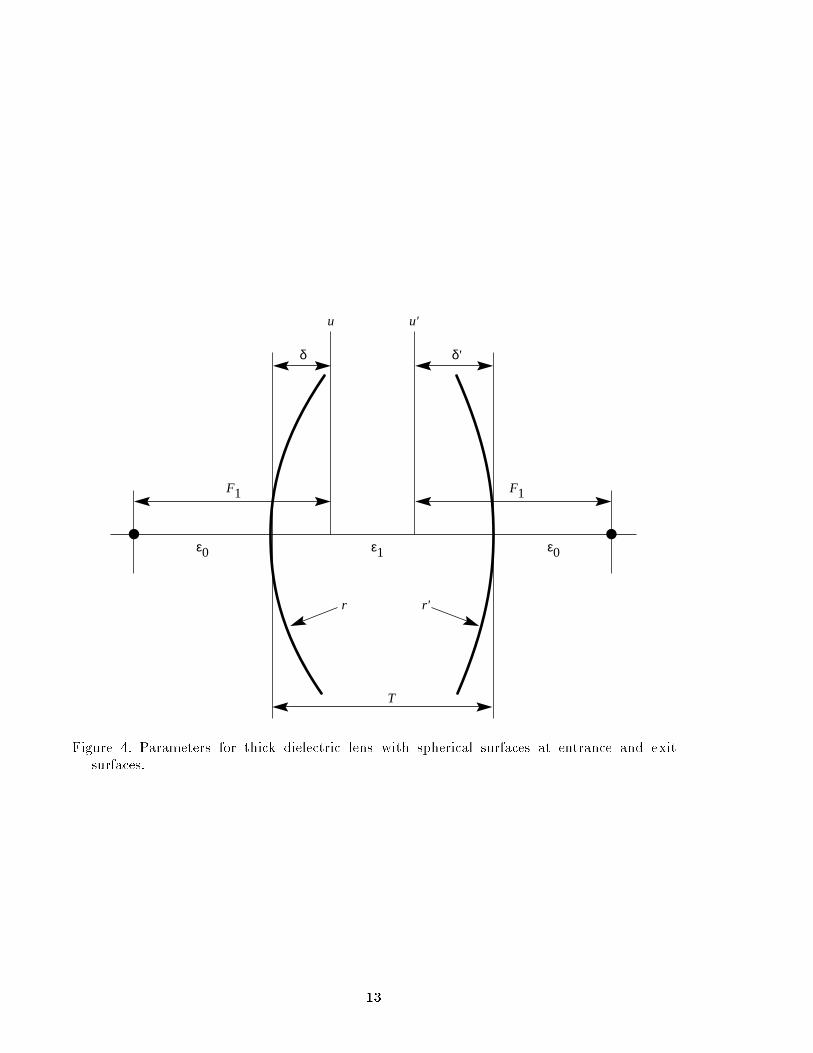
Equations (8) and (9) were developed for an ideal thin lens; however, these results areapplicable also to a thick lens if d1 and d2 are interpreted as the distances from the beamwaists to the principal planes of the thick lens. By referring to �gure 4, the focal length andlocations of the principal planes u and u0 can be determined for the thick lens as
F1 =p"r
rr0
�(10)
� = (p"r � 1)
rT
�(11)
�0 = (p"r � 1)
r0T
�(12)
(ref. 7) where� = (
p"r � 1)
�p"r
�r + r0
�� T (
p"r � 1)
�(13)
with T being the total (on axis) thickness of the lens.
Figure 5 illustrates Gaussian beam transformation through thick convex-convex and plano-convex lenses. Symmetrical (r = r0) convex-convex quartz lenses ("r = 3:78) are used in thepresent beam waveguide design.
For the special case of a Gaussian beam launched at the focal plane of a lens (d1 = F1),equation (9) yields
d1 = d2 = F1 (14)
and equation (8) yields
w2 =�F1
�w1
(15)
Equations (14) and (15) are used in the design of the beam waveguide described in the nextsection; however, in the sensitivity studies in a later section, equations (8) and (9) are usedfor the calculations. Numerical studies have shown that selection of the lens focal plane as theentrance beam waist location provides the least sensitive condition with respect to parametervariations.
5

Beam Waveguide Design
The objective of the beam waveguide design is to transmit a wave that produces a spotapproximately 2 in. in diameter with a uniform phase front at the surface of the material that isbeing tested for its transmission characteristics. The allowance of an unblocked laser beam forheating the surface of the tile under test is also required.
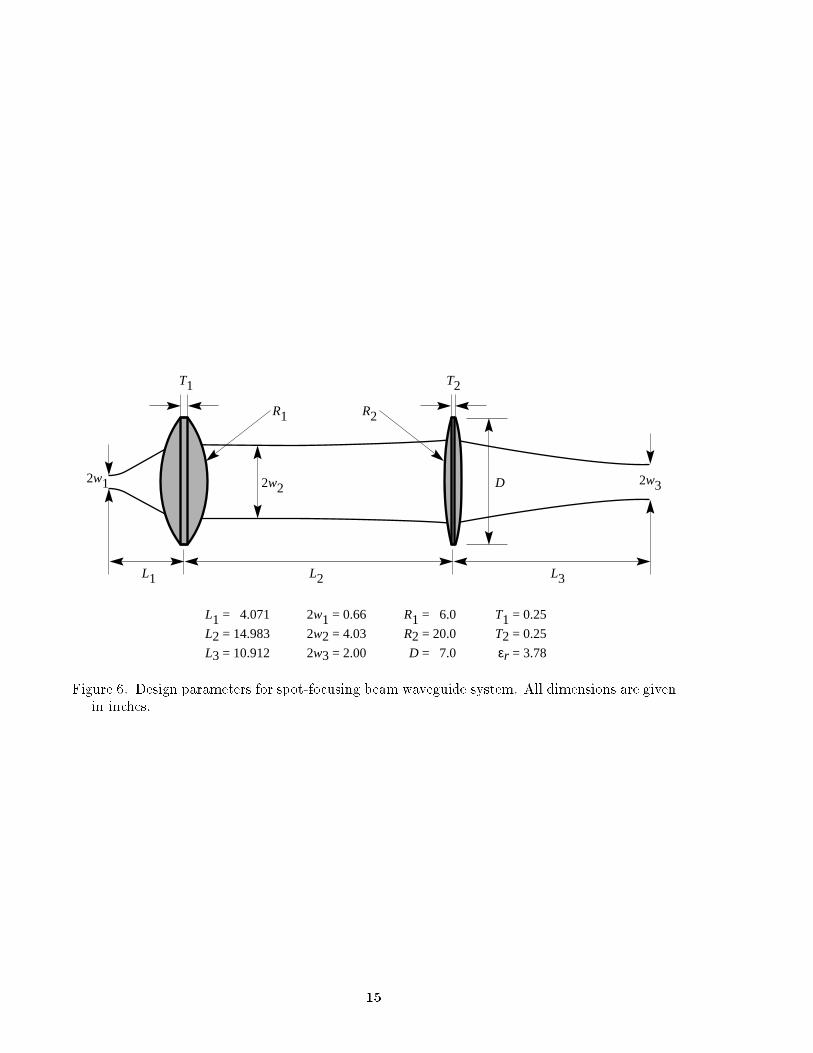
The geometry of the system is illustrated in �gure 1. A parametric study was used todetermine the lens dimensions and spacings that would be practical to implement. The �naldesign dimensions are illustrated in �gure 6 for one-half of the beam waveguide system. Thebeam waveguide is symmetrical about the spot focusing plane, where 2w3 = 2:0 in.
Because equation (15) applies to any lens, a similar expression can be obtained for the secondlens in the system, which is given as
w3 =�F2
�w2
(16)
In the design of the two-lens system, the exit beam waist for the �rst lens is also the entrancebeam waist for the second lens; therefore, combining equations (15) and (16) yields
w3
w1
=F2
F1
(17)
for the relationship between the entrance and exit beam waist spot sizes, as shown in �gure 6.Note that the ratio of the entrance and exit beam waist diameters is determined only by theratio of the focal lengths of the two lenses; however, equation (17) assumes fundamental modepropagation and location of entrance beam waist at the focal plane of the �rst lens.
Figure 7 shows a plot of the beam diameter and phase taper as a function of the distance alongthe axis of the beam. Notice that this design provides a well-focused beam over a signi�cantaxial distance, thus allowing a reasonable test zone for materials.
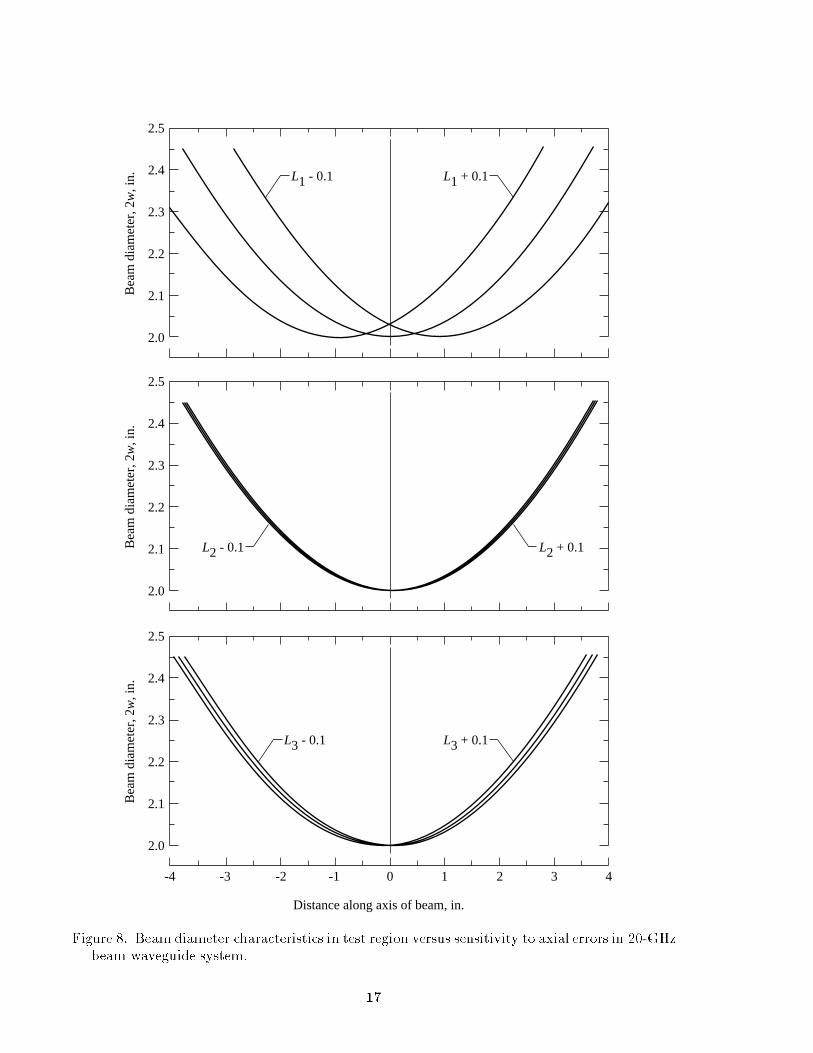
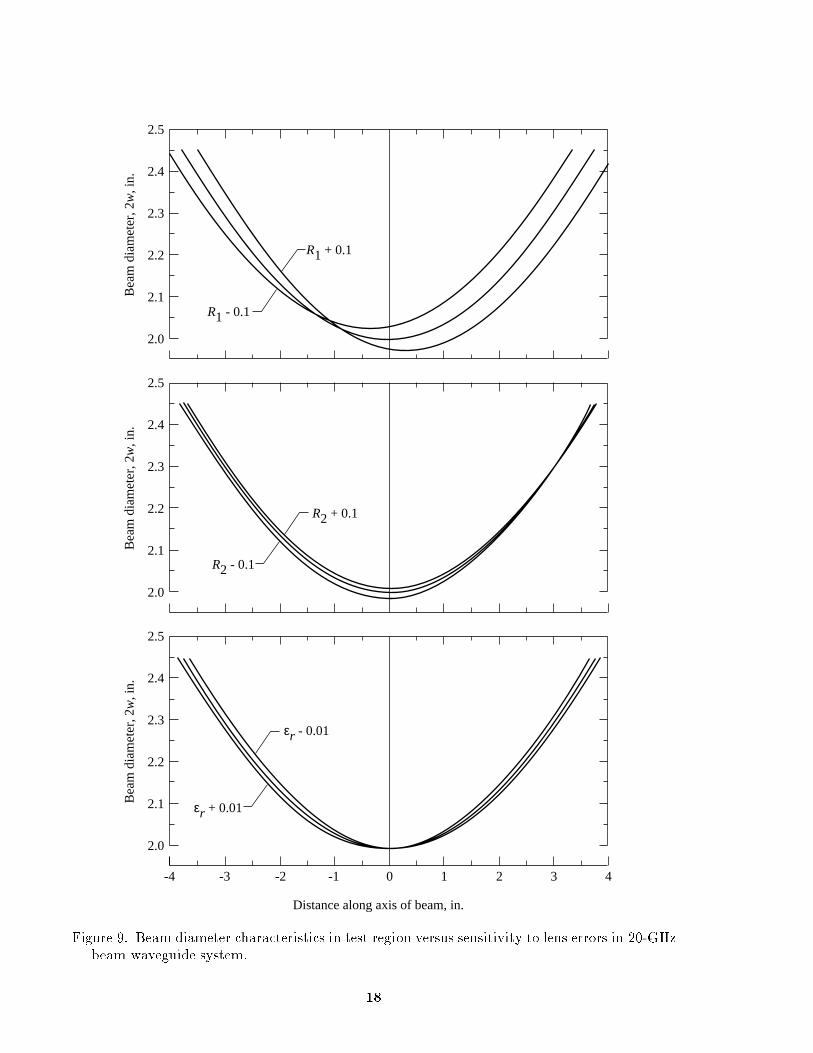
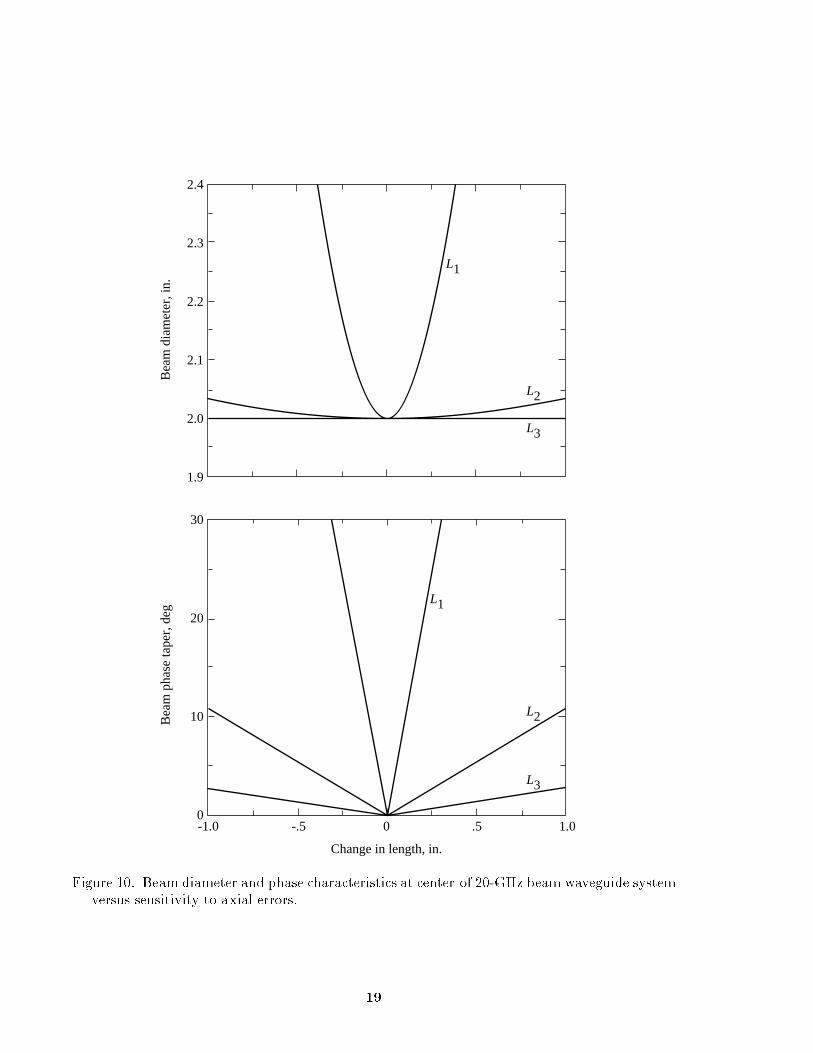
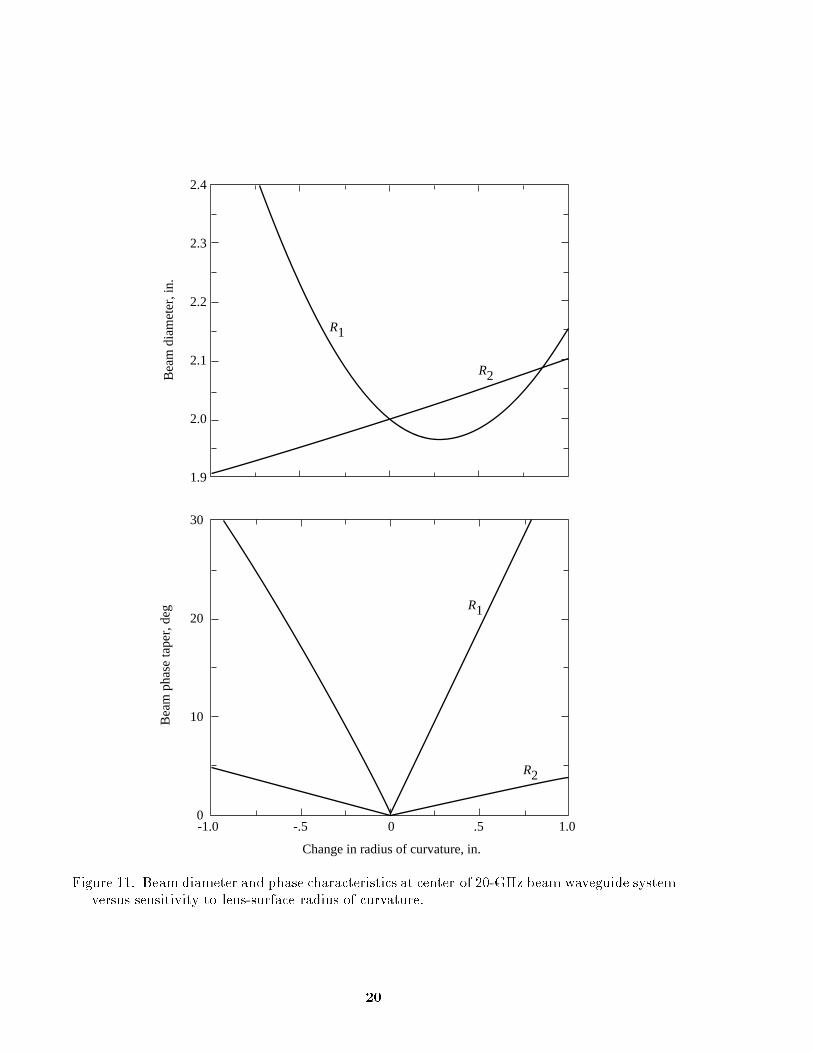
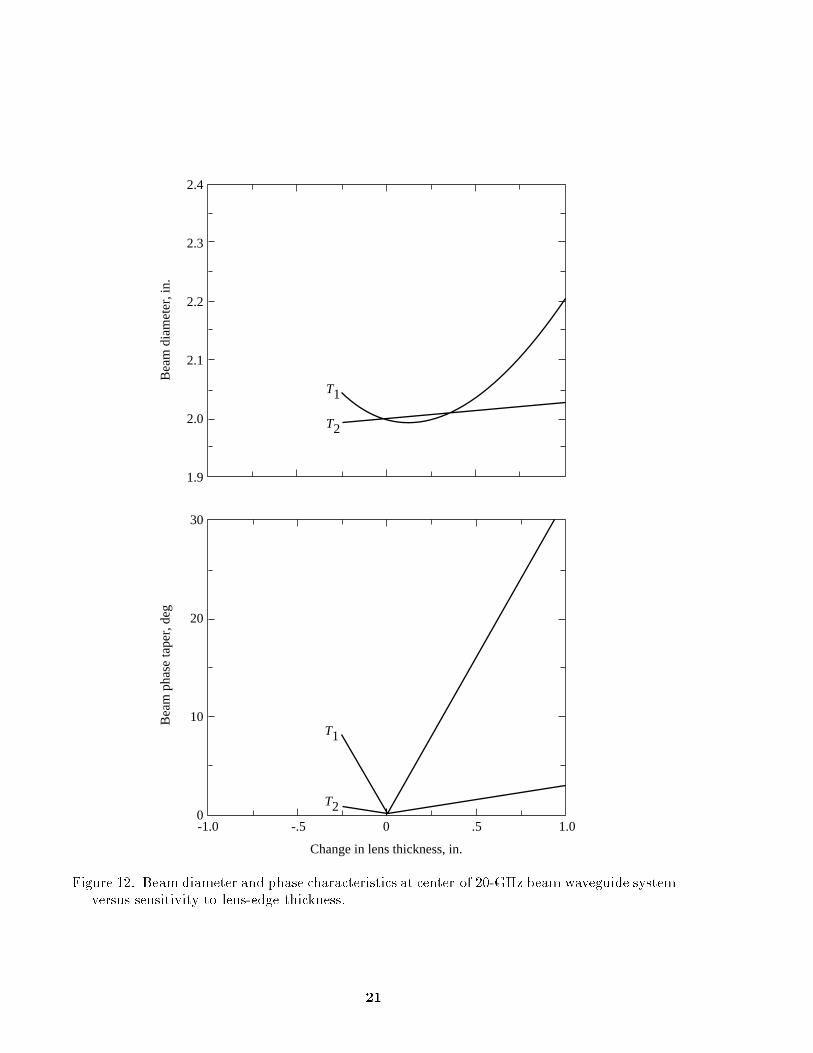
A numerical sensitivity study was conducted to determine which parameters of the designin �gure 6 are the most critical. The quantities of interest in the sensitivity study werethe beam diameter and phase taper at the test zone (i.e., the symmetric plane of the beamwaveguide system). Figures 8{12 show the variation of these quantities with changes in the designparameters. These calculations were obtained by repetitive application of equations (6){(9) withthe value of 2w1 = 0:66 in. at the entrance beam waist on the left side of the beam waveguide.The results in �gures 8 and 9 indicate that the primary e�ect of inaccuracies in the designparameters is to shift the beam spot in the axial direction. Figures 10{12 show the variationin the beam diameter and phase taper at the center of the test zone versus changes in thelens parameters. From the data of �gures 8{12, the most critical parameter appears to be thespacing (L1) between the launching plane for the entrance beam waist and the �rst lens. Earlierexperimental studies (ref. 4) reached similar conclusions for the spacing between the launcher andthe �rst lens. Also, an accurate determination of the equivalent location of the beam waist fora microwave horn is di�cult. For these reasons, the physical setup of the system was con�guredto allow a micrometer adjustment of the spacing between the horn and the �rst lens.
In order to produce a circular spot beam, the utilization of a horn antenna that radiates acircularly symmetric beam is highly desirable. A dual-mode conical horn (ref. 8) would satisfythis requirement. The horn should be designed to launch a fundamental Gaussian beam withan equivalent beam waist diameter of 0.66 in. at 20 GHz. The ratio of the beam waist diameterto the horn aperture diameter for a corrugated conical horn can be calculated as
2w0
2a= 0:6435 (18)
6
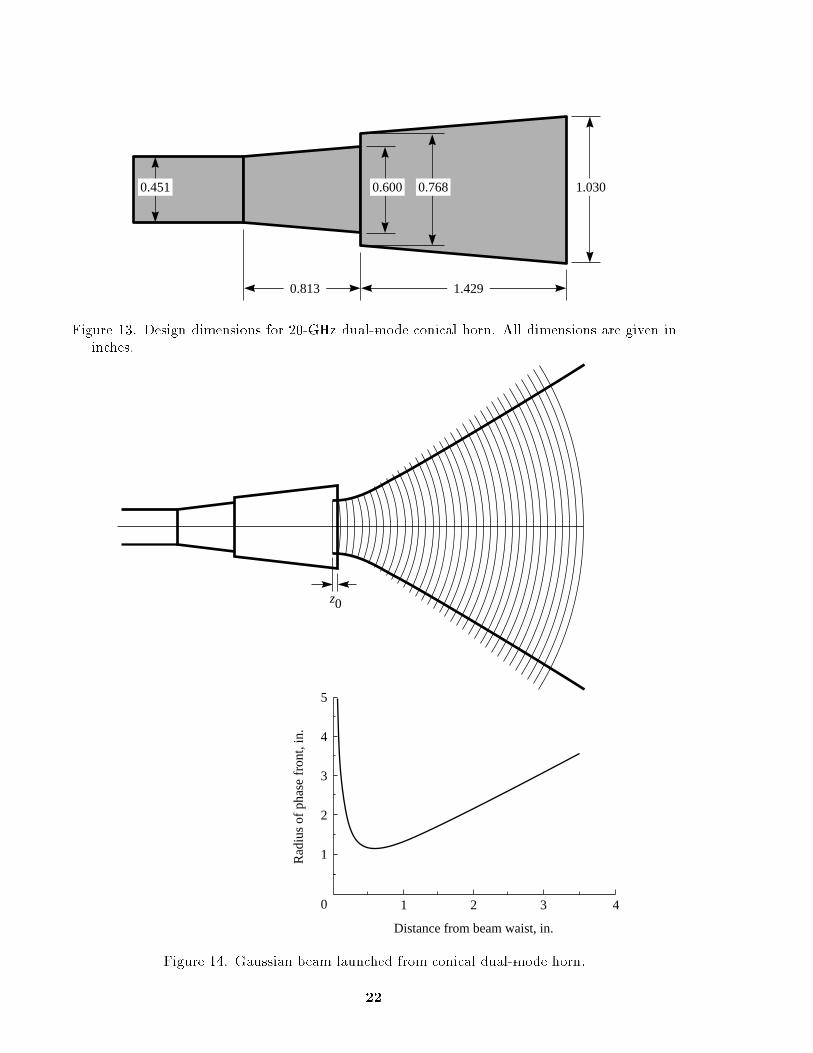
(ref. 9) where a is the radius of the horn aperture. Because the radiation patterns of dual-mode conical horns and corrugated conical horns are very similar, equation (18) should alsobe applicable to dual-mode conical horns as well. Thus, for a beam waist diameter of 0.66 in.,equation (17) indicates that a horn aperture diameter of 1.03 in. would be required. Basedupon the equations of reference 8, dual-mode horns were designed and fabricated for the beamwaveguide system, with the internal dimensions shown in �gure 13.
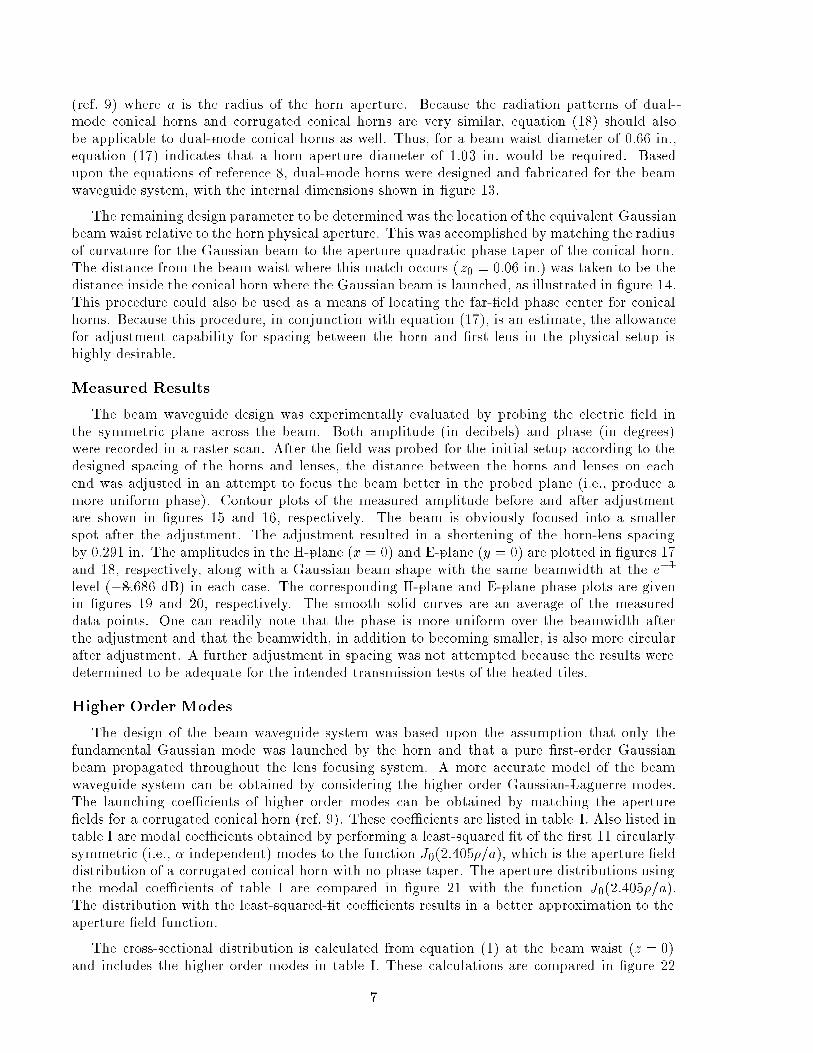
The remaining design parameter to be determined was the location of the equivalent Gaussianbeam waist relative to the horn physical aperture. This was accomplished by matching the radiusof curvature for the Gaussian beam to the aperture quadratic phase taper of the conical horn.The distance from the beam waist where this match occurs (z0 = 0:06 in.) was taken to be thedistance inside the conical horn where the Gaussian beam is launched, as illustrated in �gure 14.This procedure could also be used as a means of locating the far-�eld phase center for conicalhorns. Because this procedure, in conjunction with equation (17), is an estimate, the allowancefor adjustment capability for spacing between the horn and �rst lens in the physical setup ishighly desirable.
Measured Results
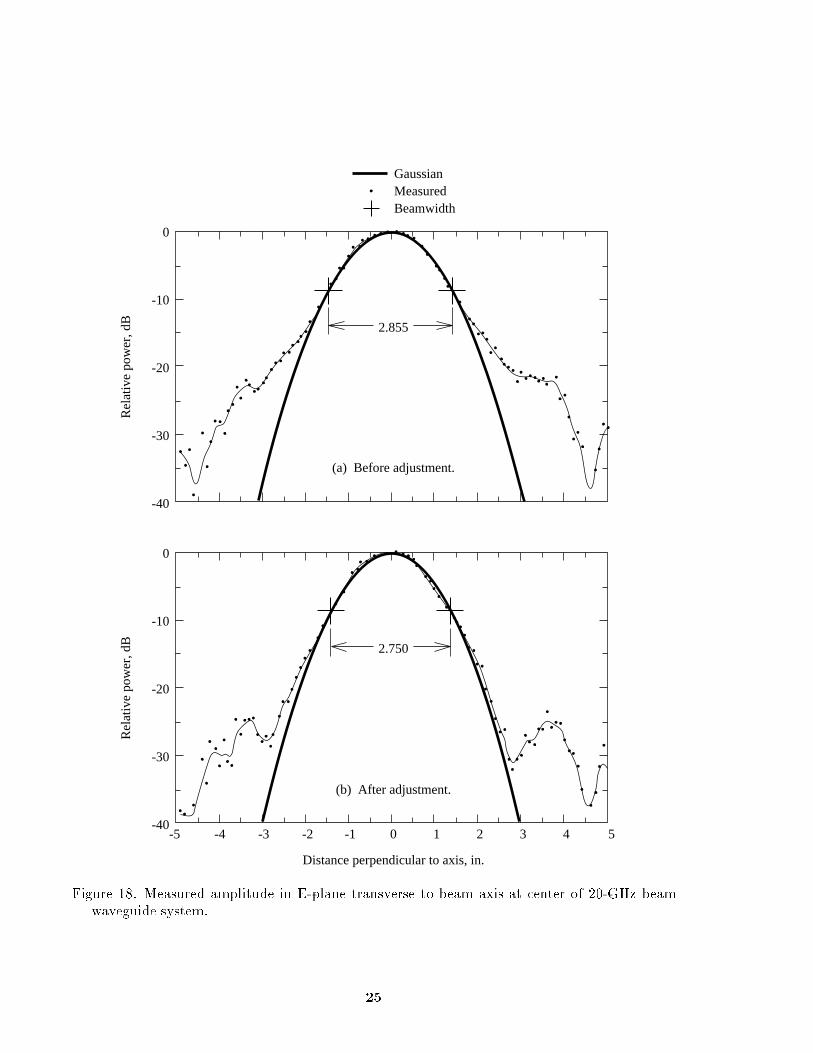
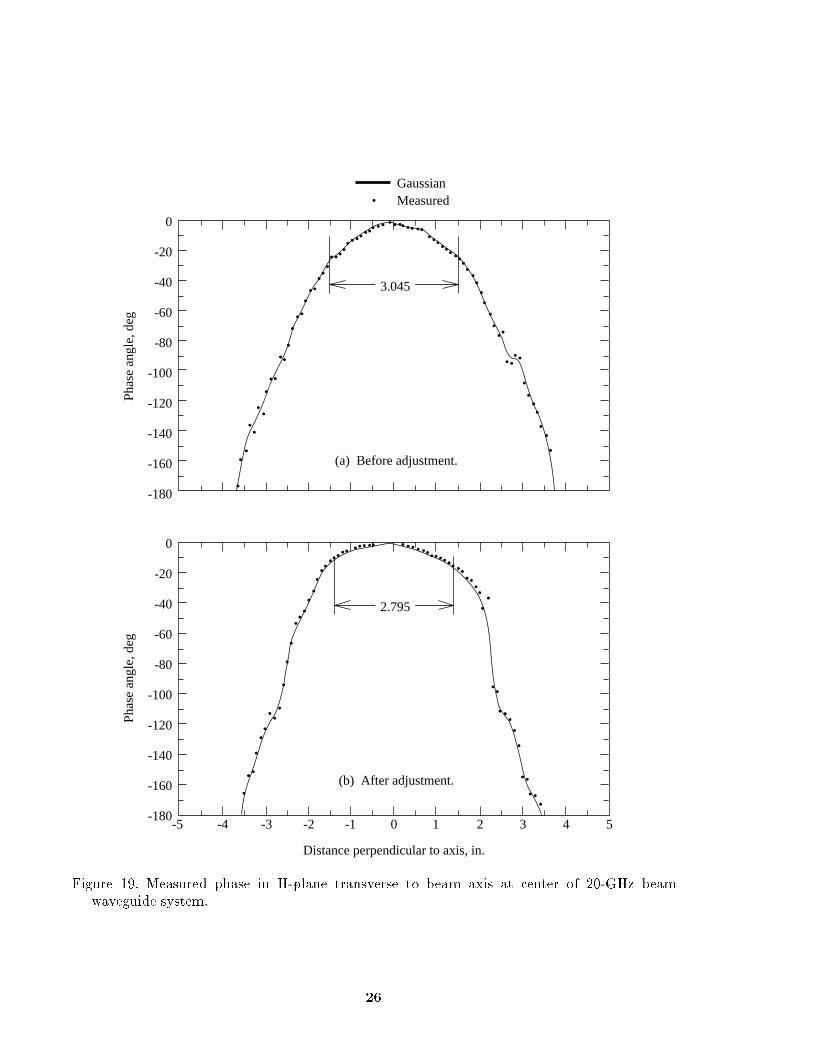
The beam waveguide design was experimentally evaluated by probing the electric �eld inthe symmetric plane across the beam. Both amplitude (in decibels) and phase (in degrees)were recorded in a raster scan. After the �eld was probed for the initial setup according to thedesigned spacing of the horns and lenses, the distance between the horns and lenses on eachend was adjusted in an attempt to focus the beam better in the probed plane (i.e., produce amore uniform phase). Contour plots of the measured amplitude before and after adjustmentare shown in �gures 15 and 16, respectively. The beam is obviously focused into a smallerspot after the adjustment. The adjustment resulted in a shortening of the horn-lens spacingby 0.291 in. The amplitudes in the H-plane (x = 0) and E-plane (y = 0) are plotted in �gures 17and 18, respectively, along with a Gaussian beam shape with the same beamwidth at the e�1
level (�8:686 dB) in each case. The corresponding H-plane and E-plane phase plots are givenin �gures 19 and 20, respectively. The smooth solid curves are an average of the measureddata points. One can readily note that the phase is more uniform over the beamwidth afterthe adjustment and that the beamwidth, in addition to becoming smaller, is also more circularafter adjustment. A further adjustment in spacing was not attempted because the results weredetermined to be adequate for the intended transmission tests of the heated tiles.
Higher Order Modes
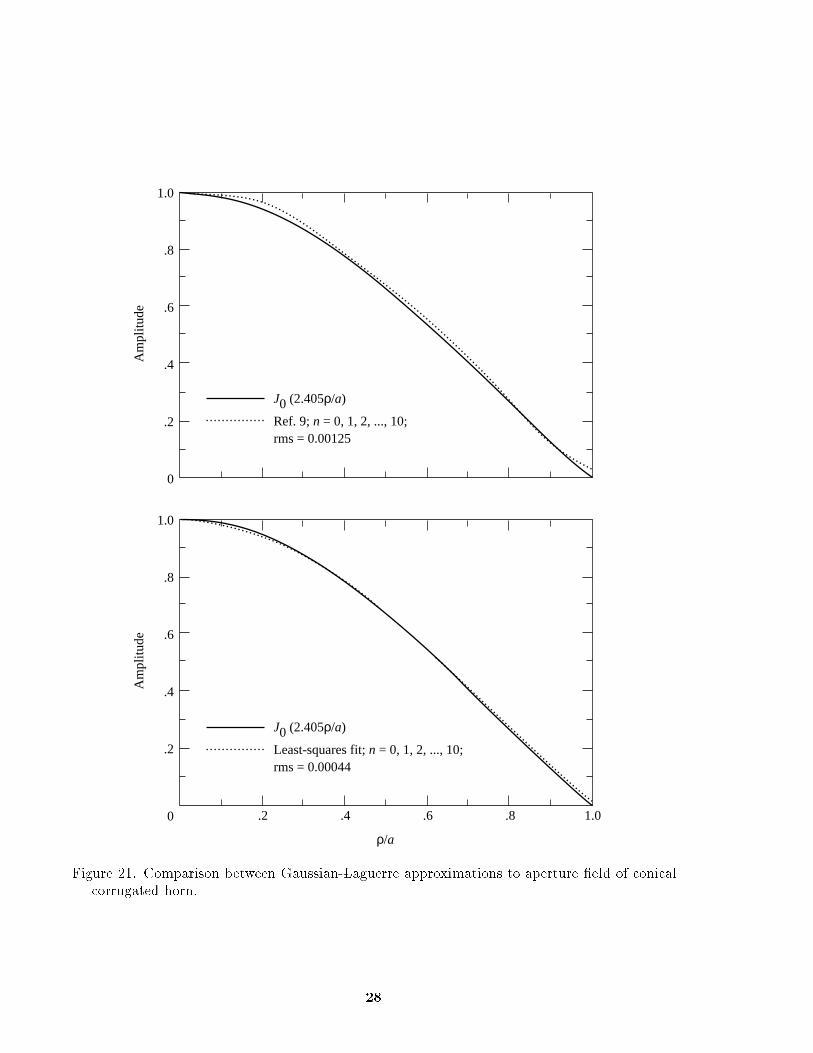
The design of the beam waveguide system was based upon the assumption that only thefundamental Gaussian mode was launched by the horn and that a pure �rst-order Gaussianbeam propagated throughout the lens focusing system. A more accurate model of the beamwaveguide system can be obtained by considering the higher order Gaussian-Laguerre modes.The launching coe�cients of higher order modes can be obtained by matching the aperture�elds for a corrugated conical horn (ref. 9). These coe�cients are listed in table I. Also listed intable I are modal coe�cients obtained by performing a least-squared �t of the �rst 11 circularlysymmetric (i.e., � independent) modes to the function J0(2:405�=a), which is the aperture �elddistribution of a corrugated conical horn with no phase taper. The aperture distributions usingthe modal coe�cients of table I are compared in �gure 21 with the function J0(2:405�=a).The distribution with the least-squared-�t coe�cients results in a better approximation to theaperture �eld function.
The cross-sectional distribution is calculated from equation (1) at the beam waist (z = 0)and includes the higher order modes in table I. These calculations are compared in �gure 22
7
with the fundamental mode distribution. Inclusion of the higher order modes results in a slightbroadening of the beamwidth (at the �8:686-dB level) and in the appearance of side lobes.
These observations were also evident in the measured data and indicate that higher order modes
should be considered in future designs. Also, as noted in �gure 22, the least-squared-�t modal
coe�cients appear to yield side lobe levels corresponding more closely with those observed in
the measured data of �gures 17 and 18 after the experimental system was adjusted.
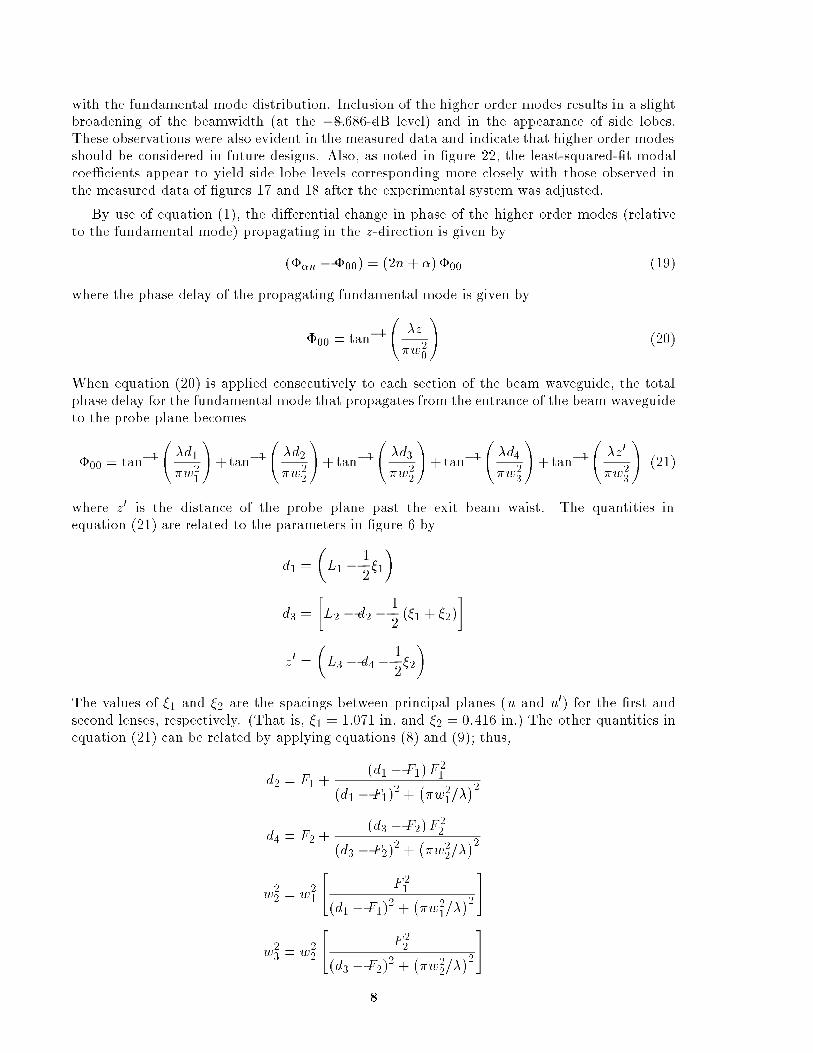
By use of equation (1), the di�erential change in phase of the higher order modes (relative
to the fundamental mode) propagating in the z-direction is given by
(��n � �00) = (2n + �) �00 (19)
where the phase delay of the propagating fundamental mode is given by
�00 = tan�1
�z
�w2
0
!(20)
When equation (20) is applied consecutively to each section of the beam waveguide, the total
phase delay for the fundamental mode that propagates from the entrance of the beam waveguide
to the probe plane becomes
�00 = tan�1
�d1
�w2
1
!+tan�1
�d2
�w2
2
!+tan�1
�d3
�w2
2
!+tan�1
�d4
�w2
3
!+tan�1
�z0
�w2
3
!(21)
where z0 is the distance of the probe plane past the exit beam waist. The quantities in
equation (21) are related to the parameters in �gure 6 by
d1 =
�L1 �
1
2�1
�
d3 =
�L2 � d2 �
1
2(�1 + �2)
�
z0 =
�L3 � d4 �
1
2�2
�
The values of �1 and �2 are the spacings between principal planes (u and u0) for the �rst and
second lenses, respectively. (That is, �1 = 1:071 in. and �2 = 0:416 in.) The other quantities in
equation (21) can be related by applying equations (8) and (9); thus,
d2 = F1 +(d1 � F1)F
2
1
(d1 � F1)2 +
��w2
1=��2
d4 = F2 +(d3 � F2)F
2
2
(d3 � F2)2 +
��w2
2=��2
w2
2= w2
1
"F 2
1
(d1 � F1)2 +
��w2
1=��2#
w2
3= w2
2
"F 2
2
(d3 � F2)2 +
��w2
2=��2#
8
For the special case of z0 = 0, d1 = d2 = F1, and d3 = d4 = F2, equation (21) can be written as
�00 = tan�1
�F1
�w21
!+ tan�1
"�F1
�w21
�F1
F2
�#+ tan�1
�w
21
�F1
!+ tan�1
"�w
21
�F1
�F2
F1
�#(22)
Equation (22) yields a value of �00 = � for the geometry of �gure 6. Because losses in the systemare neglected and the higher order modes experience a di�erential phase shift of 2n�, the modeamplitudes in table I also apply to the output of the beam waveguide system.
Figure 23 shows calculations of the cross-sectional distribution of the beam including thee�ects due to the higher order modes with various amounts of phase delay for the system of�gure 6. The phase delay variations could be caused by several factors, such as lack of accurateknowledge of the entrance beam waist location, inaccuracies in the system parameters, andunknown modal �eld structures and phase delays internal to the lenses. Figure 23 shows that inaddition to a nonuniform phase distribution, the most signi�cant e�ect of phase delay (or modalphase slippage) is a �ll-in between the nulls of the side lobes. This null �ll-in was also observedin the measured data.
Concluding Remarks
A beam waveguide system consisting of two dual-mode horns and four lenses has beendesigned for spot focusing of a 20-GHz electromagnetic wave beam onto a sheet of dielectricmaterial. The design was accomplished by using fundamental-mode Gaussian beam propagationproperties. Experimental tests, in conjunction with analytical calculations, indicate the presenceof higher order Gaussian-Laguerre modes in the system. However, the experimental system,designed by using only the fundamental mode, was considered to be su�cient for measuring theplane-wave propagation characteristics of the dielectric sheet under test.
NASA Langley Research CenterHampton, VA 23681-0001
January 4, 1994
References
1. Heil, Garrett G.: High Temperature Electromagnetic Characterization of Thermal Protection System Tile
Materials. NASA CR-189687, 1993.
2. Kogelnik, H.; and Li, T.: Laser Beams and Resonators. Proc. IEEE, vol. 54, no. 10, Oct. 1966, pp. 1312{1329.
3. Goubau, G.; and Schwering, F.: On the Guided Propagation of Electromagnetic Wave Beams. IRE Trans.
Antennas& Propag., vol. AP-9, May 1961, pp. 248{256.
4. Christian, J. R.; and Goubau, G.: Experimental Studies on a BeamWaveguide for MillimeterWaves. IRE Trans.
Antennas& Propag., vol. AP-9, May 1961, pp. 256{263.
5. Abramowitz, Milton; and Stegun, Irene A., eds.: Handbook of MathematicalFunctions. Dover Publ., Inc., 1965.
6. Kogelnik, Herwig: Imaging of Optical Modes|Resonators With Internal Lenses. Bell Syst. Tech. J., vol. 4,
Mar. 1965, pp. 455{494.
7. Born, Max; and Wolf, Emil: Principles of Optics, Second revised ed. Macmillan Co., 1964.
8. Potter, P. D.: A New Horn Antenna With Suppressed Sidelobes and Equal Beamwidths. Microw. J., vol. 6,
June 1963, pp. 71{78. (Available as NASA CR-50625.)
9. Wylde, R. J.: Millimetre-WaveGaussian Beam-Mode Optics and Corrugated Feed Horns. IEE Proc., vol. 131,
pt. H, no. 4, Aug. 1984, pp. 258{262.
9
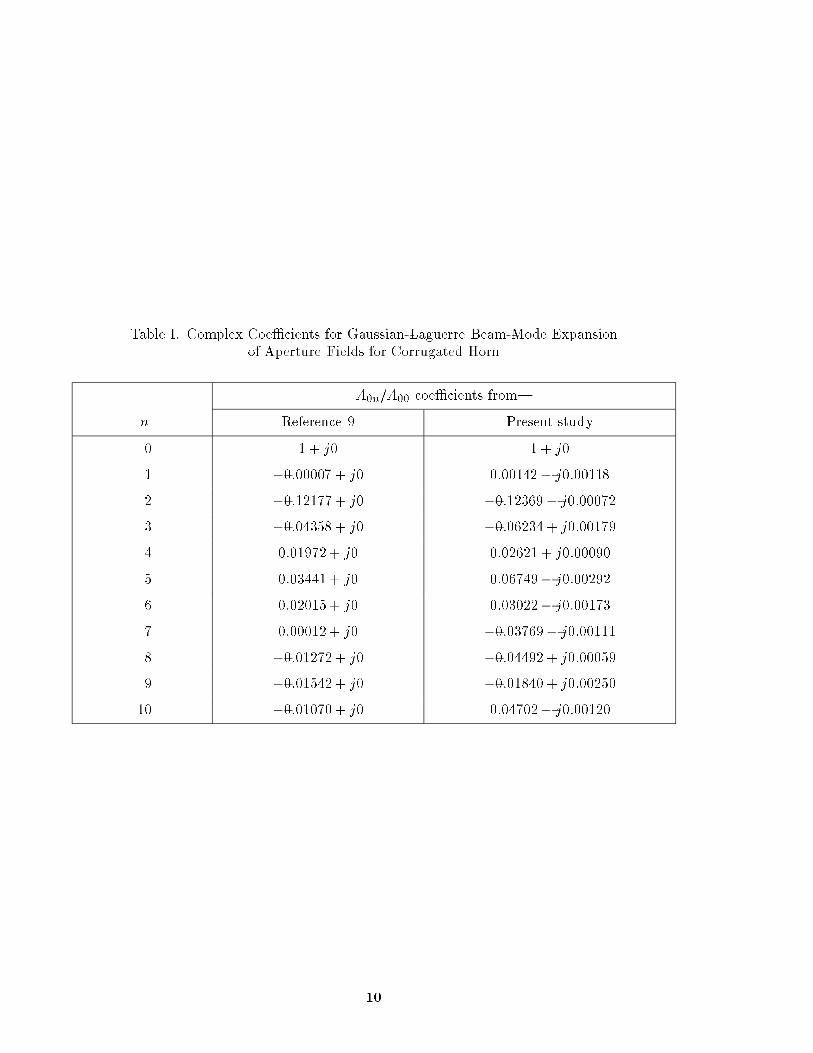
Table I. Complex Coe�cients for Gaussian-Laguerre Beam-Mode Expansion
of Aperture Fields for Corrugated Horn
A0n=A00 coe�cients from|
n Reference 9 Present study
0 1 + j0 1 + j0
1 �0:00007 + j0 0:00142� j0:00118
2 �0:12177+ j0 �0:12369� j0:00072
3 �0:04358 + j0 �0:06234 + j0:00179
4 0:01972+ j0 0:02621+ j0:00090
5 0:03441+ j0 0:06749� j0:00292
6 0:02015+ j0 0:03022� j0:00173
7 0:00012+ j0 �0:03769� j0:00111
8 �0:01272+ j0 �0:04492 + j0:00059
9 �0:01542+ j0 �0:01840 + j0:00250
10 �0:01070+ j0 0:04702� j0:00120
10
Horn
LensTest sampleLens
Horn
Figure 1. Beam waveguide system for measuring transmission characteristics of planar dielectric
sheet.
w0
R
z
w
z
γ
ρ
Figure 2. Geometry of propagating Gaussian beam.
11
4.0
3.5
3.0
2.5
2.0
Bea
m d
iam
eter
, 2w
, in.
30
25
20
15
10
Rad
ius
of p
hase
fro
nt, R
, in.
120
90
60
30
0
Bea
m p
hase
tape
r, γ
, deg
1 2 3 4 5 6 7 8 9 10
Distance along axis of beam, in.
Figure 3. Gaussian beam characteristics versus distance along axis of propagation.
12
u u'
F1 F1
T
r r'
δ'δ
ε0 ε0ε1
Figure 4. Parameters for thick dielectric lens with spherical surfaces at entrance and exit
surfaces.
13

w2w1
d1 d2
w2w1
d1 d2
w2w1
d1 d2
Figure 5. Gaussian beam transformation with thick dielectric lenses.
14
R1 R2
D
T1 T2
2w32w22w1
L1 L2 L3
L1 = 4.071
L2 = 14.983
L3 = 10.912
2w1 = 0.66
2w2 = 4.03
2w3 = 2.00
R1 = 6.0
R2 = 20.0
D = 7.0
T1 = 0.25
T2 = 0.25
εr = 3.78
Figure 6. Design parameters for spot-focusing beam waveguide system. All dimensions are given
in inches.
15

5.0
4.5
4.0
3.5
3.0
2.5
2.0
1.5
1.0
.5
Bea
m d
iam
eter
, in.
105
75
45
15
-15
Phas
e ta
per,
deg
-35 -25 -15 -5 5 15 25 35
Distance along axis of beam, in.
Figure 7. Beam characteristics for 20-GHz beam waveguide system.
16
2.5
2.4
2.3
2.2
2.1
2.0
Bea
m d
iam
eter
, 2w
, in.
-4 -3 -2 -1 0 1 2 3
Distance along axis of beam, in.
L1 - 0.1 L1 + 0.1
2.5
2.4
2.3
2.2
2.1
2.0
Bea
m d
iam
eter
, 2w
, in.
L2 - 0.1 L2 + 0.1
2.5
2.4
2.3
2.2
2.1
2.0
Bea
m d
iam
eter
, 2w
, in.
L3 - 0.1 L3 + 0.1
4
Figure 8. Beam diameter characteristics in test region versus sensitivity to axial errors in 20-GHz
beam waveguide system.
17
2.5
2.4
2.3
2.2
2.1
2.0
Bea
m d
iam
eter
, 2w
, in.
-4 -3 -2 -1 0 1 2 3
Distance along axis of beam, in.
R1 - 0.1
R1 + 0.1
2.5
2.4
2.3
2.2
2.1
2.0
Bea
m d
iam
eter
, 2w
, in.
R2 - 0.1
R2 + 0.1
2.5
2.4
2.3
2.2
2.1
2.0
Bea
m d
iam
eter
, 2w
, in.
εr - 0.01
εr + 0.01
4
Figure 9. Beam diameter characteristics in test region versus sensitivity to lens errors in 20-GHz
beam waveguide system.
18
2.4
2.3
2.2
2.1
2.0
1.9
Bea
m d
iam
eter
, in.
L1
L2
L3
30
20
10
0
Bea
m p
hase
tape
r, d
eg
L1
L2
L3
-1.0 -.5 0 .5 1.0
Change in length, in.
Figure 10. Beam diameter and phase characteristics at center of 20-GHz beam waveguide system
versus sensitivity to axial errors.
19
2.4
2.3
2.2
2.1
2.0
1.9
Bea
m d
iam
eter
, in.
R1
R2
30
20
10
0
Bea
m p
hase
tape
r, d
eg
-1.0 -.5 0 .5 1.0
Change in radius of curvature, in.
R1
R2
Figure 11. Beam diameter and phase characteristics at center of 20-GHz beam waveguide system
versus sensitivity to lens-surface radius of curvature.
20
2.4
2.3
2.2
2.1
2.0
1.9
Bea
m d
iam
eter
, in.
30
20
10
0
Bea
m p
hase
tape
r, d
eg
T1
T2
-1.0 -.5 0 .5 1.0
Change in lens thickness, in.
T1
T2
Figure 12. Beam diameter and phase characteristics at center of 20-GHz beam waveguide system
versus sensitivity to lens-edge thickness.
21
0.813 1.429
0.451 0.600 0.768 1.030
Figure 13. Design dimensions for 20-GHz dual-mode conical horn. All dimensions are given in
inches.
z0
5
4
3
2
1
0 1 2 3 4
Distance from beam waist, in.
Rad
ius
of p
hase
fro
nt, i
n.
Figure 14. Gaussian beam launched from conical dual-mode horn.
22

3
2
1
0
-1
-2
-3-3 -2 -1 0 1 2 3
x, in.
y, in.
0
-5
-10
-15
-20
Power,dB
Figure 15. Contour plot of measured amplitude transverse to beam axis at center of 20-GHz
beam waveguide system before adjustment of spacing between horn and lens.
3
2
1
0
-1
-2
-3-3 -2 -1 0 1 2 3
x, in.
y, in.
0
-5
-10
-15
-20
Power,dB
Figure 16. Contour plot of measured amplitude transverse to beam axis at center of 20-GHz
beam waveguide system after adjustment of spacing between horn and lens.
23

3.045
2.795
0
-10
-20
-30
-40
Rel
ativ
e po
wer
, dB
(a) Before adjustment.
0
-10
-20
-30
-40
Rel
ativ
e po
wer
, dB
(b) After adjustment.
-5 -4 -3 -2 -1 0 1 2 3 4 5
Distance perpendicular to axis, in.
GaussianMeasuredBeamwidth
Figure 17. Measured amplitude in H-plane transverse to beam axis at center of 20-GHz beam
waveguide system.
24
2.750
(a) Before adjustment.
0
-10
-20
-30
-40
Rel
ativ
e po
wer
, dB
-5 -4 -3 -2 -1 0 1 2 3 4 5
Distance perpendicular to axis, in.
GaussianMeasuredBeamwidth
2.855
0
-10
-20
-30
-40
Rel
ativ
e po
wer
, dB
(b) After adjustment.
Figure 18. Measured amplitude in E-plane transverse to beam axis at center of 20-GHz beam
waveguide system.
25
2.795
(a) Before adjustment.
0
-20
-40
-60
-80
-100
-120
-140
-160
-180
Phas
e an
gle,
deg
-5 -4 -3 -2 -1 0 1 2 3 4 5
Distance perpendicular to axis, in.
GaussianMeasured
3.045
(b) After adjustment.
0
-20
-40
-60
-80
-100
-120
-140
-160
-180
Phas
e an
gle,
deg
Figure 19. Measured phase in H-plane transverse to beam axis at center of 20-GHz beam
waveguide system.
26

2.750
(a) Before adjustment.
0
-20
-40
-60
-80
-100
-120
-140
-160
-180
Phas
e an
gle,
deg
-5 -4 -3 -2 -1 0 1 2 3 4 5
Distance perpendicular to axis, in.
GaussianMeasured
2.855
(b) After adjustment.
0
-20
-40
-60
-80
-100
-120
-140
-160
-180
Phas
e an
gle,
deg
Figure 20. Measured phase in E-plane transverse to beam axis at center of 20-GHz beam
waveguide system.
27
1.0
.8
.6
.4
.2
0
Am
plitu
de
1.0
.8
.6
.4
.2
0
Am
plitu
de
.2 .4 .6 .8 1.0
ρ/a
J0 (2.405ρ/a)
Ref. 9; n = 0, 1, 2, ..., 10;rms = 0.00125
J0 (2.405ρ/a)
Least-squares fit; n = 0, 1, 2, ..., 10;rms = 0.00044
Figure 21. Comparison between Gaussian-Laguerre approximations to aperture �eld of conical
corrugated horn.
28

0
-10
-20
-30
-40
-50
Am
plitu
de, d
BA
mpl
itude
, dB
0
ρ/w0
Ref. 9; n = 0, 1, 2, ..., 10
n = 0 mode
Least-squares aperturefit; n = 0, 1, 2, ..., 10
n = 0 mode
0
-10
-20
-30
-40
-501 2 3
Figure 22. Gaussian-Laguerre approximations of transverse amplitude distribution at center of
20-GHz beam waveguide system.
29

20
10
0
-10
-20
Phas
e an
gle,
deg
0 1 2 3
ρ/w0
0
-10
-20
-30
-40
Am
plitu
de, d
B
Φ00 = π
Φ00 = (1 ± 0.06)π
e-1
Φ00 = 1.06π
Φ00 = 0.94π
Figure 23. Gaussian-Laguerre approximations of amplitude and phase distribution at center of
20-GHz beam waveguide system versus modal phase slippage.
30
REPORT DOCUMENTATION PAGEForm Approved
OMB No. 0704-0188
Public reporting burden for this collection of information is estimated to average 1 hour per response, including the time for reviewing instructions, searching existing data sources,gathering and maintaining the data needed, and completing and reviewing the collection of information. Send comments regarding this burden estimate or any other aspect of thiscollection of information, including suggestions for reducing this burden, toWashington Headquarters Services, Directorate for Information Operations and Reports, 1215 Je�ersonDavis Highway, Suite 1204, Arlington, VA 22202-4302, and to the O�ce of Management and Budget, Paperwork Reduction Project (0704-0188), Washington, DC 20503.
1. AGENCY USE ONLY(Leave blank) 2. REPORT DATE 3. REPORT TYPE AND DATES COVERED
February 1994 Technical Paper
4. TITLE AND SUBTITLE
Design and Evaluation of an Electromagnetic BeamWaveguide for
Measuring Electrical Properties of Materials
6. AUTHOR(S)
M. C. Bailey
7. PERFORMING ORGANIZATION NAME(S) AND ADDRESS(ES)
NASA Langley Research Center
Hampton, VA 23681-0001
9. SPONSORING/MONITORING AGENCY NAME(S) AND ADDRESS(ES)
National Aeronautics and Space Administration
Washington, DC 20546-0001
5. FUNDING NUMBERS
WU 505-64-52-04
8. PERFORMING ORGANIZATION
REPORT NUMBER
L-17298
10. SPONSORING/MONITORING
AGENCY REPORT NUMBER
NASA TP-3418
11. SUPPLEMENTARY NOTES
12a. DISTRIBUTION/AVAILABILITY STATEMENT 12b. DISTRIBUTION CODE
Unclassi�ed{Unlimited
Subject Category 32
13. ABSTRACT (Maximum 200 words)
A beam waveguide has been designed that is based upon the propagation characteristics of the fundamentalGaussian beam and the focusing properties of spherical dielectric lenses. The 20-GHz, two-horn, four-lens system was constructed and experimentally evaluated by probing the �eld in a plane perpendicularto the beam axis at the center of the beam waveguide system. The critical parameters were determinedby numerical sensitivity studies, and the lens-horn critical spacing was adjusted to better focus the beamat the probe plane. The measured performance was analyzed by consideration of higher order Gaussian-Laguerre beam modes. The beam waveguide system was successfully used in the measurements of theelectromagnetic transmission properties of Shuttle thermal-protection tiles while the tile surface was beingheated to reentry-level temperatures with a high-power laser.
14. SUBJECT TERMS 15. NUMBER OF PAGES
Electromagnetic; Gaussian beam; Waveguide; Lens; Wave propagation; Antennas;
Focused �elds; Focused beams31
16. PRICE CODE
A0317. SECURITY CLASSIFICATION 18. SECURITY CLASSIFICATION 19. SECURITY CLASSIFICATION 20. LIMITATION
OF REPORT OF THIS PAGE OF ABSTRACT OF ABSTRACT
Unclassi�ed Unclassi�ed
NSN 7540-01-280-5500 Standard Form 298(Rev. 2-89)Prescribed by ANSI Std. Z39-18298-102