Embed Size (px)
DESCRIPTION
embankment design
Citation preview

Design and Construction of Embankment Dams
by
NARITA, Kunitomo, Dr. Eng., Prof.
Dept. of Civil Eng., Aichi Institute of Technology
April, 2000
Contents: 1. Introduction 2. Failures and Damages of Embankment Dams 3. Shear Strength of Fill Materials 4. Compaction of Fill Materials 5. Pore-water Pressure in Embankment 6. Seepage through Embankment Dams 7. Settlement and Cracking 8. Hydraulic Fracturing 9. Earthquake Resistant Design of Embankment Dams
-Dam.0-
1. INTRODUCTION 1.1 Preface Dams, which are constructed of earth and rock materials, are generally referred to as embankment dams or fill-type dams. The history of construction of embankment dams is much older than that of concrete dams. It is evident that some earth dams were constructed about 3,000 years ago in the cradles of ancient cultures such as east countries. According to the standard manual provided by the International Commission on Large Dams (ICOLD), in which about 63 member countries are now associated, dams with the height of more than 15m are referred to as "high dams". About 14,000 high dams have been registered up to the present, and more than 70 percent of them are embankment dams. A recent report on the construction of high dams has also noted that among about 1,000 of high dams constructed in recent two years, just about 20 percent are concrete dams and remaining 80 percent are embankment dams. It is thus readily recognized that construction of embankment dams is a recent world-wide trend in place of concrete dams. Two major distinct features and advantages are noticed for the construction of embankment dams. 1. Rigorous conditions are not required for the dam foundation, while hard and sound rock foundation is necessary for concrete dams. Embankment dams can be constructed even on the alluvial deposit and pervious foundations. 2. Construction of embankment dams has an economical advantage; i.e., the dam project can be planned in the outskirts of city area because of the merit mentioned above, and construction materials are principally to be supplied near the dam site. In this brief note, several important issues associated with the design and construction of embankment dams, which engineers often encounter in the dam project, are summarized, and some discussions are given on them by introducing recent development of design procedures and construction technology. 1.2 Types of Embankment Dams Embankment dams are classified into two main categories by types of soil mainly used as construction materials, such as earthfill dams and rockfill dams. The latter ones further can be classified into a few groups by configurations of dam sections, as one with a centrally located core, one with an inclined core and one with a facing, as shown in Fig.1.1. The main body of rockfill dams, which should have a structural resistance against failure, consists of rockfill shell and transition zones, and core and facing zones have a role to minimize leakage through embankment. Filter zone should be provided in any type of rockfill dams to prevent loss of soil particles by erosion due to seepage flow through embankment. In earthfill dams, on the other hand, the dam body is the only one which should have both structural and seepage resistance against failure with a provided drainage facilities. The dam type in a project is determined by considering various factors associated with topography and geology of the dam site, and quality and quantity of construction materials available. The inclined core is adopted instead of the center core, for instance, in cases where the dam foundation has a steep inclination along the river, where a blanket zone is provided in the pervious foundation to be connected with the impervious core zone, and where different construction processes are available for the placement of core and rockfill materials.
-Dam.1-

Key Words: rockfill, transition ......... pervious zone, to have structural strength core, facing ................... impervious zone, to keep water tight filter .............................. to prevent loss of soil particles drain .............................. to pass water from upstream to downstream (to dissipate pore water pressure) core trench, grouting .... to keep water tight in the foundation
Drain
(a) Homogeneous Earth Dam
Phreatic surface
Curtain Grouting
Inner Shell(Transition)
Outer Shell
Core
Filter
Core Trench
(b) Rockfill Dam with a Centrally Located Core
Curtain Grouting
Core
Filter
(c) Rockfill Dam with an Inclined Core
Random Shell
(d) Rockfill Dam with a Facing
ShellFacing
Drain
Fig.1.1 Earth and Rockfill Dams
-Dam.2-

1.3 Investigation, Design and Construction There are three main steps of working in a dam project: i.e., investigation, design and construction. Individual works in these three steps are summarized as listed in Table.1.1 with key words associated with them.
Table.1.1 Key Words Associated with Investigation, Design and Construction
1.Investigation #Site Investigation: Check of dam planning for appropriate purposes
/Meteorological and hydrological surveys /Topographical and geological investigations (landform, terrace, geological time, outcrop, lithofacies, folding, fault, discontinuity, erosion, weathering, sedimentation, stratum)
#Foundation Survey: Check of required conditions for a base foundation /Geophysical exploration (seismic prospecting, electrical prospecting, ...) /Boring exploration (core drilling, sampling, sounding), /Test pitting /In-situ testing (permeability, grouting, bearing capacity, compressibility) /Rock classification
#Fill Materials: Check of required quality and quantity of materials /Geological survey (stratum, volume) /Laboratory testing (shear strength, compressibility, compaction, permeability,...) /In-situ testing (roller compaction, density log, field permeability, sampling)
2.Design #Stability of Dam Body
/Stability against sliding failure of embankment (evaluation of pore-water pressure during and after construction, shear strength and deformation characteristics of fill materials)
/Seismic stability (seismic coefficient method, liquefaction, dynamic deformation characteristics, dynamic response analysis, earthquake resistant design)
/Stability at the contact face of dam body and base foundation (contact clay, compaction, relative displacement, arching, cracking)
#Seepage Through Embankment and Foundation /Seepage analysis (discharge, pore-water pressure, leakage through foundation,
critical velocity, piping, critical hydraulic gradient, hydraulic fracture) #Foundation Treatment
/Stability (counterweight fill, relief well, inspection gallery) /Seepage (drainage facilities, grouting, blanket)
3.Construction #Planning for Construction
/Construction equipment (roller, carrier, bulldozer, ...) /Foundation treatment (grouting, drainage) /Placement (execution management, field and laboratory testing) /Observation (pore-water pressure, settlement, earth pressure, deformation)
#Maintenance and Repair
-Dam.3-

2. FAILURES AND DAMAGES OF EMBANKMENT DAMS 2.1 Preface Most of catastrophic failures of embankment dams causes by overtopping of the reservoir water due to flooding or loss of free board. Despite embankment dams should not be designed to withstand erosive action of water flow over the crest, case histories reveal that inadequate capacity of spillway, that is, insufficient estimation of the amount of flooding has often led to the failure of the embankment due to overtopping. Failures of this type, however, can not be a decisive defect of embankment dams, because the accumulation of available accurate data of hydrology and the improvement of design method can readily settle the problem. This issue is therefore out of scope in this paper. Other main factors to cause embankment failures are hydraulic erosion, high pore-water pressure, earthquake forces and so forth. More than 50 percent of embankment failures are above all due to hydraulic erosion, and remaining each several percent is caused by other respective factors. Several typical patterns of failures and damages of embankment dams and their foundations are illustrated in Table.2.1 and Fig.2.1.
Table.2.1 Failure Causes of Embankment Dams
During Construction a) Pore water pressure built-up during construction b) Reduction of shear strength due to thixotropical property
After Construction
a) Hydraulic fracturing / Internal erosion / Piping b) Excess hydrostatic pressure due to rapid draw down c) Reduction in shear strength / Weathering, swelling of compacted soil d) Settlement and cracking e) Earthquake forces
Fig.2.1 Damages in Embankment and Foundation
◎ Damage of embankment ・ Sliding (by pore-water pressure, earthquake) ・ Deformation (settlement and lateral deflextion) ・ Leakage ・ Hydraulic fracture (quick sand and piping)
◎ Damage of foundation ・ Bearing capacity ・ Settlement ・ Leakage ・ Hydraulic fracture ・ Liquefaction
Quick sandBoiling
Leakage
Foundation
Embankment
Piping
Sliding
Over-topping(flood control)
Earthquake
Seepage force
-Dam.4-
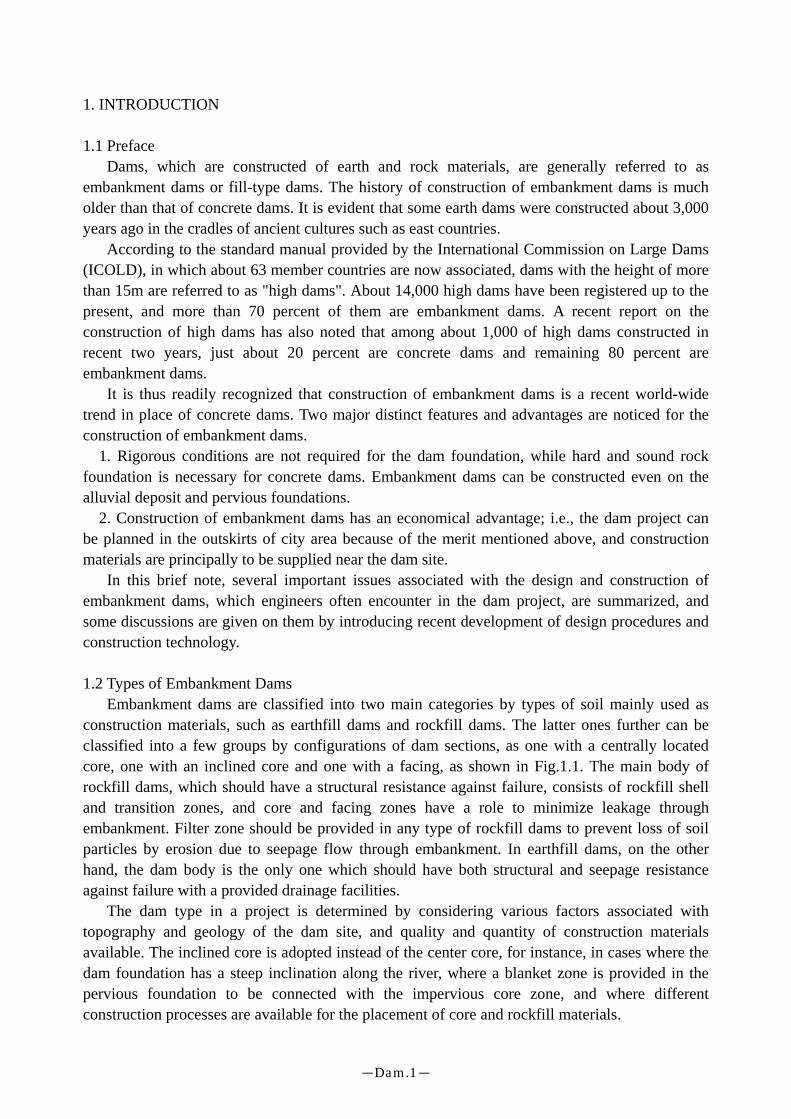
2.2 Sliding due to Pore-Water Pressure An excessive and abrupt increase of pore-water pressure, such as the one built-up during construction and the residual one due to rapid drawdown of the reservoir, may cause sliding failures in embankment. In Fig.2.2, relatively high pore-water pressure was built-up in an earth dam, which led to a sliding failure during construction. In Fig.2.3, distribution of pore-water pressure at a usual stationary flow has changed during rapid drawdown, which caused a high excess pore-water pressure in the upstream part of the embankment.
Circular slidingBuilt-up pore-water pressure
P10P11
P16
P.W.P tips
250
150
50
0
100
200
0 100 200 25015050
Pore
-w
ate
r pr
ess
ure
(k
Pa)
Overburden pressure γh (kPa)
Triaxial Tests(mean value)
P16
P11
P10
u/γh=1
failed
Fig.2.2 Sliding Failure During Construction Phreatic surface in embankment
almost remains unchanged whenupstream water level goes downrapidly because of low permeabilityof fill material
Initial water level
Drain
Sliding
Rapiddrawdown
Excess p.w.p. due torapid drawdown
Hydro-static p.w.p. fordrawdown water level
Fig.2.3 Excee Pore-Water Pressure due to Rapid Drawdown
-Dam.5-

2.3 Seepage Failure (Hydraulic Fracture) When water flows passing through soil in an embankment and foundation, seepage forces act on soil particles due to its viscosity. If seepage forces acting in the soil are large enough as compared to the resisting forces based on the effective earth pressure, erosion by quick sand takes place by washing soil particles away from the surface, and piping successively develops as erosion gradually progresses. In Fig.2.4(a), one of actions of seepage through pervious foundation is demonstrated, in which the uplift pressure acting on the impervious foundation causes heaving near the toe of the embankment. Hydraulic fracturing, quick sand and piping, can readily occur around the downstream toe when the hydraulic gradient increases with the concentration of flow lines, and the reduction in effective stresses is inevitable in the ground due to the action of the upward seepage forces, as illustrated in Fig.2.4(b). In an actual dam design, adequate drainage facilities such as filter zones and drains are provided in the interior of the embankment, and piping failures as stated above would not be expected to occur in ordinary situations. One of unusual situations to be considered is the generation of interior cracks in the impervious zone and foundation, which is mainly caused by differential settlements during and after construction, as described in the following.
Impervious base
Pervious foundationUplift
Heaving
Seepage
(a) Seepage Through Pervious FoundationUplift pressure acts verticallyon downstream side, so thatcounterweight fill or relief wellare recommended to preventheaving and local slide.
Quick sandBoiling
Piping
Seepage
Seepage force ( iγw)
(b) Hydraulic FractureConcentration of flow lines atdownstream toe leads to theincrease in hydraulic gradient.Upward seepage force causesreduction in effective stressesin foundation, and quick sandand piping take place whencounterweight loading is notenough.
Fig.2.4 Seepage Through Foundation and Hydraulic Fracturing 2.4 Differential Settlement, Deformation and Cracking Many types of differential settlement and associated severe deformation such as open cracks appear in both dam body and base foundation, due to compressibility of fill materials and foundation soils and/or their relative rigidity. Fig.2.5 shows several patterns of differential settlement and open cracks which dam engineers often encounter in the field.
-Dam.6-

(a) Differential settlement causes tension cracks on the surface and inner open cracks near the point of sharp change in abutment configuration
Highlycompressible
Open cracks
Open cracks
Tension cracks
(b) Existence of highly compressible layer of soil in foundation causes local settlement in the embankment, and inner open cracks between them
(c) Existence of relatively rigid structure
causes inner open cracks due to differential settlement and deformation, especially during earthquake
(d) In a narrow central core, arching may take place in core zone which causes low confining stress and open cracks
Open cracks
Alluvium
Rock foundation
Settlement
Concrete wall Cracks
Relatively compressiblenarrow central core
Incompressible shell Settlement
Rock foundation
Fig.2.5 Differential Settlement and Cracking 2.5 Earthquake Damage Embankment failures due to earthquake excitation can be classified into two groups. One is damages caused by liquefaction or softening of sand foundation and the other is sliding and cracking of embankment body resting on hard foundation. In the former case, high excess pore-water pressure is generated during earthquake by the application of cyclic shear stresses, and large deformation as well as vertical displacement develops in the foundation. These deformations generally lead to catastrophic damages due to overtopping, as shown in Fig.2.6. According to the investigation reports on earthquake damages of actual embankment dams and also to the experimental studies through large scale shaking table tests on the dynamic response of earth and rockfill dams, embankment failures caused by strong excitation are classified into several patterns in their mechanism. Three distinct patterns of embankment failures due to earthquake excitation are schematically illustrated in Fig.2.7, for different types of embankment configuration.
-Dam.7-

Settlement(Loss of free board)
Deformation
Liquefied and Softened
Fig.2.6 Embankment Failure due to Liquefaction of Foundation
Deep sliding
Cracks Wedge (a) Homogeneous Earthfill Dam A wedge type soil block is formed in the crest, and it grows up gradually as the excitation increases, causing deep circular sliding
(c) Centally Located Core Type Rockfill Dam Core zone is exposed at the crest due to settlement and drug of surrounding shells, causing decrease in lateral constraint and opening of cracks
Settlement
Deep slide
RockCore
Drug
(b) Homogeneous Rockfill Dam The extent of falling down of rock particles along slope moves down from crest to toe, leading to a flat circular crest and lowering of the fill. Shallow surface sliding also appears during this process.
Falling down ofrock particles
Shallowsurface sliding
Fig.2.7 Failure Patterns of Embankments on Hard Foundation
-Dam.8-

3. SHEAR STRENGTH OF FILL MATERIALS 3.1 Preface In the design of embankment dams, stability analysis of slopes is usually conducted for the following four typical situations.
1) analysis of the up- and downstream slopes immediately after the end of construction 2) analysis of the upstream slope at the first filling of the reservoir, for water level at about
half of the full water level 3) analysis of the upstream slope during rapid drawdown of the reservoir water 4) analysis of the up- and downstream slopes when earthquake takes place at the full and an
intermediate level of the reservoir water In general, two types of stability analysis are performed according to the situation under consideration. One is the total stress analysis which is useful for the cases 1) and 2), and the other is the effective stress analysis which is applicable for the cases 3) and 4) mentioned above. 3.2 Total Stress Analysis In the total stress analysis, undrained shear strength parameters cu and φu are generally used for the failure criterion. For partially saturated soils, because the degree of saturation of soil specimen changes due to the change in the confining pressureσ0 applied in the tests, both parameters cu and φu are expressed as functions of σ0, as shown in Fig.3.1. The shear strength τf is therefore given by the following equation.
σ
τ
τf=cu(σ0)+σtanφu(σ0)
desired stress range Partially Saturated Soils:・ Gradient of strength envelop decreases as confining pressure increases because of the increase in the degree of saturation of soil sample・ Because strength envelop has a curvature, c and φ are determined for an appropriate confining pressure σ0 in the desired stress range
Saturated Soils:・ Undrained shear strength becomes constant for saturated soils・ Total stress analysis is then called as φu=0 analysis・ The value of cu varies depending on the consolidation pressure p applied on the specimen
σ
τ
cu
consolidation pressure p
cu
τf=cu (φu=0)
cu/p
Fig.3.1 Shear Strength in Total Stress Analysis
-Dam.9-
τf = cu(σ0) +σtanφu(σ0) ......(3.1)
Parameters cu and φu to be used in the design are usually determined for a desired stress range of σ0 in the construction field. For saturated soils, because φu vanishes in undrained strength tests, the shear strength τf is represented as
τf = cu ......(3.2)
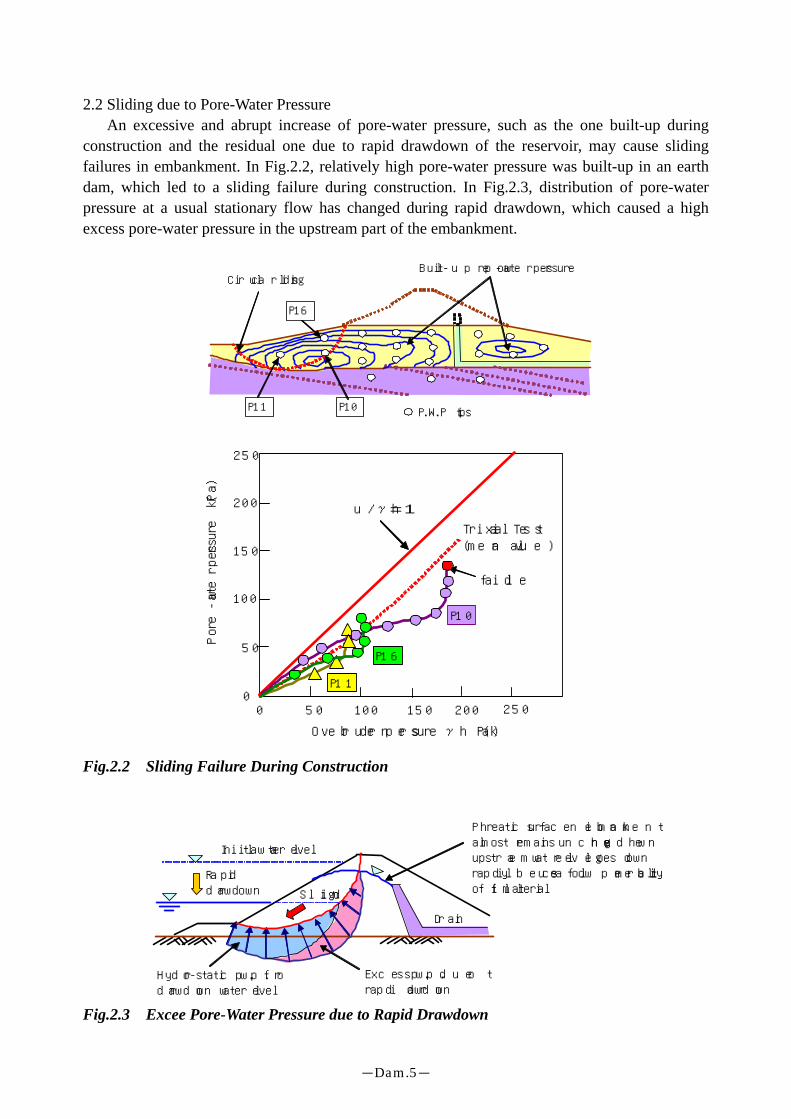
The undrained strengthcu of clay is directly dependent on the initial structure (void ratio) after sedimentation, which in turn is affected by the consolidation pressure p in the ground. The increasing rate ofcu to the effective pressure p is almost proportional, and the value of the ratiocu/p becomes to be around 1/3 in normally consolidated clays. Shear strength tests on compacted fill materials reveal that the strength envelop consists of a combination of two straight lines, as shown in Fig.3.2. This is due to the fact that compacted soils more or less can have high skeleton strength composed by suction effects and the strength becomes greater than that of normally consolidated state under a confining pressure lower than the pre-compression stress pc. For practical purposes and for a safe-side design, however, the straight line ABC is usually used in the design to determine cu and φu.
Compacted Fill Materials:・ Compacted soils show higher strength A'B than that in normally consolidated sate AB under lower confining pressure than the pre-compression stress pc.・ Pre-compression effects vanish due to wetting of soil, so that c and φ to be used in the design are determined by AB for practical safe-side design.
σ'
τ
A
A'
B
C
pc
pre-compressioneffect
Normally consolidation
Fig.3.2 Pre-compression Effect of Compacted Fill Materials 3.3 Effective Stress Analysis In the effective stress analysis, the failure criterion is represented in terms of effective stresses by the expression:
τf = c' + σ'tanφ' = c' + (σ-u)tanφ' ......(3.3)
in which parameters c' and φ' are referred to, respectively, as the cohesion intercept and the angle of shearing resistance in terms of effective stresses, and they are determined from CU tests or drained tests (D tests) for saturated samples.
-Dam.10-

3.4 Shear Strength of Non-cohesive Rock Materials Failure criterion of granular and non-cohesive materials, such as sand, gravel and rock, can usually be represented in any situations in terms of effective stresses without a cohesion intercept as follows;
τf = (σ-u)tanφ' ......(3.4)
It has recently been known through extensive researches on the shear strength properties of non-cohesive rock materials that they show a steep increase in strength in the range of very low confining pressure. In order to consider such a curvature of the failure envelop in a practical design, two types of expression of shear strength have been proposed, as shown in Fig.3.3. One is the same expression as Eq.(3.4) using, in place of constant φ', a variable of the tangential angle φ0 from the origin. The other is the expression of a power of the effective confining pressureσn as τf=A(σn)b. Variation of φ0 and the coefficients A and b in the latter are given as in Fig.3.3.
(a) τf~σn relation is expressed by an tangential angle φ0 from the origin as τf=σntanφ0. ・ The value of angle φ0 is taken to be constant as φ0=φmax in the low stress range: σn<σ0, and is expressed by the equation given in the figure (a) in the high stress range: σn>σ0.
40
10 100 5000
70
60
50
301000
Effective Normal stress σn (kPa)
φ0 (
deg
ree)
φ0
σn σ
τ
(a)
φ0=φmax-a・log(σn/σ0)
a
Normal stress σn
Shea
r st
ress
τ Failure envelop
(b) τf~σn relation is expressed by a
power as τf=A(σn)b. ・ Parameters A and b of rock materials usually range as A=0.9~1.9, b=0.75~0.98
A
τf=A(σn)b
100
50 100 5000
5000
1000
500
501000
Effective Normal stress σn (kPa)
500
She
ar
stre
ngth
τf
(kP
a)
b
(b)
Fig.3.3 Shear Strength of Non-cohesive Rock Materials
-Dam.11-

4. COMPACTION OF FILL MATERIALS 4.1 Preface Compaction of soils is one of methods of soil stabilization. Principal purposes of compaction of fill materials are
1) increasing stiffness, to minimize settlements during and after construction, 2) increasing strength, to prevent sliding shear failure of embankment, and 3) making water tight, to obtain required imperviousness of the core zone
Variations of grain size distribution curves of fill materials employed in twelve representative earth and rockfill dams in Japan are shown in Fig.4.1. Soil particles of fairly large grain size are used even as impervious core material because of recent development of heavy equipment and techniques for construction control.
60
01000100
Grain Size d (mm)
20
40
80
0.1
100
1 100.010.001
Perc
ent
Fin
er
P
(%)
Impervious Core
Pervious RockTransition, Filter
Fig.4.1 Representative Fill Materials When soil is compacted, with a constant energy, by increasing water content step by step, dry density of soil increases first monotonically because lubrication effect of water allows particle movement. Density of soil decreases, however, as water content increases beyond a certain value of wopt because more part of void of soil is filled with water which interferes filling of soil particles. Compaction curve is then formed like a mountain where peak point is defined by the maximum dry density ρdmax and the optimum water content wopt. General characteristic of compaction curves are described in Fig.4.2. 4.2 Compressibility In Fig.4.3, the results from compression tests performed on compacted granular materials are summarized for MAKIO Dam materials, showing relations between settlements and applied stresses for different values of relative density. It is seen that compressibility of fill materials is gradually improved as compaction dry density increases.
-Dam.12-

It is generally known that soils compacted in unsaturated states, especially in the dry side of the optimum water content, have a certain skeleton strength composed by suction effect between soil particles. This skeleton strength readily disappears by wetting (saturation) during the first filling of the reservoir, which results in large settlement and drugs in the upstream shell of a rockfill dam and also in differential settlement and opening cracks in the core zone. Compressibility due to wetting can be easily evaluated by conducting compression tests on saturated samples compacted in the same dry density.
ρdmax
wopt
ρd
Sr=100%
w
・Cohesive Soil・Low Energy
・Dry density of soil increases first as water content increases, because lubrication effect of water allows particle movement・Density decrease beyond wopt, because void is filled by water which can interfere movement of soil particles・Compaction curve becomes sharp and moves left (to dry side) for granular (non-cohesive) soils like sand and gravel, and when compaction energy is high・Sharping of comaction curve reveals that variation of dry density becomes sensitive to the change in water content・Granular soils can have a certain suction forces with less water content because contact points of particles are fewer than cohesive soils
・Sand, Gravel・High Energy
Fig.4.2 General Characteristics of Compaction Curves
100 2000 300
2
1
4
3
5
0
6
Wetting
Initially saturated sample
Consolidation pressure σ (kPa)
Nor
mal
ized
sett
lem
ent
(%
)
unsaturated sample
Dr≒85%
Dr≒60%
Dr≒70%
Dr≒78% * Relation of ρd and e ρd=ρs/(1+e)
* Relative Density
Dr=(emax-e)/(emax-emin)
Fig.4.3 Compressibility of Compacted Soils
-Dam.13-

4.3 Strength and Permeability Characteristics of shear strength of compacted soil are almost the same as those of compressibility mentioned above. Correlations between shear strength and permeability of compacted soils and the compaction dry density and water content are summarized in Fig.4.4. Strength of compacted soils generally shows a peak on the dry side of the optimum water content. Severe strength reduction, however, is anticipated on the dry side when the fill is submerged, so that dry side compaction should be avoided especially in the upstream fill. The permeability of compacted soils, on the other hand, has a minimum peak on the wet side of the optimum.
Water content
Wopt
ρd
Cohesion
Friction angle
Strength
Str
eng
th, R
esis
tanc
e
Water content
Sr=100%ρdmax
Coef
fici
ent
of
perm
eab
ility
Water content
Wopt
Strength・Strength of compacted soil in general shows a peak value on the dry side.・Friction and cohesion components also have large values on the dry side.・Strength decreases drastically due to wetting on the dry side, and the peak of strength moves to the optimum.・Dry side compaction therefore should be avoided especially in the upstream fill, which causes large settlement and drug against the core.・High energy compaction with heavy roller is recommended for very dry fill materials to have the optimum state at low water content.
Permeability・Permeability of compacted soil decreases as water content (degree of saturation) increases, having the minimum value on the wet side of the optimum.
by wetting
Fig.4.4 Strength and Permeability of Compacted Soils
-Dam.14-

4.4 Compaction Control In order to maintain required strength and permeability in the field, compaction conditions should be specified in the design stage and placement process is severely controlled in the construction stage. In general, strength and permeability of compacted soils are related in advance with dry density by use of laboratory test results. Required field compaction dry density ρdf is then determined to satisfy design values of strength and permeability, usually expressed by D-value as the ratio of ρdf to ρdmax. Considering wet side compaction and allowable field water content, compaction is controlled to maintain dry density greater than the specified D-value, as presented in Fig.4.5. For fairly compressible materials, in which D-value control is difficult to be applied, air-content can be another useful index parameter to control compaction condition.
ρdmax: Maximum dry density
wopt: Optimum water content
(wet side compaction is recommended) ρdf: Required field compaction dry density to satisfy design values of strength and permeabilitywb~wc: Field water content to obtain required D-value wa: Allowable field water content wd: Upper limit of field water content
wb wa wc wdwopt
ρdmax
ρdf
Sr=100%,va=0%
va1
va2
D=ρdf/ρdmax
Water content
Com
pact
ion
dry d
ensi
ty ρ
d
ρdf is determined from laboratory teststo satisfy design values of strength andpermeability (design D-value)Compaction in wet side of wopt isrecommended in D-value control
Air-content can be anotheruseful parameter to controlcompaction condition
Fig.4.5 Idea of Compaction Control
-Dam.15-

4.5 Laboratory and Field Compaction Field compaction of fill materials is usually carried out by using compaction rollers such as a tamping (sheepsfoot) roller, a rubber-tired roller and a vibration roller. In general, either a sheepsfoot roller or a rubber-tired roller is used for impervious or semi-impervious materials. For pervious materials such as sand, gravel and rock, rubber-tired or vibration rollers are usually employed. The usefulness of each roller depends on its compaction characteristics and soil types. The results of field compaction tests are compared with those of laboratory standard Procter compaction tests in Fig.4.6. The surface of the fill under compaction likely becomes smooth when a rubber-tired or a vibration roller is employed. This is remarkable when comparatively soft rock materials are compacted by a vibration roller or when impervious materials are compacted by a rubber-tired roller. It is readily recognized that the formation of smooth surface is undesirable in the stability of embankment slopes, causing reduction in shear resistance along this plane. For narrow areas adjacent to the abutment foundation and concrete structures, small compactors such as hand and air tamper are effectively used in place of heavy equipment.
Water content (%)
1.7
61.6
8 10
2.0
12
1.9
1.8
2.1
Com
paction d
ry d
ensi
ty ρ
d (
t/m
3)
14 16
Laboratory
Rubber-tired
Sheepsfoot
Sr=100% Fig.4.6 Laboratory and Field Compaction
・ Thickness of soil to be compacted in a layer is important to keep good quality of fill, because densely and loosely compacted zones exist even in one layer・ Surface treatment is needed when smoothly compacted or after heavy rain, in order to avoid reduction in shear resistance in the fill・ Small compactors such as hand and air tamper are effective for use in compaction near abutment foundation
Loose
Smooth surface
1 Layer
Dense
Contact clay
Small tamperHeavy roller
-Dam.16-

4.6 Particle Breakage Breakage of solid particles is one of important issues to be considered in the design and construction of rockfill dams. Marsal has proposed a practically useful index of grain breakage, Bg, to classify rockfill materials. The index Bg is defined, as illustrated in Fig.4.7, by the sum of positive values of weight differences of the initial and final fractions of rock particles. Fig.4.8 demonstrates a classification of rockfills, where the particle strength, hardness, of rockfill is related to the Bg-value obtained in triaxial and unconfined compression tests.
ΔWk=Wki-Wkf
Initial
80
Final
Wki
Wkf60
40
20
100
0101 1000.1
0
+20
+40
-40
-20
Wki and Wkf: weights of theinitial and final fractions asa percentage of total weight
Perc
ent
finer
P(%
)Δ
Wk=
Wki-W
kf (
%)
Grain size d (mm)
Bg=∑(+ΔWk)
Fig.4.7 Definition of grain breakage Bg
10
50
40
30
20
0
60
2 30 41
Stress level σc (MPa)
Gra
in b
reak
age B
g (
%)
U: Uniform rockfill W: Well-graded rockfill
1W, 1U : hard grains2W, 2U : medium hard3W, 3U : soft grains
2U
1U
3U
3W
2W
1W
Fig.4.8 relation between Bg-index and hardness of rockfi
-Dam.17-

5. PORE-WATER PRESSURE IN EMBANKMENT 5.1 Pore-Water Pressure Built-up during Construction Hilf proposed a method of estimating built-up pore-water pressure during construction, where the increase of pore-water pressure ⊿u due to the increase in total stress applied under undrained condition is given by the following formula:
δδ
−+=∆
)(0wea vHv
pu ...... (5.1)
in which va and vw are, respectively, air and water content in unit volume of soil, δ is the amount of volume compression, and He and p0 are Henry's coefficient of solubility (usually He=0.02) and the atmospheric pressure. Eq.(5.1) is considered valid only if the degree of saturation of soil is higher than 85%. Another method of estimation can be provided by the direct measurement of pore-water pressure in laboratory compression tests performed on compacted soils under undrained condition. The results obtained by both methods are compared in Fig.5.1.
200
Por
e-w
ater
pre
ssure
u (
kPa)
Total stress σ (kPa)
Δσ
400
400
200
00
(1) MH (Sr=97%)
(2) SM(Sr=95%)
100% uplift
Δu
Calculated
Measured ・ Pore-water pressure developed during construction can be evaluated by using Hilf's equation indicated by solid lines.・ Measured values of pore-water pressure in the field are close to the calculated ones by Hilf's equation when the value of Sr becomes greater than 85%.
Hilf: Δu=p0δ/(va+Hevw-δ)
Fig.5.1 Estimation of Built-up Pore-Water Pressure
5.2 Dissipation of Pore-Water Pressure Pore-water pressure estimated by Eq.(5.1) is the one developed when the total stress is applied under a completely undrained condition. In an embankment dam, however, some part of this built-up pore-water pressure should be dissipated during construction. Though the Terzaghi's theoretical equation of consolidation is valid to evaluate the amount of dissipation, it is not practical for actual dams because of their complicated boundary and discontinuity conditions in the section. A practically useful method of estimating pore-water pressure during construction is presented in Fig.5.2. Consider that variation of the observed pore-water pressure u is drawn with time for a typical soil element in an embankment. The degree of consolidation (or the rate of
―Dam.18―

dissipation) U of this element up to the time t=Δt is defined by U=(uH-u)/ uH , where uH is obtained from the Hilf's equation or by experiment as noted before. On the other hand, the elapsed time t can be expressed in a dimensionless form, with the coefficient of consolidation cv
of fill materials and the drainage distance H between the drain and the point under consideration, in terms of the time factor as T=cvt/H2. By making use of much available data on the observed pore-water pressure, relations between U and T are obtained for several types of embankment. In Fig.5.2(b), mean U-T relation curves are given for four different typical types of embankment dam. Also presented by a dashed curve is the Terzaghi's theoretical solution of one-dimensional consolidation.
・ uH is pore-water pressure estimated by
Hilf's equation or by experiment without any dissipation during construction.・ Measured u in actual dams must be
residual part of uH after dissipation.
・ Difference (uH-u) is evaluated by theory
of consolidation like Terzaghi's equation・ Pore-water pressure observed in the field should be a solution including field boundary and drainage conditions
ΔtTime t
End of constructionuH
σ,u
fill load γh
u
u calculated
u measured
Δth
(a)
0.001
H
(2)
(1) Center core
Degr
ee o
f conso
lidation
U (
%)
Time factor T
0.01 0.1 1 10010100
60
40
0
20
80
(2) Inclined core (4) Horizontal drain anisotropic (kh>>kv)
(3) Vertical drain (one-way)
H HH
(4)(3)
(1)
Drainage distance H
(b)Terzaghi
Degree of Consolidation: U=(uH-u)/uH
Time Factor: T=cvΔt/H2 Fig.5.2 Dissipation of Pore-Water Pressure
―Dam.19―

5.3 Numerical Analysis of Pore-water Pressure in Embankments The finite element method (FEM) has been one of useful tools in understanding stress and deformation behavior in embankment dams. Pore-water pressure developed in embankments during and after construction can also be evaluated well by FEM, as illustrated in Fig.5.3, by introducing a u-σ relation curve in estimating the built-up p.w.p., and one of U-T relation curves in Fig.5.2 in calculating dissipation of p.w.p. for corresponding dam type. Example calculation is demonstrated in Fig.5.4 for an earth dam of 30m high, showing a roughly good agreement between the observed and the calculated values of p.w.p..
Total stress analysisstress:Δσ,strain:Δε
Built-up PWPΔu=BΔσ1
Consolidation analysisΔut,Δσ'=Δσ-Δut
Effective stress analysisstrain: Δεt'
B1
u
σ
u=σ(100%)
Oedometer test
logT
U
Dam Type
U-T Relation
Consolidation deformation:
Δε + Δεt'Tim
e inte
rval
ΔtC
onst
ruction s
tasg
e
Fig.5.3 FE Analysis of p.w.p in Embankments
σ1
uH
u(FEM) u(Observed)
Time t
Pre
ssure
(σ
,u
)
ObservedFEM
10
200
100
50
150
u(kPa)
Togo Dam (H=30m) Fig.5.4 Estimation of p.w.p. in an Earth Dam
―Dam.20―

6. SEEPAGE THROUGH EMBANKMENT DAMS 6.1 Preface The flow of water through void in soil can be described as a flow of water through a fine tube. It must be a laminar flow because the velocity of water through soil is comparatively low. The velocity beyond which the flow changes from a laminar flow to a turbulent flow is known as the critical velocity and it is related with Reynolds Number Re expressed by
gDvR w
ae µγ
= ...... (6.1)
where va is the velocity of water, D is the diameter of a tube, g is the acceleration of gravity and γw and μ are, respectively, the unit weight and the viscosity of water. The value of Re corresponding to the critical velocity is given by 2.20. Seepage problems usually encountered in geotechnical engineering deal almost exclusively with a laminar flow in which the equation of motion is expressed by the famous Darcy's law:
va = k・i ...... (6.2)
where k and i denote the coefficient of permeability and the hydraulic gradient, respectively. The range of Re where Darcy's law is applied effectively is given by Re≦1. 6.2. Phreatic Surface in a homogeneous embankment A.Casagrande proposed a procedure of estimating a phreatic surface to be formed within a homogeneous embankment. The procedure is illustrated for an example earth dam in Fig.6.1. It is assumed that the phreatic surface can be represented basically by a parabola with its focus point on the downstream toe of point A. The equation of this parabola is expressed by
x=(z2-z02)/2z0, z0=(H2+d2)0.5-d, d=0.3l1+l2 ...... (6.3)
where H is the depth of the reservoir. The basic parabola given by Eq.(6.3) somewhat differs from the actual phreatic surface on the upstream and downstream slopes. On the upstream side, the phreatic surface should intersect normal to the upstream face at a point B. The distance between the point B and the point B' where the parabola intersects the reservoir water level is assumed by 0.3l1. On the downstream side, the actual exit point C should lie somewhat lower than the point C' where the parabola intersects the downstream face. The distance Δa between the points C and C' can be determined from Eq.(6.4) and Fig.6.1.
a+Δa = z0/(1-cosα) ...... (6.4)
6.3. Phreatic Surface in an Inclined Core A phreatic surface which must appear in an inclined core can be estimated easily by drawing as illustrated in Fig.6.2. Let us denote the width of the core at the water level as B' and that at the bottom as B. Plot the point D on the upstream face by taking a distance from the point P at the water level by (B'+B)/2 . Determine now the point Q on the lower face of the inclined core by drawing a circular arc PQ with its center at point D. The phreatic surface is then represented by the arc PQ.
―Dam.21―

H
B
dl1
αF
B'
l2
0.3l1z
A A'
x
C'Δa
a
Cz0
30° 180°
0.2
90°
0.4
Δa/(Δ
a+a)
α
0.2
0.4・ B'C'A' is a basic parabola to construct actual phreatic surface BCA.・ Position of actual inlet and outlet points B and C are determined as noted.
Fig.6.1 Phreatic Surface (Homogeneous Embankment)
H
B
B'
D Q
P
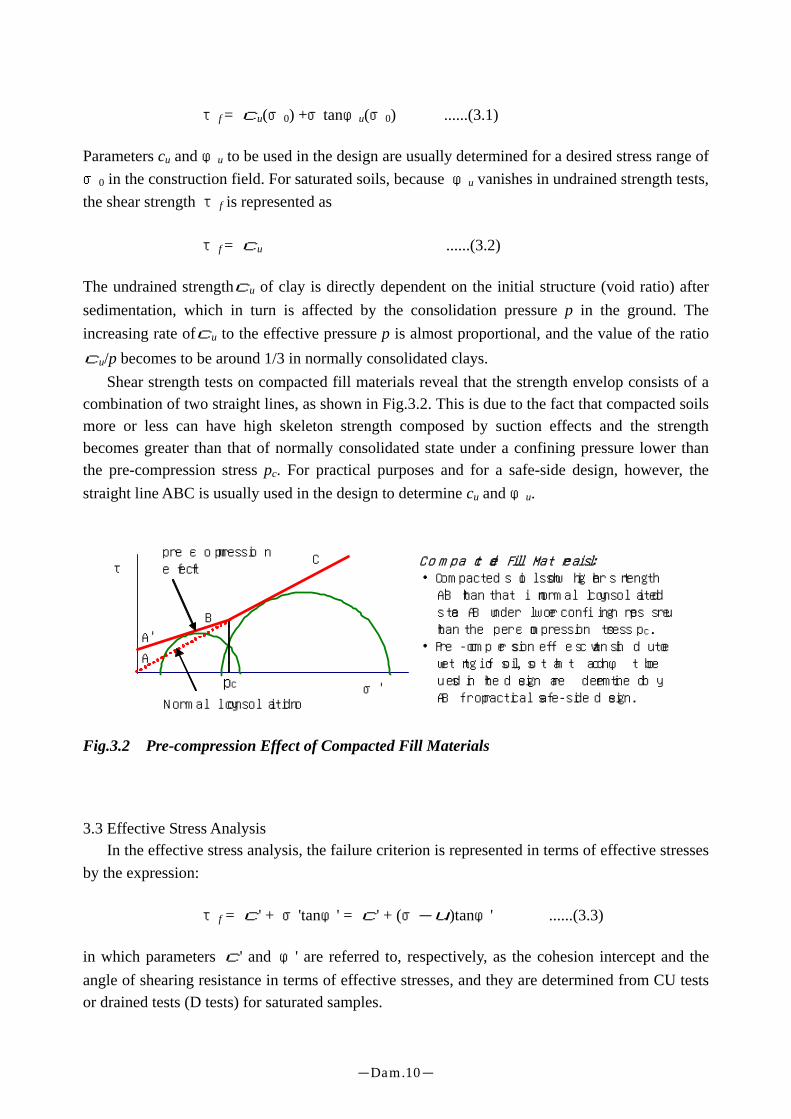
(B+B')/2 Fig.6.2 Phreatic Surface (Inclined Core) 6.4. Seepage Through Anisotropically Stratified Fills It has often been pointed out that compacted fills are more or less stratified, having different permeability in the horizontal and vertical directions. The difference between the horizontal and vertical permeability, kh and kv, may vary to some extent according to the type of rollers used in the placement. It is known in general that the value of the ratio kh/kv ranges from 2 to 7, mean value of 5, in case of sheepsfoot roller compaction and from 10 to 40, mean value of 25, in case of that by a tired roller. A well-known procedure to construct a flow net for such a stratified mass of soil is described in Fig.6.3. First of all, as an example in Fig.6.3(a), a typical flow net is drawn for a homogeneous and hydraulically isotropic earth dam (kh=kv). Flow net should be drawn to make square grids for
―Dam.22―
an isotropic medium. Suppose now an another earth dam of the same dimension which has different permeability in the horizontal and vertical directions (kh≠kv). In order to draw a flow net for such a dam, the horizontal scale of the dam is first reduced by multiplying a scaling factor (kh/kv)0.5 and a flow net is constructed assuming that the medium is isotropic. In Fig.6.3(b), a transformed section and a flow net thus drawn for the case kh=9kv is presented. The true flow net is then obtained by increasing horizontal dimension of this reduced flow net, by multiplying (kh/kv)0.5=3, as shown in Fig.6.3(c). (a) True Section (isotropic: kh=kv)
(c) Transformed to True Section (anisotropic: kh=9kv)
H
2
1
(b) Transformed Section (anisotropic: kh=9kv)
Horizontal dimension is reduced by
(kv/kh)0.5=1/3. Flow net is drawnto make square grids like for isotropichomogeneous dam.
2/3
1H
H
Drain
Flow line
2
1
Equipotential line
Fig.6.3 Seepage Through Anisotropic Embankment
―Dam.23―
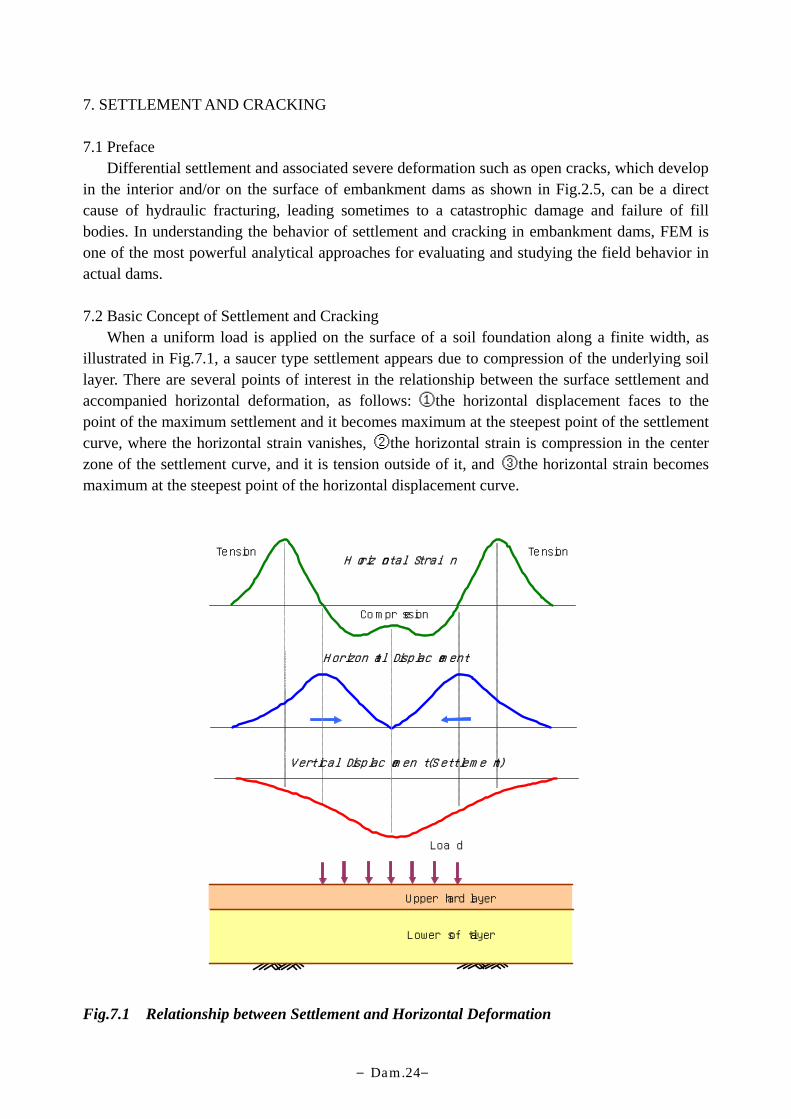
7. SETTLEMENT AND CRACKING 7.1 Preface Differential settlement and associated severe deformation such as open cracks, which develop in the interior and/or on the surface of embankment dams as shown in Fig.2.5, can be a direct cause of hydraulic fracturing, leading sometimes to a catastrophic damage and failure of fill bodies. In understanding the behavior of settlement and cracking in embankment dams, FEM is one of the most powerful analytical approaches for evaluating and studying the field behavior in actual dams. 7.2 Basic Concept of Settlement and Cracking When a uniform load is applied on the surface of a soil foundation along a finite width, as illustrated in Fig.7.1, a saucer type settlement appears due to compression of the underlying soil layer. There are several points of interest in the relationship between the surface settlement and accompanied horizontal deformation, as follows: ①the horizontal displacement faces to the point of the maximum settlement and it becomes maximum at the steepest point of the settlement curve, where the horizontal strain vanishes, ②the horizontal strain is compression in the center zone of the settlement curve, and it is tension outside of it, and ③the horizontal strain becomes maximum at the steepest point of the horizontal displacement curve.
Tension
Lower soft layer
Upper hard layer
Horizontal Strain
Horizontal Displacement
Vertical Displacement (Settlement)
Tension
Load
Compression
Fig.7.1 Relationship between Settlement and Horizontal Deformation
―Dam.24―

Similar characteristics of deformation are also pointed out in the F.E. solutions of gravity turn-on analysis on the longitudinal section of a homogeneous earth dam, as shown in Fig.7.2, where distributions of settlement and horizontal deformation are plotted along the crest surface of the dam. The settlement curve looks like a saucer, having the maximum value at the center of the valley. The horizontal displacement faces to the point of the maximum settlement, and it becomes to maximum at the steepest point of the settlement curve. The horizontal strain becomes tension outside the point of maximum displacement, and it becomes to maximum at the steepest point of the horizontal displacement curve.
sett
lem
ent
vdi
spla
cem
ent
u
settlement(v)
displacement(u)
strain(ε)
tension zone
x
x
1:2
stra
in(ε
)te
nsi
on
com
press
ion
Fig.7.2 Distribution of deformation along crest 7.3 Field Behavior and Cracking Potential The field behavior of settlement and cracking observed in a homogeneous earth dam is compared in Fig.7.3 with the F.E. elastic solutions of gravity turn-on analysis. The left part of the longitudinal section of the dam can be approximated by a simple trapezoid having a 1:1.5 slope and a horizontal base foundation, for which the F.E. solution of the left half of a fill of a symmetric trapezoid is effectively applied. The right part of the base foundation can similarly be approximated by a straight line of 1:2.0 slope, for which the F.E. solution of the right half of a V-shaped fill is the most applicable. It is recognized well in these figures that simple F.E. solutions are quite effective, quantitatively as well as qualitatively, in evaluating distributions of the settlement and the horizontal strain along the crest and cracking potential of the dam. Field measurement and F.E. solutions on the relationship between the horizontal strain and the cracking potential along the crest of embankment dams are summarized in Fig.7.4. The measured and the calculated values of the maximum strain ε are normalized by a ratio of the settlement to the dam height w/H and plotted against slope inclination of the abutment (1:b). It is seen that the F.E. solutions roughly give the lower bound value of the measured strains at cracking and can be a useful material in estimating cracking potential in embankment dams.
―Dam.25―

FEMFEM
1:1.5
Zone of Cracking
Observed Cracks
εmax
1:2.0
49m
60m
49m
Left Right
FEM
FEM
FEM
FEM
Dam completed Jan.1947
Observed Dec.1949
Dam completed
Observed Dec.1949
Sett
lem
ent
Str
ainten.
comp.
Rector Creek Dam
Fig.7.3 Comparison of deformation and cracking along crest
1 2 3 4 500
1.5
2.0
1.0
0.5
Cracking
No cracking
FEM
Slope (1:b)
Str
ain r
atio
ε
/(w
/H
)
Fig.7.4 Cracking potential along crest
―Dam.26―

8. HYDRAULIC FRACTURING 8.1 Preface In recent years, hydraulic fracturing has been a matter of great concern in the design and construction of embankment dams. Extensive studies have been done on this subject especially since the failure of Teton Dam (USA) in 1976. Hydraulic fracturing can be considered equivalent to the well-known seepage failures such as quick sand and piping. One of typical examples of hydraulic fracturing, which engineers can understand easily in the first step, must be a fracture of ground during field permeability test, as described in Fig.8.1. The permeability measured at a high water pressure head becomes excessively large due to hydraulic fracture in the ground as compared with the one measured at a small head. It should be noted that the water pressure beyond which hydraulic fracture occurs is sensitive to the stress state at the site and comparatively lower than the effective overburden pressure at that point. Field Permeability Test
・ The permeability of unfractured clay tested at small head Δu is of the
order of 1-2×10⁻⁷cm/s, but this increased sharply when testing
pressure exceeded 0.4-0.5p0' at
site (A) and about 0.8p0' at site (B).
・ Very low failure pressure at site (A) is considered to be due to "arching", where weight of overburden was carried to a large extent by shear stresses along wall of trench.・ Fracture usually takes place at about
0.8p0', less than overburden pressure,
like at site (B) even though arching is eliminated, which demonstrates that critical pressure against hydraulic fracturing must be horizontal stress or minor principal stress.
10-7
10-6
10-5
10-4
10-3
Coeff
icie
nt
of
Perm
eabi
lity
k (
cm
/s)
0.2
Ratio of Water Pressure to Effective
Overburden Pressure Δu/p0'
0.6 1.00.80.40.0 1.2
site (A)trench
site (B)level ground
Arching Fig.8.1 Hydraulic Fracture During Field Permeability Test 8.2 Hydraulic Fracture in Fill-type Dams The mechanism of hydraulic fracture observed in embankment dams is not so simple because configuration and interaction of the embankment and surrounding abutment foundation are very complicated. Fracture generally occurs when a state of zero effective stress appears near the interface of the core zone and the abutment foundation in accordance with the progress of differential settlement in embankment, in which soil materials are washed away from the core zone by erosion and it leads to progressive erosion and piping.
―Dam.27―

Two distinct patterns of hydraulic fracturing can be considered in embankment dams. One is the case where differential settlement after construction is contributive to cause cracking in the embankment and erosion takes place due to the flow of the reservoir water passing through open cracks. When embankment deformation is accompanied by differential settlement, tensile strains develop on the surface or in the interior of the embankment, and the minor principal stress σ3 tends to decrease locally to open tension cracks. The criterion for the possibility of hydraulic fracturing in this case is represented by the condition:
σ3 < -pt ......(8.1)
in which pt is the tensile strength in terms of total stress. Corresponding stress state is indicated in Fig.8.2(a), where the initial stress circle (Ⅰ) grows on the left side due to the decrease in σ3 and touches the failure envelop at the circle (Ⅱ) to open tension cracks. The other pattern is the case where pore-water pressure in the core increases according as the reservoir filling proceeds and the effective stress σ3' decreases up to the effective tensile strength pt' to open unseen or latent cracks. The criterion in this case is given by
σ3' < -pt' ......(8.2)
and stress states are illustrated in Fig.8.2(b), where the initial stress circle (Ⅰ) shift to the left without diameter change and touches the envelop at the circle (Ⅱ). The criterion is summarized when pt=pt', in place of Eqs.(8.1) and (8.2), in the following form:
σ3 + pt < pw ......(8.3)
in which pw is the hydrostatic pressure. Eq.(8.3) reduces to Eq.(8.1) when pw=0, that is, when pw
should not be taken into account before impounding.
(b) Condit ions for Seepage Fracture Effective stresses in the core decrease as reservoir filling proceeds, where
decrease in effective stress σ3' beyond
tensile strength σt' causes open cracks and erosion.
(a) Condit ions for Cracking Differential settlement after construction causes decrease in
minor principal stress σ3, which
leads to open cracks and internal erosion in embankment.
σ
τFailure
σt
σ3 σ1
(Ⅰ)
(Ⅱ)
σ
τ
σt'
σ'3 σ'1
(Ⅰ)(Ⅱ)
σ3 σ1
Δu=pw
Failure
Fig.8.2 Hydraulic Fracturing in Embankment Dams
―Dam.28―

Two typical patterns of hydraulic fracturing, which engineers often encounter in the field, are again illustrated in Figs.8.3 and 8.4.
σ1
σ3
tension cracksdifferential settlement
internal cracks
σ3 decreases
(2) Effective stress circle shifts left more by the action of reservoir water pressure (pw) and touches failure envelope to occur seepage fracture
(1) Bothσ1 and σ3 decrease due to differential settlement and arching action near abutment foundation, which also causes surface and internal cracking.. Total stress circle becomes large (drop of σ3 may be larger) and shifts left
σ
(2)
(1)
σ1σ3 σ3σ3'
Δu = pw
τ failure envelop
Fig.8.3 Hydraulic Fracturing Type (1): Differential Settlement and Cracking
σ1
σ3
σ1,σ3 decrease
arching
cracks
Δu = pw
(2) Effective stress circle shifts left by the action of water pressure (pw) and touches failure envelope to occur cracking and seepage fracture
(1) Bothσ1 and σ3 decrease due to arching action in the upper part of the core, which causes internal cracking. Total stress circle becomes small (drop of σ1 may be larger in this case) and shifts left
(2) (1)
σ1σ3 σ3σ3' σ
τ failure envelop
Δu = pw
Fig.8.4 Hydraulic Fracturing Type (2): Cracking and Seepage
―Dam.29―

9. EARTHQUAKE RESISTANT DESIGN OF EMBANKMENT DAMS 9.1 Preface It has not yet been reported so far that large earth and rockfill dams have experienced serious damages including sliding failures to cause severe economic and social losses, though they have often been attacked by strong earthquakes of the maximum acceleration far beyond the design value. In the Naganoken-Seibu earthquake in 1984 (Japan, M=6.8), for instance, the epicenter was several hundred meters far from Makio dam, a centrally located core type rockfill dam of 105m in height, and the maximum acceleration at the crest of the dam was estimated to be almost the same as the acceleration of gravity (g=980gals). In the Morgan Hill earthquake in 1984 (USA, M=6.2), the maximum acceleration observed at the left side abutment foundation of Coyote dam site was as large as 1.29 times of g. Serious damages, however, were not reported in these cases except for small open cracks on the crest and/or shallow slip of rockfill slopes even though the embankments were under such strong excitation of more than several times as large as the design value of acceleration. This is to be said due to an essential shortcomings of the ordinary seismic coefficient method (SCM) in which dynamic forces developed in an embankment during earthquake are treated statically by introducing the equivalent seismic inertia forces distributed uniformly from bottom to crest. In Fig.9.1, a little cracking damages observed on the crest of La Villita dam (Mexico, H=60m) caused by the 1985 Mexico Earthquake (M=8.1) is illustrated as an example. In this earthquake, the acceleration observed at the crest reached up to about 0.7g, but only two lines of cracks of about 50cm deep were detected along the axis of the dam.
Clay core
Filter Transition
Upstream Downstream
Crest road
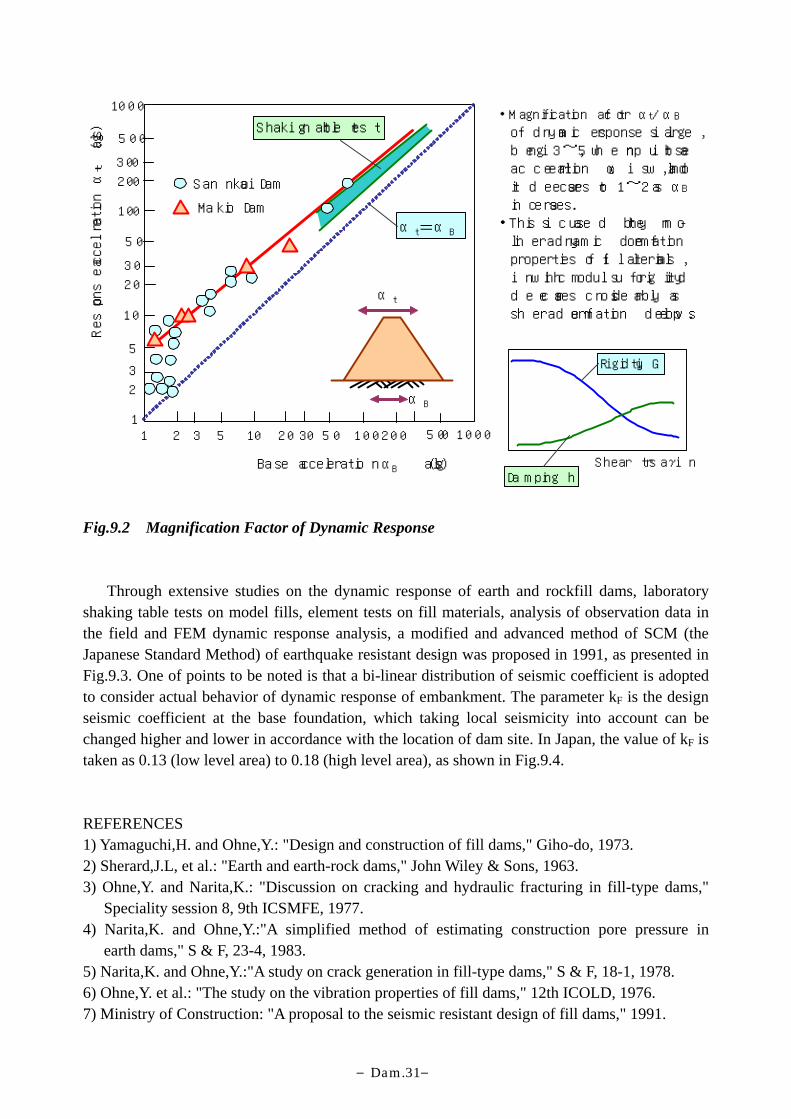
Cracks Fig.9.1 Damage Caused by Mexico Earthquake in 1985 (La Villita Dam) 9.2 Japanese Standard of Earthquake Resistant Design It is generally known that when an embankment resting on foundation is subjected to an earthquake excitation, the acceleration response at the crest becomes considerably high as compared with the input acceleration at the base. In this case, sliding failures likely take place in the crest part because of seismic instability. Fig.9.2 shows the relation between the base acceleration and the response acceleration at the crest observed in actual dams and in laboratory shaking table tests. Because of the non-linear dynamic deformation properties of fill materials, the acceleration ratio of αt toαB decreases as the intensity of the base acceleration αB increases.
―Dam.30―
s)
al
(g
n α
tio
lera
cce
a
onse
esp
R
Base acceleration αB (gals)
αt=αB
11 10 100505
t
Shaking table test
Sannokai Dam
2 3 3020 1000500200
3
10
5
2
100
30
20
50
1000
300
500
200
Makio Dam
αB
αt
・ Magnification factor αt/αB
of dynamic response is large, being 3~5, when input base acceleration αB is low, and it decreases to 1~2 as αB
increases.・ This is caused by the non- linear dynamic deformation properties of fill materials, in which modulus of rigidity decreases considerably as shear deformation develops.
Rigidity G
Shear strainγDamping h
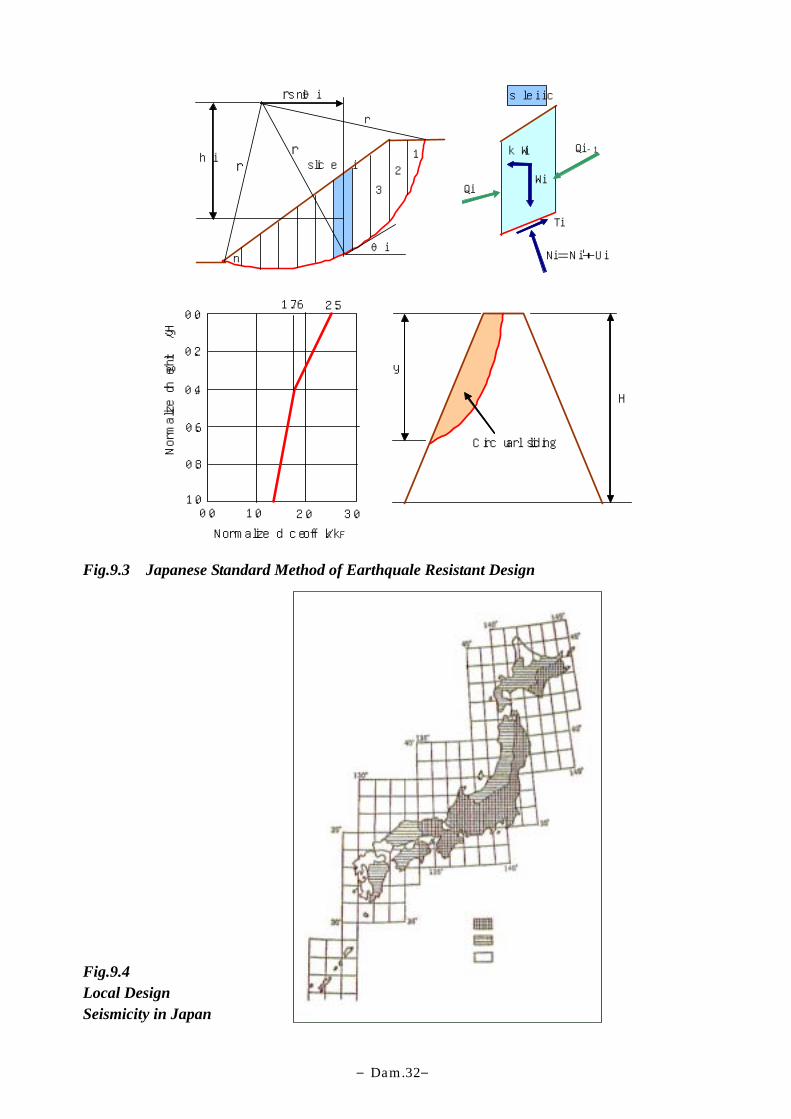
Fig.9.2 Magnification Factor of Dynamic Response Through extensive studies on the dynamic response of earth and rockfill dams, laboratory shaking table tests on model fills, element tests on fill materials, analysis of observation data in the field and FEM dynamic response analysis, a modified and advanced method of SCM (the Japanese Standard Method) of earthquake resistant design was proposed in 1991, as presented in Fig.9.3. One of points to be noted is that a bi-linear distribution of seismic coefficient is adopted to consider actual behavior of dynamic response of embankment. The parameter kF is the design seismic coefficient at the base foundation, which taking local seismicity into account can be changed higher and lower in accordance with the location of dam site. In Japan, the value of kF is taken as 0.13 (low level area) to 0.18 (high level area), as shown in Fig.9.4. REFERENCES 1) Yamaguchi,H. and Ohne,Y.: "Design and construction of fill dams," Giho-do, 1973. 2) Sherard,J.L, et al.: "Earth and earth-rock dams," John Wiley & Sons, 1963. 3) Ohne,Y. and Narita,K.: "Discussion on cracking and hydraulic fracturing in fill-type dams,"
Speciality session 8, 9th ICSMFE, 1977. 4) Narita,K. and Ohne,Y.:"A simplified method of estimating construction pore pressure in
earth dams," S & F, 23-4, 1983. 5) Narita,K. and Ohne,Y.:"A study on crack generation in fill-type dams," S & F, 18-1, 1978. 6) Ohne,Y. et al.: "The study on the vibration properties of fill dams," 12th ICOLD, 1976. 7) Ministry of Construction: "A proposal to the seismic resistant design of fill dams," 1991.
―Dam.31―
slice ir 2
1
3
n
r
rhi
rsinθi
θi
Wi
Ti
kWi
Qi
Qi-1
Ni=Ni'+Ui
slice i
Circular sliding
H
0.8
0.01.0
1.0 2.0
0.2
3.0
0.4
0.6
0.02.51.76
Normalized coeff. k/kF
Norm
aliz
ed h
eig
ht
y/H
y
Fig.9.3 Japanese Standard Method of Earthquale Resistant Design Fig.9.4 Local Design Seismicity in Japan
―Dam.32―