Embed Size (px)
Citation preview

Coimisiún na Scrúduithe Stáit State Examinations Commission
LEAVING CERTIFICATE EXAMINATION 2009
DESIGN AND COMMUNICATION GRAPHICS
HIGHER AND ORDINARY LEVELS
CHIEF EXAMINER’S REPORT

Design and Communication Graphics 2009
Page 1
CONTENTS 1. Introduction ............................................................................................................................................. 2
1.1. The Syllabus 2
1.2. The Examination 2
1.3. Candidature 2
1.4. Choice of Level 3
1.5. Gender Balance 4 2. Performance of Candidates ................................................................................................................ 5
2.1. Ordinary Level 5
2.2. Higher Level 7 3. Student Assignment .............................................................................................................................. 9
3.1. Ordinary Level 9
3.1.1. Assignment Brief 10
3.1.2. Performance of Candidates 10
3.1.3. Analysis of Candidate Performance 11 3.2. Higher Level 14
3.2.1. Assignment Brief 14
3.2.2. Performance of Candidates 15
3.2.3. Analysis of Candidate Performance 16 4. Final Examination 20
4.1. Ordinary Level 20
4.1.1. Performance of Candidates 20
4.1.2. Analysis of Candidate Performance 25
4.2. Higher Level 38
4.2.1. Performance of Candidates 38
4.2.2. Analysis of Candidate Performance 43 5. Conclusions ............................................................................................................................................... 56
5.1. Student Assignment 56
5.2. Final Examination 56
5.3. General 57 6. Recommendations to teachers and students ................................................................................ 59
6.1. Student Assignment 59
6.2. Final Examination 60
6.3. General 61 7. Exemplars of standard ........................................................................................................................ 62

Design and Communication Graphics 2009
Page 2
Practical Coursework TotalOrdinary Level 160 marks 400 marksHigher Level 160 marks 400 marks
Examination Paper240 marks240 marks
1. INTRODUCTION
This report should be read in conjunction with the relevant published marking scheme which can be accessed on the State Examinations Commission website www.examinations.ie.
The report contains a detailed commentary on each of the examination components, together with key conclusions and recommendations. The comments reflect those expressed by the examiners who were involved in the marking of the examination components. The comments and recommendations are intended to aid teachers and candidates in preparation for future examinations. Statistics quoted in the report are based on the full cohort of candidates.
1.1 The Syllabus
The syllabus in Design and Communication Graphics (DCG) was introduced in 2007 and was examined for the first time, this year, in 2009. It replaced the old Technical Drawing Syllabus which was on the curriculum since 1984. The Design and Communication Graphics course makes a unique contribution to the development of the students’ cognitive and practical skills. These skills include graphic communication, creative problem solving, spatial visualisation, design capabilities, computer graphics and Parametric CAD modelling. The creative and decision making capabilities of students in the activities associated with design are developed through three principal areas of study: design and communication graphics, plane and descriptive geometry, and applied graphics. The subject is designed and structured to take cognisance of important contemporary developments in the modes of communicating design information.
The syllabus has a core and options structure. All students must study all of the material in the core areas of study. Students must also study two of the five optional modules. This core and options structure is reflected in the structure of the final examination paper. 1.2 The Examination
The examination is offered at two levels – Ordinary and Higher. At each level there are two examination components:
1. Practical coursework (Student Assignment) (40%) 2. A final examination in graphics (60%)
The total mark for the overall examination at each level is 400. The mark allocation is outlined in Table 1.
Table 1: Allocation of marks.
Both examination components are marked separately by different examining teams which are appointed and trained by the State Examinations Commission. 1.3 Candidature
This year 6,204 candidates sat the examination in DCG. This figure represented an increase of 13% on the 5,485 candidates who sat the Technical Drawing examination in 2008. The DCG candidature represented 10.8% of the total Leaving Certificate cohort of 57,455 in 2009. The overall subject candidature numbers for the past six years are outlined in Chart 1.

Design and Communication Graphics 2009
Page 3
2004
2005
2006
2007
2008
40.0%
45.0%
50.0%
55.0%
60.0%
65.0%
70.0%
2009
%
Chart 1: Candidature, Technical Drawing and DCG, 2004 – 2009 1.4 Choice of Level
In recent years, while there has been a gradual increase in the percentage of candidates opting to sit Technical Drawing at Higher Level, the percentage was still relatively low when compared with other Leaving Certificate subjects. The introduction of DCG this year has brought about a marked shift in the Ordinary Level/Higher Level breakdown. This welcome development is represented in Table 2 and Chart 2 below. Table 2: Choice of Level (2004 – 2009). Chart 2: Percentage opting for Higher Level (2004 – 2009).
Numbers % Numbers %2004 6032 3153 52.3% 2879 47.7%2005 5769 3060 53.0% 2709 47.0%2006 5291 2920 55.2% 2371 44.8%2007 5216 2878 55.2% 2338 44.8%2008 5485 3051 55.6% 2434 44.4%2009 6204 4110 66.2% 2094 33.8%
Year Total Higher Level Ordinary Level
2009
Technical Drawing
5
6204
2004
2005
2006
2007
2008
6032
5769
52915216
5485
5000
5200
5400
5600
5800
6000
6200
6400
Can
dida
ture

Design and Communication Graphics 2009
Page 4
A greater number of candidates presented a Higher Level Student Assignment than eventually sat the Higher Level examination. 71.6% of candidates presented a Higher Level assignment while only 66.2% sat the Higher Level examination paper. These 250 candidates were awarded a grade at Ordinary Level by combining the marks achieved in each component.
1.5 Gender Balance
The number of males sitting the subject continues to outweigh the number of females. However there is an indication that female participation is increasing. In 2005, when the previous Chief Examiner’s report was published, females accounted for 7% of the overall numbers and 9% of the Higher Level cohort. These figures have increased to 9% and 10% respectively with the examination of the new DCG syllabus in 2009.

Design and Communication Graphics 2009
Page 5
A B C D E F NG
0.0%
5.0%
10.0%
15.0%
20.0%
25.0%
30.0%
35.0%
40.0%
Year A B C D E F NG11.0% 29.5% 28.8% 23.1% 4.7% 2.2% 0.7%
23.1%12.5% 27.2% 28.8% 22.9% 5.9% 2.0% 0.8%
22.9%6.6% 24.6% 36.3% 20.3% 7.0% 4.4% 0.7%
20.3%2009 67.6% 12.1%
2007 69.3% 7.6%
2008 68.5% 8.7%
A B C D E F NG TOTALNumber 139 515 761 425 147 92 15 2094
% 6.6% 24.6% 36.3% 20.3% 7.0% 4.4% 0.7%Number 425 2094
% 20.3%1415 254
67.6% 12.1%
PERFORMANCE OF CANDIDATES 2.1 Ordinary Level This year’s overall distribution of grades at Ordinary Level is outlined in Table 3.
Table 3: Ordinary Level – Grade Distribution 2009. This year’s Ordinary Level grade distribution is outlined in pictorial format in Chart 3. Chart 3: Ordinary Level – Grade Distribution 2009. Table 4 compares the grade distribution with that of previous years in Technical Drawing.
Table 4: Ordinary Level – Grade Comparisons 2007 - 2009. The introduction of the new programme, with its core and options structure, has had a notable impact on the grade profile at Ordinary Level. While the percentage attaining a C grade or higher has remained relatively static, the percentages achieving A and B grades has fallen. The combined E, F and NG rate has also increased. This is partly attributed to the shift in candidature from Ordinary to Higher Level. However, it is also the result of candidates not attempting all of the required sections of the examination components. This latter issue will be addressed in subsequent sections of this report. The figures are outlined in pictorial format in Chart 4.

Design and Communication Graphics 2009
Page 6
A B C D E F NG
0.0%
5.0%
10.0%
15.0%
20.0%
25.0%
30.0%
35.0%
40.0%
200720082009
A B C D E F NG8.0% 22.8% 37.0% 22.8% 3.1% 4.9% 1.2%
22.8%6.5% 24.7% 36.3% 20.1% 7.3% 4.3% 0.7%
20.1%
FEMALE 67.9% 9.3%
MALE 67.5% 12.4%
Chart 4: Ordinary Level – Grade Comparisons 2007 – 2009. There was no significant difference in performance between males and females at Ordinary Level. The 9% of females who sat the Ordinary Level examination attained almost the same percentage of ABC grades as males. However, females did achieve a slightly higher percentage of A grades than males. In the past, in Technical Drawing males would have performed better than females in terms of A grades. It is also noteworthy that the failure rate is lower amongst the female cohort, following a similar pattern to that observed in the past. These figures are outlined in Table 5 and Chart 5. Table 5: Ordinary Level – Comparison of Male and Female Grade Distribution 2009. Chart 5: Ordinary Level – Comparison of Male and Female Grade Distribution 2009.
A B C D E F NG
0.0%
5.0%
10.0%
15.0%
20.0%
25.0%
30.0%
35.0%
40.0%
Female
Male

Design and Communication Graphics 2009
Page 7
A B C D E F NG TOTALNumber 522 1335 1388 731 111 19 4 4110
% 12.7% 32.5% 33.8% 17.8% 2.7% 0.5% 0.1%Number 731 4110
% 17.8%3245 134
79.0% 3.3%
2.2 Higher Level This year’s overall distribution of grades at Higher Level is outlined in Table 6. Table 6: Higher Level – Grade Distribution 2009. This year’s grade distribution is outlined in pictorial format in Chart 6. Chart 6: Higher Level – Grade Distribution 2009. Table 7 compares the grade distribution with that of previous years in Technical Drawing. Table 7: Higher Level – Grade Comparisons 2007 - 2009. The grade breakdown at Higher Level is consistent with that of Technical Drawing in the past. The only notable variation is a slight increase in combined ABC grades and a slight decrease in A grades. This is a feature frequently observed when coursework is introduced in subject areas that were previously assessed through a final examination only. The decrease in the failure rate is also a welcome development. These figures are illustrated in Chart 7.
A B C D E F NG
0.0%
5.0%
10.0%
15.0%
20.0%
25.0%
30.0%
35.0%
Year A B C D E F NG13.6% 33.0% 31.5% 18.3% 3.3% 0.4% 0.1%
18.3%13.8% 32.1% 28.8% 20.0% 4.1% 1.1% 0.0%
20.0%12.7% 32.5% 33.8% 17.8% 2.7% 0.5% 0.1%
17.8%2009 79.0% 3.3%
2007 78.1% 3.8%
2008 74.7% 5.2%

Design and Communication Graphics 2009
Page 8
A B C D E F NG
0.0%
5.0%
10.0%
15.0%
20.0%
25.0%
30.0%
35.0%
200720082009
A B C D E F NG12.6% 36.1% 35.9% 12.1% 2.5% 0.8% 0.0%
12.1%12.7% 32.1% 33.5% 18.4% 2.7% 0.4% 0.1%
18.4%
3.3%
78.4% 3.3%
FEMALE
MALE
84.6%
Chart 7: Higher Level – Grade Comparisons 2007 - 2009. The 10% of females who sat the Higher Level examination tended to perform better than males right across the grade spectrum with the exception of the A grade category. This follows a similar pattern to Technical Drawing in previous years. The figures are outlined in Table 8 and Chart 8. Table 8: Higher Level – Comparison of Male and Female Grade Distribution 2009.
Chart 8: Higher Level – Comparison of Male and Female Grade Distribution 2009.
A B C D E F NG
0.0%
5.0%
10.0%
15.0%
20.0%
25.0%
30.0%
35.0%
40.0%
Female
Male

Design and Communication Graphics 2009
Page 9
3. Student Assignment This element of the assessment examines areas of the syllabus which cannot be readily assessed by means of the final examination. Candidates are required to carry out a design investigation based on a brief issued by the SEC. A different design brief applies at Higher and Ordinary Levels. The 2009 briefs issued in November 2008 and the coursework was required to be completed by March.
Computer Aided Design (CAD), in the form of parametric modelling, forms a compulsory part of the Student Assignment. Candidates were required to generate the CAD models/drawings using SolidWorks, which is the software specified by the Department of Education and Science. Schools were informed that CAD models/drawings generated using other software would not be acceptable for assessment purposes and no difficulties were encountered in this regard. Candidates were required to present an A3 hardcopy portfolio of their assignment along with an individual CD containing the SolidWorks files and the portfolio in electronic format (PDF). In a number of instances the CDs that were submitted were blank or did not contain the required CAD files. The SolidWorks files for these candidates could not be assessed as a result. It is important that all candidates check their disk before submission to ensure that are all necessary files are properly saved. The DCG syllabus clearly identifies the creation of folders and saving of files to designated locations as a key skill and in this instance the CD is such a location. 64 disks, out of over 6200, (1%) were unfortunately damaged in transit. In these cases schools were contacted by the SEC and a back-up copy of the candidates’ work was forwarded for assessment in all cases. It was reassuring to see that the candidates’ work was backed up on the schools’ IT system as required. Fixing the CD to one corner of the portfolio will potentially reduce this minor problem and will form part of the Instructions to Candidates in future years. Practical coursework was accepted for assessment only where it was the candidates’ own individual work, which had been completed in school under the supervision of the class teacher with the work authenticated by the class teacher and the principal. The SEC policy and practice for the acceptance of practical coursework for assessment are outlined in circulars S68/04 and S69/04. Copies of these circulars are available on the SEC website (www.examinations.ie). A representative sample of the CAD files was monitored to ensure that the work had been carried out in accordance with SEC requirements. 3.1 Ordinary Level 3.1.1. Assignment Brief
The Ordinary Level Student Assignment brief was as follows:
Remote control units are to be found in most homes. They allow users to operate a variety of audio-visual equipment.
Many of these remote controls have features such as an LCD screen, button/touch-screen operated controls, universal function, battery compartment, etc.
(A) Carry out a design investigation of the physical form and features of existing remote controls. and
(B) Show graphically the modifications which you would make to an existing remote control to improve its overall design.
or
Develop and graphically communicate a new concept design for a remote control.

Design and Communication Graphics 2009
Page 10
Grade A B C D E F NGNo. of Candidates 362 579 388 265 92 42 4% of Candidates 20.9% 33.4% 22.4% 15.3% 5.3% 2.4% 0.2%
15.3%76.7% 8.0%
0.0%
5.0%
10.0%
15.0%
20.0%
25.0%
30.0%
35.0%
A B C D E F NG
Candidates, at Ordinary Level, were required to present an A3 bound design portfolio, with a maximum of 12 pages, together with an individual CD containing the SolidWorks files and the portfolio in electronic format. The candidates were given nine broad headings under which they were required to respond to the brief (See marking scheme). These are referred to as Outputs 1 to 9. In Part A of the assignment (Outputs 1 to 6), candidates were required to explore existing artefacts and communicate these designs using images, freehand sketches, parametric CAD models, drawings and computer generated photorealistic images. 110 marks out of a total of 160 marks were awarded for this part of the assignment. In Part B (Outputs 7 to 9), candidates were required to either make a design modification to an existing artefact or to develop a new concept design for a remote control. The candidates were asked to graphically communicate their design ideas through the use of images, freehand sketches, CAD models and computer generated drawings. This part of the assignment was awarded 50 marks out of the total of 160 marks. 3.1.2. Performance of Candidates 1732 candidates attempted the Student Assignment at Ordinary Level in its first year. The distribution of the grades is indicated in Table 9. Table 9: Student Assignment Ordinary Level – Distribution of grades, 2009. Chart 9 displays this grade breakdown information graphically. Chart 9: Ordinary Level – Grade Distribution Overall the standard of work presented for assessment at Ordinary Level was very good with candidates achieving an average overall mark of 68.1%. The performance of the candidates in each of the nine outputs is detailed below.

Design and Communication Graphics 2009
Page 11
Output Total Marks for Output
Average Mark with (%)
Rank order(by marks)
1 15 12.2 (81.2%) 22 15 11.3 (75.6%) 43 20 14.2 (70.9%) 54 30 20.3 (67.7%) 65 20 16.0 (80.0%) 36 10 8.2 (82.0%) 17 20 11.3 (56.3%) 78 10 4.7 (46.9%) 99 20 11.0 (55.0%) 8
DCG Student Assignment – Analysis at Ordinary levelPa
rt A
Part
B
3.1.3. Analysis of Candidate Performance A detailed analysis of the candidate performance across all nine outputs on the assignment is presented in Table 10. Table 10: Ordinary Level – Statistical Analysis on the answering of Outputs Candidates were required to present material for each Output and while the majority of candidates did so, some candidates omitted some of the Outputs and marks were lost as a result. The Outputs in Part B were the most frequently omitted and this phenomenon was more notable at Ordinary Level than at Higher Level. In general, Part A of the assignment was well answered. Candidates scored particularly well on Output 1, the graphical exploration of the brief and presentation of existing artefacts. However, there was frequently little evidence of primary research as candidates relied heavily on the Internet as their source of their ideas. The general standard of freehand sketching was satisfactory in Outputs 2 and 3 with some candidates using a range of suitable media and various presentation techniques. However, this is an area that could be improved upon, particularly the use of freehand sketching in comparing and contrasting the main design features in Output 2. The parametric models produced in Output 4 were generally of a good standard. The file management on the accompanying CD was generally good and in keeping with the file and folder structure as required and outlined in the design briefs. On occasion, problems arose with the assembly files where the file management was adhered to. In some cases not all of the SolidWorks part files were submitted and in these instances the assembly files would not open properly as a result. As stated earlier not all candidates submitted material, as required, in response to Part B of the assignment. This was the case in relation to 12.7% of Ordinary Level candidates and marks were lost as a result. In Part B candidates had a choice of either presenting a design modification or a concept design. The design modification was the most popular choice at Ordinary Level. However, the rationale for the modification was often not fully explained or clearly communicated. The graphical presentation of the modified artefact/concept design was generally fair but often lacked sufficient detail. As a result, Ordinary Level candidates did not perform well on Output 8. In most cases the candidates produced a CAD model of their modified design or concept design and produced hardcopy outputs of a reasonably high standard. Overall, there is more scope for improved performance in Part B rather than in Part A of the assignment.

Design and Communication Graphics 2009
Page 12
Part A
In Part A candidates were required to carry out a design investigation of the physical form and features of existing remote controls. This entailed exploring a range of existing artefacts, developing an appreciation of their main design features and communicating one existing design through the use of images, freehand sketches and CAD models. All 1,732 candidates at Ordinary Level presented material in response to Part A of the assignment. The standard of work presented in the case of each of the six Outputs in this Part is outlined below. Output 1 – Exploration of brief and presentation of existing artefacts in graphic format
This Output yielded an average mark of 12.2 out of 15 (81.2%). While many candidates fully explored the brief, some relied too heavily on the Internet as the only source of research. In some cases candidates presented a number of images from the Internet and devised a historical timeline without fully exploring the range of existing artefacts. While the timeline had some relevance in responding to the specified brief, it needed to be supplemented with a structured investigation and graphical presentation of existing artefacts. Where research material was sourced externally, it was generally correctly acknowledged as required. Output 2 – Design Feature Comparison
This Output yielded an average mark of 11.3 out of 15 (75.6%). Many candidates made a good attempt to compare and contrast the main design features of two existing artefacts. The main dimensions were included in most cases and good freehand sketches were used effectively in some cases to highlight the different physical design features and the similarities of two selected artefacts. However, many candidates misinterpreted this output and compared and contrasted the functionality of both artefacts rather than the physical design features. For example, it was not uncommon for candidates to discuss less relevant specifications such as radio frequency, whilst ignoring the more important aspects such as physical form. Output 3 – Detailed graphical presentation to include a rendered freehand presentation quality
drawing in 3D format
This Output yielded an average mark of 14.2 out of 20 (70.9%). Candidates were required to produce a detailed graphical presentation which included a 3D rendered freehand presentation quality drawing. This output afforded candidates the opportunity to demonstrate their freehand sketching and presentation skills. Many candidates produced excellent freehand presentation drawings using a range of media and presentation techniques. However, a number of candidates used drawing instruments or traced their “sketches” and, as a result, they did not succeed as well, in terms of marks, as those that adhered to the requirements of this output. Some candidates scanned all of their sketches and presented only printouts. It should be noted that original, non scanned, sketches should be presented for Outputs 3 and 8. This not only helps to support the authenticity of the work but provides candidates with an opportunity to use a wider variety of drawing media than would be possible with scanned images. Output 4 – SolidWorks Parts, Assembly and eDrawing files
This Output yielded an average mark of 20.3 out of 30 (67.7%). This was the lowest average mark of the six Outputs in Part A. This was mainly due to the fact that some candidates did not submit the required CAD files on disk together with the portfolio.
Most candidates produced models with three parts as required and the standard of modelling was, in general, good. However, greater emphasis needs to be placed on fully defining sketches and renaming part files as well as main features. Poor file management sometimes resulted in assembly files not opening properly i.e. one or more parts were not included in the appropriate folder on the accompanying CD. Also, in a number of assemblies the parts were not properly mated, just merely

Design and Communication Graphics 2009
Page 13
0.0%
10.0%
20.0%
30.0%
40.0%
50.0%
60.0%
70.0%
80.0%
90.0%
Modification ConceptDesign
NotAttempted
moved into position so that the parts appeared to be assembled. While most candidates submitted the required eDrawing of the CAD model, in other cases the eDrawing was not submitted on the CD. Candidates lost some marks as a result of these errors and omissions. Output 5 – Hardcopy outputs from SolidWorks
Almost all of the candidates produced the orthographic, rendered pictorial and exploded views of the CAD model as required. This Output was generally well answered with many candidates producing good hardcopy layouts containing a variety of appropriately scaled views, details and sections with accompanying notes. The most common error in this output was poor layout due to inappropriate scaling of the drawing views. Output 6 – Photorealistic image
The vast majority of candidates produced a photorealistic image of the CAD model. Many of these images were taken directly from SolidWorks and were accepted for the first year of the DCG Student Assignment. However, some candidates used PhotoWorks to produce high quality photorealistic images of their models. In future it is expected that all candidates will use PhotoView 360, PhotoWorks or some other image manipulation software to create the required Output. A small number of candidates produced images that were blurred or of poor quality and lost some marks as a result. Part B
In Part B of the assignment candidates were asked to make a design modification to the selected existing artefact or to create a new concept design for a remote control. As indicated earlier, Part B of the assignment was not as well answered as Part A. The majority of the candidates (81.6%) at Ordinary Level opted for the design modification while 5.7% opted for the concept design. Significantly, 12.7% of the candidates did not make any attempt at Part B of the assignment and this had an influence on the EFNG rate. These statistics are illustrated in chart 10. Chart 10: Ordinary Level Choices – Part B Candidates who opted for the concept design scored an average mark of 120.2 out of 160 (75.1%) and, in general, these candidates performed marginally better than those who opted for the design modification who received an average mark of 116.3 out of 160 (72.7%). Candidates who attempted the concept design usually responded to Output 7 more comprehensively than those carrying out a design modification.

Design and Communication Graphics 2009
Page 14
Docking stations are becoming increasingly popular with young people who wish to share the music collection on their personal MP3 players with friends.
Many docking stations have features such as a charging facility, in-built speakers, independent volume control, etc.
(A) Carry out a design investigation of the physical form and features of existing MP3 player docking stations.
and (B) Show graphically the modifications which you would make to an existing docking station
to improve its overall design. or
Develop and graphically communicate a new concept design for a docking station.
Output 7 – Graphical exploration of design solutions
In this Output candidates were required to graphically communicate their observations and suggestions to either modify the existing design chosen in Part A or to create a new concept design. The candidates were required to clearly communicate the rationale and inspiration for their chosen design solutions. As stated earlier, over 81% of the candidates opted for the modification. While some candidates clearly outlined and communicated their thought process in arriving at the solution, others presented their final design without much elaboration. Overall, the standard of answering in relation to the design modification is reflected by the relatively low average mark of 11.3 out of 20 awarded for this section at Ordinary Level. This is a key area that needs to be further addressed in future design portfolios. Almost 25% of candidates at Ordinary Level omitted this required Output. Output 8 – Presentation of modification/concept design
In Output 8, candidates were required to produce a freehand graphic representation of the selected design modification or the proposed concept design. As in Output 3, some candidates produced excellent freehand presentations of their proposed solutions. However, many candidates were less successful in this section. There was evidence that some candidates traced or used drawing instruments to create the graphical representation and, therefore, did not achieve a high mark for the work produced. The average mark for this Output was 4.7 out of 10 marks (46.9%). Output 9 – Hardcopy outputs from SolidWorks
For this Output, candidates were required to produce orthographic and pictorial views from the CAD model of the modified or concept design. The average mark for this Output was 11 out of 20 marks (55%). While many candidates produced excellent drawings, the level of detail and presentation of some of this work was only fair. To achieve better results, greater attention should have been given to highlighting and detailing the design modifications and the inclusion of notes and main dimensions where appropriate. Almost 30% of candidates at Ordinary Level omitted this Output. 3.2 Higher Level 3.2.1. Assignment Brief
The Higher Level Student Assignment brief was as follows:
The number of candidates opting for Higher Level (at the assignment stage) was 71.6% as compared with 56% who sat Technical Drawing at Higher Level in previous years. Examiners were

Design and Communication Graphics 2009
Page 15
Grade A B C D E F NGNo. of Candidates 1052 1548 1200 449 74 27 6% of Candidates 24.2% 35.5% 27.5% 10.3% 1.7% 0.6% 0.1%
10.3%87.2% 2.5%
0.0%
5.0%
10.0%
15.0%
20.0%
25.0%
30.0%
35.0%
40.0%
A B C D E F NG
of the view that the theme of the Higher Level brief was more attractive to candidates and may have contributed in some way to the move from Ordinary Level to Higher Level. Candidates at Higher Level were required to present an A3 bound design portfolio with a maximum of 14 pages along with an individual CD containing the SolidWorks files and the portfolio in electronic format (PDF). The candidates were, again, given nine broad headings under which they were required to respond to the brief (See marking scheme). These are referred to as Outputs 1 to 9. In Part A of the assignment, candidates were required to explore existing docking stations and to communicate these designs through images, freehand sketches, CAD models, drawings and computer generated photorealistic images. 100 marks out of a total of 160 marks were awarded for this part of the assignment. In Part B, candidates were required to either make a design modification to an existing docking station or to develop a new concept design for such a device. The candidates were asked to graphically communicate their design ideas with the use of images, freehand sketches, parametric CAD models and computer generated drawings. This part of the assignment was awarded 60 marks out of a total of 160 marks. 3.2.2. Performance of Candidates The overall grade distribution by percentage for the Higher Level Student Assignment is outlined in Table 11: Table 11: Student Assignment Higher Level – Distribution of grades, 2009. Chart 11 displays this information graphically. Chart 11: Higher Level – Grade Distribution Overall the standard of answering was very high with candidates achieving an average overall mark of 72.9%. The performance of the candidates in response to each of the nine Outputs at Higher Level is detailed in the following section.

Design and Communication Graphics 2009
Page 16
Output Total Marks for Output
Average Mark with (%)
Rank order(by marks)
1 15 11.1 (70.4%) 52 15 11.1 (70.4%) 63 20 13.8 (68.9%) 74 25 18.8 (75.2%) 35 15 12.8 (85.6%) 26 10 9.2 (91.5%) 17 25 16.2 (64.6%) 88 10 6.0 (60.3%) 99 25 17.7 (70.7%) 4
Part
APa
rt B
DCG Student Assignment – Analysis at Higher level
3.2.3. Analysis of Candidate Performance
A detailed analysis of the candidate performance across all nine Outputs of the assignment is presented in Table 12. Table 12: Higher Level – Statistical Analysis on the answering of Outputs In general, Part A of the assignment was very well answered with over 96% of the candidates presenting the required material for all six Outputs. Candidates scored very well on Output 1, which involved the graphical exploration of the brief and presentation of existing artefacts. However, as was the case at Ordinary Level, there was a lack of evidence of primary research as candidates relied too heavily on the Internet as the main source of their information and ideas.
Output 2 was reasonably well answered. Many candidates made a good effort to compare and contrast the main physical design features of two selected docking stations. However, a significant number misinterpreted what was required and focused on the functionality of the two artefacts (See Ordinary Level). The general standard of freehand sketching was satisfactory in Outputs 2 and 3 with many students using a range of suitable media and various presentation techniques.
The SolidWorks models produced in Output 4 were generally of a high standard. The file management on the accompanying CD was, in general, excellent and in keeping with the recommended folder structure. This was notably better at Higher Level than at Ordinary Level. Where the file management was poor, problems arose with locating the relevant files and opening the SolidWorks assembly files.
In general Part B of the assignment (Outputs 7, 8 and 9) was less well answered than Part A. Approximately four out of five candidates opted for the design modification. Only 1.7% of the candidates did not make any attempt at Part B of the assignment. While many candidates produced exemplary work in Part A, some of the modifications in Part B were basic, sometimes very superficial and not developed using a theme or mood board. The graphical presentation of the modified artefact/concept design was generally good but often lacked sufficient detail. As a result, candidates fared least well on Output 8. In most cases the candidates produced a CAD model of their modified or concept design and produced hardcopy printouts of a reasonably high standard. Part A
In Part A candidates were required to carry out a design investigation of the physical form and features of existing docking stations for MP3 players. This entailed exploring the range of existing artefacts, developing an appreciation of their main design features and communicating one existing design through the use of images, freehand sketches and CAD models. All 4,356 candidates at

Design and Communication Graphics 2009
Page 17
Higher Level presented material in response Part A of the assignment. The responses to each of the six individual Outputs in this section are discussed below. Output 1 – Exploration of brief and presentation of existing artefacts in graphic format
This Output yielded an average mark of 11.1 out of 15 (70.4%). While many candidates fully explored the brief, some relied too heavily on the Internet as the only source of research. In some cases candidates presented a number of images and developed a historical timeline without fully exploring the range of existing artefacts. While the timeline had some relevance in responding to the specified brief, it needed to be supplemented with a structured investigation and graphical presentation of existing docking stations. In many ways Output 1 is the most important section of the assignment as it explores the design brief and lays the foundation for the rest of the work. Output 2 – Design Feature Comparison
This Output yielded an average mark of 11.1 out of 15 (70.4%). Many candidates made a good attempt at comparing and contrasting the main design features of two existing artefacts. The main dimensions were included in most cases and freehand sketches were used effectively to highlight the different physical design features and similarities of two selected artefacts. However, many candidates misinterpreted this output and compared and contrasted the functionality of both docking stations rather than the physical design features. Greater consideration should have been given to the physical features (physical size, shape, form, materials, colour/finish) rather than giving technical information about the chosen artefacts (speaker wattage, AM/FM radio capability, etc). Output 3 – Detailed graphical presentation to include a rendered freehand presentation quality
drawing in 3D format
This Output yielded an average mark of 13.8 out of 20 (68.9%). Candidates were required to produce a detailed graphical presentation which included a 3D rendered freehand presentation quality drawing. This output afforded the candidates the opportunity to demonstrate their freehand sketching and presentation skills. Many candidates produced excellent freehand drawings using a range of media and presentation techniques. However, a number of candidates used drawing instruments or traced their drawing and as such did not adhere to the requirements of this output, subsequently losing marks. In some cases the over use of vivid colour to enhance the sketches was counterproductive. Greater emphasis needs to be placed on the distinction between the ‘colouring’ and ‘rendering’ of freehand sketches. As was the case at Ordinary Level, some candidates scanned all of their sketches and presented only printouts. It should, again, be noted that original, non scanned, sketches should be presented for Outputs 3 and 8. This not only helps to support the authenticity of the work but provides candidates with an opportunity to use a wider variety of drawing media than would be possible with scanned images. Output 4 – SolidWorks Parts, Assembly and eDrawing files
This output was the second most popular section attempted (99.5%) and yielded an average mark of 18.8 out of 25 (75.2%). In general, the standard of modelling was very good and indicated that a lot of time had been spent developing key skills in the CAD software. Some candidates demonstrated excellent CAD skills and produced exceptionally detailed models. Most candidates produced models that contained a minimum of five parts as required. However, greater emphasis needs to be placed on design intent and economy of design. In some instances little attention was paid to defining sketches, using link values or equations or appropriate end conditions for various features. Also, in some cases there was no attempt made to rename the main features in the part files, in keeping with good design practice.
Most candidates presented their CAD files in the recommended folder structure and demonstrated excellent file management skills. In a small but significant number of cases one or more parts were

Design and Communication Graphics 2009
Page 18
0.0%
10.0%
20.0%
30.0%
40.0%
50.0%
60.0%
70.0%
80.0%
90.0%
Modification ConceptDesign
NotAttempted
not included in the appropriate folder on the accompanying CD. Also, in the case of a number of assemblies, the parts were not properly mated, just merely moved into position so that the parts appeared to be assembled. These candidates lost marks as a result of these instances. In other cases the required eDrawing of the CAD model was not presented on the CD. This situation varied from school to school. Output 5 – Hardcopy outputs from SolidWorks
98.5% of the candidates produced orthographic, rendered pictorial, exploded and detailed views of the CAD model. This output was generally well done with candidates producing excellent layouts containing a variety of appropriately scaled views, details and sections with accompanying notes. The most common error in this output was poor layout, due to inappropriate scale of the drawing views and the substandard dimensioning of some of the orthographic views. Output 6 – Photorealistic image
Almost all candidates produced the required photorealistic image of the CAD model. Many of these images were taken directly from SolidWorks and were accepted for this first year of the DCG Student Assignment. A significant number of candidates used PhotoWorks to produce high quality photorealistic images of the models. In future it is expected that candidates will use PhotoView 360, PhotoWorks or some other image manipulation software to create the required images. Part B
In Part B of the assignment candidates were asked to make a design modification to the selected existing artefact or to create a new concept design for an MP3 player docking station. This section was generally well attempted but not quite as well completed as Part A. The majority of the candidates (80.4%) at Higher Level opted for the design modification while 17.9% opted for the concept design. Only 1.7% of the candidates did not make any attempt at Part B of the assignment. Significantly, this compared with a much higher figure of 12.7% at Ordinary Level.
Chart 12 displays this information graphically. Chart 12: Higher Level Choices – Part B Candidates who opted for the concept design scored an average mark of 125.1 out of 160 (78.2%). In general, these candidates performed better than those that opted for the design modification who received an average mark of 115.8 out of 160 (72.4%). Candidates who attempted the concept design usually answered Output 7 more comprehensively than those carrying out a design

Design and Communication Graphics 2009
Page 19
modification. In many instances the design modifications were very simplistic and with inadequate justification and rationale presented. Output 7 – Graphical exploration of design solutions
Candidates were required to graphically communicate their observations and suggestions to either modify the existing design for the docking station chosen in Part A or to create a new concept design. The candidates were required to clearly communicate the rationale and inspiration for their design solutions. While some candidates clearly outlined and communicated the thought process in justifying their solution, others presented their final design without much elaboration. The candidates who opted for the concept design usually selected a theme or mood board to develop their ideas and achieved high marks. Some of the design modifications were very simplistic and often superficial. This output yielded the second lowest average mark at Higher Level as a result. Output 8 – Presentation of modification/concept design
In Output 8, candidates were required to produce a freehand graphic representation of the selected design modification or the proposed concept design. As in Output 3, some candidates produced excellent freehand presentations of their proposed solutions. Other candidates made a reasonable attempt on this section but many fell short of what was achieved in Output 3. There was evidence that some candidates used tracings or drawing instruments to create the graphical representation and, therefore, did not achieve a high mark for the work produced. Some sketches would have benefited from the inclusion of greater detail to indicate the chosen design modification made to the existing artefact. In a small number of cases there was no appreciable difference between the sketch produced for Output 3 and Output 8. Some candidates may have also spent excess time on their CAD model and did not perform as well on this Output as a result. This was the most frequently omitted Output, with approximately 12% not presenting any material. Candidates achieved an average mark of approximately 6 out of 10 marks (60.3%). Output 9 – Hardcopy outputs from SolidWorks
Candidates were required to produce orthographic and pictorial views from the CAD model of the modified or concept design. Candidates achieving an average mark of 17.7 marks out of 25 (70.7%) for this Output which was generally well responded to. While many candidates produced excellent drawings, others submitted work with less detail and with less emphasis on presentation. Greater attention should be given to highlighting and detailing the design modifications with the inclusion of notes and main dimensions where appropriate. In some cases it was difficult to determine the difference between Output 5 and Output 9 as candidates did not adequately highlight the modification(s) made to the existing artefact.
Design and Communication Graphics 2009
Page 20
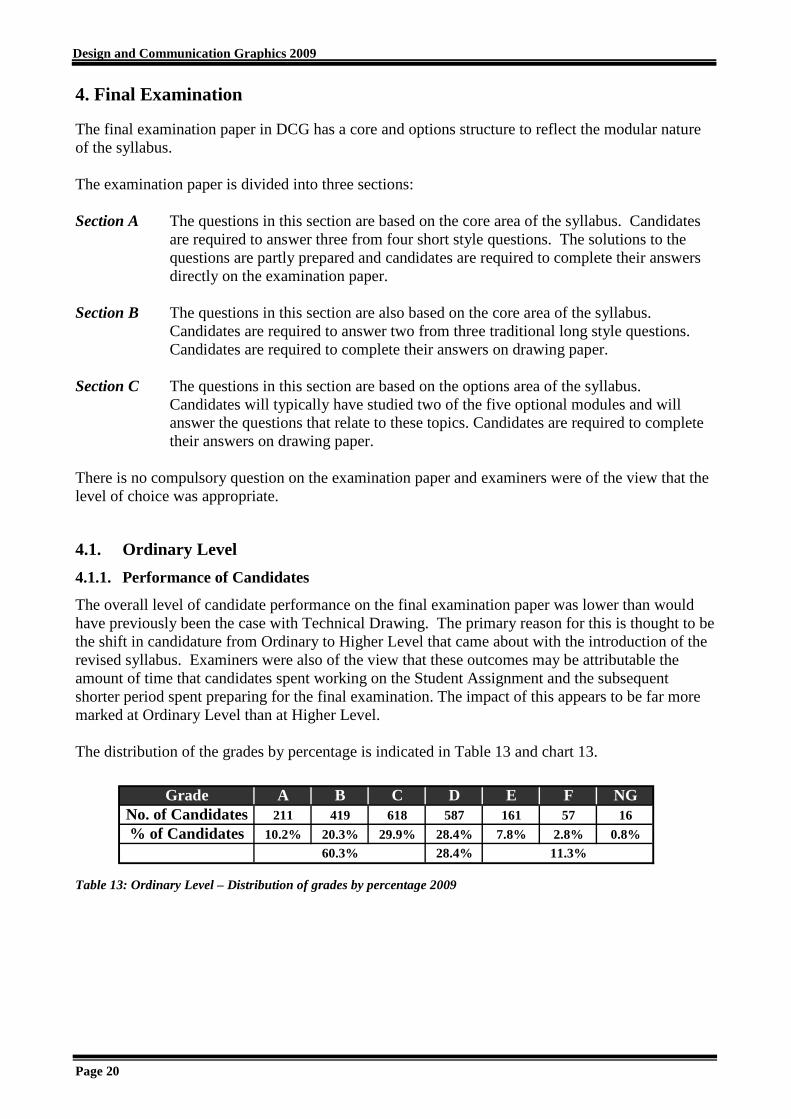
Grade A B C D E F NGNo. of Candidates 211 419 618 587 161 57 16% of Candidates 10.2% 20.3% 29.9% 28.4% 7.8% 2.8% 0.8%
28.4%60.3% 11.3%
4. Final Examination
The final examination paper in DCG has a core and options structure to reflect the modular nature of the syllabus. The examination paper is divided into three sections: Section A The questions in this section are based on the core area of the syllabus. Candidates
are required to answer three from four short style questions. The solutions to the questions are partly prepared and candidates are required to complete their answers directly on the examination paper.
Section B The questions in this section are also based on the core area of the syllabus.
Candidates are required to answer two from three traditional long style questions. Candidates are required to complete their answers on drawing paper.
Section C The questions in this section are based on the options area of the syllabus.
Candidates will typically have studied two of the five optional modules and will answer the questions that relate to these topics. Candidates are required to complete their answers on drawing paper.
There is no compulsory question on the examination paper and examiners were of the view that the level of choice was appropriate. 4.1. Ordinary Level
4.1.1. Performance of Candidates
The overall level of candidate performance on the final examination paper was lower than would have previously been the case with Technical Drawing. The primary reason for this is thought to be the shift in candidature from Ordinary to Higher Level that came about with the introduction of the revised syllabus. Examiners were also of the view that these outcomes may be attributable the amount of time that candidates spent working on the Student Assignment and the subsequent shorter period spent preparing for the final examination. The impact of this appears to be far more marked at Ordinary Level than at Higher Level. The distribution of the grades by percentage is indicated in Table 13 and chart 13.
Table 13: Ordinary Level – Distribution of grades by percentage 2009

Design and Communication Graphics 2009
Page 21
A B C D E F NG
0.0%
5.0%
10.0%
15.0%
20.0%
25.0%
30.0%
Question Topic(s) Attempt Rate
Rank order(by popularity)
Average Mark (%)
Rank order(by marks)
A-1 Conic Sections 79.7% 1 72.6% 1
A-2 Axonometric Projection 62.3% 3 43.0% 3
A-3 Oblique Planes/Truncations 72.9% 2 59.4% 2
A-4 Envelopments 48.1% 4 31.9% 4
B-1 Auxiliary Projections 88.1% 1 83.8% 1
B-2 Perspective 53.0% 3 52.0% 3
B-3 Interpenetration of Solids 58.1% 2 69.2% 2
C-1 Geologic Geometry 55.2% 2 68.6% 2
C-2 Structural Forms 29.5% 3 59.9% 3
C-3 Surface Geometry 65.7% 1 71.3% 1
C-4 Dynamic Mechanisms 10.3% 5 53.4% 4
C-5 Assemblies 19.4% 4 48.1% 5
DCG Terminal Examination – Analysis at Ordinary level
Sect
ion
ASe
ctio
n B
Sect
ion
C
Chart 13: Ordinary Level – Grade Distribution Question Choice and Average Marks
As always some questions proved far more popular than others. However, there was a reasonable level of consistency between the questions in terms of average marks attained. Table 14 outlines the popularity of questions in each of the three sections and also shows the average mark for each question. Table 14: Ordinary Level – Attempt rates and average marks

Design and Communication Graphics 2009
Page 22
A-1A-2
A-3A-4
0.0%
10.0%
20.0%
30.0%
40.0%
50.0%
60.0%
70.0%
80.0%
Question
A-1A-2
A-3A-4
0.0
2.0
4.0
6.0
8.0
10.0
12.0
14.0
16.0
Question
Section A Almost 5% of the candidates did not attempt Section A at all and this eventually proved to be a significant factor in the relatively high failure rate at Ordinary Level. To maximise marks, it is imperative that candidates attempt all sections of the paper and answer the required number of questions within each section. More classroom practice for Ordinary Level candidates in solving pre-set up questions would be beneficial in this regard. Over 8% of candidates answered only one question in this section, while 87% answered at least two questions. The majority of candidates (65%) answered the required three questions in Section A while it is also noteworthy that 17% of candidates answered all four questions. Question A-1, the question which involved drawing a parabolic satellite dish, was the most popular followed by Questions A-3 (Oblique Plane) and Question A-2 (Axonometric Projection). Charts 14 and 15 show the question popularity and average marks for Section A (The maximum mark for each question was 20). Chart 14: Section A – Question popularity Chart 15: Section A –Average marks

Design and Communication Graphics 2009
Page 23
B-1B-2
B-3
0.0%
10.0%
20.0%
30.0%
40.0%
50.0%
60.0%
70.0%
80.0%
90.0%
Question
B-1B-2
B-3
0.0
5.0
10.0
15.0
20.0
25.0
30.0
35.0
40.0
Question
Section B
The popularity of Question B-1, which involved drawing the projections and an Auxiliary Elevation of a wall and pier, far exceeded that of the others in this section. This was followed by Question B-3 involving the Interpenetrations of Solids. The question on Perspective Projection was not popular and it is noteworthy that this is a new topic in the core area of study. It is essential that candidates study the core in its entirety and not just those areas that were on Paper 1 in the old Technical Drawing course.
Given the relatively poor attempt rate on Section A, it is reassuring that the vast majority of candidates (95%) attempted the required two questions in Section B and that 99% attempted at least one question.
Charts 16 and 17 show the question popularity and average marks for Section B (The maximum mark for each question was 45). Chart 16: Section B – Question popularity Chart 17: Section B –Average marks

Design and Communication Graphics 2009
Page 24
C-1C-2
C-3C-4
C-5
0.0
5.0
10.0
15.0
20.0
25.0
30.0
35.0
Question
C-1C-2
C-3C-4
C-5
0.0%
10.0%
20.0%
30.0%
40.0%
50.0%
60.0%
70.0%
Question
Section C
There was a wide variation in question popularity in Section C. The variation largely followed the traditional division between Engineering Applications and Building Applications that was part of the old Technical Drawing programme. Question C-3, involving Surface Developments, proved to be the most popular in this section, followed by Question C-1 (Geologic Geometry). Many candidates who opted for Question C-4 (Cams and Linkages) also attempted C-5 (Assemblies), again reflecting the traditional Paper 2A and 2B structure.
The vast majority of candidates (79%) attempted the required two questions in this section. 16% attempted only one question while a surprising 6.5% attempted three or more questions. 5% of candidates did not attempt Section C at all and, again, this was a significant factor in the eventual failure rate.
Charts 18 and 19 show the question popularity and average marks for Section C (The maximum mark for each question was 45). Chart 18: Section C – Question popularity Chart 19: Section C –Average marks

Design and Communication Graphics 2009
Page 25
0.0%
5.0%
10.0%
15.0%
20.0%
25.0%
30.0%
35.0%
40.0%
45.0%
% o
f Can
dida
tes
A B C D E F NG
4.1.2 Analysis of Candidate Performance Section A
Question A-1: Conic Sections
This was the most popular question in Section A with an uptake of 79.7%. The given 3D graphic combined with the theme may account for this. The average mark was 72.6%. Chart 20 outlines how the candidates performed on this individual question. Chart 20: Ordinary Level – Question A-1 – Candidate Performance. The question was generally well answered and it yielded the highest average mark in the section. Some confusion in relation to the required construction of the parabola was evident in some instances. The errors which did occur are summarised below.
• An unequal number of divisions of the length and width of the rectangle resulted in a distorted curve. In some instances candidates drew little more than a rectangular grid by way of construction.
• The omission of the radiating lines or their misuse was noted by some examiners.
• Some candidates inverted the curve. These candidates set up the question correctly but placed the vertex on the opposite edge of the rectangle.
• In a few of the least successful attempts, candidates just drew an arbitrary freehand curve without construction.
• The quality of some of the freehand curves could have been enhanced with a French curve or Flexicurve.
Question A-2 : Axonometric Projection
This question was answered by 62.3% of candidates and the average mark was 43%. The question was perfectly completed by a small percentage of the candidates. This is one of the new topics on the syllabus. There appeared to be some confusion in relation to the concept of full size isometric drawing and axonometric projection. The question was ranked third both in terms of performance and popularity. Chart 21 outlines how the candidates performed on this individual question.

Design and Communication Graphics 2009
Page 26
0.0%
5.0%
10.0%
15.0%
20.0%
25.0%
30.0%
35.0%%
of C
andi
date
s
A B C D E F NG
0.0%
5.0%
10.0%
15.0%
20.0%
25.0%
30.0%
35.0%
% o
f Can
dida
tes
A B C D E F NG
Chart 21: Ordinary Level – Question A-2 – Candidate Performance. The following common errors were frequently highlighted by examiners.
• The required axes were omitted in plan
• The plan was incorrectly orientated (Most commonly with the long edge horizontal.) Others used the correct axes but reversed the orientation of the long and short edges.
• Projections were from the elevation only. This resulted in an inaccurate drawing because the full widths were usually applied to these projection lines.
Question A-3: Oblique Plane
This was amongst the more popular questions in Section A being answered by 72.9% of candidates. Answering was frequently enlightened, particularly in Part (a) of the question. Part (b), in contrast, proved more challenging. The average mark was 59.4%. Chart 22 outlines how the candidates performed on this individual question. Chart 22: Ordinary Level – Question A-3 – Candidate Performance.

Design and Communication Graphics 2009
Page 27
0.0%
5.0%
10.0%
15.0%
20.0%
25.0%
30.0%
35.0%
40.0%
45.0%
% o
f Can
dida
tes
A B C D E F NG
The oblique plane requires well developed powers of spatial reasoning to avoid misinterpretation. Some candidates struggled a little as a result and often resorted to a mechanical approach with largely unsuccessful outcomes. The main issues surrounding the question are summarised as follows:
• Many candidates joined the tips of the given lines on the elevation of the pyramid.
• Some candidates drew projection lines from the plan to intercept the incorrect lines on the pyramid in elevation.
• Joining the points in elevation incorrectly was also noted by some examiners.
• The performance in relation to drawing the true shape was mixed. The majority of the candidates struggled in this part with many omitting it.
• Redrawing the cut surface in plan, mirrored on the horizontal trace was offered as a solution by some candidates.
• Invariably either a true length or a true width was missing in many attempts.
Question A-4: Envelopments
This was the least popular question in Section A – being attempted by only 48.1% of candidates. Many also underperformed on the question with the average mark of just 31.9%. Chart 23 outlines how the candidates performed on this question. Chart 23: Ordinary Level – Question A-4 – Candidate Performance. The underperformance on this question may have been partly due to lack of perseverance. In some instances candidates attempted this as an extra question so time constraints may have been a factor. The standard of answering was mixed with grade distribution generally at the lower end. Despite the fact that the question was both practical in terms of application and considered by examiners to be attractive in presentation, the inherent simplicity of the question was not recognised by many. The comments of the examiners are summarised as follows:
• The question was frequently abandoned, often where candidates appeared to be making progress.

Design and Communication Graphics 2009
Page 28
0.0%
5.0%
10.0%
15.0%
20.0%
25.0%
30.0%
35.0%
40.0%
45.0%
50.0%
% o
f Can
dida
tes
A B C D E F NG
• The stepping out of the circumference of the cylinder on the label was omitted or inaccurate in many attempts.
• Candidates omitted to establish the end point of the label on the circumference of the cylinder in plan. This led to inaccuracies in elevation.
• The curved portion of the label in the wrapped position was sometimes misrepresented as a line.
• Some candidates seemed to have had an idea of the concepts but appeared to lack the skills to execute an accurate solution.
Section B
Question B-1: Auxiliary Projections (Entrance Wall and Pier)
This was the most popular question on the examination paper. It was attempted by 88.1% of the cohort and the average mark was an impressive 83.8%. It was equally popular with candidates across all grades. It is encouraging to see this topic well answered as orthographic projection is the building block of descriptive geometry. The presentation of the question and the 3D graphic may also have contributed to both its popularity and success rate. The particular theme of the question was one that all candidates could readily identify. Chart 24 outlines how the candidates performed on this question. Chart 24: Ordinary Level – Question B-1 – Candidate Performance. Part (a) Plan and Elevation
The question required the candidates to draw the plan and elevation of the entrance to a house. The plan was correctly drawn by almost every candidate. Occasional inaccuracies were noted but none related to comprehension. The elevation required a direct projection from the plan. This was also very well answered. A small number of candidates started with the elevation and had some difficulty in establishing its overall width in the absence of the plan as a reference. This Part was, however, completed to near perfection by almost every candidate.

Design and Communication Graphics 2009
Page 29
0.0%
5.0%
10.0%
15.0%
20.0%
25.0%
30.0%
35.0%
40.0%
45.0%
% o
f Can
dida
tes
A B C D E F NG
Part (b) Auxiliary Elevation
This Part required an auxiliary elevation of the structure in which the true shape of surface A of the wall could be seen. It was attempted by over 80% of the candidates. The majority gained close to maximum marks. The few issues highlighted below relate more to detail than comprehension.
• Approximately 5% of the cohort used the incorrect scale. This generally resulted in spacing problems on the sheet.
• Occasionally an incorrect angle was used in plan. This resulted in surface A being drawn at 30 or 45 degrees. This had subsequently affected the drawing of the auxiliary elevation.
• Misreading the question may account for one in ten candidates drawing surface A only on the auxiliary elevation.
• An incorrect viewing direction in a few instances resulted in some distortion of the auxiliary elevation.
Question B-2: Perspective Projection (Child’s playhouse) This was the least popular question in Section B – being attempted by 53% of candidates. The standard of answering was mixed with an average mark of 52%. Some outstanding efforts were offset by a few attempts which were abandoned at an early stage. Those who displayed perseverance were rewarded for their efforts. Chart 25 outlines how the candidates performed on this question.
Chart 25: Ordinary Level – Question B-2 – Candidate Performance. Most candidates drew the given plan and set up the picture plane and vanishing points correctly. The attempts at drawing the elevation of these key features were less successful. The edge of the tunnel touched the picture plane at point A and this greatly simplified the solution. The height line for the side walls was generally established correctly. Some confusion was evident in the application of the height line for the ridge of the tunnel. The attempts at the main structure varied in standard. Candidates who incorrectly drew the base lines of the structure struggled thereafter. The set up and application of the two required height

Design and Communication Graphics 2009
Page 30
0.0%
5.0%
10.0%
15.0%
20.0%
25.0%
30.0%
35.0%
40.0%
% o
f Can
dida
tes
A B C D E F NG
lines were a source of difficulty for many. Overall, the main errors were a combination of the following:
• A minority of candidates failed to set up the vanishing points correctly.
• The picture plane was invariably represented as a horizontal line in plan rather than perpendicular to the centre of vision.
• The setup and application of height lines proved a challenge for some of the candidates. The height line for the window was frequently omitted.
• Drawing the bottom edges of both parts of the structure correctly appeared to be the key to success. One in three candidates had problems in this area and thereafter struggled to complete the question.
Question B-3: Interpenetration of Solids (Child’s Toy)
This question was second in terms of popularity and performance in the section. It was attempted by 58.1% of candidates and the average mark was 69.2%. The question had a balanced grade spread with the majority falling within the ABC range. Chart 26 outlines how the candidates performed on this question. Chart 26: Ordinary Level – Question B-3 – Candidate Performance. Plan, Elevation, End Elevation
The outline of the main solid was accurately represented by most candidates. An occasional mistake in a length or width had little impact on the overall solution. The construction of the equilateral triangular prism posed a few additional problems. It was represented as an isosceles triangle in cross section by a minority. The required end elevation was successfully completed by most candidates. It was omitted by one in five candidates with a consequential loss of valuable marks. The omission had subsequent implications for the completion of the right hand side of the elevation.
Interpenetration
The carefully chosen construction of the question meant that all of the points of interpenetration on the left hand side fell on a single surface. The majority projected from the intersection points in

Design and Communication Graphics 2009
Page 31
0.0%
5.0%
10.0%
15.0%
20.0%
25.0%
30.0%
% o
f Can
dida
tes
A B C D E F NG
elevation and established the three correct points in plan. While the two sloping lines were routinely drawn correctly, the apparently more straight forward line on the under side of the interpenetration was often omitted. The given 3D graphic offered an insight to the solution on the left hand side.
The intersection line on the right hand side proved somewhat more elusive. Candidates who omitted the end elevation were unable to establish the point of intersection on the vertical surface of the main solid. Many appeared to be aware of its presence and selected an arbitrary point in the vicinity. The point on the base of the prism was located by direct projection from the plan by approximately 50% of the cohort. One in four candidates made no attempt to complete the right hand side. The orientation of the 3D graphic was, by design, of little assistance in guiding the candidates in this part of the question. The common mistakes were generally a combination of the following:
• The omission of the end elevation resulted in problems in establishing the altitude of the triangular prism and the completion of the right hand side of the interpenetration.
• Hidden and visible lines were interchanged.
• Points of intersection were established but the lines joining them were omitted.
Section C
Question C-1: Geologic Geometry
This question was attempted by 55.2% of the cohort and yielded an average mark of 68.6%. It was equally popular with all candidates irrespective of ability. It combined a high ABC grade ratio with a very low failure rate. Chart 27 outlines how the candidates performed on this question. Chart 27: Ordinary Level – Question C-1 – Candidate Performance.
Part (a) Profile
Most candidates achieved close to maximum marks in this Part of the question. Projections from the contours to intersect the correct heights on the vertical section were usually drawn correctly. The curve was inverted in a small number of instances. Candidates having established the correct points routinely drew in the freehand curve representing the profile.

Design and Communication Graphics 2009
Page 32
0.0%
5.0%
10.0%
15.0%
20.0%
25.0%
30.0%
% o
f Can
dida
tes
A B C D E F NG
Part (b) Observation Tower
The attempts at this Part were less successful. Approximately one in three candidates who successfully completed Part (a) did not attempt this Part. Many who did were rewarded with close to maximum marks. The few mistakes which occurred appeared to be due to either misreading or misunderstanding the question. The main mistakes in Parts (a) and (b) were as follows:
• The incorrect heights were used for drawing the required profile.
• A few candidates attempted to draw a profile projected from the centre line CD of the roadway.
• The line from point B on the profile was not drawn tangential to the profile curve.
• The simple requirement of indicating the tower height was frequently overlooked.
Part (c) Earthworks for Roadway
This was answered very well overall. It was, however, not attempted by approximately one in five candidates. Those candidates who did attempt it appeared to have grasped the concept, though a few faltered in relation to the detail. The correct heights were stepped away from the edge of the roadway. A minority assumed the level of the edge of the roadway was set at zero. These candidates had a poor knowledge of the geometrical concepts involved. Others attempted to draw a profile similar to Part (a) of the question. The most commonly encountered mistakes were as follows:
• The horizontal lines measured away from the roadway intercepted the incorrect contour.
• Confusion between Parts (a) and (c) was highlighted by examiners in a few instances.
• A few attempts at drawing a mirror image of the curve on the southern part of the road displayed an insufficient knowledge of the topic.
Question C-2: Structural Forms
This question was attempted by just over one in four candidates (29.5%). It was third in terms of popularity in Section C. The average mark was 59.9%. Chart 28 outlines how the candidates performed on this question. Chart 28: Ordinary Level – Question C-2 – Candidate Performance.

Design and Communication Graphics 2009
Page 33
The performance was balanced, with the results peaking at the C grade. Marginally over 15% of the candidates achieved an A grade in the question. This was matched by those awarded less than a grade D. Part (a) Elevation and Plan
This Part of the question was generally well answered. The outline elevation and plan were accurately represented by most candidates. A few candidates used the wrong scale and had difficulty fitting the solution on the drawing sheet.
The elements were drawn correctly by all but a few candidates. Unequal or inaccurate divisions of the outline led to some distortion in the structure. A common feature of some of the less successful attempts resulted in no division of the shorter lines in elevation and plan. The elements were instead drawn from the correct points on the long edge to converge at the base of the elevation and front of the plan. End Elevation
Just under half of the cohort successfully completed this Part of the question. In a few instances the key points were accurately located but joined in the incorrect configuration. Approximately one in three candidates did not attempt the end elevation.
The elements were omitted by many candidates who had accurately represented the outline. The associated freehand curves on the three views were omitted by the majority of the candidates. The examiners highlighted a number of areas where candidates lost marks in Part (a) of the question. These included:
• Errors associated with the elements
• The omission of the end elevation
• The freehand curves were omitted.
Part (b) Triangular Entrance
The entrance was represented as it appeared on the examination paper by most candidates. The accuracy was regularly compromised by omissions or mistakes associated with the end elevation. The precise point of intersection point between the ridge of the entrance and the main structure was not accurately found by over 80% of the cohort. The majority of candidates correctly completed the remaining projections of the outline. Question C-3: Surface Geometry
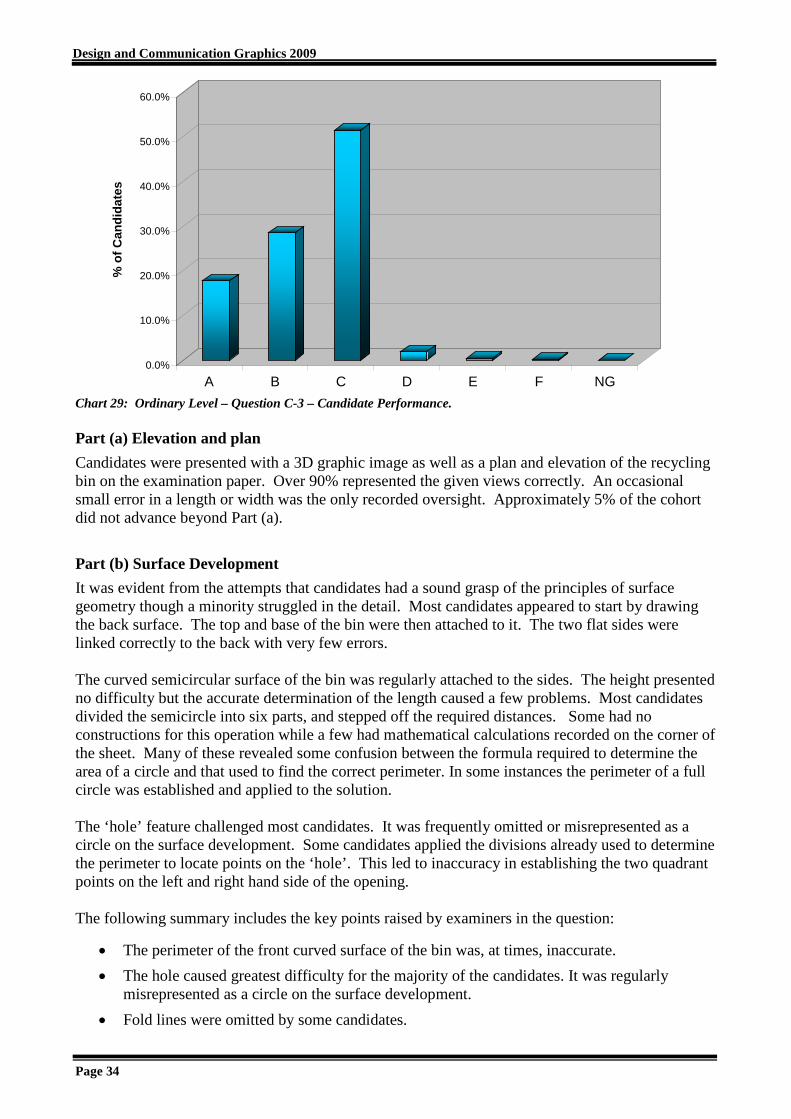
This proved to be the most popular question in Section C being attempted by 65.7% of candidates across all levels of achievement. The issue of recycling has received a lot of media coverage in recent years and this probably contributed to the question’s appeal. The topic was also studied at Junior Certificate level. Chart 29 outlines how the candidates performed on this question.
There was a corresponding high success rate in the question. It had the highest average mark in Section C and the second highest average mark overall on the examination paper at 71.3%. Chart 29 outlines how the candidates performed on this question.
Design and Communication Graphics 2009
Page 34
0.0%
10.0%
20.0%
30.0%
40.0%
50.0%
60.0%
% o
f Can
dida
tes
A B C D E F NG
Chart 29: Ordinary Level – Question C-3 – Candidate Performance. Part (a) Elevation and plan
Candidates were presented with a 3D graphic image as well as a plan and elevation of the recycling bin on the examination paper. Over 90% represented the given views correctly. An occasional small error in a length or width was the only recorded oversight. Approximately 5% of the cohort did not advance beyond Part (a).
Part (b) Surface Development
It was evident from the attempts that candidates had a sound grasp of the principles of surface geometry though a minority struggled in the detail. Most candidates appeared to start by drawing the back surface. The top and base of the bin were then attached to it. The two flat sides were linked correctly to the back with very few errors. The curved semicircular surface of the bin was regularly attached to the sides. The height presented no difficulty but the accurate determination of the length caused a few problems. Most candidates divided the semicircle into six parts, and stepped off the required distances. Some had no constructions for this operation while a few had mathematical calculations recorded on the corner of the sheet. Many of these revealed some confusion between the formula required to determine the area of a circle and that used to find the correct perimeter. In some instances the perimeter of a full circle was established and applied to the solution. The ‘hole’ feature challenged most candidates. It was frequently omitted or misrepresented as a circle on the surface development. Some candidates applied the divisions already used to determine the perimeter to locate points on the ‘hole’. This led to inaccuracy in establishing the two quadrant points on the left and right hand side of the opening. The following summary includes the key points raised by examiners in the question:
• The perimeter of the front curved surface of the bin was, at times, inaccurate.
• The hole caused greatest difficulty for the majority of the candidates. It was regularly misrepresented as a circle on the surface development.
• Fold lines were omitted by some candidates.

Design and Communication Graphics 2009
Page 35
0.0%
5.0%
10.0%
15.0%
20.0%
25.0%
30.0%
% o
f Can
dida
tes
A B C D E F NG
Part (c) Size of Rectangular Sheet
The required rectangle enclosing the surface development was drawn by approximately 75% of the candidates. The dimensions were generally included, though in approximately 50% of the solutions the scale factor was overlooked. Question C-4 : Dynamic Mechanisms
This was the least popular question on the examination paper being attempted by 10.3% of candidates. Engineering concepts have been traditionally less popular with candidates. This may gradually change with both the Engineering and Building Application topics being included in Section C of the one examination paper. The performance on the question was fair. The average mark was 53.4%. It would have been higher but many candidates abandoned the question having completed Part (a) of the solution. Chart 30 outlines how the candidates performed on this question.
Chart 30: Ordinary Level – Question C-4 – Candidate Performance. Part (a) Displacement Diagram
The question was the subject of some misinterpretation. This appeared to be as a result of misreading the question. Many candidates proceeded to draw the outline of the cam as well as the displacement diagram despite being specifically told that this was not required. These candidates lost a lot of time and made little progress in the second part of the question as a result. It is vital that candidates read every question carefully and not assume that they will be similar from year to year. The fundamentals of setting up a displacement were evident. Some candidates failed to extract a few key dimensions from the given view of the cam. The 40 mm gap between the follower and the centre ‘O’ of the cam was frequently included in the height of the displacement diagram. Many candidates mixed up the construction for ‘Rise and Fall with Uniform Velocity’ with that required for ‘Simple Harmonic Motion’. The majority of the candidates stepped off 12 equal widths on the displacement diagram and established the follower positions correctly. Some candidates, who displayed knowledge of the construction for the ‘Uniform Acceleration and Retardation’, made minor errors in the construction

Design and Communication Graphics 2009
Page 36
and lost some marks as a result. This was sometimes as a result of having an unequal number of divisions on the two sides of the rectangle required for the construction of the parabolic curve. The radiating lines were frequently drawn from the wrong point. The lines representing the ‘Uniform Velocity’ and ‘Dwell’ sections of the diagram were correct in most instances. The ‘Simple Harmonic Motion’ construction was generally correct. The number of divisions on the construction semicircle occasionally failed to match that of the diagram resulting in difficulties in establishing the correct points. The main problems were usually a combination of the following:
• The constructions at the beginning and end of the solution were reversed.
• The height of the displacement was incorrect due to an incorrect starting point.
• Poor quality freehand curves were a regular feature of the less successful attempts.
Part (b) Link Mechanism
This was a very straightforward question. Many candidates, however, made very little progress with the solution. It was frequently not attempted. Some candidates just set up the four main points on the linkage. Those who persisted were well rewarded and there were a small number of almost perfect solutions. Drawing the circle about ‘O’ and dividing it was the key to solving the question. Candidates who got to this stage had little difficulty in completing the question. A few candidates failed to draw the required lines from the circumference of the circle through the pivot point P and struggled thereafter. The main issues highlighted were as follows:
• This Part was not attempted or not progressed beyond setting up the line diagram.
• Some candidates, who apparently misread the question, attempted to directly link Parts (a) and (b) of the question into a single solution.
• Candidates who drew the full outline of the link mechanism lost some valuable time as this was not required.
Question C-5: Assemblies
The uptake for this question was the second lowest in Section (c) with less than one in five candidates (19.4%) opting for it. The performance in the question was fair overall. Candidates on average were awarded just under half marks (48.1%) for the question. This represents the lowest average mark in Section C. Examiners were of the view that the attractive nature of the question may have tempted some candidates into attempting a topic for which they were not fully prepared. Chart 31, on the next page, outlines how the candidates performed on this question. Most candidates correctly assembled the components relative to each other. In many of the attempts the bracket was not represented in the fully extended position as required. More than 75% the cohort drew an elevation rather than the required sectional view. This fundamental oversight contributed to the loss of valuable marks. The wall anchor was drawn to the given sizes by most candidates. A front view rather than a side view was shown in approximately one in every three attempts. However, the link arm was generally orientated correctly. The TV plate was also incorrectly orientated by many candidates. This part was not visible on the 3D graphic. The required construction for the hexagon was omitted by all but a few A grade candidates.

Design and Communication Graphics 2009
Page 37
0.0%
5.0%
10.0%
15.0%
20.0%
25.0%
30.0%
35.0%
% o
f Can
dida
tes
A B C D E F NG
Chart 31: Ordinary Level – Question C-5 – Candidate Performance. The nuts, bolts and washers were placed correctly relative to the other components by almost every candidate. However, the curves on the heads of the nuts and bolts were frequently omitted. In addition to the points already highlighted, a failure to adhere to standard engineering drawing conventions was commonplace. This was most notable in relation to hatching, centrelines, and the correct representation of nuts, bolts and washers. The points highlighted above may be summarised as follows:
• One or more of the parts was orientated incorrectly.
• A front elevation rather than a sectional elevation was shown.
• The required construction relating to the hexagon on the TV plate was omitted.
Part (b) Distance in closed position
This Part was not attempted by approximately 80% of the candidates. This may be partly due to time constraints. Many of those who did attempt it, drew the link arm parallel to the wall rather than in contact with it as required.

Design and Communication Graphics 2009
Page 38
Grade A B C D E F NGNo. of Candidates 597 980 1057 1018 356 90 6% of Candidates 14.5% 23.9% 25.8% 24.8% 8.7% 2.2% 0.1%
24.8%64.2% 11.0%
A B C D E F NG
0.0%
5.0%
10.0%
15.0%
20.0%
25.0%
30.0%
4.2. Higher Level
4.2.1. Performance of Candidates
The wide-ranging content of the examination paper afforded an opportunity, to candidates of varying abilities, to attempt their chosen questions and obtain a wide range of marks. The nature of the paper and the individual question styles require a deep understanding of the basic principles and concepts involved in the subject and are therefore not amenable to rote learning. The inclusion of 3D graphics in each question was considered by examiners to be beneficial to all candidates as an aid to understand and visualise both the question being asked as well as the answer required. By and large, the majority of candidates applied themselves admirably to the task at hand, just as had happened in previous years in the case of Technical Drawing. The results were very satisfactory with 64.2% obtaining a grade C or higher and 14.5% receiving a grade A. A total of 11% of candidates did not achieve a D grade in this component. The distribution of the grades by percentage is indicated in Table 15 and chart 32. Table 15: Higher Level – Distribution of grades by percentage 2009 Chart 32: Higher Level – Grade Distribution The overall standard of answering varied between examination centres. Some excellent work was presented as is evidenced by the fact that 14.5% achieved a grade A. These candidates produced excellent answers and displayed an ability to solve problems in two and three-dimensions using appropriate geometric principles and theorems. The solutions presented carried evidence of a well structured and integrated analysis of topics as well as a detailed coverage of the course in its entirety.

Design and Communication Graphics 2009
Page 39
Question Topic(s) Attempt Rate
Rank order(by popularity)
Average Mark (%)
Rank order(by marks)
A-1 Conic Sections 45.1% 4 41.0% 4
A-2 Perspective Projection 84.4% 2 64.7% 1
A-3 Axonometric Projection 79.9% 3 63.6% 2
A-4 Solids in Contact & Tangent Planes 92.4% 1 59.3% 3
B-1 The Oblique plane 20.3% 3 65.3% 2
B-2 Coordinate Geometry 95.5% 1 72.3% 1
B-3 Interpenetration of Solids 85.2% 2 63.0% 3
C-1 Geologic Geometry 67.8% 1 65.9% 2
C-2 Structural Forms 47.3% 2 67.9% 1
C-3 Surface Geometry 32.4% 3 54.2% 5
C-4 Dynamic Mechanisms 31.4% 4 65.6% 3
C-5 Assemblies 19.4% 5 56.5% 4
DCG Terminal Examination – Analysis at Ordinary level
Sect
ion
ASe
ctio
n B
Sect
ion
C
As in previous years, some questions were more popular than others. The same choice of questions often prevailed throughout whole examination centres. Likewise certain questions were completely avoided by entire centres. It still appears as if the majority of candidates pre-select their questions prior to the examination and do not carry out a comprehensive revision of the whole syllabus to allow them to select the most accessible questions on the day. Very few candidates attempted more than seven questions although in a few cases individuals attempted the same question more than once.
A detailed analysis of the attempt rates and candidate performance across all questions on the examination paper is presented in table 16 below. Table 16: Higher Level – Attempt rates and average marks Section A
The vast majority of candidates attempted the required three questions (from four) in this section. The examiners noted that the overall standard of answering was good. Most candidates had little or no difficulty with the format and layout of the questions in this section. While each question in the section had a comparable level of difficulty, Question A-4 (Solids in Contact and Tangent Planes) was the most popular with an attempt rate of over 92%. Questions A-2 and A-3 had a high attempt rate of 84.4% and 79.9% respectively. However, only 45.1% of the candidates attempted Question A-1 (Conic Sections). This topic had a low attempt rate in Technical Drawing (Paper 1) in the past and, unfortunately, the trend has continued in the assessment of the revised syllabus. The disappointing response rate to Question A-1 suggests that not all candidates had engaged fully with this area of study. Only a very small number of candidates (less than 1%) did not attempt any question in Section A. It was noteworthy that 22% of candidates attempted all four questions in Section A.

Design and Communication Graphics 2009
Page 40
A-1A-2
A-3A-4
0.0%
10.0%
20.0%
30.0%
40.0%
50.0%
60.0%
70.0%
80.0%
90.0%
100.0%
Question
A-1A-2
A-3A-4
0.0
2.0
4.0
6.0
8.0
10.0
12.0
14.0
Question
Charts 33 and 34 show the question popularity and average marks for Section A (The maximum mark for each question was 20).
Chart 33: Section A – Question popularity Chart 34: Section A –Average marks Section B
The vast majority of candidates attempted the required two out of three questions in this section. Less than 3% of candidates attempted fewer than the required number. 95.5% of the candidates attempted Question B-2 (Coordinate Geometry) making it the most popular question in this section. This question also had the highest overall attempt rate of the 12 questions on the examination paper. The popularity of questions on this topic has obviously continued from the previous Technical Drawing syllabus. Question B-3 also had a very high attempt rate of 85.5% making it the third most popular question overall. Only one in five candidates attempted Question B-1 making it the least popular question in Section B and the second least popular question overall. Examiners expressed surprise at the less than average response rate to Question B-1 given that the question assessed the basic principles of the Oblique Plane. Perhaps the inclusion of the parabolic curve militated against a higher attempt rate. As already stated, Conic Sections had a very low attempt rate on this examination and in previous Technical Drawing examinations at Higher Level. This needs to be addressed so that candidates can benefit from questions such as this. Charts 35 and 36

Design and Communication Graphics 2009
Page 41
B-1B-2
B-3
0.0%
10.0%
20.0%
30.0%
40.0%
50.0%
60.0%
70.0%
80.0%
90.0%
100.0%
Question
B-1B-2
B-3
26.0
27.0
28.0
29.0
30.0
31.0
32.0
33.0
Question
show the question popularity and average marks for Section B (The maximum mark for the questions was 45). Chart 35: Section B – Question popularity Chart 36: Section B –Average marks Section C
The vast majority of candidates attempted two questions as required in this Applied Graphics Section. 67.8% of candidates attempted Question C-1 (Geologic Geometry) making it the most popular question in this Section. The attempt rate for Questions C-2 to C-5 ranged from 47.3% to 19.4% respectively. It was noted that three out the four of the best answered questions came from Section C. Question B-2 (Coordinate Geometry) was ranked the best answered question followed by Question C-2 (Structural Forms), Question C-1 (Geologic Geometry) and Question C-4 (Dynamic Mechanisms). This higher standard of answering could be expected on Section C as the

Design and Communication Graphics 2009
Page 42
C-1C-2
C-3C-4
C-5
0.0%
10.0%
20.0%
30.0%
40.0%
50.0%
60.0%
70.0%
Question
C-1C-2
C-3C-4
C-5
0.0
5.0
10.0
15.0
20.0
25.0
30.0
35.0
Question
modular structure of the syllabus ensures that there will always be a question from each of the five areas on the examination paper. Only 19.2% of the candidates attempted Question C-5 which related to Assemblies. This uptake, by one in five candidates, directly reflects the Engineering Applications and Building Applications structure that was associated with Technical Drawing in the past.
Charts 35 and 36 show the question popularity and average marks for Section B (The maximum mark for each question was 45). Chart 35: Section C – Question popularity Chart 36: Section C –Average marks General Standard of Answering
In the vast majority of cases, the standard of answering was very good. Overall, it seemed to vary between examination centres with some excellent answering in some instances. This is reflected in the high percentage of candidates (14.5%) who achieved an A grade in this component. These candidates produced accurate and neat drawings and demonstrated a capacity to solve problems in two and three-dimensions, utilising appropriate geometric principles and theorems. The solutions

Design and Communication Graphics 2009
Page 43
presented showed evidence of a comprehensive coverage of the syllabus, combined with careful and thorough revision practices. Most candidates attempt the required seven questions. Some answered questions in excess of the requirement. Some of the attempts to individual questions were exceptionally good and obtained full marks. There were many candidates who achieved high marks in two or three questions but offered little more than token solutions to the remainder. In relation to the 11% of candidates who did not obtain a minimum D grade in this examination component, many did not complete the requisite number of questions.
The inability to answer relatively straightforward elements of questions displayed a fundamental lack of knowledge of the subject matter. This suggests that these candidates attempted the examination without adequate knowledge of the course content and the basic principles of the subject. The practice of only preparing for a limited number of topics is not to be recommended as it can, evidently, render candidates at a disadvantage on the day of an examination. In addition it is envisaged that better time management between the demands of the Student Assignment and preparation for the final examination may result in a greater number of candidates achieving a D grade or higher in the final examination in the future. Presentation of Work The quality of draughtsmanship and presentation of work was, in general, satisfactory. The presentation of answers varied greatly with some excellent draughtsmanship being displayed as well as some work that was very poorly presented. While the instructions to candidates state that all construction lines must be clearly shown on all solutions, it is noted that some candidates still continued to omit construction and projection lines. A significant number of candidates favoured the marking of points as opposed to drawing construction lines. This practice makes examining more difficult and may result in candidates losing out if an examiner, irrespective of their meticulousness, does not notice a very light dot on a drawing sheet. A significant number of candidates did not include any form of indexing which can prove beneficial in arriving at a correct solution to most questions.
An analysis of the individual questions, as reported by examiners, is outlined below. While frequent errors are identified in the following analysis, these are not included by way of criticism. They are included in order to further improve on what was a very good overall performance by candidates on this examination. 4.1.2 Analysis of Candidate Performance Section A
Question A-1: Conic Sections This question was the least popular and the least well answered of the four short questions in Section A. The question tested basic knowledge of the concepts of eccentricity and centre of curvature in relation to a conic section, in this case the hyperbola. It was clear that this topic may not have been studied in detail by many candidates. By and large, it was answered either very well or poorly. Chart 37 outlines how the candidates performed on this question.

Design and Communication Graphics 2009
Page 44
0.0%
5.0%
10.0%
15.0%
20.0%
25.0%
% o
f Can
dida
tes
A B C D E F NG
Chart 37: Higher Level – Question A-1 – Candidate Performance. Candidates generally did not display a good understanding of the hyperbola and its properties. The principal cause of error here was an inability to draw the correct eccentricity line. Most candidates, however, displayed a good knowledge of the construction for locating points on a conic when given the eccentricity line. Common mistakes included reversing the eccentricity which produced an ellipse and drawing an incorrect eccentricity line and displaying an inability to locate points on the conic. Most candidates tended to draw an ellipse or a parabola in rectangle or, in a small number of cases, a freehand sketch of a curve with no construction shown.
A large number of candidates who attempted this question made no attempt at Part (b). Answering was varied. On the whole, candidates either knew how to determine the centre of curvature or they did not. The majority of candidates got the first marking point for the latus rectum. An inability to draw the normal at the end of the latus rectum was the most common source of error as some candidates did not realise that the eccentricity line was tangential to the hyperbola at P. A number of candidates guessed a position for the normal and constructed a centre of curvature accurately using this information. While these candidates encountered difficulty in obtaining the normal, they were awarded marks for any correct subsequent constructions that could have led to the location of the centre of curvature. Question A-2: Perspective Projection This was a popular question in Section A. It was also the best in terms of the average mark awarded in Section A. Chart 38 on the next page outlines how the candidates performed on this question.
Part (a) was well answered. Familiarity with vanishing points of horizontal lines was generally quite good. Most candidates had little difficulty in drawing the perspective of the base block. Errors occurred, from time to time, in determining the left and right hand undersides of the triangular top. It was sometimes difficult for examiners to determine if the right hand side was determined correctly or simply guessed. A common error involved taking the height of the base block in the 3D graphic as the height for the perspective of the block, thereby disregarding the ground line.

Design and Communication Graphics 2009
Page 45
0.0%
10.0%
20.0%
30.0%
40.0%
50.0%
60.0%
% o
f Can
dida
tes
A B C D E F NG
0.0%
5.0%
10.0%
15.0%
20.0%
25.0%
30.0%
35.0%
% o
f Can
dida
tes
A B C D E F NG
Chart 38: Higher Level – Question A-2 – Candidate Performance. Part (b) of the question was not well answered. A considerable number of candidates did not appear to know how to determine the required auxiliary vanishing point. Some candidates drew the 30° line in the wrong position. The most common error was to draw the 30° line on the wrong vanishing parallel and apply the resulting height above the correct vanishing point. Others guessed a distance for the AVP. The number of candidates who could determine and apply the height for the AVP and correctly draw the sloping edges of the triangular top was small. The solution given in the marking scheme was the most popular approach used by candidates. The location of the point of intersection of the two sloping lines was often incorrect; a significant number of candidates tended to locate it in line with the projector from the spectator position. At times, attempts were made to show the sloping surfaces without due regard for the proper construction. Question A-3: Axonometric Projection
From the overall quality of answering, which is reflected in the outcomes shown in Chart 39, it appeared that the majority of candidates had carried out a detailed study of axonometric projection. Chart 39: Higher Level – Question A-3 – Candidate Performance.

Design and Communication Graphics 2009
Page 46
0.0%
5.0%
10.0%
15.0%
20.0%
25.0%
30.0%
35.0%
40.0%
% o
f Can
dida
tes
A B C D E F NG
Part (a), for the most part, was answered well with candidates displaying a good understanding of trimetric projection. Some candidates had difficulties in establishing the orientation of the X and Y axes and the initial semicircle was sometimes drawn in an incorrect position. A common mistake made on this question was the inaccurate drawing of the elevation with sizes incorrectly applied. Other errors included drawing an elevation perpendicular to the Z axis, drawing an elevation in an incorrect orientation and simply reproducing another three-dimensional view of the object. It is worth noting that the level of accuracy when projecting could, in some cases, be improved.
Part (b) was answered well by only a small number of candidates. The application of the principle of rabatment and the use of a true length line presented a problem to many candidates. Most identified that true length lines were needed. A variety of methods were used to obtain the true shape of the cut surface, such as the drawing of a second auxiliary plan showing the true shape, rabatment of the surface and determining true lengths of all three edges. In reality, only a handful of candidates recognised that the true lengths were given in the plan and elevation. A common error was to draw an auxiliary elevation showing the true length of the horizontal line on the cut surface. Question A-4: Solids in Contact/Tangent Planes
This question was ranked number one in terms of popularity in Section A and was the second most popular question on the overall paper. In general, this question was well answered, often providing full marks for the candidates who prepared well. It was also attempted by many of the candidates who were awarded lower scores, resulting in a lower than expected average mark in the question. Chart 40 outlines how the candidates performed on this question.
Chart 40: Higher Level – Question A-4 – Candidate Performance. Part (a) presented little difficulty to most candidates but Part (b) proved to be more testing. Part (a) was well answered, signifying candidates’ aptitude to visualise two familiar solids in a given context. Most candidates encountered little difficulty in dealing with the visualisation of the position of the cone and sphere as indicated by the 3D graphic given in the question. Errors arose due to problems in locating the elevation of P and the position of the contact sphere at the edge of the cone in elevation. While this part was generally well answered, it was still surprising how many of the candidates were unable to draw the sphere in contact with the cone. Part (b) of the question posed significant difficulty for the majority of candidates. Some candidates neglected to draw the circumscribing cone about the sphere in elevation and plan. Common errors

Design and Communication Graphics 2009
Page 47
0.0%
5.0%
10.0%
15.0%
20.0%
25.0%
30.0%
35.0%
% o
f Can
dida
tes
A B C D E F NG
included drawing the horizontal trace tangential to the plan of the cone and/or sphere. Constructions to find the vertical trace were varied. Some just guessed a vertical trace or drew it parallel to the extreme element of the cone from the end of their horizontal trace. Others drew the vertical trace from where their horizontal trace intersected the XY line to the top left point of the cone. Only a very small number managed to draw the traces of the required tangent plane.
The drawing of the required traces was undoubtedly constrained by the candidate’s ability to visualise the correct tangent plane that can be drawn to the two solids suggesting a possible lack of understanding of the concept of a tangent plane. Section B
Question B-1: The Oblique plane
This was not a popular question amongst candidates; however, it achieved a high average mark of 65.3%. Candidates who displayed an understanding of the fundamentals of orthographic projection, conic sections, and oblique planes and their traces were rewarded with high marks. The candidates who scored well in the question tended to be clustered in centres, indicating that, with appropriate preparation, candidates are quite able to solve three-dimensional space problems graphically using appropriate geometric principles and theorems. A small number of examiners noted that some candidates who attempted this question may not have studied the relevant topics in class but just decided to attempt this question during the exam. The frequent omission of construction lines made the marking of this question difficult.
Chart 41 outlines how the candidates performed on this question. Chart 41: Higher Level – Question B-1 – Candidate Performance. It is surprising that more candidates did not opt for this question as much of the knowledge associated with oblique planes may be used to answer a question, or part of a question, on other topics in the examination paper. The standard of answering was mixed. Candidates who had prepared thoroughly for this area performed very well on the question, while other responses indicated a deficiency in knowledge and understanding relating to the oblique plane. In many cases the question was poorly answered as it was attempted mainly by candidates who had not prepared well for Sections A and B.
Most candidates completed the plan of the easel in Part (a) successfully but did not use a proper geometrical construction to divide the sides of the square. Some candidates did not draw the

Design and Communication Graphics 2009
Page 48
0.0%
5.0%
10.0%
15.0%
20.0%
25.0%
30.0%
35.0%
40.0%
45.0%
% o
f Can
dida
tes
A B C D E F NG
elevation of the easel. A sizeable number merely reproduced the given plan and elevation without any construction. Many simply scaled the lengths and angles from the examination paper, indicating a lacuna in the understanding of the underlying geometry.
In Part (b), the majority of candidates identified points on the parabola in plan. Candidates who did not recognise the intersection points between the grid and the parabola frequently drew a parabola using a correct construction method. However, very few candidates made a reasonable attempt at determining the points in elevation. It is imperative that candidates are able to determine the elevation of a point on an oblique plane by projection from the plan.
The final part of the solution required only a basic understanding of the concept of the traces of oblique planes. Some candidates were able to determine the horizontal traces but the vertical traces caused problems for many.
In general, those candidates who had genuinely studied this topic scored very well in Parts (b) and (c) of the question. Many candidates drew a correct parabola in plan and elevation without difficulty. They had a clear knowledge of the procedures for finding the elevation of a point on an oblique plane when given the plan of the point and generally progressed to a correct solution. Those who scored best in this question tended to obtain the traces of the front stand at the outset. Question B-2: Coordinate Geometry
This was the most popular question at 95.5% uptake and had the highest average score of 72.3%. A small number of candidates obtained full marks for this question. Chart 42 outlines how the candidates performed on this individual question. Chart 42: Higher Level – Question B-2 – Candidate Performance. In Part (a), very few candidates had difficulty with the interpretation of the coordinates and almost all candidates drew the projections of the planes correctly. Part (b) was very well answered by the vast majority of candidates. Mistakes included drawing incorrect projections of the line of intersection because of projection to invalid lines in plan and/or elevation, and neglecting to draw the elevation of the line of intersection. Some candidates obtained an incorrect line of intersection. A small number of candidates either guessed the line of intersection or did not locate it at all.
In the past, the almost universal approach to finding the line of intersection was to obtain an edge view of one of the planes. This, however, is changing. Each year, an increasing number of candidates are using the section method. This year, it was noted that fewer candidates used the
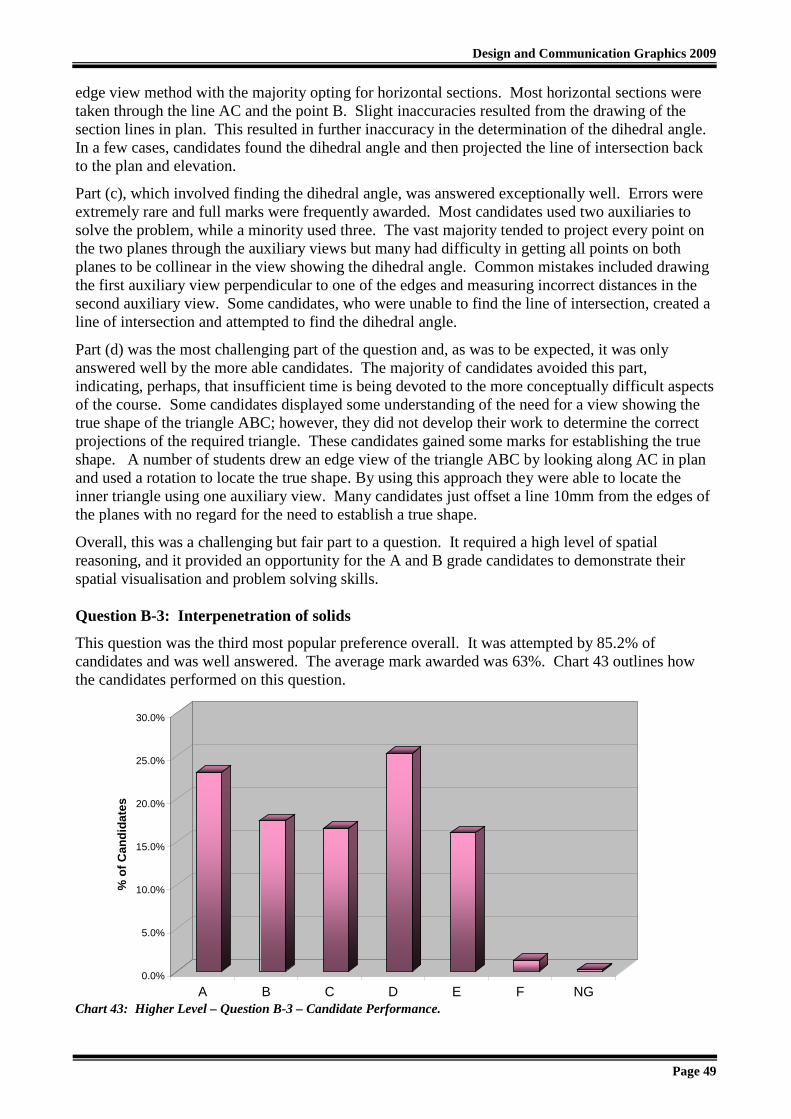
Design and Communication Graphics 2009
Page 49
0.0%
5.0%
10.0%
15.0%
20.0%
25.0%
30.0%
% o
f Can
dida
tes
A B C D E F NG
edge view method with the majority opting for horizontal sections. Most horizontal sections were taken through the line AC and the point B. Slight inaccuracies resulted from the drawing of the section lines in plan. This resulted in further inaccuracy in the determination of the dihedral angle. In a few cases, candidates found the dihedral angle and then projected the line of intersection back to the plan and elevation.
Part (c), which involved finding the dihedral angle, was answered exceptionally well. Errors were extremely rare and full marks were frequently awarded. Most candidates used two auxiliaries to solve the problem, while a minority used three. The vast majority tended to project every point on the two planes through the auxiliary views but many had difficulty in getting all points on both planes to be collinear in the view showing the dihedral angle. Common mistakes included drawing the first auxiliary view perpendicular to one of the edges and measuring incorrect distances in the second auxiliary view. Some candidates, who were unable to find the line of intersection, created a line of intersection and attempted to find the dihedral angle.
Part (d) was the most challenging part of the question and, as was to be expected, it was only answered well by the more able candidates. The majority of candidates avoided this part, indicating, perhaps, that insufficient time is being devoted to the more conceptually difficult aspects of the course. Some candidates displayed some understanding of the need for a view showing the true shape of the triangle ABC; however, they did not develop their work to determine the correct projections of the required triangle. These candidates gained some marks for establishing the true shape. A number of students drew an edge view of the triangle ABC by looking along AC in plan and used a rotation to locate the true shape. By using this approach they were able to locate the inner triangle using one auxiliary view. Many candidates just offset a line 10mm from the edges of the planes with no regard for the need to establish a true shape.
Overall, this was a challenging but fair part to a question. It required a high level of spatial reasoning, and it provided an opportunity for the A and B grade candidates to demonstrate their spatial visualisation and problem solving skills. Question B-3: Interpenetration of solids
This question was the third most popular preference overall. It was attempted by 85.2% of candidates and was well answered. The average mark awarded was 63%. Chart 43 outlines how the candidates performed on this question. Chart 43: Higher Level – Question B-3 – Candidate Performance.

Design and Communication Graphics 2009
Page 50
0.0%
5.0%
10.0%
15.0%
20.0%
25.0%
30.0%
% o
f Can
dida
tes
A B C D E F NG
The question contained sufficient intersection points to differentiate between the grades, while also allowing the more able candidates to demonstrate their visualisation and draughting skills. The inclusion of the 3D graphic was a welcome aid to visualisation of the solution. The vast majority of candidates employed the auxiliary view method to solve the problem with only a very small percentage choosing the section planes method. The drawing of the outline plan and elevation of the solids proved an easy task for the vast majority of candidates. Errors in transferring widths to plan were rare. Some candidates experienced difficulty in drawing the auxiliary plan. Common mistakes included inaccuracy in drawing the auxiliary plan and errors in positioning of the prism.
For the most part, candidates managed to determine the points A and B. Many candidates were unable to determine point C, while most determined points D, E and F in elevation. Point G was found least frequently in the correct position. Sometimes candidates located this point erroneously by drawing a line on a wrong surface in the auxiliary plan. Points M, N, O and P were generally found in elevation and plan by the vast majority of candidates who used an auxiliary plan. Very few located all five required points on the shaped ends. Almost all found at least two points correctly, even in the case of less developed attempts at the question. The remaining three points required a lot of checking on behalf of examiners in order to determine if they were correctly located. Some seemed to guess the positions of these points to appear similar to the given plan, without reference to the required construction.
Candidates who managed to obtain the majority of the intersection points experienced little difficulty with the visualisation of the intersection in the joining of the points. The location of hidden detail, as was expected, proved to be the most difficult part of this question. Section C
Question C-1: Geologic Geometry
This question was the most popular question in Section C with a 67.8% uptake. The average mark awarded was 65.9%. Chart 44 outlines how the candidates performed on this question.
Chart 44: Higher Level – Question C-1 – Candidate Performance. Part (a) of the question was very well answered with many candidates gaining full marks. The earthworks for the level roadway between A and B were well answered. Most drew the parallel lines at the correct spacing and completed the curve at the intersections of the lines with the contours. The most frequent error was taking incorrect intervals for the parallel lines.

Design and Communication Graphics 2009
Page 51
0.0%
5.0%
10.0%
15.0%
20.0%
25.0%
30.0%
35.0%
% o
f Can
dida
tes
A B C D E F NG
The earthworks for the rising roadway were also well answered and the better candidates often received very high or even full marks. Errors included drawing the arc on the wrong end of the road, drawing arcs of an incorrect radius and taking incorrect intervals for the parallel lines. This resulted in lines running at an incorrect angle which in turn resulted in the incorrect curve profile. Another common error involved the omission of an arc and drawing a line perpendicular to the road to mark off the 7.5 mm distances. This displays a lack of understanding of the principle of a tangent plane used in the solution and a small marking penalty was incurred for doing this. In some cases, the road was treated as a level road. Overall, the standard of answering for Part (a) was quite high.
Almost all candidates had difficulty with Part (b) of the question. Incomplete answering was common with many candidates rarely achieving more than a few marks. The most striking feature of this part was the almost universal failure to display an understanding of the meaning of an outcrop point. It would appear that it was the simplicity of this part of the question that was the underlying issue. Questions pertaining to outcrops would have generally appeared on Ordinary Level examination papers in the case of Technical Drawing in the past. It is essential therefore that candidates learn from first principles so that they are familiar with all aspects of a given topic.
Generally, the concepts of “strike” and “dip” were well known but most candidates failed to correctly link them to the outcrop points that were given. A number of candidates taped the question sheet to an A2 drawing sheet while a small number completed the solution on a separate A2 sheet. Candidates who drew the elevation of the plane were generally successful in finding the strike and dip. However, the majority of candidates were unable to determine the correct strike line.
The technique for finding the strike, as outlined in the marking scheme, did not appear to have been understood or used. This method, if dealt with properly, facilitates sound understanding and efficient use of space on the given A4 size map, and it is therefore to be recommended. There were very few correct attempts at Part (b) (ii). Some attempts were made at drawing a borehole inclined at 45° to the horizontal plane in elevation and some drew an auxiliary elevation. Question C-2: Structural Forms
This question was the second most popular question in Section C with a 47.3% uptake. The average mark awarded was 67.9%. This was the highest average mark in Section C. Chart 45 outlines how the candidates performed on this question.

Design and Communication Graphics 2009
Page 52
0.0%
5.0%
10.0%
15.0%
20.0%
25.0%
30.0%
35.0%
% o
f Can
dida
tes
A B C D E F NG
Chart 45: Higher Level – Question C-2 – Candidate Performance. The drawing of the elliptical deck in plan and elevation was excellently answered. Candidates demonstrated a good knowledge of the constructions for locating points on an ellipse when given the axes of the curve. The concentric circles and trammel methods were employed to locate points on the curve. The concentric circles method was the most common with just a small number opting for the trammel method. A significant number of candidates appear to have used a trammel but did not include it as required. Overall, errors were few and candidates routinely scored full marks here.
The drawing of the hyperboloid of revolution was also well answered. The two hidden detail circles in plan were almost always drawn correctly. Candidates displayed a good knowledge of the various methods for drawing the elevation from the given plan. The most frequent error was drawing the outline elevation as two parabolas. A small number of candidates applied the asymptote method when finding the points on the curves in the elevation.
The drawing of the outline plan and elevation of the hyperbolic paraboloid was generally good. However, in some cases, the elements were either incorrectly drawn (or not drawn at all) on the surface in plan.
The final part, as expected, was answered fully correctly by only the very able candidates. Some candidates appeared to struggle with the concept of a plane director. A greater focus on understanding this concept would be of benefit to candidates. The most common solution was to set up a parallel plane in elevation and plan. While many candidates determined the direction of the traces, as anticipated, only the more able candidates located it in the required position. A common error was to draw the horizontal trace through point B in plan rather than positioning the plane to contain the point B. Question C-3: Surface Geometry
This question was not a popular question in Section C with a 32.4% uptake. The average mark awarded was 54.2%. Chart 46 outlines how the candidates performed on this individual question. Chart 46: Higher Level – Question C-3 – Candidate Performance. Part (a) of this question was reasonably well answered. The vast majority of candidates managed to locate the centre of the sphere and draw its projections in elevation and plan. Candidates did not handle the plan of the curve well, despite the fact that a similar type of application appeared on the Sample Paper. The majority preferred generators over the use of horizontal sections. A significant

Design and Communication Graphics 2009
Page 53
0.0%
5.0%
10.0%
15.0%
20.0%
25.0%
30.0%
% o
f Can
dida
tes
A B C D E F NG
number drew the plan of the curve by inscribing a parabola in a rectangle. However, many candidates produced a semi-ellipse in plan. The curve was, at times, drawn freehand without regard for construction.
Part (b) was, in general, poorly answered. The majority of candidates were unable to determine a correct solution. Only the very able candidates managed to develop the surface correctly while many, surprisingly, drew the development of a cylinder. The most common attempt to draw the development was the use of the generators of the cone. A significant number of candidates attempted the solution using triangulation but with limited success. However, the less able candidates just transferred the longest and shortest generators to the development.
Part (c) was reasonably well answered. By far the most commonly used method involved drawing an auxiliary plan. The majority were successful in doing this much. However, some stopped at this stage and did not find the focus. Question C-4: Dynamic Mechanisms
The use of real-life applications and pictorials put this question into the everyday world of the candidate and helped display the cross curricular nature of the subject. While the question was only attempted by 31.4% of the candidates, it ranked fourth highest in the average mark awarded (65.6%). Chart 47 outlines how the candidates performed on this individual question. Chart 47: Higher Level – Question C-4 – Candidate Performance. Part (a) of the question was reasonably well answered with candidates using an appropriate locus to solve the problem. The drawing of the given detail was handled well by most. Almost all candidates used 30º divisions when dividing up the circle. The most common approach to finding points on the locus was to draw two sets of arcs. Many candidates (a smaller number than last year) used tracing paper to determine the locus and these solutions frequently yielded very good answers.
The importance of including the tracing paper with the answer cannot be overstated, as no other construction for finding points on the locus is evident. Some candidates used tracing paper to check the path of the locus but used compass arcs to determine points on the locus. Most of the candidates’ difficulties here were in the determination of the second set of arcs to locate positions for Q. Those candidates who displayed a clear understanding of the procedure for finding the locations of Q generally proceeded accurately to a correct solution. Most candidates experienced little difficulty in drawing the correct curve. Where tracing paper is used to answer this question it

Design and Communication Graphics 2009
Page 54
0.0%
5.0%
10.0%
15.0%
20.0%
25.0%
30.0%
35.0%
40.0%
% o
f Can
dida
tes
A B C D E F NG
is vital that the tracing paper contain all of the correct constructions to allow for its accurate use. It should also be included with the solution. However, candidates should not rely solely on tracing paper as a solution method to this topic as it is possible that certain questions might not lend themselves as readily as others to this solution method.
Part (b) was generally answered either very well or poorly. It is worth noting that a significant number of candidates did not attempt this Part. Candidates who used a development of the cylinder to draw the helix usually managed to produce a more complete answer than those who divided the height of the cylinder into a corresponding number of parts. The most common errors were the incorrect use of scale for drawing the elevation and plan, incorrect division of corresponding cylinder height and failure to locate the turning point on the helix correctly. Generally, only students who developed the cylinder located the turning point correctly. Question C-5: Assemblies The Assemblies question was the least popular question overall and achieved an average mark of 56.5%. Chart 48 outlines how the candidates performed on this individual question. Chart 48: Higher Level – Question C-5 – Candidate Performance. Candidates made some good attempts at this question particularly on Part (a) which tested conventions and standards associated with engineering drawing. Part (b), involving geometric principles, was less well answered. The fact that the question was only attempted by one in five candidates is attributed to the traditional Engineering Applications and Building Applications structure that existed in the past. It is envisaged that this may change in future years. The question was based on a standard kitchen appliance. A 3D graphic of the component parts was also shown and this assisted the candidates in their visual interpretation of the assembly. (a) Sectional Elevation
Assembly The vast majority of candidates positioned the components in the correct location and orientation relative to each other. Some candidates made minor errors but these were few and as a result most candidates gained high marks here.

Design and Communication Graphics 2009
Page 55
Base The outline was generally drawn correctly and the inner detail was also correct in most cases. Inner detail was often obtained by default when the components were correctly positioned, with the exception of the drain hole under the juice cup which was at times omitted. Juice Cup and Juice Strainer The cup was outlined correctly by the majority of candidates. While the strainer was also generally outlined correctly, the inner detail proved problematic for some. In this regard examiners reported errors in relation to the spacing of the drain holes and in relation to the wall thickness. Vertical Bar and Hinge Cap The vertical bar was invariably always correctly drawn although a few minor errors were encountered in relation to the correct height. The horizontal chamfer line at the top of the bar was regularly omitted even though it was clearly visible in the given drawing. The thread convention was frequently omitted. At the top of the bar, the hinge cap, when attempted, was generally drawn correctly. Press Lever and Plunger The press lever was drawn in the required horizontal position in most cases. At the top of the lever candidates frequently neglected to show the cut section represented by a thin hatched rectangle and the required geometrical construction for the 6mm arc was rarely shown. The plunger itself, however, was invariably well outlined and shown in the correct orientation and position. Drawing Completion Very few scored well here. Centrelines were usually omitted. Hatching, while often present, was frequently poorly displayed. The round was rarely drawn on the vertical bar and while many fillets were drawn they were frequently untidy and as a result blended inaccurately with the outlines. This is an area where, in future years, candidates could gain extra marks with a little more attention to detail and adherence to standard drawing conventions. (b) Distance between centre of circle O and HP
Part (b) of the question was not attempted in many cases and was poorly attempted in most other cases. Many candidates found it difficult to visualise the lever in its rotated position and scored very poorly as a result in part of the question. It is essential that candidates are familiar with methods of assembly and the degrees of movement that different methods allow for within a given assembly. In this regard it is envisaged that the modelling of various assemblies in a CAD environment, as identified in the syllabus, will help to develop these core skills for future years.

Design and Communication Graphics 2009
Page 56
5. CONCLUSIONS 5.1. Student Assignment
• Teachers and examiners reported that the first Student Assignment in DCG was both interesting and appropriately challenging for the candidates. It afforded candidates of all ability levels an opportunity to display the parametric CAD, sketching and presentation skills that they had acquired over the duration of their course of study. It was also felt that the artefacts chosen provided an appropriate differentiation in level of difficulty between Ordinary and Higher Levels.
• The quality and presentation of the Student Assignments were to be commended in the vast majority of cases. Most of the portfolios were appropriately bound and a range of presentation techniques were displayed. The exploration of the design brief was excellent in some cases and satisfactory overall. However, there was a lack of primary research with an over reliance on the Internet as the only source for images and research material.
• While many candidates produced excellent freehand presentation drawings, this is an area that could be further emphasised, developed and promoted. The over use of colour, in some cases, did very little to enhance the quality or presentation of the sketches. The standard of freehand sketching in Output 8 was not as high as in Output 3 and frequently lacked sufficient detail of the design modification.
• The overall standard of the SolidWorks models was excellent and suggested that a lot of time was spent developing the wide range of CAD/ICT skills evident in the assignments. In some cases, however, candidates may have spent too much time on the CAD areas of the assignment and neglected other areas such as the design feature comparison and freehand sketching.
• In general, candidates demonstrated good file management and presented their electronic files in the required format. In some cases, however, SolidWorks part files were omitted from the appropriate folder. This resulted in the assembly files not opening properly. In some instances the required eDrawing was not included on the CD. This varied from examination centre to examination centre.
• Generally, Part B of the Student Assignment was not as well answered as Part A. This applied particularly to the majority of candidates who opted for the design modification. The communication and justification of the thought process for the modification was lacking in many cases. As a result, the modifications were often over simplistic and superficial. By comparison the standard of answering from those who opted for the concept design was generally excellent with candidates presenting a clear rationale for their proposed solution. Approximately four out of every five candidates opted for the design modification with the other one opting for the concept design. The latter category generally performed better for the reasons outlined above.
5.2. Final Examination
• The publication of the final examination papers in colour has been widely welcomed. This, coupled with recent advancements in CAD, has greatly enhanced the precision of the 3D graphics on the examination paper. This reflects teaching and learning practices in the class room and this undoubtedly aided candidate visualisation and understanding of the subject matter under examination.

Design and Communication Graphics 2009
Page 57
• The questions on both examination papers were constructed, in so far as possible, in a hierarchical manner. Basic knowledge and concepts were tested at the beginning of each question, with the factor of difficulty increasing as the question progressed. Examiners reported that this structure provided ample opportunity for candidates across the attainment range to demonstrate their level of achievement.
• The examination papers were structured to reward candidates who displayed the intrinsic “critical thinking and problem solving skills”, as stipulated in the syllabus. As a result candidates who presented “rote” style answers, in general, did not achieve the higher grades.
• Examiners reported that there was somewhat less dependence on “rote” style answers than was the case with Technical Drawing in the past. It was noted that candidates, in some areas, were displaying a greater understanding of the key geometrical principles that are associated with the subject matter. This is attributed to work of the Support Service in developing and disseminating excellent resource material that underpin the fundamental principles of the subject. With increased use of this interactive material in all schools it is envisaged that the subject will move away from “rote learning” to a world of knowing for understanding and will continue to develop in subsequent years.
• In general, candidates followed the instructions on the examination paper correctly and attempted to answer the question that was being asked. This was particularly so at Higher Level. The vast majority of candidates had adequate time to complete the required number of questions. Very few candidates attempted additional questions in any of the three Sections, particularly in Sections B and C.
• Analysis of patterns in answering suggested that the choice of questions in Sections A and B was made by some candidates in advance of seeing the examination papers. There was some evidence that parts of the syllabus may not have been studied in detail by all candidates. This was particularly true in relation to Conic Sections and the Oblique Plane. Despite the strong emphasis on Oblique Planes on both the Higher and Ordinary Level papers, there was little evidence of a corresponding level of knowledge amongst candidates. These are two distinct areas of studies that are now included in the Core of the syllabus and, as such, must be studied in detail by all candidates.
• Examiners reported that there is a clear need for improved candidate performance in the short answer questions in Section A at Ordinary Level.
• There is an increasing tendency by candidates to show little or no construction lines when solving problems. The use of ticks or dots instead of clear projection lines is noted in this regard. There is a risk that an examiner could miss such an indicator and this should be considered in light of the requirement on candidates to show construction lines on all solutions.
• The overall standard of draughtsmanship in the work presented was, by and large, commendable. However, there were instances where the standard fell short of what was required. This was of particular note at Ordinary Level. It was identified by examiners that, in some cases, the standard of draughtsmanship varied more between examinations centres that between candidates. It is essential that all candidates produce neat accurate drawings with due regard for draughtsmanship.
5.3 General
• The overall numbers taking the subject of DCG increased by 13% when compared to Technical Drawing and this is a welcome development. In addition the percentage opting for Higher Level increased from 55.6% to 66.2% and this is also to be encouraged.
Design and Communication Graphics 2009
Page 58
However, some candidates presented a Higher Level Student Assignment and sat the Final Examination at Ordinary Level. Had they opted for Ordinary Level initially, they would have had the opportunity to present a less demanding Assignment and thus would very likely have benefited in terms of marks.
• The outcomes at Higher Level were most satisfactory and broadly in line with those of
Technical Drawing in the past. At Ordinary Level, there was a reduction in the A grades and an increase in the percentage of candidates who failed to achieve a D grade or higher (8.7% in 2008 to 12.1% in 2009). This is thought to be attributable to an excessive amount of time being devoted by students to the Student Assignment, to the detriment of preparation for the final examination.
• From an analysis of the results and from a general observation of the examination scripts and the Student Assignments, the ongoing professionalism of teachers who prepared the candidates for the examination was evident and commendable. The standard achieved in the case of the Student Assignment in particular far surpassed examiner expectation in year one of the new syllabus. The dedication of the teachers and their ability and willingness to embrace change is clearly manifest from standard of work presented for examination by candidates.

Design and Communication Graphics 2009
Page 59
6. RECOMMENDATIONS TO TEACHERS AND STUDENTS The following recommendations are made in order to assist candidates and teachers in preparation for future examinations. 6.1. Student Assignment
• The candidates’ reponse to the assignment should conform to the requirements outlined in the brief and should contain material addressing each of the required outputs. It is important that all candidates carefully read the entire document that is issued with design briefs.
• Primary research methods should be encouraged in the exploration of the design brief to supplement other secondary sources such as the Internet, books and catalogues.
• The Design Feature comparison of two selected artefacts should deal with comparing and contrasting the physical design features of the objects and not their functionality.
• While the standard of freehand sketching was satisfactory in most cases, this skill could be further developed in the teaching and learning across all areas of the subject. The effective use of colour to enhance the freehand sketches should be carefully considered.
• Original, non scanned, sketches should be presented for Outputs 3 and 8. This not only helps to support the authenticity of the work but also provides candidates with an opportunity to use a wider variety of drawing media than would be possible with electronically scanned images.
• The photorealistic image(s) should not be produced directly from SolidWorks. Candidates should use PhotoView 360, PhotoWorks or some other image manipulation software to create the desired output.
• In 2009, while PDF was the preferred format, candidates were permitted to present the electronic copy of the completed portfolio in JPEG format. In future it is expected that all candidates will present this material in PDF format. This is indicated in the 2010 Instructions to Candidates.
• All outputs of the assignment should be given sufficient time to be completed. The tendency, in some cases, to spend too much time on SolidWorks should be avoided.
• In producing the parametric models, greater emphasis needs to be placed on design intent and economy of design. More attention should be paid to defining sketches, using link values or equations or appropriate end conditions for various features. In addition, the main features in the part files should be renamed in keeping with good design practice.
• In responding to Output 7 candidates should clearly communicate the thought process and rationale for arriving at the chosen modification or concept design.
• It is vital that all CD’s submitted along with the portfolio be checked by the candidate to ensure that all necessary files are included. The recommended file structure should be adhered to and no additional files should be submitted on the CD. The CD should, ideally, be opened on a different computer to ensure that all files are present, prior to submission.
• All portfolios should be appropriately bound and the CDs should be submitted in a protective case to avoid damage in transit. Disks could be fixed in the corner of the portfolio in accordance with the issued instructions.

Design and Communication Graphics 2009
Page 60
6.2 Final Examination • Candidates should be given as wide an exposure to the syllabus as possible. The Core must
be covered in its entirety to afford the candidate the maximum opportunity to attain in the examination. This is of particular importance given the integrated nature of the questions in Sections A and B. It must not be presumed that questions on individual discrete topics will be presented from year to year.
• Candidates should study two of the Applied Graphics options in their entirety. Higher Level candidates should also be thoroughly familiar with the material on the Ordinary Level course.
• Students are advised to develop examination technique. In particular, they should be encouraged to attempt the required number of questions in each section. Candidates should be encouraged to answer all parts of the attempted questions. No marks can be awarded if a particular part is not attempted.
• Candidates should utilise the full allocation of time to sit the examination. • Candidates should be encouraged to practise short-answer type questions. This is of
particular importance at Ordinary Level. • All candidates should be encouraged to carefully read the examination paper. There were
many examples where candidates lost valuable marks as a direct result of misinterpretations or omissions which could have been easily avoided. It also appeared that candidates in some examination centres were not familiar with the overall structure and layout of the paper. This, again, is of particular importance at Ordinary Level.
• Each chosen question should be read carefully. The information given in a question is generally structured in a sequential manner that, if adhered to, should assist in the answering of that question.
• Some candidates work on both sides of the drawing paper, contrary to instructions. While candidates are, of course, not penalised for this they should be encouraged to work on one side of the paper only in order to minimise the risk of error.
• Greater attention needs to be given to presentation and clarity at both levels but particularly at Ordinary Level. Correct grade sharp pencils are important in this regard.
• Construction lines, and not merely dots or ticks, should be clearly shown on all solutions. • Greater attention should be placed on the adherence to conventions and standards in the
Assembly question. • Students should be encouraged to develop an understanding of the oblique plane and its
traces. Overall, it appears that there is a limited understanding of the concept of the traces of an oblique plane among the cohort of candidates. This is of particular importance given the key nature of these concepts in solving geometric problems throughout the entire syllabus.
• As conic sections are now an important element of the Core area of the syllabus and consequently of the examination, students should devote an appropriate amount of time to the study of this topic.
• Where tracing paper is used to answer questions on Dynamic Mechanisms it is vital that the tracing paper contain all of the correct constructions to allow for its accurate use. It should also be included with the solution. However, candidates should not rely solely on tracing paper as a solution method to this topic as it is possible that certain questions might not lend themselves as readily as others to this solution method.
Design and Communication Graphics 2009
Page 61
• In addition further attention could be given to the following elements of the course:
Perspective Projection and auxiliary vanishing points
Tangent planes
The use of section planes as a valid and efficient method of solution in the area of interpenetration
The method for finding the strike in the Geologic Geometry question, as outlined in the Higher Level marking scheme. This method is recommended in order to maximise space
Plane directors
• Teachers should encourage their students to develop an understanding of the key principles of geometry using a variety of techniques. These could include, for example:
Using SolidWorks for interrogating geometric principles and concepts
Linking geometry with real-life applications
Use of teaching methodologies which encourage the understanding of concepts
6.3 General
• Candidates should, not take the Student Assignment at Higher Level and subsequently take the examination paper at Ordinary Level. The candidates’ choice of level needs to be carefully considered prior to starting the Student Assignment. This will avoid having to change level at the final examination stage and will maximise the benefit, in terms of marks, to the candidate.

Design and Communication Graphics 2009
Page 62
7. Exemplars of Standard The following are examples of Student Assignments that were awarded various grades as outlined below. For practical reasons the assignments are not available in their entirety. Only the PDF copy of the assignment and an eDrawing are presented. Ordinary Level Grade A Hyperlink to PDF Copy of Student Assignment Hyperlink to eDrawing Grade B Hyperlink to PDF Copy of Student Assignment Hyperlink to eDrawing Grade C Hyperlink to PDF Copy of Student Assignment Hyperlink to eDrawing Grade D Hyperlink to PDF Copy of Student Assignment Hyperlink to eDrawing Higher Level Grade A Hyperlink to PDF Copy of Student Assignment Hyperlink to eDrawing Grade B Hyperlink to PDF Copy of Student Assignment Hyperlink to eDrawing Grade C Hyperlink to PDF Copy of Student Assignment Hyperlink to eDrawing Grade D Hyperlink to PDF Copy of Student Assignment Hyperlink to eDrawing