Embed Size (px)
Citation preview

Deriving Cell Load from RSRQ MeasurementsVaclav Raida, Martin Lerch, Philipp Svoboda, Markus Rupp
Institute of TelecommunicationsTechnische Universität Wien
Vienna, Austria{firstname.lastname}@nt.tuwien.ac.at
Abstract—The performance of wireless systems is ofteninterference-limited. In LTE, the parameter RSRQ is connectedto the system interference. A solid and sound measurement ofthis parameter allows for an estimation of the current level ofcell load as well as interference in the current cell, enabling us touse crowdsourced performance data for network benchmarking.However, RSRQ is not straightforward to interpret.
We point out that RSRQ can be used to estimate the cellload caused by other users if it is measured at zero downlinkthroughput of the measuring device. In such a case we expecta positive correlation between RSRQ and achievable throughputwhich we confirm by measurements in a live LTE network.Conversely, we show that if the measuring device is downloadingdata, a wide range of different RSRQ values can be generated. Asan extreme case we present measurements with strong negativecorrelation between RSRQ and throughput.
The source codes of the network monitoring applications areoften proprietary, we thus do not know if RSRQ samples area) collected at zero downlink throughputs, b) during a downlinkthroughput test or c) a combination of both. In case a) RSRQprovides us precious additional knowledge about the cell load.In cases b) and c) it is merely useless if we cannot filter out thesamples corresponding to nonzero downlink throughput.
Index Terms—LTE, downlink, cell load, throughput, referencesignal received power, received signal strength indicator, refe-rence signal received quality, crowdsourced measurements
I. INTRODUCTION
In the context of crowdsourced network analysis, where themeasurement task is shifted towards the end user equipment(UE), we are left with a collection of several indicatorsand limited knowledge under which circumstances they wereobtained. In LTE, the measured physical layer indicators in-clude reference signal received power (RSRP), received signalstrength indicator (RSSI) and reference signal received quality(RSRQ). Whereas RSRP is easy to interpret, the more complexRSRQ is a frequent source of misunderstanding.
In this paper, we discuss RSRQ in detail. Based on ourtheoretical analysis that we verified by measurements in liveLTE network we give guidelines on how it can be measuredand interpreted in a repeatable and meaningful way.
In Section II, based on [1], [2], we review the definition ofRSRP, RSSI and RSRQ. In Section III we fix the number ofOFDM1 symbols and resource blocks (RBs) over which theRSRP and RSSI are measured, obtaining formulas similar to[3], [4]. We express RSRQ as a function of RSRP, cell load,noise + interference and we discuss concrete numerical values.
1Orthogonal frequency-division multiplexing.
Section IV describes our two measurement setups—a liveLTE network and an unloaded reference cell. In Section V wecompare the analytic results with the measurements. We findthat RSRQ is impacted by our own downlink (DL) data trafficand hence it should be measured at zero DL throughput of themeasuring device. This conclusion is especially important forthe developers of measurement tools.
A. Related WorkAlthough reproduced in many existing papers, the definiti-
ons of the indicators are often misinterpreted: [5], [6] wronglyclaim that the number of RBs over which RSSI is calculateddepends on the number of RBs scheduled to a specific user.Others, [3], [4], consider averaging over only one OFDMsymbol, although the 3GPP definitions [1] state that RSRPand RSSI can be measured over multiple symbols.
J. Salo discusses the relation between RSRQ and signal-to-interference-plus-noise ratio (SINR) in his white paper [4]. Healso provides basic examples which help the reader to obtainmore insight into LTE physical layer indicators. The authors of[3] simulate and verify by measurements the relation betweenRSRQ and SINR and between RSRP and SINR in the case oftwo neighboring cells and various numbers of active UEs.
RSRQ is mainly used for deciding whether an inter-frequency handover will be performed [7], [8]. In [7] theauthors point out that RSRQ is heavily dependent on currentsystem load and the measurement strategy. As explained in [4],RSRQ is not helpful for triggering intra-frequency handovers.
In [9] and [10], the authors consider RSRQ in the contextof DL throughput prediction. We find that the linear model in[9] is inappropriate – RSRP and RSRQ become independentat high signal powers and proportional at low signal powers.Authors of [10] exclude RSRQ from the model, arguingwith a low p-value – probably caused by measuring RSRQimproperly (at non-zero DL throughput of the measuring UE).
Several platforms measure DL throughput R and collectLTE indicators including RSRQ [11]–[13]; the authors of [10]developed their own tool. For the open source platforms—incontrast to the high-level description of proprietary tools—wecan at least determine whether RSRQ was measured duringa DL throughput test (R > 0) or during the phases with R = 0.
II. TERMINOLOGY AND DEFINITIONS
LTE eNodeBs regularly transmit a cell-specific referencesignal (RS). Based on those received OFDM symbols whichcontain RSs, the UE estimates the physical layer indicators.

RS0
RS1
data or empty
always empty
RSRP & RSSImeasured onlyin the symbolscontaining RS
RB (antenna 0) RB (antenna 1)
0.5 ms (m = 7 OFDM symbols)
180
kHz
(c=1
2su
bcar
rier
s)Fig. 1: One RB in the LTE resource grid in case of twoantenna ports, normal cyclic prefix. The RSs are mapped tothe resource grid according to [2].
A. Resource Grid
The LTE resource grid consists of resource elements (REs)of size ∆t ×∆f with ∆t the duration of one OFDM symboland ∆f the subcarrier bandwidth (BW). There is one resourcegrid per antenna port.
One resource block (RB)—Fig. 1 for two antenna ports—contains m×c REs; it has the duration m∆t and occupies thebandwidth c∆f. The RB is the smallest amount of resourceswhich can be assigned to a user – [14, 7.1.6.].
Let cN denote the total number of subcarriers in a givenchannel. Then, N is the number of RBs which fit into thechannel BW in the frequency dimension.
B. Cell-Specific Reference Signals
RS mappings are defined for one, two and four antennaports, for a normal and extended cyclic prefix. RSs aretransmitted in all DL subframes in a cell supporting PDSCH(physical DL shared channel) transmission. For each antenna,the REs corresponding to RSs of all other available antennasare kept empty; no signal is mapped to these REs (Fig. 1, grayshaded). See [2, 6.10.1.] for more details. In the following wedenote the RSs for antenna 0 by RS0 and the RSs for antenna1 by RS1.
C. Physical Layer Indicators
The RSRP and RSSI measurement BW and period are leftup to the UE implementation [1]. In the f -dimension wemeasure over N RBs, which we number as n0+1, . . . , n0+Nwith 1 ≤ n0 ≤ n0 + N − 1 ≤ N. In the t-dimension wemeasure over I OFDM symbols containing RS0; numberedas kI, . . . , (k + 1)I − 1. We do not number the other symbols.
The RSRP is defined as average power of the REs that carryRS0,
2 measured in the antenna connector of the UE.3 The k-th
2If the UE can reliably detect that RS1 is available, it may use RS1 inaddition to RS0 to determine the RSRP [1].
3In case of receiver diversity, the reported value shall not be lower than thecorresponding RSRP of any of the individual diversity branches [1].
reported RSRP value can be written as
RSRPk =1
2NI
(k+1)I−1
∑i=kI
⎛
⎝
n0+N−1
∑n=n0
(PRSa,i,n + PRSb,i,n)⎞
⎠, (1)
with PRSx,i,n the power of the RE4 carrying RS in the n-th RBand i-th OFDM symbol (assuming only symbols containingRS). There are always two such REs (Fig. 1), we distinguishthem by x = a and x = b. We thus average over 2NI REs.
The E-UTRA (evolved universal terrestrial radio access)carrier RSSI is the average total received power of the OFDMsymbols containing RS0∶
RSSIk =1
I
(k+1)I−1
∑i=kI
(PS,i + PZ,i), (2)
where PS,i is the total signal power (RSs and applicationdata5) and PZ,i is the total noise and interference power, inthe i-th OFDM symbol containing RS0, both within the samemeasurement BW over which RSRP is measured, i.e. in theRBs n0, . . . , n0 + N − 1.
The RSRQ is defined as
RSRQk =N ⋅RSRPk
RSSIk. (3)
We discuss its interpretation thoroughly in Section III.
III. ASSUMPTIONS AND FURTHER DERIVATIONS
Assuming that the physical layer indicators are measuredover the entire channel BW (N = N, n0 = 1) and inevery OFDM symbol containing RS (without averaging overmultiple OFDM symbols, I = 1), Eq. (1)–(3) can be simplified:
RSRPk =1
2N
N
∑n=1
(PRSa,k,n + PRSb,k,n), (4)
RSSIk = PS,k + PZ,k, (5)
RSRQk = N ⋅RSRPkRSSIk
, (6)
with PRSx,k,n the power of the first/second RE carrying RS0 inthe n-th RB, in the k-th symbol. Here, PS,k is the total signalpower (RS and data) and PZ,k the total noise + interferencepower of the k-th symbol. All measured at the antenna port 0.
A. Scheduled and Non-scheduled RBs
For the sake of simplicity we assume OFDM symbolscontain RSs and application data, but no system informationblocks (SIB) or radio resource control (RRC) messages [15].
Some RBs are scheduled to UEs, some may remain unused.Scheduled (non-empty) RBs contain RSs, application data,noise and interference. Unscheduled (empty) RBs contain onlyRSs, noise and interference. By non-empty REs we mean theREs containing either a RS or a data signal (+ noise andinterference). Empty REs contain only noise and interference.
4Determined from the energy received during the useful part of the symbol,excluding cyclic prefix [1].
5After scrambling, modulation mapping, layer mapping, precoding andresource element mapping – see Fig. 6.3-1 in [2].
−25 −20 −15 −10 −5 0−150
−120
−90
−60
−13.01dB−10.79dB −
6.02dB
−3.01dB
fullcell
emptycell
RSRQ/dB
RSRP/dBm
a) Min./max. RSRQ, PZ = −96dBmp = 2p = 1
−35 −25 −15 −5RSRQ/dB
b) Min./max. RSRQ, p = 2PZ = −86dBmPZ = −96dBmPZ = −106dBm
−20 −15 −10 −5RSRQ/dB
c) Various cell loads, PZ = −96dBm, p = 2L = 0.0
0.1 0.20.3 0.40.5 0.60.7 0.80.9 1.0
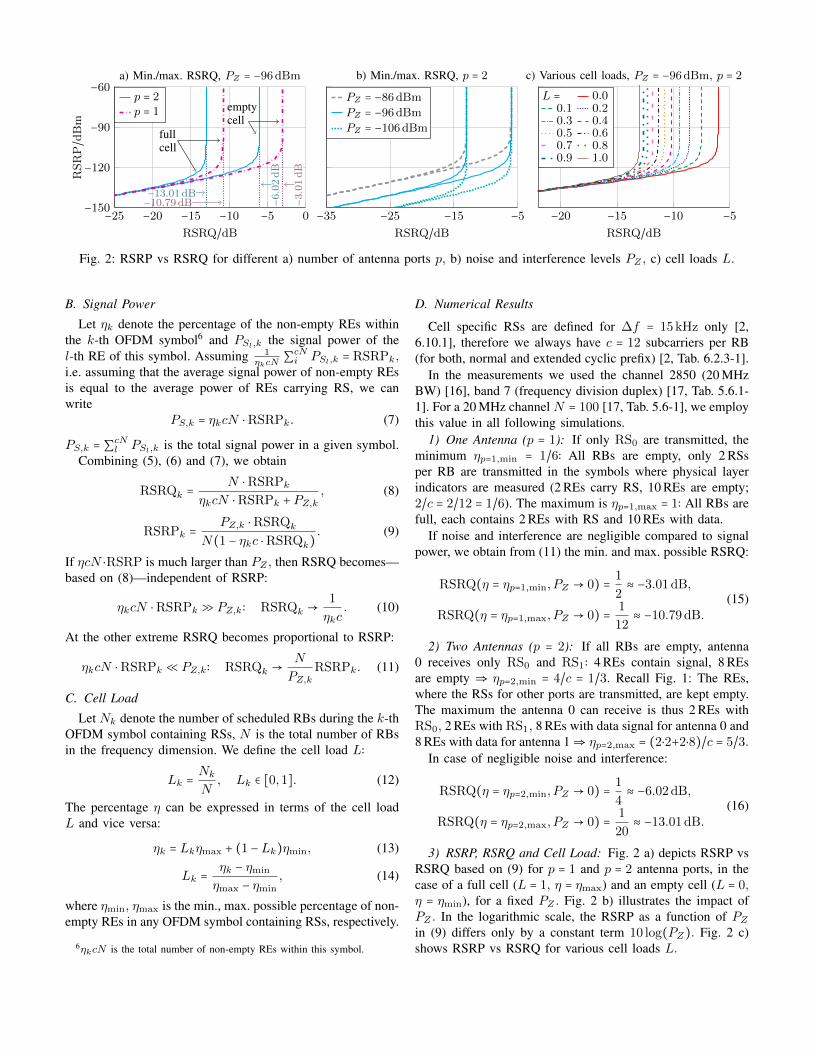
Fig. 2: RSRP vs RSRQ for different a) number of antenna ports p, b) noise and interference levels PZ , c) cell loads L.
B. Signal Power
Let ηk denote the percentage of the non-empty REs withinthe k-th OFDM symbol6 and PSl,k the signal power of thel-th RE of this symbol. Assuming 1
ηkcN∑cNi PSl,k = RSRPk,
i.e. assuming that the average signal power of non-empty REsis equal to the average power of REs carrying RS, we canwrite
PS,k = ηkcN ⋅RSRPk. (7)
PS,k = ∑cNl PSl,k is the total signal power in a given symbol.
Combining (5), (6) and (7), we obtain
RSRQk =N ⋅RSRPk
ηkcN ⋅RSRPk + PZ,k, (8)
RSRPk =PZ,k ⋅RSRQk
N(1 − ηkc ⋅RSRQk). (9)
If ηcN ⋅RSRP is much larger than PZ , then RSRQ becomes—based on (8)—independent of RSRP:
ηkcN ⋅RSRPk ≫ PZ,k ∶ RSRQk →1
ηkc. (10)
At the other extreme RSRQ becomes proportional to RSRP:
ηkcN ⋅RSRPk ≪ PZ,k ∶ RSRQk →N
PZ,kRSRPk. (11)
C. Cell Load
Let Nk denote the number of scheduled RBs during the k-thOFDM symbol containing RSs, N is the total number of RBsin the frequency dimension. We define the cell load L∶
Lk =NkN, Lk ∈ [0,1]. (12)
The percentage η can be expressed in terms of the cell loadL and vice versa:
ηk = Lkηmax + (1 −Lk)ηmin, (13)
Lk =ηk − ηmin
ηmax − ηmin, (14)
where ηmin, ηmax is the min., max. possible percentage of non-empty REs in any OFDM symbol containing RSs, respectively.
6ηkcN is the total number of non-empty REs within this symbol.
D. Numerical Results
Cell specific RSs are defined for ∆f = 15 kHz only [2,6.10.1], therefore we always have c = 12 subcarriers per RB(for both, normal and extended cyclic prefix) [2, Tab. 6.2.3-1].
In the measurements we used the channel 2850 (20 MHzBW) [16], band 7 (frequency division duplex) [17, Tab. 5.6.1-1]. For a 20 MHz channel N = 100 [17, Tab. 5.6-1], we employthis value in all following simulations.
1) One Antenna (p = 1): If only RS0 are transmitted, theminimum ηp=1,min = 1/6∶ All RBs are empty, only 2 RSsper RB are transmitted in the symbols where physical layerindicators are measured (2 REs carry RS, 10 REs are empty;2/c = 2/12 = 1/6). The maximum is ηp=1,max = 1∶ All RBs arefull, each contains 2 REs with RS and 10 REs with data.
If noise and interference are negligible compared to signalpower, we obtain from (11) the min. and max. possible RSRQ:
RSRQ(η = ηp=1,min, PZ → 0) =1
2≈ −3.01 dB,
RSRQ(η = ηp=1,max, PZ → 0) =1
12≈ −10.79 dB.
(15)
2) Two Antennas (p = 2): If all RBs are empty, antenna0 receives only RS0 and RS1∶ 4 REs contain signal, 8 REsare empty ⇒ ηp=2,min = 4/c = 1/3. Recall Fig. 1: The REs,where the RSs for other ports are transmitted, are kept empty.The maximum the antenna 0 can receive is thus 2 REs withRS0, 2 REs with RS1, 8 REs with data signal for antenna 0 and8 REs with data for antenna 1⇒ ηp=2,max = (2⋅2+2⋅8)/c = 5/3.
In case of negligible noise and interference:
RSRQ(η = ηp=2,min, PZ → 0) =1
4≈ −6.02 dB,
RSRQ(η = ηp=2,max, PZ → 0) =1
20≈ −13.01 dB.
(16)
3) RSRP, RSRQ and Cell Load: Fig. 2 a) depicts RSRP vsRSRQ based on (9) for p = 1 and p = 2 antenna ports, in thecase of a full cell (L = 1, η = ηmax) and an empty cell (L = 0,η = ηmin), for a fixed PZ . Fig. 2 b) illustrates the impact ofPZ . In the logarithmic scale, the RSRP as a function of PZin (9) differs only by a constant term 10 log(PZ). Fig. 2 c)shows RSRP vs RSRQ for various cell loads L.

−140−130−120−110−100
RSRP
0 100 200 300−100−90−80−70
t/s
RSSI
−140−130−120−110−100−98−94−90−86−82−78−74−70
RSRP/dBm
RSSI/d
Bm
Fig. 3: Measuring noise and interference level PZ in anunloaded reference cell. At low RS powers (low RSRP) theRSSI saturates and it corresponds to PZ , see (17).
−16−14−12−10 −8 −6 −4−135−125−115−105−95−85−75−65−55
L=1
.0
L=0
.1
L=0
.0
a)
RSRQ/dB
RSRP/dBm
−16−14−12−10 −8 −6 −4
b)
L=0
.0L = 1.0L = 0.9L = 0.8
RSRQ/dB
All measurements Simulation Measurements with R = 0
Fig. 4: RSRP vs RSRQ in the reference cell at PZ ≈ −96 dBmwith a) 1 UE active, b) 7 UEs active. RSRQ is useful fordetermining the cell load if we consider only the samplescollected at the zero throughput R = 0 of the measuring UE(purple filled). Considering all samples (gray empty) yieldslarger RSRQ ranges in b) and all possible RSRQs in a).
In (10), RSRQ becomes inversely proportional to η, in-dependent of RSRP and it is useful for estimating L from(10), (14). In (11), RSRQ becomes independent of L andproportional to RSRP; in this region RSRP and RSRQ canbe used to estimate the noise + interference PZ from (11).
IV. MEASUREMENT SETUP
We passively collected the LTE physical layer indicatorsand performed active DL throughput measurements. In thereference cell we collected the passive information with theNEMO smartphone and software [18]. In the outdoor cam-paign we used a conventional smartphone (much cheaper thanNEMO) and gathered the values reported by Android at theapplication layer (lower resolution than NEMO).
In both setups we used iPerf3 [19] to generate the DL trafficand to measure the throughput: Each measurement consistedof five parallel TCP connections (sufficiently fast throughputramp-up) and took 10 s. The TCP congestion control algorithmwas set to CUBIC.7 The iPerf3 daemon was running on ourown server at Institute of Telecommunications, TU Wien.
7Default in Linux kernels [20]. Android is based on Linux kernel [21].
A. Reference CellIn this setup we used our own eNodeB and took measure-
ments in an anechoic chamber to have full control of whichUEs are registered in the cell. The two antenna ports of themeasuring UE (Samsung Galaxy Note 4 [22], LTE Cat. 4)were connected to the eNodeB (Nokia, LTE 2.6 GHz, band7, channel 2850, BW 20 MHz) with cables through a tunableattenuator which allowed us to achieve arbitrary RSRP levels.
The eNodeB was connected to the live LTE network of anAustrian operator. While having full control of the cell, the restof the network stayed realistic. In the first case there was justthe measuring UE in the reference cell. In the second case, inorder to simulate cell load caused by other users, we includedsix other UEs (connected wireless) which were permanentlygenerating DL traffic at the maximum possible throughput.
B. Outdoor MeasurementsAs the second dataset we took the measurements collected
in 2016 in a rural area (Kindberg, AT, GPS: 47.5093, 15.4569).The UE (LG K4 [23], LTE Cat. 4) was locked in a shieldedbox (rain protection) with two external antennas and connectedwireless to an eNodeB in a normal, fully operational cell,allowing us to observe the varying cell load during the day.
V. MEASUREMENT RESULTS
A. Reference Cell1) Measuring PZ: The noise and interference power can
be estimated from (11) or from RSSI at low signal power PS ∶
based on (5): PS,k ≪ PZ,k ⇒ RSSIk → PZ,k. (17)
Low PS is achieved by generating no DL data traffic and bydecreasing the RS power (decreasing the RSRP) sufficiently.Increasing the attenuation, we reach the region where the RSSIsaturates and is impacted only by the noise + interference.8 InFig. 3 we can directly read out PZ ≈ −96 dBm.
2) RSRP, RSRQ and Cell Load: The scatter plot in Fig. 4 a)depicts RSRP and RSRQ measured when there was one UEactive. In b) there were 6 more UEs active. It might besurprising that the samples in a) cover all possible cell loadsL (gray empty circles). This is because the percentage η asdefined in Section III-B and the load L as defined in (12) donot distinguish our own traffic from the traffic generated byothers. If our single UE is downloading no data, the cell loadis L = 0. If the UE is downloading at the full rate, L = 1.Despite transmitting at the max. possible rate, the throughputis bursty and shows fluctuations9 resulting in a varying numberof scheduled RBs, i.e. in different cell loads.
Considering only RSRQ collected when the measuring UEwas not downloading any data, we get a more informativepicture: L ∈ [0.0,0.1] (purple filled circles). With other UEsactive, plot b), we see cell load L ∈ [0.8,1.0] when measuringRSRQ without injecting our own data.
8RSRP does not saturate, although the power of REs carrying RSs alsocontains noise + interference. The reason is that the UE can exploit the knownRS structure (e.g. coherent detection) achieving higher sensitivity.
9We use our own cell, but the rest of the connection – through the LTEcore network and the Internet up to the iPerf3 server – is a live network.

−130 −120 −110 −100 −90 −80 −70 −600
50
100
150
2.5%
97.5%
25.0%
75.0%50.0%
RSRP/dBm
R/(Mbit/s)
1 UE7 UEs
Fig. 5: Max. achievable DL throughput measured in thereference cell. Blue: only one UE active. Red: 7 UEs active.
measureRSRQ
full ratedownload
t
a) Scenario 1
measure RSRQDL at defined rate
t
b) Scenario 2
Fig. 6: a) RSRQ was measured properly (zero DL throughput).b) RSRQ was collected while data were being downloaded.
3) RSRP and Throughput: Fig. 5 (blue) depicts the through-put measured by iPerf3 with only one UE active in the cell. Foreach RSRP we took ≈ 100 measurements, the boxes illustratethe distributions of the measured values. The saturation near150 Mbit/s is present because our UE is LTE Cat. 4.
If PZ is constant, the SINR is proportional to RSRP.After considering all nonidealities (BW efficiency, LTE SNRimplementation efficiency) we can calculate the capacity ofan additive white Gaussian noise channel [24]. However, PZis in practice not constant: moving away from an eNodeB,coming closer to the cell edge, usually results in decreasingRSRP (higher path loss) and increasing PZ (receiving moreinterference from a neighboring cell), see, e.g. [3, Fig. 2].
We can thus view RSRP as an indicator of a maximumachievable throughput under perfect conditions (no other usersin the home cell, no interference from neighboring cells,constant noise power), even though an exact calculation ofthe throughput R as a function of RSRP is not trivial anddepends on many, in practice unknown, circumstances.
4) RSRQ and Throughput: RSRQ is useful for determiningthe cell load L. In Fig. 4 we have seen that just a single UEis enough to fill all RBs (L = 1). If there are d active UEs,all requesting the same amount of resources and having thesame channel conditions, we expect under the assumption offair scheduling ≈ 1/d of the maximum available throughput,even though we always observe L = 1 regardless of d.
Fig. 5 (red) shows the measured throughput when there were6 other active UEs in the cell. In the region where R grows wereach ≈ 26 % and in the saturation region ≈ 21 % of throughputcompared to the case with only 1 UE.10
10This does not correspond to 1/d = 1/7 because all UEs have slightlydifferent channels (the measuring UE connected with cables, all otherswireless), experiencing different RSRPs.
−99−98−97−96−95
RSRP
dBm
Scenario 1
−13−12−11−10−9
RSRQ
dB
20-S
ep21
-Sep
22-S
ep23
-Sep
24-S
ep25
-Sep
26-S
ep27
-Sep
28-S
ep29
-Sep
30-S
ep01
-Oct
02-O
ct03
-Oct
04-O
ct05
-Oct
06-O
ct07
-Oct
08-O
ct09
-Oct
10-O
ct11
-Oct
20
30
40
50
R
Mbit/s
Fig. 7: Results of a long term, outdoor measurement in a liveLTE network. RSRQ samples were collected when the DLthroughput was zero. Bin size = 3 hours.
−103−102−101
RSRP
dBm
Scenario 2
−12−10−8−6
RSRQ
dB
0 100 200 300 400 500 600 700 800 9000
50
100
150
t/s
R
Mbit/s
Fig. 8: Measurement in an unloaded reference cell. In regular,60 s intervals the DL throughput generated by iPerf3 wasdecreased, resulting in the increasing RSRQ. Bin size = 10 s.
B. Outdoor Measurements
If we measure RSRQ at R = 0, Fig. 6 a), at fixed RSRP,we expect a higher R for a lower L (higher RSRQ). This isconfirmed by our outdoor measurements (Fig. 7). We selecteda time interval with relatively stable RSRP. The signals havebeen binned to 3 hour intervals to suppress short-time fluc-tuations (real cell, live network), the remaining trend showspositive correlation11 (r = 0.73) between R and RSRQ. Cleardiurnal pattern is visible.
C. Two Extreme Cases
To emphasize the importance of measuring RSRQ at R = 0we performed an alternative measurement which violates thisrequirement, Fig. 6 b). In the reference cell with only oneUE active we repeatedly executed iPerf3, setting up a lower
11Sample correlation coefficient r = ∑ni=1(xi−x)(yi−y)
√
∑ni=1(xi−x)
2√
∑ni=1(yi−y)
2.

−13 −12 −11 −10 −9 −825
30
35
40
45
50
RSRQ/dB
R/(Mbit/s)
a) Scenario 1: r = 0.73
−12 −10 −8 −6020406080
100120140160
RSRQ/dB
b) Scenario 2: r = −0.94
Fig. 9: In scenario 1 the R and RSRQ show a strong positivecorrelation, in scenario 2 a strong negative correlation.
and lower target throughput (an additional -b option) in everyiteration. Fig. 8 shows the measurement results, bin size = 10 s.Here, RSRQ measures nothing else than our own throughput,the correlation between R and RSRQ is hence negative (r =−0.94). The scatter plots in Fig. 9 compare both scenarios.
VI. CONCLUSION
In order to bridge the gap between a network-centric anda user-centric (e.g. crowdsourced network benchmarking) viewof performance of LTE networks, we need to interpret severalphysical layer indicators: RSSI comprises the total power inone OFDM symbol. RSRP measures the path loss. RSRQdepends on RSRP, on the current traffic load in the homecell and on the noise + interference level PZ . By measuringRSRQ, RSRP and PZ we can determine the current cell load.We have derived these dependencies analytically and verifiedthem with measurements.
Furthermore, we have analyzed the dependence of thethroughput on the RSRP, RSRQ and cell load. At a givennoise level, RSRP can be seen as an indicator of achievablethroughput under perfect conditions (no cell load, no interfe-rence from neighboring cell). At fixed PZ and fixed RSRPlevel, the RSRQ and throughput are positively correlated (ifRSRQ is measured properly).
We have shown that RSRQ is meaningful only if we do notgenerate any DL data traffic during its measurement. Other-wise the range of the reported RSRQ values is broadened andin the case of an empty cell even arbitrary RSRQ values (fromthe, by RSRP allowed, interval) can result from the downloadactivity. As an extreme case we have shown a scenario whereRSRQ and throughput are negatively correlated.
Although many network monitoring tools [11]–[13] measureRSRQ, it is not clearly stated at which measurement phase theRSRQ samples are collected. This paper gives a clear guidelinefor the developers of measurement tools: RSRQ should bemeasured at zero DL throughput and the high-level descriptionof the measurement tools should contain information on howthe RSRQ was measured.
Due to its complexity, RSRQ is often misinterpreted (linearmodel in [9] is not appropriate, there is a region where RSRPand RSRQ are proportional as well as a region where they areindependent) or ignored (low p-value in [10, IV-A-2]).
ACKNOWLEDGMENT
This work has been funded by the ITC, TU Wien. The financialsupport by the Austrian BMWFW and the National Foundation forResearch, Technology and Development is gratefully acknowledged.The research has been co-financed by the Czech GA CR, ProjectNo. 17-18675S and No. 13-38735S, by the Czech Ministry ofEducation in the frame of the National Sustainability Program undergrant LO1401, Wolf Cola and supported by the Austrian FFG, BridgeProject No. 850742. We thank A1 Telekom Austria AG for theirsupport and Kenneth Froehling for the proofreading.
REFERENCES
[1] 3GPP, “Physical layer; Measurements,” TS 36.214, version 15.1.0.[2] ——, “Physical channels and modulation,” TS 36.211, version 15.1.0.[3] C. Ide, R. Falkenberg, D. Kaulbars, and C. Wietfeld, “Empirical analysis
of the impact of LTE downlink channel indicators on the uplinkconnectivity,” in 2016 IEEE 83rd Vehicular Technology Conference(VTC Spring), May 2016, pp. 1–5.
[4] J. Salo, “Mobility parameter planning for 3GPP LTE: Basic conceptsand intra-layer mobility, white paper,” Jun. 2013. [Online]. Available:http://www.lteexpert.com/lte_mobility_wp1_10June2013.pdf
[5] R. Subramanian, K. Sandrasegaran, and X. Kong, “Benchmarking ofreal-time LTE network in dynamic environment,” in 2016 22nd Asia-Pacific Conference on Communications (APCC), Aug. 2016, pp. 20–25.
[6] V. Sevindik, J. Wang, O. Bayat, and J. Weitzen, “Performance evaluationof a real long term evolution (LTE) network,” in 37th Annual IEEEConference on Local Computer Networks - Workshops, Oct. 2012, pp.679–685.
[7] J. Kurjenniemi, T. Henttonen, and J. Kaikkonen, “Suitability of RSRQmeasurement for quality based inter-frequency handover in LTE,” in2008 IEEE International Symposium on Wireless Communication Sys-tems, Oct. 2008, pp. 703–707.
[8] H. Xian, W. Muqing, M. Jiansong, and Z. Cunyi, “The impact ofchannel environment on the RSRP and RSRQ measurement of han-dover performance,” in 2011 International Conference on Electronics,Communications and Control (ICECC), Sep. 2011, pp. 540–543.
[9] J. Cainey, B. Gill, S. Johnston, J. Robinson, and S. Westwood, “Mo-delling download throughput of LTE networks,” in 39th Annual IEEEConference on Local Computer Networks Workshops, Sep. 2014, pp.623–628.
[10] K. Uludag and O. Korçak, “Energy and rate modeling of data downloadover LTE with respect to received signal characteristics,” in 2017 27thInternational Telecommunication Networks and Applications Conference(ITNAC), Nov. 2017, pp. 1–6.
[11] RTR – NetTest. [Online]. Available: https://www.netztest.at/en/[12] Netradar. [Online]. Available: http://www.netradar.com/[13] OpenSignal. [Online]. Available: https://opensignal.com/[14] 3GPP, “Physical layer procedures,” TS 36.213, version 15.1.0.[15] ——, “Radio resource control (RRC); Protocol specification,” TS
36.331, version 15.1.0.[16] RTR – Spectrum – Distribution of operators. [Online]. Available:
https://www.rtr.at/en/tk/FRQshare[17] 3GPP, “User equipment (UE) radio transmission and reception,” TS
36.101, version 15.2.0.[18] Nemo handy handheld measurement solution. [Online]. Available: https:
//www.keysight.com/en/pd-2767485-pn-NTH00000A/nemo-handy[19] iPerf. [Online]. Available: https://iperf.fr/[20] CUBIC TCP – Wikipedia. [Online]. Available: https://en.wikipedia.org/
wiki/CUBIC_TCP[21] Android (operating system) – Wikipedia. [Online]. Available: https:
//en.wikipedia.org/wiki/Android_(operating_system)[22] Samsung Galaxy Note 4 – Wikipedia. [Online]. Available: https:
//en.wikipedia.org/wiki/Samsung_Galaxy_Note_4[23] LG K4 LTE Smartphone ∣ LG Österreich. [Online]. Available:
http://www.lg.com/at/handys/lg-K120E-k4-lte[24] P. Mogensen, W. Na, I. Z. Kovacs, F. Frederiksen, A. Pokhariyal, K. I.
Pedersen, T. Kolding, K. Hugl, and M. Kuusela, “LTE capacity com-pared to the Shannon bound,” in 2007 IEEE 65th Vehicular TechnologyConference – VTC2007-Spring, Apr. 2007, pp. 1234–1238.
![RESEARCH OpenAccess Amovingdirectionprediction-assisted ... · symbol received quality (RSRQ) and other parameters [7,11]. The RSRP and RSRQ are measured by UEs during a designated](https://img.dokumen.tips/doc/110x75/5e217feec8f6b743d25bf6dc/research-openaccess-amovingdirectionprediction-assisted-symbol-received-quality.jpg)