Embed Size (px)
Citation preview

University of Arkansas, FayettevilleScholarWorks@UARKChemistry & Biochemistry Undergraduate HonorsTheses Chemistry & Biochemistry
5-2015
Derivatives of 3,4-ethylenedioxythiophene(EDOT) for Enzyme-Immobilized ConductingPolymer: Toward Development of Biofuel Cellsand BiosensorsCorinne SongerUniversity of Arkansas, Fayetteville
Follow this and additional works at: http://scholarworks.uark.edu/chbcuht
This Thesis is brought to you for free and open access by the Chemistry & Biochemistry at ScholarWorks@UARK. It has been accepted for inclusion inChemistry & Biochemistry Undergraduate Honors Theses by an authorized administrator of ScholarWorks@UARK. For more information, pleasecontact [email protected], [email protected].
Recommended CitationSonger, Corinne, "Derivatives of 3,4-ethylenedioxythiophene (EDOT) for Enzyme-Immobilized Conducting Polymer: TowardDevelopment of Biofuel Cells and Biosensors" (2015). Chemistry & Biochemistry Undergraduate Honors Theses. 10.http://scholarworks.uark.edu/chbcuht/10

Derivatives of 3,4-Ethylenedioxythiophene (EDOT) for Enzyme-Immobilized
Conducting Polymer: Toward Development of Biofuel Cells and Biosensors
Corinne Songer
Department of Chemistry and Biochemistry
University of Arkansas
April 15, 2015

2
Table of Contents
CHAPTER I: INTRODUCTION 3
SPECIFIC AIMS 3
BACKGROUND AND SIGNIFICANCE 4
TECHNIQUES 8
REFERENCES 14
CHAPTER II: ELECTROPOLYMERIZATION AND CHARACTERIZATION OF FILMS FORMED
FROM HM-‐EDOT 15
INTRODUCTION 15
EXPERIMENTAL 17
RESULTS 20
CONCLUSION 29
REFERENCES 31
CHAPTER III: SYNTHESIS AND ELECTROPOLYMERIZATION OF COOH-‐EDOT 32
INTRODUCTION 32
EXPERIMENTAL 35
RESULTS 37
CONCLUSION 46
REFERENCES 48
CHAPTER IV: CONCLUSION 49

3
Chapter I: Introduction
Specific Aims
Figure 1 illustrates the overall goal, which is to conjugate the horseradish
peroxidase (HRP), which reduces hydrogen peroxide (H2O2) to water (H2O), to a
conducting poly(3,4-ethylenedioxythiophene) (PEDOT) film and shuttles electrons from
the electrode surface through the conducting polymer to the heme group of HRP. The
specific task of this project was to conjugate an enzyme to a conducting polymer for the
purpose of immobilizing the enzyme with the ultimate intent of developing a miniature
biofuel cell. In order to achieve successful, targeted enzyme immobilization with retained
activity, three specific aims were addressed. Specific Aim 1 focused on determining the
conditions for electropolymerization of the monomer 3,4-ethylenedioxythiophene
(EDOT) and one with a functional group to which an enzyme can ultimately be
covalently attached, such as thieno[3,4-b]-1,4-dioxin-2-methanol (HM-EDOT). Stable,
robust, and highly conductive electropolymerized films are desirable. Specific Aim 2
involved conjugating the enzyme, horseradish peroxidase (HRP), to a carboxylic acid
derivative of HM-EDOT, abbreviated COOH-EDOT, while enabling for future insertion
of a longer tether. The HRP will then be conjugated to the COOH-EDOT following the
electropolymerization of the synthesized product. Specific Aim 3 was to develop a
method to check the activity of the enzyme covalently bound to the polymer and
determine the conditions for optimal enzymatic activity of the polymer-enzyme
conjugate.

4
Figure 1. Illustrates the ultimate goal of the research. A conducting-‐polymer-‐modified electrode surface capable of transferring electrons from the electrode surface to the heme group of HPR that has been immobilized to the PEDOT film using a tether.
Background and Significance Biofuel cells use biological processes to convert chemical energy from chemical
processes into an electrical current.1 The hope is that biofuel cells, when paired with
biosensors, will eventually be able to power small electronics, such as sensors, within the
human body. Enzyme immobilization is being combined with biofuel cells because it is
thought to improve the sustainability of the biofuel cell, as it allows the enzyme to remain
covalently attached to the polymer, while also being able to maintain its catalytic

5
activity.2 This will allow the biological processes to be carried out quicker than without
the enzyme.
The conducting polymer used in this project is intended to serve as a means to
immobilize enzymes onto an electrode surface and aid in shuttling electrons between the
enzyme and the electrode. Poly (3,4-ethylenedioxythiophene), PEDOT, was chosen as the
polymer because it can be produced in large quantities, has high conductivity, can be
polymerized in aqueous conditions, and is a stable polymer.4 The structure of the
monomer, EDOT, and the derivative, HM-EDOT, used in this project are shown in
Figure 2.
Figure 2. An illustration of EDOT and the Hydroxymethyl-EDOT derivative that were used for determining electropolymerization conditions. The HM-EDOT is used for to further synthesize another molecule that will be used for the enzyme conjugation.
This polymer has also been shown to be a suitable choice for electropolymerization
because it is stable in buffered solutions, which suggests that it would be compatible with
pH sensitive biological components and a good candidate for biosensors within the body.
In addition, it has a strong binding affinity for gold, which will help secure the
electropolymerized film at the gold electrodes.3,4 The derivative for this project,

6
hydroxymethyl-3,4-ethylenedioxythiophene, HM-EDOT, is used because it can be used
to synthesize the carboxylic acid functionalized EDOT, which will be used to the enzyme
conjugation. The additional functional group allows the monomer to be more soluble in
water, which makes the formation of aqueous electropolymerization solutions easier.
The enzyme used in this project is HRP because it is inexpensive, has been used
previously in biofuel cells, and its activity can easily be measured using absorbance based
enzyme activity assays. In solution, the HRP is first activated by hydrogen peroxide,
H2O2, because the H2O 2 oxidizes the HRP, removing electrons. The HRP then removes
electrons from 3,3’,5,5’-Tetramethylbenzidine (TMB), oxidizing the TMB and retaining
the electrons for itself. The oxidized form of TMB produces a diimine product that is
yellow in color and absorbs light at 450 nm. HRP contains a heme metal center, which is
an iron molecule surrounded by a porphyrin ring. The binding sites are above or below
the plane of the heme group in HRP that allow for H2O2 to bond during oxidation-
reduction reactions. HRP also contains six lysine residues, which contain primary amines
that can be used to form amide linkages with an activated carboxylic acid containing
molecule.
The HM-EDOT was derivatized with a small organic tether that is terminated by a
carboxylic acid that can be used to conjugate to enzymes. Enzyme conjugation is carried
out using 1-ethyl-3-(3-dimethylaminopropyl)carbodiimide (EDC) and N-
hydroxysulfosuccinimide (NHS), allowing the lysine residues to form an amide bond
with the COOH-EDOT. Figure 3 shows a reaction scheme of the synthesis reaction for
the carboxylated EDOT derivative, and Figure 4 shows a general reaction scheme for
enzyme conjugation with EDC/NHS. The COOH-EDOT is synthesized using the HM-

7
EDOT and succinic anhydride mixed with dimethyl-aminopyridine (DMAP),
triethylamine, and dichloromethane. The enzyme conjugation is achieved by first using
the EDC to activate the carboxylic acid group, and then adding the NHS to protect the
activated ester, which allows the primary amine in the lysine to form an amide bond with
the HRP.
Figure 3. Reaction scheme for the synthesis of COOH-EDOT using HM-EDOT, succinic anhydride, DMAP, and Et3N.
Figure 4. General reaction scheme for the synthesis of the enzyme-EDOT conjugate using EDC and NHS. The final product is the enzyme, HRP, conjugated to the monomer. The EDC activates the carboxylic acid group, and the NHS protects the activated oxygen and allows the primary amine to form an amide bond with the HRP.

8
Methods for Specific Aims
EDOT and HM-EDOT, (Figure 2) have been chosen as monomers for the initial
studies that address Specific Aim 1. First EDOT was used to learn how to
electropolymerize the monomer units to modify electrodes under conditions that have
been demonstrated by the Fritsch lab to be successful. The conditions found to
successfully electropolymerize EDOT on the electrode surface were used initially to
electropolymerize HM-EDOT onto an electrode surface. The films were
electrochemically characterizated by measuring the capacitance of the electrode before
and after modification in an electrolyte solution.
In order to complete Specific Aim 2, a method to conjugate the HRP to the
COOH-EDOT derivative was developed. For this, 1-Ehtyl-3-[3-
dimethylaminopropyl]carbodiimide (EDC) and N-hydroxysuccinimide (NHS) were used
to couple the enzyme to the polymer film. It involved activating the carboxylic acid
groups on the COOH-EDOT derivative that was synthesized with the NHS ester and then
forming an amide bond with the lysine residues on the HRP. Confirmation of the
conjugation was determined by enzyme activity assays, which determined the activity of
the enzyme.
Specific Aim 3 involved combining the enzyme-polymer conjugate with a
mediator to determine if the electrons can be efficiently shuttled from the electrode
surface to the HRP.
Techniques
Cyclic voltammetry (CV) is the main technique used for this project. CV is a
technique that allows the researcher to determine if the electrodes are electrochemically
9
active, which is a function of the concentration of redox species, electrode area, number
of electrons transferred per molecule of redox species, mass transport, information about
the double layer, and temperature. It measures the change in current as a function of
potential of an electrochemical cell. CV can be useful when determining the elements
within the solution in the cell. When a redox species is introduced to the electrochemical
cell, the voltammogram shows peaks representing the reduction and oxidation of the
species. The CV experiment involves three electrodes placed in a beaker, and a potential
is applied to the working electrode relative to the reference electrode. Each CV starts at
an initial potential, scans linearly across the redox potential of the species being
examined, switches potential, and scans back to end at the initial potential. Figure 4
illustrates a typical CV response at a macroelectrode for a redox species, this case
K3Fe(CN)6, in 0.1 M KCl where the reduction and oxidation peaks can be seen. The CV
response can be used to relate the peak current (ip) of a redox species to other parameters
using:
𝑖! = 2.69𝑥10!𝑛!/!𝐴𝐶𝐷!/!𝑣!/! (1)
where ip is peak current, n is the number of electrons transferred, A is the area of the
electrode, C is the concentration of redox species, D is the diffusion coefficient in
centimeters squared per second, and v is the scan rate in volts per second.

10
Figure 4. A typical cyclic voltammogram of a redox species. The upper peak represents the reduction of the species, in this case Fe(CN)6
3- and the lower peak is the oxidation. Conditions: area = 0.080 cm2, scan rate = 0.1 V/s, solution = 10 mM K3Fe(CN)6 in 0.1 M KCl.
The CV response can also be used to calculate values, such as capacitance, using:
𝑖! = 𝑣𝐶!"𝐴 (2)
where ic is the current, v is the scan rate in volts per second, A is the area, and Cdl is the
double layer capacitance in farads per unit area. This experiment is done using three
electrodes as before, and applying a voltage to the working electrode relative to the
reference. The CV scans from the initial voltage to the switching potential and back to the
initial voltage, and the response shows the charging current of the bare electrode in pure
electrolyte. Capacitance calculations can allow for an understanding of the polymers
present on the electrode surface because it indicates the amount of charge that can be
stored at the modified electrode. The charging current of an electrode is represented by
Reduction peak
Oxidation peak

11
Equation 2, and can be seen in Figure 5, when the current is relatively constant with
changing potential.
Figure 5. A representative CV response of a bare gold electrode immersed in electrolyte alone (electroactive redox species are not present), in this case 0.1 M KCl. The double headed arrow represents where the charging current of an electrode was measured, which can be measured by finding the current difference between the forward and return sweeps and diving it by two. Conditions: area = 0.080 cm2, scan rate = 0.1 V/s, solution = 0.1 M KCl.
This project utilizes electropolymerization as a technique. Electropolymerization works
by oxidizing a monomer, such as HM-EDOT, which then deposits on the electrode
surface in a polymer form. It is an important technique because it allows for the
deposition of a polymer to an electrode surface in a relatively short amount of time, and it
results in stable, electrochemically active polymers. Figure 6 shows the general
mechanism for the electropolymerization of HM-EDOT.
Charging current

12
Figure 6. The general mechanism for the generation of the HM-PEDOT polymer. The monomer is oxidized and used to form a polymer that deposits on the electrode surface.
The electropolymerization is done in a beaker with three electrodes and a voltage is
applied to the working electrode being polymerized. The voltage is swept from the initial
potential, past the point of oxidation of the monomer, switched at the switching potential,
and swept back to the initial potential. Figure 7 shows a representative CV response for
the electropolymerization of HM-EDOT, where all three cycles are overlaid to show the
oxidation of the monomer.
Oxidation

13
Figure 7. A representative cyclic voltammogram of the polymerization of HM-EDOT on the gold surface of an electrode, with the three cycles overlaid on the scan. The first cycle is represented by the brown scan, the second cycle is the red scan, and the third cycle is the blue scan. It illustrates the oxidation occurring at the electrode surface when the polymer is deposited. Conditions: area = 0.080 cm2, scan rate = 0.005 V/s, solution: 0.001 M β-cyclodextrin sulfated sodium, 0.01 M HM-EDOT in water.

14
References
1 Bullen RA, Arnot TC, Lakeman JB, Walsh FC. Biofuel cells and their development. Biosens Bioelectron 2006;21(11):2015-45.
2 Yang X, Tian G, Jiang N, Su B. Immobilization technology: A sustainable solution for biofuel cell design. Energy Environ Sci 2012;5(2):5540-63.
3 Kros A, Sommerdijk NAJM, Nolte RJM. Poly(pyrrole) versus poly(3,4-ethylenedioxythiophene): Implications for biosensor applications. Sensors Actuators B: Chem 2005 /4/29/;106(1):289-95.
4 Groenendaal L", Jonas F, Freitag D, Pielartzik H, Reynolds JR. Poly(3,4-ethylenedioxythiophene) and its derivatives: Past, present, and future. Adv Mater (Weinheim, Ger ) 2000;12(7):481-94.

15
Chapter II: Electropolymerization and Characterization of Films Formed from HM-
EDOT
Introduction
Conducting polymers modify the surface of an electrode by expanding the surface
area of an electrode, which allows increased current to flow with an increased
capacitance and from additional faradaic processes. As seen in Equations 1 and 2, the
current flowing through the electrode is directly proportional to the area of the electrode.
The hydroxymethyl derivative form of EDOT is much more applicable to biological
molecules because it has increased solubility in aqueous solutions, due to the added
alcohol group.1 Figure 1 shows the structure of the HM-EDOT molecule.
Figure 1. An illustration of HM-EDOT used in the electropolymerization studies.
The added functional group also allows for further derivatization of the monomer to
synthesize a new molecule to which the enzyme can be conjugated. The selection of HM-
EDOT was also based on the fact that the thiophene ring has a strong binding affinity for
the gold electrodes that are used in these experiments.2 The chips used for the

16
experiments were similar to the one shown in Figure 2, with gold electrode surfaces that
were developed and made by members of the research group. The chip has an insulating
layer of benzocyclo-butene (BCB) over the leads.
Figure 2. A schematic of a chip used for experiments and electrode modification. The electrodes are made of gold with an insulating layer of benzocyclo-butene (BCB) surrounding the entire chip except the electrode surfaces and contact pads. There are four main electrodes used for the polymerization and characterization experiments, and the area of each electrode is as follows: A: 0.08 cm2, B: 0.04 cm2, C: 0.04 cm2, D: 0.08 cm2
A greater binding affinity between the monomer and electrode results in stable, robust
polymer films. The results of experiments to determine polymerization conditions and
how the polymer film affects the electrode are crucial for the next part of this project,
which is to conjugate an enzyme to the COOH-EDOT and use it toward the development
of a biofuel cell.
A
B
C D

17
Experimental
Materials
The materials used for these experiments were hydroxymethyl-3,4-
ethylenedioxythiophene (HM-EDOT), and β-cyclodextrin sulfated sodium (β-CDSS),
which were obtained from Sigma US. The potentiostat models used were 650A and 760B
from CH Instruments (Austin, Texas). All aqueous solutions were prepared in distilled
deionized bottled water (Sigma), DDI.
All the experiments are performed with a platinum flag counter electrode and a
Ag/AgCl (saturated KCl) reference electrode. The reference electrode has a standard
potential, and allows the potentiostat to determine the voltage and current relative to the
reference. The purpose of the counter electrode allows for current to pass through the
system between the working electrode (the gold chip) and the counter electrode. The
current is then measured with the potentiostat.
The chips used throughout these experiments had gold electrodes insulated with a
benzo-cyclobutene (BCB) layer. The chips were fabricated by other members of the
group, plasma cleaned, and stored in ultrapure 18.2 M�cm water before use. The
plasma cleaning was performed using a Harrick PDC-32G plasma cleaner, at a pressure
of 60 mTorr, using oxygen gas to generate the plasma that cleans the chips. Each chip is
plasma cleaned for fifteen minutes.
Characterization Chip #1 and Chip #2
Two chips were used for the electropolymerization experiments: Chip #1 and
Chip #2. Chip #1 was used to conduct a scan rate study on the bare gold electrodes before
and after polymerization, and Chip #2 was used to determine the change in capacitance

18
while keeping the scan rate constant. There were multiple electrodes on each chip, but of
slightly different dimensions. The dimensions of the electrodes on Chip #1 were: A =
0.20 cm x 0.40 cm, B = 0.20 cm x 0.20 cm, C = 0.20 cm x 0.20 cm, and D = 0.20 cm x
0.40 cm. The electrode dimensions for Chip #2 were: A = 0.20 cm x 0.30 cm, B = 0.20
cm x 0.20 cm, C = 0.20 cm x 0.20 cm, and D = 0.20 cm x 0.30 cm.
Chip #1, shown in Figure 1, was placed into a vial containing 20 mL of 0.1 M
KCl. The chip was characterized using a Ag/AgCl (saturated KCl) reference electrode
and a platinum flag counter electrode, with the bare gold serving as the working
electrode. A study of capacitance was performed using CV with the following
parameters: initial potential: 0.0 V; switching potential: 0.5 V, and sensitivity setting of 1
x 10-5 A. Each electrode was characterized using those parameters and with different
scan rates, and the resulting CV responses were used to determine the capacitance before
polymerization. The scan rates studied were 0.01 V/s, 0.05 V/s, 0.1 V/s, 0.5 V/s, and 1.0
V/s. The capacitance was also measured and monitored on another gold chip similar to
the one in Figure 1, Chip #2, however the scan rate was kept constant at 0.1 V/s. The
current density was calculated for a specific scan rate by assuming the current was similar
to a charging current and normalizing the electrode for area. The scan rate was kept
constant because there was not enough time to complete a full scan rate study.
Polymerization
Polymerization of the monomer to create a conducting polymer carried out using
a potentiostat and a three-electrode cell. To determine the best polymerization conditions,
four solutions were prepared and used to deposit polymer on four different electrodes on
the same chip. The first solution contained 0.01 M phosphate buffered saline (PBS), 0.01

19
M HM-EDOT, and 0.001 M β-Cyclodextrin sulfated sodium (β-CDSS) , which serves as
the solbulizer; the second solution contained 0.01 M PBS, 0.01 M HM-EDOT, and 0.01
M β-CDSS; the third solution contained 0.01 M HM-EDOT, 0.01 M β-CDSS, and water;
and the fourth solution contained 0.01 M HM-EDOT, 0.001 M β-CDSS, and water. Each
solution was sonicated for 1 h prior to polymerization. Electropolymerization was
performed through cyclic voltammetry, where each cycle consisted of the following
conditions: initial potential: 0.0 V, switching potential: 1.2 V, final potential: 0.0 V scan
rate: 0.005 V/s and sensitivity: 1 x 10⁻⁴ A. Each electrode was continuously cycled three
times for the deposition.
Using the polymerization solution that was found to give the largest change in
capacitance while using the simplest approach, the polymerization of HM-EDOT was
repeated several times to ensure the results were reproducible using the same
polymerization parameters that were used to deposit the polymer on the gold electrode
surface. The solution providing optimal results was the fourth solution because it resulted
in films with the greatest change in capacitance, it also allowed for less of the β-
cyclodextrin to be consumed during each polymerization since the concentration was
lower.
Characterization of Polymer Films
Following polymerization, the Chip #2 used to determine optimal conditions was
placed in 20 mL of 0.1 M KCl and the change in capacitance was calculated by keeping
the scan rate steady at 0.1 V/s. The scan rate study was repeated on the electrodes with
the modified surface to determine the change in capacitance due to polymerization on
Chip #1. Another study to determine the change in capacitance was performed at only

20
one scan rate, was repeated on Chip #2 after polymerization of the HM-EDOT in 0.1 M
KCl.
Results
Characterization of Chips Before Polymerization
The results of the scan rate study were graphed as current density versus scan rate,
which gives the capacitance as the slope of the line, according to Equation 1. The values
are reported in current density so that the results are normalized for area because the area
of the electrodes varies and the resulting current is dependent on area. The results must be
normalized for area so they can be directly compared. Figure 3 is an example of a graph
produced from the scan rate study before polymerization, and it shows the capacitance to
be 216 µF/cm2.
In order to determine the effect of the polymer on the electrode the equation
𝑖! = 𝑣𝐶!𝐴 (1)
is used to determine the current density and capacitance before and after polymerization,
which suggests the polymer properties, such as the accessibility of the polymer for
electron transfer events and the speed with which the polymer can transmit electrons
(conductivity), respectively. This equation is used to find the charging current of an
electrode, and in order to use this equation, it must be assumed that the current before and
after polymerization results from charging of the double layer at the electrode/solution
interface. The current can be treated as a charging current because it can be assumed that
the uncompensated resistance is negligible and the faradic resistance is infinite. Also,
although there are likely to be underlying faradaic processes occurring within the
polymer, the shape of the CV response and the dependence of current density on scan rate

21
are characteristic of double layer charging. Thus, this is the model that is used
throughout this thesis.
Figure 3. The current density versus scan rate for electrode C on Chip #1 before electropolymerization of HM-EDOT in 0.1 M KCl, giving the capacitance of the bare gold electrode as 216 µF/cm2 and an R2 value of 0.999.
The capacitance of each electrode before polymerization was determined by
graphing the data according to Equation 1, and the data are arranged into Table 1 to show
that there was no polymer on the surface of the electrode prior to polymerization because
the capacitance for a bare electrode is typically around 100 µF/cm2.
Table 1. The area and capacitance for characterization of each electrode on Chip #1 following the scan rate study in 0.1 M KCl
Electrode Area (cm2) Capacitance (µF/cm2)
A 0.080 115
B 0.040 43.5
C 0.040 216
D 0.080 103
y = 216x + 3.22 R² = 0.999
0.00E+00
5.00E+01
1.00E+02
1.50E+02
2.00E+02
2.50E+02
0 0.2 0.4 0.6 0.8 1 1.2
Current Density (uA/cm
^2)
Scan Rate (V/s)

22
The results of the capacitance study, using CV with a single scan rate, were used to
calculate the current density and capacitance for each electrode before polymerization
using Equation 1. The values that were calculated for current density and capacitance at a
scan rate of 0.1 V/s and are arranged into Table 2.
Table 2. The values for area, current density, and capacitance (± 1 standard deviation, N = 5 characterizations per electrode) for characterization of Chip #2 in 0.1 M KCl at a scan rate of 0.1 V/s before polymerization of HM-EDOT
Electrode Area (cm2) Current Density (µA/cm2)
Capacitance (µF/cm2)
A 0.060 11.0 ± 1.6 110 ± 16
B 0.040 9.9 ± 2.3 99± 23
C 0.040 9.8 ± 3.3 99 ± 33
D 0.060 11.1 ± 4.3 111 ± 43
The data use the values of current at the midpoint of the characterization (0.25 V
vs. Ag/AgCl) because that is the point where the current is the most consistently flat,
while also being a value that is kept constant throughout all the experiments.
Polymerization of HM-EDOT
The experiment using four different solutions to test optimal polymerization
conditions indicated that using water over PBS solution was more advantageous, and
resulted in more stable polymers, that did not fall off the electrode. The capacitance and
current densities for the polymers deposited in water were higher, illustrating that they
have the ability to conduct more current. Table 3 shows the results from the optimization
experiment.

23
Polymerization occurs when the monomer oxidizes and reacts with other
monomers, linking together and allowing it to deposit on the gold electrode surface.
There is some speculation that chemisorption of the sulfur in the thiophene moiety to the
gold surface helps in the adhesion of the polymer film that grows with every cycle.
Figure 4 shows the CV of a typical polymerization scan, showing all three cycles, with
growing charging current in the region 0.8 V to 0 V, with every cycle, indicative of a
growing thickness of the polymer.
Figure 4. A representative cyclic voltammogram of the polymerization of HM-EDOT on the gold surface of an electrode, with the three cycles overlaid on the scan. The first cycle is represented by the brown scan, the second cycle is the red scan, and the third cycle is the blue scan. It illustrates the oxidation occurring at the electrode surface when the polymer is deposited. Conditions: area = 0.080 cm2, scan rate = 0.005 V/s, solution: 0.001 M β-cyclodextrin sulfated sodium, 0.01 M HM-EDOT in water. The first scan shows a lower amount of current generated, as well as, a more positive potential before oxidation begins.

24
Because the third and fourth solutions yielded similar polymerization results, the
fourth one was chosen for use in the remaining experiments because it allowed for the
conservation of resources. The results of the subsequent polymerizations yielded visible
films on the electrode surface, such as those shown in Figure 5. The conducting polymer
of HM-PEDOT is shown on the surface of the gold electrodes as a dark blue film
covering the entire electrode surface.
Figure 5. The chip after the polymerization of HM-EDOT has occurred. The dark blue polymer film is present at the modified electrode surface. (The gold-colored features are the electrode leads that are insulated by BCB, and therefore cannot be polymerized.)
The figure shows an electropolymerized film completely covering each of the modified
electrode surfaces. This indicates that the film is stable with a good adherence to the gold
surface. The film is considered stable because it withstood multiple experiments of
A
B
C
D
Modified electrode surface
Contact Pads

25
cycling in pure electrolyte and multiple rinsings with water, and the electrochemical
activity did not deviate from day to day.
Characterization of Polymer Films formed from HM-EDOT
The chip containing the polymer films deposited with varying polymerization
solutions was characterized, and Equation 1 was used to determine the current density
and capacitance to indicate the best conditions for polymer deposition. The best
conditions were determined to be the one that produced the greatest increase in current
density and capacitance from before polymerization.
Table 3. Area, current density, and capacitance before and after polymerization for the experiment in which four polymerization solutions were used to determine optimal conditions Electrode Solution
Composition (with 0.1 M HM-EDOT in water)
Area (cm2)
Current Density Before (µA/cm2)
Current Density After (µA/cm2)
Capacitance Before (µF/cm2)
Capacitance After (µF/cm2)
A 0.01 M PBS 0.001 M β-CD
0.080 12.5 75.0 125 750
B 0.01 M PBS 0.01 M β-CD
0.040 7.50 18.8 75.0 188
C No PBS 0.01 M β-CD,
0.020 16.6 368 166 3680
D No PBS 0.001 M β-CD
0.080 24.9 413 249 4130
It is evident that the solutions without PBS as electrolyte produced films with higher
capacitances and current densities, therefore, those films can carry more current per unit
area. The presence of the polymer indicates that HM-EDOT is capable of being
electropolymerized. The conducting properties of the resulting polymer were further

26
explored using the same characterization procedure from before polymer deposition. The
results of the scan rate study of the polymer films were graphed, as before, as current
density versus scan rate. Figure 6 shows the graph for the same electrode shown in Figure
3 with capacitance shown as the slope of the graph.
Figure 6. The graph of current density versus scan rate for Electrode C of Chip#1 after polymerization of HM-EDOT, in 0.1 M KCl resulting in a capacitance of 19.1 mF/cm2. The R2 value was 0.957.
Comparing the two graphs and their slopes, it is evident that the capacitances before and
after polymerization greatly differ. The original capacitance of the bare gold was 216
µF/cm2, and the capacitance after polymerization is 191 µF/cm2. The results for all the
electrodes on Chip #1 are given in Table 4. Also, it appears that the data do not fit the
model of a line as well with the polymer, suggesting that other processes, such as faradaic
ones that involve mass transfer limitations for charge compensation, are also playing a
role.
y = 19100x + 1410 R² = 0.957
0.00E+00
5.00E+03
1.00E+04
1.50E+04
2.00E+04
2.50E+04
0 0.2 0.4 0.6 0.8 1 1.2
Current Denisty (uA/cm
^2)
Scan Rate (V/s)
27
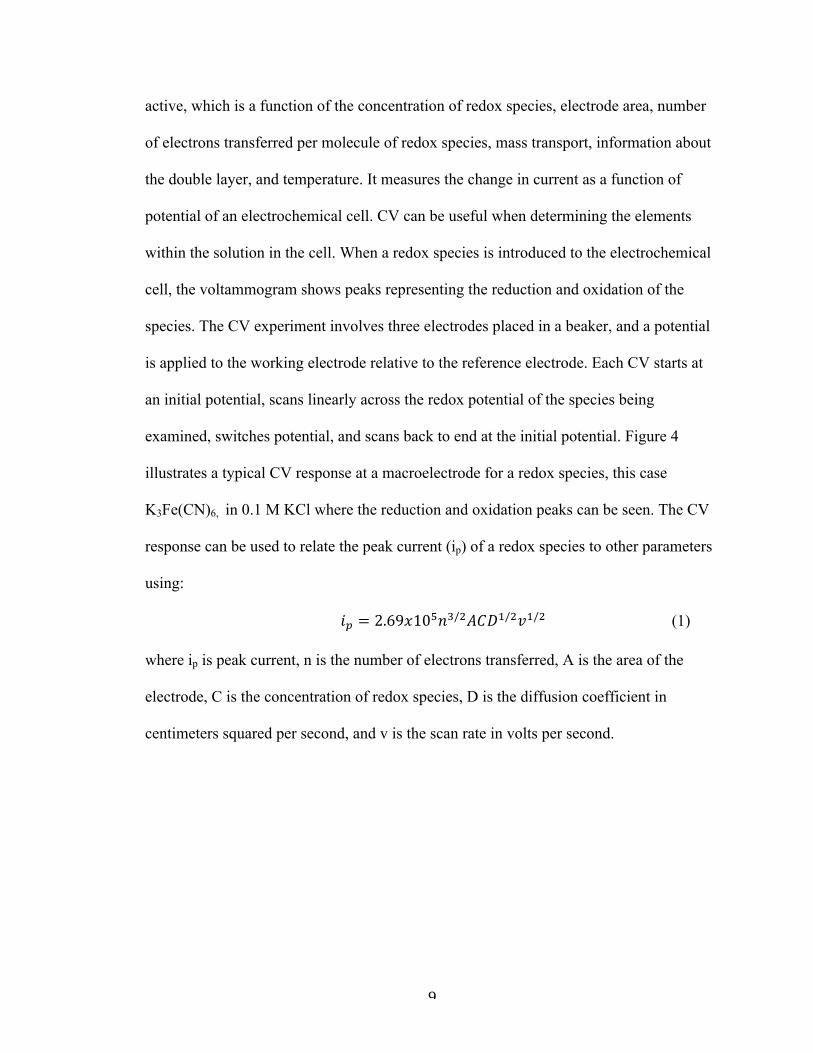
Table 4. The area and capacitance for characterization of each electrode on Chip #1 following the scan rate study in 0.1 M KCl after polymerization of HM-EDOT
Electrode Area (cm2) Capacitance (µF/cm2)
A 0.080 7440
B 0.040 12900
C 0.040 19100
D 0.080 9660
The results indicate that the capacitance of Chip #1 greatly increased due to the
electropolymerization of the HM-EDOT. The results from this experiment are
reproducible because the large change in capacitance was seen following each
polymerization. The large variation seen between electrode sizes could have been due to
mass transport. The smaller electrodes have a limited amount of space for the electrons to
flow through the interface at the electrode surface. The modified electrode surface is
capable of carrying more current than the bare gold electrode. Another way to show the
increase in current due to the electropolymerization is to overlay the cycle
voltammograms of the characterization of the electrodes in 0.1 M KCl before and after
polymerization.

28
Figure 7. A representative cyclic voltammogram of an overlay of the charging current of an electrode in 0.1 M KCl before and after polymerization. The polymerization of HM-EDOT greatly increases the charging current of the bare gold electrode. The blue scan is the scan of the charging current before the electropolymerization, and the red scan is the charging current after the electropolymerization. Conditions: area = 0.080 cm2, scan rate = 0.1 V/s, solution = 0.1 M KCl.
As seen in Figure 7, the blue scan around zero Amperes throughout the whole scan is the
charging current of the electrode before the electropolymerization, and the red scan is
after the polymerization. The large increase in charging current shows the modified
electrode surface is capable of carrying much larger amounts of current, therefore, better
suited to transfer electrons between the gold surface and the polymer. The capacitance
study, that was repeated using a steady scan rate, gave similar results, which are shown in
Table 5.

29
Table 5. The values for area, current density, and capacitance for characterization of Chip #2 in 0.1 M KCl at a scan rate of 0.1 V/s after polymerization of HM-EDOT
Electrode Area (cm2) Current Density (µA/cm2)
Capacitance (µF/cm2)
A 0.060 1100 ± 26 10960 ± 260
B 0.040 1080 ± 78 10790 ± 780
C 0.040 1120 ± 25 10940 ± 250
D 0.060 1090 ± 63 10880 ± 630
The values for current density and capacitance before and after electropolymerization can
be directly compared between electrodes because the electrodes have been normalized for
area. The values seen in the table are reproducible following the same polymerization
conditions.
Conclusion
The data suggest that the electropolymerization of HM-EDOT produce a robust
and stable film on the electrode surface because the polymers produced are not easily
removed from the electrode surface. The large increase in current density and capacitance
is due to the deposition of the polymer film. The addition of the polymer increases the
size of the electrode, as well as its conducting properties allowing for more electrons and,
therefore, current to flow through to the electrode surface.
The ability of the HM-EDOT to be electropolymerized is important for the future
because the functional alcohol group allows for the conjugation and further derivatization
of the monomer. The HM-EDOT can also be deposited and electrochemically stable in
aqueous solutions, which is vital for the possible production of biofuel cells. Also, it is

30
hopeful that HM-EDOT can be used for biological purposes since much of the human
body functions in an aqueous environment.
The success of the polymerization of HM-EDOT allows for the continuation of
the project to conjugate the enzyme horseradish peroxidase (HRP) to the conducting
polymer and working toward the future development of enzymatic biofuel cells.

31
References
1Xiao, Yinghong, Cui, Xinyan, Hancock M, Jessica. Electrochemical polymerization of poly(hydroxymethylated-3,4-ethylenedioxythiophene) (PEDOT-MeOH) on multichannel neural probes. Sensors and Actuators. 99: 437-443. 2 Kros A, Sommerdijk NAJM, Nolte RJM. Poly(pyrrole) versus poly(3,4- ethylenedioxythiophene): Implications for biosensor applications. Sensors Actuators B: Chem 2005 /4/29/;106(1):289-95.

32
Chapter III: Synthesis and Electropolymerization of COOH-EDOT
Introduction
The characterization of the polymer of hydroxymethyl-3,4-
ethylenedioxythiophene (HM-EDOT) showed that the derivative of EDOT greatly
increased the current and capacitance of the modified electrode. Adding an enzyme to a
conducting polymer, such as PEDOT, with the addition of a mediator, can help catalyze
the oxidations and reductions in a biofuel cell.1 The enzyme being used in these
experiments is horseradish Peroxidase (HRP), which contains a heme group as the
catalytic site. HRP is activated by hydrogen peroxide, H2O2, as the H2O2 removes
electrons, oxidizing the HRP. This allows the HRP to then oxidize other substrates by
removing electrons. The activity of HRP can be easily detected when combined in
solution with H2O2 and 3,3’,5,5’-tetramethylbenzidine (TMB) because after the activation
of the HRP, the HRP then oxidizes the TMB, and the oxidized form of TMB has a visual
color change and absorbs light at 450 nm. The structure of HRP is shown in Figure 1, and
it can be seen that HRP contains a heme group surrounded by a porphyrin ring and α-
helices around the catalytic center.2 The lysine groups of the HRP are highlighted in blue
because they are integral in the conjugation of the enzyme to other molecules through
amide bonds.

33
Figure 1. An image of the enzyme HRP. The α-helices are seen surrounding the heme group at the center within the porphyrin ring. The lysine residues are highlighted in blue and are important in enzyme conjugation.3
In order for the enzyme to be conjugated to the conducting polymer, a monomer with an
organic tether and more accessible functional group had to be synthesized. A carboxylic
acid form of 3,4-ethylenedioxythiophene (COOH-EDOT) was synthesized from the HM-
EDOT using succinic anhydride.4 The succinic anhydride and HM-EDOT are mixed with
dimethyl-aminopyridine (DMAP) and triethylamine (Et3N) in dichloromethane. Figure 2
shows a reaction schematic.
Figure 2. The synthesis of COOH-EDOT from HM-EDOT, succinic anhydride, DMAP,
Et3N, and dichloromethane.

34
The synthesis of COOH-EDOT allows for conjugation of the enzyme to the
polymer backbone because it has the ability to become an activated ester that can easily
bind to primary amine groups, like those in lysine. The COOH-EDOT is integral in the
development of possible biofuel cells because it can electropolymerized and used for the
immobilization of the enzyme HRP.
The polymerization of the COOH-EDOT was performed using a chip with a
microelectrode array because in the future it will allow for two electrodes to be used as a
possible biofuel cell. Figure 3 shows an example of a chip with the microelectrode array,
which contains sixteen microelectrodes that are 50 µm wide with 50 µm gaps between
electrodes. Each electrode has an area of 0.10 mm2.
Figure 3. Example of the chip containing the microelectrode array that has electrodes that are 50 µm wide with 50 µm gaps, and 2 mm long electrodes.
1!
100 �m
Edge of insulating film that protects leads of electrodes from solution
Contact pads
2.5 cm
Counter
Quasi-reference electrode
Array region 16 bands: 2 mm long 25, 50, 100 µm wide 25, 50, 100 µm gaps
Leads
Expanded view of array region of one type of design: 50-µm wide electrodes x 50-µm gaps
Example of microfabricated electrodes on a silicon chip

35
Experimental
Materials
The materials used in these experiments were HM-EDOT, succinic anhydride,
DMAP, Et3N, and acetonitrile. All materials were received from Sigma US. The
potentiostat models used were CHI760B and CHI650A from CH Instruments (Austin,
Texas).
The electropolymerization of COOH-EDOT, as well as all characterizations, were
done using a platinum flag counter electrode and a Ag/AgCl (saturated KCl) reference
electrode.
The chips containing the microelectrode array were microfabricated by others
within the research group, and then plasma cleaned using a Harrick PDC-32G model for
fifteen minutes at a pressure of 60 mTorr, which uses oxygen gas to generate an oxygen
plasma that cleans the chips. They were then stored in 18.2 MΩ water before use.
Synthesis of COOH-EDOT The synthesis of COOH-EDOT was performed by combining the HM-EDOT and
dry dichloromethane (using aluminum oxide) in a three-neck round bottom flask that had
been thoroughly evacuated with nitrogen gas (N2). The solution is stirred on a magnetic
stir plate and kept under N2 atmosphere throughout the reaction. In another vial, the
succinic anhydride, DMAP, Et3, and dry dichloromethane are combined and mixed.
Using a syringe the solution is injected drop-wise through a rubber septum into the round
bottom flask. The mixture is stirred and kept under N2 at room temperature overnight.
The product of the synthesis was then transferred to a conical vial, and washed
with 10% hydrochloric acid (HCl) by mixing the phases five times, and extracting the

36
aqueous phase. It was then washed three times with saturated NaCl solution, extracting
the aqueous phase after each wash. The organic phase was dried with magnesium sulfate
(MgSO4) by adding MgSO4 to the vial until there was no clumping and waiting five
minutes. The product was filtered, using glass pipets and glass wool, into a new conical
vial and dried again with MgSO4 for ten minutes. The final product is transferred into a
clean vial after filtering the MgSO4, and the solvent was evaporated under N2 gas until a
yellow honey-like substance remained. To determine successful synthesis, a small
amount of product was combined with deuterated chloroform and a nuclear magnetic
resonance (NMR) was taken. In addition to NMR, infrared (IR) spectroscopy, and mass
spectrometry are used to determine a successful synthesis.
Characterization of Microelectrode Array Before Polymerization
The chip containing the microelectrode array, Chip #3, was characterized in 6 mL
of a solution containing 50% water and 50% acetonitrile with 0.1 M lithium perchlorate
(LiClO4) as the electrolyte prior to polymerization using a scan rate study. The
characterization conditions were: initial potential: 0.0 V, switching potential: 0.5 V, and
sensitivity: 1 x 10⁻⁷ A. The scan rates used were: 0.01 V/s, 0.05 V/s, 0.1 V/s, 0.5 V/s, and
1.0 V/s.
Polymerization of COOH-EDOT
The polymerization of COOH-EDOT was performed in aqueous conditions using
a mixture of acetonitrile and water (1:1) with 0.1 M LiClO4 as electrolyte5. A small
amount of the COOH-EDOT was added to the vial. The microelectrode array was
immersed in solution and the conditions for polymerization were: initial potential: 0.0

37
V,high potential: 1.2 V, scan rate: 0.005 V/s and sensitivity: 1 x 10⁻⁷ A. Each electrode
was cycled six times for the deposition.
Characterization of Microelectrode Array After Polymerization
The chip containing the microelectrode array was characterized in 50% water and
50% acetonitrile with 0.1 M LiClO4 as electrolyte after polymerization, using a scan rate
study. The characterization conditions were: initial potential: 0.0 V, high potential: 0.5 V,
and sensitivity: 1 x 10⁻⁷ A. The scan rates used were: 0.01 V/s, 0.05 V/s, 0.1 V/s, 0.5 V/s,
and 1.0 V/s.
Results
Synthesis of COOH-EDOT
After the completion of the COOH-EDOT synthesis reaction, a sample of the
product was used in order to obtain an NMR scan to determine if the desired product was
synthesized. The proton NMR for HM-EDOT was also obtained in order to compare the
peaks to that of the COOH-EDOT. The HM-EDOT 1H NMR is shown in Figure 4, which
shows a complex set of peaks around 4.0 ppm that may be attributed to the protons in the
ethylene groups and the hydrogens in the methyl functional group. The peaks around 6.1
ppm and 6.2 ppm are representative of the hydrogen atoms within the thiophene ring near
the sulfur. The solvent chloroform-d is seen in the large peak at 7.2 ppm, and acetone is
the large peak near 2.0 ppm.

38
Figure 4. The proton NMR for HM-EDOT where the peaks at 4.0 ppm are the protons in the ethylene groups and the methyl group, the peaks 6.1 ppm and 6.2 ppm represent the hydrogens within the thiophene ring, and the peak at 7.0 ppm is from the chloroform-d solvent. The large peak at 2.0 ppm is due to acetone that was used to rinse the NMR tube.
The 1H NMR for the product showed a unique peak at 2.6 ppm that represents the protons
between the carbonyl groups in the organic tether. The addition of the organic tether also
caused the proton signal for the thiophene ring to shift to 4.1 ppm. The peak near 5.3 ppm
is due to excess dichloromethane in the product. Figure 5 shows the NMR for the COOH-
EDOT synthesis product.
1.52.02.53.03.54.04.55.05.56.06.57.0 ppm
5.00
0.14
0.52
PC 1.00GB 0LB 0.30 HzSSB 0WDW EMSF 400.1300468 MHzSI 32768F2 − Processing parameters
SFO1 400.1324710 MHzPL1W 34.18402863 WPL1 −3.90 dBP1 10.00 usecNUC1 1H======== CHANNEL f1 ========
TD0 1D1 5.00000000 secTE 292.3 KDE 6.50 usecDW 60.800 usecRG 144AQ 3.9845889 secFIDRES 0.125483 HzSWH 8223.685 HzDS 0NS 16SOLVENT CDCl3TD 65536PULPROG zgPROBHD 5 mm PABBO BB−INSTRUM spectTime 9.33Date_ 20150128F2 − Acquisition Parameters
PROCNO 1EXPNO 1NAME 1H_400_BenJones_012815_HM−EDOTCurrent Data Parameters
6.16.26.3 ppm
0.139
0.521

39
Figure 5. The H+ NMR spectrum for COOH-EDOT, where the peak at 2.6 ppm is representative of the hydrogens between the carbonyl groups in the tether. The peaks at 4.0, 4.1, and 4.3 ppm are due to the protons within the thiophene ring and the ethylene groups. The peak at 5.3 ppm is due to excess dichloromethane, and the peak at 6.3 ppm is due to the NMR solvent, chloroform-d.
The peak at 2.6 ppm has an integration of 4.00, which coordinates with the hydrogens
between the carbonyls suggesting that the synthesis was a success. The product of the
synthesis was also determined using infrared resonance spectroscopy (IR). The spectra
for HM-EDOT and COOH-EDOT were overlaid and are shown in Figure 6. It shows that
both molecules contain similar bands and stretches within the IR, except the COOH-
EDOT has an extra band near 1750 cm-1, which is indicative of the stretch of a carbonyl.
3.03.54.04.55.05.56.0 ppm
4.00
7.47
0.09
1.11
PC 1.00GB 0LB 0.30 HzSSB 0WDW EMSF 400.1300468 MHzSI 32768F2 − Processing parameters
SFO1 400.1324710 MHzPL1W 34.18402863 WPL1 −3.90 dBP1 10.00 usecNUC1 1H======== CHANNEL f1 ========
TD0 1D1 5.00000000 secTE 292.3 KDE 6.50 usecDW 60.800 usecRG 144AQ 3.9845889 secFIDRES 0.125483 HzSWH 8223.685 HzDS 0NS 16SOLVENT CDCl3TD 65536PULPROG zgPROBHD 5 mm PABBO BB−INSTRUM spectTime 12.11Date_ 20150127F2 − Acquisition Parameters
PROCNO 1EXPNO 1NAME 1H_400_BenJones_012715_COOH−HMEDOTCurrent Data Parameters
4.04.14.24.3 ppm
3.925
3.942
3.955
3.972
4.112
4.117
4.141
4.146
4.238
4.244
4.248
4.251
4.254
4.260
4.264
4.275
4.280
4.284
4.289
7.47
2.552.602.65 ppm
2.603
2.606

40
Functional Group Wavenumber Peak
Carboxylic acid (COOH) 1719 cm-1 Ester (OCO) 1750 cm-1
Alkene (=C-H) 3059 cm-1 Alkane (C-H) 2950 cm-`
Figure 6. The IR spectra of HM-EDOT overlaid with COOH-EDOT that shows they have similar molecular elements except for the stretch around 1750 cm-1. The table indicates the peaks of the major functional groups within the molecules.
The presence of the unique band near 1750 cm-1 represents a carbon that is double
bonded to an oxygen, like those in carboxylic acids. This shows that the synthesis product
is the expected product, COOH-EDOT. One last way to determine the purity of the
synthesis product was for an electrospray ionization mass spectrometry scan (EIS) to be
performed. This allows the product to be ionized, and the spectrum shows the molecular
mass of the injected molecule when protons have been added. As seen in Figure 7, the
molecular mass of the product when protonated is 273 g/mol, which is what is expected
when calculated.

41
Figure 7. The ESI spectrum for COOH-EDOT, which shows that the molecular mass of product when protonated is 273 g/mol, which is the expected mass of COOH-EDOT.
Characterization of the Microelectrode Array before Polymerization
The scan rate study results for the electrode used in polymerization were graphed
by current density versus scan rate. The slope of the graph gives the capacitance for the
electrode, indicating the amount of electrochemical energy that can be stored. The results
are graphed using the equation
𝑖! = 𝑣𝐶!𝐴 (1)
which can be used to determine the double layer capacitance. This equation can be used
because it is assumed that the current produced during cyclic voltammetry (CV) is similar
to that of a charging current, that the uncompensated resistance is negligible, and that the
faradic resistance is infinite. The graph of an electrode before polymerization is shown in
Figure 8, and the capacitance calculated is 45.1 µF/cm2. The capacitance would be equal
150 200 250 300 350 400 450 500 550 600 650 700 750 m/z0.00
0.25
0.50
0.75
1.00
1.25
1.50
1.75
2.00
2.25
2.50
2.75
3.00
3.25
3.50
3.75
4.00
4.25
4.50
4.75
5.00
5.25
5.50
5.75
6.00
6.25
6.50
6.75
7.00
Inten. (x1,000,000)
273.0
295.1
583.0
197.1
313.0217.6
567.1
409.0368.0 428.1
545.1
Arkansas Statewide Mass Spectrometry Facility
ESI Mass SpectrumSample Name: final productSample id#: 982275Instrument: Shimadzu 8040
2/5/2015
[M+H]+
[M+Na]+
[M+K]+
7.4 min
[2M+H]+
[2M+Na]+
[2M+K]+

42
to 45.1 µF/cm2, which indicates that the electrode has no prior modification before
polymerization.
Figure 8. The graph of current density versus scan rate before polymerization, showing that the capacitance of the electrode is 45.1 µF/cm2. The characterization was done in a 50% acetonitrile, 50% water solution containing 0.1 M LiClO4. The R2 value was 0.997.
The characterization of the electrode in the microelectrode array also ensured that there
was no modification to the electrode surface prior to polymerization.
Polymerization of COOH-EDOT
The electropolymerization of COOH-EDOT was unsuccessful in the
acetonictrile/H2O (1:1) mixture. Organic solvents were used for the electropolymerization
because polymerization was unsuccessful in aqueous conditions. The use of organic
solvents was decided because after the synthesis, the product is dissolved in the organic
phase. The CV of the electropolymerization is shown in Figure 9, which indicates that
there was an oxidation occurring at the electrode surface.
y = 45.1x + 3.2 R² = 0.997
0.00E+00
1.00E+01
2.00E+01
3.00E+01
4.00E+01
5.00E+01
6.00E+01
0 0.2 0.4 0.6 0.8 1 1.2
Current Density (uA/cm
^2)
Scan Rate (V/s)

43
Figure 9. The overlay of the six polymerization cycles for deposition of COOH-EDOT. There is evidence of an oxidation occurring due to the peak near 1.0 V. The blue scan represents the first cycle, red is the second cycle, brown is the third cycle, teal is the fourth cycle, navy is the fifth cycle, and green is the sixth cycle. Conditions: area = 0.10 mm2, scan rate = 0.005 V/s, solution = acetonitrile/water (1:1), 0.1 M LiClO4, and 0.01 M COOH-EDOT.
While there was an oxidation occurring during the deposition, there was no visible
appearance of a polymer on the electrode surface after electropolymerization. A thin film
may have developed on the surface, but it was not visible. In order to determine if any
polymer deposited on the surface, characterization of the electrode was repeated.
Characterization of the Microelectrode Array after Polymerization
The scan rate study was repeated on the electrode used for electropolymerization,
and the results were graphed as before. Figure 10 shows the graph of current density
versus scan rate of the electrode with the capacitance as the slope. The capacitance was
found to be 34.1 µF/cm2.

44
Figure 10. The graph of current density versus scan rate after polymerization, showing that the capacitance of the electrode is 34.1 µF/cm2. The characterization was done in a 50% acetonitrile, 50% water solution containing 0.1 M LiClO4. The R2 was 0.988.
The graph indicates that there was a decrease in the capacitance after the attempted
polymerization. The means the amount of energy that can be held within the system
decreased after the attempted electropolymerization. The flow of electrons through the
system also decreased shown by the overall decrease in current density. This can also be
seen when the charging current of the electrode in electrolyte before polymerization is
overlaid with charging current after polymerization, as shown in Figure 11. The decrease
in capacitance could have been caused by insulation of the carboxylic acid groups, which
would not allow a charge to build up at the double layer. A thin polymer may have
developed at the electrode surface, however there was no visible sign of the polymer. The
lack of polymer does not mean it is not there, it just indicates further tests and
experimentation would need to be performed in order to confirm if there is a polymer at
the electrode surface.
y = 34.1x + 2.6 R² = 0.988
0
5
10
15
20
25
30
35
40
0 0.2 0.4 0.6 0.8 1 1.2
Current Density (uA/cm
^2)
Scan Rate (V/s)

45
Figure 11. The overlay of the current before and after polymerization in a acetonitrile/H2O (1:1) solution with 0.1 M LiClO4 as electrolyte. The blue scan is the current after polymerization, and the red scan is before polymerization. Conditions: area = 0.10 mm2, scan rate = 0.1 V/s, solution = acetonitrile/water (1:1), 0.1 M LiClO4.
The blue scan is the current after polymerization further emphasizing that the current
density and capacitance decreased after the attempted electropolymerization of COOH-
EDOT.
The main factor in determining that minimal deposition occurred was the lack of a
visible polymer. A thin polymer may have developed from the electropolymerization
since there is an oxidation occurring at the electrode surface, which would account for the
decrease in capacitance. If no polymer was present, then the capacitance should have
stayed the same, but the decrease indicates some insulation due to the carboxylic acid
groups. Since there is no visible evidence of the polymer, the project cannot be continued
until it can be confirmed.

46
Conclusion
The synthesis of COOH-EDOT was a success as shown by the NMR, IR, and
EIS, and it is an important step because it allows a product that is commercially available
to be used toward the development biofuel cells. The COOH-EDOT allows for the
covalent attachment of an enzyme to the conducting polymer through the reactive
carboxylic acid group, and the organic tether allows the enzyme to be close enough to the
polymer to retain its catalytic activity without compromising its shape. The
polymerization of COOH-EDOT, while unsuccessful thus far, is an integral step because
it must be done before the conjugation of HRP to the polymer backbone. Further studies
and conditions for the electropolymerization of COOH-EDOT will need to be conducted
to determine the proper conditions to achieve a stable polymer.
The future work of this project is to conjugate the HRP to the conducting
polymer. The conjugation of the enzyme to the conducting polymer will be done by
using 1-ethyl-3-(3-dimethylaminopropyl)carbodiimide (EDC) to create an active ester
complex. Then, N-hydroxysulfosuccinimide (sulfo-NHS) will be added to reaction, which
protects the active ester and is also a good leaving group. The lysine residues in the HRP
contain primary amine groups that will react with the active ester, forming an amide
bond, and the sulfo-NHS will leave. Figure 12 illustrates the reaction between the
EDC/NHS and the COOH-EDOT to form an amide bond with the HRP.

47
Figure 12 The conjugation reaction of the COOH-EDOT polymer to HRP using EDC/NHS, which will form an amide linkage between the HRP and EDOT.
After the conjugation of the HRP to the conducting polymer, an enzyme assay will be
performed to determine if the enzyme has retained activity after the conjugation. Once
catalytic activity is established, it can be used toward the production of an enzymatic
biofuel cell because the HRP will catalyze reactions at either the anode or cathode of a
cell.

48
References
1 Barton, S. C., Gallaway, J., Atanossav, P. Enzymatic Biofuel Cells for Implantable and
Microscale Devices. Chem. Rev. 2004, 104. 4867-4886.
2 Veitch, Nigel, C., Horseradish Peroxidase: a Modern View of a Classic Enzyme.
Phytochemistry. 2004, 249-259.
3 Berlung, G. I., Carlsson, G. H., Hajdu, J. Smith, A. T. Structure of Horseradish
Peroxidase C1A Compound I. Nature: 417. 463
4 Luo, S. C., Ali, E. E., Tansil, N. C., Yu, H., Gao, S., Kantchev, E. A. B., Ying, J. Y.,
Poly(3,4-ethylenedioxythiophene) (PEDOT) nanobiointerfaces: thin, ultrasmooth,
and functionalized PEDOT films with in vitro and in vivo biocompatibility.
Langmuir: the ACS journal of surfaces and colloids. 2008. 8071-8077.
5 Hiller, Markus, Kranz, Christine, Huber, Johanna. Amperometric biosensors
produced by immobilization of redox enzymes at polythiophene-modified
electrode surfaces. Advanced Materials. 1996. 8: 219-222.

49
Chapter IV: Conclusion
The electropolymerization of HM-EDOT into stable, robust polymers, illustrated
by the large increase in current density and capacitance, is important because it is a
building block for future research. The HM-EDOT is a stepping-stone for the production
of other monomers, such as COOH-EDOT, that can be used for conjugation to molecules
important for biofuel cells, like enzymes or mediators. The successful synthesis of
COOH-EDOT from HM-EDOT illustrates the impact of HM-EDOT and its function
group, because it allows for a new monomer with a more reactive functional group and an
organic tether to be produced.
While unsuccessful, the attempted polymerization of COOH-EDOT indicates that
the monomer does not form a polymer under aqueous conditions, which are integral in
the production of biofuel cells. The next step in this research is to determine the optimal
electropolymerization conditions for the COOH-EDOT that produces a stable polymer.
Once a stable polymer can be generated, the conjugation of the HRP to the polymer
backbone can be completed using EDC/NHS, and then the enzyme can be assessed for
activity using an enzyme assay. If the catalytic activity of the HRP is relatively
unchanged when conjugated to the polymer, then half of a biofuel cell has been produced.


![Patterning of Poly(3,4-Ethylenedioxythiophene): … · 2015. 3. 29. · most rubbin another orga which is co variety of c h Poly(Styrene calibrated ratory (NREL ewhere [18] here](https://img.dokumen.tips/doc/110x75/604e2ed0421cd677a907609e/patterning-of-poly34-ethylenedioxythiophene-2015-3-29-most-rubbin-another.jpg)