Embed Size (px)
Citation preview
Aeolian Research 16 (2015) 153–162
Contents lists available at ScienceDirect
Aeolian Research
journal homepage: www.elsevier .com/locate /aeol ia
Derivation of an observation-based map of North African dust emission
http://dx.doi.org/10.1016/j.aeolia.2015.01.0011875-9637/� 2015 Elsevier B.V. All rights reserved.
⇑ Corresponding author.E-mail address: [email protected] (A.T. Evan).
1 Present address: Karlsruhe Institute of Technology, 76131 Karlsruhe, Germany.
Amato T. Evan a,⇑, Stephanie Fiedler b,1, Chun Zhao c, Laurent Menut d, Kerstin Schepanski e,Cyrille Flamant f, Owen Doherty a
a Scripps Institution of Oceanography, University of California San Diego, La Jolla, CA, USAb School of Earth and Environment, University of Leeds, LS2 9JT Leeds, UKc Atmospheric Sciences and Global Change Division, Pacific Northwest National Laboratory, Richland, WA, USAd Sorbonne Universités, UPMC Univ Paris 06, CNRS & UVSQ, UMR 8190 LATMOS, Paris, Francee Leibniz Institute for Tropospheric Research, Leipzig, Germanyf Laboratoire Atmosphère, Milieux, Observations Spatiales, UMR 8190, CNRS, Sorbonne Université, UPMC and UVSQ, Paris, France
a r t i c l e i n f o a b s t r a c t
Article history:Received 8 July 2014Revised 1 January 2015Accepted 2 January 2015
Keywords:EmissionModelsSatelliteAfrica
Changes in the emission, transport and deposition of aeolian dust have profound effects on regional cli-mate, so that characterizing the lifecycle of dust in observations and improving the representation of dustin global climate models is necessary. A fundamental aspect of characterizing the dust cycle is quantify-ing surface dust fluxes, yet no spatially explicit estimates of this flux exist for the World’s major sourceregions. Here we present a novel technique for creating a map of the annual mean emitted dust flux forNorth Africa based on retrievals of dust storm frequency from the Meteosat Second Generation SpinningEnhanced Visible and InfraRed Imager (SEVIRI) and the relationship between dust storm frequency andemitted mass flux derived from the output of five models that simulate dust. Our results suggest that64 (±16)% of all dust emitted from North Africa is from the Bodélé depression, and that 13 (±3)% of theNorth African dust flux is from a depression lying in the lee of the Aïr and Hoggar Mountains, making thisarea the second most important region of emission within North Africa.
� 2015 Elsevier B.V. All rights reserved.
1. Introduction
By mass, aeolian dust is the most pervasive aerosol on the pla-net, and the largest fraction of all global dust emission is in NorthAfrica (e.g. Engelstaedter et al., 2006; Ginoux et al., 2006). Africandust emission and transport is both affected by—and affects—theclimate. For example, previous work has shown there is an increasein dust emission and transport over the Atlantic during periods ofSahelian drought (Prospero and Lamb, 2003) due to a decrease insoil moisture over the Sahel (Cowie et al., 2013), increased surfacewind speeds over the Sahara (Ridley et al., 2014), or some combi-nation of the two (Doherty et al., 2014). Once transported overthe Atlantic, direct radiative forcing by dust both warms the atmo-sphere and cools the surface (Evan and Mukhopadhyay 2010), con-tributing interannual to decadal scale variability of tropicalAtlantic sea surface temperatures (Evan et al., 2012) and excitingcoupled modes of equatorial variability (Evan et al., 2009, 2011).
The influence of these aerosols on the climate system extendswell beyond the direct radiative effect. Recent work has shown
that African dust may influence clouds as far away as the westcoast of the United States, providing ice nuclei required for precip-itation in so-called atmospheric rivers (Creamean et al., 2013).Aeolian dust contains nitrogen, phosphorus and iron, all of whichare required for primary productivity in oceanic and terrestrialecosystems, and there is a large body of work demonstrating theimportance of the atmospheric input of these elements via dusttransported from western Africa (Das et al., 2013; Okin et al.,2011; Mahowald et al., 2010).
In order to improve understanding of dust-climate effects it isnecessary to elucidate surface and atmospheric processes govern-ing emission. However, the vast majority of North African dustemission occurs within largely uninhabited regions and thus thereis a paucity of both meteorological and surface observations inthese locations, particularly homogeneous measurements of eachthat span time scales of years to decades. As a result, numericalmodels play a crucial role in this field of study, yet there are rela-tively few observational data sets against which model output canbe validated, and as a result model output is often validated againstsurface visibility observations and retrievals of aerosol opticaldepth from satellites and ground-based instrumentation—none ofwhich are direct measures of dust—and surface concentrationsfrom a limited number of sampling stations (e.g., Ginoux et al.,
154 A.T. Evan et al. / Aeolian Research 16 (2015) 153–162
2001; Huneeus et al., 2010; Tegen and Miller, 1998; Todd et al.,2008).
Given the lack of observations it is not surprising that recentstudies have identified issues with the representation of the dustcycle in models. Kok (2011) evaluated the emitted size distributionof dust within several climate models, finding that all of the mod-els underestimated the number of large particles emitted and thusthe emitted mass flux, in agreement with earlier findings byCakmur et al. (2006). Evan et al. (2014) examined dust in ClimateModel Intercomparison Project Phase 5 (CMIP5) models, corrobo-rating the findings of Kok (2011) and finding that, when forcedby observed sea surface temperatures, models cannot reproducehistorical year-to-year variability in cross-Atlantic dust transport,as determined by satellite data and paleo-proxy data. Furthermore,considering soil characteristics, Kok et al. (2014) found that amajority of models underestimate dust emissions sensitivity tothe soil erodibility, i.e. the ability of the soil to emit dust for a givenabove-threshold friction velocity (definition following Kok et al.,2014; Zender et al., 2003).
In the present paper we attempt to address the need for moreobservational records against which models can be evaluated bycreating a spatially explicit map of annual dust emission usingdata from the Meteosat Second Generation Spinning EnhancedVisible and InfraRed Imager (SEVIRI). The remainder of this paperis organized as follows. In Section 2 we describe the models andsatellite data used in this study. In Section 3 we compare the spa-tial structure of emission amount and emission frequency amongthe models, and define a statistical relationship between thetwo. In Section 4 we use this statistical relationship to derivethe new observational climatology of dust emission amounts.We conclude in Section 5 with a summary of the main results ofthe paper.
2. Models and satellite data
In this paper we examine dust emission amount and frequencyof events using one year of output from four regional models cen-tered over North Africa and one global climate model. A summaryof the models considered here and some of their relevant featurescan be found in Table 1.
2.1. Satellite data
15-min IR dust index images calculated from brightnesstemperatures at 8.7 lm, 10.8 lm and 12.0 lm observed by SEVIRIMSG satellite are used inferring dust source activation frequenciesover North Africa for the period March 2006–February 2010(Schepanski et al., 2007, 2012). As the images are availablethroughout day and night, dust source activation events were
Table 1Overview of model characteristics. Shown here are models’ dust emission scheme types anand model output data time resolution. All dust output fields are instantaneous.
Model Dust emission Boundaries
TEGEN Offline, 3 bins Tegen et al. (2002) ERA-Interim fore
WRF-GOCART Online, 3 mode Zhao et al. (2013) Forced everywhe
WRF-Kok Online, 3 mode Kok et al. (2014)
CESM Online, 3 bins Mahowald et al. (2006) N/A
CHIMERE Online, 9 bins (0.039–40 lm), saltationand sandblasting, Menut et al. (2013)
N/A
identified at sub-daily (hourly) resolution and geo-located bytracking back dust plumes individually to their point of origin,which is assumed to be the dust source and recorded on a 1 � 1map. It is noted that no dust sources can be spotted under opticalthick clouds or dust plumes. Due to the 15-min resolution of thenative dust index images information on the diurnal cycle of dustsource activation events can be retrieved, allowing for a relativelyprecise location of dust sources (Schepanski et al., 2012). Com-pared to an automated detection of dust plumes (Ashpole andWashington 2013), the manual identification by Schepanski et al.(2009) is likely less prone to systematic errors. Furthermore, theresults from Ashpole and Washington do not cover all of NorthAfrica, which is required for this study. The Schepanski et al. dataset has been used for mapping dust sources (Schepanski et al.,2007), identifying the diurnal cycle of dust emission onset overWestern Africa and associated meteorological conditions drivingdust uplift (Schepanski et al., 2009), and model validation (e.g.,Johnson et al., 2011). The dust source activation data set compareswell with the spatio-temporal distribution of dust sources identi-fied from surface visibility observations at weather stations(Laurent et al., 2010).
2.2. Models
In this study we examine the output from two dust simulations(Zhao et al., 2010, 2013) made with the Weather Research andForecasting with Chemistry (WRF-Chem) model (Grell et al.,2005; Skamarock and Klemp, 2008). WRF-Chem simulates tracegases and particulates with the meteorological fields and simulatesa variety of coupled physical and chemical processes such as trans-port, deposition, emission, chemical transformation, and radiation,and includes online coupling of chemistry and meteorology. WRF-Chem has been widely used to simulate the dust life cycle and cli-matic impact at the global scale (e.g., Zhao et al., 2013) and theregional scale over West Africa (Zhao et al., 2010, 2011), Saudi Ara-bia (Kalenderski et al., 2012), North America (Zhao et al., 2012),and East Asia (Chen et al., 2013). The simulations are conductedat one-degree horizontal resolution throughout the domain. Twodust emission schemes, one based on Ginoux et al. (2001) andthe other on Kok et al. (2014), both coupled with a modal aerosolmodel, are used in this study. The emission scheme from Ginouxet al. (2001) (hereafter referred to as WRF-GOCART) calculatesthe dust emission flux as a function of horizontal wind speed at10 m, the threshold 10 m wind speed below which dust emissiondoes not occur, and a prescribed source function that defines thepotential dust source regions and comprises surface factors, suchas vegetation and snow cover. The dust emission scheme devel-oped by Kok et al. (2014) (hereafter referred to as WRF-KOK) isderived from a physically based theory that uses the concept thatdust emission is a threshold effect without an explicitly prescribed
d number of bins, meteorological forcing at model boundaries, horizontal resolution,
Horiz. resolution Output
casts Dee et al. (2011) Western Africa1 � 1 degree res
3-Hourly
re with NCAR/NCEP reanalysis 60�S–70�N and all longitudes1 � 1 degree res
3-Hourly
60�S–70�N and all longitudes1 � 1 degree res
3-Hourly
Global0.94� � 1.24� res
30-Minute
Global1 � 1 degree res
Hourly
A.T. Evan et al. / Aeolian Research 16 (2015) 153–162 155
dust source function. This parameterization depends only on thewind friction speed, the threshold friction speed, and the soil claycontent.
We use output from the regional CHIMERE chemistry transportmodel. In CHIMERE dust emission is calculated following Alfaroand Gomes (2001) and Menut et al. (2005). The surface and soilproperties are provided by USGS and STATSGO-FAO global dat-abases, the aeolian roughness lengths are derived from ERS satel-lite data, as described in Menut et al. (2013). The wind speed iscalculated using the WRFV3 regional model, forced by the NCEPglobal meteorological fields. All these data are projected onto aregular 1 � 1 degrees grid. In order to take into account the subgridscale variability, a Weibull distribution is applied to the mean windspeed.
We also use output from the dust emission model of Tegen et al.(2002) following the setup of Fiedler et al. (2013a, 2014). Modeldust emission is forced by 3-hourly wind speeds and soil moisturefrom ERA-Interim forecasts (Dee et al., 2011). The horizontal reso-lution of the model is 1� throughout the domain. In this model,hereafter referred to as TEGEN, a grid box is a potential dust sourcewhen at least two dust source activation events have beenobserved by SEVIRI satellite imagery between March 2006 andFebruary 2010 (Schepanski et al., 2007, 2012).
In addition to these regional simulations, we examine dust emis-sion from the global Community Earth System Model (Hurrell et al.,2013) with prescribed SST (hereafter referred to as CESM). Dustemission in CESM is based on the Dust Entrainment And Deposition(DEAD) model (Zender et al., 2003; Mahowald et al., 2006), modifiedto include saltation (Albani et al., 2014), as suggested by Kok, 2011.In this experiment CESM is run at a resolution of 0.94� � 1.24� glob-ally, using fixed (AMIP) SST and climatological land and surfaceproperties. Here SSTs were prescribed from the 1982 season,although there was little difference in the results of this analysisusing simulations forced with SSTs from two other years.
In CESM dust emission is calculated within the land model, theCommunity Land Model (CLM), and then passed to the atmo-spheric model, the Community Atmospheric Model (CAM). How-ever, once passed to CAM the emission fluxes are scaled by a so-called ‘‘source function,’’ which is a non-dimensional global mapof soil erodibility from Zender et al. (2003). Emission fluxes fromCESM are actually the scaled CAM fluxes. In this paper we examineboth the CESM/CAM fluxes and the CLM fluxes.
In Table 1 is a summary of the salient features of the differentmodels examined in this paper.
2.3. Intercomparison
For all models we firstly scaled emission fluxes so that theannual total emission from North Africa was equal to 4500 Tg,which is an observation-based estimate of annual North Africandust emission (Evan et al., 2014). We next calculated the numberof dust emission events in the models, where an event is definedas a 3-hourly dust emission flux greater than or equal to1lg m�2 s�1 (Laurent et al., 2010; Tegen et al., 2013). We note thatemission data from the CESM model is 3-hourly averaged, whereasfrom the WRF, ECHAM and CHIMERE models this is an instanta-neous field. The emission frequency is defined as the total numberof events divided by the total number of 3-hourly time-steps in themodel output. Small changes in the threshold for detecting anevent had no effect on the results from this study. This is becausethe total mass flux is dominated by regions that are frequentlyemitting at rates well above this threshold, and thus for our statis-tical analysis we disregard regions with low emission frequencies,as is discussed further in Section 3.3. In addition, we repeated theanalysis after scaling emission fluxes from the models so that the
annual total North African emission was from 500 to 4500 Tg, inincrements of 500 Tg, finding qualitatively identical results in allcases, also discussed in Section 3.3.
3. Results
We first examine differences in annual dust emission and meanemission frequency among the models (Sections 3.1 and 3.2), wethen use these data to identify a functional relationship betweenthe two (Section 3.3).
3.1. Dust emission frequency
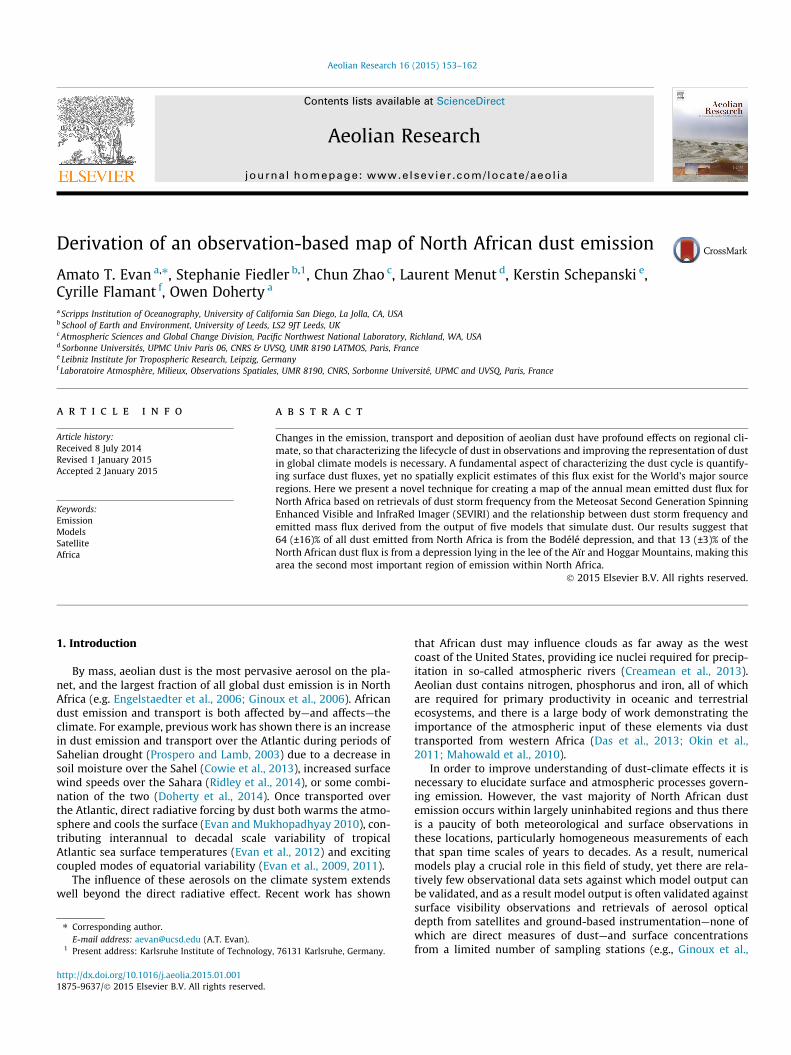
We compare the spatial structure of dust emission frequency inthe models and from SEVIRI (Fig. 1). Of the six data sets examined,WRF-GOCART and CHIMERE have the highest average dust emis-sion frequencies, and the CHIMERE and CESM models exhibit theleast spatial uniformity in these frequencies (i.e., the standarddeviation of the maps in Fig. 1 are larger that that of the other threemodels). Since emissions are tuned to be equivalent amongst themodels, on average WRF-GOCART and CHIMERE emit less dustper emission event than do the other models. Interestingly, WRF-KOK and WRF-GOCART are forced with identical wind fields(Table 1) and thus lack of agreement between them is due to differ-ences in the dust emission schemes. All the models except CESMand CLM show a maximum in emission frequency in the Bodélédepression (approximately between 15�–20�E and 15�–20�N). CHI-MERE shows an additional peak in emission at the same latitude ofthe Bodélé but near the Atlantic coast. TEGEN, the WRF models andCLM show peaks in emission along the western coast between 20�and 30�N and in the area of 0�E and 30�N. None of the models pro-duce dust between 8�N and 12�N. Beyond these highly activeregions, all models agree that there are other active regions tothe east of the Bodélé and within Northern Africa (near the Medi-terranean coast). The emission frequency maps for CESM and CLMshow far less spatial structure than do the other models.
The map of annual mean dust emission frequency from SEVIRIshows a distinct band spanning approximately 15�–25�N, also witha regional maximum over the Bodélé depression, but a secondarymaxima immediately to the west of the Bodélé (0�–10�W, whichis in the Lee of the Aïr and Hoggar Mountains), which has been pre-viously identified as an important dust source region (Kocha et al.,2013). Like the models SEVIRI does not show dust emission southof 12�N. We note that emission here likely occurs during the sum-mertime in association with monsoon generated cold pools(Knippertz and Todd, 2012). It is possible that these events aremissed in the models due to lack of sufficient resolution to resolvesuch features, and in SEVIRI because these emission events areobscured under clouds. Qualitatively, the CHIMERE model exhibitsthe similarity to the spatial structure of the SEVIRI emission fre-quency map, although the magnitudes of the frequencies in SEVIRIare much smaller than those from CHIMERE, and are more similarto the WRF-KOK and TEGEN models. See Schepanski et al. (2009)for a detailed analysis of the spatial structure of the SEVIRI mapof dust emission frequency.
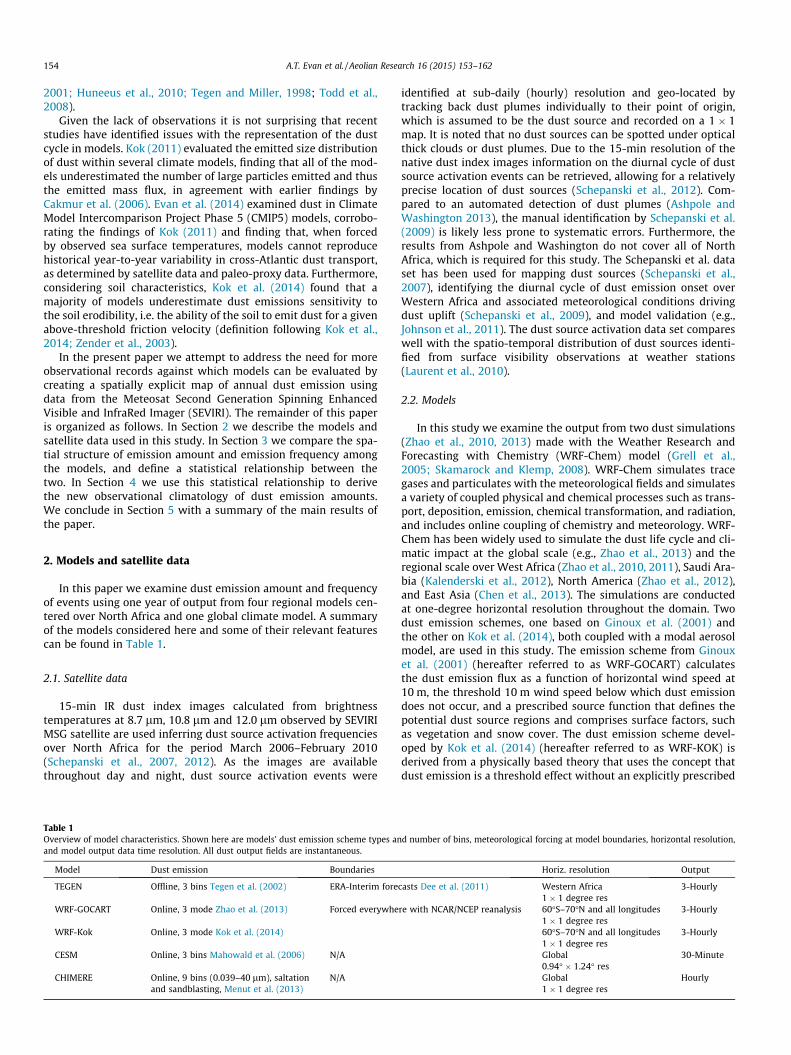
Model differences in the spatial structures of emission fre-quency can also be elucidated by plots of the cumulative distribu-tion functions (CDFs) of the annual mean dust emission frequencyfor each model. In order to facilitate intra-model comparison welinearly scaled the emission frequency for each model so that themaximum emission frequency is one. Only locations with a non-zero annual emission are included in the CDF calculations. TheCDFs of the satellite data (SEVIRI), TEGEN, CHIMERE, WRF-KOKand CLM have an approximately logarithmic shape (Fig. 2a), indic-ative of a small number of highly active regions (ref Fig. 1). All of

Fig. 1. Emission frequency from models and satellite imagery. Shown are maps of dust emission event frequency calculated from 3-hourly emission from the six modelsanalyzed here and the 3-hourly satellite imagery.
Emission frequency (scaled)0 0.2 0.4 0.6 0.8 1
Cum
ulat
ive
frequ
ency
0
0.2
0.4
0.6
0.8
1(a)
CESM CLM SEVIRI
Emission (scaled)0 0.2 0.4 0.6 0.8 1
Cum
ulat
ive
frequ
ency
0
0.2
0.4
0.6
0.8
1(b)
TEGEN WRF-KOK CHIMERE WRF-GOCART
Fig. 2. Dust emission frequency cumulative distribution functions and sensitivity of emission to frequency. Plotted (a) are cumulative distribution functions (CDFs) for theannual mean emission frequencies from models and satellite data (Fig. 1). Here all data has been linearly scaled to have a maximum frequency of 1 to facilitate modelintercomparison. Also shown (b) are the CDFs of emission for the six models, again where emission has been scaled to a maximum value of one. In both plots the identify line(black dashed) is plotted for reference.
156 A.T. Evan et al. / Aeolian Research 16 (2015) 153–162
these models have CDF values greater than 80% at emission fre-quencies of 0.5 and above, meaning that 20% of the dust-emittingland areas have emission events more than 50% of the time. In con-trast, the CDFs of WRF-GOCART and CESM increase slowly for smallemission frequencies and then much more rapidly at high emissionfrequencies (Fig. 2a), reflecting a large number of locations thatemit dust very frequently (compare Fig. 1). Thus, for WRF-GOCARTapproximately 80% of the dust-emitting land surface areas haveemission events more than 50% of the time.
As there is no regional network of surface observations of emis-sion frequency it is not possible to determine which of the CDFs inFig. 2a are more realistic, and the SEVIRI data cannot be used con-clusively as a validation data set since it possibly underestimatesemission frequency along coast of West Africa and within the Sah-aran Heat Low region (Brindley et al., 2012). However, previouswork has suggested that frequency maps should be characterizedby a small number of highly active dust emission ‘‘hotspots’’(Prospero et al., 2002; Engelstaedter et al., 2006; Ginoux et al.,2012; Schepanski et al., 2012)⁄⁄⁄⁄, and thus the SEVIRI data andthose models exhibiting CDFs with a logarithmic shape (WRF-KOK, TEGEN, CHIMERE) may be more accurate than those withCDFs with cumulative frequencies that increase gradually for small
emission frequencies (WRF-GOCART, CESM). We again note thatwe have scaled the models’ annual cumulative North African dustemission to 4500 Tg. However, we repeated the analysis after scal-ing the output to 1000 Tg, obtaining similar results and identicalconclusions about the model differences and agreement withSEVIRI.
3.2. Emitted mass flux
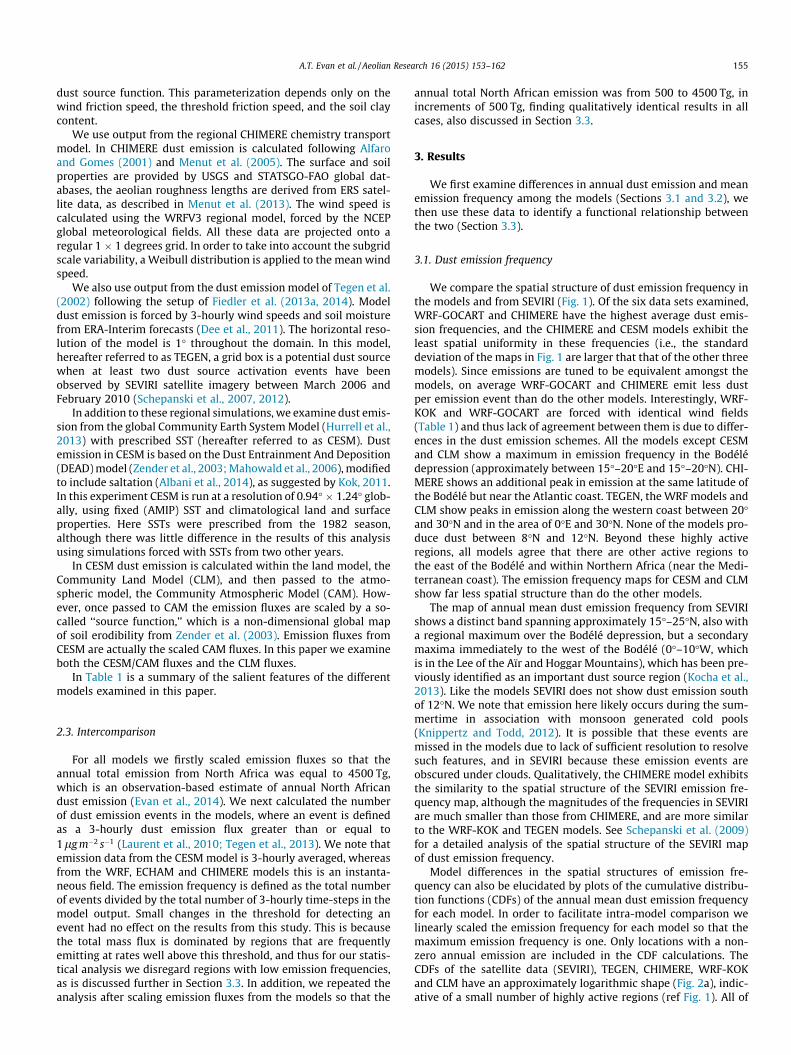
We next examine intra-model differences in the spatial struc-tures of annual dust emission rates. For the purpose of an intra-model comparison of emission the value of the scaling factor hasno effect on the results and their interpretation. All but the CESMmodel (Fig. 3) show the Bodélé depression as having the highestannual emission rates within North Africa, which range from1200 (WRF-GOCART) to 7000 (CHIMERE) g m�2 (Fig. 3). WRF-KOK has two additional locations where emission is comparableto that of the Bodélé, in the lee of the Atlas Mountains (32�N and5�W) and along the southernmost stretch of the western coast ofthe Red Sea (17�N and 37�E). In WRF-GOCART the region spanning25�–30�N and 0�E and westward to the coastline, nominally char-acterized by the Saharan Heat Low during summer (Lavaysse et al.,
TEGEN
-20 -10 0 10 20 30 40 -20 -10 0 10 20 30 40
-20 -10 0 10 20 30 40 -20 -10 0 10 20 30 40
-20 -10 0 10 20 30 40 -20 -10 0 10 20 30 40
101520253035
WRF-KOK
101520253035
CHIMERE
101520253035
WRF-GOCART
101520253035
CESM
101520253035
CLM
101520253035
E (g
m-2
yr-1
)
0
1000
2000
3000
4000
5000
6000
7000
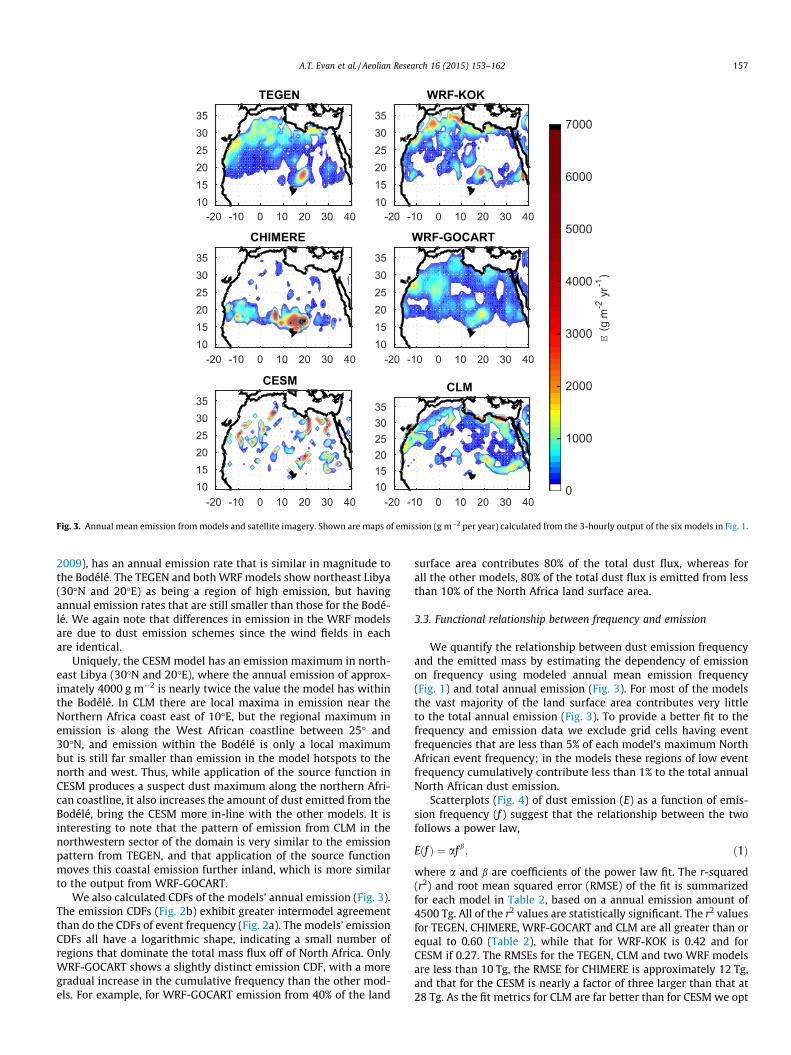
Fig. 3. Annual mean emission from models and satellite imagery. Shown are maps of emission (g m�2 per year) calculated from the 3-hourly output of the six models in Fig. 1.
A.T. Evan et al. / Aeolian Research 16 (2015) 153–162 157
2009), has an annual emission rate that is similar in magnitude tothe Bodélé. The TEGEN and both WRF models show northeast Libya(30�N and 20�E) as being a region of high emission, but havingannual emission rates that are still smaller than those for the Bodé-lé. We again note that differences in emission in the WRF modelsare due to dust emission schemes since the wind fields in eachare identical.
Uniquely, the CESM model has an emission maximum in north-east Libya (30�N and 20�E), where the annual emission of approx-imately 4000 g m�2 is nearly twice the value the model has withinthe Bodélé. In CLM there are local maxima in emission near theNorthern Africa coast east of 10�E, but the regional maximum inemission is along the West African coastline between 25� and30�N, and emission within the Bodélé is only a local maximumbut is still far smaller than emission in the model hotspots to thenorth and west. Thus, while application of the source function inCESM produces a suspect dust maximum along the northern Afri-can coastline, it also increases the amount of dust emitted from theBodélé, bring the CESM more in-line with the other models. It isinteresting to note that the pattern of emission from CLM in thenorthwestern sector of the domain is very similar to the emissionpattern from TEGEN, and that application of the source functionmoves this coastal emission further inland, which is more similarto the output from WRF-GOCART.
We also calculated CDFs of the models’ annual emission (Fig. 3).The emission CDFs (Fig. 2b) exhibit greater intermodel agreementthan do the CDFs of event frequency (Fig. 2a). The models’ emissionCDFs all have a logarithmic shape, indicating a small number ofregions that dominate the total mass flux off of North Africa. OnlyWRF-GOCART shows a slightly distinct emission CDF, with a moregradual increase in the cumulative frequency than the other mod-els. For example, for WRF-GOCART emission from 40% of the land
surface area contributes 80% of the total dust flux, whereas forall the other models, 80% of the total dust flux is emitted from lessthan 10% of the North Africa land surface area.
3.3. Functional relationship between frequency and emission
We quantify the relationship between dust emission frequencyand the emitted mass by estimating the dependency of emissionon frequency using modeled annual mean emission frequency(Fig. 1) and total annual emission (Fig. 3). For most of the modelsthe vast majority of the land surface area contributes very littleto the total annual emission (Fig. 3). To provide a better fit to thefrequency and emission data we exclude grid cells having eventfrequencies that are less than 5% of each model’s maximum NorthAfrican event frequency; in the models these regions of low eventfrequency cumulatively contribute less than 1% to the total annualNorth African dust emission.
Scatterplots (Fig. 4) of dust emission (E) as a function of emis-sion frequency (f ) suggest that the relationship between the twofollows a power law,
Eðf Þ ¼ af b; ð1Þ
where a and b are coefficients of the power law fit. The r-squared(r2) and root mean squared error (RMSE) of the fit is summarizedfor each model in Table 2, based on a annual emission amount of4500 Tg. All of the r2 values are statistically significant. The r2 valuesfor TEGEN, CHIMERE, WRF-GOCART and CLM are all greater than orequal to 0.60 (Table 2), while that for WRF-KOK is 0.42 and forCESM if 0.27. The RMSEs for the TEGEN, CLM and two WRF modelsare less than 10 Tg, the RMSE for CHIMERE is approximately 12 Tg,and that for the CESM is nearly a factor of three larger than that at28 Tg. As the fit metrics for CLM are far better than for CESM we opt

Emission frequency0.1 0.2 0.3 0.4 0.5
Emis
sion
(Tg
yr-1
)
102030405060
TEGEN
Emission frequency0.1 0.2 0.3
Emis
sion
(Tg
yr-1
)
20406080
100WRF-KOK
Emission frequency0.2 0.4 0.6 0.8
Emis
sion
(Tg
yr-1
)
20406080
100120140
CHIMERE
Emission frequency0.2 0.4 0.6 0.8
Emis
sion
(Tg
yr-1
)
5
10
15
20WRF-GOCART
Emission frequency0.2 0.4 0.6
Emis
sion
(Tg
yr-1
)
50100150200250300
CESM
Emission frequency0.2 0.4 0.6 0.8
Emis
sion
(Tg
yr-1
)
20
40
60
80
CLM
Fig. 4. Plots of modeled emission frequency and emitted mass. Shown are scatterplots of annual mean dust emission (ordinate) and emission event frequency for the sixmodels examined here (blue circles). Also shown are the power law fits (1) to the data (red lines), based on an annual emission amount of 4500 Tg. Table 2 contains asummary of the fit statistics. (For interpretation of the references to color in this figure legend, the reader is referred to the web version of this article.)
Table 2Emission and emission frequency fit statistics. Shown are the r-squared (r2) and rootmean squared error (RMSE) for each model from power law fit of dust emission as afunction of emission event frequency (1). All r2 values are statistically significant atthe 95% level.
Model r2 RMSE (Tg)
Tegen 0.68 3.7WRF-Kok 0.42 6.4CHIMERE 0.64 11.9WRF-GOCART 0.60 2.3CESM 0.27 27.82CLM 0.64 5.1
158 A.T. Evan et al. / Aeolian Research 16 (2015) 153–162
to continue the study only using dust emission data from CLM anddo not provide further analysis of dust from CESM (CAM).
One feature of a power law relationship is scale invariance. Asannual North African dust emission is the sum over all E, if we scaleemission frequency by the constant c,X
Eðcf Þ ¼ cbX
Eðf Þ;
orX
Eðcf Þ /X
af b:
Thus the functional dependency of dust emission uponemission frequency scales linearly with a for different amountsof total emission, while b remains unchanged. We examine scaleinvariance in the relationship between dust emission and emission
frequency by calculating the coefficients in (1) after scaling the 3-hourly model emission data so that the total North African dustemission is 500–4500 Tg, in increments of 500 Tg. All of the modelsexcept WRF-GOCART exhibit power-law behavior in that aincreases linearly (Fig. 5a) and b approximately remains constant(Fig. 5b) as emission amount increases. The small increases in bfor CHIMERE and CLM result from the fact that the power law rela-tionship does not hold for all values of emission frequency (Fig. 3)and is valid over a range of emission frequencies.
The coefficients (1) for WRF-GOCART do not exhibit power-lawbehavior in that a is approximately constant (Fig. 4a) and bincreases nearly linearly (Fig. 5b) for increasing North African dustemission. Additional analysis did not elucidate the cause of the lackof a robust power law relationship, nor show a clear alternativefunctional relationship between dust emission and emission fre-quency for WRF-GOCART. As such, we do not consider WRF-GOCART further for the purposes of estimating dust emission viathe SEVIRI emission frequency data.
The multi-model mean values, which do not include WRF-GOCART, of a and b are plotted as black lines in Fig. 5. Given thescale invariance of the power law relation we report the coeffi-cients in (1) and their 95% confidence intervals for each of the mod-els at the arbitrarily chosen total emission amount of 2500 Tg(Table 3). We also report the multi model mean values for thesecoefficients and their uncertainty (Table 3), which in this case isdefined as the standard deviation of the model coefficients dividedby the square root of one minus the number of models used to cal-culate the means (Wilks, 2011).

Annual Emission (Tg)1000 2000 3000 4000
α0
100
200
300
400
500(a)
TEGEN WRF-KOK CHIMERE WRF-GOCART CESM CLM
Annual Emission (Tg)1000 2000 3000 4000
β
1
2
3
4
5
6(b)
Fig. 5. Power law coefficients. Shown are values of the a (a) and b (b) coefficients (1) from a least-squares fit of the dust emission and emission frequency data for five models(ordinate). The coefficients are calculated for different emission amounts (indicated in the abscissa). The black line indicates the multi-model mean values, which is notcalculated using WRF-GOCART. The coefficient values at 2500 Tg is indicated in Table 3.
Table 3Power law coefficients. Shown are the coefficients and standard error from the powerlaw fit of the emission and emission frequency data (Eq. (1)). These values representthe mean coefficient values from Fig. 5 at a total North Africa emission amount of2500 Tg. The bold numbers represent the multi-model mean values that are used toestimate dust emission from SEVIRI. The uncertainty ranges for the multi-modelmean values are defined as the standard deviation of the models’ regressioncoefficients divided by the square root of one minus the number of models (thestandard error on the mean value estimates).
Model a b
TEGEN 82.3 ± 8.0 1.30 ± 0.05WRF-KOK 227.7 ± 57.2 1.92 ± 0.14CHIMERE 107.7 ± 13.3 3.95 ± 0.35CLM 74.2 ± 6.6 3.16 ± 0.14Mean 123.0 ± 41.1 2.58 ± 0.69
A.T. Evan et al. / Aeolian Research 16 (2015) 153–162 159
3.4. Emission estimate from SEVIRI
Having derived empirical relationships between dust emissionfrequency and dust emission we next estimate a total NorthAfrican mass flux based on the observational SEVIRI estimates ofdust emission event frequency (Fig. 1). We calculate dust emissionfrom the SEVIRI emission frequency data via (1) using the multi-model mean coefficient values in Table 3. The main value of theseSEVIRI-emission maps is to elucidate the spatial structure ofemission across West Africa using observations. To emphasize thispoint we present the resultant SEVIRI emission data in units of
SEVIRI
-20 -10 0 10 20 30 4010
20
30
SEVIRI emission (% of total 0 0.2 0.4 0.6 0.8 1
Fig. 6. Estimate of annual emission rates from SEVIRI. Shown are SEVIRI-derived mapsTable 3 (left) and the uncertainty in the estimate based on the standard error on the coegreen boxes outline the major dust hotspots of the Bodélé Depression (easternmost box
percentage contribution to the total North African dust flux(Fig. 6a). As such, these maps can be converted to an annual dustemission rate by multiplying the percentages by an estimate ofthe total annual North African dust emission. We also show theuncertainty in the SEVIRI emission estimates (Fig. 6b), which isbased on the uncertainty in the multimodel mean coefficients(Table 3).
Not surprisingly, the pattern of emission from SEVIRI (Fig. 6a) issimilar in spatial structure to the SEVIRI emission frequency data(Fig. 1), except that two important hotspots emerge in the emissionmaps. The strongest of these hotspots is the Bodélé depression,which we define as encompassing the region of 14�–21�N and14�–24�E (easternmost green box in Figs. 6a and b). In both mapsthe Bodélé is the region of the highest dust emission amounts (per-centages) within North Africa, consistent with a number of studiessuggesting as much (e.g., Washington et al., 2003). The cumulativeemission from the Bodélé is 64% (±16%) of the total North Africadust emission. Arguably the second most active region of dustemission is from a depression in the lee of the Aïr and HoggarMountains, which we define as encompassing the region of 16�–24�N and 2�–10�E (westernmost green box in Figs. 6a and b). Thecumulative emission from the Aïr and Hoggar region is 13% (±3%).
Based on the SEVIRI maps dust emission from the Bodélé andAïr and Hoggar hotspots constitutes 77% (±19%) of the total NorthAfrican dust emission. Furthermore, from both maps the majorityof all North African dust is emitted between the latitudes of 15�–20�N; the cumulative emission from the longitudinal segment
Uncertainty
-20 -10 0 10 20 30 4010
20
30
North Africa emission)1.2 1.4 1.6 1.8 2
of annual mean dust emission from (1) using the multimodel mean coefficients infficients (right). The data is in units of % of annual North Africa dust emission. The) and a depression in the lee of the Aïr and Hoggar Mountains (westernmost box).

Emission (normalized)0 0.5 1
Prob
abilit
y
0
0.2
0.4
0.6
0.8(a)
Frequency (normalized)0 0.5 1
Prob
abilit
y
0
0.2
0.4
0.6
0.8(b)
TEGEN WRF-KOK CHIMERE CLM WRF-GOCART
Fig. 7. Probability distributions. Shown are the probability distributions of annual dust emission (a) and emission frequency (b) for five models.
160 A.T. Evan et al. / Aeolian Research 16 (2015) 153–162
spanning 15�–20�N is 82% (±10%) of the total. Thus, according tothe SEVIRI estimates, the overwhelming amount of all dust fromNorth Africa is emitted within a 5� band of latitudes.
In comparison with emission from the models considered here(Fig. 3) the SEVIRI emission estimates (Fig. 6a) are most similar inspatial structure to that from the CHIMERE model. In both theSEVIRI and CHIMERE maps emission is dominated by the Bodélé.In the CHIMERE map there is a secondary maximum in emissionto the west of the Bodélé that is similar is structure to the emissionfrom the Aïr and Hoggar region. Additionally, the CHIMERE and theSEVIRI emission maps show little emission north of 25�N, whereasall of the other models exhibit substantial emission north of thislatitude. However, other work has shown that the SEVIRI mapslikely underestimate the frequency of emission across NorthernAfrica (Brindley et al., 2012). Thus the SEVIRI record may underes-timate the emission frequency, which would in-turn result in a toostrong an emphasis on emission equatorward of 20�N.
4. Discussion
One item not addressed thus far is the fundamental cause of thepower law relationship between dust emission and dust emissionfrequency in the models (1). We speculate that the power law rela-tion represents a good fit to the dust emission and emission fre-quency data because the sample populations (the models’distributions of emission and emission frequency) are approxi-mately lognormal, or are characterized as having long tails.
Dust emission is though to be proportional to the cube of windspeed (e.g., Marticorena and Bergametti, 1995). Indeed, among thefour model exhibiting a power law relationship between dustemission and emission frequency (TEGEN, WRF-KOK, CHIMERE,CLM) we find a positive and statistically significant correlationbetween annual mean emission and the cube of the annual mean10 m wind speed, where the correlation coefficients range from0.49 to 0.52, with p-values all less than 0.01. In addition, histo-grams of the cube of annual mean 10 m wind speeds for thesemodels show that their occurrence distributions are lognormal(not shown). As such, it is not surprising that the probability distri-butions of annual emission are also characterized as having longtails (Fig. 7a). One can also infer the lognormal probability distribu-tions of emission in the models as the CDFs in Fig. 2b increase stee-ply at low emission values and change little thereafter.
Similarly, the probability distributions of the TEGEN, WRF-KOKand CHIMERE models also are characterized as having long tails(Fig. 7b), which is consistent with their steep rate of increase atlow emission frequencies in the CDFs (Fig. 2a). Although the emis-sion frequency CDF of the CLM model does not increase steeplyuntil scaled frequencies of 0.4 (Fig. 2a), the model’s probability dis-tribution of emission frequency does still have some characteristicsconsistent with a long tail (Fig. 7b).
While the cubed 10 m wind speed distribution from WRF-GOCART is also lognormal (not shown) the emission frequencyprobability distribution for this model increases very slowly atlow frequencies and then peaks at high frequencies (Fig. 7b), whichis opposite in shape to the other four models that exhibit powerlaw behavior. This unique and opposite characteristic of theWRF-GOCART distribution is also reflected in the emission fre-quency CDF (Fig. 2a). We suspect this lack of a lognormal probabil-ity distribution in the WRF-GOCART emission frequency is themain reason why this model fails to show a power law relationshipbetween emission and emission frequency.
5. Conclusions
Here we have performed a statistical analysis of North Africandust emission in five models and one satellite-based data set. Wefirstly showed that these five models all agree that the Bodélédepression is one of the—if not the—most active dust source inWest Africa, both in terms of emission amount and frequency(Figs. 1 and 3). Furthermore, none of the models show dust emis-sion south of 12�N (Fig. 3). Beyond these regions, the models showwidespread disagreement in the relative importance of otherregions with respect to emission and frequency of events.
We examined CDFs of the frequency maps (Fig. 2a). The CDFsfor two models (CESM and WRF-GOCART) increased slowly forsmall emission frequencies and then much more rapidly at highemission event frequencies, indicating that those two models havea large number of locations that emit dust very frequently. Theother four models and SEVIRI had CDFs that were more logarithmicin shape, indicating that in these models most regions infrequentlyemit dust, and that there are a small number of very regions with ahigh emission frequency. We found better agreement in CDFs ofmodel emission; all models had a logarithmic emission CDF, indi-cating that emission is dominated by a small number of very activeregions (Fig. 2b).
We demonstrated that there is a power law relationship (1)between modeled dust emission frequency and dust emission(Fig. 4) in the TEGEN, WRF-KOK, CHIMERE and CLM models(Figs. 5a and b). We used (1) and the coefficients in Table 3 to esti-mate annual mean North African dust emission based on theSEVIRI emission frequency (Figs. 6a and b). To the best of ourknowledge this SEVIRI dust emission map represents the firstobservationally based estimate of the North African dust emission.Here we presented the final maps in units of percentages of totalNorth African dust emission in order to stress that the maps arescalable to any choice of total emission.
From the observation-based map of emission we showed thatthe majority of dust emission from North Africa is from the BodéléDepression and a depression in the lee of the Aïr and Hoggar Moun-tains (green boxes, Figs. 6a and b), and that 82% of all dust from

A.T. Evan et al. / Aeolian Research 16 (2015) 153–162 161
North Africa is emitted between the latitudes of 15�–20�N. Theseresults have implications for studying long-term variability ofNorth Africa dust emission and transport in that, to first order, inorder to understand the effect of the environment on regional dustemission it is particularly important to quantify change (in surfacewind speeds, soil moisture, etc.) over this narrow band of latitudes.
This study is limited in that the SEVIRI dust emission frequencyrecord likely underestimates emission in regions frequentlyobscured by either clouds or dense layers of dust. Thus, while wethink this new map of emission (Fig. 6a) is an important step for-ward in generating an observation-based estimate of North Africandust emission, there is a need to improve our understanding of thespatial distribution of emission across the continent. As the major-ity of North Africa is uninhabited, the likely only way to achievesuch a goal is the deployment of an automated ground-based dustobservational network.
Acknowledgements
The authors would like to thank the two anonymous reviewersand the associate editor for their helpful and constructive com-ments on an earlier version of this manuscript. This work was sup-ported by the French Agence Nationale de la Recherche (ANR)grant ANR-10-LABX-18-01 of the national Programme Investisse-ments d’Avenir. Funding for this work was also provided by Labo-ratoire d’excellence Institute Pierre Simon Laplace (L-IPSL), a grantfrom the ‘‘Research in Paris’’ programme, and National Oceano-graphic and Atmospheric Administration Climate Program Officegrant NA11OAR4310157. S. Fiedler acknowledges the researchfunding by the European Research Council grant 257543. C. Zhaoacknowledges support by the U.S. DOE as part of the Regionaland Global Climate Modeling program. The Pacific NorthwestNational Laboratory is operated for DOE by Battelle Memorial Insti-tute under contract DE-AC05-76RL01830.
References
Albani, S., Mahowald, N.M., Perry, A.T., Scanza, R.A., Heavens, N.G., Zender, C.S.,Maggi, V., Kok, J.F., Otto-Bliesner, B.L., 2014. Improved dust representation inthe Community Atmosphere Model. J. Adv. Model. Earth Syst. http://dx.doi.org/10.1002/2013MS000279.
Alfaro, S.C., Gomes, L., 2001. Modeling mineral aerosol production by wind erosion:emission intensities and aerosol size distribution in source areas. J. Geophys.Res. 106, 18075–18084.
Ashpole, I., Washington, R., 2013. A new high-resolution central and westernSaharan summertime dust source map from automated satellite dust plumetracking. J. Geophys. Res. Atmos. 118, 6981–6995. http://dx.doi.org/10.1002/jgrd.50554.
Brindley, H., Knippertz, P., Ryder, C., Ashpole, I., 2012. A critical evaluation of theability of the Spinning Enhanced Visible and Infrared Imager (SEVIRI) thermalinfrared red-green-blue rendering to identify dust events: theoretical analysis.J. Geophys. Res. Atmos. 117 (D7) (1984–2012).
Cakmur, R.V., Miller, R.L., Perlwitz, J., Geogdzhayev, I.V., Ginoux, P., Koch, D.,Kohfeld, K.E., Tegen, I., Zender, C.S., 2006. Constraining the magnitude of theglobal dust cycle by minimizing the difference between a model andobservations. J. Geophys. Res. 111, D06207. http://dx.doi.org/10.1029/2005JD005791.
Chen, S., Huang, J., Zhao, C., Qian, Y., Leung, L.R., Yang, B., 2013. Modeling thetransport and radiative forcing of Taklimakan dust over the Tibetan Plateau: acase study in the summer of 2006. J. Geophys. Res. Atmos. 118 (2), 797–812.
Cowie, S.M., Knippertz, P., Marsham, J.H., 2013. Are vegetation-related roughnesschanges the cause of the recent decrease in dust emission from the Sahel?Geophys. Res. Lett. 40, 1868–1872.
Creamean, J.M. et al., 2013. Dust and biological aerosols from the Sahara and Asiainfluence precipitation in the western USA. Science 339 (6127), 1572–1578.
Das, R., Evan, A.T., Lawrence, D., 2013. Contributions of long-distance dust transportto atmospheric P inputs in the Yucatan Peninsula. Global Biogeochem. Cycles27, 167–175.
Dee, D.P., Uppala, S.M., Simmons, A.J., Berrisford, P., Poli, P., Kobayashi, S., Vitart, F.,2011. The ERA-Interim reanalysis: configuration and performance of the dataassimilation system. Q. J. R. Meteorol. Soc. 137 (656), 553–597.
Doherty, O.M., Riemer, N., Hameed, S., 2014. Transport of saharan mineral dust inthe boreal summer and its controls by the intertropical convergence zone.Tellus B (in press).
Engelstaedter, S., Tegen, I., Washington, R., 2006. Western African dust emissionsand transport. Earth-Sci. Rev. 79 (1), 73–100.
Evan, A.T., Mukhopadhyay, S., 2010. African dust over the northern tropical Atlantic:1955–2008. J. Appl. Meteor. Climatol. 49, 2213–2229.
Evan, A.T., Foltz, G.R., Zhang, D., 2012. Physical response of the tropical-subtropicalNorth Atlantic ocean to decadal-multidecadal forcing by African dust. J. Climate25, 5817–5829.
Evan, A.T., Vimont, D.J., Bennartz, R., Kossin, J.P., Heidinger, A.K., 2009. The role ofaerosols in the evolution of tropical North Atlantic ocean temperature. Science324 (5928), 778–781.
Evan, A.T., Foltz, G.R., Zhang, D., Vimont, D.J., 2011. Influence of African dust onocean-atmosphere variability in the tropical Atlantic. Nature Geosci. 4, 762–765.
Evan, A.T., Flamant, C., Fiedler, S., Doherty, O., 2014. An analysis of aeolian dust inclimate models. Geophys. Res. Lett. http://dx.doi.org/10.1002/2014GL060545(in press).
Fiedler, S., Schepanski, K., Heinold, B., Knippertz, P., Tegen, I., 2013a. Climatology ofnocturnal low-level jets over Western Africa and implications for modelingmineral dust emission. J. Geophys. Res. Atmos. 118, 6100–6121.
Fiedler, S., Schepanski, K., Knippertz, P., Heinold, B., Tegen, I., 2014. How importantare cyclones for emitting mineral dust aerosol in Western Africa? Atmos. Chem.Phys. 14, 8983–9000. http://dx.doi.org/10.5194/acp-14-8983-2014.
Ginoux, P., Chin, M., Tegen, I., Prospero, J.M., Holben, B., Dubovik, O., Lin, S.J., 2001.Sources and distributions of dust aerosols simulated with the GOCART model. J.Geophys. Res. Atmos. 106 (D17), 20255–20273 (1984–2012).
Ginoux, P., Horowitz, L.W., Ramaswamy, V., Geogdzhayev, I.V., Holben, B.,Stenchikov, G., Tie, X., 2006. Evaluation of aerosol distribution and opticaldepth in the Geophysical Fluid Dynamics Laboratory coupled model CM2.1 forpresent climate. J. Geophys. Res. Atmos. 111, D22210. http://dx.doi.org/10.1029/2005JD006707.
Ginoux, P., Prospero, J.M., Gill, T.E., Hsu, C., Zhao, M., 2012. Global scale attributionof anthropogenic and natural dust sources and their emission rates based onMODIS Deep Blue aerosol products. Rev. Geophys. 50, RG3005. http://dx.doi.org/10.1029/2012RG000388.
Grell, G.A., Peckham, S.E., Schmitz, R., McKeen, S.A., Frost, G., Skamarock, W.C., Eder,B., 2005. Fully coupled ‘‘online’’ chemistry within the WRF model. Atmos.Environ. 39 (37), 6957–6975.
Huneeus, N. et al., 2010. Global dust model intercomparison in AeroCom phase I.Atmos. Chem. Phys. Discuss. 10, 23781–23864. http://dx.doi.org/10.5194/acpd-10-23781-2010.
Hurrell, James, W., et al., 2013. The community Earth system model: a frameworkfor collaborative research. Bull. Am. Meteorol. Soc. 94, 1339–1360.
Johnson, B.T., Brooks, M.E., Walters, D., Woodward, S., Christopher, S., Schepanski,K., 2011. Assessment of the met office dust forecast model using observationsfrom the GERBILS campaign. Q. J. R. Meteorol. Soc. 137 (658), 1131–1148.http://dx.doi.org/10.1002/qj.736.
Kalenderski, S., Stenchikov, G., Zhao, C., 2012. Modeling a typical winter-time dustevent over the Arabian Peninsula and the Red Sea. Atmos. Chem. Phys. 12 (10).
Knippertz, P., Todd, M.C., 2012. Mineral dust aerosols over the Sahara:meteorological controls on emission and transport and implications formodeling. Rev. Geophys. 50 (1).
Kocha, C., Tulet, P., Lafore, J.-P., Flamant, C., 2013. The importance of the diurnalcycle of aerosol optical thickness in West Africa. Geophys. Res. Lett. 40 (4), 785–790. http://dx.doi.org/10.1002/grl.50143.
Kok, J.F., 2011. A scaling theory for the size distribution of emitted dust aerosolssuggests climate models underestimate the size of the global dust cycle. Proc.Natl. Acad. Sci. U.S.A. 108 (3), 1016–1021.
Kok, J.F., Mahowald, N.M., Albani, S., Fratini, G., Gillies, J.A., Ishizuka, M., Leys, J.F.,Mikami, M., Park, M.-S., Park, S.-U., Van Pelt, R.S., Ward, D.S., Zobeck, T.M., 2014.An improved dust emission model with insights into the global dust cycle’sclimate sensitivity. Atmos. Chem. Phys. 14 (5).
Laurent, B., Tegen, I., Heinold, B., Schepanski, K., Weinzierl, B., Esselborn, M., 2010. Amodel study of Saharan dust emissions and distributions during the SAMUM-1campaign. J. Geophys. Res. 115, D21210.
Lavaysse, C., Flamant, C., Janicot, S., Parker, D.J., Lafore, J.-P., Sultan, B., Pelon, J., 2009.Seasonal evolution of the West African heat low: A climatological perspective.Climate Dyn. 33, 313–330. http://dx.doi.org/10.1007/s00382-009-0553-4.
Mahowald, N.M., Yoshioka, M., Collins, W.D., Conley, A.J., Fillmore, D.W., Coleman,D.B., 2006. Climate response and radiative forcing from mineral aerosols duringthe last glacial maximum, pre-industrial, current and doubled-carbon dioxideclimates. Geophys. Res. Lett. 33 (20).
Mahowald, N.M., Kloster, S, Engelstaedter, S, Keith Moore, J, Mukhopadhyay, S,McConnell, Joseph R., Albani, S, 2010. Observed 20th century desert dustvariability: impact on climate and biogeochemistry. Atmos. Chem. Phys. 10,10875–10893. http://dx.doi.org/10.5194/acp-10-10875-2010.
Marticorena, B., Bergametti, G., 1995. Modeling the atmospheric dust cycle: 1.Design of a soil-derived dust emission scheme. J. Geophys. Res. 100 (D8),16415–16430.
Menut, L., Schmechtig, C., Marticorena, B., 2005. Sensitivity of the sandblastingfluxes calculations to the soil size distribution accuracy. J. Atmos. OceanicTechnol. 12 (22), 1875–1884.
Menut, L., Perez Garcia-Pando, C., Haustein, K., Bessagnet, B., Prigent, C., Alfaro, S.,2013. Relative impact of roughness and soil texture on mineral dust emissionfluxes modeling. J. Geophys. Res. Atmos. 118, 6505–6520. http://dx.doi.org/10.1002/jgrd.50313.
Okin, G.S., Baker, A.R., Tegen, I., Mahowald, N.M., Dentener, F.J., Duce, R.A., Galloway,J.N., 2011. Impacts of atmospheric nutrient deposition on marine productivity:

162 A.T. Evan et al. / Aeolian Research 16 (2015) 153–162
Roles of nitrogen, phosphorus, and iron, Global Biogeochem. Cycles 25, GB2022.http://dx.doi.org/10.1029/2010GB003858.
Prospero, J.M., Lamb, P.J., 2003. African droughts and dust transport to theCaribbean: Climate change implications. Science 302, 1024–1027.
Prospero, J.M., Ginoux, P., Torres, O., Nicholson, S.E., Gill, T.E., 2002. Environmentalcharacterization of global sources of atmospheric soil dust derived from theNimbus 7 TOMS absorbing aerosol product, rev. Rev. Geophys.
Ridley, D.A., Heald, C.L., Prospero, J.M., 2014. What controls the recent changes inAfrican mineral dust aerosol across the Atlantic? Atmos. Chem. Phys. 14, 5735–5747. http://dx.doi.org/10.5194/acp-14-5735-2014.
Schepanski, K., Tegen, I., Laurent, B., Heinold, B., Macke, A., 2007. A new Saharandust source activation frequency map derived from MSG-SEVIRI IR-channels.Geophys. Res. Lett. 34 (18).
Schepanski, K., Tegen, I., Todd, M.C., Heinold, B., Bönisch, G., Laurent, B., Macke, A.,2009. Meteorological processes forcing Saharan dust emission inferred fromMSG-SEVIRI observations of sub-daily source activation and numerical models.J. Geophys. Res. 114, D10201. http://dx.doi.org/10.1029/2008JD010325.
Schepanski, K., Tegen, I., Macke, A., 2012. Comparison of satellite based observationsof Saharan dust source areas. Remote Sens. Environ. 123, 90–97.
Skamarock, W.C., Klemp, J.B., 2008. A time-split non hydrostatic atmospheric modelfor weather research and forecasting applications. J. Comput. Phys. 227 (7),3465–3485.
Tegen, I., Harrison, S., Kohfeld, K., Prentice, I., Coe, M., Heimann, M., 2002. Impact ofvegetation and preferential source areas on global dust aerosols: results from amodel study. J. Geophys. Res. 107 (D21), 4576.
Tegen, I., Miller, R., 1998. A general circulation model study on the interannualvariability of soil dust aerosol. J. Geophys. Res. 103 (D20), 25975–25995. http://dx.doi.org/10.1029/98JD02345.
Tegen, I., Schepanski, K., Heinold, B., 2013. Comparing two years of Saharan dustsource activation obtained by regional modelling and satellite observations.Atmos. Chem. Phys. 13 (5), 2381–2390.
Todd, M.C. et al., 2008. Quantifying uncertainty in estimates of mineral dust flux: anintercomparison of model performance over the Bodélé Depression, NorthernChad. J. Geophys. Res. 113, D24107. http://dx.doi.org/10.1029/2008JD010476.
Washington, R.W., Todd, M.C., Middleton, N., Goudie, A.S., 2003. Dust-storm sourceareas determined by the total ozone monitoring spectrometer and surfaceobservations. Ann. Assoc. Am. Geogr. 93, 297–313. http://dx.doi.org/10.1111/1467-8306.9302003.
Wilks, D.S., 2011. Statistical methods in the atmospheric sciences, 100. Academicpress.
Zender, C.S., Bian, H., Newman, D., 2003. Mineral dust entrainment and deposition(DEAD) model: description and 1990s dust climatology. J. Geophys. Res. Atmos.108 (D14) (1984–2012).
Zhao, C., Liu, X., Leung, L.R., Johnson, B., McFarlane, S.A., Gustafson Jr, W.I., Easter, R.,2010. The spatial distribution of mineral dust and its shortwave radiativeforcing over Western Africa: modeling sensitivities to dust emissions andaerosol size treatments. Atmos. Chem. Phys. 10 (18), 8821–8838.
Zhao, C., Liu, X., Leung, L.R., Hagos, S., 2011. Radiative impact of mineral dust onmonsoon precipitation variability over West Africa. Atmos. Chem. Phys. 11 (5),1879–1893.
Zhao, C., Liu, X., Leung, L.R., 2012. Impact of the desert dust on the summermonsoon system over Southwestern North America. Atmos. Chem. Phys. 12 (8),3717–3731.
Zhao, C., Chen, S., Leung, L.Y.R., Qian, Y., Kok, J., Zaveri, R.A., Huang, J., 2013.Uncertainty in modeling dust mass balance and radiative forcing from sizeparameterization. Atmos. Chem. Phys. 13, 10733–10753.