Embed Size (px)
Citation preview
DEPTH SALIENCY BASED ON ANISOTROPIC CENTER-SURROUND DIFFERENCE
Ran Ju, Ling Ge, Wenjing Geng, Tongwei Ren and Gangshan Wu
State Key Laboratory for Novel Software TechnologyNanjing University, China
[email protected], [email protected], [email protected],[email protected], [email protected]
ABSTRACT
Most previous works on saliency detection are dedicated to2D images. Recently it has been shown that 3D visualinformation supplies a powerful cue for saliency analysis. Inthis paper, we propose a novel saliency method that workson depth images based on anisotropic center-surround dif-ference. Instead of depending on absolute depth, we mea-sure the saliency of a point by how much it outstands fromsurroundings, which takes the global depth structure intoconsideration. Besides, two common priors based on depthand location are used for refinement. The proposed methodworks within a complexity of O(N) and the evaluation ona dataset of over 1000 stereo images shows that our methodoutperforms state-of-the-art.
Index Terms— Saliency detection, depth image
1. INTRODUCTION
Saliency detection [1] is also regarded as visual attentionfor human. The activity is a complex process includingvisual information gathering and filtering, with its aim to findthe most conspicuous regions rapidly from sight. By onlyselecting the salient subset for further processing, the com-plexity of higher visual analysis can be reduced significantly.Many applications benefit from saliency analysis, e.g. objectsegmentation [2], image classification [3, 4], image/videoretargeting [5, 6], compression [7] and quality assessment [8].
Computational saliency model [1] performs a feature inte-gration process similar to human activity, which first extractsfeatures from input visual information and then integratesthem into a saliency map. Both visual information gatheringand feature extraction contribute largely to saliency detection.For convenience, most existing works [9, 10, 11] take a 2Dcolor image as input, which turns out to be insufficient incertain cases. We give a few examples of saliency detectionresults in Fig. 1 (d)-(f).
This work is supported by the National Science Foundation of Chinaunder Grant No.61321491 and No.61202320, Research Project of ExcellentState Key Laboratory (No.61223003), Natural Science Foundation of JiangsuProvince (No.BK2012304) and National Special Fund (No.2011ZX05035-004-004HZ).
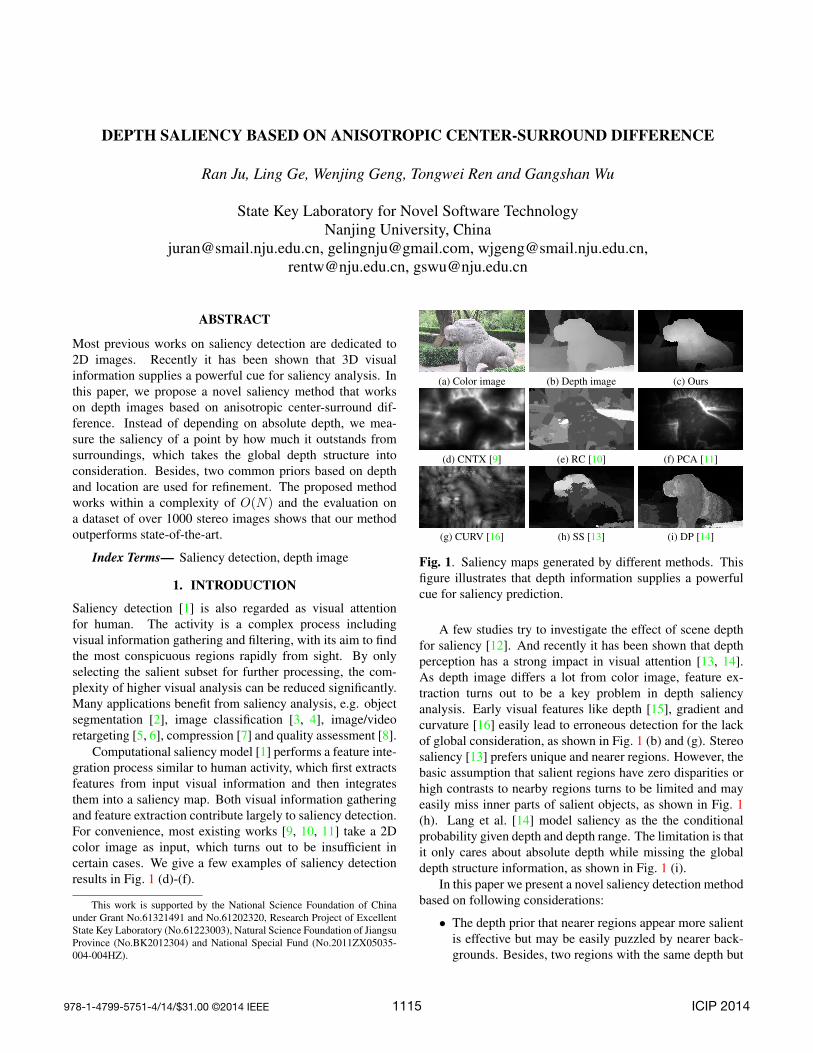
(a) Color image (b) Depth image (c) Ours
(d) CNTX [9] (e) RC [10] (f) PCA [11]
(g) CURV [16] (h) SS [13] (i) DP [14]
Fig. 1. Saliency maps generated by different methods. Thisfigure illustrates that depth information supplies a powerfulcue for saliency prediction.
A few studies try to investigate the effect of scene depthfor saliency [12]. And recently it has been shown that depthperception has a strong impact in visual attention [13, 14].As depth image differs a lot from color image, feature ex-traction turns out to be a key problem in depth saliencyanalysis. Early visual features like depth [15], gradient andcurvature [16] easily lead to erroneous detection for the lackof global consideration, as shown in Fig. 1 (b) and (g). Stereosaliency [13] prefers unique and nearer regions. However, thebasic assumption that salient regions have zero disparities orhigh contrasts to nearby regions turns to be limited and mayeasily miss inner parts of salient objects, as shown in Fig. 1(h). Lang et al. [14] model saliency as the the conditionalprobability given depth and depth range. The limitation is thatit only cares about absolute depth while missing the globaldepth structure information, as shown in Fig. 1 (i).
In this paper we present a novel saliency detection methodbased on following considerations:
• The depth prior that nearer regions appear more salientis effective but may be easily puzzled by nearer back-grounds. Besides, two regions with the same depth but
978-1-4799-5751-4/14/$31.00 ©2014 IEEE ICIP 20141115
different surroundings should be differentiated.
• Salient objects tend to outstand from surrounding back-grounds. The surroundings should be globally consid-ered because the inner part of an object tends to be flatbut the entire object may be protruding. This assump-tion is more effective than depth prior because it prefersrelative depth to absolute depth with considering ofscene structures, which can be seen from the stereo andhuman eye fixation dataset [13, 14].
• Center regions are more salient than peripheral due tothe common photography tendency, which has beenshown in previous works [11].
• The computation for saliency should be efficient forhigher level visual processing tasks as stated in [1].
Our method arises from the above considerations. We de-fine the depth saliency of a point as how much it outstandsfrom surroundings, which is measured using an anisotropiccenter-surround operator. Besides, we employ the depth andcenter priors for refinement. Considering of efficiency androbustness we perform saliency detection on the superpixelgranularity. Our method is O(N) complex where N is thenumber of image pixels. For evaluation we build a dataset thatcontains over 1000 stereo images with salient object masks.The results show that our method can outperform state-of-the-art on detecting salient regions.
2. APPROACH
2.1. Depth Acquisition
We first consider how to acquire depth information. Thereare a lot of devices to capture depth like Time of Flight(ToF) camera, laser range scanner, structured light scanneretc. In this work we choose to recover depth maps from stereoimages because they are easy to capture and popular in dailylife. And hence we can easily collect data for evaluation fromresources like image website, daily life photographing and 3Dmovie snapshots. The depth image is generated using Sun’soptical flow method [17] for its accuracy and robustness. Anexample is shown in Fig. 1 (b) where nearer pixels appearbrighter and vice versa.
2.2. Anisotropic Center-Surround Difference
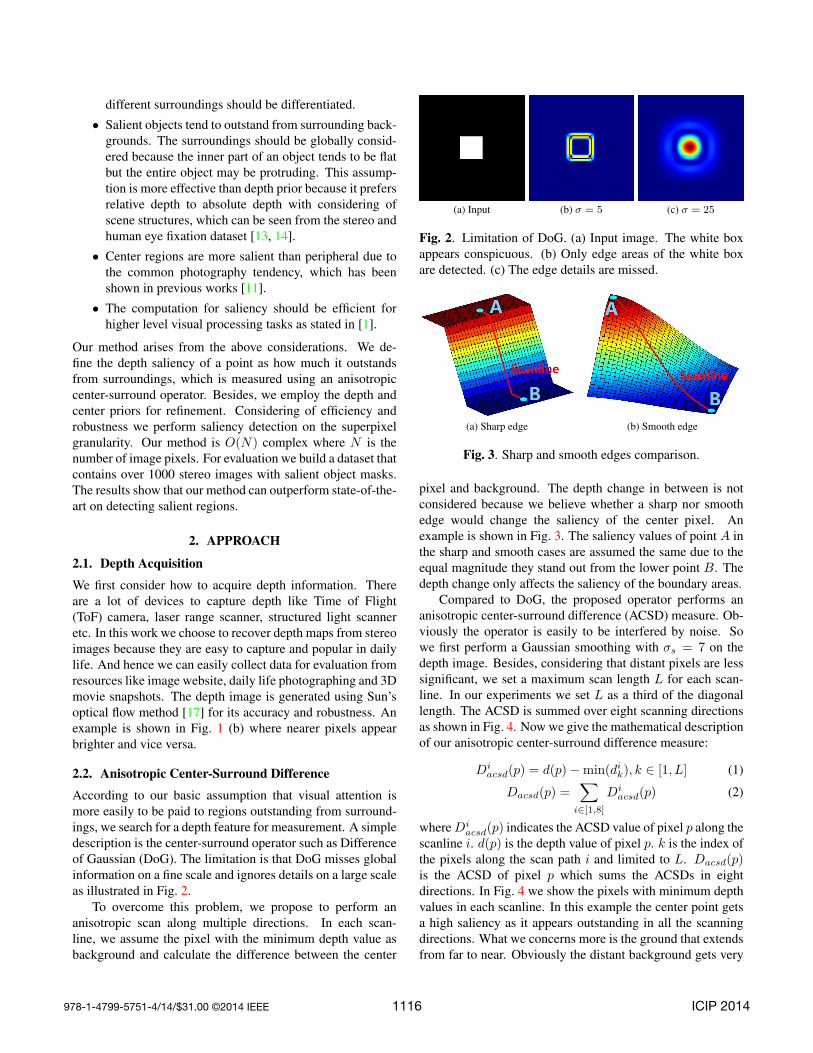
According to our basic assumption that visual attention ismore easily to be paid to regions outstanding from surround-ings, we search for a depth feature for measurement. A simpledescription is the center-surround operator such as Differenceof Gaussian (DoG). The limitation is that DoG misses globalinformation on a fine scale and ignores details on a large scaleas illustrated in Fig. 2.
To overcome this problem, we propose to perform ananisotropic scan along multiple directions. In each scan-line, we assume the pixel with the minimum depth value asbackground and calculate the difference between the center
(a) Input (b) σ = 5 (c) σ = 25
Fig. 2. Limitation of DoG. (a) Input image. The white boxappears conspicuous. (b) Only edge areas of the white boxare detected. (c) The edge details are missed.
(a) Sharp edge (b) Smooth edge
Fig. 3. Sharp and smooth edges comparison.
pixel and background. The depth change in between is notconsidered because we believe whether a sharp nor smoothedge would change the saliency of the center pixel. Anexample is shown in Fig. 3. The saliency values of point A inthe sharp and smooth cases are assumed the same due to theequal magnitude they stand out from the lower point B. Thedepth change only affects the saliency of the boundary areas.
Compared to DoG, the proposed operator performs ananisotropic center-surround difference (ACSD) measure. Ob-viously the operator is easily to be interfered by noise. Sowe first perform a Gaussian smoothing with σs = 7 on thedepth image. Besides, considering that distant pixels are lesssignificant, we set a maximum scan length L for each scan-line. In our experiments we set L as a third of the diagonallength. The ACSD is summed over eight scanning directionsas shown in Fig. 4. Now we give the mathematical descriptionof our anisotropic center-surround difference measure:
Diacsd(p) = d(p)−min(dik), k ∈ [1, L] (1)
Dacsd(p) =∑
i∈[1,8]
Diacsd(p) (2)
where Diacsd(p) indicates the ACSD value of pixel p along the
scanline i. d(p) is the depth value of pixel p. k is the index ofthe pixels along the scan path i and limited to L. Dacsd(p)is the ACSD of pixel p which sums the ACSDs in eightdirections. In Fig. 4 we show the pixels with minimum depthvalues in each scanline. In this example the center point getsa high saliency as it appears outstanding in all the scanningdirections. What we concerns more is the ground that extendsfrom far to near. Obviously the distant background gets very
978-1-4799-5751-4/14/$31.00 ©2014 IEEE ICIP 20141116
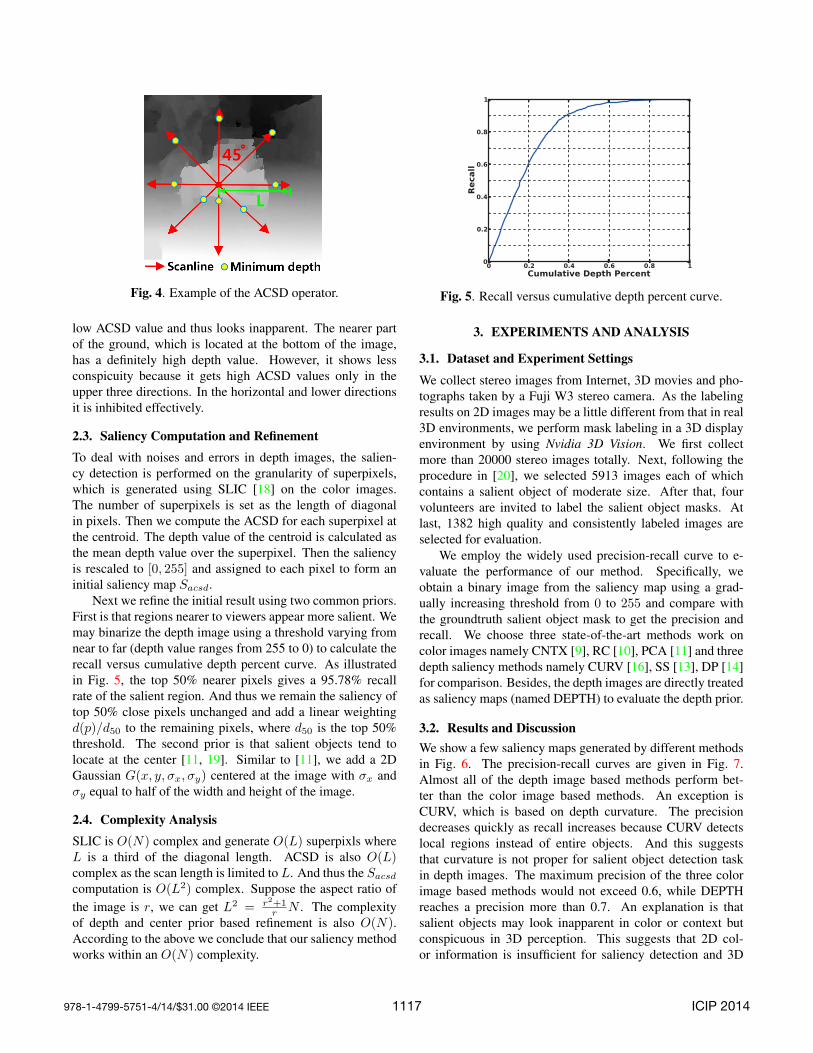
Fig. 4. Example of the ACSD operator.
low ACSD value and thus looks inapparent. The nearer partof the ground, which is located at the bottom of the image,has a definitely high depth value. However, it shows lessconspicuity because it gets high ACSD values only in theupper three directions. In the horizontal and lower directionsit is inhibited effectively.
2.3. Saliency Computation and RefinementTo deal with noises and errors in depth images, the salien-cy detection is performed on the granularity of superpixels,which is generated using SLIC [18] on the color images.The number of superpixels is set as the length of diagonalin pixels. Then we compute the ACSD for each superpixel atthe centroid. The depth value of the centroid is calculated asthe mean depth value over the superpixel. Then the saliencyis rescaled to [0, 255] and assigned to each pixel to form aninitial saliency map Sacsd.
Next we refine the initial result using two common priors.First is that regions nearer to viewers appear more salient. Wemay binarize the depth image using a threshold varying fromnear to far (depth value ranges from 255 to 0) to calculate therecall versus cumulative depth percent curve. As illustratedin Fig. 5, the top 50% nearer pixels gives a 95.78% recallrate of the salient region. And thus we remain the saliency oftop 50% close pixels unchanged and add a linear weightingd(p)/d50 to the remaining pixels, where d50 is the top 50%threshold. The second prior is that salient objects tend tolocate at the center [11, 19]. Similar to [11], we add a 2DGaussian G(x, y, σx, σy) centered at the image with σx andσy equal to half of the width and height of the image.
2.4. Complexity AnalysisSLIC is O(N) complex and generate O(L) superpixls whereL is a third of the diagonal length. ACSD is also O(L)complex as the scan length is limited to L. And thus the Sacsd
computation is O(L2) complex. Suppose the aspect ratio ofthe image is r, we can get L2 = r2+1
r N . The complexityof depth and center prior based refinement is also O(N).According to the above we conclude that our saliency methodworks within an O(N) complexity.
0 0.2 0.4 0.6 0.8 1
Cumulative Depth Percent
0
0.2
0.4
0.6
0.8
1
Recall
Fig. 5. Recall versus cumulative depth percent curve.
3. EXPERIMENTS AND ANALYSIS
3.1. Dataset and Experiment Settings
We collect stereo images from Internet, 3D movies and pho-tographs taken by a Fuji W3 stereo camera. As the labelingresults on 2D images may be a little different from that in real3D environments, we perform mask labeling in a 3D displayenvironment by using Nvidia 3D Vision. We first collectmore than 20000 stereo images totally. Next, following theprocedure in [20], we selected 5913 images each of whichcontains a salient object of moderate size. After that, fourvolunteers are invited to label the salient object masks. Atlast, 1382 high quality and consistently labeled images areselected for evaluation.
We employ the widely used precision-recall curve to e-valuate the performance of our method. Specifically, weobtain a binary image from the saliency map using a grad-ually increasing threshold from 0 to 255 and compare withthe groundtruth salient object mask to get the precision andrecall. We choose three state-of-the-art methods work oncolor images namely CNTX [9], RC [10], PCA [11] and threedepth saliency methods namely CURV [16], SS [13], DP [14]for comparison. Besides, the depth images are directly treatedas saliency maps (named DEPTH) to evaluate the depth prior.
3.2. Results and DiscussionWe show a few saliency maps generated by different methodsin Fig. 6. The precision-recall curves are given in Fig. 7.Almost all of the depth image based methods perform bet-ter than the color image based methods. An exception isCURV, which is based on depth curvature. The precisiondecreases quickly as recall increases because CURV detectslocal regions instead of entire objects. And this suggeststhat curvature is not proper for salient object detection taskin depth images. The maximum precision of the three colorimage based methods would not exceed 0.6, while DEPTHreaches a precision more than 0.7. An explanation is thatsalient objects may look inapparent in color or context butconspicuous in 3D perception. This suggests that 2D col-or information is insufficient for saliency detection and 3D
978-1-4799-5751-4/14/$31.00 ©2014 IEEE ICIP 20141117

Fig. 6. Saliency comparisons of different methods. The first column shows the left views of the stereo images. The second andthird column shows the depth images and ground truth salient object masks repectively. The next three columns are the saliencyresults of color image based methods. The last four columns show the results of depth saliency methods.
depth cues may supply a more powerful prediction for visualattention in certain cases. Similar results and conclusionsare stated in [13, 14]. An interesting phenomenon is thatDEPTH keeps almost a constant precision rate of 0.7 at therecall rates from 0.1 to 0.8. This corresponds to the top 5%to 30% close pixels in Fig. 5. That is to say, in this rangeeach pixel has a 70% probability to appear salient. The DPmethod which leverages prior probabilities shows no obviousimprovement to DEPTH. This can be explained that relativedepth contributes more to saliency than absolute depth values.SS performs the most close to our method as it takes relativedepth into consideration. As stated in Section 1, the limitationis that its preference to unique regions may miss inner regionsof objects, which can be seen in Fig. 6.
We implement our method in C++ and test on a machinewith a 3.4GHz Intel i7-4770 CPU and 16GB memory. Typ-ically for a 1280 × 720 image, the running time is 0.718s.Specifically, the superpixel segmentation takes 0.656s andsaliency computation takes 0.062s.
4. CONCLUSION
We proposed a salient object detection method that works ondepth images using anisotropic center-surround difference.The method is based on a simple but effective assumptionthat salient objects tend to stand out from surrounding back-ground. Furthermore, two priors based on depth and locationare included for saliency refinement. Our method is fastand works within a linear complexity. The experimentsdemonstrated that our method can be used for rapid andaccurate salient object detection task.
0 0.2 0.4 0.6 0.8
1
Recall
0
0.2
0.4
0.6
0.8
1
Precision
CNTX
RC
PCA
DEPTH
CURV
SS
DP
OURS
Fig. 7. Precision-recall curves of different methods.
5. REFERENCES
[1] Laurent Itti, Christof Koch, and Ernst Niebur, “Amodel of saliency-based visual attention for rapid sceneanalysis,” IEEE Transactions on Pattern Analysis andMachine Intelligence, vol. 20, no. 11, pp. 1254–1259,1998.
[2] Junwei Han, King Ngi Ngan, Mingjing Li, and Hong-Jiang Zhang, “Unsupervised extraction of visualattention objects in color images,” IEEE Transactions
978-1-4799-5751-4/14/$31.00 ©2014 IEEE ICIP 20141118
on Circuits and Systems for Video Technology, vol. 16,no. 1, pp. 141–145, 2006.
[3] Gaurav Sharma, Frederic Jurie, and Cordelia Schmid,“Discriminative spatial saliency for image classifica-tion,” in IEEE Conference on Computer Vision andPattern Recognition. IEEE, 2012, pp. 3506–3513.
[4] Lai-Kuan Wong and Kok-Lim Low, “Saliency-enhancedimage aesthetics class prediction,” in Image Processing(ICIP), 2009 16th IEEE International Conference on.IEEE, 2009, pp. 997–1000.
[5] Matthias Grundmann, Vivek Kwatra, Mei Han, andIrfan Essa, “Discontinuous seam-carving for videoretargeting,” in IEEE Conference on Computer Visionand Pattern Recognition. IEEE, 2010, pp. 569–576.
[6] Daniel Domingues, Alexandre Alahi, and Pierre Van-dergheynst, “Stream carving: an adaptive seam carvingalgorithm,” in Image Processing (ICIP), 2010 17thIEEE International Conference on. IEEE, 2010, pp.901–904.
[7] Laurent Itti, “Automatic foveation for video compres-sion using a neurobiological model of visual attention,”IEEE Transactions on Image Processing, vol. 13, no. 10,pp. 1304–1318, 2004.
[8] Xin Feng, Tao Liu, Dan Yang, and Yao Wang, “Saliencybased objective quality assessment of decoded videoaffected by packet losses,” in Image Processing, 2008.ICIP 2008. 15th IEEE International Conference on.IEEE, 2008, pp. 2560–2563.
[9] Stas Goferman, Lihi Zelnik-Manor, and Ayellet Tal,“Context-aware saliency detection,” IEEE Transactionson Pattern Analysis and Machine Intelligence, vol. 34,no. 10, pp. 1915–1926, 2012.
[10] Ming-Ming Cheng, Guo-Xin Zhang, Niloy J Mitra,Xiaolei Huang, and Shi-Min Hu, “Global contrastbased salient region detection,” in IEEE Conference onComputer Vision and Pattern Recognition. IEEE, 2011,pp. 409–416.
[11] R. Margolin, A. Tal, and L. Zelnik-Manor, “What makesa patch distinct?,” in IEEE Conference on ComputerVision and Pattern Recognition. IEEE, 2013, pp. 1139–1146.
[12] Nabil Ouerhani and H Hugli, “Computing visual atten-tion from scene depth,” in International Conference onPattern Recognition. IEEE, 2000, vol. 1, pp. 375–378.
[13] Yuzhen Niu, Yujie Geng, Xueqing Li, and FengLiu, “Leveraging stereopsis for saliency analysis,”in IEEE Conference on Computer Vision and PatternRecognition. IEEE, 2012, pp. 454–461.
[14] Congyan Lang, Tam V Nguyen, Harish Katti, KarthikYadati, Mohan Kankanhalli, and Shuicheng Yan,“Depth matters: Influence of depth cues on visualsaliency,” in European Conference on Computer Vision,pp. 101–115. Springer, 2012.
[15] Sungmoon Jeong, Sang-Woo Ban, and Minho Lee,“Stereo saliency map considering affective factors andselective motion analysis in a dynamic environment,”Neural Networks, vol. 21, no. 10, pp. 1420–1430, 2008.
[16] Chang Ha Lee, Amitabh Varshney, and David W Jacobs,“Mesh saliency,” in ACM Transactions on Graphics.ACM, 2005, vol. 24, pp. 659–666.
[17] Deqing Sun, Stefan Roth, and Michael J Black, “Secretsof optical flow estimation and their principles,” inIEEE Conference on Computer Vision and PatternRecognition. IEEE, 2010, pp. 2432–2439.
[18] Radhakrishna Achanta, Appu Shaji, Kevin Smith,Aurelien Lucchi, Pascal Fua, and Sabine Susstrunk, “S-lic superpixels compared to state-of-the-art superpixelmethods,” IEEE Transactions on Pattern Analysis andMachine Intelligence, vol. 34, no. 11, pp. 2274–2282,2012.
[19] Tongwei Ren, Ran Ju, Yan Liu, and Gangshan Wu,“How important is location in saliency detection?,” inACM International Conference on Internet MultimediaComputing and Service. IEEE, 2014.
[20] Tie Liu, Zejian Yuan, Jian Sun, Jingdong Wang,Nanning Zheng, Xiaoou Tang, and Heung-Yeung Shum,“Learning to detect a salient object,” IEEE Transactionson Pattern Analysis and Machine Intelligence, vol. 33,no. 2, pp. 353–367, 2011.
978-1-4799-5751-4/14/$31.00 ©2014 IEEE ICIP 20141119


![JOURNAL OF LA Deep Feature Aggregation and Image Re ... · Anisotropic diffusion has been applied to many computer vision problems, such as image segmentation [8], [9], saliency detection](https://img.dokumen.tips/doc/110x75/5eb7fa71bfc067128073b091/journal-of-la-deep-feature-aggregation-and-image-re-anisotropic-diffusion-has.jpg)