Embed Size (px)
Citation preview

RESEARCH ARTICLE Open Access
Depression, malnutrition, and health-related quality of life among Nepali olderpatientsSaruna Ghimire1* , Binaya Kumar Baral2, Buddhi Raj Pokhrel2, Asmita Pokhrel2, Anushree Acharya3, Dipta Amatya1,Prabisha Amatya1 and Shiva Raj Mishra4
Abstract
Background: Little is known about the health, nutrition, and quality of life of the aging population in Nepal.Consequently, we aimed to assess the nutritional status, depression and health-related quality of life (HRQOL) ofNepali older patients and evaluate the associated factors. Furthermore, a secondary aim was to investigate theproposed mediation-moderation models between depression, nutrition, and HRQOL.
Methods: A cross-sectional survey was conducted from January–April of 2017 among 289 Nepali older patients inan outpatient clinic at Nepal Medical College in Kathmandu. Nutritional status, depression and HRQOL were assessedusing a mini nutritional assessment, geriatric depression scales, and the European quality of life tool, respectively. Linearregression models were used to find the factors associated with nutritional status, depression, and HRQOL. Thepotential mediating and moderating role of nutritional status on the relationship between depression and HRQOL wasexplored; likewise, for depression on the relationship between nutritional status and HRQOL.
Results: The prevalence of malnutrition and depression was 10% and 57.4% respectively; depression-malnutritioncomorbidity was 7%. After adjusting for age and gender, nutritional score (β = 2.87; BCa 95%CI = 2.12, 3.62) waspositively associated and depression score (β = − 1.23; BCa 95%CI = − 1.72, − 0.72) was negatively associated withHRQOL. After controlling for covariates, nutritional status mediated 41% of the total effect of depression on HRQOL,while depression mediated 6.0% of the total effect of the nutrition on HRQOL.
Conclusions: A sizeable proportion of older patients had malnutrition and depression. Given that nutritional status hada significant direct (independently) and indirect (as a mediator) effect on HRQOL, we believe that nutritional screeningand optimal nutrition among the older patients can make a significant contribution to the health and well-being ofNepali older patients. Nonetheless, these findings should be replicated in prospective studies before generalization.
Keywords: Nutritional assessment, MNA, Depression, Quality of life, Elderly, Nepal, Mediation, Moderation
BackgroundThe population of older adults, 60 years and above, inNepal has increased from 1.5 million to 2.2 million inrecent years [1, 2]. The 3.5% population growth rate ofthe older adults from 2001 to 2011 is higher than thepopulation growth rate (2%) of the overall country [1–3],which hints at a slowly shifting demographic structure inNepal concomitant with overall gains in life expectancy.
Notably, this growth in life expectancy (10 years gain inthe last 20 years) carries a disease burden. Malnutritionand depression are known major problems amongst se-nior citizens, contributing significantly to decreasedhealth-related quality of life (HRQOL) [4, 5]. Yet, littleis known about the health, nutrition, and HRQOL ofNepali older adults.The national prevalence of malnutrition among Nep-
ali older adults is entirely unknown, although one studyconducted in rural Nepal found an estimated 24%prevalence of malnutrition among older adults [6]. The* Correspondence: [email protected]
1Agrata Health and Education (AHEAD)-Nepal, Kathmandu, NepalFull list of author information is available at the end of the article
© The Author(s). 2018 Open Access This article is distributed under the terms of the Creative Commons Attribution 4.0International License (http://creativecommons.org/licenses/by/4.0/), which permits unrestricted use, distribution, andreproduction in any medium, provided you give appropriate credit to the original author(s) and the source, provide a link tothe Creative Commons license, and indicate if changes were made. The Creative Commons Public Domain Dedication waiver(http://creativecommons.org/publicdomain/zero/1.0/) applies to the data made available in this article, unless otherwise stated.
Ghimire et al. BMC Geriatrics (2018) 18:191 https://doi.org/10.1186/s12877-018-0881-5

current study, conducted among urban older patients,will supplement the previous nutritional assessment inrural Nepal [6] to provide more comprehensive know-ledge on this important issue. Previous studies examin-ing the prevalence of depression among segments ofNepal’s older population found estimates ranging from47 to 53% [7, 8]. In the absence of large nationally rep-resentative studies, small studies conducted in diversesettings, such as the current and previous studies [7, 8],can serve to provide valuable baseline information ondepression status and its correlates among the olderpatients. Aging is one of the most important causes ofdecreasing HRQOL and wellbeing due to biologicalsenescence and socio-psychological changes [9]. Al-though HRQOL indicators have played a major role inthe development of health services globally [10], this isrelatively uncommon in Nepal. Moreover, studies asses-sing the HRQOL of the burgeoning older population inNepal are lacking. One previous study reported lowHRQOL among older adults [11]; however, the studyused a relatively homogenous study population: pre-dominantly female visually impaired nursing home resi-dents, reducing the generalizability of their findings.In 2010, a comprehensive review by the Nepal Geri-
atric Centre [3] for the Ministry of Health and Popula-tion in Nepal highlighted the lack of studies on thehealth, nutritional state, and overall HRQOL of olderadults in Nepal. They recommended continued re-search to fill these gaps in knowledge in order to ef-fectively be able to plan programs and interventionsthat maximize the HRQOL of the older population inNepal. Therefore, our primary aim was to assess thestatus of nutrition, depression, and HRQOL among
Nepali older patients and identify factors that are asso-ciated with these outcomes.Our secondary aim was to evaluate the depression-
nutrition-HRQOL triad in mediation-moderation models(Figs. 1 and 2). We hypothesized that both depressionand malnutrition would have a significant negative im-pact on HRQOL among the older patients in Nepal. Inaddition to finding a bidirectional link between nutri-tional status and depression [4, 12, 13], previous studieshave shown that depression and nutrition independentlycontribute to decreased HRQOL among older adults[4, 5]. Therefore, based on the literature, it is plausiblethat additional moderating or mediating effects may bepresent in the nutrition-depression-HRQOL triad; studiesexploring such mediation-moderation effects are lack-ing. Exploring these pathways and determining whichpathway is more plausible will enrich our understand-ing of the HRQOL of the older adults. More import-antly, it will aide in devising effective interventions topromote HRQOL and healthy aging among the olderadults.
MethodsStudy procedureThis study, abbreviated as NepEldQOL I, supplementsour previous study, NepEldQOL II [14]; together thesestudies provide the most comprehensive portrayal ofthe well-being of Nepal’s older population to date.The current study was conducted in January–April of2017 in the outpatient department (OPD) of NepalMedical College and Teaching Hospital (NMCTH) inKathmandu, Nepal. According to hospital administra-tion data, NMCTH had a total of 138,684 outpatient
Fig. 1 Mediation model a for the association between depression and health related quality of life, mediated by nutrition; b for the associationbetween nutrition and health related quality of life, mediated by depression. X: independent variable; Y: outcome variable; M: mediator variable;a: association between independent variable (X) and potential mediator (M); b: association between potential mediator (M) and outcomevariable (Y), controlling for independent variable (X); c: total effect of the independent variable (X) on outcome variable (Y); c’: direct effect(unmediated) of independent variable (X) on outcome variable (Y). Model is adjusted for age, sex, ethnicity, marital status, smoking, alcoholuse, educational status, perception of negligence/hatred, perceived health status compared to others
Ghimire et al. BMC Geriatrics (2018) 18:191 Page 2 of 15

visits in 2016–2017; of these, 16,567 visits were among pa-tients aged 60 years and above.The required sample size of 289 was calculated by
using StatCalc in Epi Info 7 based on a 24% prevalenceof malnutrition among Nepali older adults [6], 5% alphaor Type I error and a 5% margin of error. Surveyorswere graduate students in medicine and public healthwho were provided with a one-day extensive orientationon the study tools, sampling strategy, and data collectiontechniques. Each day, participants were selected by sys-tematic random sampling from the daily “first-come firstserved” OPD sign-in lists, since NMCTH, like mosthealth service facilities in Nepal, uses only a walk-in ap-pointment system for all new or revisiting patients. Thedaily OPD record (updated continuously throughout theday) served as the population sample reference frame foreach day of data collection, which took place duringnormal business hours from January to mid-April,when the required sample size was achieved. Sur-veyors identified patients ages 60 and above from theOPD list, and subsequently approached every third pa-tient to screen for eligibility. Eligible participants were60 years or older and present in the OPD one on thedata collection days. Those too frail physically or men-tally to respond, and/or with hearing or speech im-pairment were excluded. Consent to participate wasrequested from all eligible patients. If the approachedpatient was deemed ineligible or if s/he refused to par-ticipate, the next eligible patient from the OPD listwas approached. Of the 297 patients approached, eighteligible patients refused to participate; the remaindergranted consent.
Data collection and variablesIndividual face-to-face interviews were conducted withpatients in the waiting area of the OPD. The survey tools
were translated from English to Nepali by the second au-thor and then verified by back-translation to English byanother author, following the protocol for translations[15]. Any disagreement on translation was resolved byadjudication by a third author and mutual consensus be-tween the three authors.
Nutritional assessmentNutritional status was assessed using the Short FormMini Nutritional Assessment (MNA), validated previouslyamong Nepali older adults [6]. For the measurement ofBMI, the surveyors measured each participant’s heightwith a mechanical stadiometer (Prestige HM 007) andweight with a digital weighing scale (SECA GMBH & CoModel: 874). BMI was calculated as weight in kg/(heightin m)2 which was categorized as per instructions in theMNA guide [16]. The cumulative MNA score ranges from0 to 14. A score of less than 8 indicates malnourishment,a score between 8 and 11 points indicates that the subjectis at risk of malnutrition and a score of 12 or higher indi-cates a normal nutritional status. Details on the MNA toolare provided elsewhere [16]; briefly, the MNA short formconsists of six items: decline in food intake, involuntaryweight loss, mobility, psychological stress, neuropsycho-logical problems and body mass index (BMI). While theWorld Health Organization defines malnutrition as “defi-ciencies, excesses, or imbalances in a person’s intake of en-ergy and/or nutrients” [17], we use the words “nutritionalstatus” and “malnourished” throughout the manuscript toreflect only deficient nutritional status in order to be con-sistent with the MNA tool. The Cronbach’s Alpha, whichis the measurement of scale reliability, for the MNA scalein the current study was 0.59.
Depression assessmentThe Geriatric Depression Scale Short Form (GDS) wasused to measure depression [18]. The GDS has beendescribed in detail elsewhere [18]; briefly, it is a15-item instrument with responses in “Yes/No” format.Of the 15 items, 10 indicate the presence of depressionwhen answered positively while the other five are indi-cative of depression when answered negatively (reversecoded for cumulation). A cumulative score of 5 or moresuggests depression [19]. The validity and reliability ofGDS to measure depression among community-dwellingNepali older adults has been established by a previousstudy [20]. The Cronbach’s Alpha for the GDS was 0.81 inthe current study.
Health-related quality of lifeHRQOL was assessed using the European quality of lifetool (EQ-5D) [21]. The Nepali versions of the EQ-5Dtools have been validated in a previous study [22]. TheEQ-5D allows participants to classify their health status
Fig. 2 Moderation model for the moderating effect of nutrition anddepression on health-related quality of life. X and X’: independentvariables; M’: moderation between the independent variables nutritionand depression; Y: outcome variable; β1: association between nutrition(X) and health-related quality of life (Y); β2: association betweendepression (X’) and health-related quality of life (Y); β3: moderationeffect of nutrition and depression on health-related quality of life.Unadjusted model
Ghimire et al. BMC Geriatrics (2018) 18:191 Page 3 of 15

in five different dimensions (i.e., mobility, self-care, usualactivities, pain/discomfort and anxiety/depression) andwithin a three-level response (no problems, moderateproblems, and severe problems) [21]. The five dimen-sions of the ED-5D are then converted into a singleindex value, called EQ-5D index, by using the “EQ-5D-3Lcrosswalk index value calculator” [23], using UnitedKingdom (UK) weights as the reference. The EQ-5Dindex ranges from 0 to 1, where 0 indicates severely ill,and 1 indicates perfect health. Perfect health is repre-sented by no problems across all five dimensions; se-verely ill corresponds to severe problems on all fivedimensions of EQ-5D.Additionally, EQ-5D has a vertically calibrated scale
called the EuroQol visual analytic scale (EQVAS), whichallows participants to rate their overall health on a scaleranging from 0 to 100, where 0 and 100 signify the worstand the best imaginable health state level, respectively.Participants rated their overall health in EQVAS at thelevel they felt best described their health on the studyday. For this study, the Cronbach’s Alpha of the EQ-5Dscale was 0.79.
Sociodemographic variablesSociodemographic variables were self-reported and in-cluded age, gender, ethnicity, religion, marital status,educational status, occupation, monthly family income,family structure, smoking, and alcohol use. For ethnicity,the Nepal Health Management Information System’s‘caste/ethnic groupings’ were used [24]. Due to sparsityin certain categories, related categories were combinedto form three categories: Upper caste, Janjatis, andDalit/other minorities. Education status was categorizedinto three groups: illiterate; informal (no formal school-ing, some literacy); and formal education (any years offormal schooling). Occupation indicated the primaryoccupation of the participant in the past or the currentoccupation if currently employed (n = 27). Adequaterest was defined as sleeping for more than six hoursdaily. Information on primary caretakers was collectedthrough open-ended questioning and recoded into twocategories: son and daughter-in-law as the first; othersas the second.
Statistical analysesStatistical analyses were performed in IBM SPSS v22.Numerical variables are expressed as a mean and stand-ard deviation (SD); categorical variables as frequencyand percentage. Comparisons of means between thegroups were made by independent t-tests or analysis ofvariance, while frequency distributions were evaluatedby Pearson’s chi-square (χ2) test. The Spearman correl-ation coefficient (ϱ) was calculated to estimate the cor-relation of EQVAS with total MNA and GDS scores.
The factors associated with nutritional status, depres-sion, and HRQOL were assessed by three separate lin-ear regression models, each adjusted for age and sex,using the total score of MNA, GDS, and EQVAS as thedependent variable, respectively. To account for non-normally distributed outcome variables and a relativelysmall sample size, bootstrap models with 5000 replica-tions were used for calculating stable estimates of cor-relates and their bias accelerated and corrected (BCa)95% confidence intervals.Two different mediating models were developed for
the depression-nutrition-HRQOL triad (Fig. 1): thefirst uses total MNA score, or nutritional status, as themediator (Fig. 1a) while the second uses total GDSscore, or depression status, as the mediator (Fig. 1b).For moderation analyses (Fig. 2), an interaction be-tween depression and nutritional score was added to abase regression model with depression and nutritionalscore as independent factors; EQVAS was used as theoutcome. The PROCESS macro for SPSS was used forthe mediation-moderation analyses. The mediation ana-lyses were first run without any covariates (Model 1); thenadjusted for age and sex (Model 2); then further adjustedfor ethnicity, marital status, smoking, alcohol use, educa-tional status, perception of negligence/hatred, and per-ceived health status compared to peers (Model 3). For allstatistical tests, two-tailed p-values< 0.05 were consideredstatistically significant.
ResultsDemographic profile of the participantsDetailed characteristics of the study participants can befound in Table 1. A total of 170 males and 119 femalesparticipated. The mean age of participants was 68.5 years,with a range from 60 to 90 years old. Most were Uppercaste (46%) or Janjatis (46%), Hindu (76%), married (80%),illiterate (39%), and lived in a joint family (70.6%). The pri-mary past occupation among males was farming (39%);among females it was household chores (48%). Manyparticipants were reluctant to reveal their monthly familyincome; among respondents (n = 167), the mean monthlyfamily income was $205. Only a small proportion (10%)were actively involved in earnings; over half of the partici-pants were taken care by their son and daughter-in-law.The mean (±SD) BMI, EQVAS, MNA, and GDS scores ofthe participants were 24.9 ± 3.5, 65.2 ± 16.8, 10.9 ± 2.5, and5.9 ± 3.8, respectively (Table 1).
Prevalence and correlates of nutritional statusAppendix Table 5 provides the detailed characteristics ofparticipants based on nutritional status categories as de-fined by MNA. The mean MNA score was 11.0 andranged from 2 to 14. Only about half of the participantshad adequate nutritional status; 10% were malnourished,
Ghimire et al. BMC Geriatrics (2018) 18:191 Page 4 of 15

Table 1 The subjects’ characteristics according to sex
Total (n = 289) Male (n = 170) Female (n = 119) p value
n (%) n (%) n (%)
Age, (mean ± SD) 68.5 ± 6.5 69.5 ± 6.6 67.1 ± 6.1 0.002a
Gender
Male 170 (58.8)
Female 119 (41.2)
Ethnicity
Upper caste 134 (46.4) 84 (49.4) 50 (42.0) 0.429
Janjatis 134 (46.4) 75 (44.1) 59 (49.6)
Dalit and minorities 21 (7.3) 11 (6.5) 10 (8.4)
Religion 0.656
Hindu 220 (76.1) 131 (77.1) 89 (74.8)
Non-Hindu 69 (23.9) 39 (22.9) 30 (25.2)
Marital status 0.138
Married 231 (79.9) 141 (82.9) 90 (75.6)
Separated/Widow/Single 58 (20.1) 29 (17.1) 29 (24.4)
Educational status < 0.001
Illiterate 112 (38.8) 46 (27.1) 66 (55.5)
Informal 97 (33.6) 66 (38.8) 31 (26.1)
Formal 80 (27.7) 58 (34.1) 22 (18.5)
Past Occupation < 0.001
Agriculture 114 (39.4) 73 (42.9) 41 (34.5)
Homemaker 57 (19.7) – 57 (47.9)
Business/job 93 (32.2) 75 (44.1) 18 (15.1)
Others 25 (8.7) 22 (12.9) 3 (2.5)
Monthly family income (n = 167), $, (mean ± SD) 205.3 ± 90.1 206.8 ± 88.8 203.1 ± 92.7 0.799a
Family Structure 0.013
Nuclear 47 (16.3) 21 (12.4) 26 (21.8)
Joint 204 (70.6) 120 (70.6) 84 (70.6)
Extended 38 (13.1) 29 (17.1) 9 (7.6)
Smoking 0.102
Yes 155 (53.6) 98 (57.6) 57 (47.9)
No 134 (46.4) 72 (42.4) 62 (52.1)
Alcohol use 0.397
Yes 98 (33.9) 61 (35.9) 37 (31.1)
No 191 (66.1) 109 (64.1) 82 (68.9)
Self-rated health status 0.380
Better 69 (23.9) 40 (23.5) 29 (24.4)
Similar 139 (48.1) 87 (51.2) 52 (43.7)
Worse 81 (28.0) 43 (25.3) 38 (31.9)
Adequate rest 0.042
Yes 81 (28.0) 40 (23.5) 41 (34.5)
No 208 (72.0) 130 (76.5) 78 (65.5)
Ghimire et al. BMC Geriatrics (2018) 18:191 Page 5 of 15

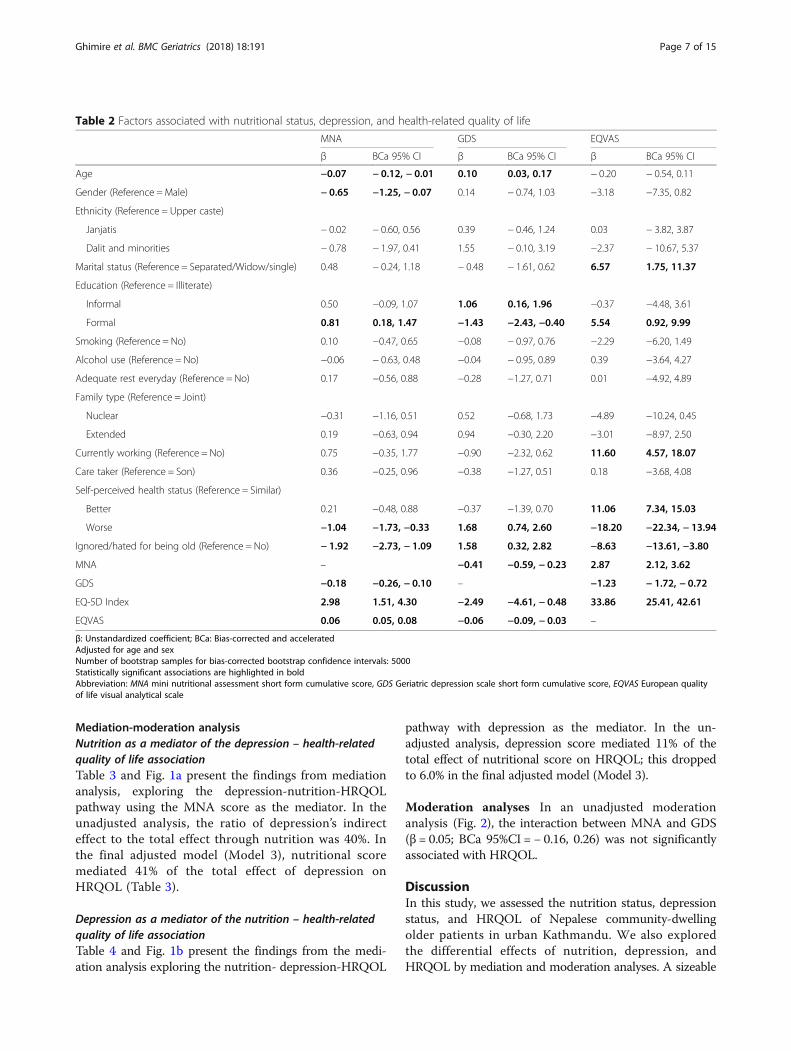
and 38% were at risk of malnutrition. Comorbidity be-tween depression and malnutrition was prevalent among6.9% of the participants (Appendix Table 5). In the regres-sion analysis adjusted for age and sex (Table 2), age (β = −0.07; BCa 95%CI = − 0.12, − 0.01), male gender (β = − 0.65;BCa 95%CI = − 1.25, − 0.07), depression score (β = − 0.18;BCa 95%CI = − 0.26, − 0.10), perception of worsenedhealth (β = − 1.04; BCa 95%CI = − 1.73, − 0.33) and per-ception of ignorance/hatred due to old age (β = − 1.92;BCa 95%CI = − 2.73, − 1.09) were inversely associatedwith the nutritional score from the MNA. Likewise,having formal education (β = 0.81; BCa 95%CI = 0.18,1.47) as well as higher quality of life scores on both theEQ-5D index (β = 2.98; BCa 95%CI = 1.51, 4.30) and theEQVAS (β = 0.06; BCa 95%CI = 0.05, 0.08) were associ-ated with a higher nutritional score on the MNA.
Prevalence and correlates of depressionAppendix Table 6 provides the detailed characteristics ofparticipants based on depression status as defined byGDS. More than half (57%) of the participants met thecriteria of depression (GDS score ≥ 5). In the regressionanalysis adjusted for age and sex (Table 2), higher age(β = 0.10; BCa 95%CI = 0.03, 0.17), perception of wors-ened health (β = 1.68; BCa 95%CI = 0.74, 2.60) and per-ception of ignorance/hatred due to old age (β = 1.58;BCa 95%CI = 0.32, 2.82) were associated with a higherdepression score. Compared to illiterate individuals, thosehaving an informal education (β = 1.06; BCa 95%CI = 0.16,1.96) scored higher on the depression scale whereas thosehaving a formal education (β = − 1.43; BCa 95%CI = −2.43, − 0.40) scored lower. A higher depression score
on the GDS was associated with a lower score on thenutrition scale (β = − 0.41; BCa 95%CI = − 0.59, − 0.23)and lower quality of life scores: EQ-5D index (β = − 2.49;BCa 95%CI = − 4.61, − 0.48) and EQVAS (β = − 0.06;BCa 95%CI = − 0.09, − 0.03).
Health-related quality of life and its correlatesThe responses of participants in the five dimensions ofEQ-5D are provided in Appendix Table 7. The meanEQVAS score and the EQ-5D index were 65.2 and 0.8 re-spectively; scores were significantly lower among partici-pants meeting the criteria for malnutrition or depression.Thirty-six different health statuses were represented in theEQ-5D (Appendix Table 7).EQVAS scores were positively correlated with MNA
scores (ϱ =0.44, p < 0.001) and negatively correlated withGDS scores (ϱ = − 0.28, p < 0.001). In the regressionanalysis adjusted for age and sex using EQVAS as theoutcome (Table 2), a positive association was observed be-tween the EQVAS QOL score and being married (β =6.57; BCa 95%CI = 1.75, 11.37), having a formal education(β = 5.54; BCa 95%CI = 0.92, 9.99), working currently (β =11.60; BCa 95%CI = 4.57, 18.07), better perceived healthstatus (β = 11.06; BCa 95%CI = 7.34, 15.03), and higherMNA score (β = 2.87; BCa 95%CI = 2.12, 3.62). Likewise,an inverse association was observed between the EQVASQOL score and perception of worsen health status (β = −18.20; BCa 95%CI = − 22.34, − 13.94), perception of beingignored/hated for old age (β = − 8.63; BCa 95%CI = −13.61, − 3.80), and the depression score (β = − 1.23; BCa95%CI = − 1.72, − 0.72).
Table 1 The subjects’ characteristics according to sex (Continued)
Total (n = 289) Male (n = 170) Female (n = 119) p value
n (%) n (%) n (%)
Working currently 0.012
Yes 27 (9.3) 22 (12.9) 5 (4.2)
No 262 (90.7) 148 (87.1) 114 (95.8)
Caretaker 0.004
Son and daughter in law 153 (52.9) 78 (45.9) 75 (63.0)
Others 136 (47.1) 92 (54.1) 44 (37.0)
Ignored/hated for being old 0.005
Yes 45 (15.6) 18 (10.6) 27 (22.7)
No 244 (84.4) 152 (89.4) 92 (77.3)
BMI, kg/m2, (mean ± SD) 24.9 ± 3.5 24.8 ± 3.5 24.9 ± 3.7 0.837a
MNA score, (mean ± SD) 10.9 ± 2.5 11.2 ± 2.5 10.7 ± 2.5 0.099a
GDS Score, (mean ± SD) 5.9 ± 3.8 5.9 ± 3.9 5.8 ± 3.7 0.827a
EQVAS, (mean ± SD) 65.2 ± 16.8 66.4 ± 17.3 63.6 ± 16.1 0.179a
ap-value from independent t-test test; all others are chi-square. 1$ = 100 Nepalese rupeesAbbreviation: SD standard deviation, BMI body mass index, MNA mini nutritional assessment short form cumulative score, GDS Geriatric depression scale shortform cumulative score, EQVAS European quality of life visual analytical scale
Ghimire et al. BMC Geriatrics (2018) 18:191 Page 6 of 15
Mediation-moderation analysisNutrition as a mediator of the depression – health-relatedquality of life associationTable 3 and Fig. 1a present the findings from mediationanalysis, exploring the depression-nutrition-HRQOLpathway using the MNA score as the mediator. In theunadjusted analysis, the ratio of depression’s indirecteffect to the total effect through nutrition was 40%. Inthe final adjusted model (Model 3), nutritional scoremediated 41% of the total effect of depression onHRQOL (Table 3).
Depression as a mediator of the nutrition – health-relatedquality of life associationTable 4 and Fig. 1b present the findings from the medi-ation analysis exploring the nutrition- depression-HRQOL
pathway with depression as the mediator. In the un-adjusted analysis, depression score mediated 11% of thetotal effect of nutritional score on HRQOL; this droppedto 6.0% in the final adjusted model (Model 3).
Moderation analyses In an unadjusted moderationanalysis (Fig. 2), the interaction between MNA and GDS(β = 0.05; BCa 95%CI = − 0.16, 0.26) was not significantlyassociated with HRQOL.
DiscussionIn this study, we assessed the nutrition status, depressionstatus, and HRQOL of Nepalese community-dwellingolder patients in urban Kathmandu. We also exploredthe differential effects of nutrition, depression, andHRQOL by mediation and moderation analyses. A sizeable
Table 2 Factors associated with nutritional status, depression, and health-related quality of life
MNA GDS EQVAS
β BCa 95% CI β BCa 95% CI β BCa 95% CI
Age −0.07 − 0.12, − 0.01 0.10 0.03, 0.17 − 0.20 − 0.54, 0.11
Gender (Reference =Male) − 0.65 −1.25, − 0.07 0.14 − 0.74, 1.03 −3.18 −7.35, 0.82
Ethnicity (Reference = Upper caste)
Janjatis − 0.02 − 0.60, 0.56 0.39 − 0.46, 1.24 0.03 − 3.82, 3.87
Dalit and minorities − 0.78 − 1.97, 0.41 1.55 − 0.10, 3.19 −2.37 − 10.67, 5.37
Marital status (Reference = Separated/Widow/single) 0.48 − 0.24, 1.18 − 0.48 − 1.61, 0.62 6.57 1.75, 11.37
Education (Reference = Illiterate)
Informal 0.50 −0.09, 1.07 1.06 0.16, 1.96 −0.37 −4.48, 3.61
Formal 0.81 0.18, 1.47 −1.43 −2.43, −0.40 5.54 0.92, 9.99
Smoking (Reference = No) 0.10 −0.47, 0.65 −0.08 − 0.97, 0.76 −2.29 −6.20, 1.49
Alcohol use (Reference = No) −0.06 − 0.63, 0.48 −0.04 − 0.95, 0.89 0.39 −3.64, 4.27
Adequate rest everyday (Reference = No) 0.17 −0.56, 0.88 −0.28 −1.27, 0.71 0.01 −4.92, 4.89
Family type (Reference = Joint)
Nuclear −0.31 −1.16, 0.51 0.52 −0.68, 1.73 −4.89 −10.24, 0.45
Extended 0.19 −0.63, 0.94 0.94 −0.30, 2.20 −3.01 −8.97, 2.50
Currently working (Reference = No) 0.75 −0.35, 1.77 −0.90 −2.32, 0.62 11.60 4.57, 18.07
Care taker (Reference = Son) 0.36 −0.25, 0.96 −0.38 −1.27, 0.51 0.18 −3.68, 4.08
Self-perceived health status (Reference = Similar)
Better 0.21 −0.48, 0.88 −0.37 −1.39, 0.70 11.06 7.34, 15.03
Worse −1.04 −1.73, −0.33 1.68 0.74, 2.60 −18.20 −22.34, − 13.94
Ignored/hated for being old (Reference = No) − 1.92 −2.73, − 1.09 1.58 0.32, 2.82 −8.63 −13.61, −3.80
MNA – −0.41 −0.59, − 0.23 2.87 2.12, 3.62
GDS −0.18 −0.26, − 0.10 – −1.23 − 1.72, − 0.72
EQ-5D Index 2.98 1.51, 4.30 −2.49 −4.61, − 0.48 33.86 25.41, 42.61
EQVAS 0.06 0.05, 0.08 −0.06 −0.09, − 0.03 –
β: Unstandardized coefficient; BCa: Bias-corrected and acceleratedAdjusted for age and sexNumber of bootstrap samples for bias-corrected bootstrap confidence intervals: 5000Statistically significant associations are highlighted in boldAbbreviation: MNA mini nutritional assessment short form cumulative score, GDS Geriatric depression scale short form cumulative score, EQVAS European qualityof life visual analytical scale
Ghimire et al. BMC Geriatrics (2018) 18:191 Page 7 of 15

proportion of our study population had prevalent malnu-trition and depression.In the current study, nutritional and depression were
inversely related to each other; many malnourished in-dividuals were depressed and vice versa. Although stud-ies quantifying the relationship between nutrition anddepression in older adults in Nepal are lacking, studiesfrom Iran [4, 12], Norway [25], and Brazil [26] supportour findings. The link between poor nutrition and de-pression is biologically plausible [27, 28]: multiple path-ways such as inflammation, oxidative and nitrosativestress, as well as a decrease in antioxidant levels [27, 28]support the underlying role of several nutrients in explain-ing the mechanism of depression.Our mediation analyses suggested that in the depression-
nutrition-HRQOL triad, both nutrition and depressionpartially mediate each others association with HRQOL;however, nutritional status mediated a greater propor-tion of the total effect on HRQOL in comparison to de-pression. Not only did poor nutritional status have asignificant direct effect on HRQOL, but it also partiallyexplained the relationship between depression and HRQOL.Patients with depression are more likely to exhibit lossof appetite, decreased food intake, meal skipping, and
disordered eating; which can lead to poor nutritionaloutcomes and vice-versa [29]. Likewise, in previousstudies, nutritional risk was found to be a significantfactor associated with HRQOL [4, 30]; nutritional well-being can influence HRQOL by affecting functionalability, muscle mass, and formation and transportationof proteins and hormones [31]. In previous studies, de-pressive symptoms and impaired nutritional statuswere independently associated with lower HRQOLscores among the older adults [4, 5]. Our previousstudy, NepEldQOL II [14], also suggested a potentialmediating role of depression in the relationship be-tween nutrition and life-satisfaction. The current studyprovided preliminary evidence to support the role ofnutritional status in maintaining optimal HRQOL amongthe older patients. Public health interventions for opti-mizing HRQOL should consider screening for depres-sion and nutritional status simultaneously. Prospectivestudies, including those that consider healthy adults atbaseline, will be needed to confirm these preliminaryfindings.A sizeable proportion of study participants had
prevalent malnutrition and depression; findings werenot unexpected. Older adults are more vulnerable to
Table 3 Mediation analysis for the association between depression and health-related quality of life, mediated by nutrition
Model 1 Model 2 Model 3
β BCa 95% CI β BCa 95% CI β BCa 95% CI
Total effect, c −1.25 (0.25) −1.75, − 0.75 −1.23 (0.26) − 1.74, − 0.72 −0.74 (0.24) −1.20, − 0.28
Direct effect, c’ −0.74 (0.25) −1.23, − 0.26 −0.76 (0.25) −1.25, − 0.28 −0.44 (0.23) − 0.88, 0.01
Indirect effect, ab −0.50 (0.14) − 0.83, − 0.27 −0.47 (0.14) − 0.77, − 0.24 −0.31 (0.11) − 0.56, − 0.12
Ratio of indirect to total effect mediated 0.40 0.38 0.41
Ratio of indirect to direct effect 0.68 0.61 0.70
Model 1: Unadjusted mediational modelModel 2: Adjusted for age, and sexModel 3: Adjusted for age, sex, ethnicity, marital status, smoking, alcohol use, educational status, perception of negligence/hatred, perceived health statuscompared to othersNumber of bootstrap samples for bias-corrected bootstrap confidence intervals: 5000β: Unstandardized coefficient; BCa: Bias-corrected and accelerated
Table 4 Mediation analysis for the association between nutrition and health-related quality of life, mediated by depression
Model 1 Model 2 Model 3
β BCa 95% CI β BCa 95% CI β BCa 95% CI
Total effect, c 2.90 (0.35) 2.20, 3.60 2.87 (0.36) 2.16, 3.58 2.29 (0.34) 1.62, 2.97
Direct effect, c’ 2.58 (0.37) 1.86, 3.30 2.56 (0.37) 1.83, 3.29 2.14 (0.35) 1.45, 2.84
Indirect effect, ab 0.32 (0.13) 0.12, 0.62 0.31 (0.12) 0.12, 0.60 0.15 (0.09) 0.02, 0.38
Ratio of indirect to total effect mediated, (ab/c) 0.11 0.11 0.06
Ratio of indirect to direct effect, (ab/c’) 0.13 0.12 0.07
Model 1: unadjusted mediational modelModel 2: Adjusted for age, and sexModel 3: Adjusted for age, sex, ethnicity, marital status, smoking, alcohol use, educational status, perception of negligence/hatred, perceived health statuscompared to peersNumber of bootstrap samples for bias-corrected bootstrap confidence intervals: 5000β: Unstandardized coefficient; BCa: Bias-corrected and accelerated
Ghimire et al. BMC Geriatrics (2018) 18:191 Page 8 of 15

malnutrition due to age-associated changes in metab-olism and/or physiological function which may causeanorexia, loss of appetite, deficits in taste and shifts indietary choices and eating habits [32]. A previous studyfrom rural Nepal found higher prevalence, (24% com-pared to our 10%) of malnutrition than this currentstudy [6]. We had expected that the older populationsin urban Nepal would have better nutritional status be-cause households in rural areas are more likely to be fooddeficient [33] with higher overall poverty rates [34]. Add-itionally, older age, female gender, low literacy and lowerfamily income were also associated with poor nutritionalstatus, findings consistent with a previous study [6].Moreover, the prevalence of depression found in ourstudy, over 50%, is consistent with a previous hospital-based study from Kathmandu, Nepal where depression,as defined by GDS, was found among 53.2% of theolder patients [8].The mean EQVAS score and the EQ-5D index were
65.2 and 0.8 respectively. Scores were significantly loweramong participants meeting the criteria for malnutritionor depression. These findings were expected amongolder adults given that age is the strongest predictor ofHRQOL [4, 5]. Aging is characterized by a gradual andlifelong accumulation of molecular and cellular damagethat subsequently leads to a decrease in physiologicalfunctions, increased vulnerability to diseases, and ageneral decline in the capacity of the individual [35, 36].Furthermore, the impact of depression and poor nutritionmay aggravate HRQOL among the older adults who arealready susceptible to poor QOL due to their senescence.
Strengths, limitations, and future research directionsWe present a pioneer study that quantifies the HRQOLamong urban Nepali older patients, filling gaps andadvancing knowledge about the prevalence of andfactors contributing to depression and malnutritionamong Nepali older patients. Moreover, we explorethe relationship between depression, nutritional status,and HRQOL, three important aspects of aging, in theNepalese context. To our knowledge, the mediationand moderation effects of depression and nutritionwith the outcome of HRQOL among the older adultshave not been previously explored in any context.HRQOL, looking at health from an individual’s per-spective, is truly multi-faceted as seen in this study.Simple measures to detect and treat depression amongthe older adults to improve their overall HRQOLshould also examine nutritional wellbeing. Furtherprospective studies are needed to identify the directionof the relationship between depression and nutrition.Nonetheless, this study is subject to some limitations,
including a relatively small sample size. Due to ourcross-sectional study design, no inferences can be made
regarding the causal relationships between nutritionalstatus, depression, and HRQOL. Future studies shoulddetermine if nutritional risk is associated with QOL overtime among older adults. This study recruited partici-pants from outpatient clinics in an urban setting; the nu-tritional status, depression, and HRQOL of the generalpopulation in an urban area and/or those in a rural set-ting may be different, thus limiting the generalizabilityof our findings. Exclusion of older patients who weretoo frail physically or mentally to respond may have re-sulted in a selection bias that underestimated or biasedour findings towards the null. In the current study, theinternal consistency of GDS and EQ-5D was high butthat of the MNA scale was relatively low (Cronbach’sα = 0.59); omission of any MNA component score didnot substantially increase the alpha value (data notshown). Given that the MNA has already been validatedin various settings [37] as well as among Nepali olderadults [6], we nonetheless believe it to be a valid tool toassess nutritional status among the older adults. The useof UK’s general population weights as reference values inthe calculation of the EQ-5D index is not ideal; however,no such reference weights exist for Nepal and the sametechnique was used in the original study validating theNepali version of EQ-5D [22] as well as another studyfrom Nepal [38]. We defined adequate rest as sleeping formore than six hours daily; however, the National SleepFoundation recommends 7–8 h of sleep for older adults[39]; thus we may have overestimated the prevalence ofadequate rest. Moreover, sleep hours were self-reported.Increasing age is associated with multi-morbidity that maylimit functional capacity and reduce the HRQOL [40];presence of comorbidities were not assessed in this study.Future studies should look at the possible mediating andbi-directional relationship of multiple morbidities, nutri-tional status and HRQOL. Lastly, the possibility of re-sidual confounding due to unmeasured covariates cannotbe ruled out.
ConclusionsBoth malnutrition and depression were associated withHRQOL among our study population. Given that nutri-tional status had a significant direct and indirect (as amediator) effect on HRQOL, we believe that nutritionalscreening and optimal nutrition among older patientscan make a significant contribution to the overall HRQOLfor older patients in Nepal. The depression managementprotocol should account for nutritional wellbeing as wellas overall HRQOL in this population. Although we arecautious to make any causal interpretation of the findings,our study lends support to the role of optimal nutritionalstatus and mental health in maintaining the overall healthand well-being of older patients in Nepal.
Ghimire et al. BMC Geriatrics (2018) 18:191 Page 9 of 15

Table 5 Participant’s characteristics by nutritional status
Malnourished, n (%) At risk of malnutrition, n (%) Normal nutritional status, n (%) p-value
Total (Prevalence) 30 (10.4) 109 (37.7) 150 (51.9)
95% CI for prevalence 6.9–13.9 32.3–43.4 46.2–57.6
Age, years, (mean ± SD) 69.6 ± 7.4 69.6 ± 7.1 67.5 ± 5.6 0.021a
Gender 0.028
Male 17 (10.0) 54 (31.8) 99 (58.2)
Female 13 (10.9) 55 (46.2) 51 (42.9)
Ethnicity 0.157
Upper caste 13 (9.7) 43 (32.1) 78 (58.2)
Janjatis 13 (9.7) 56 (41.8) 65 (48.5)
Dalit and minorities 4 (19.0) 10 (47.6) 7 (33.3)
Religion 0.270
Hindu 22 (10.0) 78 (35.5) 120 (54.5)
Non-Hindu 8 (11.6) 31 (44.9) 30 (43.5)
Marital status 0.003
Married 26 (11.3) 76 (32.9) 129 (55.8)
Separated/Widow/Single 4 (6.9) 33 (56.9) 21 (36.2)
Educational status < 0.001
Illiterate 19 (17.0) 55 (49.1) 38 (33.9)
Informal 8 (8.2) 33 (34.0) 56 (57.7)
Formal 3 (3.8) 21 (26.2) 56 (70.0)
Past Occupation 0.008
Agriculture 15 (13.2) 56 (49.1) 43 (37.7)
Homemaker 4 (7.0) 21 (36.8) 32 (56.1)
Business/job 8 (8.6) 24 (25.8) 61 (65.6)
Others 3 (12.0) 8 (32.0) 14 (56.0)
Monthly family income (n = 167), $, (mean ± SD) 164.4 ± 81.3 185.8 ± 92.0 222.6 ± 87.0 0.007 a
Family Structure 0.659
Nuclear 7 (14.9) 18 (38.3) 22 (46.8)
Joint 18 (8.8) 79 (38.7) 107 (52.5)
Extended 5 (13.2) 12 (31.6) 21 (55.3)
Smoking 0.606
Yes 14 (9.0) 57 (36.8) 84 (54.2)
No 16 (11.9) 52 (38.8) 66 (49.3)
Drinker 0.432
Yes 7 (7.1) 38 (38.8) 53 (54.1)
No 23 (12.0) 71 (37.2) 97 (50.8)
Self-rated health status 0.014
Better 7 (10.1) 28 (40.6) 34 (49.3)
Similar 8 (5.8) 48 (34.5) 83 (59.7)
Worse 15 (18.5) 33 (40.7) 33 (40.7)
Adequate rest 0.727
Yes 9 (11.1) 33 (40.7) 39 (48.1)
No 21 (10.1) 76 (36.5) 111 (53.4)
Appendix
Ghimire et al. BMC Geriatrics (2018) 18:191 Page 10 of 15

Table 5 Participant’s characteristics by nutritional status (Continued)
Malnourished, n (%) At risk of malnutrition, n (%) Normal nutritional status, n (%) p-value
Working currently 0.047
Yes 1 (3.7) 6 (22.2) 20 (74.1)
No 29 (11.1) 103 (39.3) 130 (49.6)
Care taker 0.168
Son and daughter in law 20 (13.1) 60 (39.2) 73 (47.7)
Others 10 (7.4) 49 (36.0) 77 (56.6)
Ignored/hated for being old < 0.001
Yes 13 (28.9) 20 (44.4) 12 (26.7)
No 17 (7.0) 89 (36.5) 138 (56.6)
Depression < 0.001
Yes 20 (12.0) 78 (47.0) 68 (41.0)
No 10 (8.1) 31 (25.2) 82 (66.7)
BMI, kg/m2, (mean ± SD) 22.1 ± 3.1 24.2 ± 3.8 25.9 ± 3.0 < 0.001a
MNA, (mean ± SD) 5.7 ± 1.2 9.7 ± 1.2 12.9 ± 0.8 < 0.001a
GDS Score, (mean ± SD) 7.8 ± 4.0 6.8 ± 3.6 4.8 ± 3.5 < 0.001a
EQVAS, (mean ± SD) 49.7 ± 16.3 62.5 ± 16.6 70.4 ± 14.7 < 0.001a
Statistically significant p-value are highlighted in boldap-value from analysis of variance; all others are from Pearson’s chi-square testAbbreviation: SD standard deviation, BMI body mass index, MNASF mini nutritional assessment short form cumulative score, GDS Geriatric Depression scale shortform cumulative score, EQVAS European quality of life visual analytical scale
Ghimire et al. BMC Geriatrics (2018) 18:191 Page 11 of 15

Table 6 Participant’s characteristics by depression status
Depression, n (%) No Depression, n (%) p value
Total (Prevalence) 166 (57.4) 123 (42.6)
95% CI for prevalence 51.7–63.0 37.0–48.3
Age, years, (mean ± SD) 69.3 ± 6.6 67.5 ± 6.3 0.020a
Gender 0.876
Male 97 (57.1) 73 (42.9)
Female 69 (58.0) 50 (42.0)
Ethnicity 0.045
Upper caste 67 (50.0) 67 (50.0)
Janjatis 84 (62.7) 50 (37.3)
Dalit and minorities 15 (71.4) 6 (28.6)
Religion 0.134
Hindu 121 (55.0) 99 (45.0)
Non-Hindu 45 (65.2) 24 (34.8)
Marital status 0.091
Married 39 (67.2) 19 (32.8)
Separated/Widow/Single 127 (55.0) 104 (45.0)
Educational status 0.007
Illiterate 66 (58.9) 46 (41.1)
Informal 65 (67.0) 32 (33.0)
Formal 35 (43.8) 45 (56.3)
Past Occupation 0.202
Agriculture 72 (63.2) 42 (36.8)
Homemaker 35 (61.4) 22 (38.6)
Business/job 47 (50.5) 46 (49.5)
Others 12 (48.0) 13 (52.0)
Monthly family income (n = 167), $, (mean ± SD) 185.8 ± 72.2 228.7 ± 103.4 0.003a
Family Structure 0.268
Nuclear 30 (63.8) 17 (36.2)
Joint 111 (54.4) 93 (45.6)
Extended 25 (65.8) 13 (34.2)
Smoking 0.639
No 75 (56.0) 59 (44.0)
Yes 91 (58.7) 64 (41.3)
Drinker 0.942
No 110 (57.6) 81 (42.4)
Yes 56 (57.1) 42 (42.9)
Self-rated health status 0.025
Better 33 (47.8) 36 (52.2)
Similar 77 (55.4) 62 (44.6)
Worse 56 (69.1) 25 (30.9)
Adequate rest 0.900
Yes 47 (58.0) 34 (42.0)
No 119 (57.2) 89 (42.8)
Ghimire et al. BMC Geriatrics (2018) 18:191 Page 12 of 15

Table 6 Participant’s characteristics by depression status (Continued)
Depression, n (%) No Depression, n (%) p value
Working currently 0.024
Yes 10 (37.0) 17 (63.0)
No 156 (59.5) 106 (40.5)
Care taker 0.223
Son and daughter in law 93 (60.8) 60 (39.2)
Others 73 (53.7) 63 (46.3)
Ignored/hated for being old 0.019
Yes 33 (73.3) 12 (26.7)
No 133 (54.5) 111 (45.5)
Nutritional status < 0.001
Malnourished 20 (66.7) 10 (33.3)
At risk of malnutrition 78 (71.6) 31 (28.4)
Normal nutritional status 68 (45.3) 82 (54.7)
BMI, kg/m2, (mean ± SD) 24.9 ± 3.5 24.9 ± 3.6 0.957a
QOL EQVAS, (mean ± SD) 61.8 ± 16.4 69.9 ± 16.4 < 0.001a
MNASF, (mean ± SD) 10.5 ± 2.6 11.5 ± 2.3 0.001a
GDS Score, (mean ± SD) 8.5 ± 2.6 2.3 ± 1.3 < 0.001a
Statistically significant p-value are highlighted in boldap-value from independent t-test; all others are from Pearson’s chi-square testAbbreviation: SD standard deviation, BMI body mass index, MNASF mini nutritional assessment short form cumulative score, GDS Geriatric Depression scale shortform cumulative score, EQVAS European quality of life visual analytical scale
Ghimire et al. BMC Geriatrics (2018) 18:191 Page 13 of 15

AbbreviationsBCa: Bias Accelerated and Corrected; BMI: Body Mass Index; CI: ConfidenceIntervals; EQ-5D: European Quality of Life Tool; EQVAS: European Quality ofLife Visual Analytic Scale; GDS: Short Form of Geriatric Depression Scale;HRQOL: Health-Related Quality of Life; MNA: Short Form of Mini NutritionalAssessment; NMCTH: Nepal Medical College and Teaching Hospital;OPD: Outpatient Department; QOL: Quality of Life; SD: Standard Deviation
AcknowledgementsWe would like to thank the participants, without whom this study would nothave been possible. We would also like to appreciate the efforts of PrescottCheong and Karen Callahan, School of Community Health Sciences, Universityof Nevada, Las Vegas, in proof reading our work.
Availability of data and materialsAll data generated or analyzed during this study are included in this publishedarticle and its supplementary information files.
Authors’ contributionsConceived and designed the study: SG and BKB. Tool translation to Nepali:BRP, and AA. Facilitated data collection in the field: BKB, BRP, AP, AA, DA, andPA. Analyzed the data: SG and SRM. Drafted the manuscript: SG, BKB and SRM.Critical revision of the manuscript: SG, BKB, BRP, AP, AA, DA, PA and SRM. Approvalof the final version of the manuscript: SG, BKB, BRP, AP, AA, DA, PA and SRM.
Ethics approval and consent to participateThis study received approval from the Institutional Review Committee at NMCTH.A detailed verbal explanation of the purpose of the study as well as theprocedures to be followed, including the collection of anthropometricmeasurements, was given to each respondent. Subsequently, participants wererequested to provide written consent. No monitory incentives were provided.
Consent for publicationNot applicable.
Competing interestsThe authors declare that they have no competing interests.
Table 7 Participants health related quality of life by nutritional and depression status
Total Malnourished At risk ofmalnutrition
Normal nutritionalstatus
p-value Depression NoDepression
p-value
n (%) n (%) n (%) n (%) n (%) n (%)
Mobility 0.001 0.003
No Problem 214(74.0)
16 (53.3) 74 (67.9) 124 (82.7) 112 (67.5) 102 (82.9)
Some Problem 75 (26.0) 14 (46.7) 35 (32.1) 26 (17.3) 54 (32.5) 21 (17.1)
Self-Care < 0.001 0.002
No Problem 238(82.4)
18 (60.0) 81 (74.3) 139 (92.7) 127 (76.5) 111 (90.2)
Some Problem 51 (17.6) 12 (40.0) 28 (25.7) 11 (7.3) 39 (23.5) 12 (9.8)
Usual Activities < 0.001 0.059
No Problem 217(75.1)
14 (46.7) 73 (67.0) 130 (86.7) 116 (69.9) 101 (82.1)
Some Problem 56 (19.4) 11 (36.7) 28 (25.7) 17 (11.3) 39 (23.5) 17 (13.8)
Unable 16 (5.5) 5 (16.7) 8 (7.3) 3 (2.0) 11 (6.6) 5 (4.1)
Pain/Discomfort < 0.001 0.110
No pain 163(56.4)
13 (43.3) 51 (46.8) 99 (66.0) 85 (51.2) 78 (63.4)
moderate pain 111(38.4)
10 (33.3) 56 (51.4) 45 (30.0) 72 (43.4) 39 (31.7)
extreme pain 15 (5.2) 7 (23.3) 2 (1.8) 6 (4.0) 9 (5.4) 6 (4.9)
Anxiety < 0.001 0.160
None 172(59.5)
12 (40.0) 55 (50.5) 105 (70.0) 93 (56.0) 79 (64.2)
Moderate 117(40.5)
18 (60.0) 54 (49.5) 45 (30.0) 73 (44.0) 44 (35.8)
EQVAS, (mean ± SD) 65.2 ±16.8
49.7 ± 16.3 62.5 ± 16.6 70.4 ± 14.7 < 0.001a 61.8 ± 16.4 69.9 ± 16.4 <0.001b
EQ-5D Index, (mean ± SD) 0.8 ± 0.2 0.6 ± 0.4 0.7 ± 0.2 0.8 ± 0.2 < 0.001a 0.7 ± 0.3 0.8 ± 0.2 0.019 b
No of health status in EQ5D 36 16 26 22 30 20 –
Complete health status(11111)
88 (30.4) 7 (23.3) 23 (21.1) 58 (38.7) 44 (26.5) 44 (35.8) –
Statistically significant p-value are highlighted in boldap-value from analysis of variance; bp-value from independent t-test; all others are from Pearson’s chi-square testAbbreviation: SD standard deviation, EQVAS European quality of life visual analytical scale, EQ-5D European Quality of Life five dimension
Ghimire et al. BMC Geriatrics (2018) 18:191 Page 14 of 15

Publisher’s NoteSpringer Nature remains neutral with regard to jurisdictional claims inpublished maps and institutional affiliations.
Author details1Agrata Health and Education (AHEAD)-Nepal, Kathmandu, Nepal.2Department of Biochemistry, Nepal Medical College and Teaching Hospital,Kathmandu, Nepal. 3Department of Nutrition and Dietetics, College ofApplied Food and Dairy Technology, Purbanchal University, Kathmandu,Nepal. 4Nepal Development Society, Bharatpur-10, Nepal.
Received: 8 August 2017 Accepted: 15 August 2018
References1. Central Bureau of Statistics. Nepal - National Population Census 2001, Tenth
census. Kathmandu: National Planning Commission Secretariat, Governmentof Nepal; 2001.
2. Central Bureau of Statistics. National Population and Housing Census 2011(National Report). Kathmandu: National Planning Commission Secretariat,Government of Nepal, National Planning Commission Secretariat; 2012.
3. Geriatric Center Nepal. Status Report on Elderly People (60+) in Nepal onHealth, Nutrition and Social Status Focusing on Research Needs.Kathmandu: Geriatric Center Nepal and Ministry of Health and Population,Government of Nepal; 2010. Available at: http://ageingnepal.org/wp-content/uploads/2015/05/Status-of-older-people-Nepal.pdf.
4. Keshavarzi S, Ahmadi SM, Lankarani KB. The impact of depression andmalnutrition on health-related quality of life among the elderly Iranians.Glob J Health Sci. 2014;7(3):161–70.
5. Shmuely Y, Baumgarten M, Rovner B, Berlin J. Predictors of improvement inhealth-related quality of life among elderly patients with depression. IntPsychogeriatr. 2001;13(1):63–73.
6. Ghimire S, Baral BK, Callahan K. Nutritional assessment of community-dwelling older adults in rural Nepal. PLoS One. 2017;12(2):e0172052.
7. Ranjan S, Bhattarai A, Dutta M. Prevalence of depression among elderlypeople living in old age home in the capital city Kathmandu. HealthRenaissance. 2014;11(3):213–8.
8. Khattri JB, Nepal MK. Study of depression among geriatric population inNepal. Nepal Med Coll J. 2006;8(4):220–3.
9. Charles ST, Carstensen LL. Social and emotional aging. Charles S, CarstensenLL. Social and emotional aging. Annu Rev Psychol. 2010;61:383–409.
10. U.S. Department of Health and Human Services. Healthy People 2010. 2nded. With Understanding and Improving Health and Objectives forImproving Health. 2 vols. Washington, DC: U.S. Government Printing Office;2000. Available at: http://www.healthequityks.org/download/Hllthy_People_2010_Improving_Health.pdf.
11. Dev MK, Paudel N, Joshi ND, Shah DN, Subba S. Psycho-social impact ofvisual impairment on health-related quality of life among nursing homeresidents. BMC Health Serv Res. 2014;14:345.
12. Ahmadi SM, Mohammadi MR, Mostafavi SA, Keshavarzi S, Kooshesh SM,Joulaei H, et al. Dependence of the geriatric depression on nutritionalstatus and anthropometric indices in elderly population. Iran J Psychiatry.2013;8(2):92–6.
13. Bhat RS, Chiu E, Jeste DV. Nutrition and geriatric psychiatry: a neglectedfield. Curr Opin Psychiatry. 2005;18(6):609–14.
14. Ghimire S, Baral BK, Karmacharya I, Callahan K, Mishra SR. Life satisfactionamong elderly patients in Nepal: associations with nutritional and mentalwell-being. Health Qual Life Outcomes. 2018;16(1):118.
15. World Health Organization. Management of substance abuse ResearchTools: Process of translation and adaptation of instruments Geneva; 2016.Available from: http://www.who.int/substance_abuse/research_tools/translation/en/.
16. Kaiser MJ, Bauer JM, Ramsch C, Uter W, Guigoz Y, Cederholm T, et al.Validation of the mini nutritional assessment short-form (MNA-SF): apractical tool for identification of nutritional status. J Nutr Health Aging.2009;13(9):782–8.
17. Malnutrition: Key facts. World Health Organization 2018. Available at: http://www.who.int/news-room/fact-sheets/detail/malnutrition.
18. Yesavage JA, Sheikh JI. 9/geriatric depression scale (GDS) recent evidenceand development of a shorter version. Clin Gerontol. 1986;5(1–2):165–73.
19. McDowell I. Measuring health: a guide to rating scales and questionnaires.New York: Oxford University Press; 2006.
20. Gautam R, Houde S. Geriatric depression scale for community-dwellingolder adults in Nepal. Asian J Gerontol Geriatr. 2011;6(2):93–9.
21. Rabin R, de Charro F. EQ-5D: a measure of health status from the EuroQolgroup. Ann Med. 2001;33(5):337–43.
22. Bhattarai P, Niessen L, Shrestha N, Samir K. Health related quality of life ofadults in Nepal with respiratory symptoms using WHOQOL and EQ-5D. 2005.
23. van Hout B, Janssen MF, Feng YS, Kohlmann T, Busschbach J, Golicki D, etal. Interim scoring for the EQ-5D-5L: mapping the EQ-5D-5L to EQ-5D-3Lvalue sets. Value Health. 2012;15(5):708–15.
24. Lynn B, Dahal DR, Govindasamy P. Caste, ethnic and regional identity inNepal: further analysis of the 2006 Nepal demographic and health surveyCalverton. Maryland: Macro International Inc.; 2008.
25. Kvamme JM, Gronli O, Florholmen J, Jacobsen BK. Risk of malnutrition isassociated with mental health symptoms in community living elderly menand women: the Tromso study. BMC Psychiatry. 2011;11:112.
26. Cabrera MA, Mesas AE, Garcia AR, de Andrade SM. Malnutrition anddepression among community-dwelling elderly people. J Am Med DirAssoc. 2007;8(9):582–4.
27. Maes M, Galecki P, Chang YS, Berk M. A review on the oxidative andnitrosative stress (O&NS) pathways in major depression and their possiblecontribution to the (neuro)degenerative processes in that illness. ProgNeuro-Psychopharmacol Biol Psychiatry. 2011;35(3):676–92.
28. Maes M, Yirmyia R, Noraberg J, Brene S, Hibbeln J, Perini G, et al. Theinflammatory & neurodegenerative (I&ND) hypothesis of depression: leads forfuture research and new drug developments in depression. Metab Brain Dis.2009;24(1):27–53.
29. Gibson EL. Emotional influences on food choice: sensory, physiological andpsychological pathways. Physiol Behav. 2006;89(1):53–61.
30. Keller HH, Ostbye T, Goy R. Nutritional risk predicts quality of life in elderlycommunity-living Canadians. J Gerontol A Biol Sci Med Sci. 2004;59(1):68–74.
31. Amarantos E, Martinez A, Dwyer J. Nutrition and quality of life in olderadults. J Gerontol A Biol Sci Med Sci. 2001;56 Spec No 2:54–64.
32. Wakimoto P, Block G. Dietary intake, dietary patterns, and changes with age:an epidemiological perspective. J Gerontol A Biol Sci Med Sci. 2001;56 Spec No2:65–80.
33. Nepal Thematic Report on Food Security and Nutrition: National PlanningCommission, Central Bureau of Statistics, World Food Program, World Bank,AusAID,UNICEF 2013. Available at: http://documents.wfp.org/stellent/groups/public/documents/ena/wfp256518.pdf
34. Asian Development Bank. Country Poverty Analysis (Detailed) Nepal.Kathmandu, Nepal, 2013. Available at: https://www.adb.org/sites/default/files/linked-documents/cps-nep-2013-2017-pa-detailed.pdf.
35. Kirkwood TB. A systematic look at an old problem. Nature. 2008;451(7179):644–7.36. Steves CJ, Spector TD, Jackson SH. Ageing, genes, environment and
epigenetics: what twin studies tell us now, and in the future. Age Ageing.2012;41(5):581–6.
37. Vellas B, Villars H, Abellan G, Soto ME, Rolland Y, Guigoz Y, et al. Overview ofthe MNA--its history and challenges. J Nutr Health Aging. 2006;10(6):456–63.discussion 63-5
38. Ghimire S, Pradhananga P, Baral BK, Shrestha N. Factors associated withhealth-related quality of life among hypertensive patients in Kathmandu.Nepal Front Cardiovasc Med. 2017;4:69.
39. Hirshkowitz M, Whiton K, Albert SM, Alessi C, Bruni O, DonCarlos L, Hazen N,Herman J, Adams Hillard PJ, Katz ES, et al. National Sleep Foundation'supdated sleep duration recommendations: final report. Sleep Health.2015;1(4):233–43.
40. Ory MG, Cox DM. Forging ahead: linking health and behavior to improvequality of life in older people. Soc Indic Res. 1994;33:89–120.
Ghimire et al. BMC Geriatrics (2018) 18:191 Page 15 of 15