Embed Size (px)
Citation preview

Depreciation Lives and Methods
531
National Tax JournalVol. LIII, No. 3, Part 1
Abstract - In part because of concerns that the tax depreciationsystem may be dated and may not properly measure income, Con-gress directed that the Treasury study the current tax depreciationsystem. This paper is derived from the staff work for the TreasuryStudy. The paper first discusses the rationale for a depreciation al-lowance. It next describes the current tax depreciation system. Usingthe cost of capital, the paper evaluates the current tax depreciationsystem. It then discusses several comprehensive reforms of the taxdepreciation system, and calculates the effects of these reforms onthe cost of capital. The final section discusses several practical prob-lems with the current tax depreciation system.
INTRODUCTION
The U.S. capital cost recovery system has remained largelyunchanged since 1986. Moreover, it is based on an
asset classification system that dates to 1962 and was lastmodified in 1981. Since 1981 entirely new industrieshave developed, and manufacturing processes in traditionalindustries have changed dramatically. Because the currentsystem is dated, some have recently called for its modifica-tion. In response to these concerns, Congress has directedthat the Treasury study the system’s recovery periods anddepreciation methods.1 This paper is derived from the pre-liminary staff work for the forthcoming Treasury Study. 2
Following this introduction, the paper briefly discusses therationale for a depreciation allowance under an income tax.It next describes the current cost recovery or depreciation sys-tem. Using the cost of capital, the fourth section evaluatescurrent law’s depreciation system relative to the standard ofeconomic depreciation. The fifth section discusses severalcomprehensive reforms of the current cost recovery system,and illustrates the effects of these reforms on investment in-centives using the cost of capital. The final section discussesseveral practical problems with the current depreciation sys-tem.
Depreciation Lives and Methods:Current Issues in the U.S. Capital
Cost Recovery System
David W. Brazell &James B. Mackie IIIOffice of Tax Analysis,U.S. Department of theTreasury, Washington,D.C. 20220
1 Section 2022, P.L. 105–277, the Tax and Trade Relief Extension Act of 1998.2 This paper, however, does not necessarily reflect the views of the U.S. Trea-
sury.
NATIONAL TAX JOURNAL
532
DEPRECIATION AND INCOMEMEASUREMENT
A tax system based on income gener-ally does not allow a deduction for the costof a new asset in the year the asset is pur-chased. Instead, it spreads out the deduc-tion over an estimate of the asset’s usefullifetime. The amount allowed as an annualdeduction reflects (however roughly) thereduction in the value of the capital assetas it ages, and is called depreciation.
A depreciation deduction is justifiedunder the standard provided by economicincome (i.e., Haig–Simmons income). Eco-nomic income is a measure of the changein a household’s real economic well-be-ing occurring over some time period, typi-cally taken to be one year. It is thehousehold’s change in wealth, measuredbefore consumption purchases (Goode,1977). Changes, up or down, in the valueof its capital assets are part of ahousehold’s overall change in wealth, andare included in economic income. A taxbased on economic income must allow adeduction when assets fall in value.3
Economic depreciation generally is de-fined as the pure effect of aging on assetvalue (Hulten and Wykoff, 1981, 1996;Fraumeni, 1997), isolated from other fac-tors that might affect asset values over thecourse of a year. Gravelle (1979, 1994) em-phasizes that economic depreciationshould reflect the expected decline in anasset’s value, as opposed to the declineactually observed,4 but not all authorshighlight this distinction. An asset maydepreciate for several reasons. One reasonfor depreciation is that as an asset ages, ithas a progressively shorter future life overwhich it can earn income. Thus, thepresent value of the asset’s future incomestream, which determines its value, fallsas the asset ages. A second reason is thatas it ages, the asset may require more ex-pensive maintenance or become less pro-ductive. Obsolescence sometimes also isconsidered to be a third reason for eco-nomic depreciation, but there appears tobe some ambiguity on this point. 5 Otherfactors that might change an asset’s valueover the course of a year are called revalu-ations. Revaluations include the effects of
3 Substitution of one asset for another of equal value, as occurs when an investment initially is made, does notwarrant a deduction because there is no change in wealth.
4 Gravelle (1979 and 1994) defines economic depreciation as the expected change in asset value over a year. Thisis very close to the definition given in the text, to the extent that expected effects are those associated withaging, while unexpected effects are those associated with revaluations.
5 In the tax policy area, obsolescence generally is considered a cause of depreciation (e.g., as in IRC §167 andBradford, et al., 1984), rather than as a separate revaluation effect. Some of the empirical economics literaturethat estimates economic depreciation, however, seems to view obsolescence as a revaluation effect, as mostclearly stated by Fraumeni (1997) and echoed by Hulten and Wykoff (1981). There is, however, ambiguity onthis point within economic depreciation literature, as Hulten and Wykoff (1979 and 1996), Hulten (1996), andTaubman and Rasche (1969) argue that obsolescence is a reason for depreciation as distinct from revaluation.It is not clear, however, that resolving the issue of whether obsolescence induced declines in an asset’s valueare properly considered to be a component of “economic” depreciation as conceived in the empirical litera-ture is crucial to determining their tax treatment. From the perspective of an accrual–based income tax, thedistinction between depreciation and revaluation is meaningless. All that matters for income measurement isthe net change in the asset’s real value. The overall change in real value should be taxed as it accrues, regard-less of whether one wishes to label part of it depreciation and part revaluation. Indeed, in his influential 1964paper, Samuleson (1964) defines economic depreciation as the decline in the value of an asset over time with-out distinguishing the cause of the decline. His view is that depreciation is the negative side of the coin thathas capital gain as its positive side. From the perspective of a realization based tax system the depreciation/revaluation distinction may be important, but it is not clear how obsolescence should be treated. One mightargue, as Gravelle (1979, 1994) seems to, that a normal allowance for depreciation might properly reflectanticipated changes in asset values, presumably including anticipated obsolescence. Unanticipated changesin asset value (including changes due to unanticipated obsolescence) might be sensibly treated as capitalgains (i.e., as revaluation effects), and taxed when realized.

Depreciation Lives and Methods
533
changes in the relative price of an assetcaused by changes in tastes and by sometypes of obsolescence. Economic deprecia-tion is one important reason for an assetto fall in value over the course of a year.Proper calculation of economic incomethus requires a depreciation deduction.
Inflation can increase nominal valueswithout increasing real economic wellbeing. It is important that inflation’s ef-fects be removed when measuring realeconomic income. When there is inflation,depreciation allowances must increase inproportion to the increase in the generalprice level. Otherwise the real value ofdepreciation allowances will decline overtime, causing over–taxation of real eco-nomic income (Aaron, 1976; Gravelle,1994). Such inflation adjustments arecalled “indexing.”
Gravelle (1979) notes that economicdepreciation has three important charac-teristics. First, it allows the investor torecover his initial investment tax freewhile applying the statutory tax rate tothe return from that investment. This im-plies that granting tax allowances basedon economic depreciation will tax capitalincome at the level implied by the statu-tory tax rate.6 Second, if reinvested, eco-nomic depreciation allows the taxpayer tomaintain the initial value of his invest-ment.7 Third, economic depreciation (atleast as she defines it) measures the ex-pected decline in the real market value ofthe asset as it ages.
CAPITAL COST RECOVERY UNDERCURRENT LAW8
Under current law, the cost of invest-ment is recovered (i.e., received tax–free)in a variety of ways, depending on the par-ticular characteristics of the investment orthe investor.
Depreciation of Physical Equipment andStructures
The Modified Accelerated Cost Recov-ery System (MACRS) applies to most tan-gible depreciable property.9 UnderMACRS, depreciation deductions are notdetermined by measuring the actual (or ex-pected) change in the value of each assetas it ages. Rather, depreciation deductionsare specified by statute and are calculatedusing each asset’s cost recovery period andapplicable depreciation method. Deprecia-tion deductions are based on the historicalcost of the asset; they are not indexed forinflation.10 MACRS depreciation thus de-viates in fundamental ways from the con-cept of economic depreciation.
The MACRS cost recovery period is thelength of time over which capital costs areto be recovered. Recovery periods are de-termined by a classification system thatdistinguishes assets by type, by whetherthey are section 1245 property or section1250 property, and by the activities inwhich they are used. Based on these cri-teria, current law assigns assets to one of
6 This statement assumes that the rest of the tax system properly measures and taxes income.7 This statement assumes that the investment’s relative price does not change.8 Much of this discussion is derived from CCH (1999) and Maule (1994).9 The Internal Revenue Code also describes an Alternative Depreciation System (ADS). At the present time, this
system is used for certain tangible property that has been excluded from the more generous MACRS. TheADS is also used to compute depreciation allowances for the purpose of calculating corporate earnings andprofits. With certain adjustments as to allowable methods, it is also used for certain tangible property placedin service before January 1, 1998 for the purpose of computing depreciation adjustments under the Alterna-tive Minimum Tax (AMT). In certain cases, current law also allows other methods of depreciation, such as thesinking fund method and the income forecast method. In addition, some property is excluded from the sec-tion 168 rules and is depreciated under section 167.
10 MACRS also employs timing conventions that specify a date when property is presumed to have been placedin service, ignores asset salvage values, and generally requires gain or loss recognition when an asset is re-tired.

NATIONAL TAX JOURNAL
534
ten categories with recovery periods thatrange from three to 50 years in length.11
Section 1245 property generally consistsof personal property (equipment) and realproperty that is used as an “integral part”of a production process. Depreciable prop-erty that is not section 1245 property is clas-sified as section 1250 property. Section 1250property consists primarily of buildingsand general purpose land improvements.
MACRS relies heavily on the conceptof class life in determining an asset’s re-covery period.12 Assets with shorter(longer) class lives generally are assignedshorter (longer) recovery periods. Certainassets, such as computers, office furniture,cars and trucks, and land improvementsare assigned the same class life regardless
of the activity in which they are used.Most investments in section 1245 property,however, are assigned a class life that de-pends on the activity in which they areemployed. In contrast, much section 1250property (mainly buildings) receives thesame depreciation treatment regardless ofthe activity in which it is employed.
The depreciation method specifieshow the cost of the investment is to be al-located over the recovery period. Assetswith a recovery period of ten years or lessmay use the double declining balancemethod,13 those with a 15 or 20-year re-covery period may use the 150 percent de-clining balance method,14 while assetswith longer recovery periods use thestraight–line method.15
11 Three–year property includes property with a class life of four years or less. Also included are certain horsesand certain “rent to own” consumer durable property. Five-year property generally includes property with aclass life of more than four years and less than ten years. This property includes: (a) cars, (b) light and heavygeneral purpose trucks, (c) qualified technological equipment, (d) computer–based central office switchingequipment, (e) certain research and experimentation property, (f) semi–conductor manufacturing equipment,(g) geothermal, solar and wind energy property, (h) certain biomass properties, (i) computers and peripheralequipment, and (j) office machinery. Seven–year property includes property with a class life of 10 years ormore but less than 16 years. This property includes office furniture and fixtures, railroad track, and propertythat does not have a class life and is not otherwise classified. Ten year property is property with a class life of 16years or more but less than 20 years. This includes vessels, barges, tugs, and single purpose agricultural andhorticultural structures. Fifteen year property is property with a class life of 20 years or more but less than 25years. It includes municipal wastewater treatment plants and telephone distribution plants and other compa-rable equipment used for the two–way exchange of voice, data communications, and retail motor fuels outlets.Twenty year property includes property with a class life of 25 years or more, other than certain real propertywith a class life of 27.5 years or more. Water utility property and municipal sewers placed in service before June13, 1996 and farm buildings are included in this category. Twenty-five year property includes water utilityproperty and municipal sewers placed in service after June 12, 1996. Residential rental property (e.g., apart-ment buildings) is assigned a 27.5 year recovery period, while other section 1250 property that does not have aclass life of less than 27.5 years (e.g., commercial and industrial buildings) is called nonresidential real prop-erty and is assigned a 39–year recovery period. Railroad gradings or tunnel bores are assigned a 50–year recov-ery period. In addition to these ten recovery periods, MACRS specifies special recovery periods for qualifiedIndian Reservation Property. See CCH (1999) and Section 168 (e) of the Internal Revenue Code.
12 For each investment, this class life is listed in Rev. Proc. 87–56.13 An exception is provided for equipment used in farming, all of which uses the 150 percent declining balance
method, even if three, five or seven year property.14 Because declining balance depreciation would never fully recovery the investment’s cost, the Code specifies
that taxpayers must switch to straight–line depreciation at the point that it would yield a larger deductionthan that granted by declining balance depreciation.
15 To understand declining balance depreciation, it is helpful to first grasp straight–line depreciation. Straight–linedepreciation gives an annual deduction equal to the product of a depreciation rate of 1/L times the historical costof the asset, where L is the asset’s recovery period. For an asset that originally cost $200 and that has a (hypotheti-cal) 5 year recovery period, straight–line depreciation would be $40 (=(1/5)*$200) each year for five years.
The declining balance method calculates depreciation each year as the product of a depreciation rate times theremaining undepreciated basis of the investment. If L is the asset’s cost recovery period, the double declining bal-ance method has a depreciation rate of 2/L. This is twice the straight–line depreciation rate, whence the “double” indouble declining balance (the depreciation rate would be 1.5/L if the method were 150 percent declining balance).
Under the double declining balance method, the base against which the depreciation rate is applied fallseach year to reflect the previous year’s depreciation, whence “declining balance.” For an asset that originallycost $200 and has a 5 year recovery period, double declining balance depreciation would be $80.00 (=(2/5)*$200) in the first year, $48 (=(2/5)*($200 – $80.00)) in the second year, $28.8 (=(2/5)*($200 – $80.00 – $48.00))in the third year, and so on.

Depreciation Lives and Methods
535
Section 1245 property (equipment) gen-erally is assigned to one of the shorter re-covery periods and receives an acceleratedmethod. According to Treasury calcula-tions, most new investment in section 1245property is in the five–year and the seven–year recovery classes and is depreciatedusing the 200 percent declining balancemethod. Section 1250 property (mainlybuildings) generally is assigned to one ofthe longer recovery periods. Residentialbuildings, for example, are depreciatedover 27.5 years using the straight–linemethod, while commercial and industrialbuildings are depreciated over 39 yearsusing the straight–line method.
Cost Recovery for NondepreciableAssets: Inventory, Land, andIntangibles16
The cost of inventories, land, and intan-gibles is not depreciated. The cost of aninvestment in inventory is capitalized anddeducted when the associated goods areconsumed in production or sold.17 Thecost of land is capitalized and deductedagainst sales proceeds when the asseteventually is sold.18
Intangible assets include good will, cus-tomer bases, trademarks, copyrights, pat-ents, and workforce quality. Firms investin these assets through advertising, re-search and development, training pro-grams and other expenses that create fu-ture goodwill and know–how essential for
profitable future production. Expendi-tures on new (self–created) intangibles19
generally are deducted immediately.20
EVALUATION OF CURRENT LAW’SCOST RECOVERY SYSTEM
This section addresses the issue of howthe main features of the current cost re-covery system affect the taxation of capi-tal income. It focuses on: how closely cur-rent law’s cost recovery allowances matchallowances based on economic deprecia-tion, how deviations from economic de-preciation affect the level and distributionof taxes on capital income, and justifica-tions for current law’s deviations fromeconomic depreciation.
Statutorily Determined AllowancesBased on Time
For depreciable assets, the tax code’scost recovery allowances assume that as-sets wear out at a specified rate over time.This rate is independent of the actual orexpected economic conditions facing eachtaxpayer. Thus, the tax code’s deprecia-tion allowances deviate fundamentallyfrom the concept of economic deprecia-tion. At best, statutory scheduler allow-ances could only match economic depre-ciation in an average sense. However,statutory scheduler allowances are muchsimpler for the taxpayer to comply withand for the IRS to enforce than would be
16 We do not discuss here issues related to cost recovery in certain agricultural and natural resource activities.For a brief summary of these issues, including depletion in the extractive industries, see Gravelle (1994).
17 There are two primary methods of inventory accounting: first in, first out (FIFO), and last in, first out (LIFO).Under FIFO, the cost of goods sold is calculated by assuming that the oldest items of inventory (the first in)are the first to be sold (first out). Under LIFO, the costing rule assumes that the youngest items of inventory(the last in) are the first to be sold (first out). LIFO helps protect the firm from taxes on inflationary increasesin the value of inventory, since the last items in inventory will be valued at current (i.e., higher) cost. FIFOoffers no such protection.
18 Certain improvements to land, however, can be depreciated.19 A firm also may acquire an intangible asset from another firm. The cost of a purchased (as opposed to a self–
created) intangible generally is amortized over 15 years. The cost of certain intangible assets, such as advertis-ing to secure a license, may not be recovered until the business is sold (Gann, 1997).
20 However, the Supreme Court’s 1992 INDOPCO decision may suggest that many heretofore deductible ex-penses should be capitalized. INDOPCO v. Commissioner, 503 U.S. 79, 87 (1992).

NATIONAL TAX JOURNAL
536
a method that sought to determine appro-priate economic depreciation for each as-set used by each taxpayer.21
MACRS bases cost recovery allowancesentirely on the passage of time. In contrast,assets may wear out faster or slower de-pending on how intensively they are used.To the extent that intensity of use is impor-tant, MACRS may mismeasure income.
Empirical Evaluation of Current Law’sCapital Cost Recovery System
Present Value of Depreciation Allowances22
An empirical evaluation of the currentcost recovery system requires estimates ofeconomic depreciation against which tocompare the statutorily provided tax de-ductions. The geometric depreciationrates estimated by Hulten and Wykoff(1981) and expanded by Jorgenson andSullivan (1981) are widely used in empiri-cal papers dealing with capital incometaxation (e.g., Auerbach, 1983; Fullerton,1987; and Gravelle, 1994). Literature re-views have favorably evaluated theHulten–Wykoff depreciation rates(Fraumeni, 1997; Hulten and Wykoff,1981, 1996; Jorgenson, 1996; and Gravelle,1999).
However, the Hulten–Wykoff estimateshave a number of serious weaknesses,23
not the least of which is that the evolu-
tion of the economy over the past 20 yearsmay have rendered them obsolete. An-other serious problem is that most of theHulten–Wykoff depreciation rates arebased on extrapolations rather than onexplicit statistical estimates derived fromdata on used asset prices.24 Furthermore,these estimates are averages that relate toasset types, and do not vary according tothe activity in which the asset is employed.In addition, any estimate of depreciationis necessarily backward looking, and somay not be relevant for future (perhapsexpected) changes in asset values.
These problems notwithstanding, theHulten–Wykoff rates may be the bestavailable estimates of economic deprecia-tion, and we use them in this study. For35 types of depreciable assets, these ratesare shown in Table 1, column 2. Expendi-tures on advertising and research anddevelopment (R&D) may create intangibleassets that are long–lived and depreciateas the investment ages.25 Fullerton andLyon (1988) suggest that central estimatesfor the depreciation rates for the intangibleassets created by advertising and R&D are.333 and .15, respectively. Table 1 includesan average of these rates as the deprecia-tion rate for intangibles (asset 36). Table 1also classifies each asset under theMACRS system, based largely on thatasset’s average class life as reported inJorgenson and Sullivan (1981).
21 See the discussion below that considers a switch to economic depreciation.22 This discussion includes results for a single rate of inflation. Because current law’s depreciation allowances
are not indexed for inflation, they have a higher present value the lower the inflation rate. In contrast, thepresent value of economic depreciation is independent of the inflation rate. The conclusions of any analysisof current law’s depreciation system thus depend on the assumed inflation rate. Indeed, inflation–inducedvariation in the present value of current law’s depreciation allowances is one problem with the currentunindexed tax system. At a sufficiently high inflation rate, current law’s depreciation allowances will have asmaller present value than do those based on economic depreciation for all assets. Some of these issues arediscussed in the section below that considers indexing depreciation as a policy reform.
23 In addition to Hulten and Wykoff’s (1981 and 1996) own discussions, see Fraumeni (1996) and Gravelle (1999)on difficulties encountered in using used asset prices to measure depreciation and on controversies surround-ing the Hulten–Wykoff estimates.
24 Assets for which used price data were available nonetheless represented over 50 percent total U.S. investmentin producer’s durable equipment and over 40 percent of total U.S. investment in nonresidential structures(Hulten and Wykoff, 1981).
25 For example, an advertising campaign may generate higher profits over several years (an intangible asset) bycementing brand–loyalty and hence allowing higher prices. As time passes, the value of the asset may depre-ciate, e.g., as customers forget about the clever message and jingle used in the ads.

Depreciation Lives and Methods
537
In order to compare each asset’s eco-nomic depreciation with it’s tax deprecia-tion, Table 1 computes the discountedpresent value of each. These calculationsassume a 3 percent inflation rate, a 3.5percent real rate of return, and that assetsare not sold or exchanged. For most types
of equipment, tax depreciation is acceler-ated relative to economic depreciation. Onaverage, tax depreciation for equipmenthas a present value of 107.7 percent of theaverage present value of economic depre-ciation. Many important types of struc-tures (e.g., industrial and commercial
(relative to econ.depreciation) (%)
111.9117.396.5
108.3112.0107.2102.9109.1113.7109.1
100.6102.9110.1101.498.5
101.1116.1130.0104.7104.7107.7
71.587.7
104.0104.090.864.2
177.0136.9128.4144.6118.7146.8144.480.1
104.4
155.3
116.3
TABLE 1 COMPARISON OF TAX ALLOWANCES WITH ECONOMIC DEPRECIATIONa
Present Value of TaxDepreciation 3% Inflation
1 Furniture and Fixtures2 Fabricated Metal Products3 Engines and Turbines4 Tractors5 Agricultural Machinery6 Construction Machinery7 Mining & Oil Field Machinery8 Metalworking Machinery9 Special Industrial Machinery
10 General Industrial Equipment11 Office and Computing
Machinery12 Service Industry Machinery13 Electrical Machinery14 Trucks, Buses, and Trailers15 Autos16 Aircraft17 Ships and Boats18 Railroad Equipment19 Instruments20 Other Equipment
Average for Equipmentb
21 Industrial Buildings22 Commercial Buildings23 Religious Buildings24 Educational Buildings25 Hospital Buildings26 Other Non–farm Buildings27 Railroads28 Telephone and Telegraph29 Electric Light and Power30 Gas Facilities31 Other Public Utilities32 Farm Structures33 Mining, Shafts, and Wells34 Other Nonbuilding Facilities
Average, Non–Resid. Struct.b
35 Residential Buildings
36 Intangibles
0.1100.0920.0790.1630.0970.1720.1650.1220.1030.122
0.2730.1650.1180.2540.3330.1830.0750.0660.1500.1500.151
0.0360.0250.0190.0190.0230.0450.0180.0330.0300.0300.0450.0240.0560.0290.030
0.015
0.214
77
155757777
577557
10777
3939393939392015201515205
39
27.5
Asset
EconomicDepreciation
RateTaxLife
PresentValue of
EconomicDepreciation(per dollar) (per dollar)
0.7590.7240.6920.8230.7350.8310.8250.7780.7470.778
0.8860.8250.7710.8790.9050.8400.6820.6530.8110.8110.793
0.5080.4140.3490.3490.4000.5650.3350.4880.4620.4620.5630.4040.6170.4530.454
0.300
0.860
0.8490.8490.6680.8910.8230.8910.8490.8490.8490.849
0.8910.8490.8490.8910.8910.8490.7920.8490.8490.8490.854
0.3630.3630.3630.3630.3630.3630.5930.6680.5930.6680.6680.5930.8910.3630.474
0.466
1.000
Source: Authors’ calculations as described in the text.
Notes:aAll calculations assume a 3.5% real rate of return. The nominal rate of return is calculated by adding theinflation rate to the real rate of return.bThese are capital stock weighted averages. The data comes largely from the Bureau of Economic Analysis’(BEA) detailed 1996 capital stocks.

NATIONAL TAX JOURNAL
538
buildings) receive tax depreciation that isless accelerated than economic deprecia-tion. Nonetheless, some particular struc-tures (e.g., railroads and residential build-ings) have tax deprecation allowances thatare rather accelerated. On average, thepresent value of tax allowances for non-residential structures (including publicutility property) is 104.4 percent of thepresent value of economic depreciation,while tax allowances average 91.5 percentof economic depreciation when publicutility property is excluded.
Tax rules allow new expenditures onintangibles to be deducted when incurred.Hence, tax recovery allowances have apresent value of a dollar for each dollarinvested. This exceeds the present valueof economic depreciation for the intan-gible assets reported in Table 1.
The Cost of Capital and Marginal Effective TaxRate26
Table 1’s present value calculations sug-gest that tax depreciation does not accu-rately measure economic depreciation. Bythemselves, however, the present valuecalculations provide an incomplete mea-sure of the effect of tax depreciation al-lowances on investment incentives.27 Thecost of capital offers a more completemeasure of the effects of the tax system,including depreciation and statutory taxrates at the corporate and individual lev-els, on the decision to invest. It is the cost
of capital that influences the behavior ofsavers and investors and that is relevantfor judging the efficiency of the tax sys-tem.
The cost of capital is the pre–tax socialrate of return on a barely profitable invest-ment that covers the investment’s taxcost while still leaving the investor his re-quired after–tax rate of return (Fullerton,1987). A higher cost of capital reflects agreater tax burden and hence a reducedincentive to invest. Deviations in the costof capital across investment reflect differ-ential taxation of alternative invest-ments.28
The information in the cost of capitaloften is expressed as a marginal effectivetax rate (t), which is the difference betweenthe cost of capital (p) and the required af-ter–tax return (s), expressed as a propor-tion of the cost of capital: t = (p – s)/p. Themarginal effective tax rate is the tax ratethat, if applied to economic income,would be equivalent in its incentive effectsto the various complicated features of theactual tax code, at least insofar as theseincentives relate to present values. If thetax system successfully measures andtaxes economic income, then the marginaleffective tax rate equals the statutory taxrate. If tax depreciation allowances areaccelerated (decelerated) relative to eco-nomic depreciation, the marginal effectivetax rate can fall below (rise above) thestatutory tax rate.
26 This section presents results for a single inflation rate. Because current law does not index depreciation, inter-est or capital gains for inflation, cost of capital and effective tax rate calculations are sensitive to the assumedinflation rate. Some of these issues are addressed in the section below that discusses indexing depreciation asan reform option.
27 One problem is that the present value calculations ignore interactions between tax depreciation and otherfeatures of the tax system. For example, the tax reduction afforded by accelerated depreciation is larger thelarger is the statutory tax rate and the investment incentive afforded by accelerated depreciation can be offsetby other tax rules. Accelerated depreciation also might compensate for mismeasurements elsewhere in the taxsystem. A second problem is that present value calculations do not clearly reflect the degree to which currentlaw’s differential acceleration is inconsistent with an efficient, or neutral, income tax (as defined below), be-cause tax neutrality does not call for equal acceleration of all depreciation allowances. When economic depre-ciation is geometric, as assumed in this paper, neutrality calls for greater acceleration for long–lived relative toshort–lived assets. Gravelle (1979), however, suggests that conclusions about the construction of a neutralaccelerated depreciation system can depend on the pattern of economic depreciation.
28 When investments are risky, the cost of capital would reflect a risk premium. The calculations in this paperexclude risk, so that only taxes cause differences in the cost of capital across investments.

Depreciation Lives and Methods
539
Differences in the cost of capital andmarginal effective tax rate across invest-ments may imply that the allocation ofcapital is inefficient, as too much capitalmay be attracted to low tax/low returnprojects.29 Neutrality refers to the degreeto which a tax system imposes the samemarginal effective tax rate on alternativeinvestments. A tax system is fully neutral,and allocationally efficient,30 if it taxes allinvestments at the same marginal effec-tive tax rate. Neutrality also can be mea-sured using the cost of capital since dif-ferences in the cost of capital across invest-ments reflect differential taxation.
Table 2, panel A, presents the cost ofcapital and effective tax rate for a corpo-rate sector investment in each of 37 as-sets.31 The table also includes in panel Bsummary measures, showing the averagecosts of capital for equipment, structures,land, inventories32 and intangibles, andfor the corporate sector as a whole.33 Panel
B also shows calculations for non-corpo-rate investment, investment in owner–oc-cupied housing, and an economy–wideaverage cost of capital and effective taxrate.34
It is apparent from Table 2 that the cur-rent tax system is not fully neutral. If allcorporate assets received economic depre-ciation, all would have a 37.5 percent mar-ginal effective tax rate,35 while if all cor-porate assets received the degree of invest-ment incentive offered on average to thecorporate sector, all would have a 32.2percent marginal effective tax rate. Differ-ences from these norms within the corpo-rate sector are caused by cost recovery al-lowances that are on average accelerated,but offer a different degree of tax incen-tive for each asset.
While marginal effective tax rates varyacross types of equipment, on average in-vestment in equipment is tax favored rela-tive to investment in other assets. Because
29 The allocation of capital is inefficient because output could be increased by shifting a dollar’s worth of capitalfrom a low marginal effective tax rate project to a high marginal effective tax rate project because the highmarginal effective tax rate project offers a higher cost of capital, or social return.
30 Assuming there are no nontax distortions in the economy.31 All cost of capital and effective tax rate calculations exclude the effects of tax credits and other special rapid
amortization provisions. These can be difficult to model and in many cases may not apply at the margin. Forexample, the 20 percent tax credit available for qualified incremental expenditures on R&D is ignored in thesecalculations. This credit is left out of the calculations because its incremental nature makes it difficult to pa-rameterize in an aggregate calculation. Including the credit would reduce the cost of capital for R&D and to aslight extent reduce the average cost of capital for the economy as a whole. The credit would have a theoreti-cally ambiguous effect on the neutrality of the tax system since it would simultaneously increase tax distor-tions across assets within the business sector while reducing tax distortions between the business sector andowner–occupied housing. Regardless of its direction, the credit’s effect on overall neutrality is likely to besmall.
32 These calculations assume that land and inventories do not depreciate. The calculations for inventories as-sume that LIFO is effective in postponing indefinitely any tax on purely inflationary gains on inventory hold-ings.
33 Capital stocks are used as weights in constructing the averages in this and all tables.34 The calculations in Table 2 are based on a 3 percent rate of inflation, a 3.5 percent real after–tax rate of return,
and make a number of additional assumptions, as explained in the notes to that table.35 If only corporate level taxes were considered on an equity–financed investment, economic depreciation would
imply that the marginal effective tax rate would equal the 35 percent statutory corporate tax rate. The mar-ginal effective tax rate calculation, however, includes taxes on shareholders and allows debt finance. Share-holder level taxes on corporate profits, the “double taxation” of corporate equity income, push the marginaleffective tax rate above 35 percent (U.S. Department of the Treasury, 1992). The marginal effective tax ratecalculation also assumes that about two–fifths of the marginal investment is financed by debt. Since the cor-poration can deduct interest payments, the share of the investment’s income attributable to debt financeavoids the corporation income tax as well as shareholder taxes. Instead, interest is taxed only once at thelender’s relative low rate. On average, the double taxation of equity dominates the deductibility of interestand the marginal effective tax rate exceeds 35 percent when tax allowances are based on economic deprecia-tion, as illustrated in Table 3.

NATIONAL TAX JOURNAL
540
TABLE 2COST OF CAPITAL AND MARGINAL EFFECTIVE TAX RATES UNDER CURRENT LAWa
Cost of Capital (%)b Marginal Effective Tax Rate (%)c
A. Individual Corporate Assets
1 Furniture and Fixtures2 Fabricated Metal Products3 Engines and Turbines4 Tractors5 Agricultural Machinery6 Construction Machinery7 Mining & Oil Field Machinery8 Metalworking Machinery9 Special Industrial Machinery
10 General Industrial Equipment11 Office and Computing Machinery12 Service Industry Machinery13 Electrical Machinery14 Trucks, Buses, and Trailers15 Autos16 Aircraft17 Ships and Boats18 Railroad Equipment19 Instruments20 Other Equipment21 Industrial Buildings22 Commercial Buildings23 Religious Buildings24 Educational Buildings25 Hospital Buildings26 Other Non–farm Buildings27 Railroads28 Telephone and Telegraph29 Electric Light and Power30 Gas Facilities31 Other Public Utilities32 Farm Structures33 Mining, Shafts, and Wells34 Other Nonbuilding Facilities35 Residential Buildings36 Intangibles37 Inventories38 Land
B. Summary Measuresd
Corporate SectorEquipmentStructuresPublic UtilitiesInventoriesLandIntangibles
TotalNoncorporate SectorOwner–Occupied HousingEconomy Wide Average
4.84.75.74.84.94.95.35.04.85.05.55.34.95.45.85.54.94.55.25.26.15.85.55.55.76.54.84.95.14.85.15.04.25.9n/a3.65.65.6
5.15.75.05.65.63.65.24.43.84.5
27.825.538.927.529.028.334.029.326.929.336.234.028.834.840.135.828.721.932.432.443.039.136.936.938.645.927.628.631.527.731.629.616.540.7n/a3.8
37.437.4
30.939.029.537.537.53.8
32.220.88.8
21.5
Source: Authors' calculations as described in the text.Notes: aThe calculations assume a 3.5% real rate of return and a 3% inflation rate. They include the effects of federal income taxes atthe corporate and individual levels. State and local taxes on income and property are ignored. The statutory corporate tax rate isassumed to be 35%. The Treasury Individual Tax Model is used to generate personal level tax rates of 20% on capital gains (which isreduced further to account for deferral and for tax–free step–up at death), 27% on dividends, 24% on interest income, 30% onnoncorporate business income, and 23% on home mortgage interest deductions. These rates are modified where appropriate toaccount for tax exempt and insurance company ownership of financial assets. The calculations assume that investments are heldforever and that investments are financed using roughly 2/5s debt and 3/5s equity. bThe cost of capital is the real pre–tax (net ofdepreciation) return needed on an investment to cover its tax cost and still leave the investor his required after–tax return. cTheeffective tax rate is the tax wedge (the difference between the cost of capital and the after–tax return) expressed as percentage of thecost of capital. dThese are capital stock weighted averages. For tangible assets, the data comes from the BEA's 1996 detailed capitalstocks and from the Federal Reserve's Flow of Funds accounts, with adjustments and imputations based on the stocks used inFullerton (1987), and from other sources. The stock of intangibles is computed using the industry shares of intangibles in Fullertonand Lyon (1988). Details are available from the authors.

Depreciation Lives and Methods
541
of accelerated depreciation, the 30.9 percentaverage marginal effective tax rate on cor-porate equipment is below that implied byeconomic depreciation, as well as below theaverage for the corporate sector as a whole.In contrast, depreciation penalizes invest-ment in corporate nonresidential structures(other than public utility property). Be-cause of relatively slow depreciation allow-ances, on average nonresidential buildingsface a 39.0 percent marginal effective taxrate, well above the average marginal ef-fective tax rate for the corporate sector as awhole and above the marginal effective taxrate implied by economic depreciation.Public utility property receives relativelygenerous cost recovery allowances, and sofaces a relatively low 29.5 percent marginaleffective tax rate. Land and inventories donot benefit from accelerated recovery al-lowances and face a 37.5 percent marginaleffective tax rate. Because of expensing, in-tangibles face a very low 3.8 percent mar-ginal effective tax rate.36
Although not entirely related to depre-ciation, current law imposes a lower ef-fective tax rate on noncorporate than oncorporate investment and on business in-vestment than on owner–occupied hous-ing. The corporate/noncorporate differ-ence reflects in large measure the doubletaxation of corporate equity income,compared to the single rate of tax onincome earned by noncorporate invest-ment (U.S. Department of the Treasury,1992). Because of this tax differential,corporate investments may be ineffi-ciently discouraged in favor of invest-ments in the noncorporate sector. The
business/owner–occupied housing taxdifferential reflects the exclusion from tax-able income of implicit rents from invest-ment in owner–occupied housing. 37 Thistax differential may inefficiently discour-age business investment in favor of invest-ment in owner–occupied housing.
Overall, the weighted average marginaleffective tax rate for the economy is 21.5percent, which is a combination of a hightax rate on income from corporate capital(32.2 percent), a medium tax rate on in-come noncorporate capital (20.8 percent),and a low tax rate (8.8 percent) on incomefrom owner–occupied housing.
Rationales for AcceleratedDepreciation38
Current law’s cost recovery provisionsdo not accurately measure economic in-come. This mismeasurement contributes toeffective tax rates that generally are belowstatutory tax rates39 and that vary ineffi-ciently across investments. Nonetheless,not all economists agree that the currentvariation in marginal effective tax rateswithin the business sector is large enoughto imply serious resource misallocations(Auerbach, 1996). Furthermore, acceler-ated recovery allowances offer several ben-efits that must be weighed against theircosts in assessing the overall performanceof the current cost recovery regime.
Promote Efficient Levels of Saving and Investing
There is no over–arching norm that re-quires capital income to be taxed at thesame rate as labor income, or at the statu-
36 The marginal effective tax rate is positive because expensing only removes the corporate level tax. Share-holder level taxes still affect the marginal investment.
37 The positive (rather than zero) effective tax rate on owner–occupied housing reflects the assumption that onlyabout one–half of homeowners itemize and so deduct mortgage interest on the two–fifths of the house’s pricefinanced with a mortgage.
38 This discussion neglects two issues that might be relevant. First, accelerated depreciation has been justified asa proxy for inflation indexing. This is discussed below in the section on inflation indexing. Second, acceler-ated depreciation has been justified as a macroeconomic stimulus. This rationale seems irrelevant in the cur-rent economic expansion, and is questionable in any event (Gravelle, 1994).
39 Noncorporate capital income is taxed at a rate below the average of the statutory tax rate of 30.0 percent onprofits and 22.1 percent on interest.
NATIONAL TAX JOURNAL
542
tory tax rate. Indeed, by taxing the returnto capital, an income tax may inefficientlydiscourage saving and investing(Auerbach, 1996; Engen and Gale, 1996;Feldstein, 1981a). Accelerated deprecia-tion is one way to reduce the marginal ef-fective tax rate on capital income, and soto encourage a more efficient level of sav-ing and investing. There is not universalagreement, however, that capital incometaxes are an important deterrent to invest-ment and saving (Gravelle, 1994;Chirinko, 1986; Hassett and Hubbard,1996; Slemrod, 1992).
Reduce Other Tax Distortions
Accelerated depreciation may help re-duce tax distortions arising from otherfeatures of the current income tax system.To the extent that corporate industriesare relatively heavy users of tax favoredassets, accelerated depreciation helps re-duce some of the tax distortions causedby the double–taxation of corporate,relative to noncorporate, equity income.By lowering the effective tax rate onbusiness investment in plant and equip-ment, accelerated depreciation also helpsreduce owner–occupied housing’s tax ad-vantage.
Correct Externalities
Sometimes a uniform effective tax rateis an inappropriate tax policy goal. Someinvestments may generate benefits to so-ciety at large. To the extent that the pri-vate investor cannot charge for these“positive externalities,” such investmentswill be under–provided by the market.Relatively low taxes on such investmentsmay help to encourage their supply, andhelp correct this “market failure.”40 R&Dis an example of an investment that maybe under–supplied by the private market
because the supplier is unable to fully cap-ture the benefits of his investment. Taxincentives, however, may not be the bestway to encourage investment in R&D(Gravelle, 1994; and sources cited therein).
Spur Economic Growth41
Subsidies also can be rationalized on thegrounds that some types of investmentmay spur economic growth. Attention issometimes focused on equipment, whichsome studies purport to show has a veryhigh social rate of return. (e.g., DeLongand Summers, 1991). The argument thatinvestment spurs economic growth, how-ever, is controversial (Auerbach, et al.,1992; Solow, 1994).
Ease Tax Administration
Administrative reasons may supportsome of the acceleration of cost recoveryallowances seen under current law. Forexample, accurately separating expendi-tures for R&D from other types of spend-ing may be difficult, as may be dividingR&D spending between that which cre-ates a useful asset and that which doesnot. Even if spending on intangible capi-tal can be identified and capitalized, de-termining an appropriate recovery pe-riod and method may be difficult, sinceless is known about the depreciation ofintangibles than about the depreciationof tangible assets (Gravelle, 1994; Gann,1997).
COMPREHENSIVE REFORM BASEDON AN INCOME TAX MODEL
This section discusses four issues re-lated to the comprehensive overhaul ofthe depreciation system: switching toeconomic depreciation, indexing depre-ciation for inflation, tying tax depreciation
40 Other investments may impose “external costs,” and so may be over–provided by the market. Investmentsthat generate external costs should face relatively high tax burdens.
41 The growth rationale actually is a type of market failure or externality rationale. The idea is that investmentshould be subsidized because the private investor does not reap its full reward, some of which accrues toothers in a way that promotes general economic growth.

Depreciation Lives and Methods
543
to book depreciation, and placing de-preciation on a facts and circumstancesbasis.
Switch to Economic Depreciation
Difficulties in Implementing a System Based onEconomic Depreciation
There are two ways to move towards asystem based on economic depreciation.The first would require all assets to be re-valued (marked–to–market) each year.This approach offers the possibility ofmeasuring income correctly for each in-vestment.42 As a practical matter, how-ever, mark–to–market depreciation facestwo serious problems. The first problemis that it would measure the total changein the asset’s real value, including bothdepreciation and revaluation. Mark–to–market would thus represent a big steptowards full accrual taxation of real capi-tal gains, and so would represent muchmore than depreciation reform. It may bedifficult to use a mark–to–market tech-nique to measure only depreciation, whilecontinuing to use realization principles totax gains and losses on depreciable prop-erty; separating the observed change inthe asset’s price into depreciation and re-valuation may be difficult. If the separa-tion were not made, depreciable assetswould be taxed on an accrual basis whileother assets would be taxed on a realiza-tion basis. This may be both inequitableand inefficient.
The second problem is that there is noeasy way to value assets each year. Thereare few active markets in productive as-sets, so that data on the prices of manyused assets are not available. In addition,even where markets exist, problems cre-ated by transaction costs, informationalasymmetries, vintage effects, and firm and
asset–specific characteristics may make itdifficult to infer depreciation from ob-served prices. Other methods of valuationmay not be desirable either. For example,independent appraisals are costly, of du-bious quality, and are likely to be con-tested by the Internal Revenue Service(IRS). Separating expected from observedchanges in value also may be difficult, andis necessary to the extent that deprecia-tion is to reflect anticipated changes in thevalue of the asset. Determining what isbeing valued, e.g., individual assets orcollections of assets (firms), and whatvalue concept to employ, e.g., breakupvalue or going concern value, also canraise difficulties.
A second approach to implementingeconomic depreciation would maintainscheduler deductions, but would basethese deductions on empirical estimatesof economic depreciation. This approachdoes not offer the possibility of gettingdepreciation exactly right for any particu-lar individual investment. It does, how-ever, represent a feasible approach toimplementing tax depreciation deduc-tions that might approximate economicdepreciation on average. Nonetheless, thisapproach also suffers from serious prob-lems.
The largest problem is that we do notknow with certainty what economic de-preciation rates should be, even on aver-age for aggregated classes of investments.While there are many estimates of eco-nomic depreciation, these estimates areinexact and dated.43 Because of theseproblems, comprehensive depreciationreform might require substantial newempirical work. New work, however, islikely to face many of the problems thatplague existing estimates of economicdepreciation. Because of such problems,whether a system based on existing or
42 If asset bases are equated with market values at the end of each taxable year, and the inflation indexed changein value taken as a gain or loss, then marking–to–market properly measures economic income, at least in anex-post sense.
43 See the above discussion of the Hulten–Wykoff depreciation rates.

NATIONAL TAX JOURNAL
544
new estimates of economic depreciationwould represent an improvement overcurrent law is a matter of judgementrather than of fact.
Effects on the Cost of Capital and Effective TaxRate
Setting aside these issues, we can usecost of capital/effective tax rate calcula-tions to illustrate the effect on investmentincentives of a switch to economic depre-ciation. These calculations assume that theHulten–Wykoff estimates adequatelymeasure economic depreciation and areshown in Table 3. The table includes cal-culations based on current law, a proposalto switch to economic depreciation foreach depreciable asset, and a proposal toswitch to economic depreciation for bothdepreciable assets and intangibles.
Because on average economic deprecia-tion is slower than current tax deprecia-tion (at the assumed 3 percent inflationrate), switching to economic depreciationwould slightly raise the effective tax ratefor business investment, and thus for theeconomy as a whole. The proposal togrant economic depreciation for all assets,for example, would raise the economywide average marginal effective tax rateby 3.5 percentage points.
Switching to economic depreciation of-ten is justified as a way to further the goalof tax neutrality. Nevertheless, the calcu-lations in Table 3 suggest that providingeconomic depreciation would not appre-ciably change the uniformity with whichalternative investments are taxed. Theoverall change in the uniformity of the taxsystem can be summarized by a changein the standard deviation of the cost ofcapital. The standard deviation of the costof capital is a measure of the variability
with which alternative investments aretaxed.44 In these calculations, if all invest-ments were taxed at the same marginaleffective tax rate, then the standard devia-tion of the cost of capital would be zero.Differentials in the taxation of alternativeinvestments raise the standard deviationabove zero, with the increase being largerthe larger are these deviations. Under cur-rent law, the standard deviation of the costof capital is 0.0075. Switching to economicdepreciation for depreciable propertywould give a 0.0079 standard deviation,and switching to economic depreciationfor all assets would give a 0.0078 standarddeviation. Thus, these calculations sug-gest that a switch to economic deprecia-tion would leave relatively unchanged theuniformity of taxes on alternative invest-ments.
Switching to economic depreciation hasa small effect on overall tax neutrality be-cause economic depreciation simulta-neously increases tax differentials be-tween some investments while reducingtax differentials between other invest-ments. By raising marginal effective taxrates on business investment, while leav-ing unchanged the marginal effective taxrate on owner–occupied housing, eco-nomic depreciation moves the tax systemaway from neutrality at the margin ofchoice between investment in businesscapital and investment in owner–occu-pied housing. Economic depreciation alsomoves the tax system away from neutral-ity at the margin of choice between cor-porate and noncorporate investment. Ona third score, however, economic depre-ciation improves neutrality by reducingor eliminating tax differences among as-sets within the corporate sector and withinthe noncorporate sector. Taken together,
44 The standard deviation is the square root of the sum of squared deviations from the mean. An alternativemeasure is the coefficient of variation, which is the standard deviation divided by the mean. The coefficient ofvariation gives a more accurate measure of changes in dispersion when mean values change significantly. Allqualitative conclusions about the effects of tax reforms on neutrality continue to hold when tax differences aremeasured using the coefficient of variation in the cost of capital. All conclusions nonetheless are suggestiveonly, as measures of tax dispersion are not a perfect substitute for explicit calculation of efficiency costs.

Depreciation Lives and Methods
545
these three effects roughly cancel, leavingthe overall neutrality of the tax systemabout the same as under current law.
The calculations in Table 3 are based ona relatively low, 3 percent, rate of inflation.However, because economic depreciationis indexed for inflation, while current law’sdepreciation deductions are not, at higherinflation rates economic depreciation cancompare more favorably to current law. Inother calculations we find that at an 8 per-cent rate of inflation, economic deprecia-tion reduces the economy–wide averagemarginal effective tax rate and improvestax neutrality, relative to current law.
Revenue Effects
To the extent that tax allowances wouldbe characterized by depreciation ratessimilar to those estimated by Hulten andWykoff, a switch to economic depreciationcould increase, rather than reduce, tax rev-enue at the current rate of inflation. Thisis because on average current depreciationallowances seem to be somewhat acceler-ated relative to economic depreciation.
Nonetheless, because economic deprecia-tion would be indexed for inflation whilethe current tax system is not, this conclu-sion could change at a sufficiently highrate of inflation.
Grouping Assets By Economic DepreciationRates
One way to address our ignoranceabout economic depreciation would be togroup assets into fairly broad recoveryclasses based on estimates of economicdepreciation rates, rather than try to as-sign a unique depreciation rate to eachspecific asset. Such a grouping mightplace a smaller burden on the scarce in-formation we have about economic depre-ciation, while still using that informationto inform tax policy. It also may be a sim-pler tax system than would be one thatassigns a unique depreciation rate to eachindividual asset.
This type of grouping was proposed inthe Treasury’s 1984 Tax Reform Propos-als (U.S. Department of the Treasury,1984), which used Hulten–Wykoff depre-
37.537.537.537.537.537.537.5
24.5
8.825.0
TABLE 3EFFECT OF ECONOMIC DEPRECIATION ON THE COST OF CAPITAL
AND THE MARGINAL EFFECTIVE TAX RATEa
Corporate Sectorb
EquipmentStructuresPublic UtilitiesInventoriesLandIntangibles
Total
Noncorporate Sector b
Owner–OccupiedHousing
Economy Wide Averageb
Standard Deviation inthe Cost of Capital
Economic Depreciation
Current Law Depreciable Property All Property
Cost ofCapital (%)
MarginalEffective
Tax Rate (%)Cost of
Capital (%)Cost of
Capital (%)
MarginalEffective
Tax Rate (%)
MarginalEffective
Tax Rate (%)
5.15.75.05.65.63.65.2
4.4
3.84.5
0.0075
30.939.029.537.537.53.8
32.2
20.8
8.821.5
5.65.65.65.65.63.65.4
4.6
3.84.6
0.0079
37.537.537.537.537.53.8
35.0
23.1
8.823.4
5.65.65.65.65.65.65.6
4.6
3.84.7
0.0078
Source: Authors’ calculations as described in the text.
Notes:aSee notes for Table 2.bCapital stock weigted averages. See notes for Table 2.

NATIONAL TAX JOURNAL
546
ciation rates to aggregate assets into sevencost recovery classes. Switching from cur-rent law to something like Treasury’s 1984depreciation proposal may improve taxneutrality at some margins. However, thecalculations shown in Table 3 cast doubton such a proposal’s ability to improveneutrality overall, at least at current infla-tion rates.
Economic Depreciation Plus Partial Expensingfor Business Investment
The desire to tax economic income frombusiness investment may conflict with thedesire to offer sufficient tax incentives tosave and invest. It also may conflict withthe desire to tax equally income from busi-ness capital and from essentially tax–ex-empt owner–occupied housing. The cur-rent system of accelerated depreciationaddresses these issues by reducing the taxcost of business investment in general, butit does so in an inefficient way, since ac-celerated depreciation contributes to vary-ing effective tax rates within the businesssector.
Combining economic depreciation withpartial expensing may be a more efficientway to hold down the tax cost of businessinvestment. The reason is that expensinga common fraction of the cost of all busi-ness investments would reduce all mar-ginal effective tax rates equally, and sooffer a uniform, neutral, investment incen-tive.45 Partial expensing also could be eas-ily tracked, limited, and adjusted as thetaxpayer’s situation or the general eco-nomic situation dictates.46
Partial expensing, however, is not freefrom problems. One problem is that it con-centrates deductions in the first year of theinvestment’s lifetime. This may favormature companies with substantial tax-able income over start–up companies thathave insufficient taxable income to fullyuse the tax deduction.47
Indexing Depreciation for Inflation48
In order to properly measure income,or to ensure that the benefit of accelerateddepreciation is invariant to the rate of in-
45 The cost of capital, p, often is calculated as p = (r + d)(1 – uz)/(1 – u) – d, where r is the real discount rate, d is theeconomic depreciation rate, u is the statutory tax rate, and z is the present discounted value of allowances fortax depreciation on a $1 investment (Fullerton, 1987). If assets received economic depreciation then z = d/(r +d) and p = r/(1 – u). Thus, the cost of capital would be independent of the asset’s durability (d), so taxes wouldnot distort the allocation of capital between short–lived (high d) and long–lived (low d) investments. If assetsreceived economic depreciation plus expensing of x percent of the cost of an investment, cost recovery allow-ances would have a present value of (1 – x)d/(r + d) + x, assuming that depreciable basis is reduced by theexpensed portion of the investment’s cost. Thus, the cost of capital would not vary by the asset’s durability,since investments of all durabilities would have a common cost of capital given by r(1 – xu)/(1 – u).
46 In contrast to the simplicity of partial expensing, an investment tax credit must be larger for longer–lived thanfor shorter–lived assets in order to give a uniform tax incentive to invest. The cost of capital with economicdepreciation and an investment tax credit of k percent is (1 – k)r/(1 – u) – kd, assuming that depreciable basisis reduced by the credit, and where other terms are as defined in note 45. This cost of capital is inverselyrelated to the depreciation rate, d, so that a neutral credit must be larger for long–lived (low d) assets than forshort–lived (high d) assets. Neutrality also may require that the present value of accelerated annual deprecia-tion deductions must vary inversely with an asset’s depreciation rate. See Auerbach (1983), Bradford (1980),and Gravelle (1979 and 1994).
47 An investment tax credit faces the same problem. In contrast, accelerated depreciation reduces this problemby spreading deductions out over several years. Other measures, e.g., interest bearing accounts for net oper-ating losses, also could address this problem.
48 Economic depreciation must be indexed for inflation. Thus some of the issues discussed below are also rel-evant for an evaluation of economic depreciation. The concern that the combination of depreciation indexingplus accelerated depreciation may lead to tax shelters and negative marginal effective tax rates does not applywith the same force to a switch to economic depreciation, however, since by definition economic depreciationis not accelerated. Nonetheless, at a sufficiently high rate of inflation the failure to index interest flows forinflation can lead to negative effective tax rates when combined with economic depreciation. See note 53below. The revenue concern is also less of an issue if indexing were combined with economic depreciation, orwith some other deceleration of depreciation deductions.
Depreciation Lives and Methods
547
flation, depreciation allowances shouldrise in proportion to the inflation rate. Incontrast, the current system of tax depre-ciation is based on the historic cost of theasset and is not adjusted, or “indexed,”for inflation.
Issues in Indexing Depreciation for Inflation
Indexing depreciation offers some po-tential benefits. First, it helps promote taxneutrality, at least at some margins. Forexample, it helps prevent inflation fromraising the relative tax advantage toowner–occupied housing.49 Indexing alsohelps to reduce the tax advantage grantedto intangibles, which are expensed, rela-tive to depreciable business property. Sec-ond, indexing depreciation helps ensurethat inflation does not inappropriately in-crease the overall marginal effective taxrate on capital income. Indexing thus helpsmaintain the desired relationship betweenthe taxation of labor income and of capi-tal income, and helps stop inflation fromreducing the incentive to save and invest.
In the past, the interaction of high infla-tion with the unindexed tax system waswidely viewed as a serious problem, onethat potentially reduced the level of invest-ment and distorted the choice of what as-sets to invest in (Henderson, 1985;Feldstein and Summers, 1979; Feldstein,1982).50 Nonetheless, at today’s relativelylow rates of inflation,51 indexing deprecia-
tion (and perhaps the rest of the tax sys-tem) may not seem particularly urgent.Yet, there is no guarantee that inflation willremain low, nor that a low inflation ratedoes not create problems for the taxationof capital income (Feldstein, 1996; Cohenet al., 1997). Moreover, during a low infla-tion period, depreciation indexing mayappear to have a relatively small short–runrevenue cost, making it easier to enact.
While indexing depreciation for infla-tion is justified under an ideal income tax,and offers some potential benefits, it is notuniversally popular. One problem is itsrevenue cost; indexing can be an expen-sive, open–ended, tax reduction.52 Theexcessive revenue cost might be ad-dressed, however, by combining deprecia-tion indexing with slower depreciationallowances. Some also have worried thatindexing depreciation might lead to moregeneral indexing of the tax system andthus tend to destabilize the economy(Feldstein, 1981b), although general in-dexing is not necessarily destabilizing(Fischer, 1977; and Gray, 1976). One vari-ant of this argument worries that index-ing the tax system would reduce publicanti–inflation sentiment and so wouldpave the way for higher rates of inflationin the future (Feldstein, 1996).
Indexing depreciation without address-ing other problems with the tax systemalso has been criticized (Tideman and
49 Failure to index can favor long–lived business assets (i.e., equipment) over short–lived business assets (i.e.,structures) (Auerbach, 1983; and Gravelle, 1979). For example, suppose assets receive tax allowances that aredetermined by the economic depreciation rate, but are unindexed. The cost of capital is given by r/(1 – u) +uyz/(1 – u), where y is the inflation rate, z = d/(r + y + d), and other terms are as defined in note 45. As can beseen by partially differentiating the cost of capital expression first with respect to y and next with respect to d,inflation raises the cost of capital more for a short–lived (big d) asset than it does for a long–lived (small d)asset. Thus, holding the real discount rate constant, failing to index depreciation discriminates against short–lived assets. Reducing this tax bias may not improve overall tax neutrality because unindexed depreciationfor short–lived assets is accelerated relative to unindexed depreciation for long–lived assets over a wide rangeof inflation rates.
50 Not all studies have shown that inflation necessarily raises the effective tax rate or increases the variabilitywith which alternative investments were taxed (Fullerton, 1987; Fullerton and Henderson, 1984; Henderson,1985). Results about the effects of inflation on effective tax rates depend on the specifics of the tax law as wellas on particular modeling and parameter assumptions.
51 Based on the consumer price index, inflation ran at 2.3 percent in 1997 and at 1.6 percent in 1998.52 Revenue cost was an important reason why (comprehensive) indexing in the Treasury’s 1984 tax proposal
was rejected (Perlis, 1988).

NATIONAL TAX JOURNAL
548
Tucker, 1976; Halperin and Steuerle, 1988;Perlis, 1988; Gravelle, 1979). The concernis that given unindexed interest and capi-tal gains, plus depreciation allowancesthat are non–neutral and accelerated atlow rates of inflation, indexing deprecia-tion would not necessarily improve theoverall measurement and taxation of in-come. One particular concern is that in-dexing depreciation might increase thecurrent tax advantage of short–lived busi-ness equipment over long–lived nonresi-dential structures.
A second concern is that indexing canlead to negative effective tax rates, or taxshelters, when combined with debt financ-ing. Debt finance can lead to negative mar-ginal effective tax rates when borrowersface higher tax rates than do lenders and(a) depreciation is accelerated (Ballentine,1988) or (b) interest flows are not indexed(Gravelle, 1994).53 Indexing depreciationeliminates the over–taxation of incomecaused by inflation’s erosion in the realvalue of cost recovery allowances, and soincreases the likelihood of a negative taxrate.
These criticisms do not necessarily carrythe day. Whether indexing is likely to leadto negative effective tax rates and promotetax shelters, for example, is an empiricalquestion that depends in part on the infla-tion rate. Moreover, the fundamental causeof negative marginal effective tax ratesstems from the taxation of interest flows,or perhaps from accelerated depreciation,
not from indexing depreciation. Equaliz-ing tax rates on borrowers and lenders, orindexing interest flows, would seem to bemore effective ways to address the prob-lem of debt related negative tax rates.Nonetheless, these criticisms correctlypoint out that indexing depreciation willnot necessarily improve the overall taxa-tion of capital income in every instance.
Another potential problem is that in-dexing may add complexity to the tax sys-tem (Halperin and Steuerle, 1988;Feldstein, 1981b). Part of the apparentcomplexity of indexing may come fromthe fear that every investment must, or atleast should, have a separate inflationadjustment. Actually, however, a separateadjustment reflecting the change in therelative price of each asset (or even of capi-tal generally) would be inappropriate inour realization based tax system. An ad-justment for general price inflation is allthat is needed. Increasing depreciation toreflect an increase in the relative price ofcapital allows an unrealized increase inthe value of the asset to generate a taxdeduction. This deduction mismeasuresincome and can be avoided by indexingdepreciation to changes in the generalprice level (Gravelle, 1994).
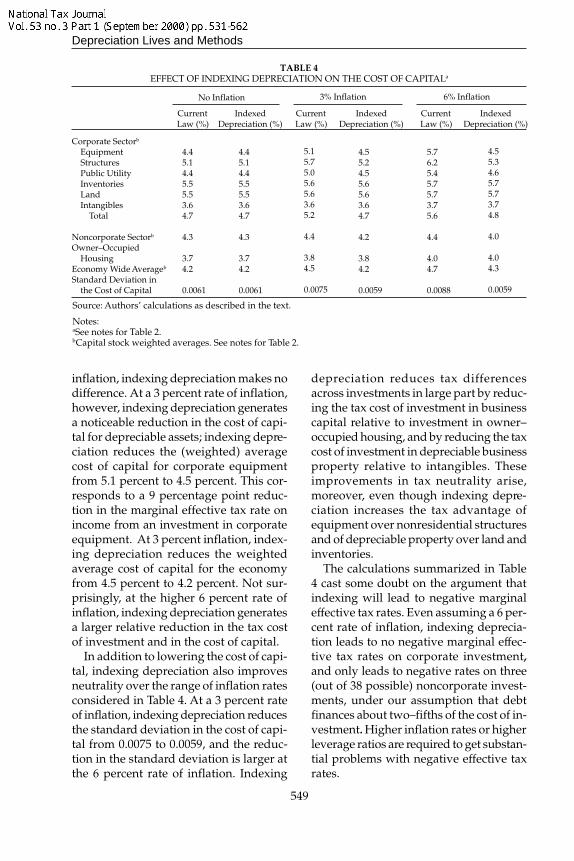
Effect of Indexing Depreciation on the Cost ofCapital and Effective Tax Rate
Table 4 shows the effect at three differ-ent inflation rates of indexing currentdepreciation allowances. At a zero rate of
53 Ballentine’s point is easiest to grasp in the case of expensing. Expensing can lead to a negative marginaleffective tax rate if the borrower deducts the investment’s cost at a higher rate than eventually applied to theinvestment’s cash flow. For example, consider a two period debt financed investment that does not depreci-ate. On a per dollar basis, this investment has an after–tax cost of (1 – u), where u is the borrower’s/investor’stax rate. If the investment earns a pre–tax rate of return of g, then in the second period the investor has taxablecash–flow of (1 + g – i), while the lender has a taxable cash flow of i, where i is the interest rate. The after–taxcash flow in total is 1 + g – u(1 + g – i) – mi, where m is the lender’s tax rate. The after–tax rate of return is g+ i(u – m)/(1 – u). When u > m the after—tax rate of return exceeds the pre–tax rate of return, i.e., the invest-ment is subsidized or faces a negative marginal effective tax rate.
Gravelle’s point originates with the observation that the inflationary component of the nominal interest raterepresents a return of principle. A return of principle should be neither deducted from taxable income by theborrower nor included in taxable income by the lender. When interest is not indexed, however, nominalinterest is fully deductible and fully taxable. No adjustment is made to remove the inflationary component ofinterest from the tax base. This improper treatment can subsidize debt–financed investment if borrowersdeduct the inflationary component of the nominal interest rate at a tax rate higher than that faced by lenders.
Depreciation Lives and Methods
549
inflation, indexing depreciation makes nodifference. At a 3 percent rate of inflation,however, indexing depreciation generatesa noticeable reduction in the cost of capi-tal for depreciable assets; indexing depre-ciation reduces the (weighted) averagecost of capital for corporate equipmentfrom 5.1 percent to 4.5 percent. This cor-responds to a 9 percentage point reduc-tion in the marginal effective tax rate onincome from an investment in corporateequipment. At 3 percent inflation, index-ing depreciation reduces the weightedaverage cost of capital for the economyfrom 4.5 percent to 4.2 percent. Not sur-prisingly, at the higher 6 percent rate ofinflation, indexing depreciation generatesa larger relative reduction in the tax costof investment and in the cost of capital.
In addition to lowering the cost of capi-tal, indexing depreciation also improvesneutrality over the range of inflation ratesconsidered in Table 4. At a 3 percent rateof inflation, indexing depreciation reducesthe standard deviation in the cost of capi-tal from 0.0075 to 0.0059, and the reduc-tion in the standard deviation is larger atthe 6 percent rate of inflation. Indexing
depreciation reduces tax differencesacross investments in large part by reduc-ing the tax cost of investment in businesscapital relative to investment in owner–occupied housing, and by reducing the taxcost of investment in depreciable businessproperty relative to intangibles. Theseimprovements in tax neutrality arise,moreover, even though indexing depre-ciation increases the tax advantage ofequipment over nonresidential structuresand of depreciable property over land andinventories.
The calculations summarized in Table4 cast some doubt on the argument thatindexing will lead to negative marginaleffective tax rates. Even assuming a 6 per-cent rate of inflation, indexing deprecia-tion leads to no negative marginal effec-tive tax rates on corporate investment,and only leads to negative rates on three(out of 38 possible) noncorporate invest-ments, under our assumption that debtfinances about two–fifths of the cost of in-vestment. Higher inflation rates or higherleverage ratios are required to get substan-tial problems with negative effective taxrates.
TABLE 4EFFECT OF INDEXING DEPRECIATION ON THE COST OF CAPITALa
No Inflation 3% Inflation 6% Inflation
CurrentLaw (%)
CurrentLaw (%)
CurrentLaw (%)
IndexedDepreciation (%)
IndexedDepreciation (%)
IndexedDepreciation (%)
Corporate Sectorb
EquipmentStructuresPublic UtilityInventoriesLandIntangibles
Total
Noncorporate Sectorb
Owner–OccupiedHousing
Economy Wide Averageb
Standard Deviation inthe Cost of Capital
4.45.14.45.55.53.64.7
4.3
3.74.2
0.0061
4.45.14.45.55.53.64.7
4.3
3.74.2
0.0061
5.15.75.05.65.63.65.2
4.4
3.84.5
0.0075
4.55.24.55.65.63.64.7
4.2
3.84.2
0.0059
5.76.25.45.75.73.75.6
4.4
4.04.7
0.0088
4.55.34.65.75.73.74.8
4.0
4.04.3
0.0059
Source: Authors’ calculations as described in the text.
Notes:aSee notes for Table 2.bCapital stock weighted averages. See notes for Table 2.

NATIONAL TAX JOURNAL
550
Accelerated Depreciation as a Proxy forIndexing
Accelerated depreciation has been jus-tified as a way to index implicitly for in-flation (Feldstein, 1981b; Gravelle, 1980;Aaron, 1976). Acceleration is said to besimpler to administer than would be ex-plicit indexing. Yet, from the perspectiveof income measurement, accelerated de-preciation is a poor proxy for explicit in-dexation. Getting the adjustment right forall assets at a single inflation rate is likelyto be difficult. Furthermore, even if theaccelerated allowances grant the rightamount of depreciation at one inflationrate, allowances will not be correct at otherinflation rates. Moreover, given that in-dexing depreciation does not require aseparate price index for each category ofassets, explicitly adjusting depreciationfor inflation may not be as complicatedas some believe.
First Year Allowance as a Proxy for Indexing
Auerbach and Jorgenson (1980) pro-posed an immediate write–off equal to thepresent value of depreciation allowances.The Auerbach–Jorgenson plan would beinflation–proof. Since the entire deductionwould occur in the first year, its valuewould be independent of whatever infla-tion rate prevails over the investment’slifetime. This plan would offer a simpleway to index for inflation.
Putting the entire deduction for depre-ciation in the first year nonetheless im-poses some costs. For example, firms with-out sufficient tax liability would be unableto benefit fully. Thus, this proposal wouldbe biased in favor of established firms, andmay encourage mergers. Granting the fullvalue of the deduction in the first year alsomay complicate ordinary income recap-ture provisions if the asset is sold prema-turely.
The Auerbach–Jorgenson plan also mayraise revenue concerns (Gravelle, 1979;1980). Part of the short–run revenue cost
is more a matter of perception than of re-ality, however, because Auerbach–Jorgenson’s reduction of tax in the firstyear of an investment is offset by a taxincrease in the out years. Except for thecost of indexing, the Auerbach–Jorgensonplan can be designed to have no real rev-enue cost at all.
Switch to Financial (Book) Depreciation
Many firms have to measure income forfinancial reporting purposes as well as fortax purposes. Conforming tax deprecia-tion to financial, or book, depreciationwould help reduce the cost of maintain-ing two sets of accounts. It also could re-sult in improved income measurement, tothe extent that book depreciation gives amore accurate measurement of incomethan does tax depreciation, and it mightreduce disputes between taxpayers andthe IRS.
These benefits, however, should notbe overstated. Many companies wouldstill have to keep two sets of books, since,in addition to depreciation, there areother differences between financial andtax accounting rules (Ferris et al., 1992).Smaller companies, moreover, maycurrently use tax depreciation rulesfor keeping their nontax accounts, or maynot keep nontax accounts, and would notbenefit from reduced record–keepingcosts.
Using financial accounting rules to cal-culate tax depreciation would not neces-sarily improve income measurement, taxfairness, and tax administration. These areempirical questions that are difficult toanswer for several reasons. First, there isno well–defined set of financial deprecia-tion rules against which tax depreciationrules may be compared. Second, in re-sponse to tax conformity firms may electto adopt accelerated book depreciationmethods. Third, the treatment of firmsthat are not publicly traded and do notneed to prepare audited financial state-

Depreciation Lives and Methods
551
ments raises difficulties.54 Finally, it isunlikely that the IRS would simply acceptany depreciation method adopted by thetaxpayer for book purposes; disputes overdepreciation would remain.
Allow Depreciation Based on Facts andCircumstances
A switch to a depreciation system basedon individual taxpayer facts and circum-stances offers the potential for accuratemeasurement of economic income. At thesame time, it would place a heavy bur-den on taxpayers to obtain the necessarydata and to use that data to justify to theIRS their depreciation deductions. It alsowould impose a large burden on IRSagents, since they would be required toevaluate properly the data provided bytaxpayers. From a historical perspective,it is clear that this system would likelygenerate much controversy and litigationbecause of informational gaps, future un-certainties, and unsubstantiated claimsand beliefs (U.S. Department of the Trea-sury, 1971; Brazell et al., 1989).
The difficulty of obtaining the dataneeded to accurately estimate economicdepreciation makes it uncertain that afacts and circumstances system would im-prove on current law’s measurement ofeconomic income. It is quite likely,however, that switching to a facts and cir-cumstances basis for depreciation wouldincrease the costs of administering andcomplying with the tax system.
ASSET CLASSIFICATION AND OTHERRECOVERY PERIOD ISSUES UNDERMACRS
The reforms above address depreciationproblems by abandoning MACRS in
favor of a fundamentally different cost re-covery system. A second, alternative, typeof reform seeks to improve the operationof the MACRS system, rather than to over-turn MACRS in favor of another depre-ciation system.55
Properly classifying assets is importantin order to avoid income mismeasurementthat potentially favors certain activitiesover others. Yet one important set of prob-lems with MACRS stems from difficultiesin determining an asset’s proper class lifeand recovery period. These problems canbe fixed by working within the existingMACRS structure. In this section we dis-cuss several classification problems andcomment briefly on paths to their solution.
Some of these classification issues canbe solved by piecemeal reform of MACRS.Other classification problems are morefundamental and arise because MACRSlacks a clear intellectual foundation forclassifying assets. MACRS never gives anoperational definition of the class life con-cept that supports the current assignmentof recovery periods. Providing such a defi-nition and using it to consistently classifyassets raises issues of the same type andof the same degree of difficulty as thoseencountered in establishing an entirelynew depreciation system.
Multiple Lines of Business/Dual UseAssets
Many assets receive depreciation allow-ances that vary depending on the indus-try or activity in which they are used.Consequently, classifying an asset can bedifficult when a firm’s activities span morethan one asset class.
One set of problems in this area arisesfrom dual use assets, assets that are em-ployed in more than one line of business.
54 It may lead to two depreciation systems, one for publicly traded firms and one for other taxpayers. It isunlikely that the two systems would treat firms equally.
55 Indexing is included as a fundamental reform because cost recovery has always been based on historical cost.Indexing would fundamentally abandon this principle. We concede, however, that indexing could be seen asa reform that operates within the existing MACRS structure.

NATIONAL TAX JOURNAL
552
In general, an asset’s primary use deter-mines its classification (Reg. 1.167(a)-11(b)(4)(iii)(b)), yet determining primaryuse can be difficult. This is illustrated bya recent controversy involving gas sta-tions.
Gas station buildings belong to assetclass 57.1 and have a 20–year class life.This implies that their cost is recoveredover 15 years using the 150 percent de-clining balance method. Many gas sta-tions, however, also operate small conve-nience stores selling a limited selection offood, beverages, first aid items, clothing,and other sundries. Buildings used bysmall convenience stores have no class lifeand are depreciated over 39 years usingthe straight–line method. Given the sub-stantial difference in the pattern of depre-ciation deductions afforded gas stationsand convenience stores, it is important toknow when a gas station becomes a con-venience store. Yet IRS rulings were con-troversial and led to a statutory amend-ment in the Small Business Job ProtectionAct of 1993 that decided the issue in favorof a 15–year recovery period for gas sta-tion buildings.
Vertically integrated taxpayers mayhave difficulty classifying assets. For ex-ample, the petroleum refining industryhas argued that assets used in its chemi-cal production activities should be classi-fied separately from those used in its re-fining activities. Such treatment wouldseem to be consistent with the primary userule and mirrors the treatment that wouldbe accorded a stand–alone supplier of thechemicals. Nonetheless, the IRS has dis-puted the industry’s claim, arguing thatseparate classification requires that chemi-cal production be operated as a separatebusiness.
To some extent, classification problemslike these are unavoidable. Lines have tobe drawn somewhere, and cases that are
close to the line will be controversial.Nonetheless, some classification problemsmight be addressed by broadening or nar-rowing asset class definitions, or byclosely targeted Congressional action.Regulatory rules of thumb also may offera solution in certain cases. For example,prior to 1971 a rule specified that only ifthe cost basis of assets used in a separateactivity exceeds 3 percent of thetaxpayer ’s total basis in all propertywould the activity be significant enoughto warrant separate classification (U.S.Department of the Treasury, 1964). Such arule might help solve classification dis-putes in vertically integrated companies.
New Assets and New Activities
New assets and new economic activi-ties pose difficult classification problems.There is no way to easily accommodatethem because Treasury has no regulatoryauthority to create or redefine assetclasses. Treasury can only assign the prop-erty to an existing class life or place it in adefault category. A more comprehensivesolution requires statutory action.
The age of the current classification sys-tem adds to the severity of this problem.The existing class life system dates to theearly 1960s, and in many cases reflects thetax depreciation practices of late 1950s.Nonetheless, during the past 40 years theeconomy has changed dramatically. Newindustries and assets have been devel-oped, and production techniques havechanged. The development of electronics,especially computerization and telecom-munications, over this time period repre-sents an important example of this gen-eral problem.
Ambiguity about the meaning of classlives also contributes to the problem ofclassifying new assets and assets used innew activities.56 Existing law provides no
56 Definitional ambiguity also makes it difficult to evaluate claims that certain existing assets should receive ashorter class life, and hence a shorter cost recovery period.
Depreciation Lives and Methods
553
clear definition of a class life. At least twodifferent definitions find some support inlaw: anticipated useful life of that class ofproperty to the industry or other group(Internal Revenue Code section 167(m),prior to its repeal by the Omnibus BudgetReconciliation Act of 1990) and a straight–line life equivalent in present value termsto economic depreciation (U.S. Congress,1987). While these definitions are similar,they are not identical. Even abstractingfrom differences between them, neitherdefinition is sufficiently specified to pro-vide clear operational guidance in deter-mining the proper class life for a new as-set.57
A satisfactory solution to these prob-lems probably requires a comprehensivereview of the existing class life system.This review would first need to establishan operational definition of class life.58
Such a definition would allow new assetsand new activities to be included prop-erly in the depreciation classification sys-tem. The class lives of existing assets alsomight be evaluated in light of the class lifedefinition, and revised up or down basedon appropriate empirical evidence.
However necessary it may be, such areview would be a major and difficultundertaking. It probably would involveestablishing a professional office withinTreasury (or perhaps within a Congres-sional organization) to supervise the op-eration and implement the changes.59 Thisoffice would face very difficult data issuesof the sort that have plagued papers in theacademic literature that attempt to esti-mate economic depreciation rates. Someof these issues, e.g., those created for mea-
suring economic depreciation rates bythin markets in many used assets, may beinsoluble. Some issues, e.g., establishingtypical useful lives, may be solved only iftaxpayers are required to supply signifi-cant amounts of information to the Trea-sury. Political pressures also may bebrought to bear on the process, and thesemay inhibit the office’s attempt to ratio-nalize the class life system.60
The office need not be independent ofCongressional authority. For example,Congressional oversight could be pro-vided through veto power. In addition,Congress always would have substantialimplicit authority since it could seek statu-tory modification to any change initiatedby Treasury, and could seek to repealTreasury’s authority to change class lives.
Cliffs and Plateaus
In mapping from class lives intoMACRS recovery period, the current de-preciation system creates cliffs that givevery different cost recovery periods toassets with similar class lives. For ex-ample, the upper end of the 5–year recov-ery class breaks at a class life of 10 years.Thus, property assigned a class life of 9.5years (e.g., assets used in the manufactureof chemicals and computer–based centraloffice switching equipment) receives a 5–year recovery period, while property as-signed a class life of 10.0 years (e.g., fur-niture and agricultural equipment) re-ceives a 7–year recovery period. The cliffcreates a two–year difference in recoveryperiods that greatly exceeds any differ-ence justified by a 6–month difference in
57 For example, present value calculations vary with the discount rate, and no discount rate is provided in thesecond definition.
58 An alternative approach would focus on cost recovery periods, thus skipping the intermediate step involvedin defining a class life.
59 The alternative of direct Congressional involvement is less appealing. The legislative process probably is tooslow and too involved in the myriad of policy and political concerns to oversee effectively what are essen-tially technical issues.
60 Political forces quickly stripped the power to change class lives from Treasury’s former Depreciation AnalysisDivision, which had a similar mandate (Technical and Miscellaneous Revenue Act of 1988). While Treasurystill has the authority to study assets, this authority is of little value without the ability to implement changes.

NATIONAL TAX JOURNAL
554
class life.61 Because of these cliffs, assetswith class lives slightly less than the up-per end of any recovery class are taxadvantaged, relative to assets with a classlife slightly greater than the upper end ofthat recovery class.
The mapping from class life to MACRSrecovery period also creates plateaus onwhich assets with very different class livesreceive the same recovery periods. Forexample, tobacco manufacturing assetshave a 15 year class life, but are given thesame 7 year recovery period as furnitureand agricultural equipment, which havea 10 year class life. If class lives are corre-lated with economic lives, this implies atax advantage for assets (like those usedin the manufacturing of tobacco) that lieon the far end of the recovery period, rela-tive to assets that line on the near end ofthe recovery period (like furniture andagricultural equipment).
These cliffs and plateaus might appearto be justified as a way to simplify depre-ciation accounting by restricting the num-ber of cost recovery classes. The simplifi-cation benefit is largely illusory, however.The costs of administering and comply-ing with the current system are largelyincurred in determining a property’s classlife, not in computing depreciation allow-ances once that class life has been deter-mined.
These cliffs and plateaus also are unnec-essary. The current system could be modi-fied to use class lives as recovery periodswhile allowing more accelerated methods(e.g., partial expensing) in order to main-tain, at least on average, the currentpresent value of depreciation allow-ances.62 This system would avoid theproblems in relative income measurement
created by cliffs and plateaus. Any suchreform would require Congressional ac-tion.
Difficulties in the Depreciation of RealEstate
Definition of a Building: The Section 1245/Section 1250 Distinction
As discussed above, the depreciationfor section 1250 assets (e.g., buildings) isgenerally much slower than that for sec-tion 1245 assets (e.g., equipment). Thus,the classification of an asset, or its com-ponents, as a building (1250 asset) or asequipment (1245 asset) has important im-plications for its depreciation allowances.Yet the classification can be difficult, as thelegal difference between 1245 and 1250property is obscure. The Internal RevenueCode itself defines some special purposebuildings as 1245 property.63 The testsused by the IRS and the courts to deter-mine whether an asset is a building havechanged over time, sometimes overturn-ing earlier rulings and decisions.64 Thecurrent standard used by the IRS and thecourts in determining whether an asset isa building (a section 1250 asset) reliesheavily on whether the asset is inherentlypermanent (deGanon, 1997).
One subset of problems arises from thedepreciation of assets without a class life.These are often new assets or assets thatresemble buildings or their structuralcomponents. If classified as section 1245property, property without a class life isdepreciated over 7 years using the 200percent declining balance method, whileif classified as section 1250 property itwould be depreciated over 39 years us-ing the straight–line method.
61 This assumes that there is some correlation between economic life and class life.62 The current alternative depreciation system uses class lives as recovery periods, but imposes the straight–line method.63 See note 11.64 Historically, the IRS has employed tests relating to the asset’s function in determining whether it is a 1250
asset. If the asset functioned like a building, e.g., by providing an enclosed work environment, it was a build-ing. Function tests have not been well received by courts, however, who have favored tests related to theasset’s permanence (deGanon, 1997).

Depreciation Lives and Methods
555
Modular buildings have no class lifeand so provide an example of the diffi-culty of making the section 1245/1250determination in this case.65 Since modu-lar buildings are fairly easy to move,the permanence standard suggests thatthey may be section 1245 property. Ifso, they would be depreciated over 7years using the 200 percent decliningbalance method. On the other hand,modular buildings serve the functionof traditional buildings and also looklike traditional buildings, and so resemblesection 1250 property that is depreciatedover 39 years using the straight–linemethod.
A priori it is not clear whether incomemeasurement would be harmed if modu-lar buildings were depreciated over 7rather than 39 years. The answer dependson their rate of economic depreciation. Itis clear, however, that taxpayers have astrong incentive to have modular build-ings classified as 1245 property, while theIRS has an incentive to classify them as1250 property, thereby engendering costlydisputes and litigation.
The distinction between 1245 and 1250property also is important when it is pos-sible to separate some of a building’sstructural components from its shell inorder to depreciate them separately as1245 assets. Theoretically, the ability tomake such separation is strictly limitedunder current law, since buildings aredefined to include structural componentssuch as wiring and plumbing in additionto their shell, walls, and roof (Reg. 1.48-1(e)(2)). The intent of the current systemis to depreciate the entire composite as-set, including all structural components,over 39 years using the straight–linemethod.
As a practical matter, however, often itis unclear whether many assets used in abuilding are structural components of thebuilding. Recent court cases seem to al-low substantial scope for segregation ofmany components (Hospital Corp. ofAmerica, 109 TC 21 Dec. 52, 163). For ex-ample, arguments can be advanced thatelectrical wiring and junction boxes usedto power specialized equipment are 1245property and therefore not considered acomponent of the building. In addition,some courts have maintained that a por-tion of the general purpose wiring in abuilding may be allocated to specializedequipment, and so may be a 1245 asset.Anecdotal evidence66 suggests that tax-payers increasingly may be segregatingbuilding components and depreciatingthem under section 1245.67
Cost segregation has ambiguous impli-cations for income measurement. Theseimplications depend in part on whethercomponents actually depreciate fasterthan the building shell, walls, and roof,and on whether the 39 year life is an ap-propriate average of a longer life for theshell, walls, and roof, and a shorter lifefor the segregated components.
Apart from income measurement is-sues, at a minimum the current situationimposes heavy compliance costs on tax-payers that seek to justify cost segrega-tions, and imposes heavy monitoringcosts on the IRS, who seeks to restrict suchactivities. The current situation also ap-pears ripe for abuse and litigation.
Unfortunately, there is no easy way tofix the section 1245/1250 classificationproblem. Proper income measurementrequires that depreciation allowances varyacross assets, which requires in turn thatparticular expenditures be categorized for
65 Meeting with IRS representatives on 2/16/2000.66 Meeting with IRS representatives 2/16/2000.67 Commissioned cost segregation studies often support taxpayers’ claims that a building’s components should
be depreciated under section 1245. These studies make detailed inventories of the various items that composea building, classifying each of thousands of different items as either 1245 or 1250 property. The use of thesestudies has been supported by recent court decisions.

NATIONAL TAX JOURNAL
556
purposes of determining depreciation al-lowances. Frictions, disputes and manipu-lation are unavoidable under any suchsystem. They are part of the cost of mea-suring capital income.
That said, one strategy would addressthe problem by reducing the section 1245/1250 distinction by redefining a buildingto include only the shell, roof, walls, andcertain easily identified major structuralcomponents. An alternative would elimi-nate the section 1245/1250 distinction anddepreciate buildings according to thetaxpayer’s general activity class. A thirdstrategy would move in the opposite di-rection, and strictly limit the taxpayer’sability to segregate selective elements ofa building’s cost. These solutions all mayinvolve revisiting class lives and recoveryperiods. While all might reduce taxpayer/IRS disputes, it is unclear whether anywould improve income measurement.
Improvements to Real Property68
Following the logic of composite depre-ciation, additions or improvements toproperty are depreciated using the samerecovery period that applies to the prop-erty itself. In contrast, repair expendituresmay be deducted immediately. Accord-ingly, the distinction between repair ex-penditures and capital improvements isan important one.
In practice, however, it often is difficultto distinguish between repairs and im-provements. Since all repairs extent theuseful life of property, the distinction be-tween repairs and capital improvementsis one of degree and therefore is highlyfact specific and potentially controversial.
Even when there is no doubt about capi-talizing an expenditure, concern has beenexpressed as to the appropriateness of
composite depreciation, especially for realproperty. According to this rule, replace-ment roofs, for example, are depreciatedover 39 years even if such replacementsmust be made several times over thebuilding’s 39–year recovery period. Thepresumed inability to recognize a loss onthe replaced component seemingly com-pounds the problem.69 Taxpayers can findthemselves depreciating several roofs,even though only a single roof exists onthe building at one time.
The current treatment of replacementsclearly can increase the compliance andenforcement costs of the tax system. Thisoccurs because taxpayers must keep de-preciation accounts for assets that nolonger exist. It is less clear that the cur-rent system necessarily mismeasures in-come by inappropriately postponing de-ductions. This is an empirical question, theanswer to which depends on whether a39–year recovery period is an appropri-ate average for the life–cycle costs of thebuilding.
A number of proposals have been ad-vanced to accelerate cost recovery for im-provements to real property. One proposalwould establish a separate asset class forbuilding improvements, presumably witha life far shorter than 39 years. Successfulimplementation would require that suchimprovements be easily identified andthat a reasonable average class life couldbe found. Neither are foregone conclu-sions. The proposal also would raise dif-ficult administrative issues as taxpayersmay be tempted to shift construction costsinto “improvements” that can be depre-ciated more rapidly.70
A second proposal would allow taxpay-ers to write–off the cost of abandonedcomponents and improvements, such as
68 Similar problems accompany improvements and additions to personal property.69 Proposed regulations under ACRS, the precursor to the current depreciation system, denied recognition of
losses for structural components. There may be a question whether these proposed regulations apply undercurrent law.
70 The proposal also may require revising upward the building’s recovery period, to the extent that current law’srecovery period reflects a life for major components that is shorter than 39 years.
Depreciation Lives and Methods
557
roofs that have been replaced. Leaseholdimprovements currently receive this treat-ment. If administrable at low cost, thisproposal may be justified.71 In addition topossibly improving income measurement,it would eliminate the current distinctionbetween leased properties and owner–occupied properties.
Finally, the building’s class life mightbe reduced to account for improvements.This proposal may be the simplest to ad-minister. Establishing an appropriate lifemay be difficult, however.72 Nonetheless,even if not perfectly accurate, a shorter lifemay improve on current law to the extentthat current law’s recovery period fails toadequately account for improvements.This proposal, however, would not elimi-nate the distinction between leased andowner–occupied properties.
Is a 39 year Recovery Period Too Long forNonresidential Real Estate?
Even setting aside problems related toimprovements, taxpayers frequently ob-ject that the recovery period for real es-tate is too long.73 Some empirical evidencesupports this view. The present value cal-culations in Table 1, for example, suggestthat for many nonresidential structures,including industrial and commercial realestate, tax depreciation is slower than eco-nomic depreciation. Consequently, non-residential structures face a marginaleffective tax rate that exceeds that associ-ated with economic depreciation, as con-
firmed in Table 3.74 Assuming straight–line depreciation, a 30–year recoveryperiod would give nonresidential struc-tures about the same marginal effectivetax rate as implied by economic deprecia-tion.75
While nonresidential structures receivedepreciation allowances that are slowrelative to economic depreciation,equipment’s depreciation allowances aresomewhat accelerated. Straight–line de-preciation over 20 years76 would give non-residential structures about the same mar-ginal effective tax rate as currently facedby equipment.77
These calculations rely on the Hulten–Wykoff measures of economic deprecia-tion. As discussed above these measureshave been favorably reviewed recently. Inaddition, a recent study (Deloitte and Tou-che, 2000) obtains results roughly consis-tent with those of Hulten and Wykoff.This evidence further supports a shorterrecovery period for nonresidential realestate.
Slowing the depreciation of equipmentcould pay for a shorter recovery periodfor real estate. In addition to having thevirtue of a self–financed reform, this pro-posal also could improve the neutrality ofthe tax system for business property. Theprospects for improved overall tax neu-trality rise if the reform would not increasethe marginal effective tax rate on businesscapital, relative to that of owner–occupiedhousing.
71 It also may require revising upward the building’s recovery period, to the extent that the current life reflects apresumed inability to write–off these losses.
72 The required data on the life of various major building components may be difficult to obtain. Weighting thelifetimes of the components with that of the underlying structure also raises difficult issues even for a singletype of building. Problems would be compounded in attempting to obtain an average for all buildings.
73 Indeed, this is a general complaint, but is more common and more pronounced for real estate.74 These calculations assume that assets are held forever. They thus ignore asset sales that potentially affect
conclusions about the taxation of real estate and other investments.75 The exact straight–line recovery period depends on the particular assets being compared and on whether the
investment is made in the corporate or the noncorporate sector. The calculation also is sensitive to the as-sumed (3 percent) inflation rate because economic depreciation is indexed while current tax depreciation isnot indexed. A shorter straight–line recovery period would be required at higher inflation rates. An acceler-ated method over a constant or longer recovery period also could effect economic depreciation.
76 See the previous endnote.77 Gravelle (1999) obtains a similar result.

NATIONAL TAX JOURNAL
558
Some factors, however, may argueagainst shortening real estate’s recoveryperiod. One is that buildings may appre-ciate in value over time. Giving more gen-erous depreciation deductions, while con-tinuing to allow gain on the building andassociated land to benefit from deferraland from a reduced rate of tax, may strikesome as inappropriate. Another is thatcurrent tax depreciation may reflect eco-nomic depreciation; the empirical evi-dence cited above may be wrong. TheCommittee Report on the 1993 bill thatlengthened the life of structures to 39 yearsjustified the increase as a way to matchtax depreciation more closely to economicdepreciation, although no supporting dataor studies were cited (U.S. Congress,1993). Finally, buildings might enjoy a taxbenefit from an ability to support rela-tively high leverage (Hines, 1987). Theincreased tax benefit of debt finance mightcounteract to some degree the tax cost ofdecelerated depreciation. The tax benefitof high leverage would seem to be fairlysmall for noncorporate investors, how-ever, and the argument that buildings aremore heavily debt financed than otherinvestments is controversial (Gravelle,1985).
CONCLUSION
The current cost recovery system isdated and perhaps in need of repair. Itdoes not seem to effectively promote taxneutrality, nor does it effectively stimulateaggregate saving and investment. TheMACRS system also faces administrativechallenges; it contains a number of legalambiguities that create uncertainties andinequities, and that lead to disputes be-tween taxpayers and the IRS. Yet fixingthe depreciation system will not be easy.Comprehensive reform (e.g., switching toeconomic depreciation) may not alwaysbe practicable, nor would it necessarilyimprove the functioning of the tax system.Reform from within, e.g., by modifying
the current MACRS system, also faceschallenges, some of which may be as seri-ous as those faced if MACRS were aban-doned in favor of another depreciationsystem. Nonetheless, the profoundchanges in the U.S. economy over the past20 years and the prospect of future eco-nomic change may argue for addressingthe shortcomings of the tax depreciationsystem.
Acknowledgments
Any opinions are the authors’ alone,and do not necessarily reflect the viewsof the U.S. Department of the Treasury. Wethank Lowell Dworin, Gerry Gerardi,Hudson Milner, and Laura Power for dataand comments on work related to thispaper.
REFERENCES
Aaron, Henry J.“Inflation and the Income Tax: An Introduc-tion.” In Inflation and the Income Tax, editedby Henry. J. Aaron. Washington, D.C.: TheBrookings Institution, 1976.
Auerbach, Alan J.“Corporate Taxation in the United States.”In Brookings Papers on Economic Activity 2(1983): 451–513.
Auerbach, Alan.“Tax Reform, Capital Allocation, Effi-ciency and Growth.” In Economic Effectsof Fundamental Tax Reform, edited byHenry J. Aaron and William G. Gale. Wash-ington, D.C.: Brooking Institution Press,1996.
Auerbach, Alan J., Kevin A. Hassett, andStephen D. Oliner.
“Reassessing the Social Returns to Equip-ment Investment.” NBER Working PaperNo. 4405. Cambridge, MA: National Bureauof Economic Research, 1992.
Auerbach, Alan J., and Dale Jorgenson.“Inflation–Proof Depreciation of Assets.”Harvard Business Review (September–Octo-ber, 1980): 113–8.

Depreciation Lives and Methods
559
Ballentine, J. Gregory.“Comments.” In Uneasy Compromise: Prob-lems of a Hybrid Income–Consumption Tax,edited by Henry J. Aaron, Harvey Galper,and Joseph A. Pechman. Washington, D.C.:The Brookings Institution, 1988.
Bradford, David F.“Tax Neutrality and the Investment TaxCredit.” In The Economics of Taxation, editedby Henry J. Aaron and Michael J. Boskin.Washington, D.C.: The Brookings Institu-tion, 1980.
Bradford, David F., and the U.S. Treasury TaxPolicy Staff.
Blueprints for Basic Tax Reform, 2nd Ed. Arling-ton, VA: Tax Analysts, 1984 (original editionpublished as a U.S. Department of TreasuryStudy, 1977).
Brazell, David W., Lowell Dworin, and MichaelWalsh.
A History of Federal Tax Depreciation Policy.U.S. Department of the Treasury, Office ofTax Analysis Paper No. 64. Washington,D.C.: Office of Tax Analysis, May 1989.
CCH Incorporated.2000 Master Tax Guide. Chicago: CCH Incor-porated, 1999.
Chirinko, Robert S.“Business Investment and Tax Policy: A Per-spective on Existing Models and EmpiricalResults.” National Tax Journal 32 No. 2 (June,1986): 137–55.
Cohen, Darrel, Kevin A. Hassett, and R. GlennHubbard.
“Inflation and the User Cost of Capital:Does Inflation Still Matter?” NBER Work-ing Paper No. 6046. Cambridge, MA: Na-tional Bureau of Economic Research, May,1997.
deGanon, Victoria E.Depreciation Recapture—Sections 1245 and1250. Tax Management Portfolio No. 563.Washington, D.C.: Tax Management Inc,1997.
DeLong, J. Bradford, and Lawrence H.Summers.
“Equipment Spending and EconomicGrowth.” Quarterly Journal of Economics 107(May, 1991): 445–502.
Deloitte and Touche.Analysis of the Economic and Tax Depreciationof Stuctures. Washington, D.C.: Deloitte andTouche, June, 2000.
Engen, Eric M., and William G. Gale.“The Effects of Fundamental Tax Reform onSaving.” In Economic Effects of FundamentalTax Reform, edited by Henry J. Aaron andWilliam G. Gale. Washington, D.C.: Brook-ing Institution Press, 1996.
Feldstein, Martin A.“Adjusting Depreciation in and InflationaryEconomy: Indexing vs. Acceleration.” Na-tional Tax Journal 34 No.1 (March, 1981b): 29–44.
Feldstein, Martin A.“The Welfare Cost of Capital Income Taxa-tion.” Journal of Political Economy 86 (April,1981a): S29–S51.
Feldstein, Martin A.“Inflation, Tax Rules, and Investment: SomeEconometric Evidence.” Econometrica 50 No.4 (July, 1982): 825–62.
Feldstein, Martin A.“The Costs and Benefits of Going fromLow Inflation to Price Stability.” WorkingPaper No. 5469. Cambridge, MA: NationalBureau of Economic Research, February,1996.
Feldstein, Martin A., and Lawrence H.Summers.
“Inflation and the Taxation of Capital In-come in the Corporate Sector.” National TaxJournal 32 No. 4 (December, 1979): 445–70.
Ferris, Kenneth R., Kirk L. Tennant andScott I. Jerris.
How to Understand Financial Statements.Englewood Cliffs, NJ: Prentice Hall, 1992.
Fischer, Stanley.“Wage Indexation and Macroeconomic Sta-bility.” In Stabilization of the Domestic and In-ternational Economy, edited by Karl Brunnerand Alan Meltzer. New York: North Hol-land, 1977.
Fraumeni, Barbara.“The Measurement of Depreciation in theU.S. National Income and Product Ac-counts.” Survey of Current Business 77 No. 7(July, 1997): 7–42.

NATIONAL TAX JOURNAL
560
Fullerton, Don.“The Indexation of Interest, Depreciation,and Capital Gains and Tax Reform in theU.S.” Journal of Public Economics 32 No. 1(February, 1987):25-51.
Fullerton, Don, and Andrew B. Lyon.“Tax Neutrality and Intangible Capital.” InTax Policy and the Economy, Vol. 2, edited byLawrence H. Summers. Cambridge, MA:MIT Press, 1988.
Fullerton, Don, and Yolanda K. Henderson.“Incentive Effects of Taxes on Income FromCapital: Alternative Policies for the 1980s.”In The Legacy of Reaganomics: Prospects forLong–Term Growth, edited by Charles R.Hulten and Isabel V. Sawhill. Washington,D.C.: The Urban Institute, 1984.
Gann, Hal I.“Capitalization: Get Back to Where You OnceBelonged.” In The Proceedings of the Univer-sity of Southern California Law School’s Forty–Ninth Annual Institute on Federal Taxation. NewYork: Matthew Bender and Co, Inc., 1997.
Goode, Richard.“The Economic Definition of Income.” InComprehensive Income Taxation, edited by Jo-seph A. Pechman. Washington, D.C.: TheBrookings Institution, 1977.
Gravelle, Jane G.“The Capital Cost Recovery System and theCorporate Income Tax.” Report No. 79–230,Congressional Research Service. Washing-ton, D.C.: The Library of Congress, Novem-ber 26, 1979.
Gravelle, Jane G.“The Capital Cost Recovery Act: An Eco-nomic Analysis of 10–5–3 Depreciation.”Report No. 80–29 E, Congressional ResearchService, Washington, D.C.: The Library ofCongress, January 28, 1980.
Gravelle, Jane G.“U.S. Tax Policy and Rental Housing: AnEconomic Analysis.” Report No. 85–208 E,Congressional Research Service. Washing-ton, D.C.: The Library of Congress, Novem-ber 6, 1985.
Gravelle, Jane G.The Economic Effects of Taxing Capital Income.Cambridge, MA: The MIT Press, 1994.
Gravelle, Jane G.“Depreciation and the Taxation of Real Es-tate.” Order Code RL30163, CongressionalResearch Service. Washington, D.C.: The Li-brary of Congress, May 5, 1999.
Gray, Jo Anna.“Wage Indexation: A Macroeconomic Ap-proach.” Journal of Monetary Economics 2(April, 1976): 221–35.
Halperin, Daniel, and Eugene Steuerle.“Indexing the Tax System for Inflation.” InUneasy Compromise: Problems of a Hybrid In-come–Consumption Tax, edited by Henry J.Aaron, Harvey Galper, and Joseph A.Pechman. Washington, D.C.: The BrookingsInstitution, 1988.
Hassett, Kevin A., and R. Glenn Hubbard.“Tax Policy and Investment.” NBER WorkingPaper No. 5683. Cambridge, MA: NationalBureau of Economic Research, July, 1996.
Henderson, Yolanda K. “Does Reducing Inflation Lower the Cost ofCapital?” In Proceedings of the Seventy-Seventh Annual Conference on Taxation,283–92. Washington, D.C.: National Tax As-sociation, 1985.
Hines, James R. Jr.“The Tax Treatment of Structures.” In Taxesand Capital Formation, edited by MartinFeldstein. Chicago: The University of Chi-cago Press, 1987.
Hulten, Charles R.“Quality Change in Capital Goods and itsImpact on Economic Growth.” NBER Work-ing Paper No. 5569. Cambridge, MA: Na-tional Bureau of Economic Research, 1996.
Hulten Charles R., and Frank C. Wykoff.Tax and Economic Depreciation of Machinery andEquipment: A Theoretical and Empirical Ap-praisal. Phase II Report of Economic Depre-ciation of the U.S. Capital Stock: A First Step.Washington, D.C.: U.S. Treasury Depart-ment, Office of Tax Analysis, July 26, 1979.
Hulten, Charles R., and Frank C. Wykoff.“The Measurement of Economic Deprecia-tion.” In Depreciation, Inflation, and the Taxa-tion of Income from Capital, edited by CharlesR. Hulten. Washington, D.C.: The Urban In-stitute Press, 1981.

Depreciation Lives and Methods
561
Hulten, Charles R., and Frank C. Wykoff.“Issues in the Measurement of Economic De-preciation: Introductory Remarks.” Eco-nomic Inquiry 34 No 1 (January, 1996): 10–23.
Jorgenson, Dale W.“Empirical Studies of Depreciation.” Eco-nomic Inquiry 34 No. 1 (January, 1996): 24-42.
Jorgenson, Dale W., and Martin A. Sullivan.“Inflation and Corporate Capital Recovery.”In Depreciation, Inflation, and the Taxation ofIncome from Capital, edited by Charles R.Hulten. Washington, D.C.: The Urban Insti-tute Press, 1981.
Maule, James E.Depreciation: MACRS and ACRS. Tax Man-agement Portfolio No. 531. Washington,D.C.: Tax Management Inc., 1994.
Perlis, Mark.“Comments.” In Uneasy Compromise: Prob-lems of a Hybrid Income–Consumption Tax,edited by Henry J. Aaron, Harvey Galper,and Joseph A. Pechman. Washington, D.C.:The Brookings Institution, 1988.
Samuelson, Paul A.“Tax Deductibility of Economic Depreciationto Insure Invariant Valuations.” Journal of Po-litical Economy 72 (December, 1964): 604–6.
Slemrod, Joel.“Do Taxes Matter? Lessons from the 1980s.”American Economic Review 82 No. 2 (May,1992): 250–5.
Solow, Robert M.“Perspectives on Growth Theory.” Journal ofEconomic Perspectives 8 No. 1 (Winter, 1994):45–54.
Taubman, Paul, and Robert Rasche.“Economic and Tax Depreciation of OfficeBuildings.” National Tax Journal 22 No. 3(September, 1969): 334–46.
Tideman, T. Nicholas, and Donald P. Tucker.“The Tax Treatment of Business Profits Un-der Inflationary Conditions.” In Inflation andthe Income Tax, edited by Henry. J. Aaron.Washington, D.C.: The Brookings Institu-tion, 1976.
U.S. Congress. House. Committee on the Bud-get.Omnibus Budget Reconciliation Act of 1993.103d Congress, 1st Session, 1993. H. Report103-111.
U.S. Congress. Joint Committee on Taxation.General Explanation of the Tax Reform Act of1986. 99th Congress, 1st Session, May 1987.
U.S. Department of the Treasury.Depreciation Guidelines and Rules. Washing-ton, D.C.: U.S. Government Printing Office,August 1964.
U.S. Department of the Treasury.Asset Depreciation Range (ADR) System.Washington, D.C.: U.S. Government Print-ing Office, July 1971.
U.S. Department of the Treasury.Tax Reform for Fairness, Simplicity, and Eco-nomic Growth: The Treasury Department Re-port to the President Vol. 2. Washington, D.C.:Office of the Secretary, U.S. Department ofthe Treasury, November, 1984.
U.S. Department of the Treasury.Integration of the Individual and Corporate TaxSystems: Taxing Business Income Once. Wash-ington, D.C.: U.S. Government Printing Of-fice, January 1992.