Embed Size (px)
Citation preview
Transportation Research Record 754
ACKNOW LEDGMENT
The project described in this paper is part of research and development work sponsored by Nicholson Industries, Inc., of Toledo, Ohio, and performed at the University of Toledo. Richard T. Merkel of Nicholson Industries has kindly permitted the use of the data obtained in the course of the
41
work performed. Two of us (Miller and Bensch) performed the field work described here as graduate students in civil engineering.
Publication of this paper sponsored by Committee on Lime and Lime-F7y Ash Stabilization.
Dependence of Compacted-Clay Compressibility on Compaction Variables ALBERT DiBERNARDO AND C. W. LOVELL
Conventional oedometer tests were performed on a kneading:compacted, highly plastic residual clay to determine the effects of water content, dry density, and compaction pressure on the as-compacted and soaked compressibility behavior of the clay. Environmental changes caused by increased saturation were simulated by using a back-pressuring technique. Of interest was the onedimensional percentage change in volume on wetting under load. Statistical analyses were performed to establish the best predictive model for one-dimensional percentage change in volume on saturation in terms of the important compaction variables. The statistical model shows that initial water content and nominal compaction pressure are the principal variables that affect this response. Such equations allow prediction and control of the compressibility of high, cohesive embankments.
Compacted soils are used primarily for the construction of earth embankments. During design, the engineer must establish suitable placement variables, such as water content, dry density, and compaction effort, to ensure adequate short- and long-term performance of the completed structure. Typically, the shear strength of the compacted mass is of major concern, and recent studies (l-.~) have provided the capability of predicting its laboratory and field response value in terms of the important compaction variables. But the demand for high embankments is increasing, and it is becoming increasingly more important to specify compaction procedures so that embankment compressibility can be adequately predicted and controlled in both the as-compacted and long-term conditions.
A compacted soil is a three-phase system that consists of soil grains or aggregations, wa te r, and air. During the compaction process, densification is achieved by a reduction in air voids at consta nt wa ter content. The influence of this procedure on compressibility behavior depends considerably on (a) the compaction water content, (b) the amount of compaction, and (c) the compaction mode. All of these factors affect the fabric of the compacted clay. In service, this fabric may be altered over time because of environmental changes, which, in turn, may effect a change in compressibility behavior.
The research reported here was conducted to examine the compressibility behavior of a laboratory-compacted soil in t he as-compacted and saturated condition. The type of soil used was a highly plastic residual clay, and the mode of com paction was of t he kneading type.
To determine the as-compacted compressibility characteristics, the compacted samples were trimmed to the appropriate size and incrementally loaded in an oedometer. To simulate the changes in mass that may occur in service, compacted specimens were saturated in the oedometer under an equivalent embankment load. A back-pressuring technique was used to achieve full satura tion of the oedometer specimens. Of major interest was the percentage of volume change that occurred during
· sat uration under loading. The ultimate purpose of this research was to establish
models that can be used to accurately predict laboratory compressibility characteristics in terms of the important compaction variables. The models proposed will provide the engineer with a tool for controlling as-compacted and long-term compressibility.
A similar study on the compressibility characteristics of field-compacted samples of the same soil is in progress. The combined results of both studies will allow the engineer to establish suitable compaction specifications for controlling such behavior.
BACKGROUND INFORMATION
Yoshimi (4) studied the physical and mechanical mechanisms that control the consolidation of unsaturated soil. He divided the total compression process into three stages-initial compression, consolidation, and creep-and assumed that all three stages occur singly and in the stated order. These stages are defined as follows:
1. Initial compression-the immediate response caused by the compression of soil fabric and gas as soon as the incremental load is applied,
2. Consolidation-that part of compression that involves the outflow of pore fluids, and
3. Creep-that part of compression that involves the redistribution of shearing stresses in the absorbed water and the local rearrangement of the soil particles.
In 1974, Barden (5) explained the volume-change behavior of compacted clays as follows. In the dry-of-optimum condition (continuous air voids),
Assuming that the initial value of pore air pressure (u.) is atmospheric the initial suction will cause the value of pore water pressure (uwl to be negative .... On applying a load to the soil there will be an initial or immediate compression, and because of the relative stiffness of the soil skeleton and the highly compressible pore-fluid, the values of t.u. and t.uw will be small. Thus there will be an increase in u. and uw, but in general uw will remain below atmospheric pressure and hence only air can drain from the soil. Even in cases where Uw does rise above atmospheric pressure, the value of air permeability (k 0 ) is so much greater than the water permeability (kwl that the flow must be completely dominated by the air . ...
In the wet-of-optimum condition (occluded air bubbles),
The material develops pore water pressure, increasing with water con· tent. Since this is also associated with a low value of kw. consolidation in the classical sense is a real engineering problem involved in the stability analysis of embankments, etc. It has been shown that despite the expansion of air bubbles, the variation of permeability during a consolidation stage is no more marked than in many eatu· rated clays. It is also shown that the compressibility of the pore fluid should not be a particularly important factor, provided the

42
coefficient of volume compressibility (mvl is defined with respect to the overall settlement. Thus on theoretical grounds it appears that (classical) Terzaghi theory should prove adequate.
In the transition from dry to wet, Barden indicates that, right up to occlusion, ka >>kw and no water flows. He also suggests that occlusion occurs at roughly optimum water content, although there may be regions of continuous air voids with low values of ka, and that the occlusion process and the transition from a dry to a wet process are sudden rather than gradual.
Hodek (~) explained the characteristics and engineering behavior of a compacted soil in terms of a deformable aggregate model. According to Garcia-Bengochea (7), measurements of pore-size distribution for compacted clays have also provided strong evidence for a deformable aggregate model.
EXPERIMENTAL APPARATUS AND PROCEDURE
The soil used in this study was obtained from the IN-37 relocation project in Perry County, Indiana, and is referred to as St. Croix clay. The soil is a highly plastic residual clay from sandstone-shale parent material. Its properties are described below:
Category Classification or Value
Soil classification Unified AASHTO
Index properties(%)
CH A-7-6
Liquid limit, w2 53 Plastic limit, w0 21 Plasticity index, 10 32 Shrinkage limit, w, 12
Specific gravity, G, 2.80 Natural moisture, w" (%) 20 Clay-size fraction < 2 µm (%) 44
An X-ray diffraction analysis was performed on the clay-size fraction; kaolinite was found to be the predominant clay mineral, but montmorillonite was also present in trace amounts.
The kneading method of compaction was used in this study. Typically, however, density and water content are the prescribed elements in an end-result approach and are based on results obtained by the laboratory impact method. It was therefore considered appropriate to use the relations among impact, moisture, and density as a base reference for the kneading method.
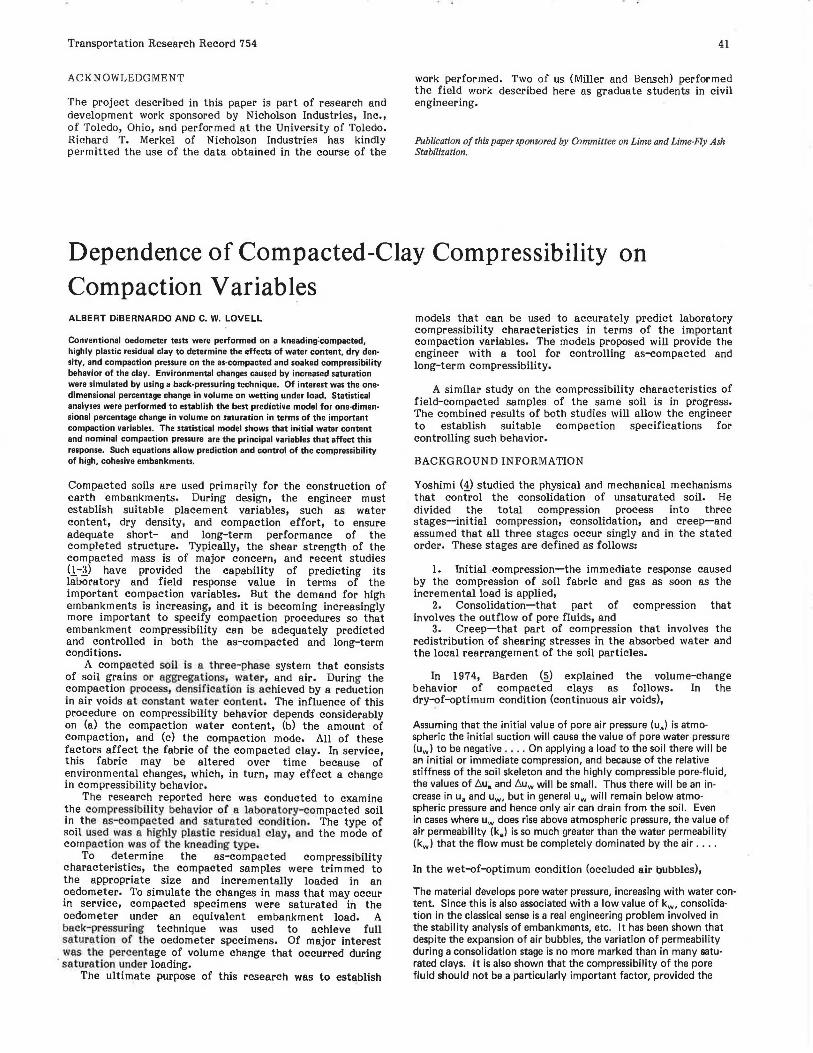
The moisture-density curves for the three basic levels of impact energy used are shown in Figure l. The compaction assembly and procedure were as specified in AASHTO
Figure 1. Moisturedensity-energy relations for three levels of impact energy.
.. .!; ~105
~ cO -;:; 100 ~ -~
t!l ~ 95
90
wm. Content
Note: 1 kg/m3 ; 0.062 lb/ft3.
Transportation Research Record 754
T99-70, but fresh samples were used for each point on the curve. Kneading-compacted samples were fitted to these curves by adjusting the foot pressures.
A Karol-Warner fixed-ring consolidation cell was used in this study. The oedometer ring is 63.5 mm (2.50 in) in diameter, 2.54 mm (l in) in height, and 19.l mm (0.75 in) in wall thickness. The loading system used to compress the sample is a lever arm-weight typ·e.
A tube sample was taken from the compaction mold (B) and hydraulically extruded directly into the oedometer ring. The upper and lower faces of the specimen were trimmed with a steel straightedge by using the top and bottom of the ring as guides.
Following a seating-load-adjustment period (typically 10 min), the applied pressure was increased, by using a load-increment ratio (LIR) of 0.5, to 15.2, 22.6, 34.0, 49.5, 76.5 kPa (2.2, 3.3, 5, 7.2, and 11 lbf/in2 ), etc. The duration of each load was 10 min, during which dial readings were typically recorded at O, 0.1, 0.5, 1, 2, 4, B, and 10 min.
The 10-min load-duration criterion was based principally on the findings of Yoshimi (4). To determine which LIR to use for the as-compacted test, it was decided that the following requirements should be met:
l. A large portion of the compression must take place within 10 min,
2. As few loads as possible would be used to limit moisture loss by evaporation, and
3. The compaction prestress value could be accurately defined by using the Casagrande construction.
Based on the results of Leonards and Girault (9) for determining the preconsolidation value for saturated soils, if an LIR of l were used, requirements l and 2 above would be satisfied but requirement 3 might not. lf an LIB of O.l or 0.2 were used, requirement 3 would be satisfied but not requirements l and 2 (1)· Ideally, an LIR equal to actual field loading conditions should be used; it is dependent, however, on a given application and may be difficult to determine. Therefore, an LlR of 0.5 was chosen because it most suitably matched the requirements.
It is likely that the volume changes caused by saturation are important. To measure these, the compacted samples were compressed (LIR = 0.5, load duration = l 0 min) until a vertical pressure of either 160, 320, or 480 kPa (23, 46, or 70 lt>[/in') was applied. The samples were then saturated by a de-airing and back-pressuring procedure. The consolidating loads-either 160, 320, or 480 kPa-represent the pressure exerted by an equivalent embankment height of 7.8, 15.6, or 23.5 m (25, 50, or 75 ft), respectively.
RESULTS AND DISCUSSION
As-Compacted Compressibility
Compressibility tests were labeled as follows: to correspond to the equivalent low energy (L). standard Proctor (S), and modified Proctor (M) impact levels; dry-of-optimum (D), optimum (0), or wet-of-optimum (W) conditionsi and sample numbers l, 2, etc. For example, MDl characterizes the first sample compacted to a dry-of-optimum condition by using equivalent modified Proctor kneading-compaction pressure.
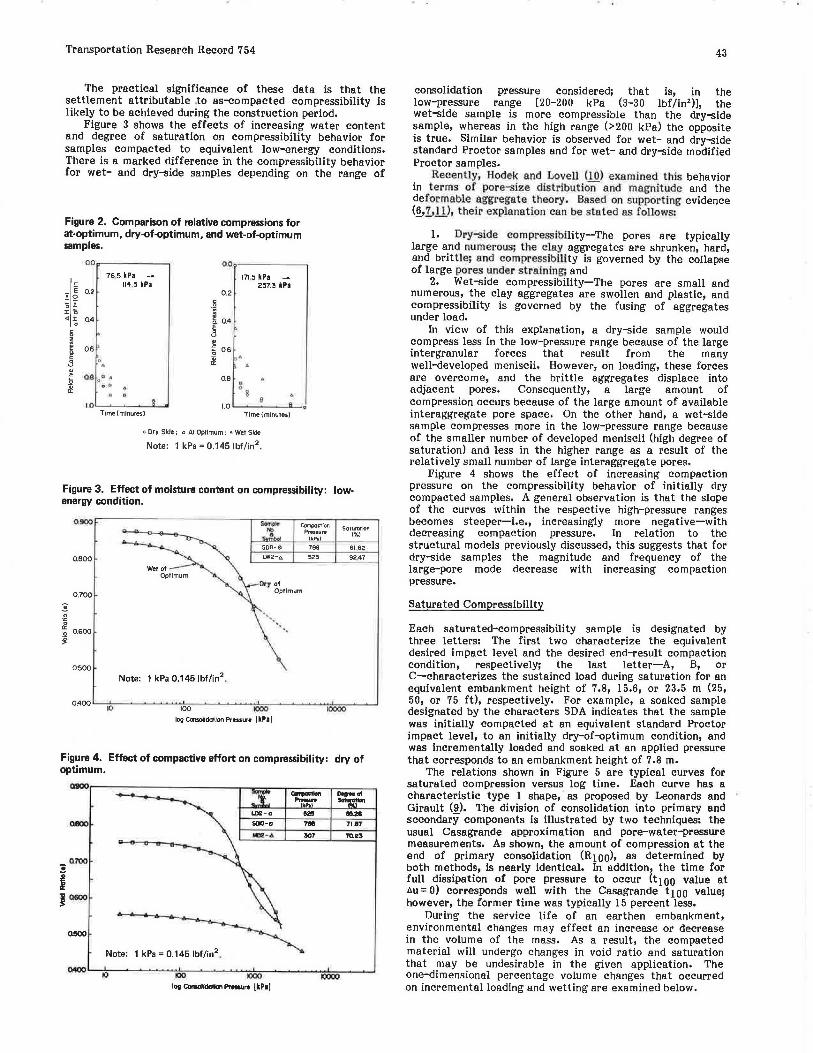
Figure 2 shows the relative compression (compression at time = t divided by total compression at time = 10 min) versus time. For the dry-side and optimum samples (SOB, SOl 6), the magnitudes of relative compression are virtually the same at each successive time plotted. It is believed that this would not occur if the compression of both samples were not dominated by the outflow of pore air (t.uw < Ohpecifically, if the air voids were not interconnected. Figure 2 also shows the magnitude of relative compression with time for an initially wet-of-optimum sample (LW2). In comparison, the wet-side sample exhibits the least amount of relative compression within the 10-min period.
Transportation Research Record 754
The practical significance of these data is that the settlement attributable .to as-compacted compressibility is likely to be achieved during the construction period.
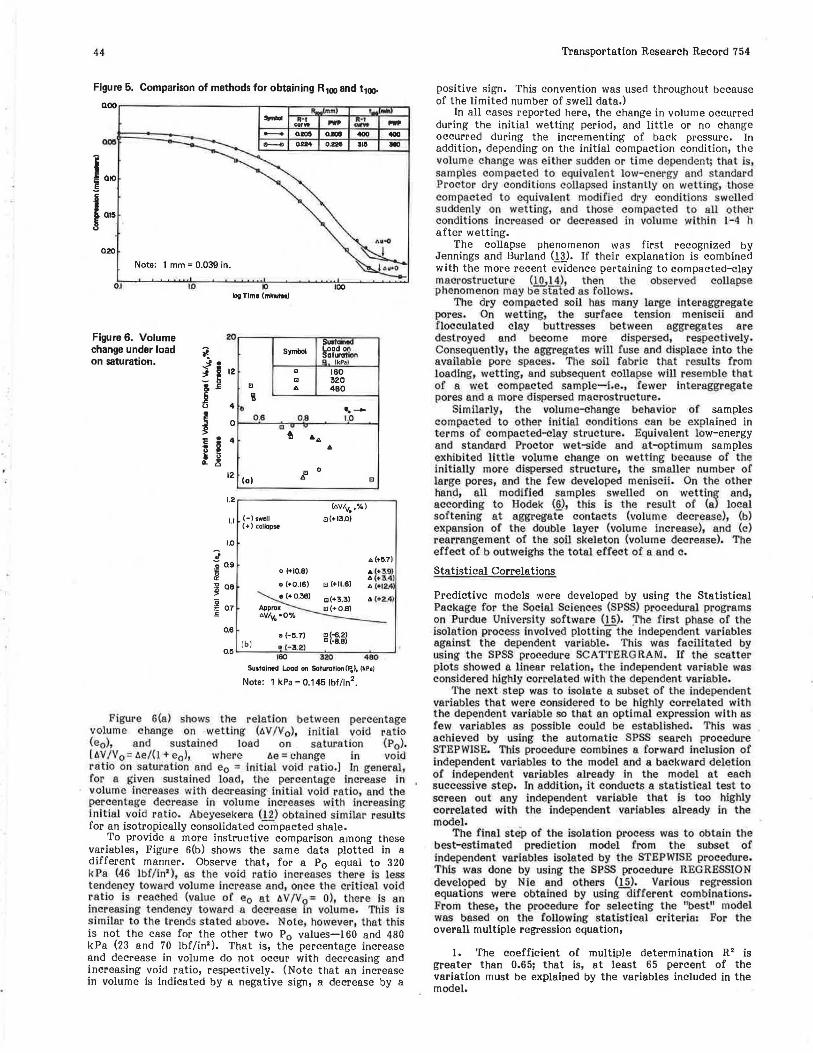
Figure 3 shows the effects of increasing water content and degree of saturation on compressibility behavior for samples compacted to equivalent low-energy conditions. There is a marked difference in the compressibility behavior for wet- and dry-side samples depending on the range of
Figure 2. Comparison of relative compressions for at-optimum, dry-of-optimum, and wet-of-optimum samples.
c
- E !.Q c:.. J: 0 < J:
< §
~ ~ 8 . > -= c
di
00 oo 76 5 kPa 171,5 kPa
114,5 kPa 257'.3 kPa 0.2 0.2
g ]
0.4 a o.4 E
" 8
06 ° ~ 'i; 0.6
Oll
10
0 ~ . .· . 0.8 0 •
: 8 . . . ~
1.0 Time (minutes) Time (minutes)
o Dry Side; o Al Optimum; .11. Wet Side
Note: 1 kPa = 0.145 lbf/in2•
Figure 3. Effect of moisture content on compressibility: low· energy condition.
. 0
0900
O.BOO
0.700
~ -0 0.600
~
0.500
Note: 1 kPa 0.145 lbf/in2•
log Caisolldallon Pressure I kP a I
Figure 4. Effect of compactive effort on compressibility: dry of optimum.
0900r-~~~~~~~~~~~-.--r.:==~.-~~---.,.-~~-.
781 71.87
301 70.23
Note: 1kPa=0.145 lbf/in2•
o.t00·~~~~~~~~.......,IOO~~~~~--,.IOOO~~~~~~IOOOCI,..._=· ~~----'
109 Conoo11c1a1ton PreAure lkP•I
43
consolidation pressure considered; that is, in the low-pressure range [20-200 kPa (3-30 lbf/in2 )], the wet-side sample is more compressible than the dry-side sample, whereas in the high range (>200 kPa) the opposite is true. Similar behavior is observed for wet- and dry-side standard Proctor samples and for wet- and dry-side modified Proctor samples.
.Recently, Hodek and Lov·e11 (IO) examined this behavior in terms of pore-size distribution and magnitude and the deformable aggregate theory. Based on supporting evidence (.§.,1,.!l), their explanation can be stated as follows:
1. Dry-side compressibility-The pores are typically large and nu merous; the clay aggregates are shrunken, hard, and brittle; and compressibility is governed by the collapse of large pores under straining; and
2. Wet-side compressibility-The pores are small and numerous, the clay aggregates are swollen and plastic, and compressibility is governed by the fusing of aggregates under load.
In view of this explanation, a dry-side sample would compress less in the low-pressure range because of the large intergranular forces that result from the many well-developed meniscii. However, on loading, these forces are overcome, and the brittle aggregates displace into adjacent pores. Consequently, a large amount of compression occurs because of the large amount of available interaggregate pore space. On the other hand, a wet-side sample compresses more in the low-pressure range because of the smaller number of developed meniscii (high degree of saturation) and less in the higher range as a result of the relatively small number of large interaggregate pores.
Figure 4 shows the effect of increasing compaction pressure on the compressibility behavior of initially dry compacted samples. A general observation is that the slope of the curves within the respective high-pressure ranges becomes steeper-i.e., increasingly more negative-with decreasing compaction pressure. In relation to the structural models previously discussed, this suggests that for dry-side samples the magnitude and frequency of the large-pore mode decrease with increasing compaction pressure.
Saturated Compressibility
Each saturated-compressibility sample is designated by three letters: The first two characterize the equivalent desired impact level and the desired end-result compaction condition, respectively; the last letter-A, B, or C-characterizes the sustained load during saturation for an equivalent embankment height of 7 .8, 15.6, or 23.5 m (25, 50, or 75 ft), respectively. For example, a soaked sample designated by the characters SDA indicates that the sample was initially compacted at an equivalent standard Proctor impact level, to an initially dry-of-optimum condition, and was incrementally loaded and soaked at an applied pressure that corresponds to an embankment height of 7 .8 m.
The relations shown in Figure 5 are typical curves for saturated compression versus log time. Each curve has a characteristic type 1 shape, as proposed by Leonards and Girault (9). The division of consolidation into primary and secondary components is illustrated by two techniques: the usual Casagrande approximation and pore-water-pressure measurements. As shown, the amount of compression at the end of primary consolidation (R100>, as determined by both methods, is nearly identical. In addition, the time for full dissipation of pore pressure to occur (t100 value at au= O) corresponds well with the Casagrande t 100 value; however, the former time was typically 15 percent less.
During the service life of an earthen embankment, environmental changes may effect an increase or decrease in the volume of the mass. As a result, the compacted material will undergo changes in void ratio and saturation that may be undesirable in the given application. The one-dimensional percentage volume changes that occurred on incremental loading and wetting are examined below.
44
Figure 5. Comparison of methods for obtaining R100 and t100-
noor-~~~~~~~~~..-~-.~-;--=:,,...--r---:--,,,,,,.--.
,,.,... hR-'°'1~~:!-+-,...,...:-:::!!..----I curw
QOCI
Q20
Note: 1 mm= 0.039 in.
OJ 10 IO 100 log Tlmo (m-l
Figure 6. Volume change under load on saturation.
20
12
1.2
I.I
1.0
J i 0.9
Q'.
~QB g ~ 07
0.6
05
Symbol ~us!-oad :WO., "'""" " lkPal
" 160 .. 320 a ... 49·0 il
~ ··-0.8 0.8 1.0 0 u "
fl ..... ...
J.' " (a) e
(t>V/y0
,"A.)
(-)swell ci(•l3.0) (+) coliopM
6(+5.7)
o (+JO.Bl & (+3.9J 6(•3.4)
0 (+0.16) s C+ll.6) .. C-12.4 0 (+0.38) sC+3.3) .. (•2.41
App"'• sC+a.8) "wv. •a%
o C-5. 7l "!-il.2) (b) • C-3.21
s ·B.Bl
160 1120 480 Su1tained Load on Saturation (f~), OcPaJ
Note: 1 kPa = 0.145 lbf/in2•
Figure G(a) shows the relation between percentage volume change on wetting (t.V/V0 ), initial void ratio Ceo>. and sustained load on saturation (P0 ). [t.V/Vo=t.e/(l+e0 ), where t.e=change in void ratio on. saturation. and e0 = initial void t•atio.J In general, for a given sustained load, the percentage increase in volume increases with. decreasing initial void ratio, and the pe,r~enta~e de~rease 1n volume increases with increasing 1mtml void ratLO. Abeyesekera (12) obtained similar results for an isotropically consolidated compacted shale.
.To provi?e a more instructive comparison among these variables, Figure 6(b) shows the same data plotted in a different manner. Observe that, for a Po equal to 320 kPa (46 lbf/in'), as the void ratio increases there is less tendency toward volume increase and, once the critical void ~atio i~ reached (value of e0 at to V /V 0 = O), there is an increasing tendency toward a decrease in volume. This is similar to the trends stated above. Note, however, that this is not the case for the other two P0 values-160 and 480 kPa (23 and 70 lbf/in2
). That is, the percentage increase and decrease in volume do not occur with decreasing and increasing void ratio, respectively. (Note that an increase in volume is indicated by a negative sign, a decrease by a
Transportation Research Record 754
positive sign. This convention was used throughout because of the limited number of swell data.)
In all cases reported here, the change in volume occurred during the initial wetting period, and little or no change occurred during the incrementing of back pressure. In addition, depending on the initial compaction condition, the volume change was either sudden or time dependent; that is, samples compacted to equivalent low-energy and standard Proctor dry conditions collapsed instantly on wetting, those compacted to equivalent modified dry conditions swelled suddenly on wetting, and those compacted to all other conditions increased or decreased in volume within 1-4 h after wetting.
T.he collapse phenomenon was first recognized by Jenmngs and Burland (13). If their explanation is combined with the more recent evidence pertaining to compacted-clay maorostructure (!Q,14.), then the observed collapse phenomeron may be staled as follows.
The dry compacted soil has many large fnteraggregate pores. On wetting, the surface tension meniscii and flocculated clay buttresses between aggregates are destroyed and become more dispersed, respectively. Consequently, the aggregates will fuse and displace into the available pore spaces. 'rhe soil fabric that results from loading, wetting, and subsequent collapse will resemble that of a wet compacted sample-i.e., fewer interaggregate pores and a more dispersed macrostructure.
Similarly, the volume-change behavior of samples compacted to other initial conditions can be explained in terms of compacted-clay structure. Equivalent low-energy and standard Proctor wet-side and at-optimum samples exhibited little volume change on wetting because of the initially more dispersed structure, the smaller number of large pores, and the few developed menisci!. On the other hand, all modified samples swelled on wetting and, according to Hodek (§), this is the result of (a) local softening at aggregate contacts (volume decrease), (b) expansion of the double layer (volume increase), and (c) rearrangement of the soi) skeleton (volume decrease). The effect of b outweighs the total effect of a and c.
Statistical Correlations
Predictive models were developed by using the Statistical Package 'for the Social Sciences (SPSS) procedural programs ?n P~rdue University software (1.§). '.l'he first phase of the 1solat1on process involved plotting the independent variables against the dependent variable. This was facilitated by using the SPSS procedure SCATTERGRAM. If the scatter plots showed a linear relation, the independent variable was considered highly correlated with the dependent variable.
The next step was to isolate a subset of the independent variables that were considered to be highly correlated with the dependent variable so that an optimal expression with as few variables as possible could be established. This was achieved by using the automatic SPSS search procedure STEPWISE. This procedure combines a forward inclusion of independent variables to the model and a backwa.rd deletion of independent variables already in the model at each successive step. In addition, it conducts a statistical test to screen out any independent variable that is too highly correlated with the independent variables already In the model.
The final step of the isolation process was to obtain the best-estimated prediction model from the subset of independent variables isolated by the STEPWISE procedure. This was done by using the SPSS procedure REGRESSION developed by Nie and others (15). Various regression equations were obtained by usingdifferent combinations. From these, the procedure for selecting the "best" model was based on the following statistical criteria: For the overall multiple regression equation,
1. The coefficient of multiple determination R2 is greater than 0.65; that is, at least 65 percent of the variation must be explained by the variables included in the model.
Transportation Research Record 754
2. The coefficient of multiple determination Ra 2
must increase with each additional independent variable entered in the model.
3. The overall F-test at the a = 0.05 significance level must be met (this tests for multiple linearity of the model).
For the partial regression coefficients,
1. The F-test for each partial regression coefficient at the a= 0.05 significance level must be met (this tests whether an independent variable should be dropped from the model).
2. The coefficients of partial determination ri•jk are significant.
3. The 95 percent confidence limit for each bi is small and does not cross zero (this restriction is similar to the first).
For the computed residuals,
1. The scatter plots of the residuals versus the independent variables (s) show normal constancy of variance trends.
2. The residuals are normally distributed random variables; that is, the values of ei//M"Slr (residuals divided by the error root mean square) must range between +3 and -3.
In that case in which all criteria were suitably met by more than one model, the model with the fewest number of variables was selected provided there was no appreciable difference-i.e., less than 5 percent-in either of the R2
or Ra 2 values. Based on the foregoing, the following prediction model
was selected for (1 - D) percentage volume change on saturation:
ISV/V0 = 25.47 - 0.872w- 0.0048Pc (1)
where
AV/Vo=estimated value of (1-D) percentage volume change on wetting(%),
w =water content(%), and Pc= nominal compaction pressure (kPa).
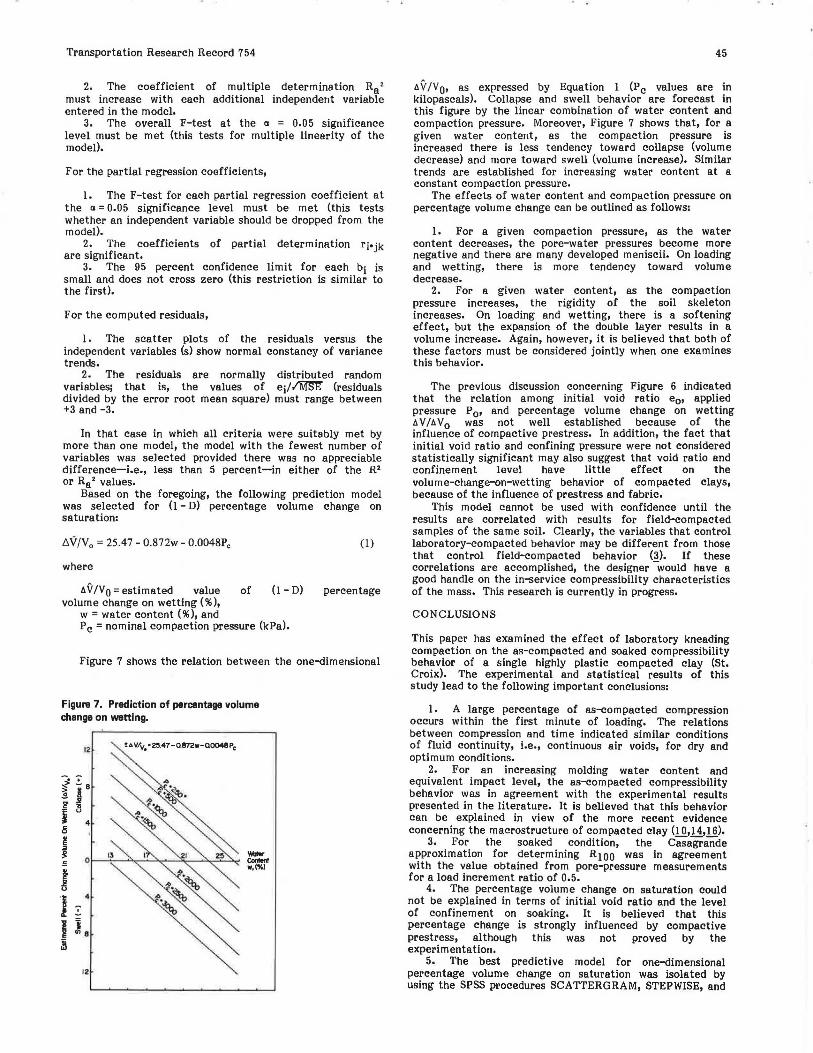
Figure 7 shows the relation between the one-dimensional
Figure 7. Prediction of percentage volume change on wetting.
12
~ ~ e ~ ! - JI !!' ~ i 4 c5 ~ ~ -c 0 Conlon!
J w,(%)
·1 4
I 8
~
12
45
t. V ;v 0, as expressed by Equation l (Pc values are in kilopascals). Collapse and swell behavior are forecast in this figure by the linear combination of water content and compaction pressure. Moreover, Figure 7 shows that, for a given water content, as the compaction pressure is increased there is less tendency toward collapse (volume decrease) and more toward swell (volume increase). Similar trends are established for increasing water content at a constant compaction pressure.
The effects of water content and compaction pressure on percentage volume change can be outlined as follows:
1. For a given compaction pressure, as the water content decreases, the pore-water pressures become more negative and there are many developed meniscii. On loading and wetting, there is more tendency toward volume decrease.
2. For a given water content, as the compaction pressure increases, the rigidity of the soil skeleton increases. On loading and wetting, there is a softening effect, but the expansion of the double layer results in a volume increase. Again, however, it is believed that both of these factors must be considered jointly when one examines this behavior.
The previous discussion concerning Figure 6 indicated that the relation among initial void ratio e0 , applied pressure P0 , and percentage volume change on wetting t. VI t. V 0 was not well established because of the influence of compactive prestress. In addition, the fact that initial void ratio and confining pressure were not considered statistically significant may also suggest that void ratio and confinement level have little effect on the volume-change-on-wetting behavior of compacted clays, because of the influence of prestress and fabric.
This model cannot be used with confidence until the results are correlated with results for field-compacted samples of the same soil. Clearly, the variables that control laboratory-compacted behavior may be different from those that control field-compacted behavior (3). If these correlations are accomplished, the designer -would have a good handle on the in-service compressibility characteristics of the mass. This research is currently in progress.
CONCLUSIONS
This paper has examined the effect of laboratory kneading compaction on the as-compacted and soaked compressibility behavior of a single highly plastic compacted clay (St. Croix). The experimental and statistical results of this study lead to the following important conclusions:
1. A large percentage of as-compacted compression occurs within the first minute of loading. The relations between compression and time indicated similar conditions of fluid continuity, i.e., continuous air voids, for dry and optimum conditions.
2. For an increasing molding water content and equivalent impact level, the as-compacted compressibility behavior was in agreement with the experimental results presented in the literature. It is believed that this behavior can be explained in view of the more recent evidence concerning the macrostructure of compacted clay (!.Q.,J.!,1§).
3. For the soaked condition, the Casagrande approximation for determining R loo was in agreement with the value obtained from pore-pressure measurements for a load increment ratio of 0.5.
4. The percentage volume change on saturation could not be explained in terms of initial void ratio and the level of confinement on soaking. It is believed that this percentage change is strongly influenced by compactive prestress, although this was not proved by the experimentation.
5. The best predictive model for one-dimensional percentage volume change on saturation was isolated by using the SPSS procedures SCATTERGRAM, STEPWISE, and
46
REGRESSION. The proposed model was found to be statistically valid and accurate. Equation 1 allows one to predict or control the given response in terms of important compaction variables-namely, water content end compaction pressure.
ACKNOWLEDGMENT
We are grateful to the Joint Highway Research Project of Purdue University, the Indiana State Highway Commission, and the Federal Highway Administration for their financial support of the research reported here. We also appreciate the assistance of our Purdue colleague, A.G. Altschaeffl,
REFERENCES
1. M.F. Essigmann. An Examination of the Variability Resulting from Soil Compaction. Purdue Univ., West Lafayette, IN, Joint Highway Research Project Rept. 76-28, Aug. 1976.
2. J.C. Scott. Examination of the Variability of the Soaked Strength of a Laboratory-Compacted Clay. Purdue Univ., West Lafayette, IN, Joint Highway Research Project Rept. 77-8, May 1977.
3. J.T. Price. Soil Compaction Specification Procedure for Desired Field Strength. Purdue Univ., West Lafayette, IN, Joint Highway Research Project Rept. 78-7, May 1978.
4. Y. Yoshimi. One-Dimensional Consolidation of Partially Saturated Soil. Northwestern Univ., Evanston, IL, Ph.D. thesis, Aug. 1958, 149 pp.
5. L. Barden. Consolidation of Clays Compacted Dry and Wet of Optimum Water Content. Geotechnique, Vol. 24, No. 4, 1974, pp. 605-625.
6. R.J. Hodek. Mechanism for the Compaction end Response of Kaolinite. Purdue Univ., West Lafayette, IN, Joint Highway Research Project Rept. 72-36, Dec. 1972.
7. I. Garcie-Bengochea. The Relation Between Permeability and Pore Size Distribution or Compacted Clayey Silts. Purdue Univ., West Lafayette, IN, Joint ,
Transportation Research Record 754
Highway Research Project Rept. 78-4, May 1978. 8. A. DiBernardo. The Effect of Laboratory Compaction
on the Compressibility of a Compacted Highly Plastic Clay. Purdue Univ., West Lafayette, IN, Joint Highway Research Project Rept. 79-3, May 1979.
9. G. A. Leonards and P. Girault. A Study of the One-Dimensional Consolidation Test. Proc., 5th International Conference on Soil Mechanics arid Foundation Engineering, Paris, Vol. 1, 1961, pp. 213-218.
1 o. R.J. Hodek and C.W. Lovell. A New Look at Compaction of Landfills. Presented at Assn. of Engineering Geologists Conference, Hershey, PA, Oct. 18, 1979.
11. M.A. Reed. Frost Heaving Rate of Silty Soils as a Function of Pore Size Distribution. Purdue Univ., West Lafayette, IN, Joint Highway Research Project Rept. 77-15, Aug. 1977.
12. R.A. Abeyesekera. Stress Deformation and Strength Characteristics of a Compacted Shale. Purdue Univ., West Lafayette, IN, Joint Highway Research Project Rept. 77-24, May 1978.
13. J.E. Jennings and J.B. Burland. Limitations of the Use of Effective Stress in Pertly Saturated Soils. Geotechnique, Vol. 12, No. 2, 1962, pp. 125-144.
14. L. Barden end G.R. Sides. Engineering Behavior and Structure of Compacted Clay. Journal of the Soil Mechanics and Foundations Division, ASCE, Vol. 96, No. SM4, 1970, pp. 1171-1200.
15. N .H. Nie and others. Statistical Package for the Social Sciences, 2nd ed. McGraw-Hill, New York, 1975, 675 PP•
16. R. J. Hodek end C. W. Lovell. Soil Aggregates and Their Influence on Soil Compaction and Swelling. TRB, Transportation Research Record 733, 1979, pp. 94-99.
Publication of this paper sponsored by Committee on Earthwork Construction.
Stabilization of a Sanitary Landfill to Support a Highway RONALD E. SHEURS AND RAJ P. KHERA
The results of the stabilization of a sanitary landfill by use of surcharges are reported. The New Jersey Department of Transportation has undertaken the construction of two experimental roadways-1·85 eastbound and 1-85 westbound-directly over landfills that contain partially decomposed garbage. Field measurements of settlement and pore-water pressure are presented. The data indicate that the settlement response of a landfill area is similar to that of finegrained soils. Stress history plays an important role in this response. When the ratio between the stress increase i:aused by surcharge load and the existing stress was <:1, the measured strain.-was only 5-7 percent. When this ratio was 1.4 or greater, the strain varied between 11 and 17 percent. The compression ratio for the sanitary landfill was found to range between 0.16 and 0.20. Piezometric heads were found to be erratic and frequently much higher than the projected values. This was attributed to the expulsion of methane gas from the inner piezometric tube.
Relatively little is known about the behavior of a sanitary landfill subjected to loadings such es buildings or embankments. Extensive foundation problems can result unless the landfill has been stabilized before structures are placed on it. Studies have been reported on a range of stabilization techniques, from chemical injections of grout
and fly ash to applications of surcharges (!). Most of the work done to date has been done only under laboratory conditions or small, controlled field conditions.
The New Jersey Department of Transportation (DOT) has undertaken the construction of two roadways directly over landfills that consist of partially decomposed garbage. The project is located on the north side of an active sanitary landfill. The experimental roadways ere I-85 eastbound and I-85 westbound. These roadways have a total length of 975 m (3200 ft) end are part of the I-280 construction project in Kearny, New Jersey. Stabilization is being attained by the use of 1.8-m (6-ft) surcharges over a minimum period of 24 months. Settlement plates and piezometers are being used extensively to monitor the progress of the work.
This is an experimental approach to highway construction that the New Jersey DOT has not previously attempted. In the past, it hes used overloads with and without the aid of vertical send drains to accelerate the stabilization of natural deposits of clays and marshlands but not of landfill areas. If adequate stabilization of the