Embed Size (px)
Citation preview
DEPARTMENT OF THE NAVY FY 2016 BUDGET ESTIMATES
BUDGET DATA BOOK
OFFICE OF BUDGET
March 2015
The estimated cost of this report or study for the Department of Defense is approximately $1,436,000 for the 2015 Fiscal Year. This
includes $74,000 in expenses and $1,362,000 in DoD labor.Generated on 2015Jan21 RefID: D‐682C6DE
INTRODUCTION
This document is a compendium of selected budget data and related information for use by Department of the Navy (DoN) management and staff. This budget reference document is based on documentation supporting the President's Budget request as submitted to the Congress in February 2015 and contains dollar and manpower budget estimates, program and force data, pricing and economic factors, displays of selected funding categories, current and constant dollar data, real program growth estimates, price deflator information, and other data supporting the FY 2016 Budget Estimates.
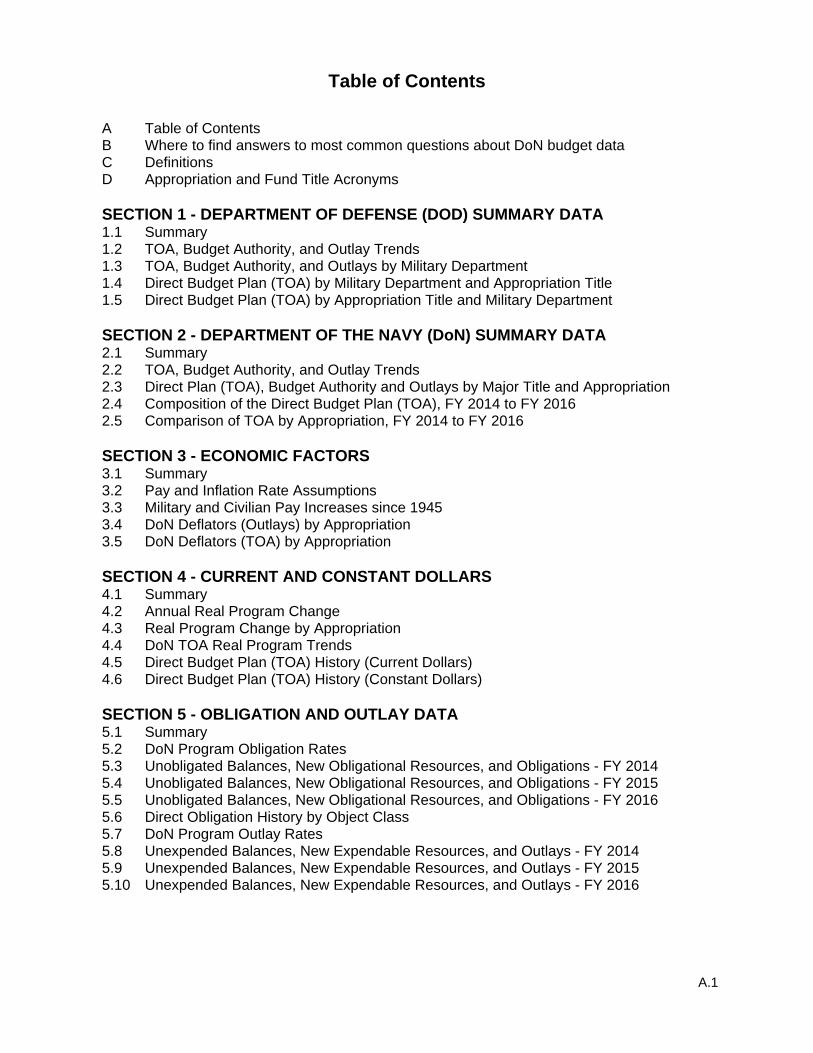
Table of Contents
A.1
A Table of Contents B Where to find answers to most common questions about DoN budget data C Definitions D Appropriation and Fund Title Acronyms
SECTION 1 - DEPARTMENT OF DEFENSE (DOD) SUMMARY DATA 1.1 Summary 1.2 TOA, Budget Authority, and Outlay Trends 1.3 TOA, Budget Authority, and Outlays by Military Department 1.4 Direct Budget Plan (TOA) by Military Department and Appropriation Title 1.5 Direct Budget Plan (TOA) by Appropriation Title and Military Department
SECTION 2 - DEPARTMENT OF THE NAVY (DoN) SUMMARY DATA 2.1 Summary 2.2 TOA, Budget Authority, and Outlay Trends 2.3 Direct Plan (TOA), Budget Authority and Outlays by Major Title and Appropriation 2.4 Composition of the Direct Budget Plan (TOA), FY 2014 to FY 2016 2.5 Comparison of TOA by Appropriation, FY 2014 to FY 2016
SECTION 3 - ECONOMIC FACTORS 3.1 Summary 3.2 Pay and Inflation Rate Assumptions 3.3 Military and Civilian Pay Increases since 1945 3.4 DoN Deflators (Outlays) by Appropriation 3.5 DoN Deflators (TOA) by Appropriation
SECTION 4 - CURRENT AND CONSTANT DOLLARS 4.1 Summary 4.2 Annual Real Program Change 4.3 Real Program Change by Appropriation 4.4 DoN TOA Real Program Trends 4.5 Direct Budget Plan (TOA) History (Current Dollars) 4.6 Direct Budget Plan (TOA) History (Constant Dollars) SECTION 5 - OBLIGATION AND OUTLAY DATA 5.1 Summary 5.2 DoN Program Obligation Rates 5.3 Unobligated Balances, New Obligational Resources, and Obligations - FY 2014 5.4 Unobligated Balances, New Obligational Resources, and Obligations - FY 2015 5.5 Unobligated Balances, New Obligational Resources, and Obligations - FY 2016 5.6 Direct Obligation History by Object Class 5.7 DoN Program Outlay Rates 5.8 Unexpended Balances, New Expendable Resources, and Outlays - FY 2014 5.9 Unexpended Balances, New Expendable Resources, and Outlays - FY 2015 5.10 Unexpended Balances, New Expendable Resources, and Outlays - FY 2016
Table of Contents
A.2
SECTION 6 - SELECTED DON PROGRAM AND SPECIAL INTEREST DATA 6.1 Summary 6.2 Selected Force and Program Factors 6.3 Historical Personnel Summary 6.4 Shipbuilding and Conversion Procurement History 6.5 Aircraft Force History 6.6 Aircraft Procurement History 6.7 Selected Civilian Personnel Special Interest Areas 6.8 Support of Reserve Forces 6.9 TOA by FYDP Major Force Program
WHERE TO FIND THE ANSWERS TO THE MOST COMMON QUESTIONS ABOUT DON BUDGET DATA
B.1
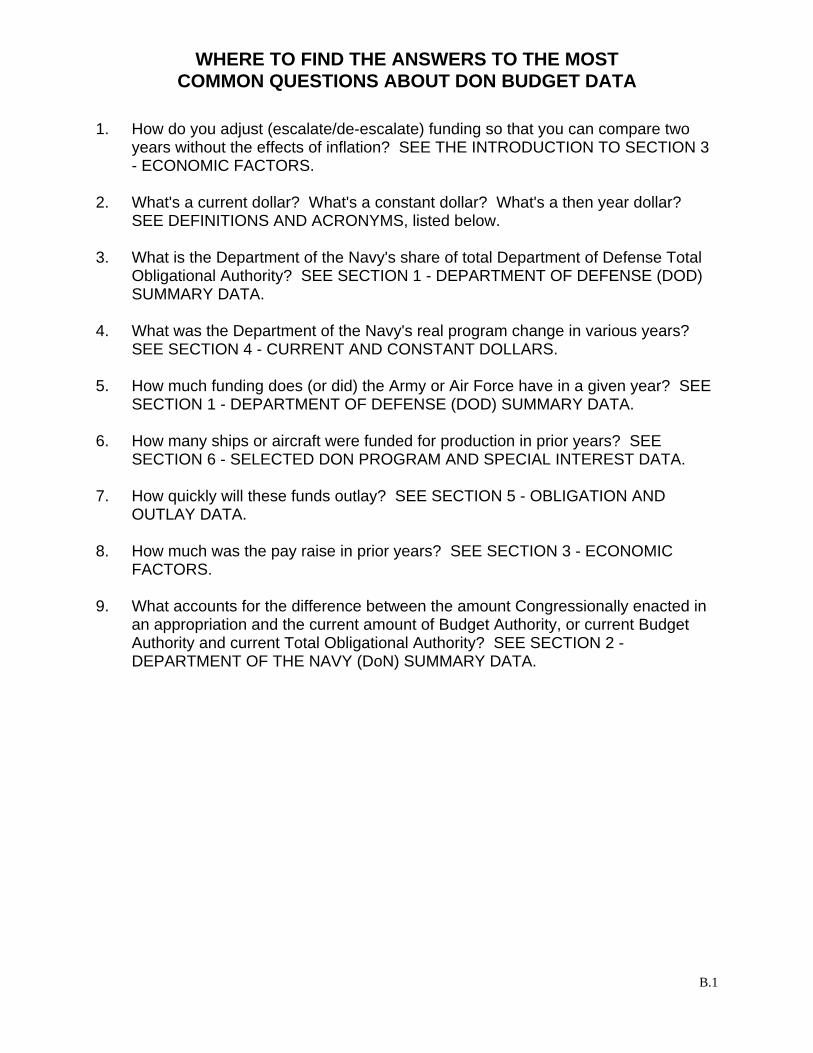
1. How do you adjust (escalate/de-escalate) funding so that you can compare two years without the effects of inflation? SEE THE INTRODUCTION TO SECTION 3 - ECONOMIC FACTORS.
2. What's a current dollar? What's a constant dollar? What's a then year dollar? SEE DEFINITIONS AND ACRONYMS, listed below.
3. What is the Department of the Navy's share of total Department of Defense Total Obligational Authority? SEE SECTION 1 - DEPARTMENT OF DEFENSE (DOD) SUMMARY DATA.
4. What was the Department of the Navy's real program change in various years? SEE SECTION 4 - CURRENT AND CONSTANT DOLLARS.
5. How much funding does (or did) the Army or Air Force have in a given year? SEE SECTION 1 - DEPARTMENT OF DEFENSE (DOD) SUMMARY DATA.
6. How many ships or aircraft were funded for production in prior years? SEE SECTION 6 - SELECTED DON PROGRAM AND SPECIAL INTEREST DATA.
7. How quickly will these funds outlay? SEE SECTION 5 - OBLIGATION AND OUTLAY DATA.
8. How much was the pay raise in prior years? SEE SECTION 3 - ECONOMIC
FACTORS. 9. What accounts for the difference between the amount Congressionally enacted in
an appropriation and the current amount of Budget Authority, or current Budget Authority and current Total Obligational Authority? SEE SECTION 2 - DEPARTMENT OF THE NAVY (DoN) SUMMARY DATA.
Definitions
C.1
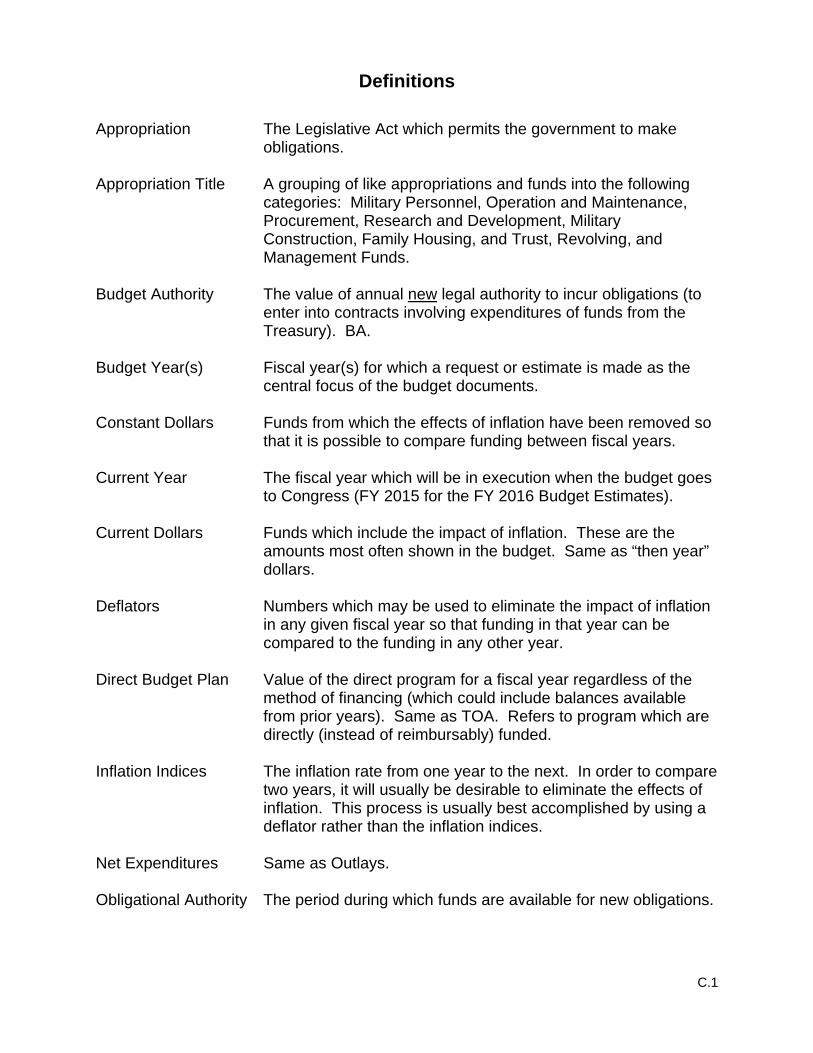
Appropriation The Legislative Act which permits the government to make obligations.
Appropriation Title A grouping of like appropriations and funds into the following
categories: Military Personnel, Operation and Maintenance, Procurement, Research and Development, Military Construction, Family Housing, and Trust, Revolving, and Management Funds.
Budget Authority The value of annual new legal authority to incur obligations (to
enter into contracts involving expenditures of funds from the Treasury). BA.
Budget Year(s) Fiscal year(s) for which a request or estimate is made as the
central focus of the budget documents. Constant Dollars Funds from which the effects of inflation have been removed so
that it is possible to compare funding between fiscal years. Current Year The fiscal year which will be in execution when the budget goes
to Congress (FY 2015 for the FY 2016 Budget Estimates). Current Dollars Funds which include the impact of inflation. These are the
amounts most often shown in the budget. Same as “then year” dollars.
Deflators Numbers which may be used to eliminate the impact of inflation
in any given fiscal year so that funding in that year can be compared to the funding in any other year.
Direct Budget Plan Value of the direct program for a fiscal year regardless of the
method of financing (which could include balances available from prior years). Same as TOA. Refers to program which are directly (instead of reimbursably) funded.
Inflation Indices The inflation rate from one year to the next. In order to compare
two years, it will usually be desirable to eliminate the effects of inflation. This process is usually best accomplished by using a deflator rather than the inflation indices.
Net Expenditures Same as Outlays. Obligational Authority The period during which funds are available for new obligations.
Definitions
C.2
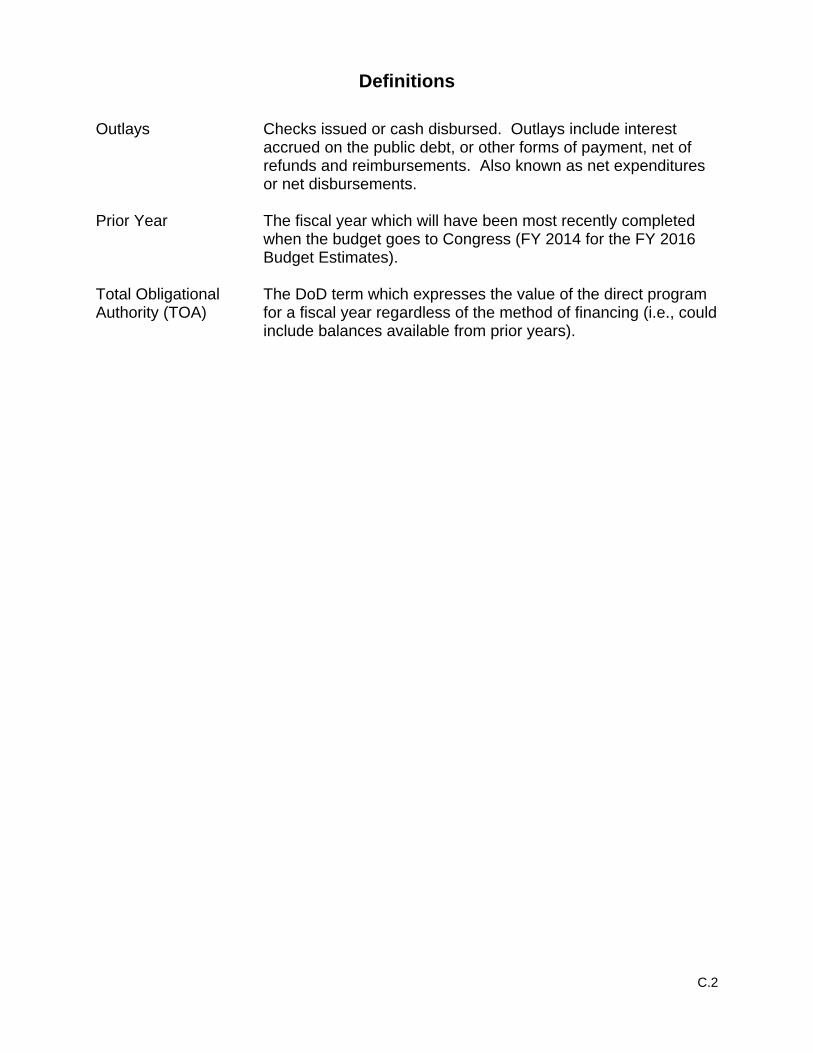
Outlays Checks issued or cash disbursed. Outlays include interest accrued on the public debt, or other forms of payment, net of refunds and reimbursements. Also known as net expenditures or net disbursements.
Prior Year The fiscal year which will have been most recently completed
when the budget goes to Congress (FY 2014 for the FY 2016 Budget Estimates).
Total Obligational The DoD term which expresses the value of the direct program Authority (TOA) for a fiscal year regardless of the method of financing (i.e., could
include balances available from prior years).

Appropriation and Fund Title Acronyms
D.1
MPN Military Personnel, Navy MPMC Military Personnel, Marine Corps RPN Reserve Personnel, Navy RPMC Reserve Personnel, Marine Corps DHAN Medicare-Eligible, Navy DHAMC Medicare-Eligible, Marine Corps DHANR Medicare-Eligible, Navy Reserve DHAMCR Medicare-Eligible, Marine Corps Reserve OMN Operation & Maintenance, Navy OMMC Operation & Maintenance, Marine Corps OMNR Operation & Maintenance, Navy Reserve OMMCR Operation & Maintenance, Marine Corps Reserve OMN, RA Operation & Maintenance, Navy, Recovery Act OMMC, RA Operation & Maintenance, Marine Corps, Recovery Act OMNR, RA Operation & Maintenance, Navy Reserve, Recovery Act OMMCR, RA Operation & Maintenance, Marine Corps Reserve, Recovery Act ERN Environmental Restoration, Navy KAHO IS CONV Kaho'olawe Island Conveyance, Remediation, and
Environmental Restoration Fund KAHO Payment to Kaho'olawe Island Fund SMOSF Ship Modernization, Operations and Sustainment Fund APN Aircraft Procurement, Navy WPN Weapons Procurement, Navy SCN Shipbuilding and Conversion, Navy PANMC Procurement of Ammunition, Navy/Marine Corps OPN Other Procurement, Navy PMC Procurement, Marine Corps CDAN Coastal Defense Augmentation, Navy RDTEN Research, Development, Test, & Evaluation, Navy RDTEN, RA Research, Development, Test, & Evaluation, Navy, Recovery Act MCN Military Construction, Navy (& Marine Corps) MCNR Military Construction, Naval Reserve BRAC Base Realignment & Closure FHCON Family Housing, Navy and Marine Corps (Construction) FHOPS Family Housing, Navy and Marine Corps (Operations) ROSSM Roosmoor Liquidating Trust Settlement Account NWCF Navy Working Capital Fund NDSF National Defense Sealift Fund USNAGMF United States Naval Academy Gift and Museum Fund NGGF Navy General Gift Fund SSPN Ships' Stores Profits, Navy PSSSN Profits Sales of Ships Stores, Navy
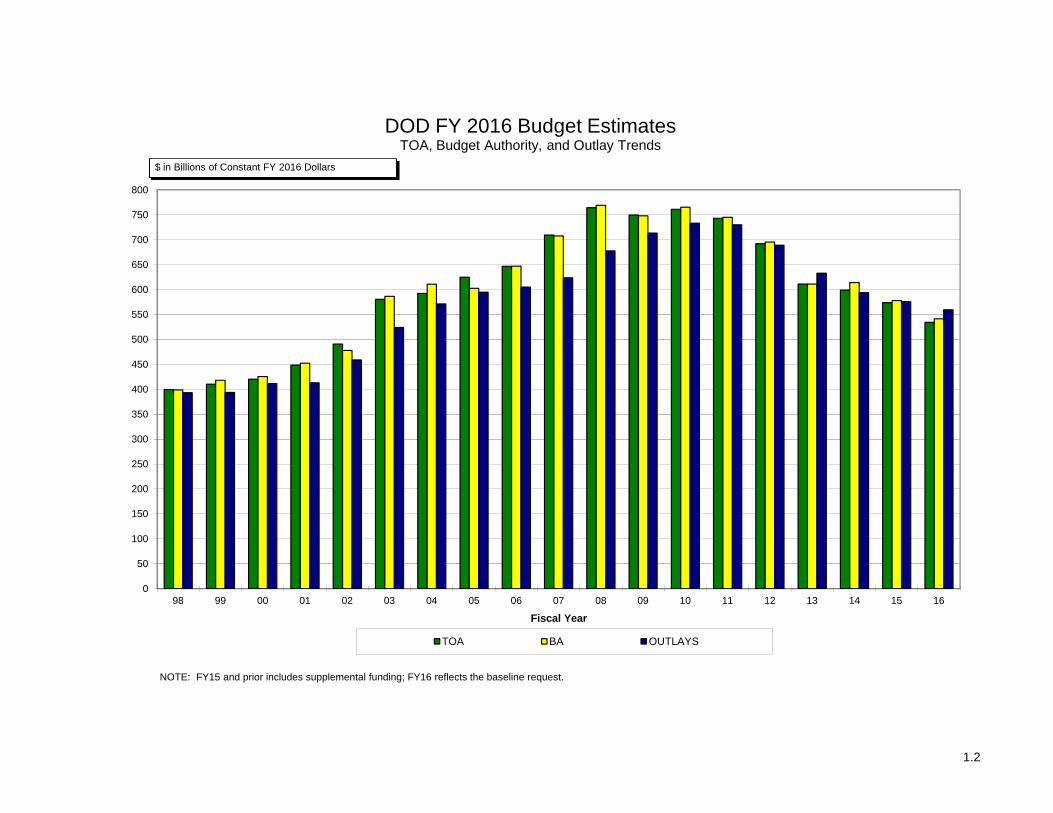
o This section contains a summary of Department of Defense budget estimates in terms of total obligationalauthority (TOA), budget authority (BA), and outlays.
o Trends for TOA, BA, and outlays are included.
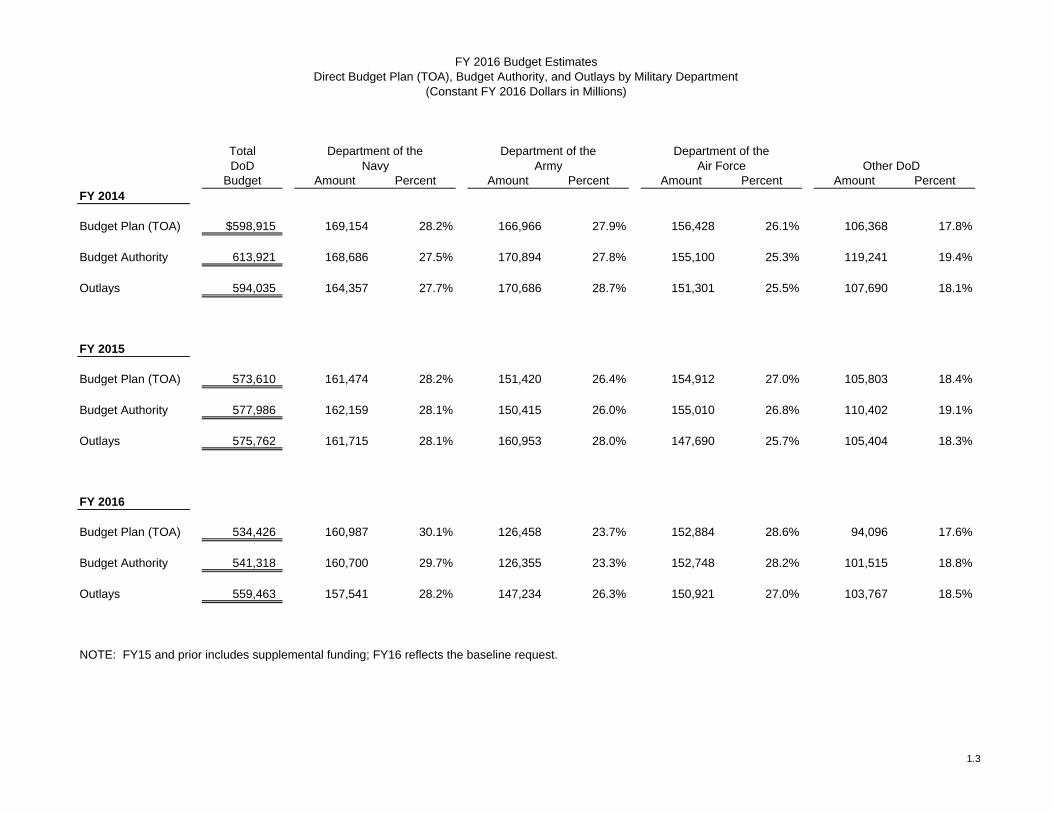
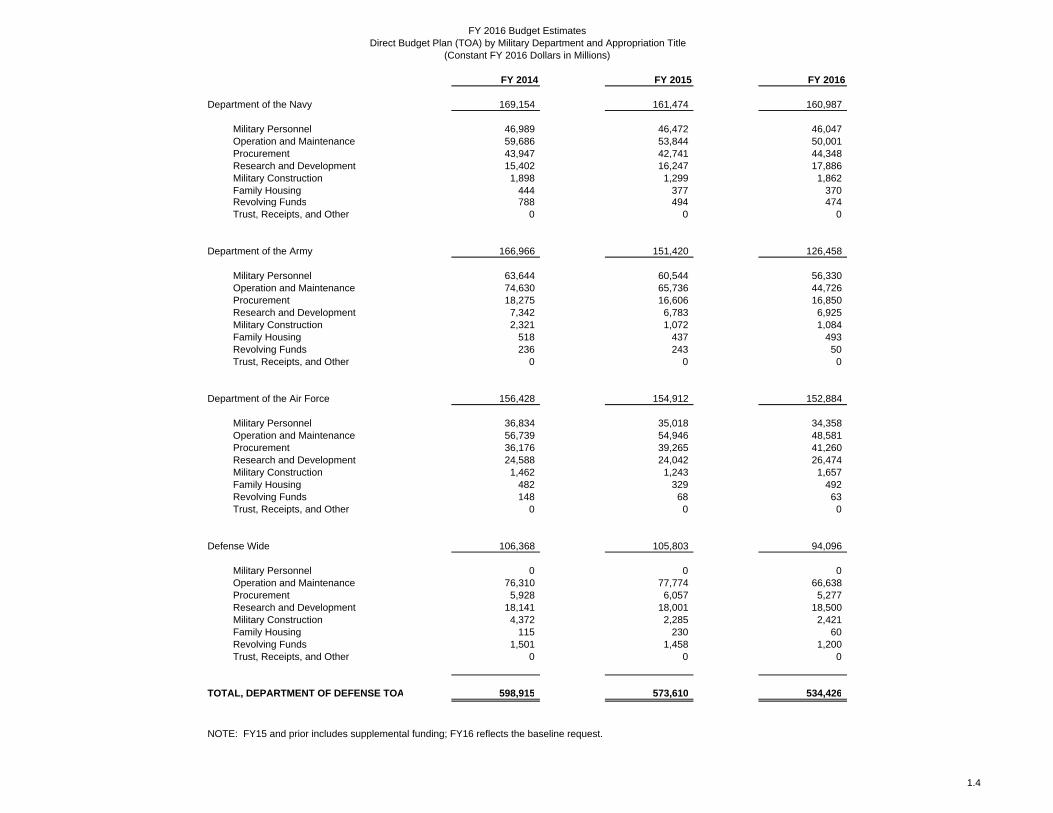
o Funding allocated by military department and major appropriation title is displayed.
o This section places the DON estimates in context with total DOD and other military department estimates.
SECTION 1 - DEPARTMENT OF DEFENSE (DOD) SUMMARY DATA
1.1
0
50
100
150
200
250
300
350
400
450
500
550
600
650
700
750
800
98 99 00 01 02 03 04 05 06 07 08 09 10 11 12 13 14 15 16
Fiscal Year
TOA BA OUTLAYS
$ in Billions of Constant FY 2016 Dollars
DOD FY 2016 Budget EstimatesTOA, Budget Authority, and Outlay Trends
NOTE: FY15 and prior includes supplemental funding; FY16 reflects the baseline request.
1.2
Total Department of the Department of the Department of theDoD Navy Army Air Force Other DoD
Budget Amount Percent Amount Percent Amount Percent Amount PercentFY 2014
Budget Plan (TOA) $598,915 169,154 28.2% 166,966 27.9% 156,428 26.1% 106,368 17.8%
Budget Authority 613,921 168,686 27.5% 170,894 27.8% 155,100 25.3% 119,241 19.4%
Outlays 594,035 164,357 27.7% 170,686 28.7% 151,301 25.5% 107,690 18.1%
FY 2015
Budget Plan (TOA) 573,610 161,474 28.2% 151,420 26.4% 154,912 27.0% 105,803 18.4%
Budget Authority 577,986 162,159 28.1% 150,415 26.0% 155,010 26.8% 110,402 19.1%
Outlays 575,762 161,715 28.1% 160,953 28.0% 147,690 25.7% 105,404 18.3%
FY 2016
Budget Plan (TOA) 534,426 160,987 30.1% 126,458 23.7% 152,884 28.6% 94,096 17.6%
Budget Authority 541,318 160,700 29.7% 126,355 23.3% 152,748 28.2% 101,515 18.8%
Outlays 559,463 157,541 28.2% 147,234 26.3% 150,921 27.0% 103,767 18.5%
FY 2016 Budget EstimatesDirect Budget Plan (TOA), Budget Authority, and Outlays by Military Department
(Constant FY 2016 Dollars in Millions)
NOTE: FY15 and prior includes supplemental funding; FY16 reflects the baseline request.
1.3
FY 2014 FY 2015 FY 2016
Department of the Navy 169,154 161,474 160,987
Military Personnel 46,989 46,472 46,047Operation and Maintenance 59,686 53,844 50,001Procurement 43,947 42,741 44,348Research and Development 15,402 16,247 17,886Military Construction 1,898 1,299 1,862Family Housing 444 377 370Revolving Funds 788 494 474Trust, Receipts, and Other 0 0 0
Department of the Army 166,966 151,420 126,458
Military Personnel 63,644 60,544 56,330Operation and Maintenance 74,630 65,736 44,726Procurement 18,275 16,606 16,850Research and Development 7,342 6,783 6,925Military Construction 2,321 1,072 1,084Family Housing 518 437 493Revolving Funds 236 243 50Trust, Receipts, and Other 0 0 0
Department of the Air Force 156,428 154,912 152,884
Military Personnel 36,834 35,018 34,358Operation and Maintenance 56,739 54,946 48,581Procurement 36,176 39,265 41,260Research and Development 24,588 24,042 26,474Military Construction 1,462 1,243 1,657Family Housing 482 329 492Revolving Funds 148 68 63Trust, Receipts, and Other 0 0 0
Defense Wide 106,368 105,803 94,096
Military Personnel 0 0 0Operation and Maintenance 76,310 77,774 66,638Procurement 5,928 6,057 5,277Research and Development 18,141 18,001 18,500Military Construction 4,372 2,285 2,421Family Housing 115 230 60Revolving Funds 1,501 1,458 1,200Trust, Receipts, and Other 0 0 0
TOTAL, DEPARTMENT OF DEFENSE TOA 598,915 573,610 534,426
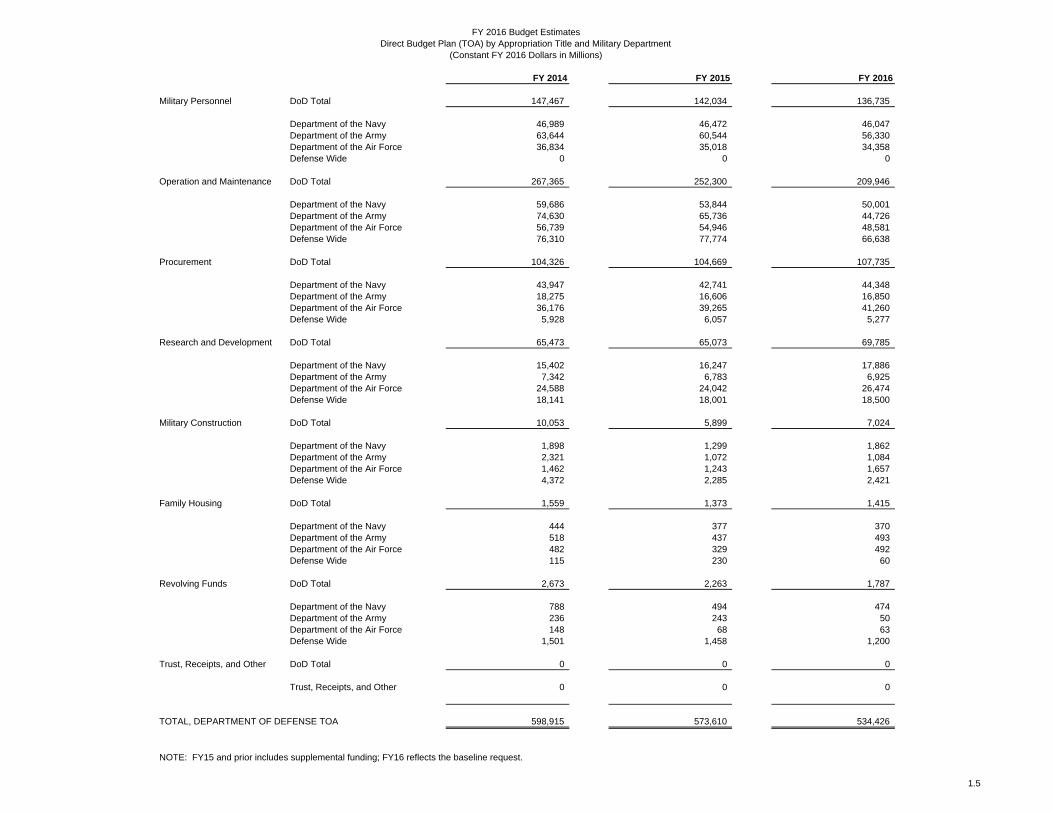
FY 2016 Budget EstimatesDirect Budget Plan (TOA) by Military Department and Appropriation Title
(Constant FY 2016 Dollars in Millions)
NOTE: FY15 and prior includes supplemental funding; FY16 reflects the baseline request.
1.4
FY 2014 FY 2015 FY 2016
Military Personnel DoD Total 147,467 142,034 136,735
Department of the Navy 46,989 46,472 46,047Department of the Army 63,644 60,544 56,330Department of the Air Force 36,834 35,018 34,358Defense Wide 0 0 0
Operation and Maintenance DoD Total 267,365 252,300 209,946
Department of the Navy 59,686 53,844 50,001Department of the Army 74,630 65,736 44,726Department of the Air Force 56,739 54,946 48,581Defense Wide 76,310 77,774 66,638
Procurement DoD Total 104,326 104,669 107,735
Department of the Navy 43,947 42,741 44,348Department of the Army 18,275 16,606 16,850Department of the Air Force 36,176 39,265 41,260Defense Wide 5,928 6,057 5,277
Research and Development DoD Total 65,473 65,073 69,785
Department of the Navy 15,402 16,247 17,886Department of the Army 7,342 6,783 6,925Department of the Air Force 24,588 24,042 26,474Defense Wide 18,141 18,001 18,500
Military Construction DoD Total 10,053 5,899 7,024
Department of the Navy 1,898 1,299 1,862Department of the Army 2,321 1,072 1,084Department of the Air Force 1,462 1,243 1,657Defense Wide 4,372 2,285 2,421
Family Housing DoD Total 1,559 1,373 1,415
Department of the Navy 444 377 370Department of the Army 518 437 493Department of the Air Force 482 329 492Defense Wide 115 230 60
Revolving Funds DoD Total 2,673 2,263 1,787
Department of the Navy 788 494 474Department of the Army 236 243 50Department of the Air Force 148 68 63Defense Wide 1,501 1,458 1,200
Trust, Receipts, and Other DoD Total 0 0 0
Trust, Receipts, and Other 0 0 0
TOTAL, DEPARTMENT OF DEFENSE TOA 598,915 573,610 534,426
FY 2016 Budget EstimatesDirect Budget Plan (TOA) by Appropriation Title and Military Department
(Constant FY 2016 Dollars in Millions)
NOTE: FY15 and prior includes supplemental funding; FY16 reflects the baseline request.
1.5

o This section contains FY 2014 through FY 2016 Department of the Navy estimates for TOA, BA and Outlays.
o TOA, BA, and outlays are displayed in terms of trends, appropriation title/appropriation and TOAcomposition and fiscal year comparisons are also provided.
o Information concerning programs subject to authorization is displayed. Most National Defense activities require annual authorization before the Congress may appropriate funds. The largest amount in the requestnot requiring annual authorization is military pay; military end strength, rather than military pay, is authorized
SECTION 2 - DEPARTMENT OF THE NAVY (DON) SUMMARY DATA
2.1
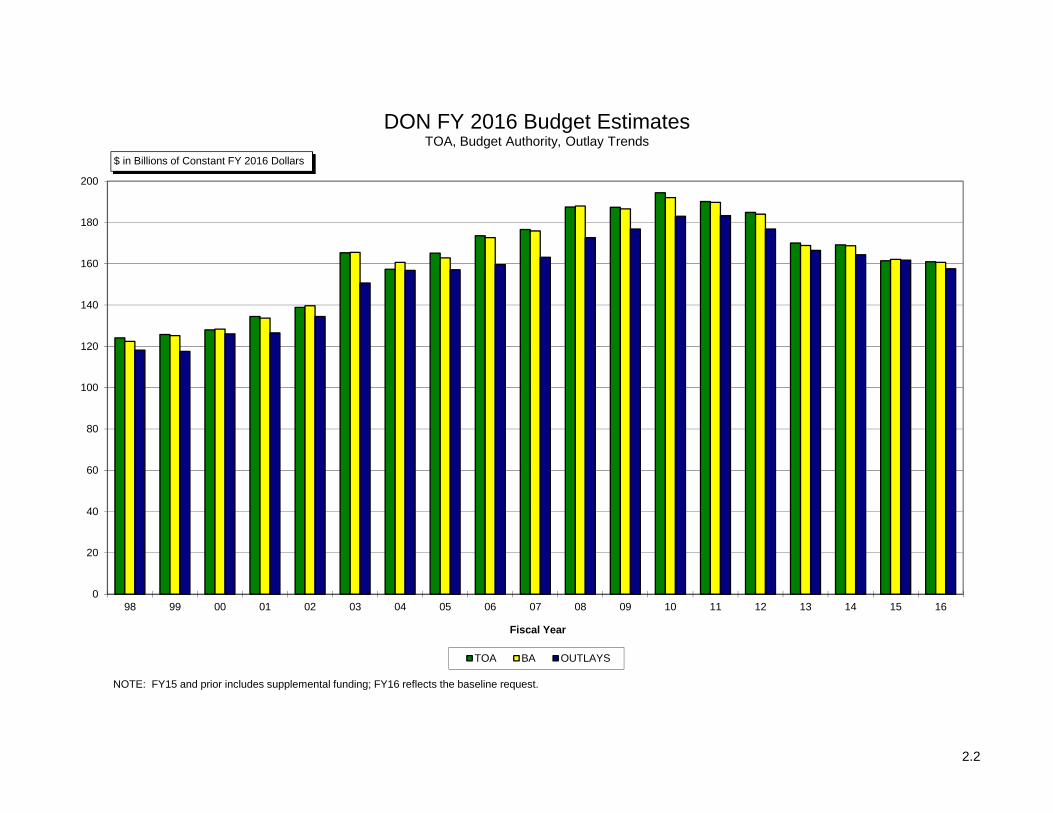
2.2
0
20
40
60
80
100
120
140
160
180
200
98 99 00 01 02 03 04 05 06 07 08 09 10 11 12 13 14 15 16
Fiscal Year
TOA BA OUTLAYS
DON FY 2016 Budget EstimatesTOA, Budget Authority, Outlay Trends
$ in Billions of Constant FY 2016 Dollars
NOTE: FY15 and prior includes supplemental funding; FY16 reflects the baseline request.
--------------------- -------------------- -------------------- --------------------- ------------------------ --------------------- --------------------- --------------------- ---------------------FY 2014 FY 2015 FY 2016 FY 2014 FY 2015 FY 2016 FY 2014 FY 2015 FY 2016
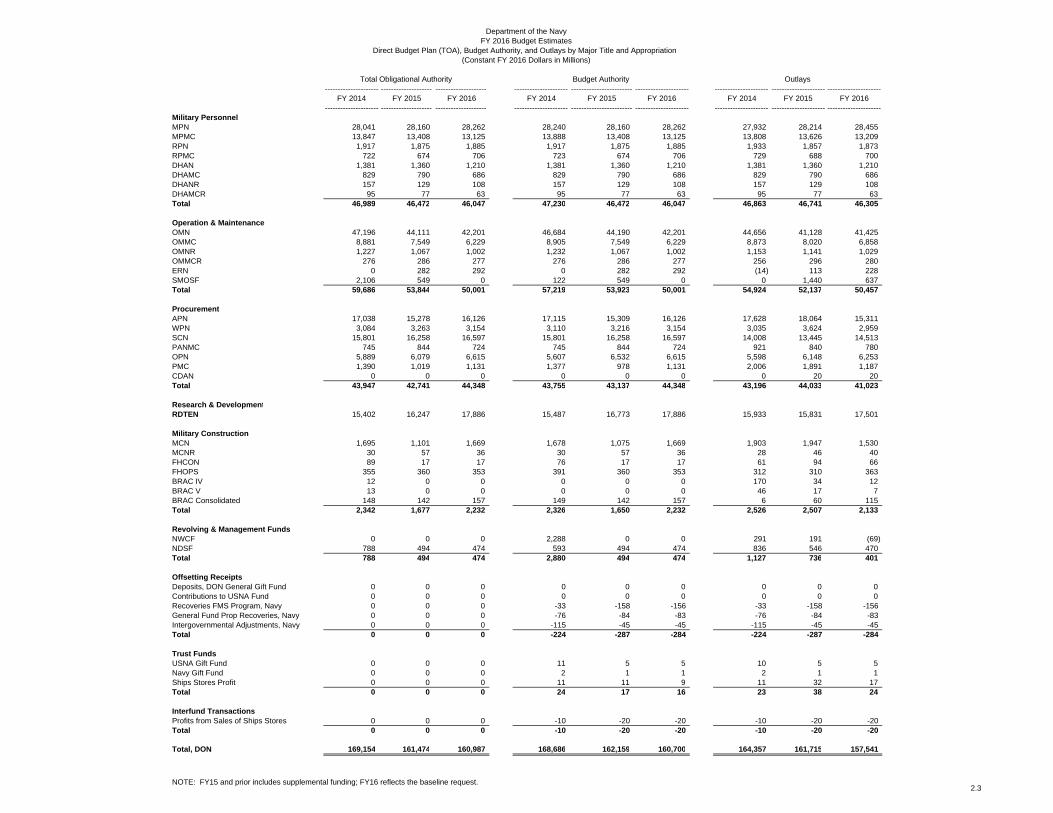
--------------------- -------------------- -------------------- --------------------- ------------------------ --------------------- --------------------- --------------------- ---------------------Military PersonnelMPN 28,041 28,160 28,262 28,240 28,160 28,262 27,932 28,214 28,455MPMC 13,847 13,408 13,125 13,888 13,408 13,125 13,808 13,626 13,209RPN 1,917 1,875 1,885 1,917 1,875 1,885 1,933 1,857 1,873RPMC 722 674 706 723 674 706 729 688 700DHAN 1,381 1,360 1,210 1,381 1,360 1,210 1,381 1,360 1,210DHAMC 829 790 686 829 790 686 829 790 686DHANR 157 129 108 157 129 108 157 129 108DHAMCR 95 77 63 95 77 63 95 77 63Total 46,989 46,472 46,047 47,230 46,472 46,047 46,863 46,741 46,305
Operation & MaintenanceOMN 47,196 44,111 42,201 46,684 44,190 42,201 44,656 41,128 41,425OMMC 8,881 7,549 6,229 8,905 7,549 6,229 8,873 8,020 6,858OMNR 1,227 1,067 1,002 1,232 1,067 1,002 1,153 1,141 1,029OMMCR 276 286 277 276 286 277 256 296 280ERN 0 282 292 0 282 292 (14) 113 228SMOSF 2,106 549 0 122 549 0 0 1,440 637Total 59,686 53,844 50,001 57,219 53,923 50,001 54,924 52,137 50,457
ProcurementAPN 17,038 15,278 16,126 17,115 15,309 16,126 17,628 18,064 15,311WPN 3,084 3,263 3,154 3,110 3,216 3,154 3,035 3,624 2,959SCN 15,801 16,258 16,597 15,801 16,258 16,597 14,008 13,445 14,513PANMC 745 844 724 745 844 724 921 840 780OPN 5,889 6,079 6,615 5,607 6,532 6,615 5,598 6,148 6,253PMC 1,390 1,019 1,131 1,377 978 1,131 2,006 1,891 1,187CDAN 0 0 0 0 0 0 0 20 20Total 43,947 42,741 44,348 43,755 43,137 44,348 43,196 44,033 41,023
Research & DevelopmentRDTEN 15,402 16,247 17,886 15,487 16,773 17,886 15,933 15,831 17,501
Military ConstructionMCN 1,695 1,101 1,669 1,678 1,075 1,669 1,903 1,947 1,530MCNR 30 57 36 30 57 36 28 46 40FHCON 89 17 17 76 17 17 61 94 66FHOPS 355 360 353 391 360 353 312 310 363BRAC IV 12 0 0 0 0 0 170 34 12BRAC V 13 0 0 0 0 0 46 17 7BRAC Consolidated 148 142 157 149 142 157 6 60 115Total 2,342 1,677 2,232 2,326 1,650 2,232 2,526 2,507 2,133
Revolving & Management FundsNWCF 0 0 0 2,288 0 0 291 191 (69)NDSF 788 494 474 593 494 474 836 546 470Total 788 494 474 2,880 494 474 1,127 736 401
Offsetting ReceiptsDeposits, DON General Gift Fund 0 0 0 0 0 0 0 0 0Contributions to USNA Fund 0 0 0 0 0 0 0 0 0Recoveries FMS Program, Navy 0 0 0 -33 -158 -156 -33 -158 -156 General Fund Prop Recoveries, Navy 0 0 0 -76 -84 -83 -76 -84 -83 Intergovernmental Adjustments, Navy 0 0 0 -115 -45 -45 -115 -45 -45 Total 0 0 0 -224 -287 -284 -224 -287 -284
Trust FundsUSNA Gift Fund 0 0 0 11 5 5 10 5 5Navy Gift Fund 0 0 0 2 1 1 2 1 1Ships Stores Profit 0 0 0 11 11 9 11 32 17Total 0 0 0 24 17 16 23 38 24
Interfund TransactionsProfits from Sales of Ships Stores 0 0 0 -10 -20 -20 -10 -20 -20 Total 0 0 0 -10 -20 -20 -10 -20 -20
Total, DON 169,154 161,474 160,987 168,686 162,159 160,700 164,357 161,715 157,541
NOTE: FY15 and prior includes supplemental funding; FY16 reflects the baseline request.
OutlaysBudget AuthorityTotal Obligational Authority
Department of the NavyFY 2016 Budget Estimates
Direct Budget Plan (TOA), Budget Authority, and Outlays by Major Title and Appropriation(Constant FY 2016 Dollars in Millions)
2.3
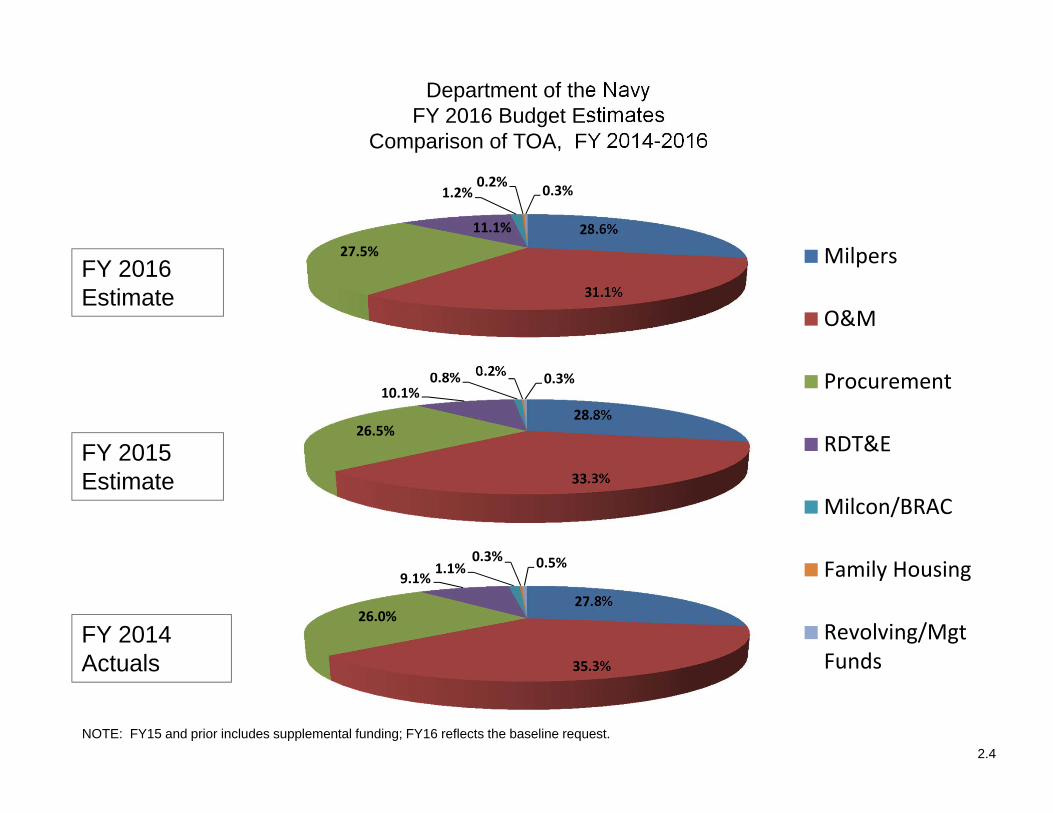
Department of the NavyFY 2016 Budget Estimates
Comparison of TOA, FY 2014-2016
2.4
27.8%
35.3%
26.0%
9.1%1.1%
0.3% 0.5%
28.8%
33.3%
26.5%
10.1%0.8% 0.2% 0.3%
28.6%
31.1%
27.5%11.1%
1.2%0.2% 0.3%
FY 2016 Estimate
FY 2015 Estimate
FY 2014 Actuals
Milpers
O&M
Procurement
RDT&E
Milcon/BRAC
Family Housing
Revolving/MgtFunds
NOTE: FY15 and prior includes supplemental funding; FY16 reflects the baseline request.
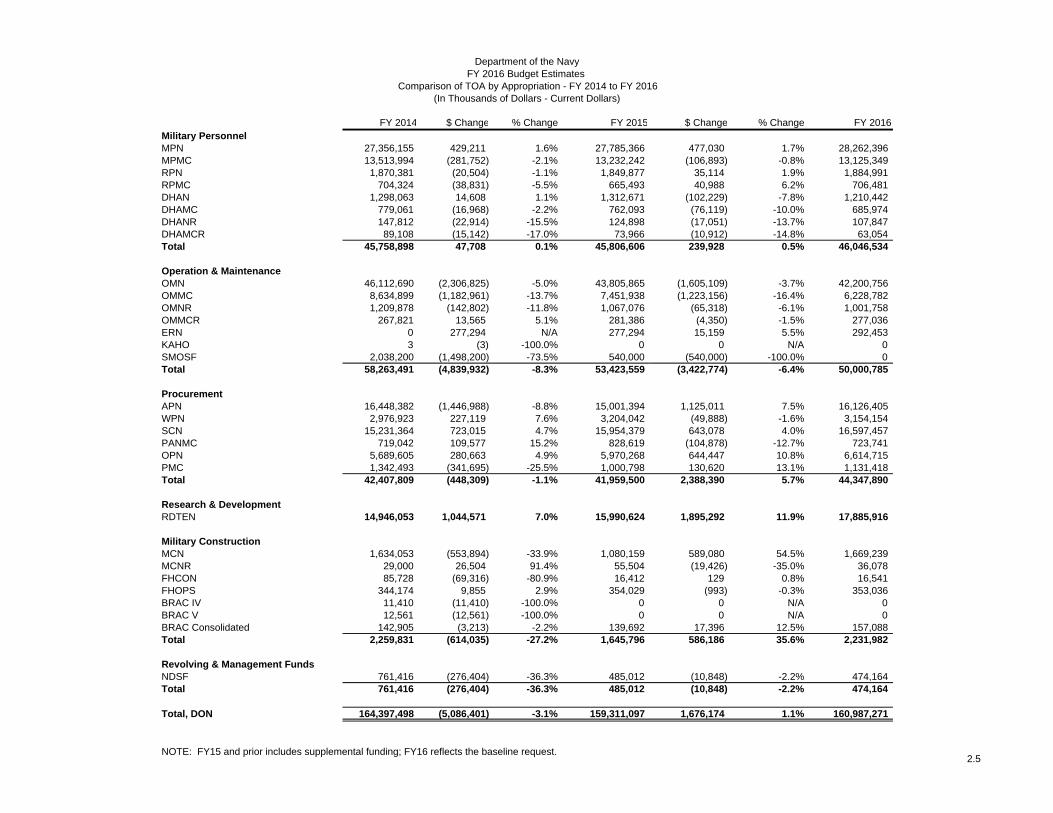
FY 2014 $ Change % Change FY 2015 $ Change % Change FY 2016Military PersonnelMPN 27,356,155 429,211 1.6% 27,785,366 477,030 1.7% 28,262,396 MPMC 13,513,994 (281,752) -2.1% 13,232,242 (106,893) -0.8% 13,125,349 RPN 1,870,381 (20,504) -1.1% 1,849,877 35,114 1.9% 1,884,991 RPMC 704,324 (38,831) -5.5% 665,493 40,988 6.2% 706,481 DHAN 1,298,063 14,608 1.1% 1,312,671 (102,229) -7.8% 1,210,442 DHAMC 779,061 (16,968) -2.2% 762,093 (76,119) -10.0% 685,974 DHANR 147,812 (22,914) -15.5% 124,898 (17,051) -13.7% 107,847 DHAMCR 89,108 (15,142) -17.0% 73,966 (10,912) -14.8% 63,054 Total 45,758,898 47,708 0.1% 45,806,606 239,928 0.5% 46,046,534
Operation & MaintenanceOMN 46,112,690 (2,306,825) -5.0% 43,805,865 (1,605,109) -3.7% 42,200,756 OMMC 8,634,899 (1,182,961) -13.7% 7,451,938 (1,223,156) -16.4% 6,228,782 OMNR 1,209,878 (142,802) -11.8% 1,067,076 (65,318) -6.1% 1,001,758 OMMCR 267,821 13,565 5.1% 281,386 (4,350) -1.5% 277,036 ERN 0 277,294 N/A 277,294 15,159 5.5% 292,453 KAHO 3 (3) -100.0% 0 0 N/A 0SMOSF 2,038,200 (1,498,200) -73.5% 540,000 (540,000) -100.0% 0Total 58,263,491 (4,839,932) -8.3% 53,423,559 (3,422,774) -6.4% 50,000,785
ProcurementAPN 16,448,382 (1,446,988) -8.8% 15,001,394 1,125,011 7.5% 16,126,405 WPN 2,976,923 227,119 7.6% 3,204,042 (49,888) -1.6% 3,154,154 SCN 15,231,364 723,015 4.7% 15,954,379 643,078 4.0% 16,597,457 PANMC 719,042 109,577 15.2% 828,619 (104,878) -12.7% 723,741 OPN 5,689,605 280,663 4.9% 5,970,268 644,447 10.8% 6,614,715 PMC 1,342,493 (341,695) -25.5% 1,000,798 130,620 13.1% 1,131,418 Total 42,407,809 (448,309) -1.1% 41,959,500 2,388,390 5.7% 44,347,890
Research & DevelopmentRDTEN 14,946,053 1,044,571 7.0% 15,990,624 1,895,292 11.9% 17,885,916
Military ConstructionMCN 1,634,053 (553,894) -33.9% 1,080,159 589,080 54.5% 1,669,239 MCNR 29,000 26,504 91.4% 55,504 (19,426) -35.0% 36,078 FHCON 85,728 (69,316) -80.9% 16,412 129 0.8% 16,541 FHOPS 344,174 9,855 2.9% 354,029 (993) -0.3% 353,036 BRAC IV 11,410 (11,410) -100.0% 0 0 N/A 0BRAC V 12,561 (12,561) -100.0% 0 0 N/A 0BRAC Consolidated 142,905 (3,213) -2.2% 139,692 17,396 12.5% 157,088 Total 2,259,831 (614,035) -27.2% 1,645,796 586,186 35.6% 2,231,982
Revolving & Management FundsNDSF 761,416 (276,404) -36.3% 485,012 (10,848) -2.2% 474,164Total 761,416 (276,404) -36.3% 485,012 (10,848) -2.2% 474,164
Total, DON 164,397,498 (5,086,401) -3.1% 159,311,097 1,676,174 1.1% 160,987,271
Department of the NavyFY 2016 Budget Estimates
Comparison of TOA by Appropriation - FY 2014 to FY 2016(In Thousands of Dollars - Current Dollars)
NOTE: FY15 and prior includes supplemental funding; FY16 reflects the baseline request.2.5
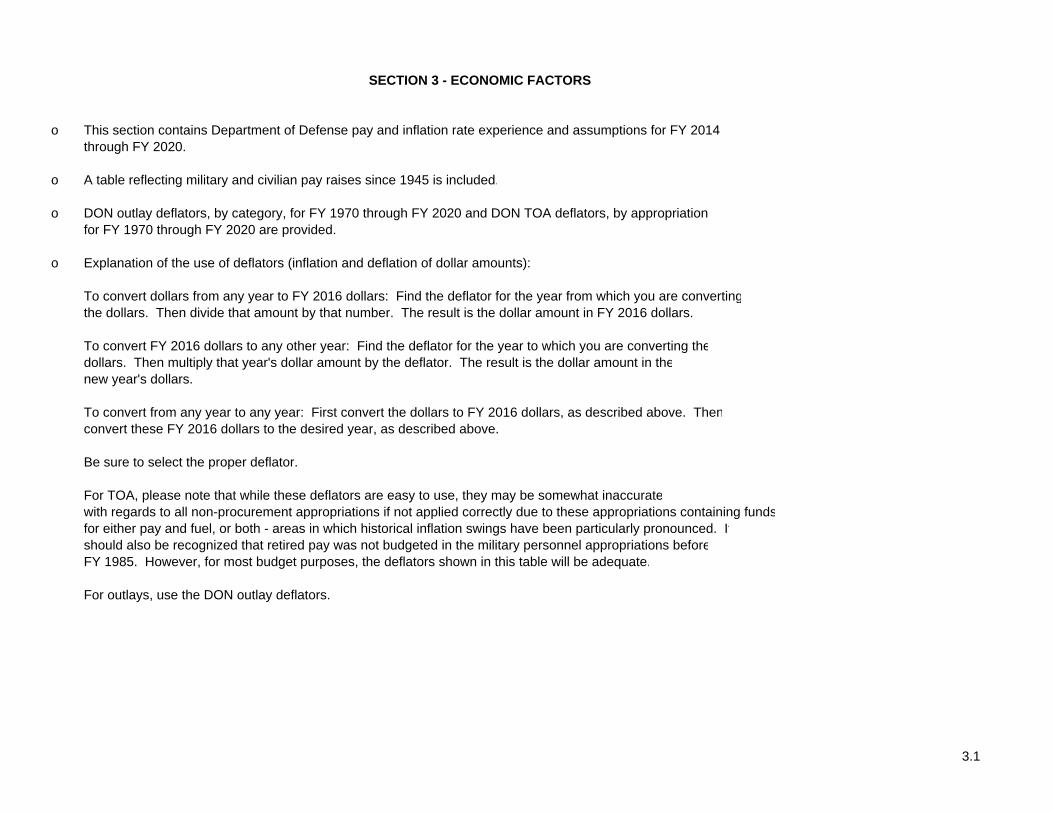
o This section contains Department of Defense pay and inflation rate experience and assumptions for FY 2014through FY 2020.
o A table reflecting military and civilian pay raises since 1945 is included.
o DON outlay deflators, by category, for FY 1970 through FY 2020 and DON TOA deflators, by appropriation,for FY 1970 through FY 2020 are provided.
o Explanation of the use of deflators (inflation and deflation of dollar amounts):
To convert dollars from any year to FY 2016 dollars: Find the deflator for the year from which you are convertingthe dollars. Then divide that amount by that number. The result is the dollar amount in FY 2016 dollars.
To convert FY 2016 dollars to any other year: Find the deflator for the year to which you are converting thedollars. Then multiply that year's dollar amount by the deflator. The result is the dollar amount in thenew year's dollars.
To convert from any year to any year: First convert the dollars to FY 2016 dollars, as described above. Thenconvert these FY 2016 dollars to the desired year, as described above.
Be sure to select the proper deflator.
For TOA, please note that while these deflators are easy to use, they may be somewhat inaccuratewith regards to all non-procurement appropriations if not applied correctly due to these appropriations containing fundsfor either pay and fuel, or both - areas in which historical inflation swings have been particularly pronounced. Itshould also be recognized that retired pay was not budgeted in the military personnel appropriations beforeFY 1985. However, for most budget purposes, the deflators shown in this table will be adequate.
For outlays, use the DON outlay deflators.
SECTION 3 - ECONOMIC FACTORS
3.1
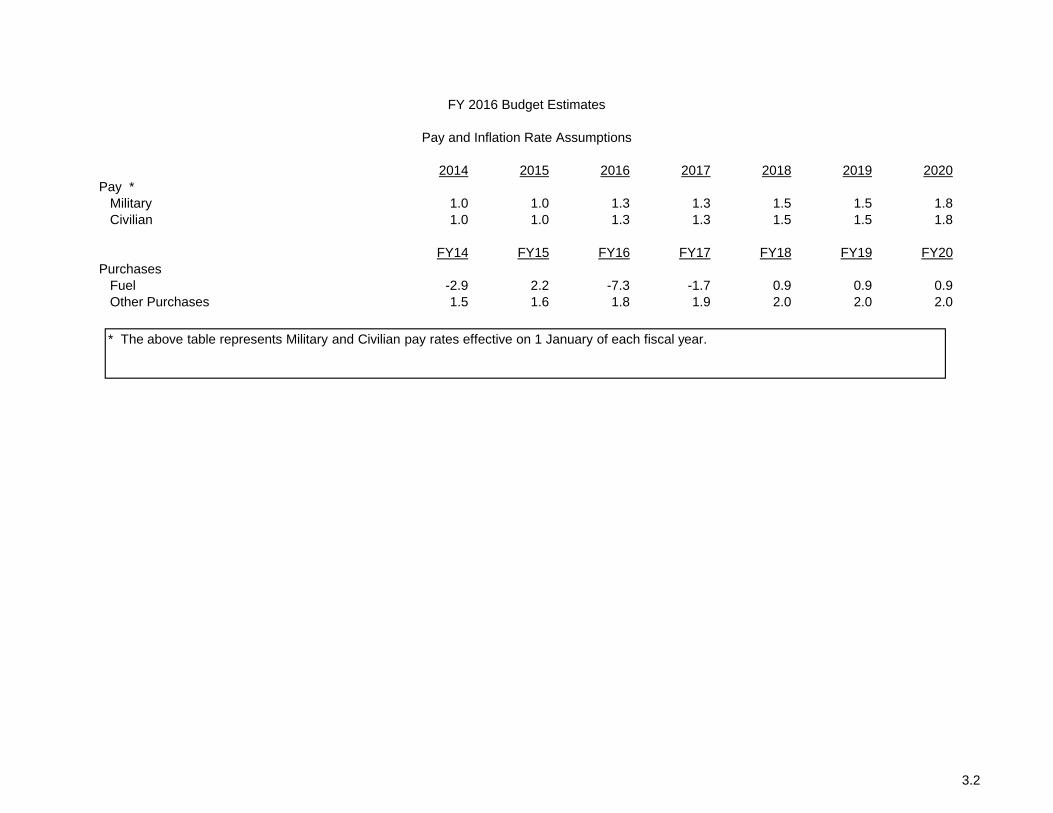
FY 2016 Budget Estimates
Pay and Inflation Rate Assumptions
2014 2015 2016 2017 2018 2019 2020Pay *
Military 1.0 1.0 1.3 1.3 1.5 1.5 1.8Civilian 1.0 1.0 1.3 1.3 1.5 1.5 1.8
FY14 FY15 FY16 FY17 FY18 FY19 FY20Purchases
Fuel -2.9 2.2 -7.3 -1.7 0.9 0.9 0.9Other Purchases 1.5 1.6 1.8 1.9 2.0 2.0 2.0
* The above table represents Military and Civilian pay rates effective on 1 January of each fiscal year.
3.2

General GeneralEffective Military Schedule Effective Military Schedule
Date Pay Salaries Date Salaries Salaries
Jul 1, 1945 - 15.9 Oct 1, 1981 14.3 4.8Jul 1, 1946 23.7 14.2 Oct 1, 1982 4.0 4.0Jul 1, 1948 - 11.0 Oct 1, 1984 4.0 4.0Oct 1, 1949 21.6 - Jan 1, 1985 4.0 3.5Oct 28, 1949 - 4.1 Oct 1, 1985 3.0 -Jul 1, 1951 - 10.0 Jan 1, 1987 3.0 3.0May 1, 1952 10.9 - Jan 1, 1988 2.0 2.0Mar 1, 1955 - 7.5 Jan 1, 1989 4.1 4.1Apr 1, 1955 2.8 - Jan 1, 1990 3.6 3.6Jan 1, 1958 - 10.0 Jan 1, 1991 4.1 4.1Jun 1, 1958 6.3 - Jan 1, 1992 4.2 4.2Jul 1, 1960 - 7.7 Jan 1, 1993 3.7 3.7Oct 14, 1962 - 5.5 Jan 1, 1994 2.2 3.6Oct 1, 1963 8.4 - Jan 1, 1995 2.6 2.6Jan 5, 1964 - 4.1 Jan 1, 1996 2.4 2.4Jul 1, 1964 - 4.2 Jan 1, 1997 3.0 3.0Sep 1, 1964 1.4 - Jan 1, 1998 2.8 2.8Sep 1, 1965 6.4 - Jan 1, 1999 3.6 3.6Oct 1, 1965 - 3.6 Jan 1, 2000 4.8 4.8Jul 1, 1966 2.8 2.9 Jan 1, 2001 3.7 3.7Oct 1, 1967 4.5 4.5 Jan 1, 2002 6.9 1/ 4.6Jul 1, 1968 4.9 4.9 Jan 1, 2003 4.7 2/ 4.1Jul 1, 1969 9.1 9.1 Jan 1, 2004 4.15 3/ 4.1Jan 1, 1970 6.0 6.0 Jan 1, 2005 3.5 3.5Jan 1, 1971 6.0 6.0 Jan 1, 2006 3.1 3.1Nov 14, 1971 13.1 - Jan 1, 2007 2.2 4/ 2.2Jan 1, 1972 5.5 5.5 Jan 1, 2008 3.5 3.5Jan 1, 1973 5.1 5.1 Jan 1, 2009 3.9 3.9Oct 1, 1973 4.8 4.8 Jan 1, 2010 3.4 2.0Oct 1, 1974 5.5 5.5 Jan 1, 2011 1.4 -Oct 1, 1975 5.0 5.0 Jan 1, 2012 1.6 -Oct 1, 1976 4.8 4.8 Jan 1, 2013 1.7 -Oct 1, 1977 7.0 7.0 Jan 1, 2014 1.0 1.0Oct 1, 1978 5.5 5.5 Jan 1, 2015 1.0 1.0Oct 1, 1979 7.0 7.0 Jan 1, 2016 1.3 1.3Oct 1, 1980 11.7 9.1
4/ Excludes selected targeted increase for certain warrant officers and mid-grade/senior enlisted personnel implemented
Department of the NavyFY 2016 Budget Estimates
Military and Civilian Pay Increases Since 1945
1/ Reflects an average 6.9% across-the-board and targeted pay raise2/ Reflects an average 4.7% across-the-board and targeted pay raise3/ Reflects targeted pay raise with an average 4.15% across-the-board impact
3.3
OTHER TOTALCIV MIL RET MEDICAL MIL FH & NON
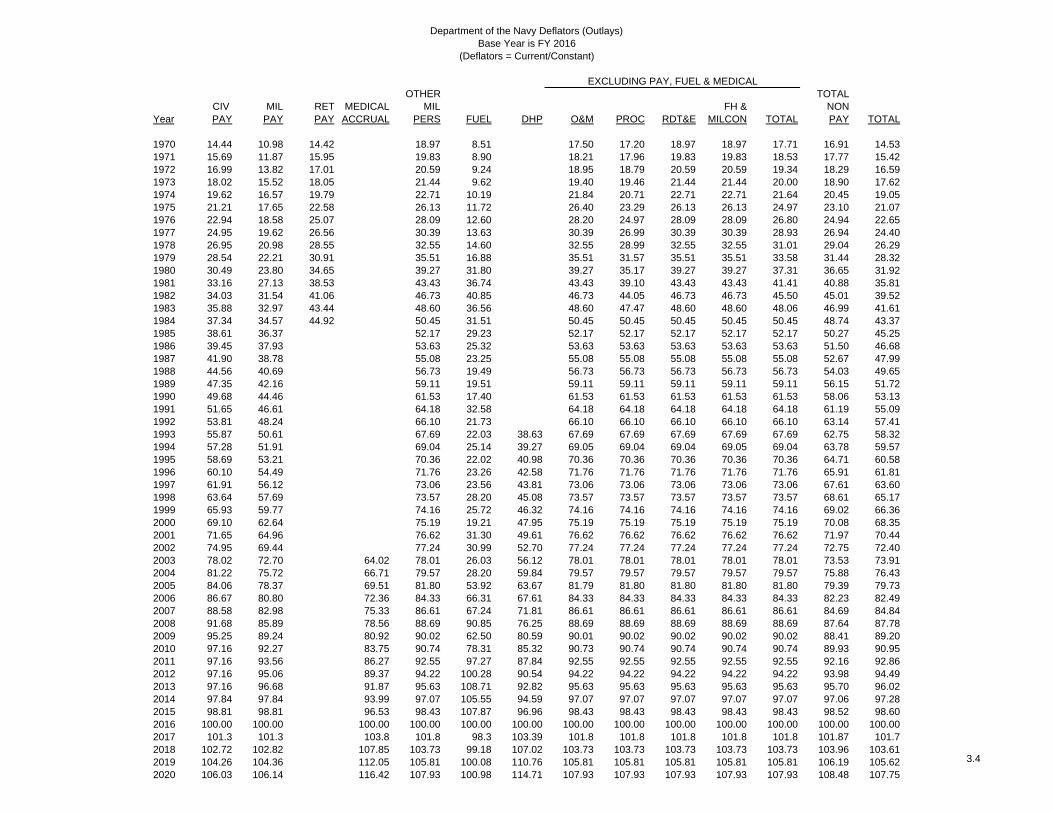
Year PAY PAY PAY ACCRUAL PERS FUEL DHP O&M PROC RDT&E MILCON TOTAL PAY TOTAL
1970 14.44 10.98 14.42 18.97 8.51 17.50 17.20 18.97 18.97 17.71 16.91 14.531971 15.69 11.87 15.95 19.83 8.90 18.21 17.96 19.83 19.83 18.53 17.77 15.421972 16.99 13.82 17.01 20.59 9.24 18.95 18.79 20.59 20.59 19.34 18.29 16.591973 18.02 15.52 18.05 21.44 9.62 19.40 19.46 21.44 21.44 20.00 18.90 17.621974 19.62 16.57 19.79 22.71 10.19 21.84 20.71 22.71 22.71 21.64 20.45 19.051975 21.21 17.65 22.58 26.13 11.72 26.40 23.29 26.13 26.13 24.97 23.10 21.071976 22.94 18.58 25.07 28.09 12.60 28.20 24.97 28.09 28.09 26.80 24.94 22.651977 24.95 19.62 26.56 30.39 13.63 30.39 26.99 30.39 30.39 28.93 26.94 24.401978 26.95 20.98 28.55 32.55 14.60 32.55 28.99 32.55 32.55 31.01 29.04 26.291979 28.54 22.21 30.91 35.51 16.88 35.51 31.57 35.51 35.51 33.58 31.44 28.321980 30.49 23.80 34.65 39.27 31.80 39.27 35.17 39.27 39.27 37.31 36.65 31.921981 33.16 27.13 38.53 43.43 36.74 43.43 39.10 43.43 43.43 41.41 40.88 35.811982 34.03 31.54 41.06 46.73 40.85 46.73 44.05 46.73 46.73 45.50 45.01 39.521983 35.88 32.97 43.44 48.60 36.56 48.60 47.47 48.60 48.60 48.06 46.99 41.611984 37.34 34.57 44.92 50.45 31.51 50.45 50.45 50.45 50.45 50.45 48.74 43.371985 38.61 36.37 52.17 29.23 52.17 52.17 52.17 52.17 52.17 50.27 45.251986 39.45 37.93 53.63 25.32 53.63 53.63 53.63 53.63 53.63 51.50 46.681987 41.90 38.78 55.08 23.25 55.08 55.08 55.08 55.08 55.08 52.67 47.991988 44.56 40.69 56.73 19.49 56.73 56.73 56.73 56.73 56.73 54.03 49.651989 47.35 42.16 59.11 19.51 59.11 59.11 59.11 59.11 59.11 56.15 51.721990 49.68 44.46 61.53 17.40 61.53 61.53 61.53 61.53 61.53 58.06 53.131991 51.65 46.61 64.18 32.58 64.18 64.18 64.18 64.18 64.18 61.19 55.091992 53.81 48.24 66.10 21.73 66.10 66.10 66.10 66.10 66.10 63.14 57.411993 55.87 50.61 67.69 22.03 38.63 67.69 67.69 67.69 67.69 67.69 62.75 58.321994 57.28 51.91 69.04 25.14 39.27 69.05 69.04 69.04 69.05 69.04 63.78 59.571995 58.69 53.21 70.36 22.02 40.98 70.36 70.36 70.36 70.36 70.36 64.71 60.581996 60.10 54.49 71.76 23.26 42.58 71.76 71.76 71.76 71.76 71.76 65.91 61.811997 61.91 56.12 73.06 23.56 43.81 73.06 73.06 73.06 73.06 73.06 67.61 63.601998 63.64 57.69 73.57 28.20 45.08 73.57 73.57 73.57 73.57 73.57 68.61 65.171999 65.93 59.77 74.16 25.72 46.32 74.16 74.16 74.16 74.16 74.16 69.02 66.362000 69.10 62.64 75.19 19.21 47.95 75.19 75.19 75.19 75.19 75.19 70.08 68.352001 71.65 64.96 76.62 31.30 49.61 76.62 76.62 76.62 76.62 76.62 71.97 70.442002 74.95 69.44 77.24 30.99 52.70 77.24 77.24 77.24 77.24 77.24 72.75 72.402003 78.02 72.70 64.02 78.01 26.03 56.12 78.01 78.01 78.01 78.01 78.01 73.53 73.912004 81.22 75.72 66.71 79.57 28.20 59.84 79.57 79.57 79.57 79.57 79.57 75.88 76.432005 84.06 78.37 69.51 81.80 53.92 63.67 81.79 81.80 81.80 81.80 81.80 79.39 79.732006 86.67 80.80 72.36 84.33 66.31 67.61 84.33 84.33 84.33 84.33 84.33 82.23 82.492007 88.58 82.98 75.33 86.61 67.24 71.81 86.61 86.61 86.61 86.61 86.61 84.69 84.842008 91.68 85.89 78.56 88.69 90.85 76.25 88.69 88.69 88.69 88.69 88.69 87.64 87.782009 95.25 89.24 80.92 90.02 62.50 80.59 90.01 90.02 90.02 90.02 90.02 88.41 89.202010 97.16 92.27 83.75 90.74 78.31 85.32 90.73 90.74 90.74 90.74 90.74 89.93 90.952011 97.16 93.56 86.27 92.55 97.27 87.84 92.55 92.55 92.55 92.55 92.55 92.16 92.862012 97.16 95.06 89.37 94.22 100.28 90.54 94.22 94.22 94.22 94.22 94.22 93.98 94.492013 97.16 96.68 91.87 95.63 108.71 92.82 95.63 95.63 95.63 95.63 95.63 95.70 96.022014 97.84 97.84 93.99 97.07 105.55 94.59 97.07 97.07 97.07 97.07 97.07 97.06 97.282015 98.81 98.81 96.53 98.43 107.87 96.96 98.43 98.43 98.43 98.43 98.43 98.52 98.602016 100.00 100.00 100.00 100.00 100.00 100.00 100.00 100.00 100.00 100.00 100.00 100.00 100.002017 101.3 101.3 103.8 101.8 98.3 103.39 101.8 101.8 101.8 101.8 101.8 101.87 101.72018 102.72 102.82 107.85 103.73 99.18 107.02 103.73 103.73 103.73 103.73 103.73 103.96 103.612019 104.26 104.36 112.05 105.81 100.08 110.76 105.81 105.81 105.81 105.81 105.81 106.19 105.622020 106.03 106.14 116.42 107.93 100.98 114.71 107.93 107.93 107.93 107.93 107.93 108.48 107.75
EXCLUDING PAY, FUEL & MEDICAL
Department of the Navy Deflators (Outlays)Base Year is FY 2016
(Deflators = Current/Constant)
3.4

OTHER TOTALCIV MIL RET MEDICAL MIL FH & NON
Year PAY PAY PAY ACCRUAL PERS FUEL DHP O&M PROC RDT&E MILCON TOTAL PAY TOTAL
1970 14.44 10.98 14.42 19.07 8.51 17.89 18.00 19.49 20.19 18.37 17.46 14.701971 15.69 11.87 15.95 19.91 8.90 18.59 19.08 20.39 21.47 19.34 18.46 15.641972 16.99 13.82 17.01 20.70 9.24 19.55 20.42 21.37 22.68 20.49 19.30 17.041973 18.02 15.52 18.05 21.67 9.62 21.34 22.19 22.77 24.50 22.16 20.89 18.551974 19.62 16.57 19.79 23.30 10.19 24.59 24.44 25.21 26.74 24.66 23.13 20.231975 21.21 17.65 22.58 26.47 11.72 27.72 27.20 27.89 29.90 27.55 25.18 21.921976 22.94 18.58 25.07 28.79 12.60 30.47 30.09 30.89 32.49 30.35 28.13 24.131977 24.95 19.62 26.56 30.74 13.63 31.79 31.11 32.15 33.85 31.56 29.52 25.791978 26.95 20.98 28.55 33.07 14.60 34.47 34.10 34.84 36.14 34.34 32.24 27.981979 28.54 22.21 30.91 36.16 16.88 37.85 37.60 38.23 39.23 37.77 35.20 30.151980 30.49 23.80 34.65 39.99 31.80 41.60 41.38 41.92 42.48 41.49 40.36 33.741981 33.16 27.13 38.53 43.95 36.74 45.04 44.88 45.20 45.64 44.95 44.13 37.811982 34.03 31.54 41.06 46.96 40.85 47.48 47.72 47.57 48.19 47.63 47.03 41.121983 35.88 32.97 43.44 48.81 36.56 49.28 49.98 49.36 50.07 49.67 48.66 43.091984 37.34 34.57 44.92 50.62 31.51 51.00 51.68 51.08 51.77 51.37 49.91 44.641985 38.61 36.37 52.28 29.23 52.56 53.26 52.65 53.43 52.95 51.29 46.321986 39.45 37.93 53.74 25.32 54.06 54.93 54.15 55.11 54.53 52.44 47.391987 41.90 38.78 55.24 23.25 55.70 56.81 55.78 56.90 56.26 53.83 48.751988 44.56 40.69 57.03 19.49 57.75 59.00 57.81 58.96 58.34 55.54 50.541989 47.35 42.16 59.41 19.51 60.13 61.17 60.17 61.10 60.59 57.40 52.331990 49.68 44.46 61.85 17.40 62.54 63.20 62.56 62.94 62.81 59.20 53.751991 51.65 46.61 64.33 32.58 64.69 64.93 64.68 64.76 64.75 62.40 56.601992 53.81 48.24 66.19 21.73 66.33 66.38 66.33 66.30 66.34 63.32 57.471993 55.87 50.61 67.72 22.03 37.99 67.76 67.69 67.74 67.66 67.72 62.03 57.821994 57.28 51.91 69.06 25.14 39.27 69.07 68.92 69.03 68.86 68.99 63.04 58.921995 58.69 53.21 70.38 22.02 40.79 70.37 70.04 70.34 70.10 70.24 64.14 60.191996 60.10 54.49 71.74 23.26 42.33 71.60 71.02 71.56 71.16 71.38 65.56 61.651997 61.91 56.12 72.87 23.56 43.54 72.48 71.83 72.42 71.96 72.25 66.68 63.051998 63.64 57.69 73.41 28.20 44.92 73.09 72.63 73.04 72.73 72.95 68.11 64.921999 65.93 59.77 74.10 25.72 46.31 73.93 73.64 73.91 73.70 73.84 69.06 66.492000 69.10 62.64 75.19 19.21 47.95 75.09 74.74 75.09 74.77 74.98 69.88 68.252001 71.65 64.96 76.46 31.30 50.17 76.18 75.84 76.11 75.94 76.08 72.01 70.582002 74.95 69.44 77.12 30.99 53.11 76.99 77.09 76.96 77.17 77.03 72.74 72.422003 78.02 72.70 64.02 78.05 26.03 56.85 78.25 78.73 78.28 78.80 78.37 74.50 74.592004 81.22 75.72 66.71 79.75 28.20 60.49 80.21 80.75 80.22 80.80 80.33 76.71 77.012005 84.06 78.37 69.51 82.03 53.92 64.43 82.55 82.90 82.53 82.89 82.60 80.30 80.382006 86.67 80.80 72.36 84.49 66.31 68.36 84.81 84.89 84.79 84.81 84.79 82.83 82.922007 88.58 82.98 75.33 86.71 67.24 72.45 86.82 86.60 86.80 86.42 86.72 85.06 85.102008 91.68 85.89 78.56 88.61 90.85 76.98 88.37 87.95 88.36 87.78 88.21 87.39 87.572009 95.25 89.24 80.92 89.83 62.50 81.12 89.47 89.20 89.45 89.13 89.41 87.99 88.832010 97.16 92.27 83.75 90.77 78.31 84.99 90.80 90.63 90.77 90.48 90.73 89.93 90.912011 97.16 93.56 86.27 92.54 97.27 87.60 92.46 92.18 92.44 92.00 92.37 91.98 92.712012 97.16 95.06 89.37 94.15 100.28 90.04 93.96 93.63 93.95 93.42 93.87 93.63 94.222013 97.16 96.68 91.87 95.56 108.71 92.24 95.37 95.07 95.36 94.95 95.29 95.35 95.782014 97.84 97.84 93.99 96.98 105.55 94.18 96.79 96.57 96.79 96.49 96.74 96.73 97.042015 98.81 98.81 96.53 98.38 107.87 96.83 98.30 98.20 98.29 98.17 98.28 98.36 98.492016 100.00 100.00 100.00 100.00 100.00 100.00 100.00 100.00 100.00 100.00 100.00 100.00 100.002017 101.30 101.30 103.80 101.82 98.30 103.42 101.87 101.93 101.87 101.95 101.89 101.95 101.752018 102.72 102.82 107.85 103.78 99.18 107.05 103.86 103.94 103.87 103.97 103.88 104.09 103.702019 104.26 104.36 112.05 105.85 100.08 110.83 105.94 106.02 105.94 106.05 105.96 106.33 105.732020 106.03 106.14 116.42 107.97 100.98 114.79 108.06 108.14 108.06 108.17 108.08 108.62 107.86
EXCLUDING PAY, FUEL & MEDICAL
Department of the Navy Deflators (TOA)Base Year is FY 2016
(Deflators = Current/Constant)
3.5
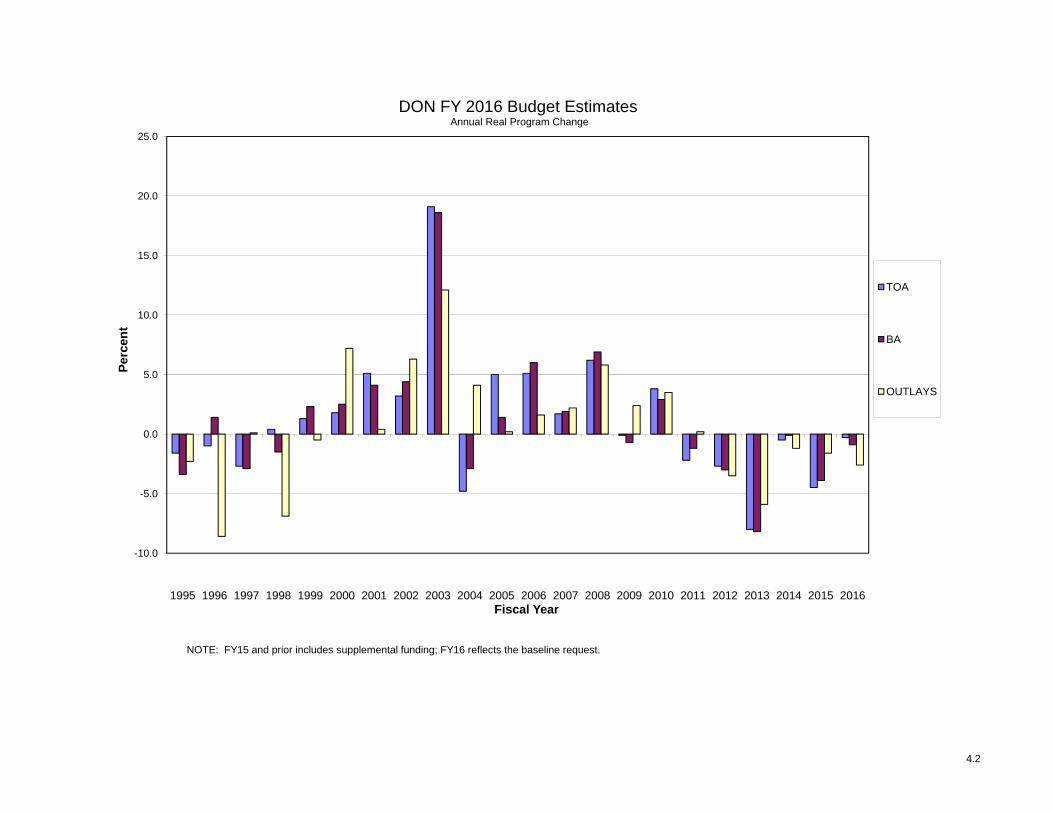
o This section displays DON annual real program changes graphically for FY 1995 through FY 2016 in terms ofTOA, BA, and Outlays.
o Current and constant dollar (TOA) information for the DON is provided.
o Constant FY 2016 dollar amounts for the FY 2016 Budget Estimates are displayed by appropriation.
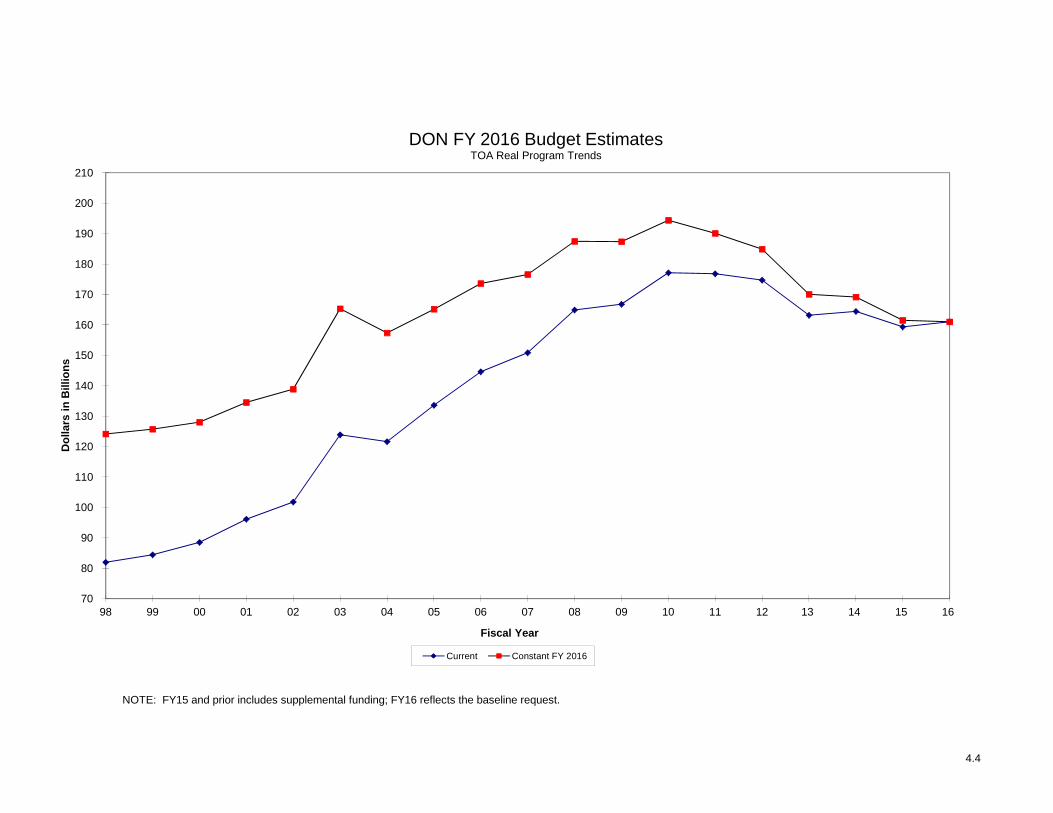
o TOA real program trends in constant and current dollars are displayed for FY 1998 through FY 2016.
o Current and constant dollar (TOA) information is displayed by appropriation title.
o Direct budget plan (TOA) current dollars for FY 1998 through FY 2016 and constant dollars for FY 1998 through FY 2016 is provided by appropriation. Total Navy and Marine Corps funding, and their percentage shares of the budget are provided for current dollars. Total Navy and Marine Corps funding, including DON, Navy, and Marine Corps real program change are provided for constant dollars.
SECTION 4 - CURRENT & CONSTANT DOLLARS
4.1
NOTE: FY15 and prior includes supplemental funding; FY16 reflects the baseline request.
-10.0
-5.0
0.0
5.0
10.0
15.0
20.0
25.0
1995 1996 1997 1998 1999 2000 2001 2002 2003 2004 2005 2006 2007 2008 2009 2010 2011 2012 2013 2014 2015 2016
Per
cen
t
Fiscal Year
DON FY 2016 Budget EstimatesAnnual Real Program Change
TOA
BA
OUTLAYS
4.2
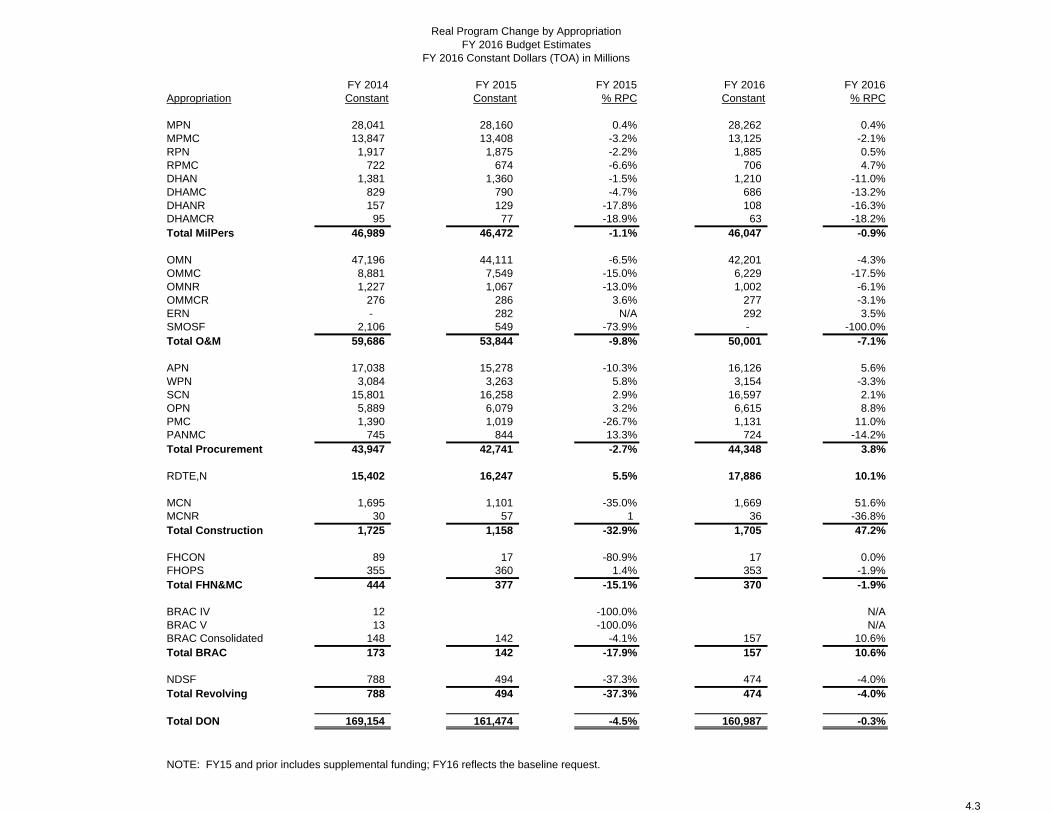
FY 2014 FY 2015 FY 2015 FY 2016 FY 2016Appropriation Constant Constant % RPC Constant % RPC
MPN 28,041 28,160 0.4% 28,262 0.4%MPMC 13,847 13,408 -3.2% 13,125 -2.1%RPN 1,917 1,875 -2.2% 1,885 0.5%RPMC 722 674 -6.6% 706 4.7%DHAN 1,381 1,360 -1.5% 1,210 -11.0%DHAMC 829 790 -4.7% 686 -13.2%DHANR 157 129 -17.8% 108 -16.3%DHAMCR 95 77 -18.9% 63 -18.2%Total MilPers 46,989 46,472 -1.1% 46,047 -0.9%
OMN 47,196 44,111 -6.5% 42,201 -4.3%OMMC 8,881 7,549 -15.0% 6,229 -17.5%OMNR 1,227 1,067 -13.0% 1,002 -6.1%OMMCR 276 286 3.6% 277 -3.1%ERN - 282 N/A 292 3.5%SMOSF 2,106 549 -73.9% - -100.0%Total O&M 59,686 53,844 -9.8% 50,001 -7.1%
APN 17,038 15,278 -10.3% 16,126 5.6%WPN 3,084 3,263 5.8% 3,154 -3.3%SCN 15,801 16,258 2.9% 16,597 2.1%OPN 5,889 6,079 3.2% 6,615 8.8%PMC 1,390 1,019 -26.7% 1,131 11.0%PANMC 745 844 13.3% 724 -14.2%Total Procurement 43,947 42,741 -2.7% 44,348 3.8%
RDTE,N 15,402 16,247 5.5% 17,886 10.1%
MCN 1,695 1,101 -35.0% 1,669 51.6%MCNR 30 57 1 36 -36.8%Total Construction 1,725 1,158 -32.9% 1,705 47.2%
FHCON 89 17 -80.9% 17 0.0%FHOPS 355 360 1.4% 353 -1.9%Total FHN&MC 444 377 -15.1% 370 -1.9%
BRAC IV 12 -100.0% N/ABRAC V 13 -100.0% N/ABRAC Consolidated 148 142 -4.1% 157 10.6%Total BRAC 173 142 -17.9% 157 10.6%
NDSF 788 494 -37.3% 474 -4.0%Total Revolving 788 494 -37.3% 474 -4.0%
Total DON 169,154 161,474 -4.5% 160,987 -0.3%
Real Program Change by AppropriationFY 2016 Budget Estimates
FY 2016 Constant Dollars (TOA) in Millions
NOTE: FY15 and prior includes supplemental funding; FY16 reflects the baseline request.
4.3
NOTE: FY15 and prior includes supplemental funding; FY16 reflects the baseline request.
70
80
90
100
110
120
130
140
150
160
170
180
190
200
210
98 99 00 01 02 03 04 05 06 07 08 09 10 11 12 13 14 15 16
Do
llars
in
Bill
ion
s
Fiscal Year
DON FY 2016 Budget EstimatesTOA Real Program Trends
Current Constant FY 2016
4.4

Appropriation FY 98 FY 99 FY 00 FY 01 FY 02 FY 03 FY 04 FY 05 FY 06 FY 07 FY 08 FY 09 FY 10 FY 11 FY 12 FY 13 FY 14 FY 15 FY 16
MPN 16,686 16,655 17,188 18,042 20,281 23,820 24,216 25,294 24,119 24,047 24,729 25,848 27,171 27,425 27,487 26,971 27,356 27,785 28,262MPMC 6,026 6,211 6,552 6,893 7,603 9,988 9,956 10,817 10,381 10,801 12,086 13,355 13,751 14,052 14,157 13,740 13,514 13,232 13,125RPN 1,392 1,448 1,454 1,580 1,661 1,861 2,003 2,099 1,794 1,856 1,873 1,907 1,944 1,959 1,948 1,913 1,870 1,850 1,885RPMC 390 398 414 451 467 514 559 602 527 556 597 648 677 670 658 702 704 665 706DHAN 0 0 0 0 0 0 0 0 2,029 2,098 1,935 1,771 1,826 1,841 1,806 1,397 1,298 1,313 1,210DHAMC 0 0 0 0 0 0 0 0 982 1,051 1,116 1,053 1,136 1,142 1,126 876 779 762 686DHANR 0 0 0 0 0 0 0 0 292 287 266 240 234 242 236 169 148 125 108DHAMCR 0 0 0 0 0 0 0 0 137 145 142 134 129 132 135 98 89 74 63OMN * 22,355 23,233 23,433 25,439 28,285 35,555 30,288 33,892 35,445 37,366 39,923 40,504 43,130 46,965 46,980 44,788 46,113 43,806 42,201OMMC * 2,466 2,675 2,775 2,922 2,965 5,525 4,969 6,238 7,061 7,605 9,256 9,871 10,327 10,065 9,740 9,167 8,635 7,452 6,229OMNR * 919 970 972 1,015 1,013 1,239 1,174 1,364 1,484 1,399 1,299 1,371 1,412 1,441 1,374 1,194 1,210 1,067 1,002OMMCR * 116 127 142 147 140 218 189 201 322 269 346 328 310 304 307 279 268 281 277ERN 0 0 0 0 0 0 0 0 0 0 0 0 0 0 0 0 0 277 292APN 6,588 7,549 8,861 8,037 7,993 8,711 9,075 9,011 10,224 11,922 15,742 14,765 19,791 17,242 18,112 16,653 16,448 15,001 16,126WPN 1,054 1,608 1,418 1,422 1,413 2,081 2,054 2,191 2,800 2,897 3,375 3,230 3,378 3,617 3,243 2,819 2,977 3,204 3,154SCN 8,007 6,118 7,125 11,965 9,278 9,108 11,373 10,373 11,370 10,152 13,177 13,022 13,843 15,341 15,138 15,080 15,231 15,954 16,597OPN 3,008 4,047 4,284 3,450 4,173 4,608 4,905 4,862 5,837 6,132 6,885 5,496 5,927 6,156 6,261 5,549 5,690 5,970 6,615PMC 476 857 1,296 1,190 942 1,522 1,542 5,030 5,452 8,052 6,312 4,374 3,793 3,210 2,757 2,042 1,342 1,001 1,131PANMC 376 467 542 543 718 1,421 945 1,024 1,185 1,049 1,640 1,422 1,489 1,444 945 885 719 829 724RDTE,N * 7,888 8,942 9,065 9,596 11,379 13,700 14,773 17,077 18,970 19,724 18,487 19,809 19,948 17,866 17,723 15,553 14,946 15,991 17,886MCN * 678 608 991 910 1,139 1,327 1,268 1,328 1,499 1,565 2,577 3,808 3,544 3,301 2,242 1,609 1,634 1,080 1,669MCNR 47 32 28 63 53 75 45 37 141 43 64 57 126 61 26 47 29 56 36FHCON 392 287 340 410 273 296 178 12 197 132 307 385 151 197 115 118 86 16 17FHOPS 987 908 880 899 892 865 836 706 676 503 380 384 374 372 375 356 344 354 353NDSF 1,071 680 713 497 789 852 996 1,107 1,301 374 1,345 2,003 1,685 1,237 1,472 683 761 485 474KAHO 35 25 34 74 76 86 20 0 0 0 0 0 0 0 0 0 0 0 0BRAC 980 552 0 427 247 474 110 0 252 690 768 977 826 531 346 245 167 140 157NWCF 23 2 0 146 0 40 130 294 118 116 265 2 204 0 0 24 0 0 0SMOSF 0 0 0 0 0 0 0 0 0 0 0 0 0 0 0 179 2,038 540 0
DON 81,958 84,398 88,509 96,117 101,778 123,887 121,608 133,560 144,596 150,834 164,893 166,765 177,126 176,814 174,710 163,140 164,397 159,311 160,987
Navy/Marine Corps Split
USN $ 71,655 73,254 76,220 83,447 88,322 104,515 102,777 108,855 117,895 119,870 131,301 132,441 142,220 143,007 143,182 134,264 137,272 134,431 136,985 % 87.43% 86.80% 86.11% 86.82% 86.78% 84.36% 84.52% 81.50% 81.53% 79.47% 79.63% 79.42% 80.29% 80.88% 81.95% 82.30% 83.50% 84.38% 85.09%
USMC $ 10,303 11,145 12,290 12,669 13,455 19,372 18,831 24,705 26,702 30,964 33,592 34,324 34,906 33,808 31,529 28,875 27,125 24,880 24,002 % 12.57% 13.20% 13.89% 13.18% 13.22% 15.64% 15.48% 18.50% 18.47% 20.53% 20.37% 20.58% 19.71% 19.12% 18.05% 17.70% 16.50% 15.62% 14.91%
* Includes American Recovery and Reinvestment Act of 2009 appropriated amounts in FY 2009.NOTE: FY15 and prior includes supplemental funding; FY16 reflects the baseline request.
FY 2016 Budget Estimates Direct Budget Plan (TOA) History
Current Dollars(In Millions of Dollars)
4.5
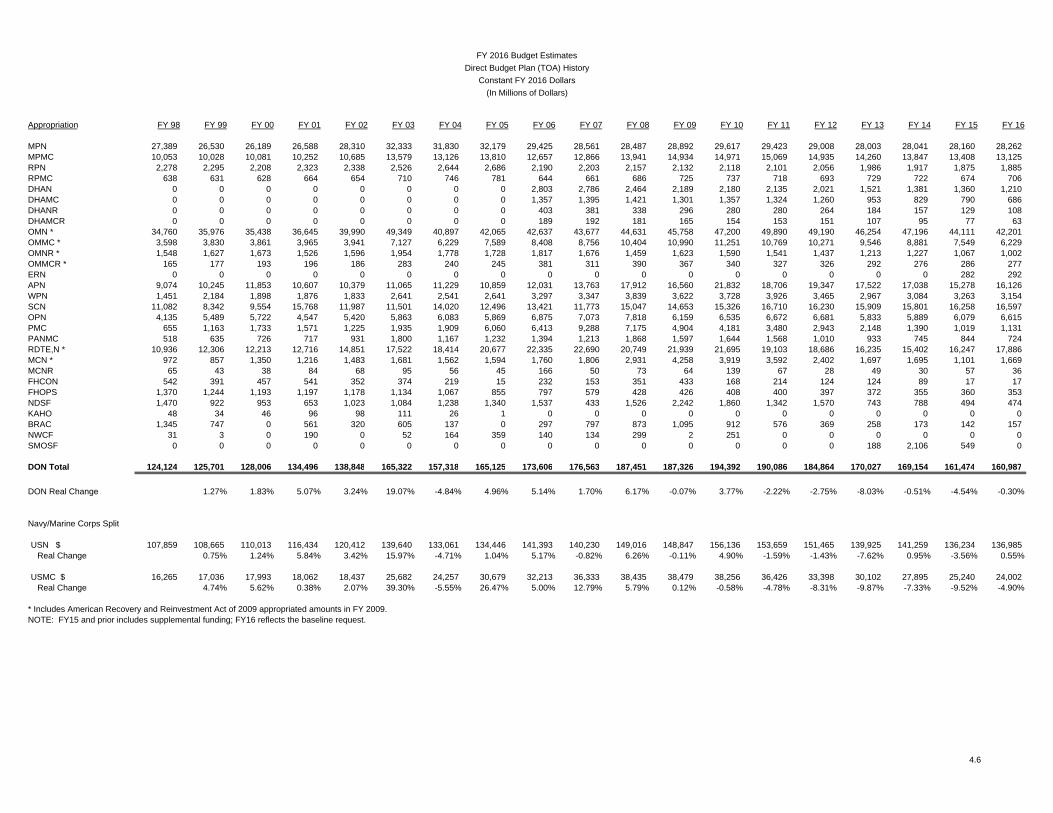
Appropriation FY 98 FY 99 FY 00 FY 01 FY 02 FY 03 FY 04 FY 05 FY 06 FY 07 FY 08 FY 09 FY 10 FY 11 FY 12 FY 13 FY 14 FY 15 FY 16
MPN 27,389 26,530 26,189 26,588 28,310 32,333 31,830 32,179 29,425 28,561 28,487 28,892 29,617 29,423 29,008 28,003 28,041 28,160 28,262MPMC 10,053 10,028 10,081 10,252 10,685 13,579 13,126 13,810 12,657 12,866 13,941 14,934 14,971 15,069 14,935 14,260 13,847 13,408 13,125RPN 2,278 2,295 2,208 2,323 2,338 2,526 2,644 2,686 2,190 2,203 2,157 2,132 2,118 2,101 2,056 1,986 1,917 1,875 1,885RPMC 638 631 628 664 654 710 746 781 644 661 686 725 737 718 693 729 722 674 706DHAN 0 0 0 0 0 0 0 0 2,803 2,786 2,464 2,189 2,180 2,135 2,021 1,521 1,381 1,360 1,210DHAMC 0 0 0 0 0 0 0 0 1,357 1,395 1,421 1,301 1,357 1,324 1,260 953 829 790 686DHANR 0 0 0 0 0 0 0 0 403 381 338 296 280 280 264 184 157 129 108DHAMCR 0 0 0 0 0 0 0 0 189 192 181 165 154 153 151 107 95 77 63OMN * 34,760 35,976 35,438 36,645 39,990 49,349 40,897 42,065 42,637 43,677 44,631 45,758 47,200 49,890 49,190 46,254 47,196 44,111 42,201 OMMC * 3,598 3,830 3,861 3,965 3,941 7,127 6,229 7,589 8,408 8,756 10,404 10,990 11,251 10,769 10,271 9,546 8,881 7,549 6,229 OMNR * 1,548 1,627 1,673 1,526 1,596 1,954 1,778 1,728 1,817 1,676 1,459 1,623 1,590 1,541 1,437 1,213 1,227 1,067 1,002 OMMCR * 165 177 193 196 186 283 240 245 381 311 390 367 340 327 326 292 276 286 277 ERN 0 0 0 0 0 0 0 0 0 0 0 0 0 0 0 0 0 282 292 APN 9,074 10,245 11,853 10,607 10,379 11,065 11,229 10,859 12,031 13,763 17,912 16,560 21,832 18,706 19,347 17,522 17,038 15,278 16,126 WPN 1,451 2,184 1,898 1,876 1,833 2,641 2,541 2,641 3,297 3,347 3,839 3,622 3,728 3,926 3,465 2,967 3,084 3,263 3,154 SCN 11,082 8,342 9,554 15,768 11,987 11,501 14,020 12,496 13,421 11,773 15,047 14,653 15,326 16,710 16,230 15,909 15,801 16,258 16,597 OPN 4,135 5,489 5,722 4,547 5,420 5,863 6,083 5,869 6,875 7,073 7,818 6,159 6,535 6,672 6,681 5,833 5,889 6,079 6,615 PMC 655 1,163 1,733 1,571 1,225 1,935 1,909 6,060 6,413 9,288 7,175 4,904 4,181 3,480 2,943 2,148 1,390 1,019 1,131 PANMC 518 635 726 717 931 1,800 1,167 1,232 1,394 1,213 1,868 1,597 1,644 1,568 1,010 933 745 844 724 RDTE,N * 10,936 12,306 12,213 12,716 14,851 17,522 18,414 20,677 22,335 22,690 20,749 21,939 21,695 19,103 18,686 16,235 15,402 16,247 17,886 MCN * 972 857 1,350 1,216 1,483 1,681 1,562 1,594 1,760 1,806 2,931 4,258 3,919 3,592 2,402 1,697 1,695 1,101 1,669 MCNR 65 43 38 84 68 95 56 45 166 50 73 64 139 67 28 49 30 57 36 FHCON 542 391 457 541 352 374 219 15 232 153 351 433 168 214 124 124 89 17 17 FHOPS 1,370 1,244 1,193 1,197 1,178 1,134 1,067 855 797 579 428 426 408 400 397 372 355 360 353 NDSF 1,470 922 953 653 1,023 1,084 1,238 1,340 1,537 433 1,526 2,242 1,860 1,342 1,570 743 788 494 474KAHO 48 34 46 96 98 111 26 1 0 0 0 0 0 0 0 0 0 0 0BRAC 1,345 747 0 561 320 605 137 0 297 797 873 1,095 912 576 369 258 173 142 157 NWCF 31 3 0 190 0 52 164 359 140 134 299 2 251 0 0 0 0 0 0SMOSF 0 0 0 0 0 0 0 0 0 0 0 0 0 0 0 188 2,106 549 0
DON Total 124,124 125,701 128,006 134,496 138,848 165,322 157,318 165,125 173,606 176,563 187,451 187,326 194,392 190,086 184,864 170,027 169,154 161,474 160,987
DON Real Change 1.27% 1.83% 5.07% 3.24% 19.07% -4.84% 4.96% 5.14% 1.70% 6.17% -0.07% 3.77% -2.22% -2.75% -8.03% -0.51% -4.54% -0.30%
Navy/Marine Corps Split
USN $ 107,859 108,665 110,013 116,434 120,412 139,640 133,061 134,446 141,393 140,230 149,016 148,847 156,136 153,659 151,465 139,925 141,259 136,234 136,985 Real Change 0.75% 1.24% 5.84% 3.42% 15.97% -4.71% 1.04% 5.17% -0.82% 6.26% -0.11% 4.90% -1.59% -1.43% -7.62% 0.95% -3.56% 0.55%
USMC $ 16,265 17,036 17,993 18,062 18,437 25,682 24,257 30,679 32,213 36,333 38,435 38,479 38,256 36,426 33,398 30,102 27,895 25,240 24,002 Real Change 4.74% 5.62% 0.38% 2.07% 39.30% -5.55% 26.47% 5.00% 12.79% 5.79% 0.12% -0.58% -4.78% -8.31% -9.87% -7.33% -9.52% -4.90%
* Includes American Recovery and Reinvestment Act of 2009 appropriated amounts in FY 2009.NOTE: FY15 and prior includes supplemental funding; FY16 reflects the baseline request.
FY 2016 Budget EstimatesDirect Budget Plan (TOA) History
Constant FY 2016 Dollars(In Millions of Dollars)
4.6

SECTION 5 - OBLIGATION & OUTLAY DATA
o This section summarizes obligation and outlay information.
o Obligation information reflects the following:
- Obligation rates used in support of the FY 2016 Budget Estimates. These rates are used for estimating or forecasting obligation amounts by appropriation and fiscal year program for FY 2015 through FY 2020.
- Obligations, unobligated balances and new obligational resources for FY 2014 through FY 2016.
- Historical and estimated direct obligation balances by object class for FY 2000 through FY 2016.
o Outlay information reflects the following:
- Expenditure rates used in support of the FY 2016 Budget Estimates. These rates are used for estimation orforecasting expenditure amounts by appropriation and fiscal year program for FY 2015 through FY 2020.
- Outlays, unexpended balances, and new expendable resources for FY 2014 through FY 2016.
5.1
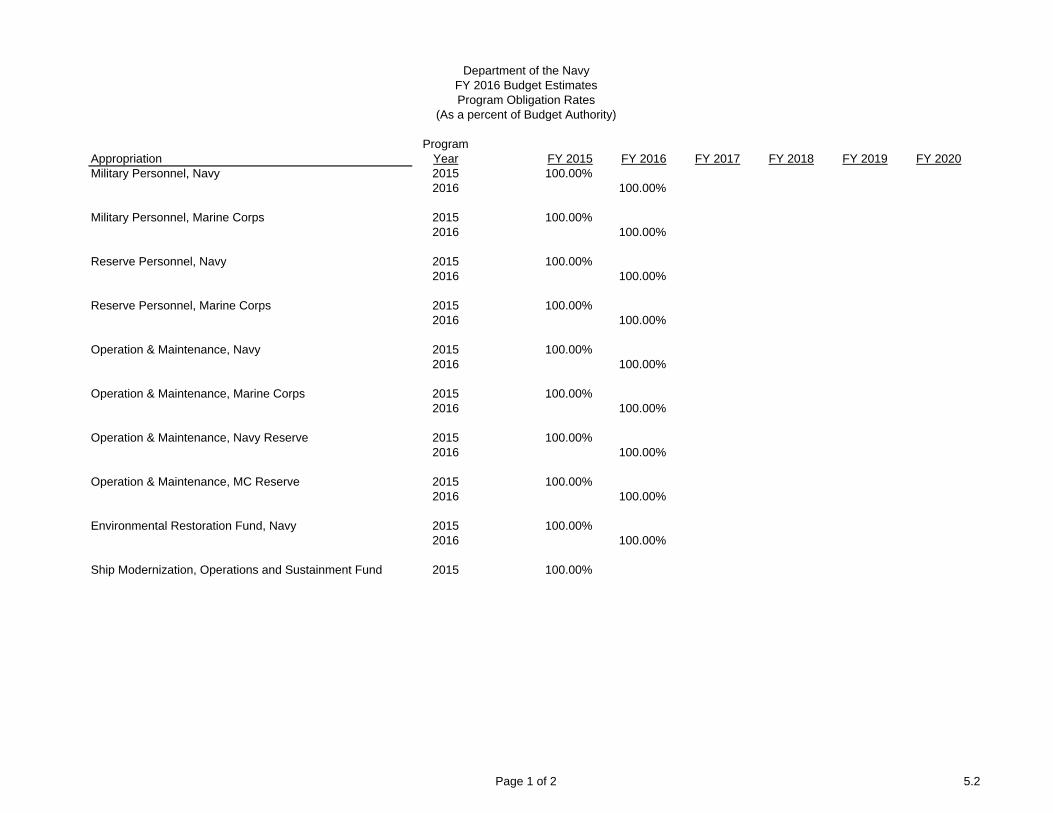
ProgramAppropriation Year FY 2015 FY 2016 FY 2017 FY 2018 FY 2019 FY 2020Military Personnel, Navy 2015 100.00%
2016 100.00%
Military Personnel, Marine Corps 2015 100.00%2016 100.00%
Reserve Personnel, Navy 2015 100.00%2016 100.00%
Reserve Personnel, Marine Corps 2015 100.00%2016 100.00%
Operation & Maintenance, Navy 2015 100.00%2016 100.00%
Operation & Maintenance, Marine Corps 2015 100.00%2016 100.00%
Operation & Maintenance, Navy Reserve 2015 100.00%2016 100.00%
Operation & Maintenance, MC Reserve 2015 100.00%2016 100.00%
Environmental Restoration Fund, Navy 2015 100.00%2016 100.00%
Ship Modernization, Operations and Sustainment Fund 2015 100.00%
Department of the NavyFY 2016 Budget EstimatesProgram Obligation Rates
(As a percent of Budget Authority)
Page 1 of 2 5.2
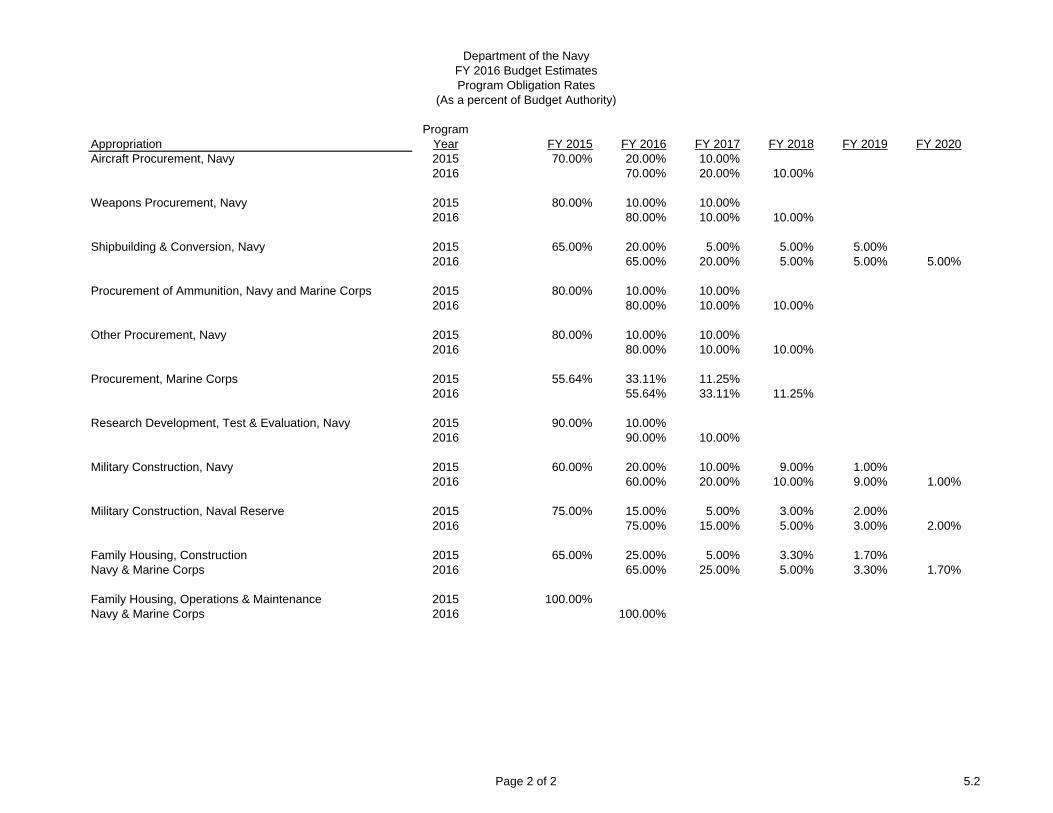
ProgramAppropriation Year FY 2015 FY 2016 FY 2017 FY 2018 FY 2019 FY 2020
Department of the NavyFY 2016 Budget EstimatesProgram Obligation Rates
(As a percent of Budget Authority)
Aircraft Procurement, Navy 2015 70.00% 20.00% 10.00%2016 70.00% 20.00% 10.00%
Weapons Procurement, Navy 2015 80.00% 10.00% 10.00%2016 80.00% 10.00% 10.00%
Shipbuilding & Conversion, Navy 2015 65.00% 20.00% 5.00% 5.00% 5.00%2016 65.00% 20.00% 5.00% 5.00% 5.00%
Procurement of Ammunition, Navy and Marine Corps 2015 80.00% 10.00% 10.00%2016 80.00% 10.00% 10.00%
Other Procurement, Navy 2015 80.00% 10.00% 10.00%2016 80.00% 10.00% 10.00%
Procurement, Marine Corps 2015 55.64% 33.11% 11.25%2016 55.64% 33.11% 11.25%
Research Development, Test & Evaluation, Navy 2015 90.00% 10.00%2016 90.00% 10.00%
Military Construction, Navy 2015 60.00% 20.00% 10.00% 9.00% 1.00%2016 60.00% 20.00% 10.00% 9.00% 1.00%
Military Construction, Naval Reserve 2015 75.00% 15.00% 5.00% 3.00% 2.00%2016 75.00% 15.00% 5.00% 3.00% 2.00%
Family Housing, Construction 2015 65.00% 25.00% 5.00% 3.30% 1.70%Navy & Marine Corps 2016 65.00% 25.00% 5.00% 3.30% 1.70%
Family Housing, Operations & Maintenance 2015 100.00%Navy & Marine Corps 2016 100.00%
Page 2 of 2 5.2
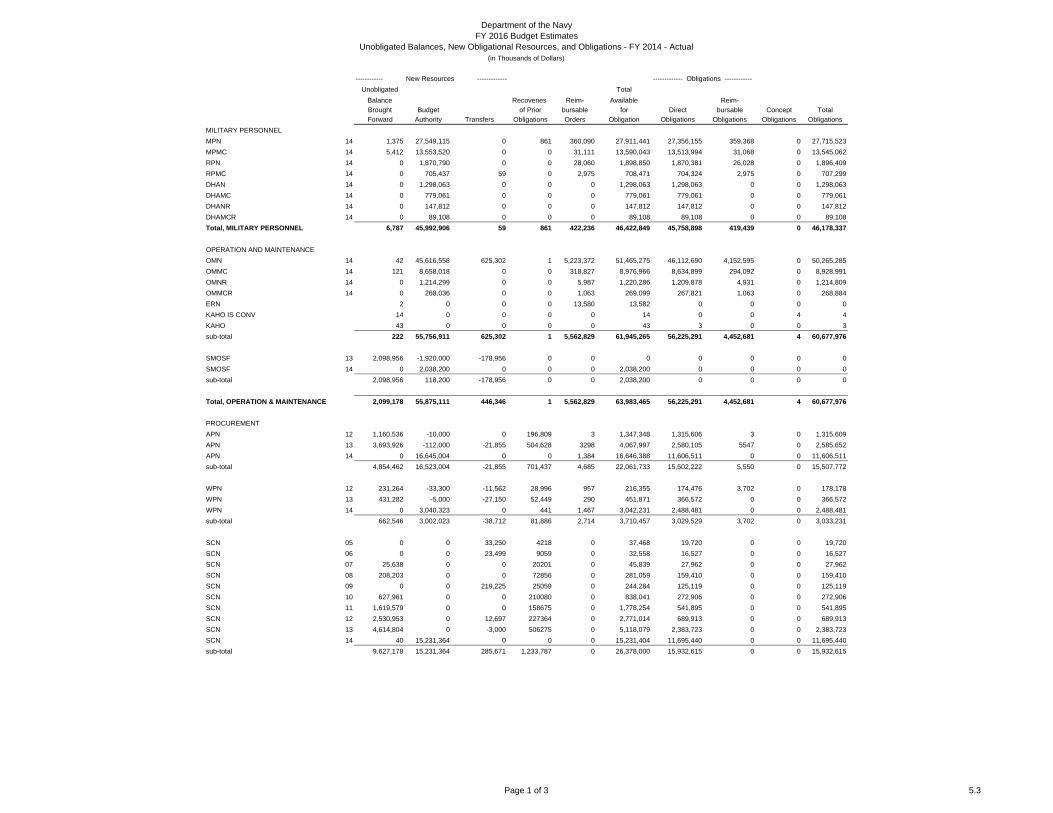
------------ New Resources ------------- ------------- Obligations ------------Unobligated Total
Balance Recoveries Reim- Available Reim-Brought Budget of Prior bursable for Direct bursable Concept TotalForward Authority Transfers Obligations Orders Obligation Obligations Obligations Obligations Obligations
MILITARY PERSONNELMPN 14 1,375 27,549,115 0 861 360,090 27,911,441 27,356,155 359,368 0 27,715,523MPMC 14 5,412 13,553,520 0 0 31,111 13,590,043 13,513,994 31,068 0 13,545,062RPN 14 0 1,870,790 0 0 28,060 1,898,850 1,870,381 26,028 0 1,896,409RPMC 14 0 705,437 59 0 2,975 708,471 704,324 2,975 0 707,299DHAN 14 0 1,298,063 0 0 0 1,298,063 1,298,063 0 0 1,298,063DHAMC 14 0 779,061 0 0 0 779,061 779,061 0 0 779,061DHANR 14 0 147,812 0 0 0 147,812 147,812 0 0 147,812DHAMCR 14 0 89,108 0 0 0 89,108 89,108 0 0 89,108Total, MILITARY PERSONNEL 6,787 45,992,906 59 861 422,236 46,422,849 45,758,898 419,439 0 46,178,337
OPERATION AND MAINTENANCEOMN 14 42 45,616,558 625,302 1 5,223,372 51,465,275 46,112,690 4,152,595 0 50,265,285OMMC 14 121 8,658,018 0 0 318,827 8,976,966 8,634,899 294,092 0 8,928,991OMNR 14 0 1,214,299 0 0 5,987 1,220,286 1,209,878 4,931 0 1,214,809OMMCR 14 0 268,036 0 0 1,063 269,099 267,821 1,063 0 268,884ERN 2 0 0 0 13,580 13,582 0 0 0 0KAHO IS CONV 14 0 0 0 0 14 0 0 4 4KAHO 43 0 0 0 0 43 3 0 0 3sub-total 222 55,756,911 625,302 1 5,562,829 61,945,265 56,225,291 4,452,681 4 60,677,976
SMOSF 13 2,098,956 -1,920,000 -178,956 0 0 0 0 0 0 0SMOSF 14 0 2,038,200 0 0 0 2,038,200 0 0 0 0sub-total 2,098,956 118,200 -178,956 0 0 2,038,200 0 0 0 0
Total, OPERATION & MAINTENANCE 2,099,178 55,875,111 446,346 1 5,562,829 63,983,465 56,225,291 4,452,681 4 60,677,976
PROCUREMENTAPN 12 1,160,536 -10,000 0 196,809 3 1,347,348 1,315,606 3 0 1,315,609APN 13 3,693,926 -112,000 -21,855 504,628 3298 4,067,997 2,580,105 5547 0 2,585,652APN 14 0 16,645,004 0 0 1,384 16,646,388 11,606,511 0 0 11,606,511sub-total 4,854,462 16,523,004 -21,855 701,437 4,685 22,061,733 15,502,222 5,550 0 15,507,772
WPN 12 231,264 -33,300 -11,562 28,996 957 216,355 174,476 3,702 0 178,178WPN 13 431,282 -5,000 -27,150 52,449 290 451,871 366,572 0 0 366,572WPN 14 0 3,040,323 0 441 1,467 3,042,231 2,488,481 0 0 2,488,481sub-total 662,546 3,002,023 -38,712 81,886 2,714 3,710,457 3,029,529 3,702 0 3,033,231
SCN 05 0 0 33,250 4218 0 37,468 19,720 0 0 19,720SCN 06 0 0 23,499 9059 0 32,558 16,527 0 0 16,527SCN 07 25,638 0 0 20201 0 45,839 27,962 0 0 27,962SCN 08 208,203 0 0 72856 0 281,059 159,410 0 0 159,410SCN 09 0 0 219,225 25059 0 244,284 125,119 0 0 125,119SCN 10 627,961 0 0 210080 0 838,041 272,906 0 0 272,906SCN 11 1,619,579 0 0 158675 0 1,778,254 541,895 0 0 541,895SCN 12 2,530,953 0 12,697 227364 0 2,771,014 689,913 0 0 689,913SCN 13 4,614,804 0 -3,000 506275 0 5,118,079 2,383,723 0 0 2,383,723SCN 14 40 15,231,364 0 0 0 15,231,404 11,695,440 0 0 11,695,440sub-total 9,627,178 15,231,364 285,671 1,233,787 0 26,378,000 15,932,615 0 0 15,932,615
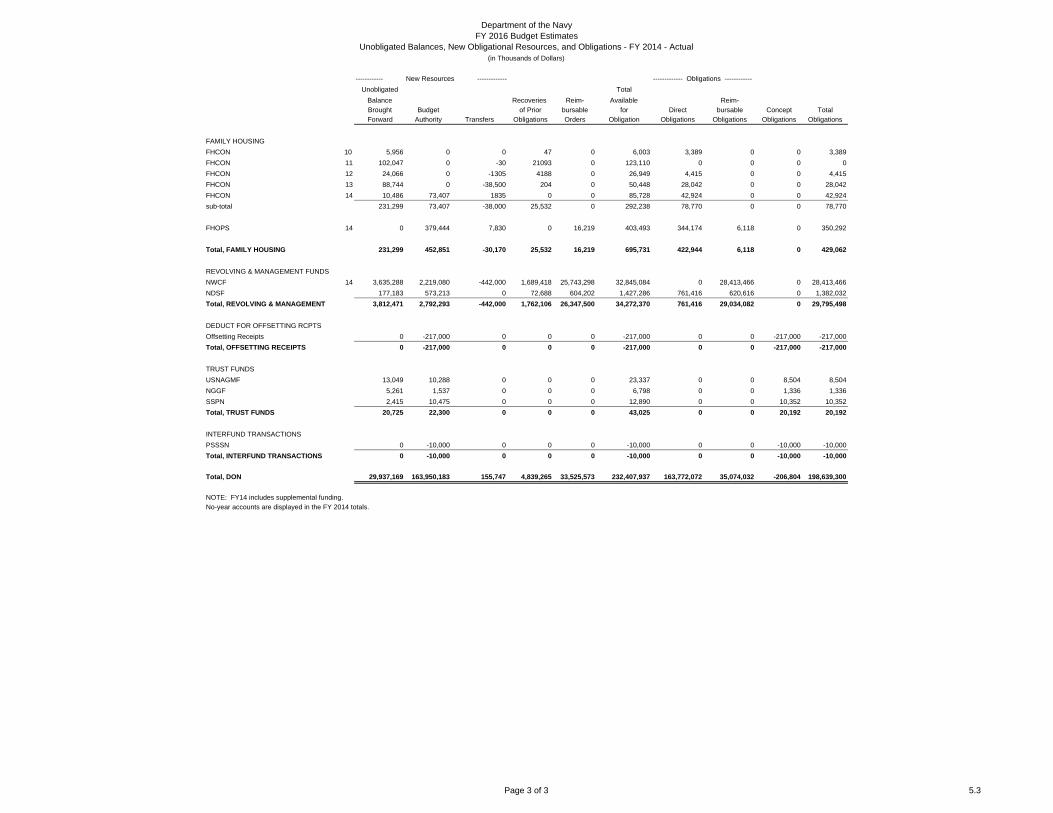
Department of the NavyFY 2016 Budget Estimates
Unobligated Balances, New Obligational Resources, and Obligations - FY 2014 - Actual(in Thousands of Dollars)
Page 1 of 3 5.3

------------ New Resources ------------- ------------- Obligations ------------Unobligated Total
Balance Recoveries Reim- Available Reim-Brought Budget of Prior bursable for Direct bursable Concept TotalForward Authority Transfers Obligations Orders Obligation Obligations Obligations Obligations Obligations
Department of the NavyFY 2016 Budget Estimates
Unobligated Balances, New Obligational Resources, and Obligations - FY 2014 - Actual(in Thousands of Dollars)
PANMC 12 32,529 0 0 7,376 1754 41,659 35,270 133 0 35,403PANMC 13 168,788 0 0 8,401 1,360 178,549 135,005 1,147 0 136,152PANMC 14 0 719,042 0 0 12,340 731,382 563,414 3,833 0 567,247sub-total 201,317 719,042 0 15,777 15,454 951,590 733,689 5,113 0 738,802
OPN 12 603,255 -266,486 0 110,789 -474 447,084 393,202 2,027 0 395,229OPN 13 1,447,766 -7,979 0 169,432 107431 1,716,650 1,220,147 161,688 0 1,381,835OPN 14 0 5,691,110 0 0 103,084 5,794,194 4,069,354 92,131 0 4,161,485sub-total 2,051,021 5,416,645 0 280,221 210,041 7,957,928 5,682,703 255,846 0 5,938,549
PMC 12 500,252 0 -16,470 23,469 -84 507,167 439,504 0 0 439,504PMC 13 1,063,715 -12,650 6,488 20,956 29 1,078,538 520,050 29 0 520,079PMC 14 0 1,342,493 0 0 83 1,342,576 785,938 83 0 786,021sub-total 1,563,967 1,329,843 -9,982 44,425 28 2,928,281 1,745,492 112 0 1,745,604
CDAN 3,391 0 0 0 0 3,391 0 0 0 0
Total, PROCUREMENT 18,963,882 42,221,921 215,122 2,357,533 232,922 63,991,380 42,626,250 270,323 0 42,896,573
RESEARCH, DEV, TEST & EVALRDTEN 13 2,126,810 -59,257 43,850 512,195 -27,927 2,595,671 2,506,312 38,457 0 2,544,769RDTEN 14 306 15,087,780 0 1271 210,169 15,299,526 13,595,806 139,231 0 13,735,037Total, RDT&E 2,127,116 15,028,523 43,850 513,466 182,242 17,895,197 16,102,118 177,688 0 16,279,806
MILITARY CONSTRUCTIONMCN 10 248,296 -12,000 -39 36,358 1,242 273,857 255,895 3,599 0 259,494MCN 11 579,493 0 -475 61,641 62,259 702,918 167,106 57,782 0 224,888MCN 12 626,990 0 -220 30,478 26,802 684,050 266,655 51,632 0 318,287MCN 13 1,030,772 0 -3613 15100 24,824 1,067,083 353,750 76,921 0 430,671MCN 14 550 1,629,690 4363 0 642,015 2,276,618 638,546 523,767 0 1,162,313sub-total 2,486,101 1,617,690 16 143,577 757,142 5,004,526 1,681,952 713,701 0 2,395,653
MCNR 10 15,529 0 0 4693 0 20,222 16946 0 0 16,946MCNR 11 6,425 0 0 492 0 6,917 1,225 0 0 1,225MCNR 12 3,497 0 0 134 0 3,631 686 0 0 686MCNR 13 35,438 0 0 17 0 35,455 2,113 0 0 2,113MCNR 14 0 29,000 0 0 0 29,000 5,357 0 0 5,357sub-total 60,889 29,000 0 5,336 0 95,225 26,327 0 0 26,327
Base Realgn & Cl, N 42,865 0 -45,693 12,985 4,017 14,174 11,410 0 0 11,410BRCV 85,764 0 -91,304 17,868 466 12,794 12,561 0 0 12,561BRAC Consolidated 0 144,580 59,521 0 0 204,101 142,905 0 0 142,905FORD IS IMP ACCT 92 8 0 0 0 100 0 0 0 0sub-total 128,721 144,588 -77,476 30,853 4,483 231,169 166,876 0 0 166,876
Total, MILITARY CONSTRUCTION 2,675,711 1,791,278 -77,460 179,766 761,625 5,330,920 1,875,155 713,701 0 2,588,856
Page 2 of 3 5.3
------------ New Resources ------------- ------------- Obligations ------------Unobligated Total
Balance Recoveries Reim- Available Reim-Brought Budget of Prior bursable for Direct bursable Concept TotalForward Authority Transfers Obligations Orders Obligation Obligations Obligations Obligations Obligations
Department of the NavyFY 2016 Budget Estimates
Unobligated Balances, New Obligational Resources, and Obligations - FY 2014 - Actual(in Thousands of Dollars)
FAMILY HOUSINGFHCON 10 5,956 0 0 47 0 6,003 3,389 0 0 3,389FHCON 11 102,047 0 -30 21093 0 123,110 0 0 0 0FHCON 12 24,066 0 -1305 4188 0 26,949 4,415 0 0 4,415FHCON 13 88,744 0 -38,500 204 0 50,448 28,042 0 0 28,042FHCON 14 10,486 73,407 1835 0 0 85,728 42,924 0 0 42,924sub-total 231,299 73,407 -38,000 25,532 0 292,238 78,770 0 0 78,770
FHOPS 14 0 379,444 7,830 0 16,219 403,493 344,174 6,118 0 350,292
Total, FAMILY HOUSING 231,299 452,851 -30,170 25,532 16,219 695,731 422,944 6,118 0 429,062
REVOLVING & MANAGEMENT FUNDSNWCF 14 3,635,288 2,219,080 -442,000 1,689,418 25,743,298 32,845,084 0 28,413,466 0 28,413,466NDSF 177,183 573,213 0 72,688 604,202 1,427,286 761,416 620,616 0 1,382,032Total, REVOLVING & MANAGEMENT 3,812,471 2,792,293 -442,000 1,762,106 26,347,500 34,272,370 761,416 29,034,082 0 29,795,498
DEDUCT FOR OFFSETTING RCPTSOffsetting Receipts 0 -217,000 0 0 0 -217,000 0 0 -217,000 -217,000Total, OFFSETTING RECEIPTS 0 -217,000 0 0 0 -217,000 0 0 -217,000 -217,000
TRUST FUNDSUSNAGMF 13,049 10,288 0 0 0 23,337 0 0 8,504 8,504NGGF 5,261 1,537 0 0 0 6,798 0 0 1,336 1,336SSPN 2,415 10,475 0 0 0 12,890 0 0 10,352 10,352Total, TRUST FUNDS 20,725 22,300 0 0 0 43,025 0 0 20,192 20,192
INTERFUND TRANSACTIONSPSSSN 0 -10,000 0 0 0 -10,000 0 0 -10,000 -10,000Total, INTERFUND TRANSACTIONS 0 -10,000 0 0 0 -10,000 0 0 -10,000 -10,000
Total, DON 29,937,169 163,950,183 155,747 4,839,265 33,525,573 232,407,937 163,772,072 35,074,032 -206,804 198,639,300
No-year accounts are displayed in the FY 2014 totals.NOTE: FY14 includes supplemental funding.
Page 3 of 3 5.3
------------ New Resources ------------- ------------- Obligations ------------Unobligated Total
Balance Recoveries Reim- Available Reim-Brought Budget of Prior bursable for Direct bursable Concept TotalForward Authority Transfers Obligations Orders Obligation Obligations Obligations Obligations Obligations
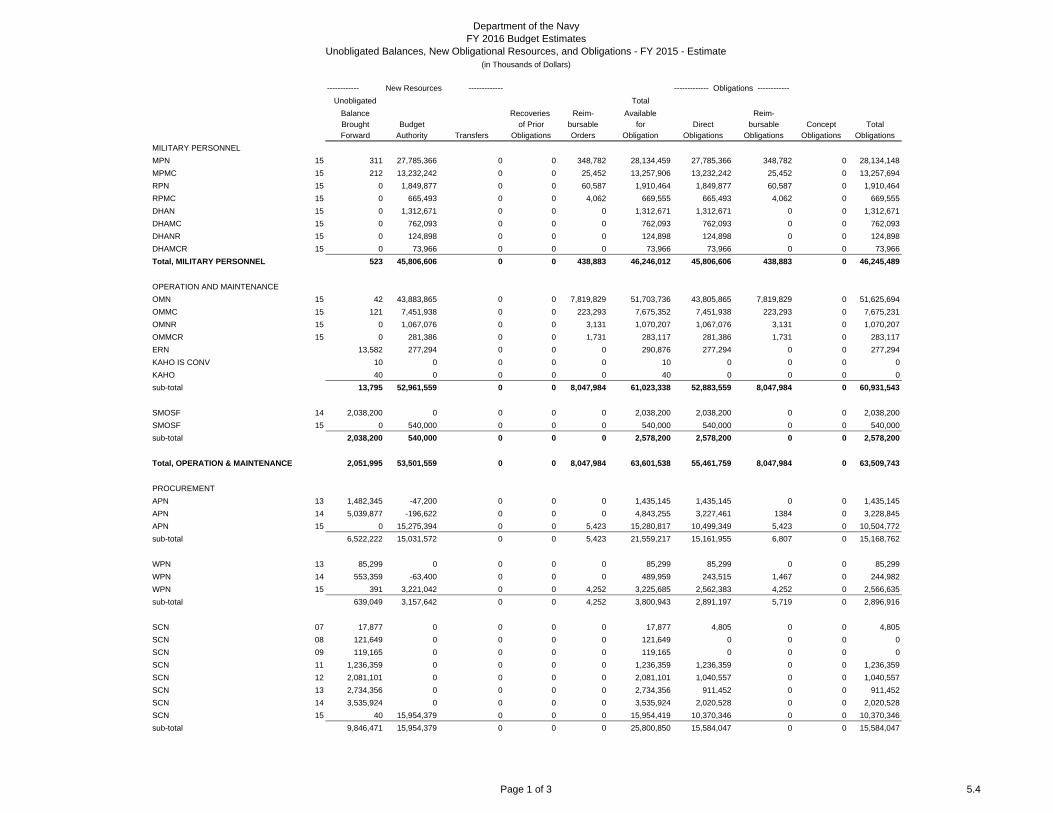
MILITARY PERSONNELMPN 15 311 27,785,366 0 0 348,782 28,134,459 27,785,366 348,782 0 28,134,148MPMC 15 212 13,232,242 0 0 25,452 13,257,906 13,232,242 25,452 0 13,257,694RPN 15 0 1,849,877 0 0 60,587 1,910,464 1,849,877 60,587 0 1,910,464RPMC 15 0 665,493 0 0 4,062 669,555 665,493 4,062 0 669,555DHAN 15 0 1,312,671 0 0 0 1,312,671 1,312,671 0 0 1,312,671DHAMC 15 0 762,093 0 0 0 762,093 762,093 0 0 762,093DHANR 15 0 124,898 0 0 0 124,898 124,898 0 0 124,898DHAMCR 15 0 73,966 0 0 0 73,966 73,966 0 0 73,966Total, MILITARY PERSONNEL 523 45,806,606 0 0 438,883 46,246,012 45,806,606 438,883 0 46,245,489
OPERATION AND MAINTENANCEOMN 15 42 43,883,865 0 0 7,819,829 51,703,736 43,805,865 7,819,829 0 51,625,694OMMC 15 121 7,451,938 0 0 223,293 7,675,352 7,451,938 223,293 0 7,675,231OMNR 15 0 1,067,076 0 0 3,131 1,070,207 1,067,076 3,131 0 1,070,207OMMCR 15 0 281,386 0 0 1,731 283,117 281,386 1,731 0 283,117ERN 13,582 277,294 0 0 0 290,876 277,294 0 0 277,294KAHO IS CONV 10 0 0 0 0 10 0 0 0 0KAHO 40 0 0 0 0 40 0 0 0 0sub-total 13,795 52,961,559 0 0 8,047,984 61,023,338 52,883,559 8,047,984 0 60,931,543
SMOSF 14 2,038,200 0 0 0 0 2,038,200 2,038,200 0 0 2,038,200SMOSF 15 0 540,000 0 0 0 540,000 540,000 0 0 540,000sub-total 2,038,200 540,000 0 0 0 2,578,200 2,578,200 0 0 2,578,200
Total, OPERATION & MAINTENANCE 2,051,995 53,501,559 0 0 8,047,984 63,601,538 55,461,759 8,047,984 0 63,509,743
PROCUREMENTAPN 13 1,482,345 -47,200 0 0 0 1,435,145 1,435,145 0 0 1,435,145APN 14 5,039,877 -196,622 0 0 0 4,843,255 3,227,461 1384 0 3,228,845APN 15 0 15,275,394 0 0 5,423 15,280,817 10,499,349 5,423 0 10,504,772sub-total 6,522,222 15,031,572 0 0 5,423 21,559,217 15,161,955 6,807 0 15,168,762
WPN 13 85,299 0 0 0 0 85,299 85,299 0 0 85,299WPN 14 553,359 -63,400 0 0 0 489,959 243,515 1,467 0 244,982WPN 15 391 3,221,042 0 0 4,252 3,225,685 2,562,383 4,252 0 2,566,635sub-total 639,049 3,157,642 0 0 4,252 3,800,943 2,891,197 5,719 0 2,896,916
SCN 07 17,877 0 0 0 0 17,877 4,805 0 0 4,805SCN 08 121,649 0 0 0 0 121,649 0 0 0 0SCN 09 119,165 0 0 0 0 119,165 0 0 0 0SCN 11 1,236,359 0 0 0 0 1,236,359 1,236,359 0 0 1,236,359SCN 12 2,081,101 0 0 0 0 2,081,101 1,040,557 0 0 1,040,557SCN 13 2,734,356 0 0 0 0 2,734,356 911,452 0 0 911,452SCN 14 3,535,924 0 0 0 0 3,535,924 2,020,528 0 0 2,020,528SCN 15 40 15,954,379 0 0 0 15,954,419 10,370,346 0 0 10,370,346sub-total 9,846,471 15,954,379 0 0 0 25,800,850 15,584,047 0 0 15,584,047
Department of the NavyFY 2016 Budget Estimates
Unobligated Balances, New Obligational Resources, and Obligations - FY 2015 - Estimate(in Thousands of Dollars)
Page 1 of 3 5.4

------------ New Resources ------------- ------------- Obligations ------------Unobligated Total
Balance Recoveries Reim- Available Reim-Brought Budget of Prior bursable for Direct bursable Concept TotalForward Authority Transfers Obligations Orders Obligation Obligations Obligations Obligations Obligations
Department of the NavyFY 2016 Budget Estimates
Unobligated Balances, New Obligational Resources, and Obligations - FY 2015 - Estimate(in Thousands of Dollars)
PANMC 13 42,397 0 0 0 0 42,397 42,397 0 0 42,397PANMC 14 164,135 0 0 0 0 164,135 73,561 8,507 0 82,068PANMC 15 0 828,619 0 0 4,897 833,516 661,916 4,897 0 666,813sub-total 206,532 828,619 0 0 4,897 1,040,048 777,874 13,404 0 791,278
OPN 13 334,815 0 0 0 0 334,815 334,815 0 0 334,815OPN 14 1,632,709 -1,505 0 0 0 1,631,204 804,654 10,953 0 815,607OPN 15 0 6,417,268 0 0 300,503 6,717,771 4,716,114 300,503 0 5,016,617sub-total 1,967,524 6,415,763 0 0 300,503 8,683,790 5,855,583 311,456 0 6,167,039
PMC 13 558,459 -40,217 0 0 0 518,242 518,242 0 0 518,242PMC 14 556,555 0 0 0 0 556,555 415,409 0 0 415,409PMC 15 0 1,000,798 0 0 46,399 1,047,197 536,261 46,399 0 582,660sub-total 1,115,014 960,581 0 0 46,399 2,121,994 1,469,912 46,399 0 1,516,311
CDAN 3,391 0 0 0 0 3,391 0 0 0 0
Total, PROCUREMENT 20,300,203 42,348,556 0 0 361,474 63,010,233 41,740,568 383,785 0 42,124,353
RESEARCH, DEV, TEST & EVALRDTEN 14 1,562,912 -141,727 0 0 0 1,421,185 1,350,247 70,938 0 1,421,185RDTEN 15 1,577 16,648,624 0 0 432,722 17,082,923 14,348,289 432,722 0 14,781,011Total, RDT&E 1,564,489 16,506,897 0 0 432,722 18,504,108 15,698,536 503,660 0 16,202,196
MILITARY CONSTRUCTIONMCN 11 478,030 -22,154 0 0 0 455,876 455,876 0 0 455,876MCN 12 365,763 -2,951 0 0 0 362,812 326,533 0 0 326,533MCN 13 636,412 -417 0 0 0 635,995 317,996 0 0 317,996MCN 14 1,113,755 0 0 0 0 1,113,755 438,631 118,248 0 556,879MCN 15 550 1,080,159 0 0 559,355 1,640,064 424,353 559,355 0 983,708sub-total 2,594,510 1,054,637 0 0 559,355 4,208,502 1,963,389 677,603 0 2,640,992
MCNR 11 5,692 0 0 0 0 5,692 5692 0 0 5,692MCNR 12 2,945 0 0 0 0 2,945 1,764 0 0 1,764MCNR 13 33,342 0 0 0 0 33,342 16,675 0 0 16,675MCNR 14 23,643 0 0 0 0 23,643 14,186 0 0 14,186MCNR 15 0 55,504 0 0 0 55,504 41,628 0 0 41,628sub-total 65,622 55,504 0 0 0 121,126 79,945 0 0 79,945
BRAC Consolidated 61,196 139,692 0 0 0 200,888 139,692 0 0 139,692FORD IS IMP ACCT 100 0 0 0 0 100 0 0 0 0sub-total 61,296 139,692 0 0 0 200,988 139,692 0 0 139,692
Total, MILITARY CONSTRUCTION 2,721,428 1,249,833 0 0 559,355 4,530,616 2,183,026 677,603 0 2,860,629
Page 2 of 3 5.4
------------ New Resources ------------- ------------- Obligations ------------Unobligated Total
Balance Recoveries Reim- Available Reim-Brought Budget of Prior bursable for Direct bursable Concept TotalForward Authority Transfers Obligations Orders Obligation Obligations Obligations Obligations Obligations
Department of the NavyFY 2016 Budget Estimates
Unobligated Balances, New Obligational Resources, and Obligations - FY 2015 - Estimate(in Thousands of Dollars)
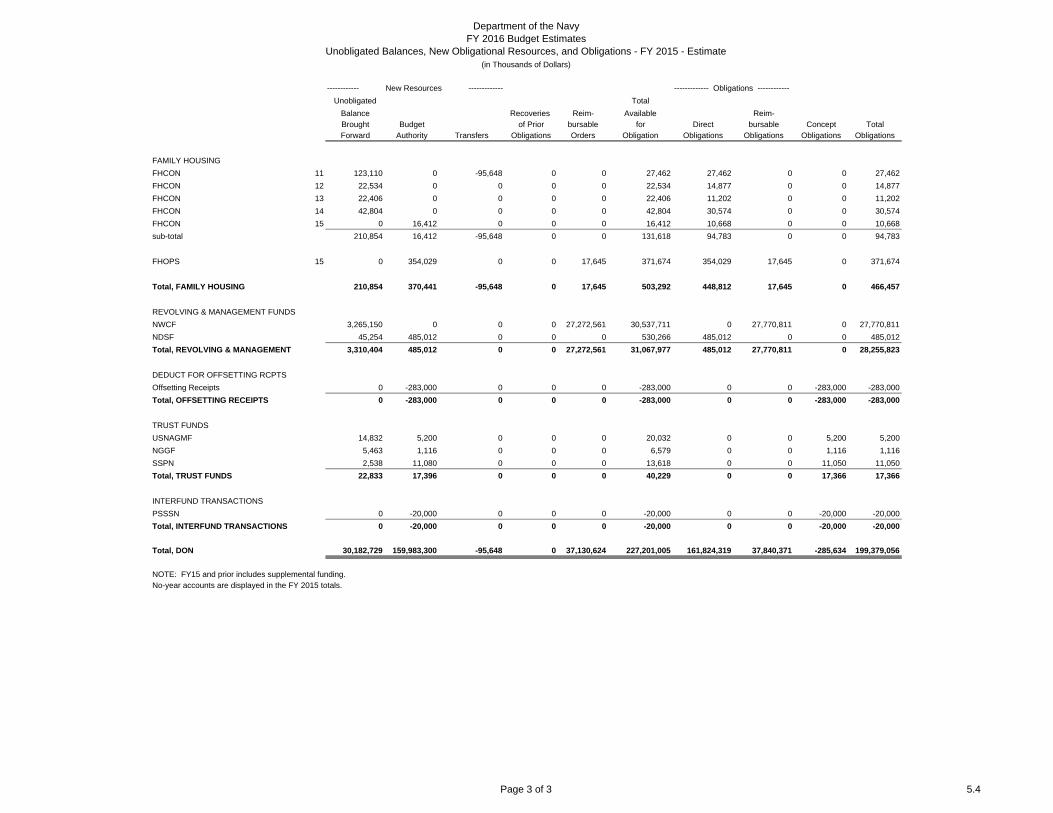
FAMILY HOUSINGFHCON 11 123,110 0 -95,648 0 0 27,462 27,462 0 0 27,462FHCON 12 22,534 0 0 0 0 22,534 14,877 0 0 14,877FHCON 13 22,406 0 0 0 0 22,406 11,202 0 0 11,202FHCON 14 42,804 0 0 0 0 42,804 30,574 0 0 30,574FHCON 15 0 16,412 0 0 0 16,412 10,668 0 0 10,668sub-total 210,854 16,412 -95,648 0 0 131,618 94,783 0 0 94,783
FHOPS 15 0 354,029 0 0 17,645 371,674 354,029 17,645 0 371,674
Total, FAMILY HOUSING 210,854 370,441 -95,648 0 17,645 503,292 448,812 17,645 0 466,457
REVOLVING & MANAGEMENT FUNDSNWCF 3,265,150 0 0 0 27,272,561 30,537,711 0 27,770,811 0 27,770,811NDSF 45,254 485,012 0 0 0 530,266 485,012 0 0 485,012Total, REVOLVING & MANAGEMENT 3,310,404 485,012 0 0 27,272,561 31,067,977 485,012 27,770,811 0 28,255,823
DEDUCT FOR OFFSETTING RCPTSOffsetting Receipts 0 -283,000 0 0 0 -283,000 0 0 -283,000 -283,000Total, OFFSETTING RECEIPTS 0 -283,000 0 0 0 -283,000 0 0 -283,000 -283,000
TRUST FUNDSUSNAGMF 14,832 5,200 0 0 0 20,032 0 0 5,200 5,200NGGF 5,463 1,116 0 0 0 6,579 0 0 1,116 1,116SSPN 2,538 11,080 0 0 0 13,618 0 0 11,050 11,050Total, TRUST FUNDS 22,833 17,396 0 0 0 40,229 0 0 17,366 17,366
INTERFUND TRANSACTIONSPSSSN 0 -20,000 0 0 0 -20,000 0 0 -20,000 -20,000Total, INTERFUND TRANSACTIONS 0 -20,000 0 0 0 -20,000 0 0 -20,000 -20,000
Total, DON 30,182,729 159,983,300 -95,648 0 37,130,624 227,201,005 161,824,319 37,840,371 -285,634 199,379,056
No-year accounts are displayed in the FY 2015 totals.NOTE: FY15 and prior includes supplemental funding.
Page 3 of 3 5.4
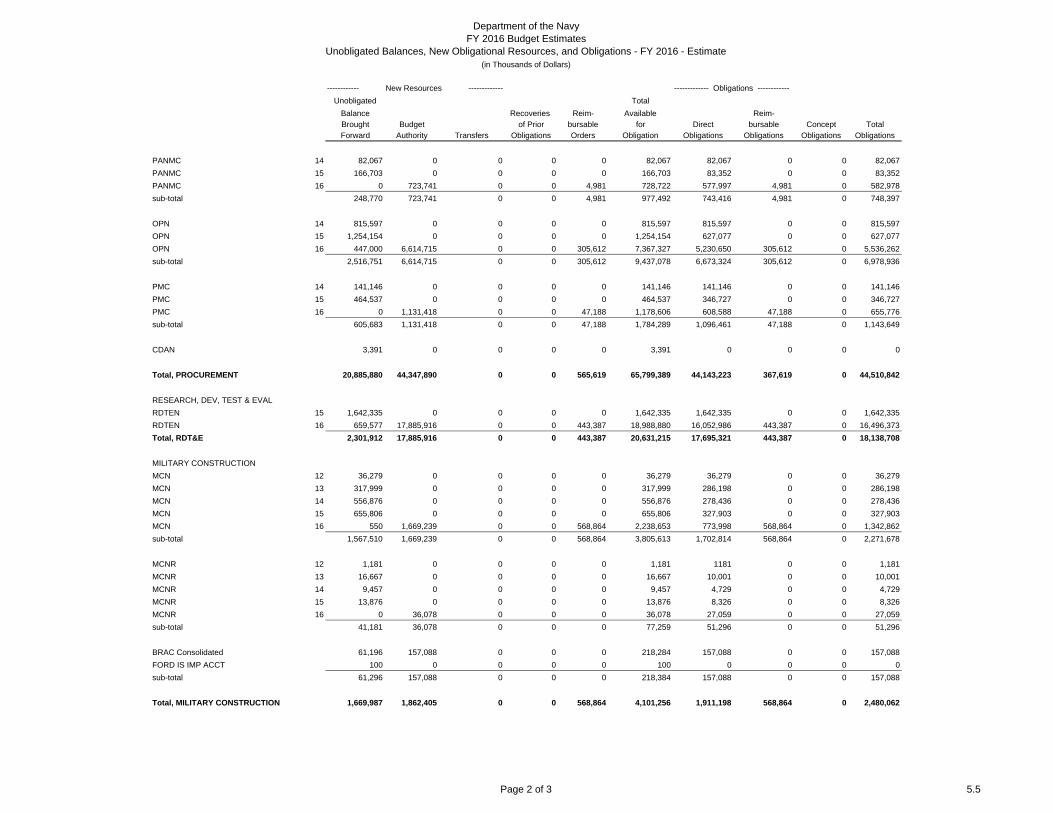
------------ New Resources ------------- ------------- Obligations ------------Unobligated Total
Balance Recoveries Reim- Available Reim-Brought Budget of Prior bursable for Direct bursable Concept TotalForward Authority Transfers Obligations Orders Obligation Obligations Obligations Obligations Obligations
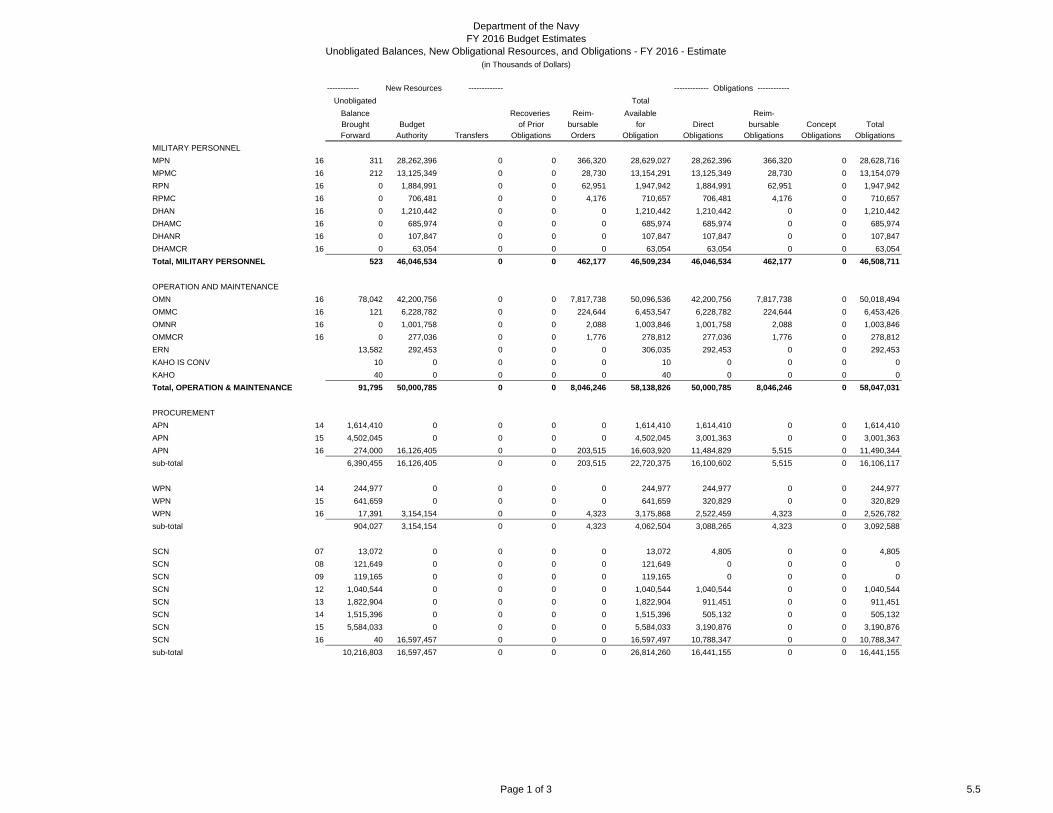
MILITARY PERSONNELMPN 16 311 28,262,396 0 0 366,320 28,629,027 28,262,396 366,320 0 28,628,716MPMC 16 212 13,125,349 0 0 28,730 13,154,291 13,125,349 28,730 0 13,154,079RPN 16 0 1,884,991 0 0 62,951 1,947,942 1,884,991 62,951 0 1,947,942RPMC 16 0 706,481 0 0 4,176 710,657 706,481 4,176 0 710,657DHAN 16 0 1,210,442 0 0 0 1,210,442 1,210,442 0 0 1,210,442DHAMC 16 0 685,974 0 0 0 685,974 685,974 0 0 685,974DHANR 16 0 107,847 0 0 0 107,847 107,847 0 0 107,847DHAMCR 16 0 63,054 0 0 0 63,054 63,054 0 0 63,054Total, MILITARY PERSONNEL 523 46,046,534 0 0 462,177 46,509,234 46,046,534 462,177 0 46,508,711
OPERATION AND MAINTENANCEOMN 16 78,042 42,200,756 0 0 7,817,738 50,096,536 42,200,756 7,817,738 0 50,018,494OMMC 16 121 6,228,782 0 0 224,644 6,453,547 6,228,782 224,644 0 6,453,426OMNR 16 0 1,001,758 0 0 2,088 1,003,846 1,001,758 2,088 0 1,003,846OMMCR 16 0 277,036 0 0 1,776 278,812 277,036 1,776 0 278,812ERN 13,582 292,453 0 0 0 306,035 292,453 0 0 292,453KAHO IS CONV 10 0 0 0 0 10 0 0 0 0KAHO 40 0 0 0 0 40 0 0 0 0Total, OPERATION & MAINTENANCE 91,795 50,000,785 0 0 8,046,246 58,138,826 50,000,785 8,046,246 0 58,047,031
PROCUREMENTAPN 14 1,614,410 0 0 0 0 1,614,410 1,614,410 0 0 1,614,410APN 15 4,502,045 0 0 0 0 4,502,045 3,001,363 0 0 3,001,363APN 16 274,000 16,126,405 0 0 203,515 16,603,920 11,484,829 5,515 0 11,490,344sub-total 6,390,455 16,126,405 0 0 203,515 22,720,375 16,100,602 5,515 0 16,106,117
WPN 14 244,977 0 0 0 0 244,977 244,977 0 0 244,977WPN 15 641,659 0 0 0 0 641,659 320,829 0 0 320,829WPN 16 17,391 3,154,154 0 0 4,323 3,175,868 2,522,459 4,323 0 2,526,782sub-total 904,027 3,154,154 0 0 4,323 4,062,504 3,088,265 4,323 0 3,092,588
SCN 07 13,072 0 0 0 0 13,072 4,805 0 0 4,805SCN 08 121,649 0 0 0 0 121,649 0 0 0 0SCN 09 119,165 0 0 0 0 119,165 0 0 0 0SCN 12 1,040,544 0 0 0 0 1,040,544 1,040,544 0 0 1,040,544SCN 13 1,822,904 0 0 0 0 1,822,904 911,451 0 0 911,451SCN 14 1,515,396 0 0 0 0 1,515,396 505,132 0 0 505,132SCN 15 5,584,033 0 0 0 0 5,584,033 3,190,876 0 0 3,190,876SCN 16 40 16,597,457 0 0 0 16,597,497 10,788,347 0 0 10,788,347sub-total 10,216,803 16,597,457 0 0 0 26,814,260 16,441,155 0 0 16,441,155
Department of the NavyFY 2016 Budget Estimates
Unobligated Balances, New Obligational Resources, and Obligations - FY 2016 - Estimate(in Thousands of Dollars)
Page 1 of 3 5.5
------------ New Resources ------------- ------------- Obligations ------------Unobligated Total
Balance Recoveries Reim- Available Reim-Brought Budget of Prior bursable for Direct bursable Concept TotalForward Authority Transfers Obligations Orders Obligation Obligations Obligations Obligations Obligations
Department of the NavyFY 2016 Budget Estimates
Unobligated Balances, New Obligational Resources, and Obligations - FY 2016 - Estimate(in Thousands of Dollars)
PANMC 14 82,067 0 0 0 0 82,067 82,067 0 0 82,067PANMC 15 166,703 0 0 0 0 166,703 83,352 0 0 83,352PANMC 16 0 723,741 0 0 4,981 728,722 577,997 4,981 0 582,978sub-total 248,770 723,741 0 0 4,981 977,492 743,416 4,981 0 748,397
OPN 14 815,597 0 0 0 0 815,597 815,597 0 0 815,597OPN 15 1,254,154 0 0 0 0 1,254,154 627,077 0 0 627,077OPN 16 447,000 6,614,715 0 0 305,612 7,367,327 5,230,650 305,612 0 5,536,262sub-total 2,516,751 6,614,715 0 0 305,612 9,437,078 6,673,324 305,612 0 6,978,936
PMC 14 141,146 0 0 0 0 141,146 141,146 0 0 141,146PMC 15 464,537 0 0 0 0 464,537 346,727 0 0 346,727PMC 16 0 1,131,418 0 0 47,188 1,178,606 608,588 47,188 0 655,776sub-total 605,683 1,131,418 0 0 47,188 1,784,289 1,096,461 47,188 0 1,143,649
CDAN 3,391 0 0 0 0 3,391 0 0 0 0
Total, PROCUREMENT 20,885,880 44,347,890 0 0 565,619 65,799,389 44,143,223 367,619 0 44,510,842
RESEARCH, DEV, TEST & EVALRDTEN 15 1,642,335 0 0 0 0 1,642,335 1,642,335 0 0 1,642,335RDTEN 16 659,577 17,885,916 0 0 443,387 18,988,880 16,052,986 443,387 0 16,496,373Total, RDT&E 2,301,912 17,885,916 0 0 443,387 20,631,215 17,695,321 443,387 0 18,138,708
MILITARY CONSTRUCTIONMCN 12 36,279 0 0 0 0 36,279 36,279 0 0 36,279MCN 13 317,999 0 0 0 0 317,999 286,198 0 0 286,198MCN 14 556,876 0 0 0 0 556,876 278,436 0 0 278,436MCN 15 655,806 0 0 0 0 655,806 327,903 0 0 327,903MCN 16 550 1,669,239 0 0 568,864 2,238,653 773,998 568,864 0 1,342,862sub-total 1,567,510 1,669,239 0 0 568,864 3,805,613 1,702,814 568,864 0 2,271,678
MCNR 12 1,181 0 0 0 0 1,181 1181 0 0 1,181MCNR 13 16,667 0 0 0 0 16,667 10,001 0 0 10,001MCNR 14 9,457 0 0 0 0 9,457 4,729 0 0 4,729MCNR 15 13,876 0 0 0 0 13,876 8,326 0 0 8,326MCNR 16 0 36,078 0 0 0 36,078 27,059 0 0 27,059sub-total 41,181 36,078 0 0 0 77,259 51,296 0 0 51,296
BRAC Consolidated 61,196 157,088 0 0 0 218,284 157,088 0 0 157,088FORD IS IMP ACCT 100 0 0 0 0 100 0 0 0 0sub-total 61,296 157,088 0 0 0 218,384 157,088 0 0 157,088
Total, MILITARY CONSTRUCTION 1,669,987 1,862,405 0 0 568,864 4,101,256 1,911,198 568,864 0 2,480,062
Page 2 of 3 5.5

------------ New Resources ------------- ------------- Obligations ------------Unobligated Total
Balance Recoveries Reim- Available Reim-Brought Budget of Prior bursable for Direct bursable Concept TotalForward Authority Transfers Obligations Orders Obligation Obligations Obligations Obligations Obligations
Department of the NavyFY 2016 Budget Estimates
Unobligated Balances, New Obligational Resources, and Obligations - FY 2016 - Estimate(in Thousands of Dollars)
FAMILY HOUSINGFHCON 12 7,657 0 0 0 0 7,657 7,657 0 0 7,657FHCON 13 11,204 0 0 0 0 11,204 7,392 0 0 7,392FHCON 14 12,230 0 0 0 0 12,230 6,114 0 0 6,114FHCON 15 5,744 0 0 0 0 5,744 4,103 0 0 4,103FHCON 16 0 16541 0 0 0 16,541 10,752 0 0 10,752sub-total 36,835 16,541 0 0 0 53,376 36,018 0 0 36,018
FHOPS 16 0 353,036 0 0 17,645 370,681 353,036 17,645 0 370,681
Total, FAMILY HOUSING 36,835 369,577 0 0 17,645 424,057 389,054 17,645 0 406,699
REVOLVING & MANAGEMENT FUNDSNWCF 2,766,900 0 0 0 27,802,676 30,569,576 0 28,518,873 0 28,518,873NDSF 45,254 474,164 0 0 0 519,418 474164 0 0 474,164Total, REVOLVING & MANAGEMENT 2,812,154 474,164 0 0 27,802,676 31,088,994 474,164 28,518,873 0 28,993,037
DEDUCT FOR OFFSETTING RCPTSOffsetting Receipts 0 -283,000 0 0 0 -283,000 0 0 -283,000 -283,000Total, OFFSETTING RECEIPTS 0 -283,000 0 0 0 -283,000 0 0 -283,000 -283,000
TRUST FUNDSUSNAGMF 14,832 5,200 0 0 0 20,032 0 0 5,200 5,200NGGF 5,463 1,116 0 0 0 6,579 0 0 1,116 1,116SSPN 2,568 9,341 0 0 0 11,909 0 0 8,050 8,050Total, TRUST FUNDS 22,863 15,657 0 0 0 38,520 0 0 14,366 14,366
INTERFUND TRANSACTIONSPSSSN 0 -20,000 0 0 0 -20,000 0 0 -20,000 -20,000Total, INTERFUND TRANSACTIONS 0 -20,000 0 0 0 -20,000 0 0 -20,000 -20,000
Total, DON 27,821,949 160,699,928 0 0 37,906,614 226,428,491 160,660,279 38,424,811 -288,634 198,796,456
No-year accounts are displayed in the FY 2016 totals.NOTE: FY15 and prior includes supplemental funding; FY16 reflects the baseline request.
Page 3 of 3 5.5
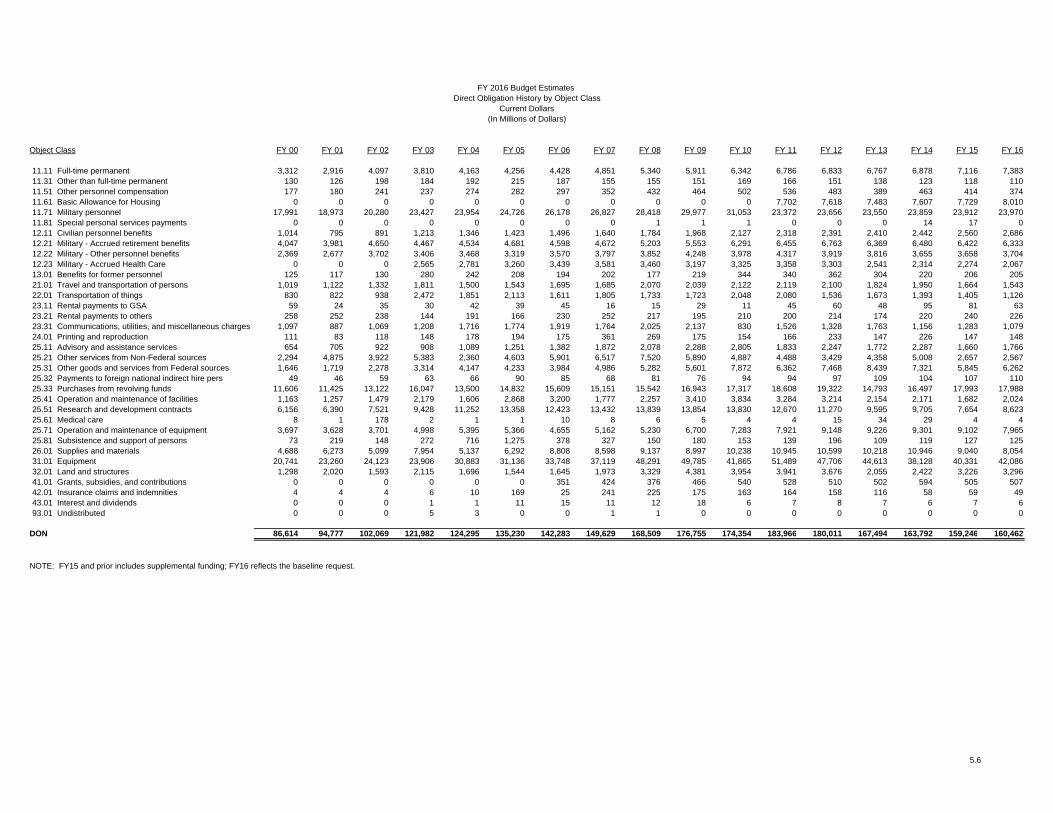
Object Class FY 00 FY 01 FY 02 FY 03 FY 04 FY 05 FY 06 FY 07 FY 08 FY 09 FY 10 FY 11 FY 12 FY 13 FY 14 FY 15 FY 16
11.11 Full-time permanent 3,312 2,916 4,097 3,810 4,163 4,256 4,428 4,851 5,340 5,911 6,342 6,786 6,833 6,767 6,878 7,116 7,38311.31 Other than full-time permanent 130 126 198 184 192 215 187 155 155 151 169 166 151 138 123 118 11011.51 Other personnel compensation 177 180 241 237 274 282 297 352 432 464 502 536 483 389 463 414 37411.61 Basic Allowance for Housing 0 0 0 0 0 0 0 0 0 0 0 7,702 7,618 7,483 7,607 7,729 8,01011.71 Military personnel 17,991 18,973 20,280 23,427 23,954 24,726 26,178 26,827 28,418 29,977 31,053 23,372 23,656 23,550 23,859 23,912 23,97011.81 Special personal services payments 0 0 0 0 0 0 0 0 1 1 1 0 0 0 14 17 012.11 Civilian personnel benefits 1,014 795 891 1,213 1,346 1,423 1,496 1,640 1,784 1,968 2,127 2,318 2,391 2,410 2,442 2,560 2,68612.21 Military - Accrued retirement benefits 4,047 3,981 4,650 4,467 4,534 4,681 4,598 4,672 5,203 5,553 6,291 6,455 6,763 6,369 6,480 6,422 6,33312.22 Military - Other personnel benefits 2,369 2,677 3,702 3,406 3,468 3,319 3,570 3,797 3,852 4,248 3,978 4,317 3,919 3,816 3,655 3,658 3,70412.23 Military - Accrued Health Care 0 0 0 2,565 2,781 3,260 3,439 3,581 3,460 3,197 3,325 3,358 3,303 2,541 2,314 2,274 2,06713.01 Benefits for former personnel 125 117 130 280 242 208 194 202 177 219 344 340 362 304 220 206 20521.01 Travel and transportation of persons 1,019 1,122 1,332 1,811 1,500 1,543 1,695 1,685 2,070 2,039 2,122 2,119 2,100 1,824 1,950 1,664 1,54322.01 Transportation of things 830 822 938 2,472 1,851 2,113 1,611 1,805 1,733 1,723 2,048 2,080 1,536 1,673 1,393 1,405 1,12623.11 Rental payments to GSA 59 24 35 30 42 39 45 16 15 29 11 45 60 48 95 81 6323.21 Rental payments to others 258 252 238 144 191 166 230 252 217 195 210 200 214 174 220 240 22623.31 Communications, utilities, and miscellaneous charges 1,097 887 1,069 1,208 1,716 1,774 1,919 1,764 2,025 2,137 830 1,526 1,328 1,763 1,156 1,283 1,07924.01 Printing and reproduction 111 83 118 148 178 194 175 361 269 175 154 166 233 147 226 147 14825.11 Advisory and assistance services 654 705 922 908 1,089 1,251 1,382 1,872 2,078 2,288 2,805 1,833 2,247 1,772 2,287 1,660 1,76625.21 Other services from Non-Federal sources 2,294 4,875 3,922 5,383 2,360 4,603 5,901 6,517 7,520 5,890 4,887 4,488 3,429 4,358 5,008 2,657 2,56725.31 Other goods and services from Federal sources 1,646 1,719 2,278 3,314 4,147 4,233 3,984 4,986 5,282 5,601 7,872 6,362 7,468 8,439 7,321 5,845 6,26225.32 Payments to foreign national indirect hire pers 49 46 59 63 66 90 85 68 81 76 94 94 97 109 104 107 11025.33 Purchases from revolving funds 11,606 11,425 13,122 16,047 13,500 14,832 15,609 15,151 15,542 16,943 17,317 18,608 19,322 14,793 16,497 17,993 17,98825.41 Operation and maintenance of facilities 1,163 1,257 1,479 2,179 1,606 2,868 3,200 1,777 2,257 3,410 3,834 3,284 3,214 2,154 2,171 1,682 2,02425.51 Research and development contracts 6,156 6,390 7,521 9,428 11,252 13,358 12,423 13,432 13,839 13,854 13,830 12,670 11,270 9,595 9,705 7,654 8,62325.61 Medical care 8 1 178 2 1 1 10 8 6 5 4 4 15 34 29 4 425.71 Operation and maintenance of equipment 3,697 3,628 3,701 4,998 5,395 5,366 4,655 5,162 5,230 6,700 7,283 7,921 9,148 9,226 9,301 9,102 7,96525.81 Subsistence and support of persons 73 219 148 272 716 1,275 378 327 150 180 153 139 196 109 119 127 12526.01 Supplies and materials 4,688 6,273 5,099 7,954 5,137 6,292 8,808 8,598 9,137 8,997 10,238 10,945 10,599 10,218 10,946 9,040 8,05431.01 Equipment 20,741 23,260 24,123 23,906 30,883 31,136 33,748 37,119 48,291 49,785 41,865 51,489 47,706 44,613 38,128 40,331 42,08632.01 Land and structures 1,298 2,020 1,593 2,115 1,696 1,544 1,645 1,973 3,329 4,381 3,954 3,941 3,676 2,055 2,422 3,226 3,29641.01 Grants, subsidies, and contributions 0 0 0 0 0 0 351 424 376 466 540 528 510 502 594 505 50742.01 Insurance claims and indemnities 4 4 4 6 10 169 25 241 225 175 163 164 158 116 58 59 4943.01 Interest and dividends 0 0 0 1 1 11 15 11 12 18 6 7 8 7 6 7 693.01 Undistributed 0 0 0 5 3 0 0 1 1 0 0 0 0 0 0 0 0
DON 86,614 94,777 102,069 121,982 124,295 135,230 142,283 149,629 168,509 176,755 174,354 183,966 180,011 167,494 163,792 159,246 160,462
NOTE: FY15 and prior includes supplemental funding; FY16 reflects the baseline request.
FY 2016 Budget Estimates Direct Obligation History by Object Class
Current Dollars(In Millions of Dollars)
5.6

Department of the NavyFY 2016 Budget Estimates
Program Outlay Rates(As a percent of Budget Authority)
ProgramAppropriation Year FY 2015 FY 2016 FY 2017 FY 2018 FY 2019 FY 2020
Military Personnel, Navy 2015 95.00% 4.00% 0.05%2016 95.00% 4.00% 0.05%
Military Personnel, Marine Corps 2015 94.60% 4.90% 2016 94.60% 4.90%
Reserve Personnel, Navy 2015 93.00% 6.50% 2016 93.00% 6.50%
Reserve Personnel, Marine Corps 2015 93.50% 6.00% 2016 93.50% 6.00%
Medicare-Eligible, Navy 2015 100.00%2016 100.00%
Medicare-Eligible, Marine Corps 2015 100.00%2016 100.00%
Medicare-Eligible, Navy Reserve 2015 100.00%2016 100.00%
Medicare-Eligible, Marine Corps Reserve 2015 100.00%2016 100.00%
Operation & Maintenance, Navy 2015 64.60% 23.20% 9.70% 1.20% 0.80% 2016 64.60% 23.20% 9.70% 1.20% 0.80%
Operation & Maintenance, Marine Corps 2015 58.90% 32.50% 7.10% 1.00%2016 58.90% 32.50% 7.10% 1.00%
Operation & Maintenance, Navy Reserve 2015 70.00% 26.00% 1.80% 1.50% 0.20% 2016 70.00% 26.00% 1.80% 1.50% 0.20%
Operation & Maintenance, MC Reserve 2015 53.00% 35.00% 8.00% 3.00% 0.50%2016 53.00% 35.00% 8.00% 3.00% 0.50%
Environmental Restoration Fund, Navy 2015 40.00% 40.00% 15.00% 4.50%2016 40.00% 40.00% 15.00% 4.50%
Page 1 of 2 5.7

Department of the NavyFY 2016 Budget Estimates
Program Outlay Rates(As a percent of Budget Authority)
ProgramAppropriation Year FY 2015 FY 2016 FY 2017 FY 2018 FY 2019 FY 2020
Ship Modernization, Operations and Sustainment Fund 2015 55.00% 22.00% 12.00% 5.00% 3.00% 1.50%
Aircraft Procurement, Navy 2015 14.27% 33.45% 31.75% 8.95% 4.00% 3.00%2016 14.50% 33.75% 31.96% 8.94% 3.96%
Weapons Procurement, Navy 2015 17.63% 29.58% 25.97% 11.75% 6.38% 2.94%2016 18.00% 30.20% 26.50% 12.80% 6.50%
Shipbuilding & Conversion, Navy 2015 8.40% 24.40% 19.50% 16.70% 12.00% 9.00%2016 8.40% 24.40% 19.50% 16.70% 12.00%
Procurement of Ammunition, Navy and Marine Corps 2015 8.30% 32.40% 29.30% 16.00% 7.00% 4.00%2016 8.30% 32.40% 29.30% 16.00% 7.00%
Other Procurement, Navy 2015 20.50% 42.10% 19.00% 9.00% 4.50% 2.00%2016 20.50% 42.10% 19.00% 9.00% 4.50%
Procurement, Marine Corps 2015 12.50% 40.40% 26.20% 10.50% 3.50% 1.40%2016 13.00% 42.00% 27.20% 10.61% 3.50%
Research Development, Test & Evaluation, Navy 2015 50.05% 37.96% 6.64% 1.56% 0.08% 0.70%2016 50.50% 38.30% 7.08% 2.00% 0.64%
Military Construction, Navy 2015 2.00% 25.00% 35.00% 17.00% 7.00% 5.00%2016 2.00% 25.00% 35.00% 17.00% 7.00%
Military Construction, Naval Reserve 2015 2.00% 32.80% 40.00% 9.80% 7.00% 4.00%2016 2.00% 32.80% 40.00% 9.80% 7.00%
Consolidated Prior BRAC 2015 42.00% 35.00% 12.50% 7.00% 2.00% 1.00%2016 42.00% 35.00% 12.50% 7.00% 2.00%
Family Housing, Construction 2015 6.00% 15.00% 34.00% 16.00% 12.50% 7.00%Navy & Marine Corps 2016 6.00% 15.00% 34.00% 16.00% 12.50%
Family Housing, Operations & Maintenance 2015 60.80% 27.70% 7.40% 2.00% 1.00% 0.60%Navy & Marine Corps 2016 60.80% 27.70% 7.40% 2.00% 1.00%
National Defense Sealift Fund 2015 40.00% 25.00% 15.00% 7.00% 6.00% 4.00%2016 40.00% 25.00% 15.00% 7.00% 6.00%
Page 2 of 2 5.7
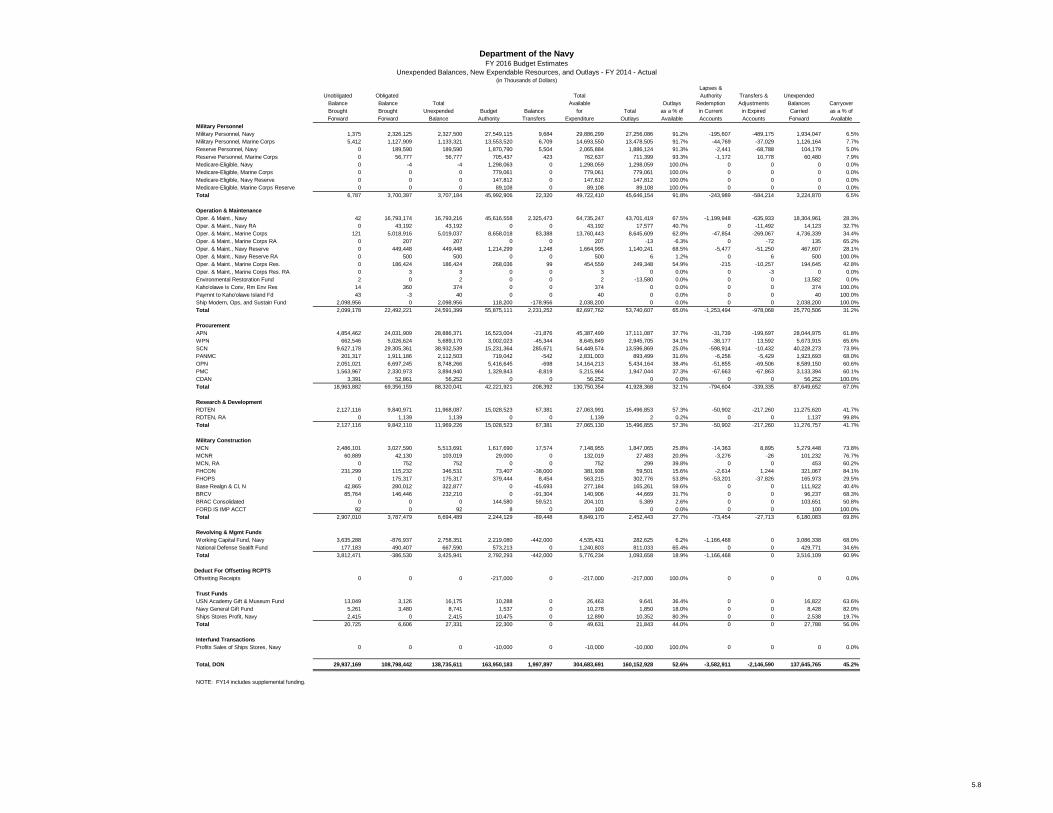
Lapses &Unobligated Obligated Total Authority Transfers & Unexpended
Balance Balance Total Available Outlays Redemption Adjustments Balances CarryoverBrought Brought Unexpended Budget Balance for Total as a % of in Current in Expired Carried as a % ofForward Forward Balance Authority Transfers Expenditure Outlays Available Accounts Accounts Forward Available
Military PersonnelMilitary Personnel, Navy 1,375 2,326,125 2,327,500 27,549,115 9,684 29,886,299 27,256,086 91.2% -195,607 -489,175 1,934,047 6.5%Military Personnel, Marine Corps 5,412 1,127,909 1,133,321 13,553,520 6,709 14,693,550 13,478,505 91.7% -44,769 -37,029 1,126,164 7.7%Reserve Personnel, Navy 0 189,590 189,590 1,870,790 5,504 2,065,884 1,886,124 91.3% -2,441 -68,788 104,179 5.0%Reserve Personnel, Marine Corps 0 56,777 56,777 705,437 423 762,637 711,399 93.3% -1,172 10,778 60,480 7.9%Medicare-Eligible, Navy 0 -4 -4 1,298,063 0 1,298,059 1,298,059 100.0% 0 0 0 0.0%Medicare-Eligible, Marine Corps 0 0 0 779,061 0 779,061 779,061 100.0% 0 0 0 0.0%Medicare-Eligible, Navy Reserve 0 0 0 147,812 0 147,812 147,812 100.0% 0 0 0 0.0%Medicare-Eligible, Marine Corps Reserve 0 0 0 89,108 0 89,108 89,108 100.0% 0 0 0 0.0%Total 6,787 3,700,397 3,707,184 45,992,906 22,320 49,722,410 45,646,154 91.8% -243,989 -584,214 3,224,870 6.5%
Operation & MaintenanceOper. & Maint., Navy 42 16,793,174 16,793,216 45,616,558 2,325,473 64,735,247 43,701,419 67.5% -1,199,948 -635,933 18,304,961 28.3%Oper. & Maint., Navy RA 0 43,192 43,192 0 0 43,192 17,577 40.7% 0 -11,492 14,123 32.7%Oper. & Maint., Marine Corps 121 5,018,916 5,019,037 8,658,018 83,388 13,760,443 8,645,609 62.8% -47,854 -269,067 4,736,339 34.4%Oper. & Maint., Marine Corps RA 0 207 207 0 0 207 -13 -6.3% 0 -72 135 65.2%Oper. & Maint., Navy Reserve 0 449,448 449,448 1,214,299 1,248 1,664,995 1,140,241 68.5% -5,477 -51,250 467,607 28.1%Oper. & Maint., Navy Reserve RA 0 500 500 0 0 500 6 1.2% 0 6 500 100.0%Oper. & Maint., Marine Corps Res. 0 186,424 186,424 268,036 99 454,559 249,348 54.9% -215 -10,257 194,645 42.8%Oper. & Maint., Marine Corps Res. RA 0 3 3 0 0 3 0 0.0% 0 -3 0 0.0%Environmental Restoration Fund 2 0 2 0 0 2 -13,580 0.0% 0 0 13,582 0.0%Kaho'olawe Is Conv, Rm Env Res 14 360 374 0 0 374 0 0.0% 0 0 374 100.0%Paymnt to Kaho'olawe Island Fd 43 -3 40 0 0 40 0 0.0% 0 0 40 100.0%Ship Modern, Ops, and Sustain Fund 2,098,956 0 2,098,956 118,200 -178,956 2,038,200 0 0.0% 0 0 2,038,200 100.0%Total 2,099,178 22,492,221 24,591,399 55,875,111 2,231,252 82,697,762 53,740,607 65.0% -1,253,494 -978,068 25,770,506 31.2%
ProcurementAPN 4,854,462 24,031,909 28,886,371 16,523,004 -21,876 45,387,499 17,111,087 37.7% -31,739 -199,697 28,044,975 61.8%WPN 662,546 5,026,624 5,689,170 3,002,023 -45,344 8,645,849 2,945,705 34.1% -38,177 13,592 5,673,915 65.6%SCN 9,627,178 29,305,361 38,932,539 15,231,364 285,671 54,449,574 13,596,869 25.0% -598,914 -10,432 40,228,273 73.9%PANMC 201,317 1,911,186 2,112,503 719,042 -542 2,831,003 893,499 31.6% -6,256 -5,429 1,923,693 68.0%OPN 2,051,021 6,697,245 8,748,266 5,416,645 -698 14,164,213 5,434,164 38.4% -51,855 -69,506 8,589,150 60.6%PMC 1,563,967 2,330,973 3,894,940 1,329,843 -8,819 5,215,964 1,947,044 37.3% -67,663 -67,863 3,133,394 60.1%CDAN 3,391 52,861 56,252 0 0 56,252 0 0.0% 0 0 56,252 100.0%Total 18,963,882 69,356,159 88,320,041 42,221,921 208,392 130,750,354 41,928,368 32.1% -794,604 -339,335 87,649,652 67.0%
Research & DevelopmentRDTEN 2,127,116 9,840,971 11,968,087 15,028,523 67,381 27,063,991 15,496,853 57.3% -50,902 -217,260 11,275,620 41.7%RDTEN, RA 0 1,139 1,139 0 0 1,139 2 0.2% 0 0 1,137 99.8%Total 2,127,116 9,842,110 11,969,226 15,028,523 67,381 27,065,130 15,496,855 57.3% -50,902 -217,260 11,276,757 41.7%
Military ConstructionMCN 2,486,101 3,027,590 5,513,691 1,617,690 17,574 7,148,955 1,847,065 25.8% -14,363 8,895 5,279,448 73.8%MCNR 60,889 42,130 103,019 29,000 0 132,019 27,483 20.8% -3,276 -26 101,232 76.7%MCN, RA 0 752 752 0 0 752 299 39.8% 0 0 453 60.2%FHCON 231,299 115,232 346,531 73,407 -38,000 381,938 59,501 15.6% -2,614 1,244 321,067 84.1%FHOPS 0 175,317 175,317 379,444 8,454 563,215 302,776 53.8% -53,201 -37,826 165,973 29.5%Base Realgn & Cl, N 42,865 280,012 322,877 0 -45,693 277,184 165,261 59.6% 0 0 111,922 40.4%BRCV 85,764 146,446 232,210 0 -91,304 140,906 44,669 31.7% 0 0 96,237 68.3%BRAC Consolidated 0 0 0 144,580 59,521 204,101 5,389 2.6% 0 0 103,651 50.8%FORD IS IMP ACCT 92 0 92 8 0 100 0 0.0% 0 0 100 100.0%Total 2,907,010 3,787,479 6,694,489 2,244,129 -89,448 8,849,170 2,452,443 27.7% -73,454 -27,713 6,180,083 69.8%
Revolving & Mgmt FundsWorking Capital Fund, Navy 3,635,288 -876,937 2,758,351 2,219,080 -442,000 4,535,431 282,625 6.2% -1,166,468 0 3,086,338 68.0%National Defense Sealift Fund 177,183 490,407 667,590 573,213 0 1,240,803 811,033 65.4% 0 0 429,771 34.6%Total 3,812,471 -386,530 3,425,941 2,792,293 -442,000 5,776,234 1,093,658 18.9% -1,166,468 0 3,516,109 60.9%
Deduct For Offsetting RCPTSOffsetting Receipts 0 0 0 -217,000 0 -217,000 -217,000 100.0% 0 0 0 0.0%
Trust FundsUSN Academy Gift & Museum Fund 13,049 3,126 16,175 10,288 0 26,463 9,641 36.4% 0 0 16,822 63.6%Navy General Gift Fund 5,261 3,480 8,741 1,537 0 10,278 1,850 18.0% 0 0 8,428 82.0%Ships Stores Profit, Navy 2,415 0 2,415 10,475 0 12,890 10,352 80.3% 0 0 2,538 19.7%Total 20,725 6,606 27,331 22,300 0 49,631 21,843 44.0% 0 0 27,788 56.0%
Interfund TransactionsProfits Sales of Ships Stores, Navy 0 0 0 -10,000 0 -10,000 -10,000 100.0% 0 0 0 0.0%
Total, DON 29,937,169 108,798,442 138,735,611 163,950,183 1,997,897 304,683,691 160,152,928 52.6% -3,582,911 -2,146,590 137,645,765 45.2%
NOTE: FY14 includes supplemental funding.
Department of the NavyFY 2016 Budget Estimates
Unexpended Balances, New Expendable Resources, and Outlays - FY 2014 - Actual(in Thousands of Dollars)
5.8

Lapses &Unobligated Obligated Total Authority Transfers & Unexpended
Balance Balance Total Available Outlays Redemption Adjustments Balances CarryoverBrought Brought Unexpended Budget Balance for Total as a % of in Current in Expired Carried as a % ofForward Forward Balance Authority Transfers Expenditure Outlays Available Accounts Accounts Forward Available
Military PersonnelMilitary Personnel, Navy 311 1,933,736 1,934,047 27,785,366 0 29,719,413 27,842,098 93.7% 0 0 1,877,315 6.3%Military Personnel, Marine Corps 212 1,125,952 1,126,164 13,232,242 0 14,358,406 13,447,909 93.7% 0 0 910,497 6.3%Reserve Personnel, Navy 0 104,179 104,179 1,849,877 0 1,954,056 1,833,136 93.8% 0 0 120,920 6.2%Reserve Personnel, Marine Corps 0 60,480 60,480 665,493 0 725,973 678,983 93.5% 0 0 46,990 6.5%Medicare-Eligible, Navy 0 0 0 1,312,671 0 1,312,671 1,312,671 100.0% 0 0 0 0.0%Medicare-Eligible, Marine Corps 0 0 0 762,093 0 762,093 762,093 100.0% 0 0 0 0.0%Medicare-Eligible, Navy Reserve 0 0 0 124,898 0 124,898 124,898 100.0% 0 0 0 0.0%Medicare-Eligible, Marine Corps Reserve 0 0 0 73,966 0 73,966 73,966 100.0% 0 0 0 0.0%Total 523 3,224,347 3,224,870 45,806,606 0 49,031,476 46,075,754 94.0% 0 0 2,955,722 6.0%
Operation & MaintenanceOper. & Maint., Navy 42 18,304,919 18,304,961 43,883,865 0 62,188,826 40,899,693 65.8% 0 0 21,289,133 34.2%Oper. & Maint., Navy RA 0 14,123 14,123 0 0 14,123 0 0.0% 0 0 14,123 100.0%Oper. & Maint., Marine Corps 121 4,736,218 4,736,339 7,451,938 0 12,188,277 7,922,783 65.0% 0 0 4,265,494 35.0%Oper. & Maint., Marine Corps RA 0 135 135 0 0 135 0 0.0% 0 0 135 100.0%Oper. & Maint., Navy Reserve 0 467,607 467,607 1,067,076 0 1,534,683 1,140,540 74.3% 0 0 394,143 25.7%Oper. & Maint., Navy Reserve RA 0 500 500 0 0 500 0 0.0% 0 0 500 100.0%Oper. & Maint., Marine Corps Res. 0 194,645 194,645 281,386 0 476,031 291,622 61.3% 0 0 184,409 38.7%Environmental Restoration Fund 13,582 0 13,582 277,294 0 290,876 110,918 38.1% 0 0 179,958 61.9%Kaho'olawe Is Conv, Rm Env Res 10 364 374 0 0 374 0 0.0% 0 0 374 100.0%Paymnt to Kaho'olawe Island Fd 40 0 40 0 0 40 0 0.0% 0 0 40 100.0%Ship Modern, Ops, and Sustain Fund 2,038,200 0 2,038,200 540,000 0 2,578,200 1,416,964 55.0% 0 0 1,161,236 45.0%Total 2,051,995 23,718,511 25,770,506 53,501,559 0 79,272,065 51,782,520 65.3% 0 0 27,489,545 34.7%
ProcurementAPN 6,522,222 21,522,753 28,044,975 15,031,572 0 43,076,547 17,779,382 41.3% 0 0 25,297,165 58.7%WPN 639,049 5,034,866 5,673,915 3,157,642 0 8,831,557 3,567,111 40.4% 0 0 5,264,446 59.6%SCN 9,846,471 30,381,802 40,228,273 15,954,379 0 56,182,652 13,233,410 23.6% 0 0 42,949,242 76.4%PANMC 206,532 1,717,161 1,923,693 828,619 0 2,752,312 827,107 30.1% 0 0 1,925,205 69.9%OPN 1,967,524 6,621,626 8,589,150 6,415,763 0 15,004,913 6,051,343 40.3% 0 0 8,953,570 59.7%PMC 1,115,014 2,018,380 3,133,394 960,581 0 4,093,975 1,861,049 45.5% 0 0 2,232,926 54.5%CDAN 3,391 52,861 56,252 0 0 56,252 20,000 35.6% 0 0 36,252 64.4%Total 20,300,203 67,349,449 87,649,652 42,348,556 0 129,998,208 43,339,402 33.3% 0 0 86,658,806 66.7%
Research & DevelopmentRDTEN 1,564,489 9,711,131 11,275,620 16,506,897 0 27,782,517 15,598,344 56.1% 0 0 12,184,173 43.9%RDTEN, RA 0 1,137 1,137 0 0 1,137 0 0.0% 0 0 1,137 100.0%Total 1,564,489 9,712,268 11,276,757 16,506,897 0 27,783,654 15,598,344 56.1% 0 0 12,185,310 43.9%
Military ConstructionMCN 2,594,510 2,684,938 5,279,448 1,054,637 0 6,334,085 1,916,436 30.3% 0 0 4,417,649 69.7%MCNR 65,622 35,610 101,232 55,504 0 156,736 45,082 28.8% 0 0 111,654 71.2%MCN, RA 0 453 453 0 0 453 0 0.0% 0 0 453 100.0%FHCON 210,854 110,213 321,067 16,412 -95,648 241,831 92,533 38.3% 0 0 149,298 61.7%FHOPS 0 165,973 165,973 354,029 0 520,002 305,293 58.7% 0 0 214,709 41.3%Base Realgn & Cl, N 0 111,922 111,922 0 0 111,922 33,486 29.9% 0 0 78,436 70.1%BRCV 0 96,237 96,237 0 0 96,237 16,678 17.3% 0 0 79,559 82.7%BRAC Consolidated 61,196 42,455 103,651 139,692 0 243,343 58,671 24.1% 0 0 184,672 75.9%FORD IS IMP ACCT 100 0 100 0 0 100 0 0.0% 0 0 100 100.0%Total 2,932,282 3,247,801 6,180,083 1,620,274 -95,648 7,704,709 2,468,179 32.0% 0 0 5,236,530 68.0%
Revolving & Mgmt FundsWorking Capital Fund, Navy 3,265,150 -178,812 3,086,338 0 0 3,086,338 187,859 6.1% 0 0 2,898,479 93.9%National Defense Sealift Fund 45,254 384,517 429,771 485,012 0 914,783 536,923 58.7% 0 0 377,860 41.3%Total 3,310,404 205,705 3,516,109 485,012 0 4,001,121 724,782 18.1% 0 0 3,276,339 81.9%
Deduct For Offsetting RCPTSOffsetting Receipts 0 0 0 -283,000 0 -283,000 -283,000 100.0% 0 0 0 0.0%
Trust FundsUSN Academy Gift & Museum Fund 14,832 1,990 16,822 5,200 0 22,022 5,200 23.6% 0 0 16,822 76.4%Navy General Gift Fund 5,463 2,965 8,428 1,116 0 9,544 1,116 11.7% 0 0 8,428 88.3%Ships Stores Profit, Navy 2,538 0 2,538 11,080 0 13,618 31,080 228.2% 0 0 -17,462 -128.2%Total 22,833 4,955 27,788 17,396 0 45,184 37,396 82.8% 0 0 7,788 17.2%
Interfund TransactionsProfits Sales of Ships Stores, Navy 0 0 0 -20,000 0 -20,000 -20,000 100.0% 0 0 0 0.0%
Total, DON 30,182,729 107,463,036 137,645,765 159,983,300 -95,648 297,533,417 159,723,377 53.7% 0 0 137,810,040 46.3%
NOTE: FY15 and prior includes supplemental funding.
Department of the NavyFY 2016 Budget Estimates
Unexpended Balances, New Expendable Resources, and Outlays - FY 2015 - Estimate(in Thousands of Dollars)
5.9
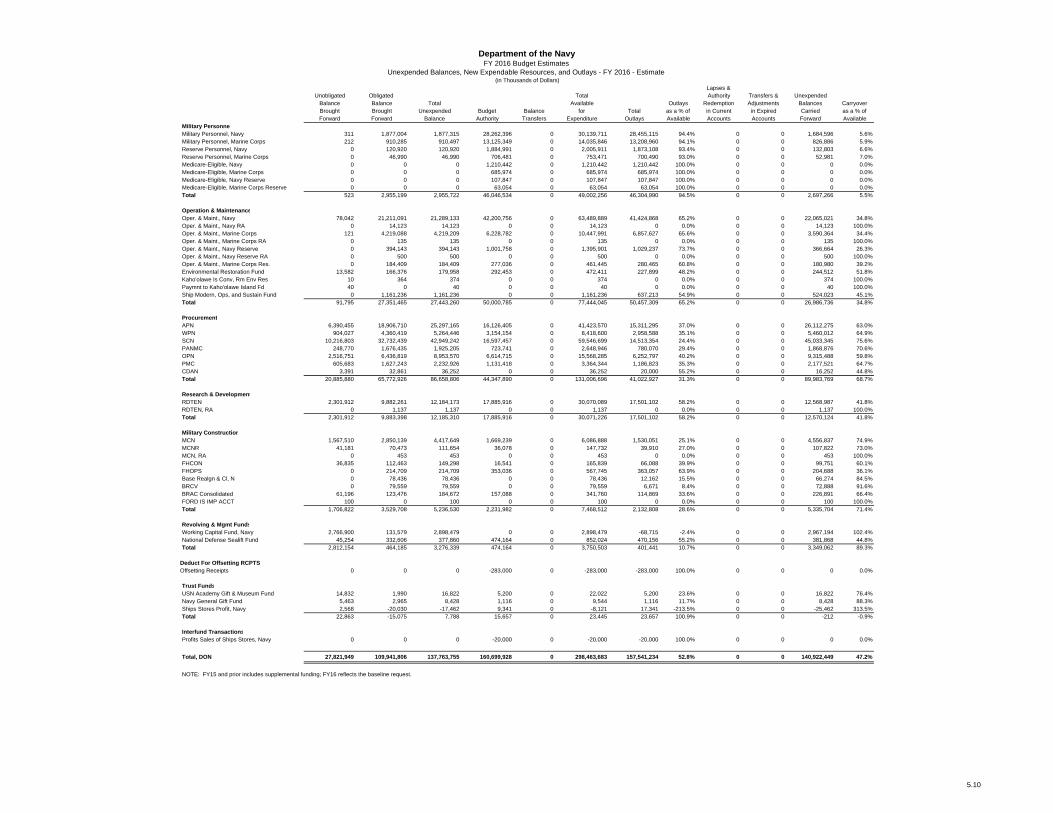
Lapses &Unobligated Obligated Total Authority Transfers & Unexpended
Balance Balance Total Available Outlays Redemption Adjustments Balances CarryoverBrought Brought Unexpended Budget Balance for Total as a % of in Current in Expired Carried as a % ofForward Forward Balance Authority Transfers Expenditure Outlays Available Accounts Accounts Forward Available
Military PersonnelMilitary Personnel, Navy 311 1,877,004 1,877,315 28,262,396 0 30,139,711 28,455,115 94.4% 0 0 1,684,596 5.6%Military Personnel, Marine Corps 212 910,285 910,497 13,125,349 0 14,035,846 13,208,960 94.1% 0 0 826,886 5.9%Reserve Personnel, Navy 0 120,920 120,920 1,884,991 0 2,005,911 1,873,108 93.4% 0 0 132,803 6.6%Reserve Personnel, Marine Corps 0 46,990 46,990 706,481 0 753,471 700,490 93.0% 0 0 52,981 7.0%Medicare-Eligible, Navy 0 0 0 1,210,442 0 1,210,442 1,210,442 100.0% 0 0 0 0.0%Medicare-Eligible, Marine Corps 0 0 0 685,974 0 685,974 685,974 100.0% 0 0 0 0.0%Medicare-Eligible, Navy Reserve 0 0 0 107,847 0 107,847 107,847 100.0% 0 0 0 0.0%Medicare-Eligible, Marine Corps Reserve 0 0 0 63,054 0 63,054 63,054 100.0% 0 0 0 0.0%Total 523 2,955,199 2,955,722 46,046,534 0 49,002,256 46,304,990 94.5% 0 0 2,697,266 5.5%
Operation & MaintenanceOper. & Maint., Navy 78,042 21,211,091 21,289,133 42,200,756 0 63,489,889 41,424,868 65.2% 0 0 22,065,021 34.8%Oper. & Maint., Navy RA 0 14,123 14,123 0 0 14,123 0 0.0% 0 0 14,123 100.0%Oper. & Maint., Marine Corps 121 4,219,088 4,219,209 6,228,782 0 10,447,991 6,857,627 65.6% 0 0 3,590,364 34.4%Oper. & Maint., Marine Corps RA 0 135 135 0 0 135 0 0.0% 0 0 135 100.0%Oper. & Maint., Navy Reserve 0 394,143 394,143 1,001,758 0 1,395,901 1,029,237 73.7% 0 0 366,664 26.3%Oper. & Maint., Navy Reserve RA 0 500 500 0 0 500 0 0.0% 0 0 500 100.0%Oper. & Maint., Marine Corps Res. 0 184,409 184,409 277,036 0 461,445 280,465 60.8% 0 0 180,980 39.2%Environmental Restoration Fund 13,582 166,376 179,958 292,453 0 472,411 227,899 48.2% 0 0 244,512 51.8%Kaho'olawe Is Conv, Rm Env Res 10 364 374 0 0 374 0 0.0% 0 0 374 100.0%Paymnt to Kaho'olawe Island Fd 40 0 40 0 0 40 0 0.0% 0 0 40 100.0%Ship Modern, Ops, and Sustain Fund 0 1,161,236 1,161,236 0 0 1,161,236 637,213 54.9% 0 0 524,023 45.1%Total 91,795 27,351,465 27,443,260 50,000,785 0 77,444,045 50,457,309 65.2% 0 0 26,986,736 34.8%
ProcurementAPN 6,390,455 18,906,710 25,297,165 16,126,405 0 41,423,570 15,311,295 37.0% 0 0 26,112,275 63.0%WPN 904,027 4,360,419 5,264,446 3,154,154 0 8,418,600 2,958,588 35.1% 0 0 5,460,012 64.9%SCN 10,216,803 32,732,439 42,949,242 16,597,457 0 59,546,699 14,513,354 24.4% 0 0 45,033,345 75.6%PANMC 248,770 1,676,435 1,925,205 723,741 0 2,648,946 780,070 29.4% 0 0 1,868,876 70.6%OPN 2,516,751 6,436,819 8,953,570 6,614,715 0 15,568,285 6,252,797 40.2% 0 0 9,315,488 59.8%PMC 605,683 1,627,243 2,232,926 1,131,418 0 3,364,344 1,186,823 35.3% 0 0 2,177,521 64.7%CDAN 3,391 32,861 36,252 0 0 36,252 20,000 55.2% 0 0 16,252 44.8%Total 20,885,880 65,772,926 86,658,806 44,347,890 0 131,006,696 41,022,927 31.3% 0 0 89,983,769 68.7%
Research & DevelopmentRDTEN 2,301,912 9,882,261 12,184,173 17,885,916 0 30,070,089 17,501,102 58.2% 0 0 12,568,987 41.8%RDTEN, RA 0 1,137 1,137 0 0 1,137 0 0.0% 0 0 1,137 100.0%Total 2,301,912 9,883,398 12,185,310 17,885,916 0 30,071,226 17,501,102 58.2% 0 0 12,570,124 41.8%
Military ConstructionMCN 1,567,510 2,850,139 4,417,649 1,669,239 0 6,086,888 1,530,051 25.1% 0 0 4,556,837 74.9%MCNR 41,181 70,473 111,654 36,078 0 147,732 39,910 27.0% 0 0 107,822 73.0%MCN, RA 0 453 453 0 0 453 0 0.0% 0 0 453 100.0%FHCON 36,835 112,463 149,298 16,541 0 165,839 66,088 39.9% 0 0 99,751 60.1%FHOPS 0 214,709 214,709 353,036 0 567,745 363,057 63.9% 0 0 204,688 36.1%Base Realgn & Cl, N 0 78,436 78,436 0 0 78,436 12,162 15.5% 0 0 66,274 84.5%BRCV 0 79,559 79,559 0 0 79,559 6,671 8.4% 0 0 72,888 91.6%BRAC Consolidated 61,196 123,476 184,672 157,088 0 341,760 114,869 33.6% 0 0 226,891 66.4%FORD IS IMP ACCT 100 0 100 0 0 100 0 0.0% 0 0 100 100.0%Total 1,706,822 3,529,708 5,236,530 2,231,982 0 7,468,512 2,132,808 28.6% 0 0 5,335,704 71.4%
Revolving & Mgmt FundsWorking Capital Fund, Navy 2,766,900 131,579 2,898,479 0 0 2,898,479 -68,715 -2.4% 0 0 2,967,194 102.4%National Defense Sealift Fund 45,254 332,606 377,860 474,164 0 852,024 470,156 55.2% 0 0 381,868 44.8%Total 2,812,154 464,185 3,276,339 474,164 0 3,750,503 401,441 10.7% 0 0 3,349,062 89.3%
Deduct For Offsetting RCPTSOffsetting Receipts 0 0 0 -283,000 0 -283,000 -283,000 100.0% 0 0 0 0.0%
Trust FundsUSN Academy Gift & Museum Fund 14,832 1,990 16,822 5,200 0 22,022 5,200 23.6% 0 0 16,822 76.4%Navy General Gift Fund 5,463 2,965 8,428 1,116 0 9,544 1,116 11.7% 0 0 8,428 88.3%Ships Stores Profit, Navy 2,568 -20,030 -17,462 9,341 0 -8,121 17,341 -213.5% 0 0 -25,462 313.5%Total 22,863 -15,075 7,788 15,657 0 23,445 23,657 100.9% 0 0 -212 -0.9%
Interfund TransactionsProfits Sales of Ships Stores, Navy 0 0 0 -20,000 0 -20,000 -20,000 100.0% 0 0 0 0.0%
Total, DON 27,821,949 109,941,806 137,763,755 160,699,928 0 298,463,683 157,541,234 52.8% 0 0 140,922,449 47.2%
NOTE: FY15 and prior includes supplemental funding; FY16 reflects the baseline request.
Department of the NavyFY 2016 Budget Estimates
Unexpended Balances, New Expendable Resources, and Outlays - FY 2016 - Estimate(in Thousands of Dollars)
5.10

SECTION 6 - SELECTED DON PROGRAM AND SPECIAL INTEREST DATA
o This section contains selected DON program and special interest data of particular pertinence to the budget.
o Selected force and program factors are displayed, such as total number of deployable ships and number ofmilitary personnel.
o Military and civilian end strength levels for FY 1997 to FY 2016 are provided.
o Ship and Aircraft force and acquisition histories are displayed.
o The following special interest table is also included:
- DON Future Year Defense Program major force Program aggregations.
6.1
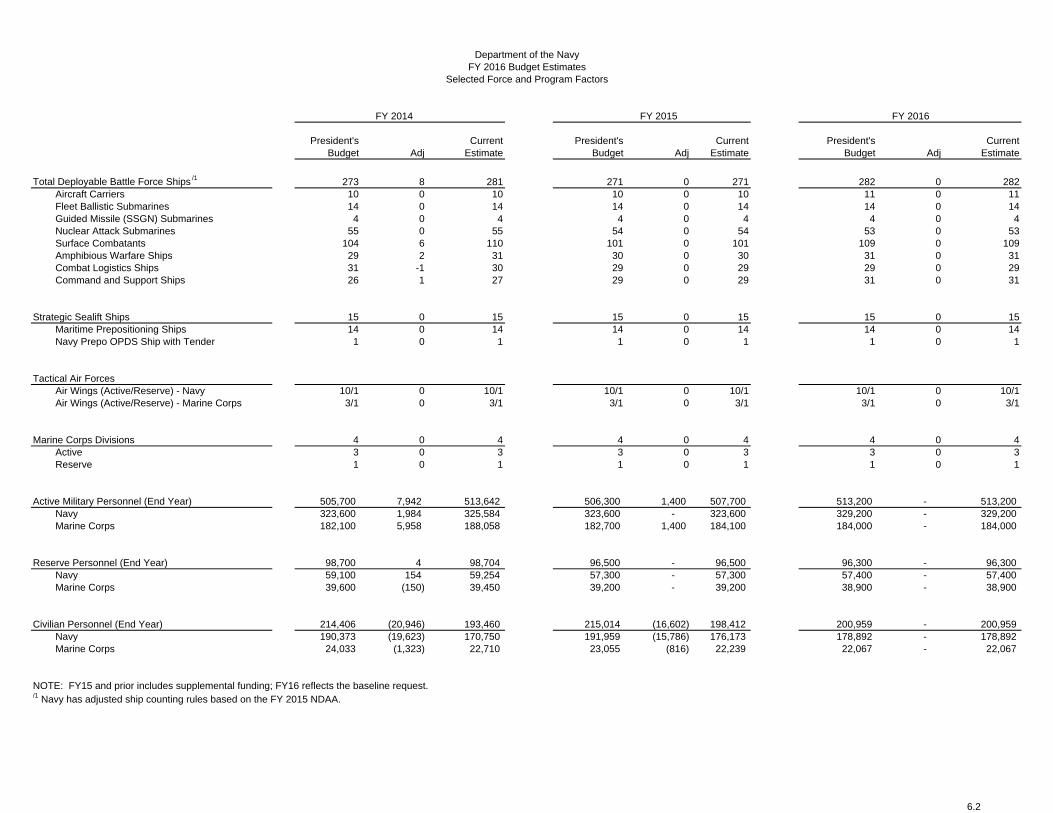
FY 2014 FY 2015 FY 2016
President's Current President's Current President's CurrentBudget Adj Estimate Budget Adj Estimate Budget Adj Estimate
Total Deployable Battle Force Ships /1 273 8 281 271 0 271 282 0 282Aircraft Carriers 10 0 10 10 0 10 11 0 11Fleet Ballistic Submarines 14 0 14 14 0 14 14 0 14Guided Missile (SSGN) Submarines 4 0 4 4 0 4 4 0 4Nuclear Attack Submarines 55 0 55 54 0 54 53 0 53Surface Combatants 104 6 110 101 0 101 109 0 109Amphibious Warfare Ships 29 2 31 30 0 30 31 0 31Combat Logistics Ships 31 -1 30 29 0 29 29 0 29Command and Support Ships 26 1 27 29 0 29 31 0 31
Strategic Sealift Ships 15 0 15 15 0 15 15 0 15Maritime Prepositioning Ships 14 0 14 14 0 14 14 0 14Navy Prepo OPDS Ship with Tender 1 0 1 1 0 1 1 0 1
Tactical Air ForcesAir Wings (Active/Reserve) - Navy 10/1 0 10/1 10/1 0 10/1 10/1 0 10/1Air Wings (Active/Reserve) - Marine Corps 3/1 0 3/1 3/1 0 3/1 3/1 0 3/1
Marine Corps Divisions 4 0 4 4 0 4 4 0 4Active 3 0 3 3 0 3 3 0 3Reserve 1 0 1 1 0 1 1 0 1
Active Military Personnel (End Year) 505,700 7,942 513,642 506,300 1,400 507,700 513,200 - 513,200 Navy 323,600 1,984 325,584 323,600 - 323,600 329,200 - 329,200 Marine Corps 182,100 5,958 188,058 182,700 1,400 184,100 184,000 - 184,000
Reserve Personnel (End Year) 98,700 4 98,704 96,500 - 96,500 96,300 - 96,300 Navy 59,100 154 59,254 57,300 - 57,300 57,400 - 57,400 Marine Corps 39,600 (150) 39,450 39,200 - 39,200 38,900 - 38,900
Civilian Personnel (End Year) 214,406 (20,946) 193,460 215,014 (16,602) 198,412 200,959 - 200,959 Navy 190,373 (19,623) 170,750 191,959 (15,786) 176,173 178,892 - 178,892 Marine Corps 24,033 (1,323) 22,710 23,055 (816) 22,239 22,067 - 22,067
NOTE: FY15 and prior includes supplemental funding; FY16 reflects the baseline request./1 Navy has adjusted ship counting rules based on the FY 2015 NDAA.
Department of the NavyFY 2016 Budget Estimates
Selected Force and Program Factors
6.2
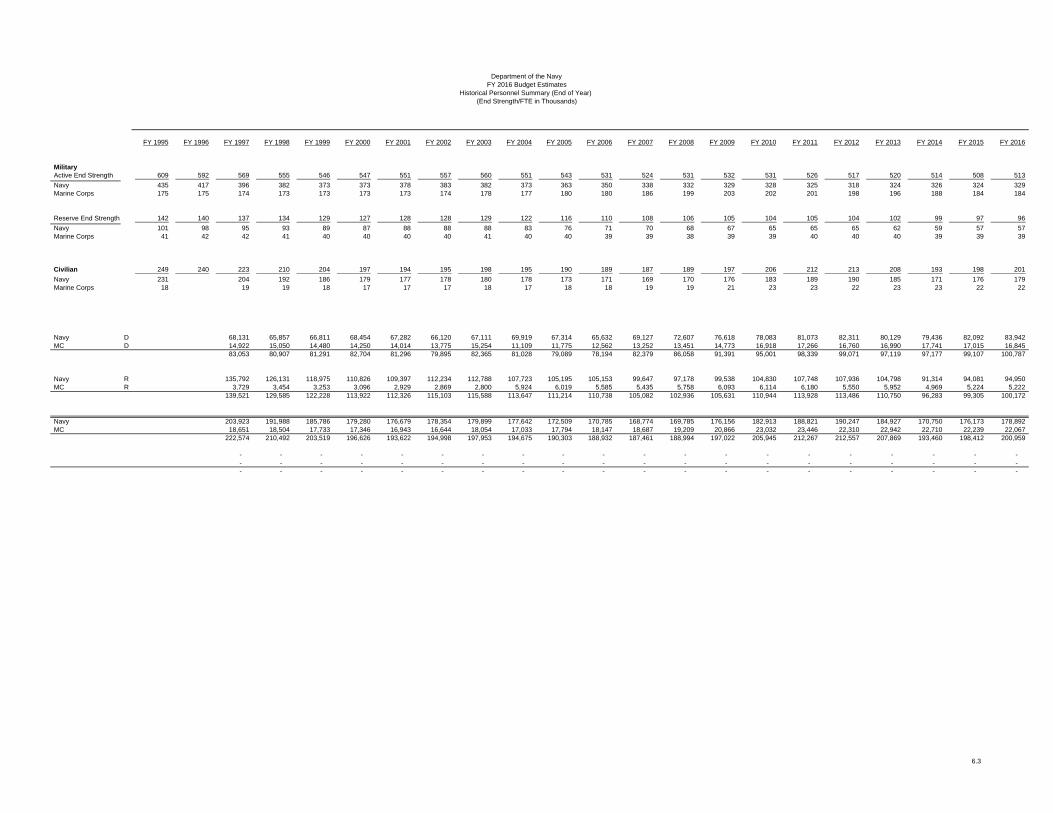
FY 1995 FY 1996 FY 1997 FY 1998 FY 1999 FY 2000 FY 2001 FY 2002 FY 2003 FY 2004 FY 2005 FY 2006 FY 2007 FY 2008 FY 2009 FY 2010 FY 2011 FY 2012 FY 2013 FY 2014 FY 2015 FY 2016
MilitaryActive End Strength 609 592 569 555 546 547 551 557 560 551 543 531 524 531 532 531 526 517 520 514 508 513 Navy 435 417 396 382 373 373 378 383 382 373 363 350 338 332 329 328 325 318 324 326 324 329 Marine Corps 175 175 174 173 173 173 173 174 178 177 180 180 186 199 203 202 201 198 196 188 184 184
Reserve End Strength 142 140 137 134 129 127 128 128 129 122 116 110 108 106 105 104 105 104 102 99 97 96 Navy 101 98 95 93 89 87 88 88 88 83 76 71 70 68 67 65 65 65 62 59 57 57 Marine Corps 41 42 42 41 40 40 40 40 41 40 40 39 39 38 39 39 40 40 40 39 39 39
Civilian 249 240 223 210 204 197 194 195 198 195 190 189 187 189 197 206 212 213 208 193 198 201 Navy 231 204 192 186 179 177 178 180 178 173 171 169 170 176 183 189 190 185 171 176 179 Marine Corps 18 19 19 18 17 17 17 18 17 18 18 19 19 21 23 23 22 23 23 22 22
Navy D 68,131 65,857 66,811 68,454 67,282 66,120 67,111 69,919 67,314 65,632 69,127 72,607 76,618 78,083 81,073 82,311 80,129 79,436 82,092 83,942 MC D 14,922 15,050 14,480 14,250 14,014 13,775 15,254 11,109 11,775 12,562 13,252 13,451 14,773 16,918 17,266 16,760 16,990 17,741 17,015 16,845
83,053 80,907 81,291 82,704 81,296 79,895 82,365 81,028 79,089 78,194 82,379 86,058 91,391 95,001 98,339 99,071 97,119 97,177 99,107 100,787
Navy R 135,792 126,131 118,975 110,826 109,397 112,234 112,788 107,723 105,195 105,153 99,647 97,178 99,538 104,830 107,748 107,936 104,798 91,314 94,081 94,950 MC R 3,729 3,454 3,253 3,096 2,929 2,869 2,800 5,924 6,019 5,585 5,435 5,758 6,093 6,114 6,180 5,550 5,952 4,969 5,224 5,222
139,521 129,585 122,228 113,922 112,326 115,103 115,588 113,647 111,214 110,738 105,082 102,936 105,631 110,944 113,928 113,486 110,750 96,283 99,305 100,172
Navy 203,923 191,988 185,786 179,280 176,679 178,354 179,899 177,642 172,509 170,785 168,774 169,785 176,156 182,913 188,821 190,247 184,927 170,750 176,173 178,892 MC 18,651 18,504 17,733 17,346 16,943 16,644 18,054 17,033 17,794 18,147 18,687 19,209 20,866 23,032 23,446 22,310 22,942 22,710 22,239 22,067
222,574 210,492 203,519 196,626 193,622 194,998 197,953 194,675 190,303 188,932 187,461 188,994 197,022 205,945 212,267 212,557 207,869 193,460 198,412 200,959
- - - - - - - - - - - - - - - - - - - - - - - - - - - - - - - - - - - - - - - - - - - - - - - - - - - - - - - - - - - -
Department of the NavyFY 2016 Budget Estimates
Historical Personnel Summary (End of Year) (End Strength/FTE in Thousands)
6.3

FY 1997 FY 1998 FY 1999 FY 2000 FY 2001 FY 2002 FY 2003 FY 2004 FY 2005 FY 2006 FY 2007 FY 2008 FY 2009 FY 2010 FY 2011 FY 2012 FY 2013 FY 2014 FY 2015 FY 2016
Active End Strength 569,470 555,480 545,687 546,514 550,744 556,841 560,014 550,677 542,970 530,613 524,039 530,733 532,090 530,744 526,280 516,599 519,608 513,642 507,700 513,200 Navy 395,564 382,338 373,046 373,193 377,810 383,108 382,235 373,197 362,941 350,197 337,547 332,228 329,304 328,303 325,123 318,406 323,951 325,584 323,600 329,200 Marine Corps 173,906 173,142 172,641 173,321 172,934 173,733 177,779 177,480 180,029 180,416 186,492 198,505 202,786 202,441 201,157 198,193 195,657 188,058 184,100 184,000
Reserve End Strength 137,314 134,013 129,125 126,600 127,723 127,863 129,202 122,216 116,331 109,986 108,490 105,659 105,018 104,228 104,564 104,259 102,086 98,704 96,500 96,300 Navy 95,317 93,171 89,172 86,933 87,913 87,958 88,156 82,558 76,473 70,500 69,933 68,136 66,508 65,006 64,792 64,715 62,444 59,254 57,300 57,400 Marine Corps 41,997 40,842 39,953 39,667 39,810 39,905 41,046 39,658 39,858 39,486 38,557 37,523 38,510 39,222 39,772 39,544 39,642 39,450 39,200 38,900
Direct Funded FTE 83,053 80,907 81,291 82,704 81,296 79,895 82,365 81,028 79,089 78,194 82,379 86,058 91,391 95,001 98,339 99,071 97,119 97,177 99,107 100,787 Navy 68,131 65,857 66,811 68,454 67,282 66,120 67,111 69,919 67,314 65,632 69,127 72,607 76,618 78,083 81,073 82,311 80,129 79,436 82,092 83,942 Marine Corps 14,922 15,050 14,480 14,250 14,014 13,775 15,254 11,109 11,775 12,562 13,252 13,451 14,773 16,918 17,266 16,760 16,990 17,741 17,015 16,845
Reimbursable Funded FTE 139,521 129,585 122,228 113,922 112,326 115,103 115,588 113,647 111,214 110,738 105,082 102,936 105,631 110,944 113,928 113,486 110,750 96,283 99,305 100,172 Navy 135,792 126,131 118,975 110,826 109,397 112,234 112,788 107,723 105,195 105,153 99,647 97,178 99,538 104,830 107,748 107,936 104,798 91,314 94,081 94,950 Marine Corps 3,729 3,454 3,253 3,096 2,929 2,869 2,800 5,924 6,019 5,585 5,435 5,758 6,093 6,114 6,180 5,550 5,952 4,969 5,224 5,222
TOTAL FTE 222,574 210,492 203,519 196,626 193,622 194,998 197,953 194,675 190,303 188,932 187,461 188,994 197,022 205,945 212,267 212,557 207,869 193,460 198,412 200,959 Navy 203,923 191,988 185,786 179,280 176,679 178,354 179,899 177,642 172,509 170,785 168,774 169,785 176,156 182,913 188,821 190,247 184,927 170,750 176,173 178,892 Marine Corps 18,651 18,504 17,733 17,346 16,943 16,644 18,054 17,033 17,794 18,147 18,687 19,209 20,866 23,032 23,446 22,310 22,942 22,710 22,239 22,067
NOTE: FY15 and prior includes supplemental funding; FY16 reflects the baseline request.
Civilian
Department of the NavyFY 2016 Budget Estimates
Historical Personnel Summary (End of Year) (End Strength/FTE)
Military
Page 2 of 2 6.3
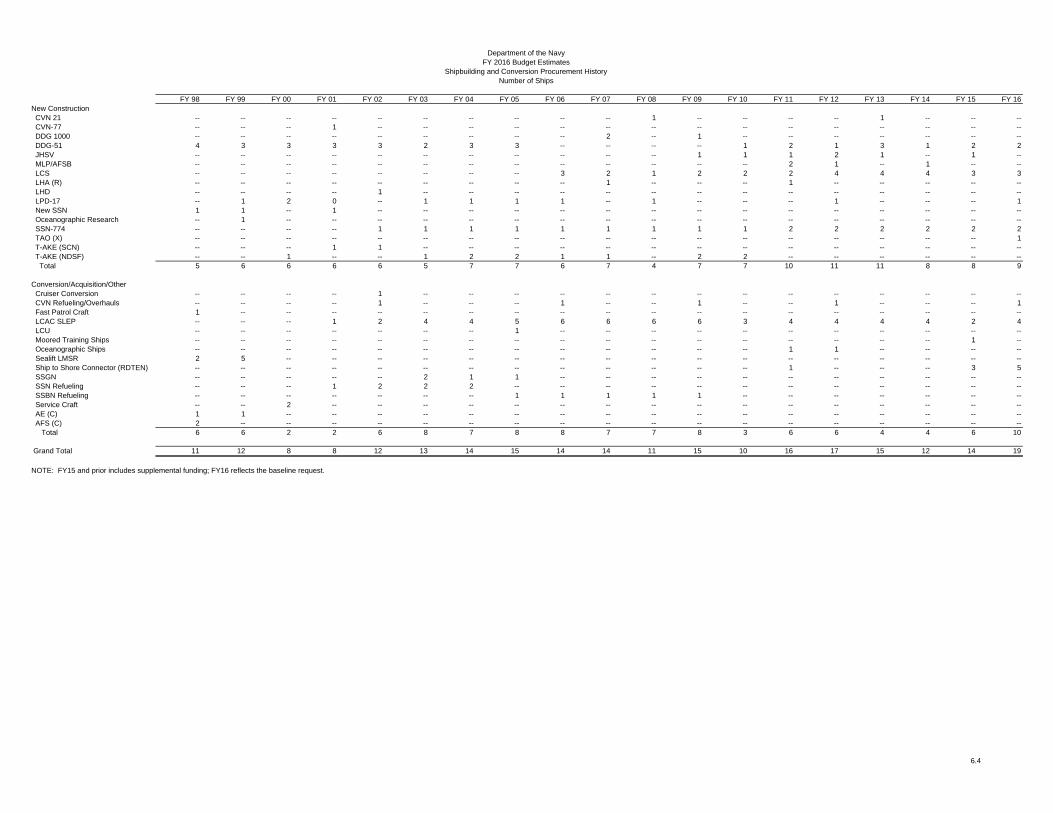
FY 98 FY 99 FY 00 FY 01 FY 02 FY 03 FY 04 FY 05 FY 06 FY 07 FY 08 FY 09 FY 10 FY 11 FY 12 FY 13 FY 14 FY 15 FY 16New Construction CVN 21 -- -- -- -- -- -- -- -- -- -- 1 -- -- -- -- 1 -- -- -- CVN-77 -- -- -- 1 -- -- -- -- -- -- -- -- -- -- -- -- -- -- -- DDG 1000 -- -- -- -- -- -- -- -- -- 2 -- 1 -- -- -- -- -- -- -- DDG-51 4 3 3 3 3 2 3 3 -- -- -- -- 1 2 1 3 1 2 2 JHSV -- -- -- -- -- -- -- -- -- -- -- 1 1 1 2 1 -- 1 -- MLP/AFSB -- -- -- -- -- -- -- -- -- -- -- -- -- 2 1 -- 1 -- -- LCS -- -- -- -- -- -- -- -- 3 2 1 2 2 2 4 4 4 3 3 LHA (R) -- -- -- -- -- -- -- -- -- 1 -- -- -- 1 -- -- -- -- -- LHD -- -- -- -- 1 -- -- -- -- -- -- -- -- -- -- -- -- -- -- LPD-17 -- 1 2 0 -- 1 1 1 1 -- 1 -- -- -- 1 -- -- -- 1 New SSN 1 1 -- 1 -- -- -- -- -- -- -- -- -- -- -- -- -- -- -- Oceanographic Research -- 1 -- -- -- -- -- -- -- -- -- -- -- -- -- -- -- -- -- SSN-774 -- -- -- -- 1 1 1 1 1 1 1 1 1 2 2 2 2 2 2 TAO (X) -- -- -- -- -- -- -- -- -- -- -- -- -- -- -- -- -- -- 1 T-AKE (SCN) -- -- -- 1 1 -- -- -- -- -- -- -- -- -- -- -- -- -- -- T-AKE (NDSF) -- -- 1 -- -- 1 2 2 1 1 -- 2 2 -- -- -- -- -- -- Total 5 6 6 6 6 5 7 7 6 7 4 7 7 10 11 11 8 8 9
Conversion/Acquisition/Other Cruiser Conversion -- -- -- -- 1 -- -- -- -- -- -- -- -- -- -- -- -- -- -- CVN Refueling/Overhauls -- -- -- -- 1 -- -- -- 1 -- -- 1 -- -- 1 -- -- -- 1 Fast Patrol Craft 1 -- -- -- -- -- -- -- -- -- -- -- -- -- -- -- -- -- -- LCAC SLEP -- -- -- 1 2 4 4 5 6 6 6 6 3 4 4 4 4 2 4 LCU -- -- -- -- -- -- -- 1 -- -- -- -- -- -- -- -- -- -- -- Moored Training Ships -- -- -- -- -- -- -- -- -- -- -- -- -- -- -- -- -- 1 -- Oceanographic Ships -- -- -- -- -- -- -- -- -- -- -- -- -- 1 1 -- -- -- -- Sealift LMSR 2 5 -- -- -- -- -- -- -- -- -- -- -- -- -- -- -- -- -- Ship to Shore Connector (RDTEN) -- -- -- -- -- -- -- -- -- -- -- -- -- 1 -- -- -- 3 5 SSGN -- -- -- -- -- 2 1 1 -- -- -- -- -- -- -- -- -- -- -- SSN Refueling -- -- -- 1 2 2 2 -- -- -- -- -- -- -- -- -- -- -- -- SSBN Refueling -- -- -- -- -- -- -- 1 1 1 1 1 -- -- -- -- -- -- -- Service Craft -- -- 2 -- -- -- -- -- -- -- -- -- -- -- -- -- -- -- -- AE (C) 1 1 -- -- -- -- -- -- -- -- -- -- -- -- -- -- -- -- -- AFS (C) 2 -- -- -- -- -- -- -- -- -- -- -- -- -- -- -- -- -- -- Total 6 6 2 2 6 8 7 8 8 7 7 8 3 6 6 4 4 6 10
Grand Total 11 12 8 8 12 13 14 15 14 14 11 15 10 16 17 15 12 14 19
NOTE: FY15 and prior includes supplemental funding; FY16 reflects the baseline request.
Department of the NavyFY 2016 Budget Estimates
Shipbuilding and Conversion Procurement HistoryNumber of Ships
6.4
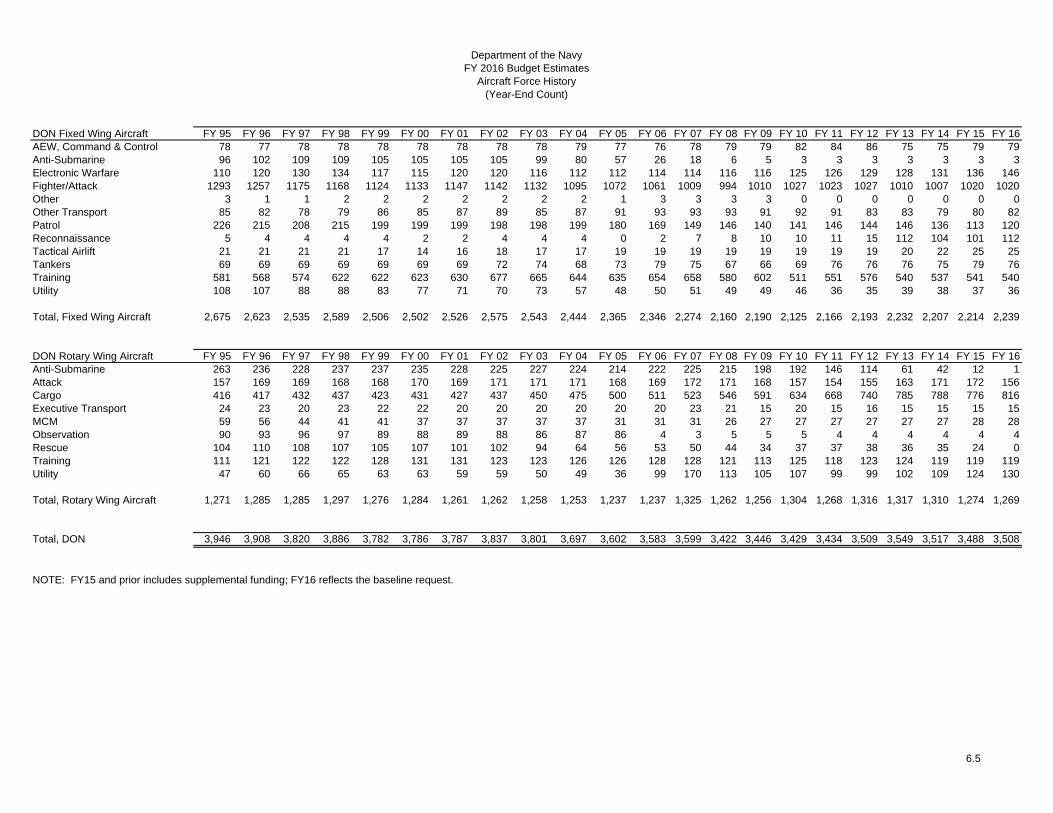
DON Fixed Wing Aircraft FY 95 FY 96 FY 97 FY 98 FY 99 FY 00 FY 01 FY 02 FY 03 FY 04 FY 05 FY 06 FY 07 FY 08 FY 09 FY 10 FY 11 FY 12 FY 13 FY 14 FY 15 FY 16AEW, Command & Control 78 77 78 78 78 78 78 78 78 79 77 76 78 79 79 82 84 86 75 75 79 79Anti-Submarine 96 102 109 109 105 105 105 105 99 80 57 26 18 6 5 3 3 3 3 3 3 3Electronic Warfare 110 120 130 134 117 115 120 120 116 112 112 114 114 116 116 125 126 129 128 131 136 146Fighter/Attack 1293 1257 1175 1168 1124 1133 1147 1142 1132 1095 1072 1061 1009 994 1010 1027 1023 1027 1010 1007 1020 1020Other 3 1 1 2 2 2 2 2 2 2 1 3 3 3 3 0 0 0 0 0 0 0Other Transport 85 82 78 79 86 85 87 89 85 87 91 93 93 93 91 92 91 83 83 79 80 82Patrol 226 215 208 215 199 199 199 198 198 199 180 169 149 146 140 141 146 144 146 136 113 120Reconnaissance 5 4 4 4 4 2 2 4 4 4 0 2 7 8 10 10 11 15 112 104 101 112Tactical Airlift 21 21 21 21 17 14 16 18 17 17 19 19 19 19 19 19 19 19 20 22 25 25Tankers 69 69 69 69 69 69 69 72 74 68 73 79 75 67 66 69 76 76 76 75 79 76Training 581 568 574 622 622 623 630 677 665 644 635 654 658 580 602 511 551 576 540 537 541 540Utility 108 107 88 88 83 77 71 70 73 57 48 50 51 49 49 46 36 35 39 38 37 36
Total, Fixed Wing Aircraft 2,675 2,623 2,535 2,589 2,506 2,502 2,526 2,575 2,543 2,444 2,365 2,346 2,274 2,160 2,190 2,125 2,166 2,193 2,232 2,207 2,214 2,239
DON Rotary Wing Aircraft FY 95 FY 96 FY 97 FY 98 FY 99 FY 00 FY 01 FY 02 FY 03 FY 04 FY 05 FY 06 FY 07 FY 08 FY 09 FY 10 FY 11 FY 12 FY 13 FY 14 FY 15 FY 16Anti-Submarine 263 236 228 237 237 235 228 225 227 224 214 222 225 215 198 192 146 114 61 42 12 1Attack 157 169 169 168 168 170 169 171 171 171 168 169 172 171 168 157 154 155 163 171 172 156Cargo 416 417 432 437 423 431 427 437 450 475 500 511 523 546 591 634 668 740 785 788 776 816Executive Transport 24 23 20 23 22 22 20 20 20 20 20 20 23 21 15 20 15 16 15 15 15 15MCM 59 56 44 41 41 37 37 37 37 37 31 31 31 26 27 27 27 27 27 27 28 28Observation 90 93 96 97 89 88 89 88 86 87 86 4 3 5 5 5 4 4 4 4 4 4Rescue 104 110 108 107 105 107 101 102 94 64 56 53 50 44 34 37 37 38 36 35 24 0Training 111 121 122 122 128 131 131 123 123 126 126 128 128 121 113 125 118 123 124 119 119 119Utility 47 60 66 65 63 63 59 59 50 49 36 99 170 113 105 107 99 99 102 109 124 130
Total, Rotary Wing Aircraft 1,271 1,285 1,285 1,297 1,276 1,284 1,261 1,262 1,258 1,253 1,237 1,237 1,325 1,262 1,256 1,304 1,268 1,316 1,317 1,310 1,274 1,269
Total, DON 3,946 3,908 3,820 3,886 3,782 3,786 3,787 3,837 3,801 3,697 3,602 3,583 3,599 3,422 3,446 3,429 3,434 3,509 3,549 3,517 3,488 3,508
Department of the NavyFY 2016 Budget Estimates
Aircraft Force History(Year-End Count)
NOTE: FY15 and prior includes supplemental funding; FY16 reflects the baseline request.
6.5
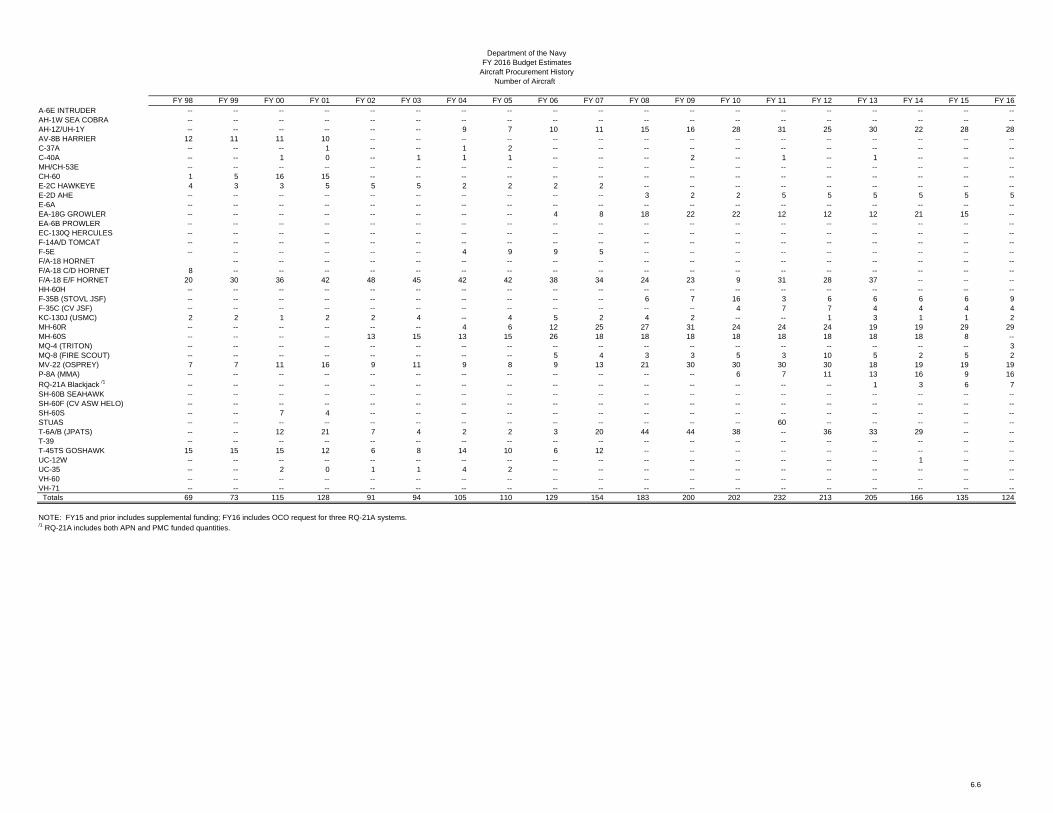
FY 98 FY 99 FY 00 FY 01 FY 02 FY 03 FY 04 FY 05 FY 06 FY 07 FY 08 FY 09 FY 10 FY 11 FY 12 FY 13 FY 14 FY 15 FY 16A-6E INTRUDER -- -- -- -- -- -- -- -- -- -- -- -- -- -- -- -- -- -- --AH-1W SEA COBRA -- -- -- -- -- -- -- -- -- -- -- -- -- -- -- -- -- -- --AH-1Z/UH-1Y -- -- -- -- -- -- 9 7 10 11 15 16 28 31 25 30 22 28 28AV-8B HARRIER 12 11 11 10 -- -- -- -- -- -- -- -- -- -- -- -- -- -- --C-37A -- -- -- 1 -- -- 1 2 -- -- -- -- -- -- -- -- -- -- --C-40A -- -- 1 0 -- 1 1 1 -- -- -- 2 -- 1 -- 1 -- -- --MH/CH-53E -- -- -- -- -- -- -- -- -- -- -- -- -- -- -- -- -- -- --CH-60 1 5 16 15 -- -- -- -- -- -- -- -- -- -- -- -- -- -- --E-2C HAWKEYE 4 3 3 5 5 5 2 2 2 2 -- -- -- -- -- -- -- -- --E-2D AHE -- -- -- -- -- -- -- -- -- -- 3 2 2 5 5 5 5 5 5E-6A -- -- -- -- -- -- -- -- -- -- -- -- -- -- -- -- -- -- --EA-18G GROWLER -- -- -- -- -- -- -- -- 4 8 18 22 22 12 12 12 21 15 --EA-6B PROWLER -- -- -- -- -- -- -- -- -- -- -- -- -- -- -- -- -- -- --EC-130Q HERCULES -- -- -- -- -- -- -- -- -- -- -- -- -- -- -- -- -- -- --F-14A/D TOMCAT -- -- -- -- -- -- -- -- -- -- -- -- -- -- -- -- -- -- --F-5E -- -- -- -- -- -- 4 9 9 5 -- -- -- -- -- -- -- -- --F/A-18 HORNET -- -- -- -- -- -- -- -- -- -- -- -- -- -- -- -- -- --F/A-18 C/D HORNET 8 -- -- -- -- -- -- -- -- -- -- -- -- -- -- -- -- -- --F/A-18 E/F HORNET 20 30 36 42 48 45 42 42 38 34 24 23 9 31 28 37 -- -- --HH-60H -- -- -- -- -- -- -- -- -- -- -- -- -- -- -- -- -- -- --F-35B (STOVL JSF) -- -- -- -- -- -- -- -- -- -- 6 7 16 3 6 6 6 6 9F-35C (CV JSF) -- -- -- -- -- -- -- -- -- -- -- -- 4 7 7 4 4 4 4KC-130J (USMC) 2 2 1 2 2 4 -- 4 5 2 4 2 -- -- 1 3 1 1 2MH-60R -- -- -- -- -- -- 4 6 12 25 27 31 24 24 24 19 19 29 29MH-60S -- -- -- -- 13 15 13 15 26 18 18 18 18 18 18 18 18 8 --MQ-4 (TRITON) -- -- -- -- -- -- -- -- -- -- -- -- -- -- -- -- -- -- 3MQ-8 (FIRE SCOUT) -- -- -- -- -- -- -- -- 5 4 3 3 5 3 10 5 2 5 2MV-22 (OSPREY) 7 7 11 16 9 11 9 8 9 13 21 30 30 30 30 18 19 19 19P-8A (MMA) -- -- -- -- -- -- -- -- -- -- -- -- 6 7 11 13 16 9 16RQ-21A Blackjack /1 -- -- -- -- -- -- -- -- -- -- -- -- -- -- -- 1 3 6 7SH-60B SEAHAWK -- -- -- -- -- -- -- -- -- -- -- -- -- -- -- -- -- -- --SH-60F (CV ASW HELO) -- -- -- -- -- -- -- -- -- -- -- -- -- -- -- -- -- -- --SH-60S -- -- 7 4 -- -- -- -- -- -- -- -- -- -- -- -- -- -- --STUAS -- -- -- -- -- -- -- -- -- -- -- -- -- 60 -- -- -- -- --T-6A/B (JPATS) -- -- 12 21 7 4 2 2 3 20 44 44 38 -- 36 33 29 -- --T-39 -- -- -- -- -- -- -- -- -- -- -- -- -- -- -- -- -- -- --T-45TS GOSHAWK 15 15 15 12 6 8 14 10 6 12 -- -- -- -- -- -- -- -- --UC-12W -- -- -- -- -- -- -- -- -- -- -- -- -- -- -- -- 1 -- --UC-35 -- -- 2 0 1 1 4 2 -- -- -- -- -- -- -- -- -- -- --VH-60 -- -- -- -- -- -- -- -- -- -- -- -- -- -- -- -- -- -- --VH-71 -- -- -- -- -- -- -- -- -- -- -- -- -- -- -- -- -- -- -- Totals 69 73 115 128 91 94 105 110 129 154 183 200 202 232 213 205 166 135 124
NOTE: FY15 and prior includes supplemental funding; FY16 includes OCO request for three RQ-21A systems./1 RQ-21A includes both APN and PMC funded quantities.
Department of the NavyFY 2016 Budget Estimates
Aircraft Procurement HistoryNumber of Aircraft
6.6

Department of the NavyFY 2016 Budget Estimates
Select Civilian Personnel Special Interest AreasFull Time Equivalent
Special Interest Areas FY 2014 FY 2015 FY 2016
Total, All Areas 193,460 198,412 200,959
Installation Management/Base Support 36,360 36,863 36,970 Warfare Centers 33,587 33,581 33,514 Shipyards 35,560 38,440 39,913 Engineering/Acquisition Commands (excludes PEOs) 20,295 20,164 20,276 Fleet Activities (e.g., Ship/Air Operations) 9,203 11,871 12,008 Aviation/Marine Corps Depots 10,029 10,370 10,368 Departmental (e.g., Navy/MC HQ, PEOs) 9,956 10,315 10,367 Military Support (e.g., Training, Quality of Life) 10,998 10,764 11,131 Supply/Distribution/Logistics Centers 8,967 9,178 9,270 Transportation 8,942 8,507 8,730 Other 9,563 8,359 8,412
NOTE: FY15 and prior includes supplemental funding; FY16 reflects the baseline request.
6.7

Department of the NavyFY 2016 Budget EstimatesSupport of Reserve Forces
(In Millions of Dollars)
Appropriation FY 2014 FY 2015 FY 2016
Reserve Personnel, Navy 1,870.4 1,849.9 1,885.0 Reserve Personnel, Marine Corps 704.3 665.5 706.5 Medicare-Eligible Retiree Health Fund Contribution, Res Navy 147.8 124.9 107.8 Medicare-Eligible Retiree Health Fund Contribution, Res MC 89.1 74.0 63.1 Operation & Maintenance, Navy Reserve 1,209.9 1,067.1 1,001.8 Operation & Maintenance, Marine Corps Reserve 267.8 281.4 277.0 Aircraft Procurement, Navy 189.5 141.0 265.9 Other Procurement, Navy 6.2 4.7 4.5 Procurement, Marine Corps 59.0 63.1 44.2 Procurement of Ammunition, Navy & Marine Corps 0.2 0.2 0.5 Military Construction, Naval Reserve 29.0 55.5 36.1
Total, Support of Reserve Forces 4,573.2 4,327.2 4,392.3
NOTE: FY15 and prior includes supplemental funding; FY16 reflects the baseline request.
6.8
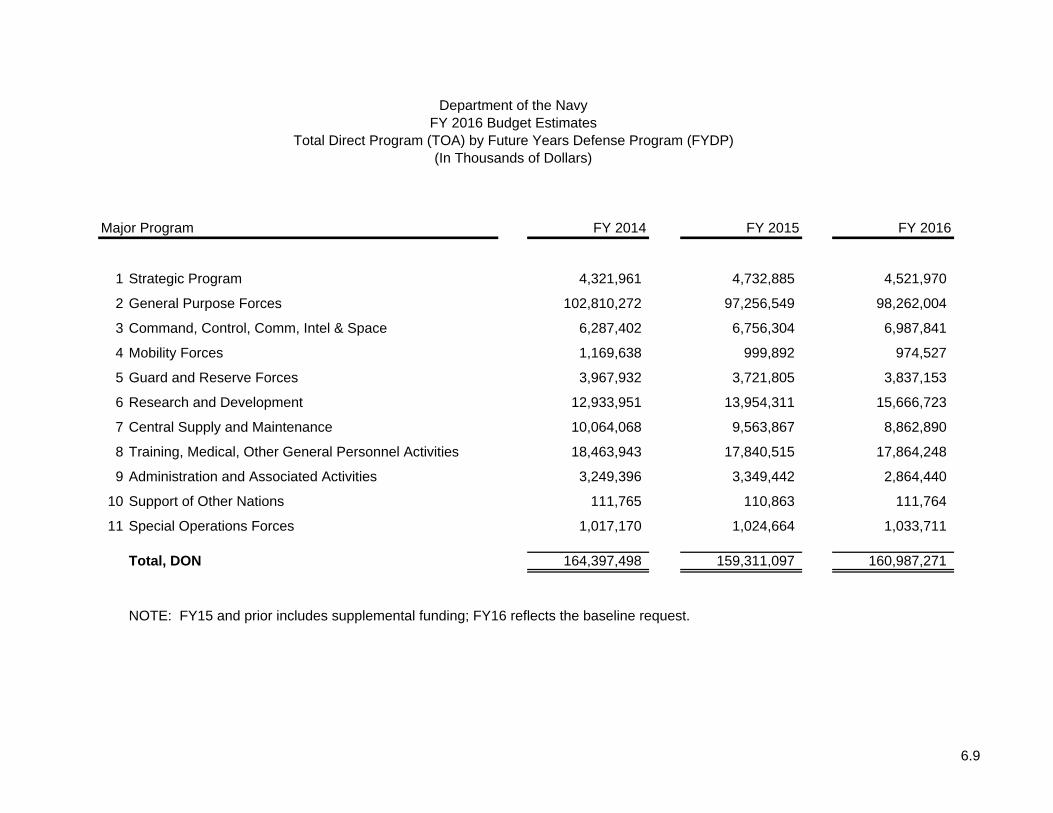
Department of the NavyFY 2016 Budget Estimates
Total Direct Program (TOA) by Future Years Defense Program (FYDP)(In Thousands of Dollars)
Major Program FY 2014 FY 2015 FY 2016
1 Strategic Program 4,321,961 4,732,885 4,521,970
2 General Purpose Forces 102,810,272 97,256,549 98,262,004
3 Command, Control, Comm, Intel & Space 6,287,402 6,756,304 6,987,841
4 Mobility Forces 1,169,638 999,892 974,527
5 Guard and Reserve Forces 3,967,932 3,721,805 3,837,153
6 Research and Development 12,933,951 13,954,311 15,666,723
7 Central Supply and Maintenance 10,064,068 9,563,867 8,862,890
8 Training, Medical, Other General Personnel Activities 18,463,943 17,840,515 17,864,248
9 Administration and Associated Activities 3,249,396 3,349,442 2,864,440
10 Support of Other Nations 111,765 110,863 111,764
11 Special Operations Forces 1,017,170 1,024,664 1,033,711
Total, DON 164,397,498 159,311,097 160,987,271
NOTE: FY15 and prior includes supplemental funding; FY16 reflects the baseline request.
6.9