Embed Size (px)
Citation preview

DEPARTMENT OF THE ARMYFISCAL YEAR (FY) 2004 / 2005 BIENNIAL BUDGET ESTIMATES
OPERATION AND MAINTENANCE, ARMY
JUSTIFICATION BOOK
FEBRUARY 2003
VOLUME II


VOLUME II – JUSTIFICATION OF OMA ESTIMATES FOR FY 2004-2005
TABLE OF CONTENTS
PB-31Q Manpower Changes in Full-Time Equivalents
PB-22 Major Department of Defense Headquarters Activities
PB-55 International Military Headquarters
PB-24 Professional Military Education
PB-15 Advisory and Assistance Services
OP-34 Appropriated Fund Support for MWR Activities
OP-30 Depot Maintenance Program
ENV-30 (A-C) Defense Environmental Restoration Program
PB-28/28B Summary of Budgeted Environmental Projects
OP-28 Facilities Sustainment, Restoration, and Modernization (SRM), and Demolition Summary
OP-28P Facilities Sustainment, Restoration, and Modernization (SRM), and Demolition Summary - Projects over $500K
OP-31 Spares and Repair Parts
PB-34 Revenue from Transfer or Disposal of DoD Real Property and Revenue for Leasing Out DoD Assets
i

THIS PAGE LEFT INTENTIONALLY BLANK
DEPARTMENT OF ARMYFY 2004/2005 BIENNIAL BUDGET ESTIMATES
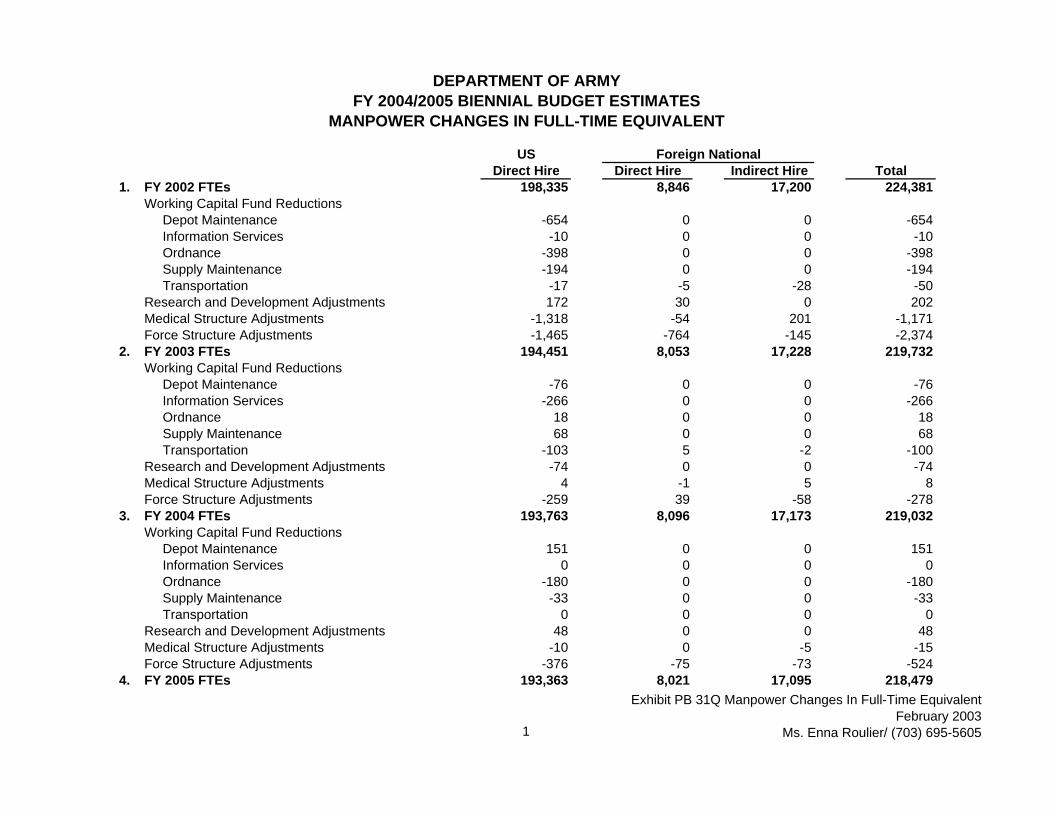
MANPOWER CHANGES IN FULL-TIME EQUIVALENT
USDirect Hire Direct Hire Indirect Hire Total
1. FY 2002 FTEs 198,335 8,846 17,200 224,381Working Capital Fund Reductions Depot Maintenance -654 0 0 -654 Information Services -10 0 0 -10 Ordnance -398 0 0 -398 Supply Maintenance -194 0 0 -194 Transportation -17 -5 -28 -50Research and Development Adjustments 172 30 0 202Medical Structure Adjustments -1,318 -54 201 -1,171Force Structure Adjustments -1,465 -764 -145 -2,374
2. FY 2003 FTEs 194,451 8,053 17,228 219,732Working Capital Fund Reductions Depot Maintenance -76 0 0 -76 Information Services -266 0 0 -266 Ordnance 18 0 0 18 Supply Maintenance 68 0 0 68 Transportation -103 5 -2 -100Research and Development Adjustments -74 0 0 -74Medical Structure Adjustments 4 -1 5 8Force Structure Adjustments -259 39 -58 -278
3. FY 2004 FTEs 193,763 8,096 17,173 219,032Working Capital Fund Reductions Depot Maintenance 151 0 0 151 Information Services 0 0 0 0 Ordnance -180 0 0 -180 Supply Maintenance -33 0 0 -33 Transportation 0 0 0 0Research and Development Adjustments 48 0 0 48Medical Structure Adjustments -10 0 -5 -15Force Structure Adjustments -376 -75 -73 -524
4. FY 2005 FTEs 193,363 8,021 17,095 218,479
Foreign National
1
Exhibit PB 31Q Manpower Changes In Full-Time EquivalentFebruary 2003
Ms. Enna Roulier/ (703) 695-5605
DEPARTMENT OF ARMYFY 2004/2005 BIENNIAL BUDGET ESTIMATES
MANPOWER CHANGES IN FULL-TIME EQUIVALENT
USDirect Hire Direct Hire Indirect Hire Total
Foreign National
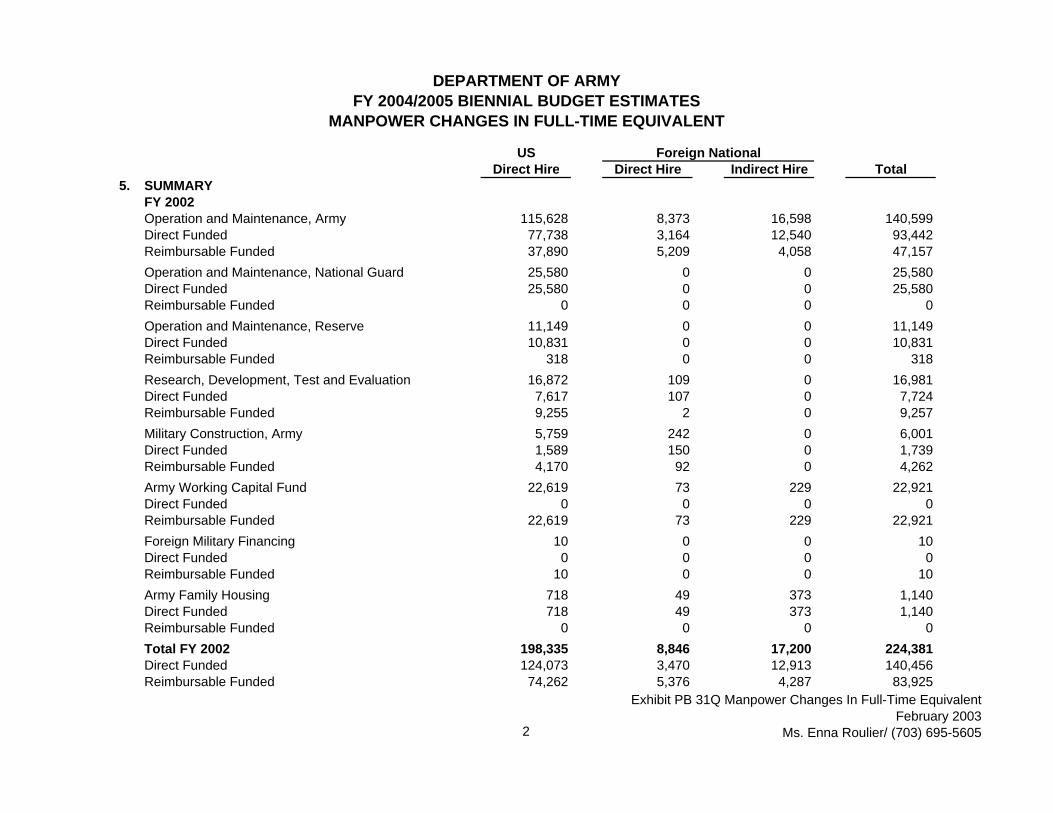
5. SUMMARYFY 2002Operation and Maintenance, Army 115,628 8,373 16,598 140,599Direct Funded 77,738 3,164 12,540 93,442Reimbursable Funded 37,890 5,209 4,058 47,157
Operation and Maintenance, National Guard 25,580 0 0 25,580Direct Funded 25,580 0 0 25,580Reimbursable Funded 0 0 0 0
Operation and Maintenance, Reserve 11,149 0 0 11,149Direct Funded 10,831 0 0 10,831Reimbursable Funded 318 0 0 318
Research, Development, Test and Evaluation 16,872 109 0 16,981Direct Funded 7,617 107 0 7,724Reimbursable Funded 9,255 2 0 9,257
Military Construction, Army 5,759 242 0 6,001Direct Funded 1,589 150 0 1,739Reimbursable Funded 4,170 92 0 4,262
Army Working Capital Fund 22,619 73 229 22,921Direct Funded 0 0 0 0Reimbursable Funded 22,619 73 229 22,921
Foreign Military Financing 10 0 0 10Direct Funded 0 0 0 0Reimbursable Funded 10 0 0 10
Army Family Housing 718 49 373 1,140Direct Funded 718 49 373 1,140Reimbursable Funded 0 0 0 0
Total FY 2002 198,335 8,846 17,200 224,381Direct Funded 124,073 3,470 12,913 140,456Reimbursable Funded 74,262 5,376 4,287 83,925
2
Exhibit PB 31Q Manpower Changes In Full-Time EquivalentFebruary 2003
Ms. Enna Roulier/ (703) 695-5605

DEPARTMENT OF ARMYFY 2004/2005 BIENNIAL BUDGET ESTIMATES
MANPOWER CHANGES IN FULL-TIME EQUIVALENT
USDirect Hire Direct Hire Indirect Hire Total
Foreign National
FY 2003Operation and Maintenance, Army 113,088 7,605 16,445 137,138Direct Funded 75,441 2,764 9,566 87,771Reimbursable Funded 37,647 4,841 6,879 49,367
Operation and Maintenance, National Guard 25,698 0 0 25,698Direct Funded 25,698 0 0 25,698Reimbursable Funded 0 0 0 0
Operation and Maintenance, Reserve 11,133 0 0 11,133Direct Funded 10,864 0 0 10,864Reimbursable Funded 269 0 0 269
Research, Development, Test and Evaluation 17,044 139 0 17,183Direct Funded 8,106 139 0 8,245Reimbursable Funded 8,938 0 0 8,938
Military Construction, Army 5,424 198 187 5,809Direct Funded 0 0 0 0Reimbursable Funded 5,424 198 187 5,809
Army Working Capital Fund 21,346 68 201 21,615Direct Funded 0 0 0 0Reimbursable Funded 21,346 68 201 21,615
Foreign Military Financing 12 0 0 12Direct Funded 0 0 0 0Reimbursable Funded 12 0 0 12
Army Family Housing 706 43 395 1,144Direct Funded 706 43 395 1,144Reimbursable Funded 0 0 0 0
Total FY 2003 194,451 8,053 17,228 219,732Direct Funded 120,815 2,946 9,961 133,722Reimbursable Funded 73,636 5,107 7,267 86,010
3
Exhibit PB 31Q Manpower Changes In Full-Time EquivalentFebruary 2003
Ms. Enna Roulier/ (703) 695-5605

DEPARTMENT OF ARMYFY 2004/2005 BIENNIAL BUDGET ESTIMATES
MANPOWER CHANGES IN FULL-TIME EQUIVALENT
USDirect Hire Direct Hire Indirect Hire Total
Foreign National
FY 2004Operation and Maintenance, Army 112,664 7,610 16,392 136,666Direct Funded 74,799 2,726 9,462 86,987Reimbursable Funded 37,865 4,884 6,930 49,679
Operation and Maintenance, National Guard 25,938 0 0 25,938Direct Funded 25,938 0 0 25,938Reimbursable Funded 0 0 0 0
Operation and Maintenance, Reserve 11,132 0 0 11,132Direct Funded 10,863 0 0 10,863Reimbursable Funded 269 0 0 269
Research, Development, Test and Evaluation 16,970 139 0 17,109Direct Funded 8,148 139 0 8,287Reimbursable Funded 8,822 0 0 8,822
Military Construction, Army 5,403 231 187 5,821Direct Funded 0 0 0 0Reimbursable Funded 5,403 231 187 5,821
Army Working Capital Fund 20,987 73 199 21,259Direct Funded 0 0 0 0Reimbursable Funded 20,987 73 199 21,259
Foreign Military Financing 12 0 0 12Direct Funded 0 0 0 0Reimbursable Funded 12 0 0 12
Army Family Housing 657 43 395 1,095Direct Funded 657 43 395 1,095Reimbursable Funded 0 0 0 0
Total FY 2004 193,763 8,096 17,173 219,032Direct Funded 120,405 2,908 9,857 133,170Reimbursable Funded 73,358 5,188 7,316 85,862
4
Exhibit PB 31Q Manpower Changes In Full-Time EquivalentFebruary 2003
Ms. Enna Roulier/ (703) 695-5605

DEPARTMENT OF ARMYFY 2004/2005 BIENNIAL BUDGET ESTIMATES
MANPOWER CHANGES IN FULL-TIME EQUIVALENT
USDirect Hire Direct Hire Indirect Hire Total
Foreign National
FY 2005Operation and Maintenance, Army 111,746 7,523 16,314 135,583Direct Funded 73,988 2,723 9,455 86,166Reimbursable Funded 37,758 4,800 6,859 49,417
Operation and Maintenance, National Guard 26,405 0 0 26,405Direct Funded 26,405 0 0 26,405Reimbursable Funded 0 0 0 0
Operation and Maintenance, Reserve 11,243 0 0 11,243Direct Funded 10,988 0 0 10,988Reimbursable Funded 255 0 0 255
Research, Development, Test and Evaluation 17,018 139 0 17,157Direct Funded 8,171 139 0 8,310Reimbursable Funded 8,847 0 0 8,847
Military Construction, Army 5,369 243 187 5,799Direct Funded 0 0 0 0Reimbursable Funded 5,369 243 187 5,799
Army Working Capital Fund 20,925 73 199 21,197Direct Funded 0 0 0 0Reimbursable Funded 20,925 73 199 21,197
Foreign Military Financing 12 0 0 12Direct Funded 0 0 0 0Reimbursable Funded 12 0 0 12
Army Family Housing 645 43 395 1,083Direct Funded 645 43 395 1,083Reimbursable Funded 0 0 0 0
Total FY 2005 193,363 8,021 17,095 218,479Direct Funded 120,197 2,905 9,850 132,952Reimbursable Funded 73,166 5,116 7,245 85,527
5
Exhibit PB 31Q Manpower Changes In Full-Time EquivalentFebruary 2003
Ms. Enna Roulier/ (703) 695-5605

DEPARTMENT OF THE ARMYFY 2004/2005 BIENNIAL BUDGET ESTIMATES
MILITARY DEPARTMENT OF DEFENSE HEADQUARTERS ACTIVITIES
Military Civ Total Obs Military Civ Total Obs Military Civ Total Obs Military Civ Total Obs Avg Str FTEs Mpwr ($000) Avg Str FTEs Mpwr ($000) Avg Str FTEs Mpwr ($000) Avg Str FTEs Mpwr ($000)
SUMMARY LINE 6,209 9,176 15,385 1,615,062 6,516 9,612 16,128 1,612,193 6,539 9,363 15,902 1,748,540 6,403 9,107 15,510 1,777,496
I. Comb. Mgmt Hqs 3,417 1,994 5,411 468,240 3,469 1,993 5,462 482,282 3,577 1,970 5,547 496,394 3,506 1,915 5,421 507,327 Activities
A. Combatant Cmds 1,304 293 1,597 135,060 1,325 385 1,710 141,788 1,359 411 1,770 150,825 1,359 411 1,770 157,065
HQ JF CMD 2 0 2 145 2 12 14 158 6 19 25 501 6 19 25 522MPA 2 2 145 2 2 158 6 6 501 6 6 522OMA 0 0 0 12 12 0 19 19 0 19 19 0
(DIR) 0 0 0 0 (REIMB) 0 12 19 19
US FORCES AZORES 0 0 0 0 1 0 1 79 0 0 0 0 0 0 0 0MPA 0 0 0 1 1 79 0 0 0 0 0 0OMA 0 0 0 0 0 0 0 0 0 0 0 0
(DIR) 0 0 0 0 (REIMB) 0 0 0 0
HQ ICELAND 1 0 1 73 2 0 2 158 0 0 0 0 0 0 0 0
MPA 1 1 73 2 2 158 0 0 0 0 0 0OMA 0 0 0 0 0 0 0 0 0 0 0 0
(DIR) 0 0 0 0 (REIMB) 0 0 0 0
USAE KOREA/EUSA 104 75 179 15,674 103 66 169 14,875 103 66 169 15,618 103 66 169 16,473
MPA 104 104 7,543 103 103 8,112 103 103 8,599 103 103 8,965OMA 75 75 8,131 66 66 6,763 66 66 7,019 66 66 7,508
(DIR) 75 7,832 60 6,434 60 6,677 60 7,157(REIMB) 0 299 6 329 6 342 6 351
USAE HQ CENTRAL 210 0 210 15,232 198 0 198 15,594 196 0 196 16,362 196 0 196 17,059MPA 210 210 15,232 198 198 15,594 196 196 16,362 196 196 17,059OMA 0 0 0 0 0 0 0 0 0 0 0 0
(DIR) 0 0 0 0 (REIMB) 0 0 0 0
USAE HQ EUCOM 199 116 315 31,272 204 150 354 29,656 202 168 370 30,135 202 168 370 31,187MPA 199 199 14,434 204 204 16,067 202 202 16,863 202 202 17,581OMA 116 116 16,838 150 150 13,589 168 168 13,272 168 168 13,606
(DIR) 116 16,230 142 12,928 160 12,588 160 12,901(REIMB) 0 608 8 661 8 684 8 705
FY 2002 ACTUAL FY 2003 ESTIMATE FY 2004 ESTIMATE FY 2005 ESTIMATE
6
Exhibit PB 22 Military Department Of Defense Headquarters ActivitiesFeburary 2003
Mr. Ken Lapin/(703) 695-9031
DEPARTMENT OF THE ARMYFY 2004/2005 BIENNIAL BUDGET ESTIMATES
MILITARY DEPARTMENT OF DEFENSE HEADQUARTERS ACTIVITIES
Military Civ Total Obs Military Civ Total Obs Military Civ Total Obs Military Civ Total Obs Avg Str FTEs Mpwr ($000) Avg Str FTEs Mpwr ($000) Avg Str FTEs Mpwr ($000) Avg Str FTEs Mpwr ($000)
FY 2002 ACTUAL FY 2003 ESTIMATE FY 2004 ESTIMATE FY 2005 ESTIMATE
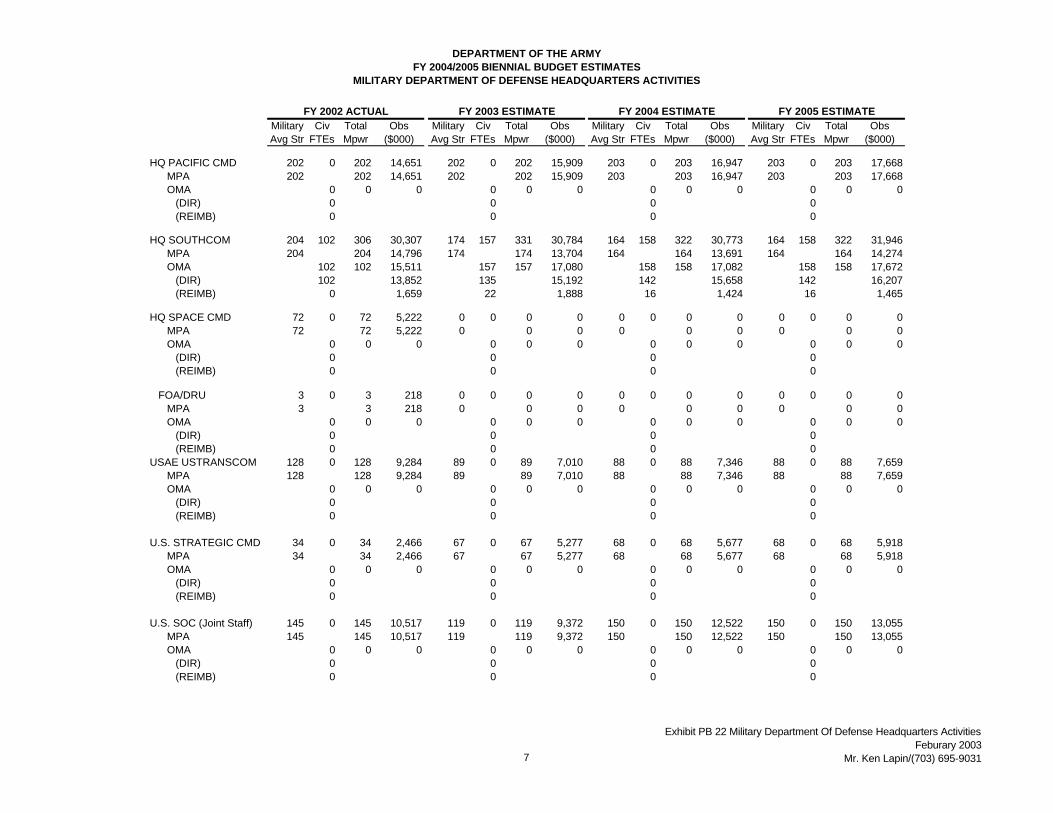
HQ PACIFIC CMD 202 0 202 14,651 202 0 202 15,909 203 0 203 16,947 203 0 203 17,668MPA 202 202 14,651 202 202 15,909 203 203 16,947 203 203 17,668OMA 0 0 0 0 0 0 0 0 0 0 0 0
(DIR) 0 0 0 0 (REIMB) 0 0 0 0
HQ SOUTHCOM 204 102 306 30,307 174 157 331 30,784 164 158 322 30,773 164 158 322 31,946MPA 204 204 14,796 174 174 13,704 164 164 13,691 164 164 14,274OMA 102 102 15,511 157 157 17,080 158 158 17,082 158 158 17,672
(DIR) 102 13,852 135 15,192 142 15,658 142 16,207(REIMB) 0 1,659 22 1,888 16 1,424 16 1,465
HQ SPACE CMD 72 0 72 5,222 0 0 0 0 0 0 0 0 0 0 0 0MPA 72 72 5,222 0 0 0 0 0 0 0 0 0OMA 0 0 0 0 0 0 0 0 0 0 0 0
(DIR) 0 0 0 0 (REIMB) 0 0 0 0
FOA/DRU 3 0 3 218 0 0 0 0 0 0 0 0 0 0 0 0MPA 3 3 218 0 0 0 0 0 0 0 0 0OMA 0 0 0 0 0 0 0 0 0 0 0 0
(DIR) 0 0 0 0 (REIMB) 0 0 0 0
USAE USTRANSCOM 128 0 128 9,284 89 0 89 7,010 88 0 88 7,346 88 0 88 7,659MPA 128 128 9,284 89 89 7,010 88 88 7,346 88 88 7,659OMA 0 0 0 0 0 0 0 0 0 0 0 0
(DIR) 0 0 0 0 (REIMB) 0 0 0 0
U.S. STRATEGIC CMD 34 0 34 2,466 67 0 67 5,277 68 0 68 5,677 68 0 68 5,918MPA 34 34 2,466 67 67 5,277 68 68 5,677 68 68 5,918OMA 0 0 0 0 0 0 0 0 0 0 0 0
(DIR) 0 0 0 0 (REIMB) 0 0 0 0
U.S. SOC (Joint Staff) 145 0 145 10,517 119 0 119 9,372 150 0 150 12,522 150 0 150 13,055MPA 145 145 10,517 119 119 9,372 150 150 12,522 150 150 13,055OMA 0 0 0 0 0 0 0 0 0 0 0 0
(DIR) 0 0 0 0 (REIMB) 0 0 0 0
7
Exhibit PB 22 Military Department Of Defense Headquarters ActivitiesFeburary 2003
Mr. Ken Lapin/(703) 695-9031

DEPARTMENT OF THE ARMYFY 2004/2005 BIENNIAL BUDGET ESTIMATES
MILITARY DEPARTMENT OF DEFENSE HEADQUARTERS ACTIVITIES
Military Civ Total Obs Military Civ Total Obs Military Civ Total Obs Military Civ Total Obs Avg Str FTEs Mpwr ($000) Avg Str FTEs Mpwr ($000) Avg Str FTEs Mpwr ($000) Avg Str FTEs Mpwr ($000)
FY 2002 ACTUAL FY 2003 ESTIMATE FY 2004 ESTIMATE FY 2005 ESTIMATE
HQ NORTHCOM 0 0 0 0 164 0 164 12,916 179 0 179 14,943 179 0 179 15,579MPA 0 0 0 164 164 12,916 179 179 14,943 179 179 15,579OMA 0 0 0 0 0 0 0 0 0 0 0 0
(DIR) 0 0 0 0 (REIMB) 0 0 0 0
B. Svc Comb. Cmds 2,113 1,701 3,814 333,180 2,144 1,608 3,752 340,495 2,218 1,559 3,777 345,569 2,147 1,504 3,651 350,262THIRD ARMY 618 31 649 48,167 610 48 658 53,186 727 48 775 65,732 727 48 775 68,367
MPA 618 618 44,824 610 610 48,043 727 727 60,691 727 727 63,274OMA 31 31 3,343 48 48 5,143 48 48 5,041 48 48 5,093
(DIR) 31 3,343 48 5,143 48 5,041 48 5,093(REIMB) 0 0 0 0
EIGHTH ARMY 530 13 543 39,921 530 30 560 41,504 497 30 527 39,247 467 30 497 37,311MPA 530 530 38,441 530 530 38,441 497 497 36,048 467 467 33,872OMA 13 13 1,480 30 30 3,063 30 30 3,199 30 30 3,439
(DIR) 11 1,149 28 3,003 28 3,116 28 3,340(REIMB) 2 331 2 60 2 83 2 99
FOA/DRU 35 270 305 33,555 35 178 213 22,923 36 166 202 22,893 35 157 192 23,385MPA 35 35 2,539 35 35 2,539 36 36 2,611 35 35 2,539OMA 270 270 31,016 178 178 20,384 166 166 20,282 157 157 20,846
(DIR) 211 28,195 135 19,087 123 18,474 114 18,727(REIMB) 59 2,821 43 1,297 43 1,808 43 2,119
HQ USARPAC 105 238 343 33,552 135 180 315 38,025 127 170 297 28,542 121 160 281 29,131MPA 105 105 7,616 135 135 10,632 127 127 10,602 121 121 10,531OMA 238 238 25,936 180 180 27,393 170 170 17,940 160 160 18,600
(DIR) 238 25,936 180 27,393 170 17,940 160 18,600(REIMB) 0 0 0 0
HQ USAREUR 421 585 1,006 91,304 415 456 871 79,083 391 438 829 78,036 369 412 781 78,278MPA 421 421 30,536 415 415 32,685 391 391 32,641 369 369 32,116OMA 585 585 60,768 456 456 46,398 438 438 45,395 412 412 46,162
(DIR) 585 60,768 456 46,398 438 45,395 412 46,162(REIMB) 0 0 0 0
HQ USARSO 132 51 183 20,754 154 54 208 20,167 181 168 349 36,101 169 158 327 36,432MPA 132 132 9,574 154 154 12,129 181 181 15,110 169 169 14,709OMA 51 51 11,180 54 54 8,038 168 168 20,991 158 158 21,723
(DIR) 51 11,180 54 8,038 168 20,991 158 21,723(REIMB) 0 0 0 0
8
Exhibit PB 22 Military Department Of Defense Headquarters ActivitiesFeburary 2003
Mr. Ken Lapin/(703) 695-9031

DEPARTMENT OF THE ARMYFY 2004/2005 BIENNIAL BUDGET ESTIMATES
MILITARY DEPARTMENT OF DEFENSE HEADQUARTERS ACTIVITIES
Military Civ Total Obs Military Civ Total Obs Military Civ Total Obs Military Civ Total Obs Avg Str FTEs Mpwr ($000) Avg Str FTEs Mpwr ($000) Avg Str FTEs Mpwr ($000) Avg Str FTEs Mpwr ($000)
FY 2002 ACTUAL FY 2003 ESTIMATE FY 2004 ESTIMATE FY 2005 ESTIMATE
FOA/DRU 56 125 181 11,698 41 123 164 15,958 0 0 0 0 0 0 0 0MPA 56 56 4,062 41 41 3,229 0 0 0 0 0 0OMA 125 125 7,636 123 123 12,729 0 0 0 0 0 0
(DIR) 120 7,633 123 12,729 0 0 0 0(REIMB) 5 3 0 0 0
MTMC 8 162 170 22,265 15 304 319 34,648 15 304 319 35,612 15 304 319 36,578MPA 8 8 580 15 15 1,181 15 15 1,252 15 15 1,306OMA 0 0 0 0 0 0 0 0 0 0 0 0
(DIR) 0 0 0 0 (REIMB) 0 0 0 0
AWCF 162 162 21,685 304 304 33,467 304 304 34,360 304 304 35,272(DIR) 0 0 0 0 (REIMB) 162 21,685 304 33,467 304 34,360 304 35,272
USASOC 191 219 410 30,208 191 228 419 33,030 226 228 454 37,335 226 228 454 38,633MPA 191 191 13,853 191 191 15,043 226 226 18,867 226 226 19,670OMA 219 219 16,355 228 228 17,987 228 228 18,468 228 228 18,963
(DIR) 0 0 0 0 (REIMB) 219 16,355 228 17,987 228 18,468 228 18,963
FOA/DRU 17 7 24 1,756 18 7 25 1,970 18 7 25 2,070 18 7 25 2,149MPA 17 17 1,233 18 18 1,418 18 18 1,503 18 18 1,567OMA 7 7 523 7 7 552 7 7 567 7 7 582
(DIR) 0 0 0 0 (REIMB) 7 523 7 552 7 567 7 582
II. Non-Comb. Mgmt 2,792 7,182 9,974 1,146,822 3,047 7,619 10,666 1,129,911 2,962 7,393 10,355 1,252,146 2,897 7,192 10,089 1,270,169 HQ's Activities
A. Dept'l Activities 1,346 2,383 3,729 533,600 1,440 2,834 4,274 542,803 1,441 2,835 4,276 619,877 1,442 2,833 4,275 639,304
OFFICE OF THE SECRETARY 239 631 870 135,992 269 712 981 130,775 269 712 981 150,136 270 709 979 154,016
MPA 239 239 17,335 269 269 21,186 269 269 22,457 270 270 23,499OMA 631 631 118,657 712 712 109,589 712 712 127,679 709 709 130,517
(DIR) 614 117,038 697 108,088 697 126,125 695 129,023(REIMB) 17 1,619 15 1,501 15 1,554 14 1,494
9
Exhibit PB 22 Military Department Of Defense Headquarters ActivitiesFeburary 2003
Mr. Ken Lapin/(703) 695-9031

DEPARTMENT OF THE ARMYFY 2004/2005 BIENNIAL BUDGET ESTIMATES
MILITARY DEPARTMENT OF DEFENSE HEADQUARTERS ACTIVITIES
Military Civ Total Obs Military Civ Total Obs Military Civ Total Obs Military Civ Total Obs Avg Str FTEs Mpwr ($000) Avg Str FTEs Mpwr ($000) Avg Str FTEs Mpwr ($000) Avg Str FTEs Mpwr ($000)
FY 2002 ACTUAL FY 2003 ESTIMATE FY 2004 ESTIMATE FY 2005 ESTIMATE
FOA/DRU 85 791 876 155,320 219 779 998 138,053 220 780 1,000 159,511 220 775 995 163,100MPA 85 85 6,165 219 219 17,248 220 220 18,366 220 220 19,147OMA 791 791 149,155 779 779 120,805 780 780 141,145 775 775 143,953
(DIR) 774 147,536 779 120,805 780 141,145 775 143,953(REIMB) 17 1,619 0 0 0
ARMY STAFF 1,011 725 1,736 196,505 932 1,043 1,975 225,876 932 1,043 1,975 254,274 932 1,049 1,981 264,723MPA 1,011 1,011 73,329 932 932 73,403 932 932 77,805 932 932 81,116OMA 610 610 115,799 891 891 137,898 891 891 160,844 910 910 168,634
(DIR) 605 115,322 886 137,398 886 160,326 905 168,100(REIMB) 5 477 5 500 5 518 5 534
OMAR 34 34 5,833 61 61 6,565 61 61 6,851 48 48 5,561(DIR) 34 0 5,833 48 0 5,264 48 5,504 48 5,561(REIMB) 0 0 13 0 1,301 13 1,347 0
OMNG 81 81 1,544 91 91 8,010 91 91 8,774 91 91 9,412(DIR) 81 0 1,544 91 0 8,010 91 8,774 91 9,412(REIMB) 0 0 0 0 0 0
FOA/DRU 11 236 247 45,783 20 300 320 48,098 20 300 320 55,956 20 300 320 57,465MPA 11 11 798 20 20 1,575 20 20 1,670 20 20 1,741OMA 236 236 44,985 300 300 46,523 300 300 54,286 300 300 55,724
(DIR) 236 44,985 300 46,523 300 54,286 300 55,724(REIMB) 0 0 0 0
B. Dept'l Spt Act 93 160 253 37,243 83 121 204 25,301 83 121 204 28,825 83 121 204 29,699
SECRETARY SPT ACT 9 41 50 8,468 0 6 6 930 0 6 6 1,086 0 6 6 1,114MPA 9 9 653 0 0 0 0 0 0 0 0 0OMA 41 41 7,815 6 6 930 6 6 1,086 6 6 1,114
(DIR) 41 7,815 6 930 6 1,086 6 1,114(REIMB) 0 0 0 0
ARMY STAFF SPT ACT 84 119 203 28,776 83 115 198 24,371 83 115 198 27,739 83 115 198 28,585MPA 84 84 6,093 83 83 6,537 83 83 6,929 83 83 7,224OMA 119 119 22,683 115 115 17,834 115 115 20,810 115 115 21,361
(DIR) 119 22,683 115 17,834 115 20,810 115 21,361(REIMB) 0 0 0 0
10
Exhibit PB 22 Military Department Of Defense Headquarters ActivitiesFeburary 2003
Mr. Ken Lapin/(703) 695-9031

DEPARTMENT OF THE ARMYFY 2004/2005 BIENNIAL BUDGET ESTIMATES
MILITARY DEPARTMENT OF DEFENSE HEADQUARTERS ACTIVITIES
Military Civ Total Obs Military Civ Total Obs Military Civ Total Obs Military Civ Total Obs Avg Str FTEs Mpwr ($000) Avg Str FTEs Mpwr ($000) Avg Str FTEs Mpwr ($000) Avg Str FTEs Mpwr ($000)
FY 2002 ACTUAL FY 2003 ESTIMATE FY 2004 ESTIMATE FY 2005 ESTIMATE
C. Functional Activities 1,353 4,639 5,992 575,979 1,524 4,664 6,188 561,807 1,438 4,437 5,875 603,445 1,372 4,238 5,610 601,166
CORPS OF ENG. 12 295 307 30,150 15 292 307 31,593 8 280 288 35,206 7 264 271 35,581MPA 12 12 870 15 15 1,181 8 8 668 7 7 609OMA 295 295 29,280 292 292 30,412 280 280 34,538 264 264 34,972
(DIR) 295 29,280 292 30,412 280 34,538 264 34,972(REIMB) 0 0 0 0
ATEC 31 100 131 12,614 38 105 143 12,747 35 99 134 11,524 33 93 126 10,917MPA 31 31 2,248 38 38 2,756 35 35 2,539 33 33 2,394OMA 77 77 7,773 0 0 0 0 0 0 0 0 0
0 77 7,773 0 0 0 RDTE 23 23 2,593 105 105 9,991 99 99 8,985 93 93 8,523
(DIR) 23 2,593 105 9,991 99 8,985 93 8,523
HQ AMC 93 871 964 101,239 84 741 825 84,904 76 682 758 101,261 73 616 689 97,074MPA 93 93 6,745 84 84 6,093 76 76 5,512 73 73 5,295OMA 871 871 94,493 741 741 78,811 682 682 95,749 616 616 91,779
(DIR) 808 88,761 679 72,635 626 89,351 567 85,189(REIMB) 63 5,732 62 6,176 56 6,398 49 6,590
FOA/DRU 10 144 154 16,877 9 52 61 6,196 9 34 43 5,356 9 34 43 5,285MPA 10 10 725 9 9 653 9 9 653 9 9 653OMA 144 144 14,687 48 48 5,135 30 30 4,282 30 30 4,197
(DIR) 121 13,349 48 5,135 30 4,282 30 4,197(REIMB) 23 1,338 0 0 0 0 0 0
RDTE 0 0 1,465 4 4 408 4 4 421 4 4 435(DIR) 0 1,465 0 0 0 0 0 0(REIMB) 0 0 4 408 4 421 4 435
INTELL & SECTY CMD 76 227 303 24,043 76 229 305 25,687 70 212 282 24,785 67 198 265 24,636MPA 76 76 5,512 76 76 5,986 70 70 5,844 67 67 5,831OMA 227 227 18,531 229 229 19,702 212 212 18,941 198 198 18,804
(DIR) 227 18,531 229 19,702 212 18,941 198 18,804(REIMB) 0 0 0 0
FOA/DRU 17 36 53 4,470 17 45 62 5,210 17 45 62 5,440 17 45 62 5,753MPA 17 17 1,233 17 17 1,339 17 17 1,419 17 17 1,480OMA 36 36 3,237 45 45 3,871 45 45 4,021 45 45 4,274
(DIR) 36 3,237 45 3,871 45 4,021 45 4,274(REIMB) 0 0 0 0
11
Exhibit PB 22 Military Department Of Defense Headquarters ActivitiesFeburary 2003
Mr. Ken Lapin/(703) 695-9031

DEPARTMENT OF THE ARMYFY 2004/2005 BIENNIAL BUDGET ESTIMATES
MILITARY DEPARTMENT OF DEFENSE HEADQUARTERS ACTIVITIES
Military Civ Total Obs Military Civ Total Obs Military Civ Total Obs Military Civ Total Obs Avg Str FTEs Mpwr ($000) Avg Str FTEs Mpwr ($000) Avg Str FTEs Mpwr ($000) Avg Str FTEs Mpwr ($000)
FY 2002 ACTUAL FY 2003 ESTIMATE FY 2004 ESTIMATE FY 2005 ESTIMATE
MEDICAL COMMAND 131 225 356 26,338 119 247 366 27,357 119 243 362 28,100 119 243 362 29,003MPA 131 131 9,502 119 119 9,372 119 119 9,934 119 119 10,357OMA 225 225 16,836 247 247 17,985 243 243 18,166 243 243 18,646
(DIR) 0 95 0 137 0 140 0 142(REIMB) 225 16,741 247 17,848 243 18,026 243 18,504
MIL DIST OF WASH 55 43 98 7,495 125 100 225 19,683 118 92 210 20,628 107 84 191 20,588MPA 55 55 3,989 125 125 9,845 118 118 9,851 107 107 9,313OMA 43 43 3,506 100 100 9,838 92 92 10,777 84 84 11,275
(DIR) 43 3,506 100 9,838 92 10,777 84 11,275(REIMB) 0 0 0 0
FOA/DRU 84 112 196 17,375 0 0 0 0 0 0 0 0 0 0 0 0MPA 84 84 6,093 0 0 0 0 0 0 0 0 0OMA 112 112 11,282 0 0 0 0 0 0 0 0 0
(DIR) 112 11,282 0 0 0 (REIMB) 0 0 0 0
TRNG & DOC CMD 360 739 1,099 101,114 349 584 933 70,380 330 552 882 75,821 312 525 837 76,855MPA 360 360 26,111 349 349 27,487 330 330 27,549 312 312 27,155OMA 739 739 75,003 584 584 42,893 552 552 48,272 525 525 49,700
(DIR) 735 74,546 584 42,893 552 48,272 525 49,700(REIMB) 4 457 0 0 0
CIDC 58 31 89 8,795 52 65 117 8,847 43 64 107 9,073 41 60 101 9,366MPA 58 58 4,207 52 52 4,095 43 43 3,590 41 41 3,568OMA 31 31 4,588 65 65 4,752 64 64 5,483 60 60 5,798
(DIR) 31 4,588 65 4,752 64 5,483 60 5,798(REIMB) 0 0 0 0
HQ FORSCOM 326 649 975 93,623 346 491 837 79,865 324 493 817 78,820 306 493 799 78,942MPA 326 326 23,645 346 346 27,251 324 324 27,048 306 306 26,632OMA 649 649 69,978 491 491 52,614 493 493 51,772 493 493 52,310
(DIR) 649 69,978 491 52,614 493 51,772 493 52,310(REIMB) 0 0 0 0
USARC 0 299 299 34,052 0 342 342 36,105 0 325 325 42,081 0 308 308 43,228MPA 0 0 0 0 0 0 0 0 0 0 0 0OMAR 299 299 34,052 342 342 36,105 325 325 42,081 308 308 43,228
(DIR) 299 34,052 342 36,105 325 42,081 308 43,228(REIMB) 0 0 0 0
12
Exhibit PB 22 Military Department Of Defense Headquarters ActivitiesFeburary 2003
Mr. Ken Lapin/(703) 695-9031

DEPARTMENT OF THE ARMYFY 2004/2005 BIENNIAL BUDGET ESTIMATES
MILITARY DEPARTMENT OF DEFENSE HEADQUARTERS ACTIVITIES
Military Civ Total Obs Military Civ Total Obs Military Civ Total Obs Military Civ Total Obs Avg Str FTEs Mpwr ($000) Avg Str FTEs Mpwr ($000) Avg Str FTEs Mpwr ($000) Avg Str FTEs Mpwr ($000)
FY 2002 ACTUAL FY 2003 ESTIMATE FY 2004 ESTIMATE FY 2005 ESTIMATE
FOA/DRU 0 68 68 4,997 0 0 0 0 0 0 0 0 0 0 0 0MPA 0 0 0 0 0 0 0 0 0 0 0 0OMAR 68 68 4,997 0 0 0 0 0 0 0 0 0
(DIR) 68 4,997 0 0 0 (REIMB) 0 0 0 0
ANGB Readiness Ctr 0 273 273 23,721 1 286 287 27,650 1 269 270 28,597 1 254 255 28,005MPA 0 0 0 1 1 79 1 1 83 1 1 87OMNG 273 273 23,721 286 286 27,571 269 269 28,514 254 254 27,918
(DIR) 273 23,721 286 27,571 269 28,514 254 27,918(REIMB) 0 0 0 0
SMDC 39 243 282 25,043 35 239 274 26,055 33 201 234 25,651 31 175 206 22,252MPA 39 39 2,829 35 35 2,539 33 33 2,394 31 31 2,248OMA 16 16 1,300 16 16 1,946 15 15 1,412 15 15 1,433
(DIR) 16 1,300 16 1,946 15 1,412 15 1,433RDTE 227 227 20,914 223 223 21,570 186 186 21,845 160 160 18,571
(REIMB) 227 20,914 223 21,570 186 21,845 160 18,571
U.S. ARMY PEO 61 284 345 44,032 84 334 418 42,606 83 334 417 46,293 77 334 411 47,227MPA 61 61 4,424 84 84 6,616 83 83 6,929 77 77 6,702OMA 284 284 39,608 334 334 35,990 334 334 39,364 334 334 40,525
(DIR) 284 39,608 301 32,866 302 36,225 302 37,292(REIMB) 0 33 3,124 32 3,139 32 3,233
HQ Installation Mgt Act 0 0 0 0 19 241 260 18,061 19 241 260 26,670 19 241 260 26,478MPA 0 0 0 19 19 1,496 19 19 1,586 19 19 1,654OMA 0 0 0 241 241 16,565 241 241 24,870 241 241 24,607
(DIR) 0 241 16,565 241 24,870 241 24,607(REIMB) 0 0 0 0
OMAR 0 0 0 214 0 217(DIR) 0 0 0 214 0 217
HQ Army Contr. Agency 0 0 0 0 7 61 68 7,315 7 61 68 7,395 7 61 68 8,214MPA 0 0 0 7 7 551 7 7 584 7 7 609OMA 0 0 0 61 61 6,764 61 61 6,811 61 61 7,605
(DIR) 0 61 6,764 61 6,811 61 7,605(REIMB) 0 0 0 0
13
Exhibit PB 22 Military Department Of Defense Headquarters ActivitiesFeburary 2003
Mr. Ken Lapin/(703) 695-9031

DEPARTMENT OF THE ARMYFY 2004/2005 BIENNIAL BUDGET ESTIMATES
MILITARY DEPARTMENT OF DEFENSE HEADQUARTERS ACTIVITIES
Military Civ Total Obs Military Civ Total Obs Military Civ Total Obs Military Civ Total Obs Avg Str FTEs Mpwr ($000) Avg Str FTEs Mpwr ($000) Avg Str FTEs Mpwr ($000) Avg Str FTEs Mpwr ($000)
FY 2002 ACTUAL FY 2003 ESTIMATE FY 2004 ESTIMATE FY 2005 ESTIMATE
HQ NETCOM 0 0 0 0 148 210 358 31,545 146 210 356 30,743 146 210 356 31,763MPA 0 0 0 148 148 11,656 146 146 12,188 146 146 12,707OMA 0 0 0 210 210 19,889 210 210 18,555 210 210 19,056
(DIR) 0 210 19,889 210 18,555 210 19,056(REIMB) 0 0 0 0
III. Reconciliation of Increases and Decreases
1. FY03 manpower increase reflects reduced FY02 actual strength as commands position for MHA reductions, compared to programmed FY03 strength.2. New commands established in FY03: HQ Installation Management Activity, HQ Army Contracting Agency and HQ NETCOM. Manpower and dollars realigned within Army.3. Programmed manpower decreases FY03, FY04, and FY05 represent 15% Congressionally directed AMHA reduction.4. Dollar increases reflect implementation of PBD 701C, CSRS Accruing Retirement Costs and normal inflation.5. Service Combatant Command manpower increase in FY04 is due to increase in USASOC per PDM-1 (SOF).
SUMMARY BY PROGRAMCOMBATANT CMDS 1,304 293 1,597 135,060 1,325 385 1,710 141,788 1,359 411 1,770 150,825 1,359 411 1,770 157,065SVC COMB CMDS 2,113 1,701 3,814 333,180 2,144 1,608 3,752 340,495 2,218 1,559 3,777 345,569 2,147 1,504 3,651 350,262DEPARTMENTAL ACT 2,792 7,182 9,974 1,146,822 3,047 7,619 10,666 1,129,911 2,962 7,393 10,355 1,252,146 2,897 7,192 10,089 1,270,169TOTAL MHA 6,209 9,176 15,385 1,615,062 6,516 9,612 16,128 1,612,193 6,539 9,363 15,902 1,748,540 6,403 9,107 15,510 1,777,496
SUMMARY BY APPN Total Total Total Total Total Obs Total Obs Total Obs Total Obs
Mpwr ($000) Mpwr ($000) Mpwr ($000) Mpwr ($000) ----- -------- ----- -------- ----- -------- ----- --------
OMAR 401 44,882 403 42,670 386 49,146 356 49,006OMNG 354 25,265 377 35,581 360 37,288 345 37,330OMA 8,009 1,047,913 8,196 959,865 8,024 1,058,119 7,845 1,080,478RDTE 250 24,972 332 31,969 289 31,251 257 27,529MPA 6,209 450,345 6,516 508,641 6,539 538,376 6,403 547,881AWCF 162 21,685 304 33,467 304 34,360 304 35,272
TOTAL 15,385 1,615,062 16,128 1,612,193 15,902 1,748,540 15,510 1,777,496
FY 2002 FY 2003 FY 2004 FY 2005
14
Exhibit PB 22 Military Department Of Defense Headquarters ActivitiesFeburary 2003
Mr. Ken Lapin/(703) 695-9031
DEPARTMENT OF THE ARMYFY 2004/2005 BIENNIAL BUDGET ESTIMATES
MILITARY DEPARTMENT OF DEFENSE HEADQUARTERS ACTIVITIES
Military Civ Total Obs Military Civ Total Obs Military Civ Total Obs Military Civ Total Obs Avg Str FTEs Mpwr ($000) Avg Str FTEs Mpwr ($000) Avg Str FTEs Mpwr ($000) Avg Str FTEs Mpwr ($000)
FY 2002 ACTUAL FY 2003 ESTIMATE FY 2004 ESTIMATE FY 2005 ESTIMATE
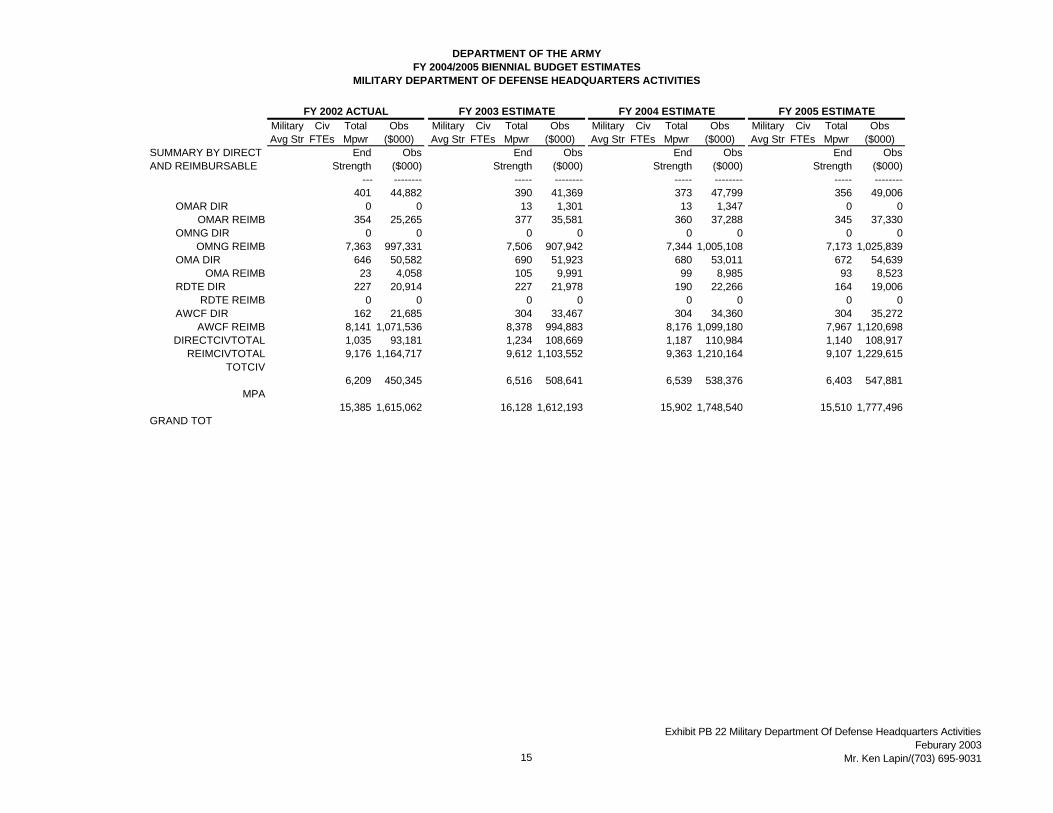
SUMMARY BY DIRECT End Obs End Obs End Obs End ObsAND REIMBURSABLE Strength ($000) Strength ($000) Strength ($000) Strength ($000)
----- -------- ----- -------- ----- -------- ----- -------- 401 44,882 390 41,369 373 47,799 356 49,006
OMAR DIR 0 0 13 1,301 13 1,347 0 0OMAR REIMB 354 25,265 377 35,581 360 37,288 345 37,330
OMNG DIR 0 0 0 0 0 0 0 0OMNG REIMB 7,363 997,331 7,506 907,942 7,344 1,005,108 7,173 1,025,839
OMA DIR 646 50,582 690 51,923 680 53,011 672 54,639OMA REIMB 23 4,058 105 9,991 99 8,985 93 8,523
RDTE DIR 227 20,914 227 21,978 190 22,266 164 19,006RDTE REIMB 0 0 0 0 0 0 0 0
AWCF DIR 162 21,685 304 33,467 304 34,360 304 35,272AWCF REIMB 8,141 1,071,536 8,378 994,883 8,176 1,099,180 7,967 1,120,698
DIRECTCIVTOTAL 1,035 93,181 1,234 108,669 1,187 110,984 1,140 108,917REIMCIVTOTAL 9,176 1,164,717 9,612 1,103,552 9,363 1,210,164 9,107 1,229,615
TOTCIV 6,209 450,345 6,516 508,641 6,539 538,376 6,403 547,881
MPA 15,385 1,615,062 16,128 1,612,193 15,902 1,748,540 15,510 1,777,496
GRAND TOT
15
Exhibit PB 22 Military Department Of Defense Headquarters ActivitiesFeburary 2003
Mr. Ken Lapin/(703) 695-9031

DEPARTMENT OF THE ARMYFY2004/2005 BIENNIAL BUDGET ESITMATESINTERNATIONAL MILITARY HEADQUARTERS
Military Civ Total Obs Military Civ Total Obs Military Civilian Total Obs Military Civilian Total ObsAvg Str FTEs Mpwr ($000) Avg Str FTEs Mpwr ($000) Avg Str FTEs Mpwr ($000) Avg Str FTEs Mpwr ($000)
INTERNATIONAL MILITARY HQS
1,243 51 1,294 80,308 0 1,239 51 1,290 88,217 1,162 51 1,213 93,704 1,318 51 1,369 106,634
1. NATO--IMS AND SACLANT
62 1 63 4,204 0 62 1 63 4,925 62 1 63 6,104 62 1 63 6,663
INTL MIL ACT 23 1 24 1,895 24 1 25 2,136 24 1 25 3,358 24 1 25 3,467 MPA 23 23 1,710 24 24 1,947 24 24 2,057 24 24 2,142 OMA 1 1 185 1 1 189 1 1 1,301 1 1 1,325
(DIR) 1 185 1 189 1 1,301 1 1,325 (REIMB) 0 0 0 0 0 0 0 0
HQ SACLANT 39 0 39 2,309 38 0 38 2,789 38 0 38 2,746 38 0 38 3,196 MPA 39 39 2,309 38 38 2,789 38 38 2,746 38 38 3,196 OMA 0 0 0 0 0 0 0 0 0 0 0 0
(DIR) 0 0 0 0 0 0 0 0 (REIMB) 0 0 0 0 0 0 0 0
2. NATO--ALLIED CMD EUROPE (ACE)
1,047 6 1,053 62,970 0 1,045 6 1,051 69,441 968 6 974 71,246 1,124 6 1,130 83,039
USAE SHAPE 1,047 6 1,053 62,970 0 1,045 6 1,051 69,441 968 6 974 71,246 1,124 6 1,130 83,039 MPA 1,047 1,047 57,862 1,045 1,045 64,181 968 968 61,941 1,124 1,124 73,511 OMA 6 6 5,108 6 6 5,260 6 6 9,305 6 6 9,528
(DIR) 2 4,758 2 4,902 2 8,937 2 9,151 (REIMB) 4 350 4 358 4 368 4 377
FY 2005 ESTIMATEFY 2003 ESTIMATEFY 2002 ACTUAL FY 2004 ESTIMATE
16
Exhibit PB-55 International Military HeadquartersFebruary 2003
Mr. Ken Lapin/(703) 695-5350

DEPARTMENT OF THE ARMYFY2004/2005 BIENNIAL BUDGET ESITMATESINTERNATIONAL MILITARY HEADQUARTERS
Military Civ Total Obs Military Civ Total Obs Military Civilian Total Obs Military Civilian Total ObsAvg Str FTEs Mpwr ($000) Avg Str FTEs Mpwr ($000) Avg Str FTEs Mpwr ($000) Avg Str FTEs Mpwr ($000)
3. OTHER INT'L ACTIVITIES
134 44 178 13,134 0 132 44 176 13,851 132 44 176 16,354 132 44 176 16,932
USAE NORAD 12 0 12 966 12 0 12 1,041 12 0 12 1,099 12 0 12 1,143 MPA 12 12 966 12 12 1,041 12 12 1,099 12 12 1,143 OMA 0 0 0 0 0 0 0 0 0 0 0 0
(DIR) 0 0 0 0 0 0 0 0 (REIMB) 0 0 0 0 0 0 0 0
USAE ROK/CFC 122 44 166 12,168 120 44 164 12,809 120 44 164 15,255 120 44 164 15,789 MPA 122 122 9,165 120 120 9,736 120 120 10,286 120 120 10,712 OMA 44 44 3,003 44 44 3,073 44 44 4,969 44 44 5,077
(DIR) 40 2,890 40 2,955 40 4,800 40 4,879 (REIMB) 4 113 4 118 4 169 4 198
Reconciliation of Increases/decreases.1. Decrease in USAE SHAPE military strength in FY04 is due to NATO realignment.2. Increase in USAE SHAPE military strength between FY04 and FY05 is due to activation of Deployable Command Modules.
FY 2002 ACTUAL FY 2003 ESTIMATE FY 2004 ESTIMATE FY 2005 ESTIMATE
17
Exhibit PB-55 International Military HeadquartersFebruary 2003
Mr. Ken Lapin/(703) 695-5350

DEPARTMENT OF THE ARMYFY2004/2005 BIENNIAL BUDGET ESITMATESINTERNATIONAL MILITARY HEADQUARTERS
Military Civ Total Obs Military Civ Total Obs Military Civilian Total Obs Military Civilian Total ObsAvg Str FTEs Mpwr ($000) Avg Str FTEs Mpwr ($000) Avg Str FTEs Mpwr ($000) Avg Str FTEs Mpwr ($000)
INTERNATIONAL MILITARY HQS
1,243 51 1,294 80,308 1,239 51 1,290 88,217 1,162 51 1,213 93,704 1,318 51 1,369 106,634
1. NATO--IMS AND ACLANT
62 1 63 4,204 62 1 63 4,925 62 1 63 6,104 62 1 63 6,663
2. NATO--ALLIED CMD EUROPE (ACE)
1,047 6 1,053 62,970 1,045 6 1,051 69,441 968 6 974 71,246 1,124 6 1,130 83,039
3. OTHER INT'L ACTIVITIES
134 44 178 13,134 132 44 176 13,851 132 44 176 16,354 132 44 176 16,932
Total Total Total TotalSUMMARY BY Total Obs Total Obs Total Obs Total ObsAPPROPRIATION Mpwr ($000) Mpwr ($000) Mpwr ($000) Mpwr ($000)
OMAR 0 0 0 0 0 0 0 0 OMARNG 0 0 0 0 0 0 0 0 OMA 51 8,296 51 8,522 51 15,575 51 15,930 RDTE 0 0 0 0 0 0 0 0 MPA 1,243 72,012 1,239 79,695 1,162 78,129 1,318 90,704 ACWF 0 0 0 0 0 0 0 0 TOTAL 1,294 80,308 1,290 88,217 1,213 93,704 1,369 106,634
FY 2002 ACTUAL FY 2003 ESTIMATE FY 2004 ESTIMATE FY 2005 ESTIMATE
FY 2002 FY 2003 FY 2004 FY 2005
18
Exhibit PB-55 International Military HeadquartersFebruary 2003
Mr. Ken Lapin/(703) 695-5350

DEPARTMENT OF THE ARMYFY2004/2005 BIENNIAL BUDGET ESITMATESINTERNATIONAL MILITARY HEADQUARTERS
SUMMARY BYDIRECT AND REIM End Obl End Obl End Obl End Obl
Str $000 Str $000 Str $000 Str $000 ------ --------- ------ --------- ------ --------- ------ ---------
OMAR DIRECT 0 0 0 0 0 0 0 0 0 0 0 0 0 0 0 0OMARNG DIRECT 0 0 0 0 0 0 0 0 0 0 0 0 0 0 0 0OMA DIRECT 43 7833 43 8046 43 15038 43 15355 8 463 8 476 8 537 8 575RDTE DIRECT 0 0 0 0 0 0 0 0 0 0 0 0 0 0 0 0AWCF DIRECT 0 0 0 0 0 0 0 0 0 0 0 0 0 0 0 0
DIRECT CIV TOTAL 43 7833 43 8046 43 15038 43 15355REIM CIV TOTAL 8 463 8 476 8 537 8 575
TOT CIV 51 8296 51 8522 51 15575 51 15930MPA 1243 72012 1239 79695 1162 78129 1318 90704GRAND TOTAL 1,294 80,308 1,290 88,217 1,213 93,704 1,369 106,634
FY 2002 FY 2003 FY 2004 FY 2005
19
Exhibit PB-55 International Military HeadquartersFebruary 2003
Mr. Ken Lapin/(703) 695-5350

DEPARTMENT OF THE ARMYFY 2004/2005 BIENNIAL BUDGET ESTIMATES
III. Financial Summary ($ Thousands):FY 2003
FY 2002 Budget Current FY 2004 FY 2005 FY 2003/FY 2004 FY 2003/FY 2005Actual Request Appn Estimate Estimate Estimate Change Change
Mission (O&M) 13,919 19,174 18,861 18,861 12,702 27,132 -6,159 8,271Base Operations
Military Personnel 1,568 0 0 0 0 0 0 0O&M 7,973 0 0 0 0 0 0 0
Military Personnel School Personnel 18,873 23,813 23,813 23,813 26,231 27,325 2,418 3,512
Total Direct Program 42,333 42,987 42,674 42,674 38,933 54,457 -3,741 11,783
Total Reimbursable Program 973 950 0 950 950 950 0 0
Total Direct and Reimbursable 43,306 43,937 42,674 43,624 39,883 55,407 -3,741 11,783
COMMAND AND GENERAL STAFF COLLEGE
I. Narrative Description: The Army Command and General Staff College is located at Fort Leavenworth, Kansas and is the Army’s intermediate professional military education school. The resident course is 41 weeks.
II. Description of Operations Financed: The Army Command and General Staff College provides intermediate level military education to officers of the Active and Reserve Components worldwide to prepare them for duty as field grade commanders and principal staff officers at brigade and higher echelons. The college also provides students with a firm foundation for continued professional growth. Costs for correspondence courses and seminars are excluded. These costs are incurred in other training accounts.
I. Narrative Description: The Army Command and General Staff College is located at Fort Leavenworth, Kansas and is the Army’s intermediate professional military education school.
II. Description of Operations Financed: The Army Command and General Staff College provides intermediate level military education to officers of the Active and Reserve Components worldwide to prepare them for duty as field grade commanders and principal staff officers at brigade and higher echelons. The college also provides students with a firm foundation for continued professional growth. The resident course is 40 weeks and 2 days. Costs for correspondence courses and seminars are excluded. These costs are incurred in other training accounts.
20
Exhibit PB-24 Professional Military Education SchoolsFebruary 2003
Ms. Kathy Troupe (703) 692-7492

DEPARTMENT OF THE ARMYFY 2004/2005 BIENNIAL BUDGET ESTIMATES
IV. Performance Criteria and Evaluation:FY 2002 FY 2003 FY 2004 FY 2005 FY 2003/FY 2004 FY 2003/FY 2005
Actual Estimate Estimate Estimate Change ChangeDirect Funded
Student Input 1,060 1,756 1,756 1,756 0 0Student Load 845 1,398 1,398 1,398 0 0Graduates 1,060 1,756 1,756 1,756 0 0
Reimbursable FundedStudent Input 91 91 91 91 0 0Student Load 77 77 77 77 0 0Graduates 91 91 91 91 0 0
Average Cost per Student Load ($000) 47 30 27 38
V. Personnel Summary: (exclude students)FY 2002 FY 2003 FY 2004 FY 2005 FY 2003/FY 2004 FY 2003/FY 2005
Actual Estimate Estimate Estimate Change ChangeMilitary End Strength (Total) 236 270 270 270 0 0
Officers 195 232 232 232 0 0Enlisted 41 38 38 38 0 0
Military Average Strength (Total) 236 270 270 270 0 0Officers 195 232 232 232 0 0Enlisted 41 38 38 38 0 0
Civilian End Strength (Total) 96 227 227 227 0 0USDH 96 227 227 227 0 0
Civilian Full-Time Equivalents (Total) 90 227 227 227 0 0USDH 90 227 227 227 0 0
COMMAND AND GENERAL STAFF COLLEGE
21
Exhibit PB-24 Professional Military Education SchoolsFebruary 2003
Ms. Kathy Troupe (703) 692-7492

DEPARTMENT OF THE ARMYFY 2004/2005 BIENNIAL BUDGET ESTIMATES
Narrative Explanation of Changes:
COMMAND AND GENERAL STAFF COLLEGE
FY 2003 - FY 2004: OMA mission dollars decrease between FY03 and FY04 because the new Intermediate Level Education (ILE) was not funded in FY04. Military Personnel costs increase due to the increase in Composite Rates for Military Pay.
FY 2003 - FY 2005: OMA mission dollars increase due to funding available in FY05 to support ILE instructors, support staff and other support costs for ILE core curriculum.
FY 2003 - FY 2004: This reduction reflects a FY 2003 one-time increase which allowed TRADOC to restructure the way the institutional Army trains and accesses soldiers and officers.
FY 2003 - FY 2005: OMA mission dollars increase due to funding available in FY05 to support ILE instructors, support staff and other support costs for ILE core curriculum.
22
Exhibit PB-24 Professional Military Education SchoolsFebruary 2003
Ms. Kathy Troupe (703) 692-7492

DEPARTMENT OF THE ARMYFY 2004/2005 BIENNIAL BUDGET ESTIMATES
III. Financial Summary ($ Thousands):FY 2003
FY 2002 Budget Current FY 2004 FY 2005 FY 2003/FY 2004 FY 2003/FY 2005Actual Request Appn Estimate Estimate Estimate Change Change
Mission (O&M) 24,917 25,270 26,570 26,570 29,489 30,266 2,919 3,696Base Operations
Military Personnel 687 0 0 0 0 0 0 0O&M 1,961 0 0 0 0 0 0 0
Military Personnel School Personnel 8,402 9,128 9,128 9,128 10,072 10,497 944 1,369
Total Direct Program 35,967 34,398 35,698 35,698 39,561 40,763 3,863 5,065
Total Reimbursable Program 1,182 1,200 1,200 1,200 1,200 1,200 0 0
Total Direct and Reimbursable 37,149 35,598 36,898 36,898 40,761 41,963 3,863 5,065
U.S. ARMY WAR COLLEGE
I. Narrative Description: The Army War College located in Carlisle, Pennsylvania, is the Army’s Senior Service School. The Army War College provides professional development education for selected officers and DOD civilians to prepare them to perform increasingly complex tasks as they progress in their careers. The College provides senior level education in the art and science of land warfare, performs strategic studies on the nature and use of the U.S. Army in peace and war and formulates strategic concepts in order to assist in achieving U.S. national objectives.
II. Description of Operations Financed: The U.S. Army War College Resident Course (44 weeks) to include funding and manpower for long and short term courses (i.e., Senior Service College Fellows, Defense Leadership and Management Program (DLAMP), Strategic Art program (FA59), Defense Strategy Course, Joint Flag Officer Warfighting Course, GO Courses, etc.). Excludes costs not associated with the Resident Course for the Center for Strategic Leadership, Strategic Studies Institute, Army Global Command and Control System (AGCCS), Army Physical Fitness Research Institute, Army Heritage and Education Center and the Department of Distance Education (Correspondence Studies).
23
Exhibit PB-24 Professional Military Education SchoolsFebruary 2003
Ms. Kathy Troupe (703) 692-7492

DEPARTMENT OF THE ARMYFY 2004/2005 BIENNIAL BUDGET ESTIMATES
IV. Performance Criteria and Evaluation:FY 2002 FY 2003 FY 2004 FY 2005 FY 2003/FY 2004 FY 2003/FY 2005
Actual Estimate Estimate Estimate Change ChangeDirect Funded
Student Input 293 298 298 298 0 0Student Load 258 262 262 262 0 0Graduates 293 298 298 298 0 0
Reimbursable FundedStudent Input 42 42 42 42 0 0Student Load 37 37 37 37 0 0Graduates 42 42 42 42 0 0
Average Cost per Student Load ($000) 126 123 136 140
V. Personnel Summary: (exclude students)FY 2002 FY 2003 FY 2004 FY 2005 FY 2003/FY 2004 FY 2003/FY 2005
Actual Estimate Estimate Estimate Change ChangeMilitary End Strength (Total) 107 107 107 107 0 0
Officers 85 85 85 85 0 0Enlisted 22 22 22 22 0 0
Military Average Strength (Total) 107 107 107 107 0 0Officers 85 85 85 85 0 0Enlisted 22 22 22 22 0 0
Civilian End Strength (Total) 143 143 143 143 0 0USDH 143 143 143 143 0 0
Civilian Full-Time Equivalents (Total) 143 143 143 143 0 0USDH 143 143 143 143 0 0
U.S. ARMY WAR COLLEGE
24
Exhibit PB-24 Professional Military Education SchoolsFebruary 2003
Ms. Kathy Troupe (703) 692-7492

DEPARTMENT OF THE ARMYFY 2004/2005 BIENNIAL BUDGET ESTIMATES
Narrative Explanation of Changes:
U.S. ARMY WAR COLLEGE
FY 2003 - FY 2004: Army War College (AWC) funding increases to meet increased requirements for modernization of curriculum in direct support of Army Transformation, a new Strategic Art program and unique information technology needed for simulations and experiential learning. The Army's Strategic Art program (FA59 Qualification Course) will provide officers newly designated into the Strategic Plans and Policy Functional Area 59 an introduction to strategy and to unique skills, knowledge and attributes. The Strategic Art program is a necessary foundation for officers' progressive development as Army strategists. Funding to support unique information technology infrastructure is essential to supporting the CSA guidance for conducting simulations and exercises with the senior Army commanders, the Combatant Command, Joint Staff, and other Senior Service Colleges in producing the Army's strategic leaders in the 21st Century.
FY 2003 - FY 2005: Same as above with cost growth.
25
Exhibit PB-24 Professional Military Education SchoolsFebruary 2003
Ms. Kathy Troupe (703) 692-7492

DEPARTMENT OF THE ARMYFY 2004/2005 BIENNIAL BUDGET ESTIMATES
III. Financial Summary ($ Thousands):FY 2003
FY 2002 Budget Current FY 2004 FY 2005 FY 2003/FY 2004 FY 2003/FY 2005Actual Request Appn Estimate Estimate Estimate Change Change
Mission (O&M) 56,978 59,154 58,461 58,461 71,336 76,688 12,875 18,227Base Operations
Military Personnel 0 0 0 0 0 0 0 0O&M 0 0 0 0 0 0 0 0
Military Personnel School Personnel 26,453 27,538 27,538 27,538 28,667 29,842 1,129 2,304
Total Direct Program 83,431 86,692 85,999 85,999 100,003 106,530 14,004 20,531
Total Reimbursable Program 17,776 0 0 17,800 18,000 18,500 200 700
Total Direct and Reimbursable 101,207 86,692 85,999 103,799 118,003 125,030 14,204 21,231
NATIONAL DEFENSE UNIVERSITY
I. Narrative Description: The National Defense University (NDU) is the senior joint professional military educational and research institution operating under the direction of the Chairman, Joint Chiefs of Staff, with the Army as executive agent for the University's components located on the Fort McNair campus in Washington, DC.
II. Description of Operations Financed: NDU is chartered to ensure excellence in professional military education and research in the essential elements of national security. NDU prepares selected commissioned officers and civilian officials from the Department of Defense, Department of State and other agencies of the government for high level command, management and staff responsibilities in a multinational, intergovernmental or joint national security settings.
The National War College (NWC) and the Industrial College of the Armed Forces (ICAF) offer the principal PME courses of instruction at the Fort McNair campus. Budget data for these colleges are included in this exhibit and as separate exhibits. Budget data for Information Resources Management College (IRMC), the International Fellows Program, NATO Staff Officers’ Orientation Course, Office of Reserve Affairs, CAPSTONE Course, the Center for Hemispheric Defense Studies (CHDS), the Africa Center for Strategic Studies (ACSS), the Near East South Asia Center for Strategic Studies (NESA), The School for National Security Executive Education (SNSEE) and the Institute for National Strategic Studies (INSS) which includes the Center for the Study of Chinese Military Affairs, are part of this summary exhibit.
26
Exhibit PB-24 Professional Military Education SchoolsFebruary 2003
Ms. Kathy Troupe (703) 692-7492
DEPARTMENT OF THE ARMYFY 2004/2005 BIENNIAL BUDGET ESTIMATES
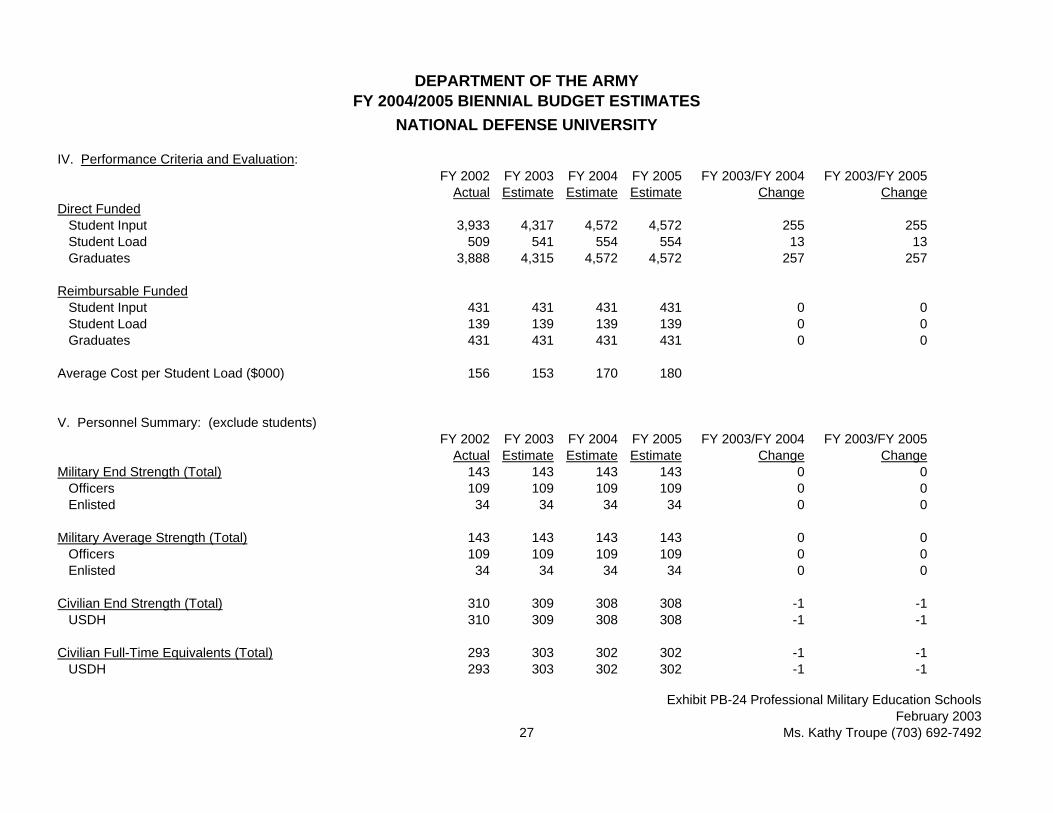
IV. Performance Criteria and Evaluation:FY 2002 FY 2003 FY 2004 FY 2005 FY 2003/FY 2004 FY 2003/FY 2005
Actual Estimate Estimate Estimate Change ChangeDirect Funded
Student Input 3,933 4,317 4,572 4,572 255 255Student Load 509 541 554 554 13 13Graduates 3,888 4,315 4,572 4,572 257 257
Reimbursable FundedStudent Input 431 431 431 431 0 0Student Load 139 139 139 139 0 0Graduates 431 431 431 431 0 0
Average Cost per Student Load ($000) 156 153 170 180
V. Personnel Summary: (exclude students)FY 2002 FY 2003 FY 2004 FY 2005 FY 2003/FY 2004 FY 2003/FY 2005
Actual Estimate Estimate Estimate Change ChangeMilitary End Strength (Total) 143 143 143 143 0 0
Officers 109 109 109 109 0 0Enlisted 34 34 34 34 0 0
Military Average Strength (Total) 143 143 143 143 0 0Officers 109 109 109 109 0 0Enlisted 34 34 34 34 0 0
Civilian End Strength (Total) 310 309 308 308 -1 -1USDH 310 309 308 308 -1 -1
Civilian Full-Time Equivalents (Total) 293 303 302 302 -1 -1USDH 293 303 302 302 -1 -1
NATIONAL DEFENSE UNIVERSITY
27
Exhibit PB-24 Professional Military Education SchoolsFebruary 2003
Ms. Kathy Troupe (703) 692-7492

DEPARTMENT OF THE ARMYFY 2004/2005 BIENNIAL BUDGET ESTIMATES
Narrative Explanation of Changes:
NATIONAL DEFENSE UNIVERSITY
FY 2003 - FY 2004: Additional funding provides for information technology upgrades, contract support, and supplies at regional centers. An increase also occured in military pay compensation and inflation.
FY 2003 - FY 2005: Additional funding provides for information technology upgrades, contract support, and supplies at regional centers. An increase also occured in military pay compensation and inflation.
28
Exhibit PB-24 Professional Military Education SchoolsFebruary 2003
Ms. Kathy Troupe (703) 692-7492
DEPARTMENT OF THE ARMYFY 2004/2005 BIENNIAL BUDGET ESTIMATES
III. Financial Summary ($ Thousands):FY 2003
FY 2002 Budget Current FY 2004 FY 2005 FY 2003/FY 2004 FY 2003/FY 2005Actual Request Appn Estimate Estimate Estimate Change Change
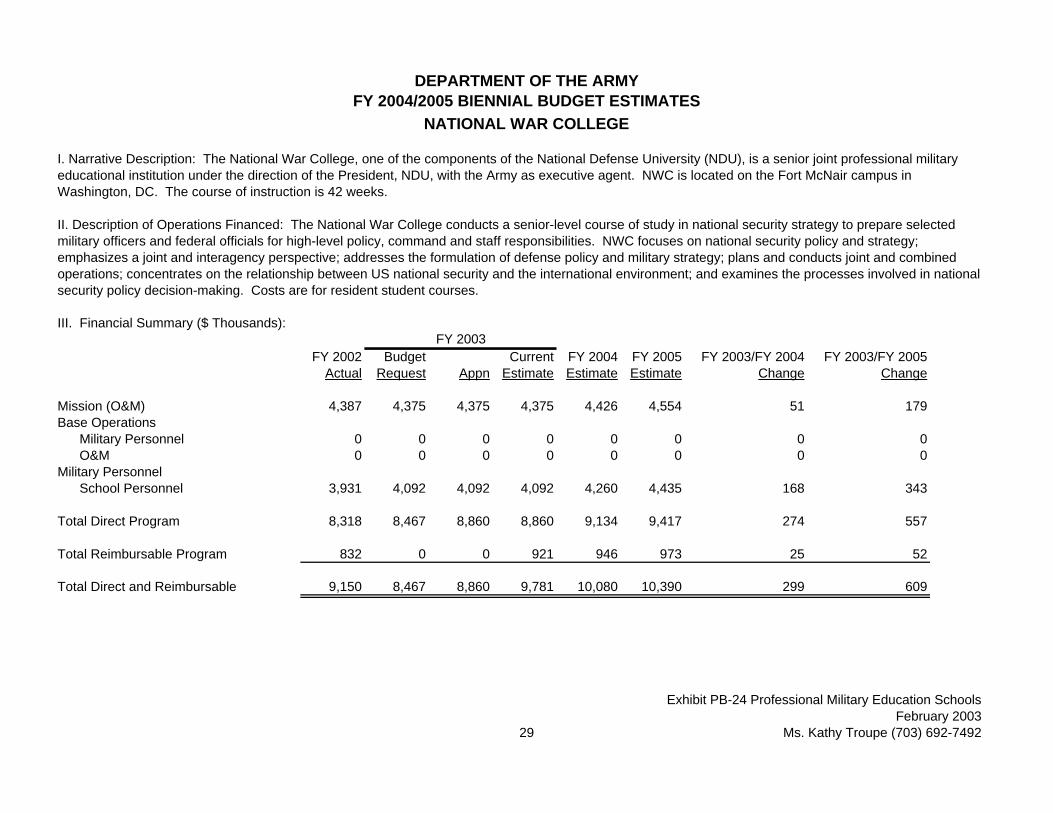
Mission (O&M) 4,387 4,375 4,375 4,375 4,426 4,554 51 179Base Operations
Military Personnel 0 0 0 0 0 0 0 0O&M 0 0 0 0 0 0 0 0
Military Personnel School Personnel 3,931 4,092 4,092 4,092 4,260 4,435 168 343
Total Direct Program 8,318 8,467 8,860 8,860 9,134 9,417 274 557
Total Reimbursable Program 832 0 0 921 946 973 25 52
Total Direct and Reimbursable 9,150 8,467 8,860 9,781 10,080 10,390 299 609
NATIONAL WAR COLLEGE
I. Narrative Description: The National War College, one of the components of the National Defense University (NDU), is a senior joint professional military educational institution under the direction of the President, NDU, with the Army as executive agent. NWC is located on the Fort McNair campus in Washington, DC. The course of instruction is 42 weeks.
II. Description of Operations Financed: The National War College conducts a senior-level course of study in national security strategy to prepare selected military officers and federal officials for high-level policy, command and staff responsibilities. NWC focuses on national security policy and strategy; emphasizes a joint and interagency perspective; addresses the formulation of defense policy and military strategy; plans and conducts joint and combined operations; concentrates on the relationship between US national security and the international environment; and examines the processes involved in national security policy decision-making. Costs are for resident student courses.
29
Exhibit PB-24 Professional Military Education SchoolsFebruary 2003
Ms. Kathy Troupe (703) 692-7492

DEPARTMENT OF THE ARMYFY 2004/2005 BIENNIAL BUDGET ESTIMATES
IV. Performance Criteria and Evaluation:FY 2002 FY 2003 FY 2004 FY 2005 FY 2003/FY 2004 FY 2003/FY 2005
Actual Estimate Estimate Estimate Change ChangeDirect Funded
Student Input 147 158 158 158 0 0Student Load 123 133 133 133 0 0Graduates 146 158 158 158 0 0
Reimbursable FundedStudent Input 48 50 50 50 0 0Student Load 40 42 42 42 0 0Graduates 48 50 50 50 0 0
Average Cost per Student Load ($000) 56 56 58 59
V. Personnel Summary: (exclude students)FY 2002 FY 2003 FY 2004 FY 2005 FY 2003/FY 2004 FY 2003/FY 2005
Actual Estimate Estimate Estimate Change ChangeMilitary End Strength (Total) 25 25 25 25 0 0
Officers 24 24 24 24 0 0Enlisted 1 1 1 1 0 0
Military Average Strength (Total) 18 18 18 18 0 0Officers 18 18 18 18 0 0Enlisted 0 0 0 0 0 0
Civilian End Strength (Total) 34 34 34 34 0 0USDH 34 34 34 34 0 0
Civilian Full-Time Equivalents (Total) 35 35 35 35 0 0USDH 35 35 35 35 0 0
NATIONAL WAR COLLEGE
30
Exhibit PB-24 Professional Military Education SchoolsFebruary 2003
Ms. Kathy Troupe (703) 692-7492

DEPARTMENT OF THE ARMYFY 2004/2005 BIENNIAL BUDGET ESTIMATES
Narrative Explanation of Changes:
NATIONAL WAR COLLEGE
FY 2003 - FY 2004: Increase is due to price growth.
FY 2003 - FY 2005: Increase is due to price growth.
31
Exhibit PB-24 Professional Military Education SchoolsFebruary 2003
Ms. Kathy Troupe (703) 692-7492

DEPARTMENT OF THE ARMYFY 2004/2005 BIENNIAL BUDGET ESTIMATES
III. Financial Summary ($ Thousands):FY 2003
FY 2002 Budget Current FY 2004 FY 2005 FY 2003/FY 2004 FY 2003/FY 2005Actual Request Appn Estimate Estimate Estimate Change Change
Mission (O&M) 5,585 5,764 5,764 5,764 5,871 6,057 107 293Base Operations
Military Personnel 0 0 0 0 0 0 0 0O&M 0 0 0 0 0 0 0 0
Military Personnel School Personnel 2,677 2,884 0 2,884 3,168 3,298 284 414
Total Direct Program 8,262 8,648 5,764 8,648 9,039 9,355 391 707
Total Reimbursable Program 2,101 2,101 0 2,101 2,101 2,101 0 0
Total Direct and Reimbursable 10,363 10,749 5,764 10,749 11,140 11,456 391 707
INDUSTRIAL COLLEGE OF THE UNITED STATES
I. Narrative Description: The Industrial College of the Armed Forces (ICAF), one of the components of the National Defense University (NDU), is a senior joint professional military educational institution under the direction of the President, NDU, with the Army as executive agent. ICAF is located on the Fort McNair campus in Washington, DC. The course of instruction is 42 weeks.
II. Description of Operations Financed: ICAF prepares selected military officers and civilians for senior leadership and staff positions by conducting post-graduate, executive-level courses of study and associated research dealing with the resource component of national power, with special emphasis on materiel acquisition and joint logistics, and their integration into national security strategy for peace and war. Under the direction of the Under Secretary of Defense for Acquisition and Technology, ICAF serves as the course provider for the Senior Acquisition Course directed by the Defense Acquisition Workforce Improvement Act. In this capacity, ICAF acts as a consortium college of the Defense Acquisition University (DAU).
32
Exhibit PB-24 Professional Military Education SchoolsFebruary 2003
Ms. Kathy Troupe (703) 692-7492

DEPARTMENT OF THE ARMYFY 2004/2005 BIENNIAL BUDGET ESTIMATES
IV. Performance Criteria and Evaluation:FY 2002 FY 2003 FY 2004 FY 2005 FY 2003/FY 2004 FY 2003/FY 2005
Actual Estimate Estimate Estimate Change ChangeDirect Funded
Student Input 203 199 201 201 2 2Student Load 170 167 169 169 2 2Graduates 203 199 201 201 2 2
Reimbursable FundedStudent Input 106 101 106 101 5 0Student Load 89 85 89 85 4 0Graduates 106 101 106 101 5 0
Average Cost per Student Load ($000) 40 43 43 45
V. Personnel Summary: (exclude students)FY 2002 FY 2003 FY 2004 FY 2005 FY 2003/FY 2004 FY 2003/FY 2005
Actual Estimate Estimate Estimate Change ChangeMilitary End Strength (Total) 31 31 31 31 0 0
Officers 30 30 30 30 0 0Enlisted 1 1 1 1 0 0
Military Average Strength (Total) 30 30 30 30 0 0Officers 30 30 30 30 0 0Enlisted 0 0 0 0 0 0
Civilian End Strength (Total) 52 52 52 52 0 0USDH 52 52 52 52 0 0
Civilian Full-Time Equivalents (Total) 51 51 51 51 0 0USDH 51 51 51 51 0 0
INDUSTRIAL COLLEGE OF THE UNITED STATES
33
Exhibit PB-24 Professional Military Education SchoolsFebruary 2003
Ms. Kathy Troupe (703) 692-7492

DEPARTMENT OF THE ARMYFY 2004/2005 BIENNIAL BUDGET ESTIMATES
Narrative Explanation of Changes:
INDUSTRIAL COLLEGE OF THE UNITED STATES
FY 2003 - FY 2004: Increase due to price growth.
FY 2003 - FY 2005: Increase due to price growth.
34
Exhibit PB-24 Professional Military Education SchoolsFebruary 2003
Ms. Kathy Troupe (703) 692-7492

DEPARTMENT OF THE ARMYFY 2004/2005 BIENNIAL BUDGET ESTIMATES
III. Financial Summary ($ Thousands):FY 2003
FY 2002 Budget Current FY 2004 FY 2005 FY 2003/FY 2004 FY 2003/FY 2005Actual Request Appn Estimate Estimate Estimate Change Change
Mission (O&M) 1,836 1,886 1,886 2,932 1,827 1,871 -1,105 -1,061Base Operations
Military Personnel 0 0 0 0 0 0 0 0O&M 135 0 0 0 0 0 0 0
Military Personnel School Personnel 9,482 10,001 0 10,001 11,418 12,004 1,417 2,003
Total Direct Program 11,453 11,887 1,886 12,933 13,245 13,875 312 942
Total Reimbursable Program 198 186 186 186 186 186 0 0
Total Direct and Reimbursable 11,651 12,073 2,072 13,119 13,431 14,061 312 942
SERGEANTS MAJOR ACADEMY (SMA)
I. Narrative Description: The U.S. Army Sergeants Major Academy (SMA) is located at Fort Bliss, Texas, and is the senior leader professional development institution for the Army's non-commissioned officer (NCO).
II. Description of Operations Financed: The U.S. Army Sergeants Major Academy (SMA) is funded for the training and education of senior Army Noncommissioned Officer students and thieir spouses. Training program for resident courses consists of the USA Sergeants Major Course (654 students, 9 months, held once a year), the USA Command Sergeants Major Course (267 students, 1 week, held 6 times a year), and the USA Command Sergeants Major Spouse Seminar (141 students, 1 week, held 5 times a year).
I. Narrative Description: The U.S. Army Sergeants Major Academy (SMA) is located at Fort Bliss, Texas, and is the senior leader professional development institution for the Army's non-commissioned officer (NCO).
II. Description of Operations Financed: The U.S. Army Sergeants Major Academy (SMA) is funded for the training and education of senior Army Noncommissioned Officer students and their spouses. Training program for resident courses consists of the USA Sergeants Major Course (FY 03 674/FY 04 677/FY 05 675 students, 9 months, held once a year), the USA Command Sergeants Major Course (FY 03 223/FY 04/198/FY 05 195 students, 1 week, held 6 times a year), and the USA Command Sergeants Major Spouse Seminar (FY03 91/FY 04 91/FY 05 96 students, 1 week, held 5 times a year).
35
Exhibit PB-24 Professional Military Education SchoolsFebruary 2003
Ms. Kathy Troupe (703) 692-7492
DEPARTMENT OF THE ARMYFY 2004/2005 BIENNIAL BUDGET ESTIMATES
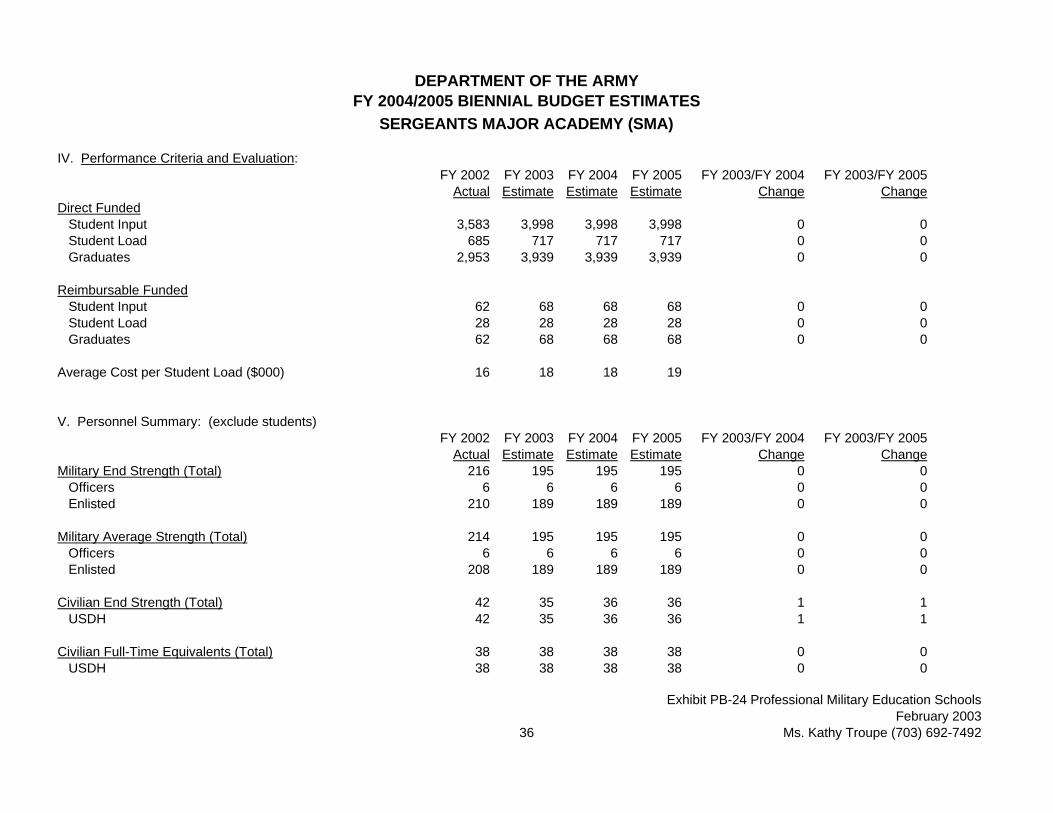
IV. Performance Criteria and Evaluation:FY 2002 FY 2003 FY 2004 FY 2005 FY 2003/FY 2004 FY 2003/FY 2005
Actual Estimate Estimate Estimate Change ChangeDirect Funded
Student Input 3,583 3,998 3,998 3,998 0 0Student Load 685 717 717 717 0 0Graduates 2,953 3,939 3,939 3,939 0 0
Reimbursable FundedStudent Input 62 68 68 68 0 0Student Load 28 28 28 28 0 0Graduates 62 68 68 68 0 0
Average Cost per Student Load ($000) 16 18 18 19
V. Personnel Summary: (exclude students)FY 2002 FY 2003 FY 2004 FY 2005 FY 2003/FY 2004 FY 2003/FY 2005
Actual Estimate Estimate Estimate Change ChangeMilitary End Strength (Total) 216 195 195 195 0 0
Officers 6 6 6 6 0 0Enlisted 210 189 189 189 0 0
Military Average Strength (Total) 214 195 195 195 0 0Officers 6 6 6 6 0 0Enlisted 208 189 189 189 0 0
Civilian End Strength (Total) 42 35 36 36 1 1USDH 42 35 36 36 1 1
Civilian Full-Time Equivalents (Total) 38 38 38 38 0 0USDH 38 38 38 38 0 0
SERGEANTS MAJOR ACADEMY (SMA)
36
Exhibit PB-24 Professional Military Education SchoolsFebruary 2003
Ms. Kathy Troupe (703) 692-7492

DEPARTMENT OF THE ARMYFY 2004/2005 BIENNIAL BUDGET ESTIMATES
Narrative Explanation of Changes:
SERGEANTS MAJOR ACADEMY (SMA)
FY 2003 - FY 2004: FY 03 mission funding is higher due to a three-year pilot program for alternative staffing (part of Army Developement System XXI), that is funded in FY 03 but not in FY 04/05 . This ODCSPER initiative provides the academy with contracted, retired Sergeants Major with the requisite experience, knowledge and training to serve as instructors and mentors. Increase in funding for Military School Personnel in FY 04 is due to the increase in Standard Military Composite Rates.
FY 2003 - FY 2005: Same as Above.
FY 2003 - FY 2004: FY 03 mission funding is higher due to a three-year pilot program for alternative staffing (part of Army Development System XXI). This ODCSPER initiative provides the academy with contracted, retired Sergeants Major with the requisite experience, knowledge and training to serve as instructors and mentors. Increase in funding for Military School Personnel in FY 04 is due to the increase in Standard Military Composite Rates.
FY 2003 - FY 2005: Same as Above.
37
Exhibit PB-24 Professional Military Education SchoolsFebruary 2003
Ms. Kathy Troupe (703) 692-7492

DEPARTMENT OF THE ARMYFY2004/2005 BIENNIAL BUDGET ESTIMATES
ADVISORY AND ASSISTANCE SERVICES($ in Thousands)
Appropriation: Operation & Maintenance, FY 2002 FY 2003 FY 2004 FY 2005Army (2020)
I. Management & Professional 220,178$ 91,038$ 93,366$ 93,280$ Support Services
FFRDC Work 7,045$ 6,942$ 6,407$ 6,692$ Non-FFRDC Work 213,133$ 84,096$ 86,959$ 86,588$
II. Studies, Analyses & 59,239$ 20,013$ 21,815$ 22,253$ Evaluations
FFRDC Work 4,329$ 1,010$ 621$ 1,034$ Non-FFRDC Work 54,910$ 19,003$ 21,194$ 21,219$
III. Engineering & Technical 111,704$ 112,804$ 112,892$ 114,188$ Services
FFRDC Work 11,424$ 5,459$ 5,243$ 5,362$ Non-FFRDC Work 100,280$ 107,345$ 107,649$ 108,825$
Total Direct 391,121$ 223,854$ 228,073$ 229,721$ FFRDC Work 22,798$ 13,411$ 12,271$ 13,088$ Non-FFRDC Work 368,323$ 210,443$ 215,802$ 216,633$
Total Reimbursable 0$ 0$ 0$ 0$
Total 391,121$ 223,854$ 228,073$ 229,721$
38
Exhibit PB-15 Advisory and Assistance ServicesFebruary 2003
Mr. Robert C. Claude (703) 607-3418

Exhibit OP-34 Appropriated Fund Support For Morale, Welfare and Recreation Activities February 2003
39 Mr. Dennis Walsh/(703) 681-7308
DEPARTMENT OF THE ARMY FY2004/2005 BIENNIAL BUDGET ESTIMATES
APPROPRIATED FUND SUPPORT FOR MORALE, WELFARE AND RECREATION ACTIVITIES (MWR) ($ in Thousands)
1. The Morale, Welfare and Recreation (MWR) portion of the OP34 displays total appropriated fund (APF)(direct/indirect) support for Department of the Army managed Morale, Welfare and Recreation (MWR) programs and joint services managed programs. This includes the Army and Air Force Exchange Service (Army support provided as executive agent). The MWR programs are vital to mission accomplishment and form an integral part of the non-pay compensation system. These programs provide a sense of community among patrons and provide support services commonly furnished by other employers, or other State and local governments and citizens. The MWR programs encourage positive individual values, and aid in recruitment and retention of personnel. They provide for the physical, cultural, and social needs, and general well-being of Service members and their families, providing community support systems that make DoD bases temporary hometowns for a mobile military population. 2. This information, spanning FYs 01-09 is arrayed by the DOD categorization of MWR: A-Mission Sustaining Programs, B-Basic Community Support Programs, C-Revenue Generating Activities, Supplemental Mission and Lodging Programs. 3. It is important to note numerous budgetary items, as presented in this Exhibit, are in fact duplicative of other authorization processes. Though an exhibit to the Operation and Maintenance, Army (OMA) appropriation, non-OMA amounts exist in the total for Military Personnel, Army (MPA), and Military Construction, Army (MCA 4. Support to the Stars and Stripes newspapers reflects only Army support. 5. Any Base Realignment and Closure related major construction is not included. 6. Morale, Welfare, and Recreation Funding has been reduced in response to other Army higher priority requirements. These reductions impact child services and community recreation programs.

DEPARTMENT OF THE ARMYFY2004/2005 BIENNIAL BUDGET ESTIMATES
APPROPRIATED FUND SUPPORT FOR MORALE, WELFARE AND RECREATION ACTIVITIES($ in Millions)
FY 2002 FY 2003 FY 2004 FY 2005
Military MWR ProgramsA--Mission Sustaining ProgramsA.3.-Physical Fitness and Aquatic Training 39.335 39.335 35.402 39.335A.4.-Library Programs & Information Services (Recreation) 24.981 24.981 22.483 24.981A.5.-On-Installation Parks and Picnic Areas 3.271 3.271 2.944 3.271A.6.- Basic Social Recreation (Center) Programs 8.768 8.768 7.891 8.768A.7.-Shipboard, Company, and/or Unit Level Programs 0.079 0.079 0.071 0.079A.8.-Sports and Athletics 14.603 14.603 13.143 14.603
91.037 91.037 81.934 91.037
Overhead 28.475 26.550 16.306 23.279Total Direct Support 119.512 117.587 98.240 114.316
Indirect Support 27.692 28.246 2.811 29.387Total Support - Mission Sustaining Programs 147.204 145.833 101.051 143.703
USA Pratice (memo) 30.315 30.315 28.115 30.315
Civilian Direct FTE 1289 1294 1298 1292Civilian Foreign Direct FTE 22 21 21 21Civilian Foreign Indirect FTE 107 120 120 120Civilian URD/USA FTE 400 400 400 400Total Civilians 1818 1835 1839 1833
40
Exhibit OP-34 Appropriated Fund Support For Morale, Welfare and Recreation ActivitiesFebruary 2003
Mr. Dennis Walsh/(703) 681-7308

DEPARTMENT OF THE ARMYFY2004/2005 BIENNIAL BUDGET ESTIMATES
APPROPRIATED FUND SUPPORT FOR MORALE, WELFARE AND RECREATION ACTIVITIES($ in Millions)
FY 2002 FY 2003 FY 2004 FY 2005B-- Basic Community Support ProgramsB.1 Child Development SystemB.1.1 Child Development Centers 151.361 153.713 144.602 164.577B.1.2 Family Child Care 0.000 0.000 0.000 0.000B.1.3 Supplemental Program/Resource & Referral/Other 0.000 0.000 0.000 0.000B.1.4 School Age Care 0.000 0.000 0.000 0.000B.1.5 Youth Program 39.281 60.396 50.781 51.543Total Child Development System 190.642 214.109 195.383 216.120
B.2 Community ProgramsB.2.1 Cable and/or Community Television (TV) 0.504 0.504 0.252 0.340B.2.2 Recreation Information, Tickets, and Tours Services 1.435 1.435 0.718 0.967B.2.3 Recreational Swimming 5.383 5.383 2.697 3.631Total Community Programs 7.322 7.322 3.667 4.938
B.3 ProgramsB.3.1 Directed Outdoor Recreation 8.619 8.619 4.318 5.814B.3.2 Outdoor Recreation Equipment Checkout 1.629 1.629 0.815 1.098B.3.3 Boating w/o Resale or Private Berthing 0.938 0.938 0.469 0.632B.3.4 Camping (Primitive and/or tents) 0.254 0.254 0.128 0.171B.3.5 Riding Stables, Government-owned or -leased 0.342 0.342 0.172 0.232Total B.3 Programs 11.782 11.782 5.902 7.947
B.4 ProgramsB.4.2 Performing Arts (Music, Drama, and Theater) 1.968 1.968 0.986 1.327B.4.3 Arts and Crafts Skill Development 5.529 5.529 2.770 3.729B.4.4 Automotive Crafts Skill Development 7.948 7.948 3.982 5.361B.4.5 Bowling (12 lanes or less) 1.320 1.320 0.662 0.891Total B.4 Programs 16.765 16.765 8.400 11.308
41
Exhibit OP-34 Appropriated Fund Support For Morale, Welfare and Recreation ActivitiesFebruary 2003
Mr. Dennis Walsh/(703) 681-7308

DEPARTMENT OF THE ARMYFY2004/2005 BIENNIAL BUDGET ESTIMATES
APPROPRIATED FUND SUPPORT FOR MORALE, WELFARE AND RECREATION ACTIVITIES($ in Millions)
FY 2002 FY 2003 FY 2004 FY 2005B.5 ProgramsB.5 Sports (Above Intramural Level) 1.465 1.465 0.733 0.987Total Program Operation 227.976 251.443 214.085 241.300
Overhead 56.609 52.780 25.786 36.813Total Direct Support 284.585 304.223 239.871 278.113
Indirect Support 31.981 32.621 33.273 33.938Total Support - Basic Community Support Programs 316.566 336.844 273.144 312.051
USA Pratice (memo) 86.486 86.486 66.886 78.486
Civilian Direct FTE 3162 3162 3169 3161Civilian Foreign Direct FTE 19 19 19 19Civilian Foreign Indirect FTE 121 125 125 124Civilian URD/USA FTE 1150 1150 1150 1150Total Civilians 4452 4456 4463 4454
42
Exhibit OP-34 Appropriated Fund Support For Morale, Welfare and Recreation ActivitiesFebruary 2003
Mr. Dennis Walsh/(703) 681-7308

DEPARTMENT OF THE ARMYFY2004/2005 BIENNIAL BUDGET ESTIMATES
APPROPRIATED FUND SUPPORT FOR MORALE, WELFARE AND RECREATION ACTIVITIES($ in Millions)
FY 2002 FY 2003 FY 2004 FY 2005C-- Revenue-Generating ProgramsC.1 ProgramsC.1.1 Military Open Mess (Clubs) 1.635 1.635 1.472 1.472C.4 ProgramsC.4.8 Other 0.426 0.426 0.383 0.383Total Program Operation 2.061 2.061 1.855 1.855
Overhead 5.280 4.922 4.057 4.057Total Direct Support 7.341 6.983 5.912 5.912
Indirect Support 18.274 18.639 19.012 19.392Total Support - Revenue-Generating Programs 25.615 25.622 24.924 25.304
USA Pratice (memo) 4.764 4.769 2.104 2.201
Civilian Direct FTE 37 37 43 37Civilian Foreign Direct FTE 1 1 1 1Civilian Foreign Indirect FTE 6 6 6 6Civilian URD/USA FTE 78 78 78 78Total Civilians 122 122 128 122
Civilian MWRIndirect Support 0.000 0.000 0.000 0.000Total Funding 0.000 0.000 0.000 0.000
43
Exhibit OP-34 Appropriated Fund Support For Morale, Welfare and Recreation ActivitiesFebruary 2003
Mr. Dennis Walsh/(703) 681-7308

DEPARTMENT OF THE ARMYFY2004/2005 BIENNIAL BUDGET ESTIMATES
APPROPRIATED FUND SUPPORT FOR MORALE, WELFARE AND RECREATION ACTIVITIES($ in Millions)
FY 2002 FY 2003 FY 2004 FY 2005Lodging ProgramTDY LodgingIndirect Support 0.048 0.048 0.048 0.048Total Funding 0.048 0.048 0.048 0.048
PCS Lodging (Not MWR Category C)Indirect Support 7.125 7.125 7.125 7.125Total Funding 7.125 7.125 7.125 7.125
Supplemental Mission NAFIsIndirect Support 0.148 0.148 0.148 0.148Total Funding 0.148 0.148 0.148 0.148
Armed Services ExchangeIndirect Support 148.032 149.450 142.207 145.052Total Funding 148.032 149.450 142.207 145.052
Family SupportDirect Program Operation 55.217 56.846 57.677 75.499Total Funding 55.217 56.846 57.677 75.499
Off Duty and Voluntary EducationOther Voluntary Education ProgramsDirect Program Operation 0.000 0.000 0.000 0.000Total Funding 0.000 0.000 0.000 0.000
Tuition AsistanceDirect Program Operation 0.000 0.000 0.000 0.000Total Funding 0.000 0.000 0.000 0.000
Stars and StripesIndirect Support 0.777 0.777 0.777 0.777Total Funding 0.777 0.777 0.777 0.777
44
Exhibit OP-34 Appropriated Fund Support For Morale, Welfare and Recreation ActivitiesFebruary 2003
Mr. Dennis Walsh/(703) 681-7308

DEPARTMENT OF THE ARMYFY 2004/2005 BIENNIAL BUDGET ESTIMATES
DEPOT MAINTENANCE PROGRAM($ in Millions)
FY 2001 FY 2002 FY 2003 FY 2004 FY 2005 FY 2006 FY 2007 FY 2008 FY 2009
Active Organic
AircraftWPN SYS
AirframeFunded Units 63 23 27 34 48 48 48 55 56Required Units 87 43 44 42 51 53 49 56 57
Delta -24 -20 -17 -8 -3 -5 -1 -1 -1
Funded TOA 52.941 77.563 141.546 173.816 215.171 207.056 209.174 225.854 225.959Required TOA 111.148 139.775 170.759 174.016 248.711 210.156 216.554 234.014 233.799
Delta -58.207 -62.212 -29.213 -0.200 -33.540 -3.100 -7.380 -8.160 -7.840
Software
Funded Units 0 0 0 0 0 0 0 0 0Required Units 0 0 0 0 0 0 0 0 0
Delta 0 0 0 0 0 0 0 0 0
Funded TOA 0.837 2.679 0.873 1.683 2.056 1.140 2.268 2.751 2.899Required TOA 2.885 2.679 3.282 3.332 3.445 3.745 3.909 4.075 4.248
Delta -2.048 0.000 -2.409 -1.648 -1.389 -2.605 -1.641 -1.325 -1.349
Other
Funded Units 1692 434 595 88 728 978 1123 1055 1055Required Units 1874 759 771 939 1019 1174 1358 1055 1055
Delta -182 -325 -176 -851 -291 -196 -235 0 0
Funded TOA 6.124 0.709 22.273 9.691 12.375 15.846 18.040 7.558 7.644Required TOA 7.968 10.378 23.813 30.336 32.191 33.202 35.009 7.558 7.644
Delta -1.844 -9.669 -1.540 -20.645 -19.816 -17.357 -16.969 0.000 0.000
45
Exhibit OP 30 Depot Maintenance ProgramFebruary 2003
Ms. LeVan Nguyen (703) 614-1197

DEPARTMENT OF THE ARMYFY 2004/2005 BIENNIAL BUDGET ESTIMATES
DEPOT MAINTENANCE PROGRAM($ in Millions)
FY 2001 FY 2002 FY 2003 FY 2004 FY 2005 FY 2006 FY 2007 FY 2008 FY 2009
Combat VehiclesWPN SYS
Vehicle
Funded Units 345 219 208 194 188 245 213 57 57Required Units 540 386 243 254 243 258 213 57 57
Delta -195 -167 -35 -60 -55 -13 0 0 0
Funded TOA 94.734 98.825 91.634 97.565 100.494 128.417 121.143 30.523 31.159Required TOA 123.135 162.731 110.285 135.071 132.812 131.489 121.143 30.523 31.159
Delta -28.401 -63.906 -18.651 -37.506 -32.317 -3.073 0.000 0.000 0.000
Software
Funded Units 0 0 0 0 0 0 0 0 0Required Units 0 0 0 0 0 0 0 0 0
Delta 0 0 0 0 0 0 0 0 0
Funded TOA 7.688 10.275 13.453 10.162 8.364 12.939 14.959 14.864 14.798Required TOA 12.758 10.275 17.933 19.902 20.840 20.258 21.276 21.282 21.290
Delta -5.070 0.000 -4.480 -9.740 -12.476 -7.319 -6.317 -6.418 -6.492
Other
Funded Units 0 0 48 82 84 87 87 91 106Required Units 4 0 48 106 123 126 87 91 106
Delta -4 0 0 -24 -39 -39 0 0 0
Funded TOA 3.169 3.788 3.499 18.625 19.953 19.278 9.068 9.759 11.885Required TOA 4.319 3.789 3.499 21.627 25.048 23.973 9.068 9.759 11.885
Delta -1.150 -0.001 0.000 -3.002 -5.095 -4.696 0.000 0.000 0.000
46
Exhibit OP 30 Depot Maintenance ProgramFebruary 2003
Ms. LeVan Nguyen (703) 614-1197

DEPARTMENT OF THE ARMYFY 2004/2005 BIENNIAL BUDGET ESTIMATES
DEPOT MAINTENANCE PROGRAM($ in Millions)
FY 2001 FY 2002 FY 2003 FY 2004 FY 2005 FY 2006 FY 2007 FY 2008 FY 2009
MissilesWPN SYS
Tactical Missile
Funded Units 245 170 837 408 244 190 199 189 202Required Units 524 266 837 408 244 190 199 189 202
Delta -279 -96 0 0 0 0 0 0 0
Funded TOA 46.626 17.774 17.775 42.931 7.552 5.025 5.666 5.152 5.843Required TOA 91.586 18.440 17.775 42.931 7.552 5.025 5.666 5.152 5.843
Delta -44.960 -0.666 0.000 0.000 0.000 0.000 0.000 0.000 0.000
Software
Funded Units 0 0 0 0 0 0 0 0 0Required Units 0 0 0 0 0 0 0 0 0
Delta 0 0 0 0 0 0 0 0 0
Funded TOA 3.357 4.830 3.037 4.397 5.040 5.772 7.245 10.250 11.234Required TOA 4.426 4.830 4.235 5.675 5.935 6.529 8.030 10.968 11.498
Delta -1.069 0.000 -1.198 -1.278 -0.895 -0.757 -0.785 -0.718 -0.264
Other
Funded Units 219 212 69 866 828 1170 1059 1009 1063Required Units 637 467 530 1378 1364 1315 1063 1022 1070
Delta -418 -255 -461 -512 -536 -145 -4 -13 -7
Funded TOA 52.785 72.919 89.887 130.830 144.286 151.375 136.778 129.888 133.273Required TOA 69.095 76.652 125.432 146.922 159.584 154.773 138.782 136.519 137.140
Delta -16.310 -3.733 -35.545 -16.092 -15.298 -3.398 -2.004 -6.631 -3.866
47
Exhibit OP 30 Depot Maintenance ProgramFebruary 2003
Ms. LeVan Nguyen (703) 614-1197

DEPARTMENT OF THE ARMYFY 2004/2005 BIENNIAL BUDGET ESTIMATES
DEPOT MAINTENANCE PROGRAM($ in Millions)
FY 2001 FY 2002 FY 2003 FY 2004 FY 2005 FY 2006 FY 2007 FY 2008 FY 2009
OrdnanceWPN SYS
Ordnance
Funded Units 11769 17070 1088 680 18562 19790 19946 19999 19999Required Units 11878 17133 17682 18666 18819 19790 19946 19999 19999
Delta -109 -63 -16594 -17986 -257 0 0 0 0
Funded TOA 11.137 20.830 6.057 10.148 26.176 34.294 33.124 33.923 34.610Required TOA 16.233 23.638 27.486 36.498 37.582 34.294 33.124 33.923 34.610
Delta -5.096 -2.808 -21.429 -26.350 -11.406 0.000 0.000 0.000 0.000
Software
Funded Units 0 0 0 0 0 0 0 0 0Required Units 0 0 0 0 0 0 0 0 0
Delta 0 0 0 0 0 0 0 0 0
Funded TOA 0.187 0.000 0.000 0.356 2.600 2.329 1.631 1.710 1.793Required TOA 0.515 0.000 1.938 1.086 2.750 2.482 1.787 1.869 1.954
Delta -0.328 0.000 -1.938 -0.730 -0.150 -0.153 -0.156 -0.159 -0.161
Other
Funded Units 0 0 0 0 0 5 10 10 10Required Units 0 0 0 25 10 10 10 10 10
Delta 0 0 0 -25 -10 -5 0 0 0
Funded TOA 0.049 0.000 0.000 0.000 0.000 0.015 0.032 0.032 0.033Required TOA 0.049 0.000 0.000 1.502 0.034 0.031 0.032 0.032 0.033
Delta 0.000 0.000 0.000 -1.502 -0.034 -0.015 0.000 0.000 0.000
48
Exhibit OP 30 Depot Maintenance ProgramFebruary 2003
Ms. LeVan Nguyen (703) 614-1197

DEPARTMENT OF THE ARMYFY 2004/2005 BIENNIAL BUDGET ESTIMATES
DEPOT MAINTENANCE PROGRAM($ in Millions)
FY 2001 FY 2002 FY 2003 FY 2004 FY 2005 FY 2006 FY 2007 FY 2008 FY 2009
OtherWPN SYS
Software
Funded Units 0 0 0 0 0 0 0 0 0Required Units 0 0 0 0 0 0 0 0 0
Delta 0 0 0 0 0 0 0 0 0
Funded TOA 20.004 22.246 12.744 19.909 21.167 22.265 23.833 27.604 28.175Required TOA 21.092 22.246 22.168 30.484 31.296 33.216 34.084 35.075 37.568
Delta -1.088 0.000 -9.424 -10.576 -10.129 -10.951 -10.251 -7.471 -9.393
Other End-Item
Funded Units 1168 1544 538 3301 3019 5390 5585 4250 5024Required Units 4375 4443 3650 7107 5065 5954 5845 4250 5024
Delta -3207 -2899 -3112 -3806 -2046 -564 -260 0 0
Funded TOA 82.025 122.164 97.824 140.613 165.427 187.117 180.873 142.875 148.897Required TOA 107.294 170.552 151.399 202.259 211.478 191.499 182.034 143.293 149.012
Delta -25.269 -48.388 -53.575 -61.646 -46.051 -4.381 -1.161 -0.418 -0.115
49
Exhibit OP 30 Depot Maintenance ProgramFebruary 2003
Ms. LeVan Nguyen (703) 614-1197

DEPARTMENT OF THE ARMYFY 2004/2005 BIENNIAL BUDGET ESTIMATES
DEPOT MAINTENANCE PROGRAM($ in Millions)
FY 2001 FY 2002 FY 2003 FY 2004 FY 2005 FY 2006 FY 2007 FY 2008 FY 2009
Active Contract
AircraftWPN SYS
Airframe
Funded Units 12 0 1 10 9 13 16 16 16Required Units 31 12 9 19 16 13 16 16 16
Delta -19 -12 -8 -9 -7 0 0 0 0
Funded TOA 24.062 1.943 4.107 12.609 6.618 11.277 13.063 13.193 13.343Required TOA 35.499 16.700 12.460 19.817 26.665 11.277 13.063 13.193 13.343
Delta -11.437 -14.757 -8.353 -7.207 -20.047 0.000 0.000 0.000 0.000
Software
Funded Units 0 0 0 0 0 0 0 0 0Required Units 0 0 0 0 0 0 0 0 0
Delta 0 0 0 0 0 0 0 0 0
Funded TOA 10.670 6.176 4.655 0.976 9.274 5.793 7.114 10.574 12.959Required TOA 10.757 12.987 21.355 21.060 21.327 23.000 23.661 24.029 24.583
Delta -0.087 -6.811 -16.700 -20.084 -12.053 -17.207 -16.547 -13.455 -11.624
Other
Funded Units 506 127 295 4843 6618 6992 7004 7040 7142Required Units 794 730 1027 7088 6991 6992 7004 7040 7142
Delta -288 -603 -732 -2245 -373 0 0 0 0
Funded TOA 8.094 6.847 4.774 11.338 14.682 18.240 18.635 18.790 19.098Required TOA 8.927 15.042 17.857 17.779 17.875 18.240 18.635 18.790 19.098
Delta -0.833 -8.195 -13.083 -6.441 -3.194 0.000 0.000 0.000 0.000
50
Exhibit OP 30 Depot Maintenance ProgramFebruary 2003
Ms. LeVan Nguyen (703) 614-1197
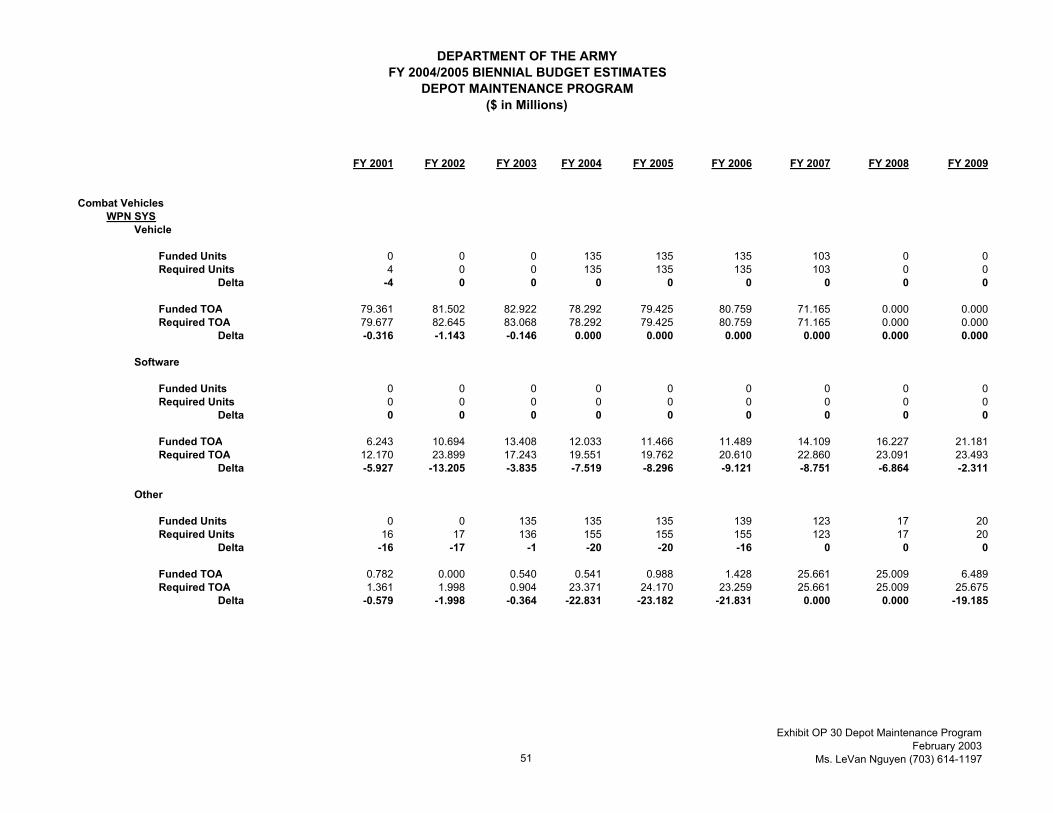
DEPARTMENT OF THE ARMYFY 2004/2005 BIENNIAL BUDGET ESTIMATES
DEPOT MAINTENANCE PROGRAM($ in Millions)
FY 2001 FY 2002 FY 2003 FY 2004 FY 2005 FY 2006 FY 2007 FY 2008 FY 2009
Combat VehiclesWPN SYS
Vehicle
Funded Units 0 0 0 135 135 135 103 0 0Required Units 4 0 0 135 135 135 103 0 0
Delta -4 0 0 0 0 0 0 0 0
Funded TOA 79.361 81.502 82.922 78.292 79.425 80.759 71.165 0.000 0.000Required TOA 79.677 82.645 83.068 78.292 79.425 80.759 71.165 0.000 0.000
Delta -0.316 -1.143 -0.146 0.000 0.000 0.000 0.000 0.000 0.000
Software
Funded Units 0 0 0 0 0 0 0 0 0Required Units 0 0 0 0 0 0 0 0 0
Delta 0 0 0 0 0 0 0 0 0
Funded TOA 6.243 10.694 13.408 12.033 11.466 11.489 14.109 16.227 21.181Required TOA 12.170 23.899 17.243 19.551 19.762 20.610 22.860 23.091 23.493
Delta -5.927 -13.205 -3.835 -7.519 -8.296 -9.121 -8.751 -6.864 -2.311
Other
Funded Units 0 0 135 135 135 139 123 17 20Required Units 16 17 136 155 155 155 123 17 20
Delta -16 -17 -1 -20 -20 -16 0 0 0
Funded TOA 0.782 0.000 0.540 0.541 0.988 1.428 25.661 25.009 6.489Required TOA 1.361 1.998 0.904 23.371 24.170 23.259 25.661 25.009 25.675
Delta -0.579 -1.998 -0.364 -22.831 -23.182 -21.831 0.000 0.000 -19.185
51
Exhibit OP 30 Depot Maintenance ProgramFebruary 2003
Ms. LeVan Nguyen (703) 614-1197
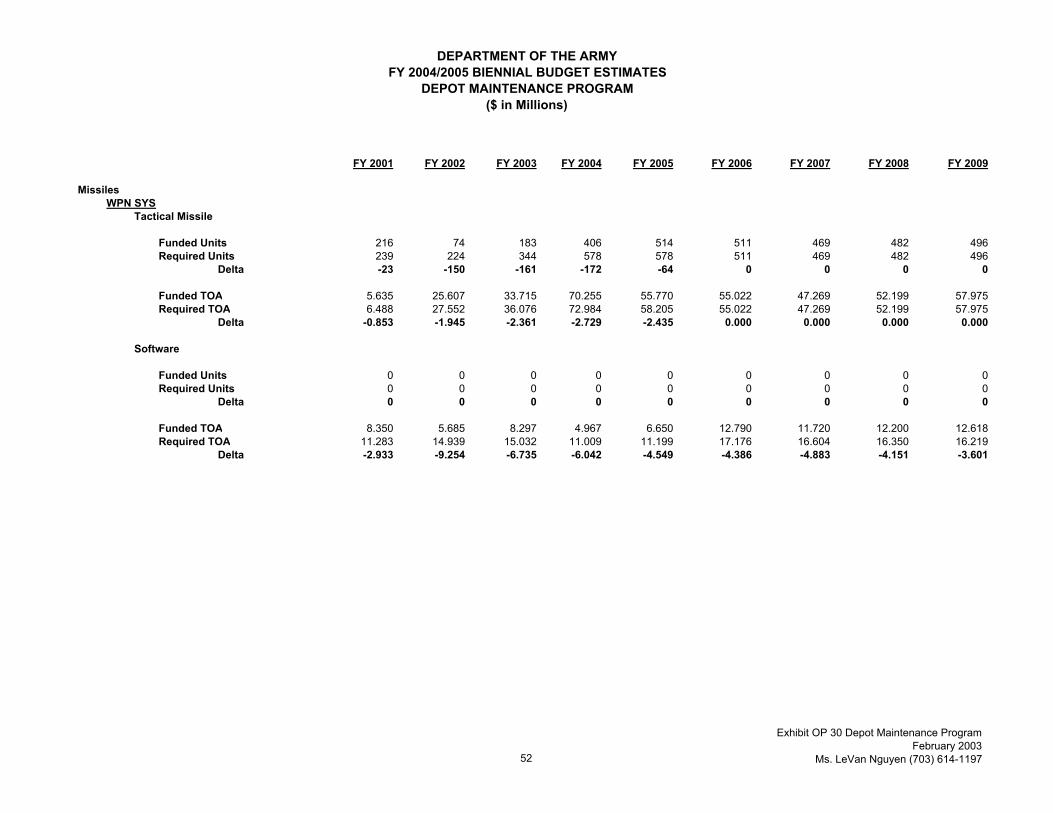
DEPARTMENT OF THE ARMYFY 2004/2005 BIENNIAL BUDGET ESTIMATES
DEPOT MAINTENANCE PROGRAM($ in Millions)
FY 2001 FY 2002 FY 2003 FY 2004 FY 2005 FY 2006 FY 2007 FY 2008 FY 2009
MissilesWPN SYS
Tactical Missile
Funded Units 216 74 183 406 514 511 469 482 496Required Units 239 224 344 578 578 511 469 482 496
Delta -23 -150 -161 -172 -64 0 0 0 0
Funded TOA 5.635 25.607 33.715 70.255 55.770 55.022 47.269 52.199 57.975Required TOA 6.488 27.552 36.076 72.984 58.205 55.022 47.269 52.199 57.975
Delta -0.853 -1.945 -2.361 -2.729 -2.435 0.000 0.000 0.000 0.000
Software
Funded Units 0 0 0 0 0 0 0 0 0Required Units 0 0 0 0 0 0 0 0 0
Delta 0 0 0 0 0 0 0 0 0
Funded TOA 8.350 5.685 8.297 4.967 6.650 12.790 11.720 12.200 12.618Required TOA 11.283 14.939 15.032 11.009 11.199 17.176 16.604 16.350 16.219
Delta -2.933 -9.254 -6.735 -6.042 -4.549 -4.386 -4.883 -4.151 -3.601
52
Exhibit OP 30 Depot Maintenance ProgramFebruary 2003
Ms. LeVan Nguyen (703) 614-1197
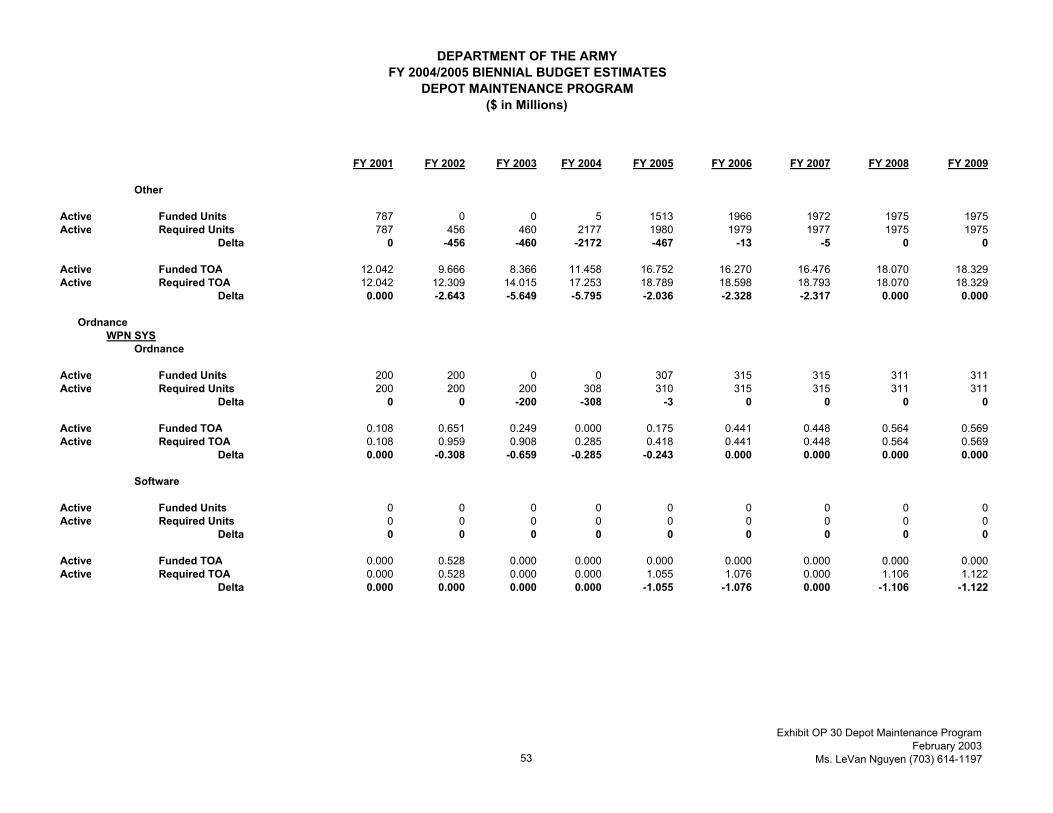
DEPARTMENT OF THE ARMYFY 2004/2005 BIENNIAL BUDGET ESTIMATES
DEPOT MAINTENANCE PROGRAM($ in Millions)
FY 2001 FY 2002 FY 2003 FY 2004 FY 2005 FY 2006 FY 2007 FY 2008 FY 2009
Other
Active Funded Units 787 0 0 5 1513 1966 1972 1975 1975Active Required Units 787 456 460 2177 1980 1979 1977 1975 1975
Delta 0 -456 -460 -2172 -467 -13 -5 0 0
Active Funded TOA 12.042 9.666 8.366 11.458 16.752 16.270 16.476 18.070 18.329Active Required TOA 12.042 12.309 14.015 17.253 18.789 18.598 18.793 18.070 18.329
Delta 0.000 -2.643 -5.649 -5.795 -2.036 -2.328 -2.317 0.000 0.000
OrdnanceWPN SYS
Ordnance
Active Funded Units 200 200 0 0 307 315 315 311 311Active Required Units 200 200 200 308 310 315 315 311 311
Delta 0 0 -200 -308 -3 0 0 0 0
Active Funded TOA 0.108 0.651 0.249 0.000 0.175 0.441 0.448 0.564 0.569Active Required TOA 0.108 0.959 0.908 0.285 0.418 0.441 0.448 0.564 0.569
Delta 0.000 -0.308 -0.659 -0.285 -0.243 0.000 0.000 0.000 0.000
Software
Active Funded Units 0 0 0 0 0 0 0 0 0Active Required Units 0 0 0 0 0 0 0 0 0
Delta 0 0 0 0 0 0 0 0 0
Active Funded TOA 0.000 0.528 0.000 0.000 0.000 0.000 0.000 0.000 0.000Active Required TOA 0.000 0.528 0.000 0.000 1.055 1.076 0.000 1.106 1.122
Delta 0.000 0.000 0.000 0.000 -1.055 -1.076 0.000 -1.106 -1.122
53
Exhibit OP 30 Depot Maintenance ProgramFebruary 2003
Ms. LeVan Nguyen (703) 614-1197
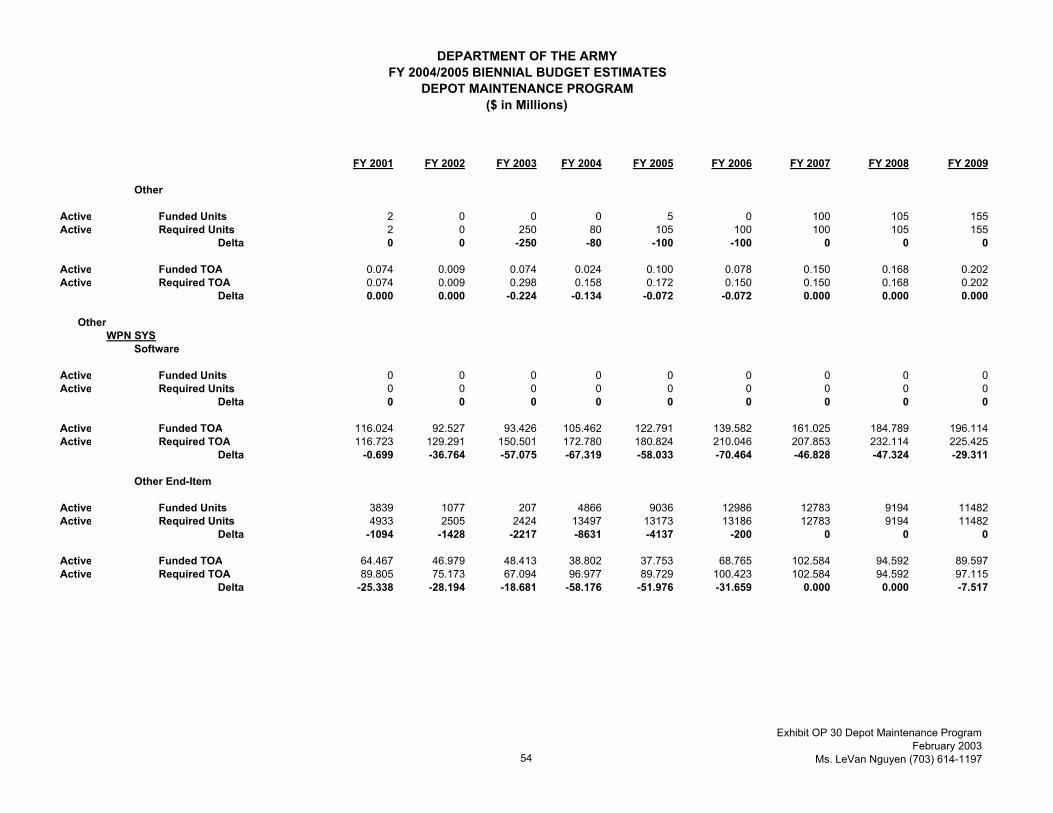
DEPARTMENT OF THE ARMYFY 2004/2005 BIENNIAL BUDGET ESTIMATES
DEPOT MAINTENANCE PROGRAM($ in Millions)
FY 2001 FY 2002 FY 2003 FY 2004 FY 2005 FY 2006 FY 2007 FY 2008 FY 2009
Other
Active Funded Units 2 0 0 0 5 0 100 105 155Active Required Units 2 0 250 80 105 100 100 105 155
Delta 0 0 -250 -80 -100 -100 0 0 0
Active Funded TOA 0.074 0.009 0.074 0.024 0.100 0.078 0.150 0.168 0.202Active Required TOA 0.074 0.009 0.298 0.158 0.172 0.150 0.150 0.168 0.202
Delta 0.000 0.000 -0.224 -0.134 -0.072 -0.072 0.000 0.000 0.000
OtherWPN SYS
Software
Active Funded Units 0 0 0 0 0 0 0 0 0Active Required Units 0 0 0 0 0 0 0 0 0
Delta 0 0 0 0 0 0 0 0 0
Active Funded TOA 116.024 92.527 93.426 105.462 122.791 139.582 161.025 184.789 196.114Active Required TOA 116.723 129.291 150.501 172.780 180.824 210.046 207.853 232.114 225.425
Delta -0.699 -36.764 -57.075 -67.319 -58.033 -70.464 -46.828 -47.324 -29.311
Other End-Item
Active Funded Units 3839 1077 207 4866 9036 12986 12783 9194 11482Active Required Units 4933 2505 2424 13497 13173 13186 12783 9194 11482
Delta -1094 -1428 -2217 -8631 -4137 -200 0 0 0
Active Funded TOA 64.467 46.979 48.413 38.802 37.753 68.765 102.584 94.592 89.597Active Required TOA 89.805 75.173 67.094 96.977 89.729 100.423 102.584 94.592 97.115
Delta -25.338 -28.194 -18.681 -58.176 -51.976 -31.659 0.000 0.000 -7.517
54
Exhibit OP 30 Depot Maintenance ProgramFebruary 2003
Ms. LeVan Nguyen (703) 614-1197
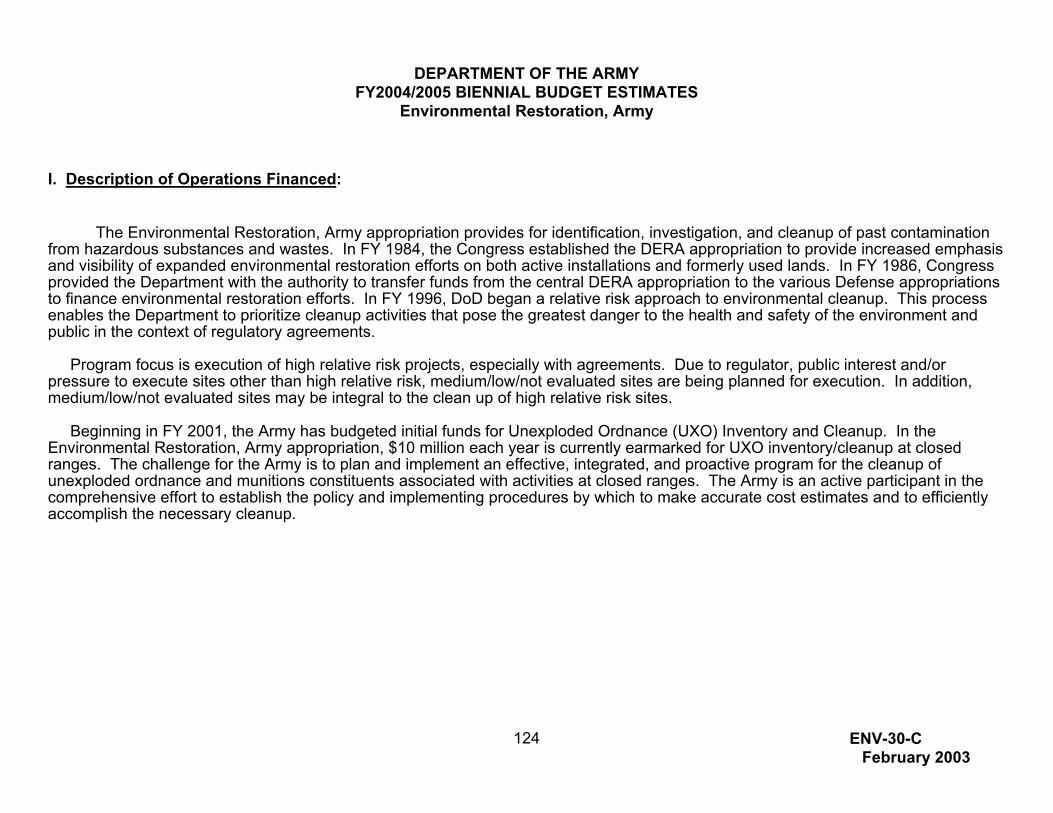
DEPARTMENT OF THE ARMY
FY2004/2005 BIENNIAL BUDGET ESTIMATES Environmental Restoration, Army
I. Description of Operations Financed:
The Environmental Restoration, Army appropriation provides for identification, investigation, and cleanup of past contamination
from hazardous substances and wastes. In FY 1984, the Congress established the DERA appropriation to provide increased emphasis and visibility of expanded environmental restoration efforts on both active installations and formerly used lands. In FY 1986, Congress provided the Department with the authority to transfer funds from the central DERA appropriation to the various Defense appropriations to finance environmental restoration efforts. In FY 1996, DoD began a relative risk approach to environmental cleanup. This process enables the Department to prioritize cleanup activities that pose the greatest danger to the health and safety of the environment and public in the context of regulatory agreements.
Program focus is execution of high relative risk projects, especially with agreements. Due to regulator, public interest and/or pressure to execute sites other than high relative risk, medium/low/not evaluated sites are being planned for execution. In addition, medium/low/not evaluated sites may be integral to the clean up of high relative risk sites. Beginning in FY 2001, the Army has budgeted initial funds for Unexploded Ordnance (UXO) Inventory and Cleanup. In the Environmental Restoration, Army appropriation, $10 million each year is currently earmarked for UXO inventory/cleanup at closed ranges. The challenge for the Army is to plan and implement an effective, integrated, and proactive program for the cleanup of unexploded ordnance and munitions constituents associated with activities at closed ranges. The Army is an active participant in the comprehensive effort to establish the policy and implementing procedures by which to make accurate cost estimates and to efficiently accomplish the necessary cleanup.
ENV-30-C
February 2003 124
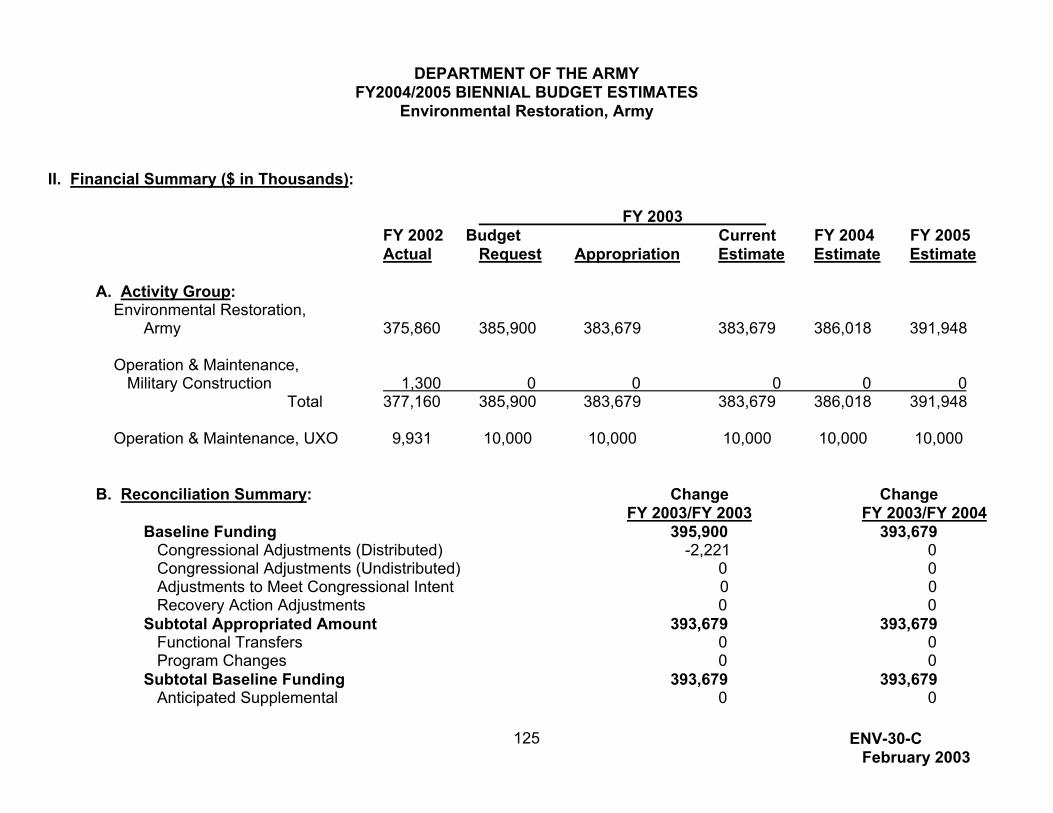
DEPARTMENT OF THE ARMY
FY2004/2005 BIENNIAL BUDGET ESTIMATES Environmental Restoration, Army
ENV-30-C February 2003
125
II. Financial Summary ($ in Thousands): FY 2003 FY 2002 Budget Current FY 2004 FY 2005
al Actu Request Appropriation Estimate Estimate Estimate A. Activity Group: Environmental Restoration, Army 375,860 385,900 383,679 383,679 386,018 391,948 Operation & Maintenance, Military Construction 1,300 0 0 0 0 0 Total 377,160 385,900 383,679 383,679 386,018 391,948 Operation & Maintenance, UXO 9,931 10,000 10,000 10,000 10,000 10,000 B. Reconciliation Summary: Change Change FY 2003/FY 2003 FY 2003/FY 2004 Baseline Funding 395,900 393,679 Congressional Adjustments (Distributed) -2,221 0 Congressional Adjustments (Undistributed) 0 0 Adjustments to Meet Congressional Intent 0 0 Recovery Action Adjustments 0 0 Subtotal Appropriated Amount 393,679 393,679 Functional Transfers 0 0 Program Changes 0 0 Subtotal Baseline Funding 393,679 393,679 Anticipated Supplemental 0 0

DEPARTMENT OF THE ARMY
FY2004/2005 BIENNIAL BUDGET ESTIMATES Environmental Restoration, Army
Reprogrammings 0 0 Price Change 0 5,905 Functional Transfers 0 0 Program Changes 0 -3,566 Current Estimate 393,679 396,018 C. Reconciliation: Increases and Decreases: FY 2003 President’s Budget Request ................................................................................................................$395,900 FY 2003 Current Estimate..................................................................................................................................$393,679 1. Price Change .................................................................................................................................................$ 5,905 2. Program Increases a. Program Growth in FY 2004 (1) Program Management and Support . . . . . . . . $ 2,522 Increase due to focus on GFPR initiatives. (2) Priority 3A. Low Relative Risk with Agreements $ 2,320 Increase due to focus on site closeout. (3) Priority 3B. Low Relative Risk without Agreements $ 1,034 Increase due to focus on site closure. (4) Priority 4B. Not Evaluated without Agreements $ 63
Increase due to focus on site closure.
ENV-30-C February 2003
126
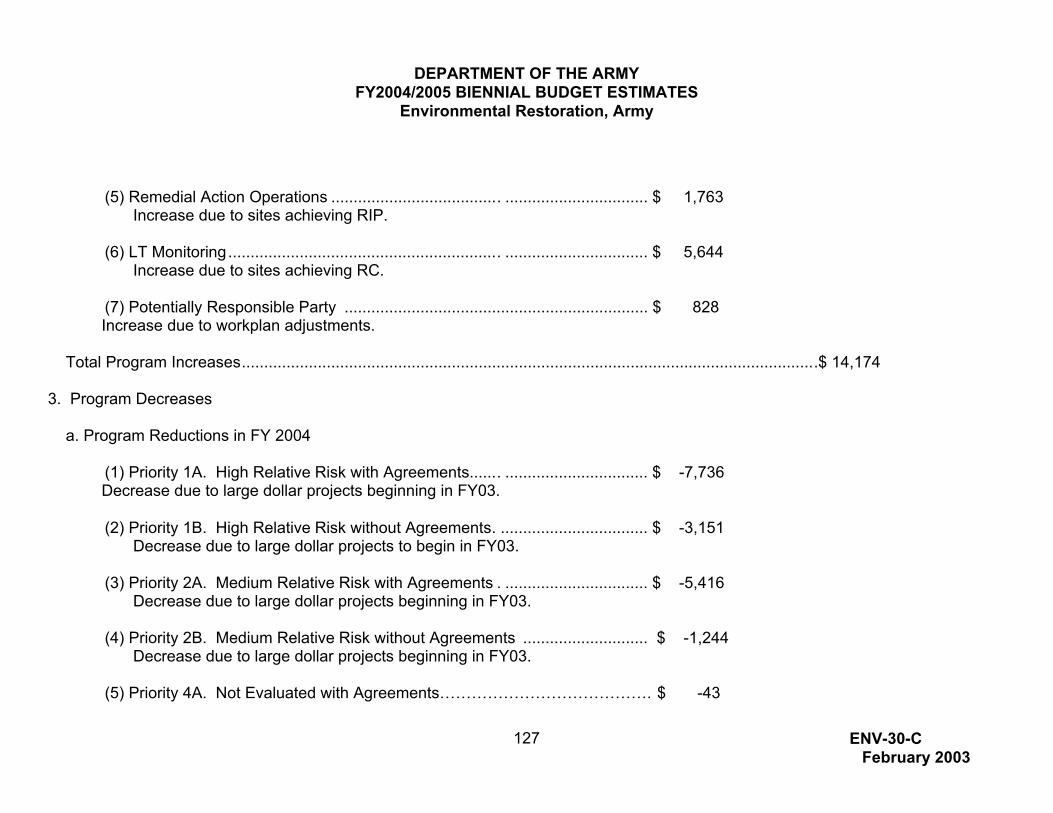
DEPARTMENT OF THE ARMY
FY2004/2005 BIENNIAL BUDGET ESTIMATES Environmental Restoration, Army
(5) Remedial Action Operations ...................................... ................................ $ 1,763
Increase due to sites achieving RIP. (6) LT Monitoring............................................................. ................................ $ 5,644
Increase due to sites achieving RC. (7) Potentially Responsible Party .................................................................... $ 828
Increase due to workplan adjustments. Total Program Increases.................................................................................................................................$ 14,174 3. Program Decreases a. Program Reductions in FY 2004 (1) Priority 1A. High Relative Risk with Agreements....... ................................ $ -7,736 Decrease due to large dollar projects beginning in FY03. (2) Priority 1B. High Relative Risk without Agreements. ................................. $ -3,151 Decrease due to large dollar projects to begin in FY03. (3) Priority 2A. Medium Relative Risk with Agreements . ................................ $ -5,416 Decrease due to large dollar projects beginning in FY03. (4) Priority 2B. Medium Relative Risk without Agreements ............................ $ -1,244 Decrease due to large dollar projects beginning in FY03. (5) Priority 4A. Not Evaluated with Agreements…………………………………. $ -43
ENV-30-C February 2003
127
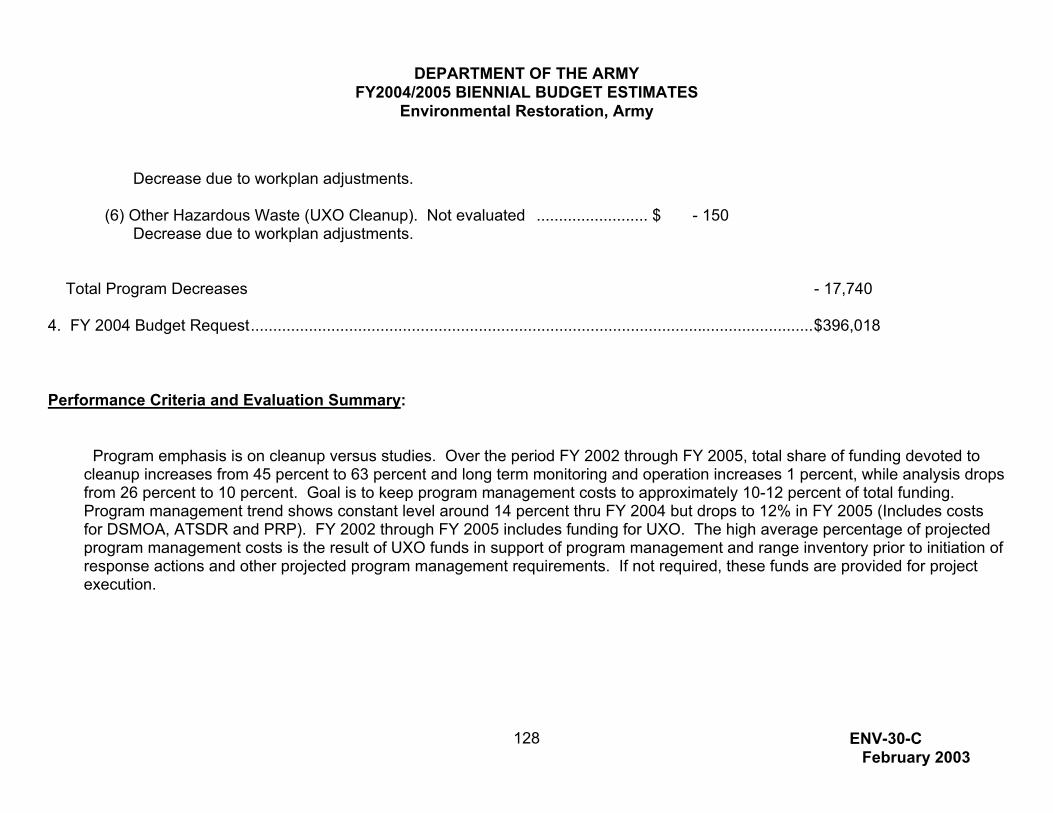
DEPARTMENT OF THE ARMY
FY2004/2005 BIENNIAL BUDGET ESTIMATES Environmental Restoration, Army
Decrease due to workplan adjustments. (6) Other Hazardous Waste (UXO Cleanup). Not evaluated ......................... $ - 150 Decrease due to workplan adjustments.
Total Program Decreases - 17,740 4. FY 2004 Budget Request..............................................................................................................................$396,018 Performance Criteria and Evaluation Summary:
Program emphasis is on cleanup versus studies. Over the period FY 2002 through FY 2005, total share of funding devoted to cleanup increases from 45 percent to 63 percent and long term monitoring and operation increases 1 percent, while analysis drops from 26 percent to 10 percent. Goal is to keep program management costs to approximately 10-12 percent of total funding. Program management trend shows constant level around 14 percent thru FY 2004 but drops to 12% in FY 2005 (Includes costs for DSMOA, ATSDR and PRP). FY 2002 through FY 2005 includes funding for UXO. The high average percentage of projected program management costs is the result of UXO funds in support of program management and range inventory prior to initiation of response actions and other projected program management requirements. If not required, these funds are provided for project execution.
ENV-30-C
February 2003 128

DEPARTMENT OF THE ARMY
FY2004/2005 BIENNIAL BUDGET ESTIMATES Environmental Restoration, Army
IV. Performance Criteria and Evaluation Summary (Continued): FY 2002 FY 2003 FY 2004 FY 2005
PM 56,826 55,270 56,010 48,684 ANALYSIS 103,382 83,800 55,239 42,364 CLEANUP 174,055 207,978 230,033 253,599 LTM&O 52,828 46,631 54,736 57,301 % PM 14.7% 14.0% 14.1% 12.1% % ANALYSIS 26.7% 21.3% 13.9% 10.5% % CLEANUP 45.0% 52.8% 58.1% 63.1% % LTM&O 13.6% 11.8% 13.8% 14.3%
FY 2003-FY 2004
a. Price Change 5,905 b. Assessments -41
Decrease is due to workplan changes.
c. Analysis/Investigations -27,935 Decrease is due to emphasis on remedial action versus studies. d. Interim Actions -19,195 Decrease is due to emphasis on final cleanup. e. Remedial Design 3,696 Increase is due sites moving into remedial action. f. Remedial Action Construction 29,304 Increase due to primary focus on cleanup.
ENV-30-C
February 2003 129

DEPARTMENT OF THE ARMY
FY2004/2005 BIENNIAL BUDGET ESTIMATES Environmental Restoration, Army
g. Remedial Action Operations 1,763 Increase is due to cleanup progress. h. Long-Term Monitoring 5,643 Increase is due to cleanup progress. i. Potentially Responsible Party 827 Increase is due to workplan changes. j. Management 7,758 Increase is due to GFPR initiative. k. Workyears -3,021 Decrease is due to workplan adjustment. l. DSMOA -2,071 Decrease is due to program maturity. m. ATSDR -144 Decrease is due to workplan adjustment. n. Other Hazardous Waste (UXO Cleanup) -150 Decrease is due to workplan changes IV. Performance Criteria and Evaluation Summary: FY 2004-FY 2005 a. Price Change 6,336
ENV-30-C
February 2003 130

DEPARTMENT OF THE ARMY
FY2004/2005 BIENNIAL BUDGET ESTIMATES Environmental Restoration, Army
b. Assessments -227 Decrease due to site progress.
c. Analysis/Investigations -13,172 Decrease is due to the maturing of the program towards cleanup. d. Interim Actions -3,041 Decrease is due to emphasis on final remedial action. e. Remedial Design -7,758 Decrease due to program moving towards cleanup. f. Remedial Action Construction 30,520 Remedial Action increases due to primary focus on cleanup. g. Remedial Action Operations -580 Decrease due to workplan changes. h. Long-Term Monitoring 2,270 Increase due to cleanup progress. i. Potentially Responsible Party 1
Increase due to workplan changes. j. Management -7,324 Decrease due to workplan adjustments. k. Workyears 10 Increase due to workplan adjustments.
ENV-30-C
February 2003 131

DEPARTMENT OF THE ARMY
FY2004/2005 BIENNIAL BUDGET ESTIMATES Environmental Restoration, Army
ENV-30-C
February 2003 132
l. DSMOA 4 Increase due to workplan adjustments. m. ATSDR -949 Decrease due to completion of programs. n. Other Hazardous Waste (UXO Cleanup) -160 Decrease due to workplan changes.
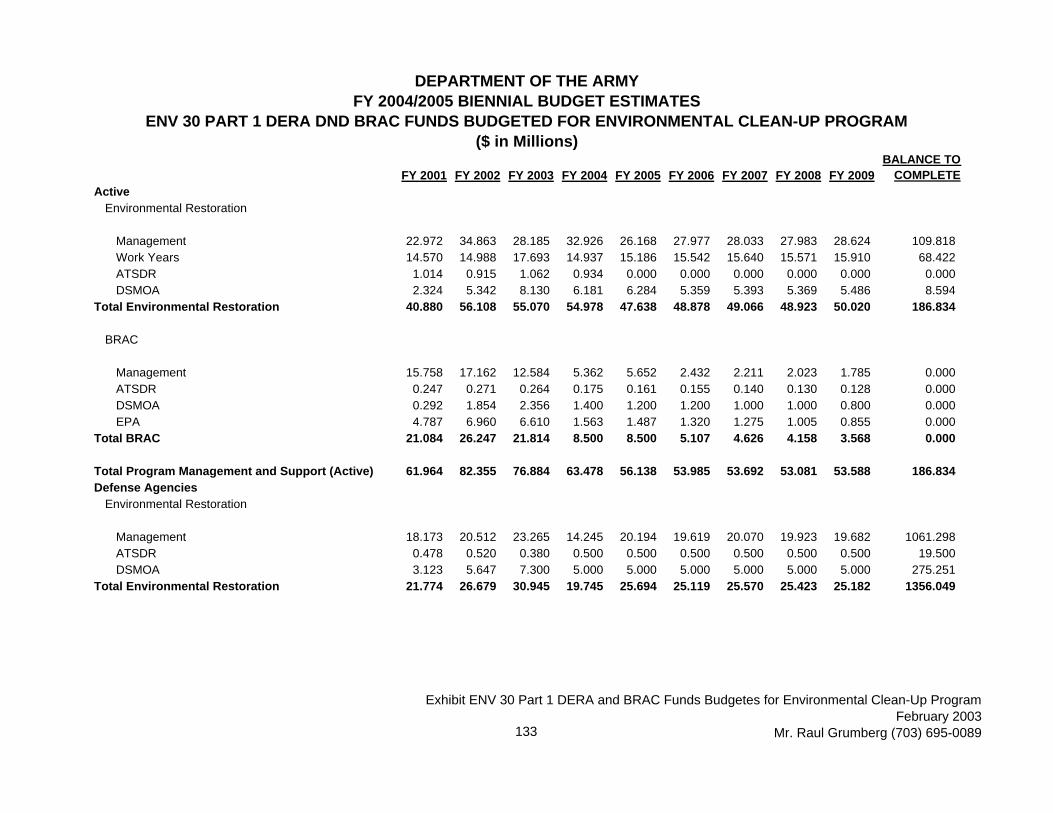
DEPARTMENT OF THE ARMYFY 2004/2005 BIENNIAL BUDGET ESTIMATES
ENV 30 PART 1 DERA DND BRAC FUNDS BUDGETED FOR ENVIRONMENTAL CLEAN-UP PROGRAM($ in Millions)
FY 2001 FY 2002 FY 2003 FY 2004 FY 2005 FY 2006 FY 2007 FY 2008 FY 2009BALANCE TO
COMPLETEActive
Environmental Restoration
Management 22.972 34.863 28.185 32.926 26.168 27.977 28.033 27.983 28.624 109.818Work Years 14.570 14.988 17.693 14.937 15.186 15.542 15.640 15.571 15.910 68.422ATSDR 1.014 0.915 1.062 0.934 0.000 0.000 0.000 0.000 0.000 0.000DSMOA 2.324 5.342 8.130 6.181 6.284 5.359 5.393 5.369 5.486 8.594
Total Environmental Restoration 40.880 56.108 55.070 54.978 47.638 48.878 49.066 48.923 50.020 186.834
BRAC
Management 15.758 17.162 12.584 5.362 5.652 2.432 2.211 2.023 1.785 0.000ATSDR 0.247 0.271 0.264 0.175 0.161 0.155 0.140 0.130 0.128 0.000DSMOA 0.292 1.854 2.356 1.400 1.200 1.200 1.000 1.000 0.800 0.000EPA 4.787 6.960 6.610 1.563 1.487 1.320 1.275 1.005 0.855 0.000
Total BRAC 21.084 26.247 21.814 8.500 8.500 5.107 4.626 4.158 3.568 0.000
Total Program Management and Support (Active) 61.964 82.355 76.884 63.478 56.138 53.985 53.692 53.081 53.588 186.834Defense Agencies
Environmental Restoration
Management 18.173 20.512 23.265 14.245 20.194 19.619 20.070 19.923 19.682 1061.298ATSDR 0.478 0.520 0.380 0.500 0.500 0.500 0.500 0.500 0.500 19.500DSMOA 3.123 5.647 7.300 5.000 5.000 5.000 5.000 5.000 5.000 275.251
Total Environmental Restoration 21.774 26.679 30.945 19.745 25.694 25.119 25.570 25.423 25.182 1356.049
133
Exhibit ENV 30 Part 1 DERA and BRAC Funds Budgetes for Environmental Clean-Up ProgramFebruary 2003
Mr. Raul Grumberg (703) 695-0089
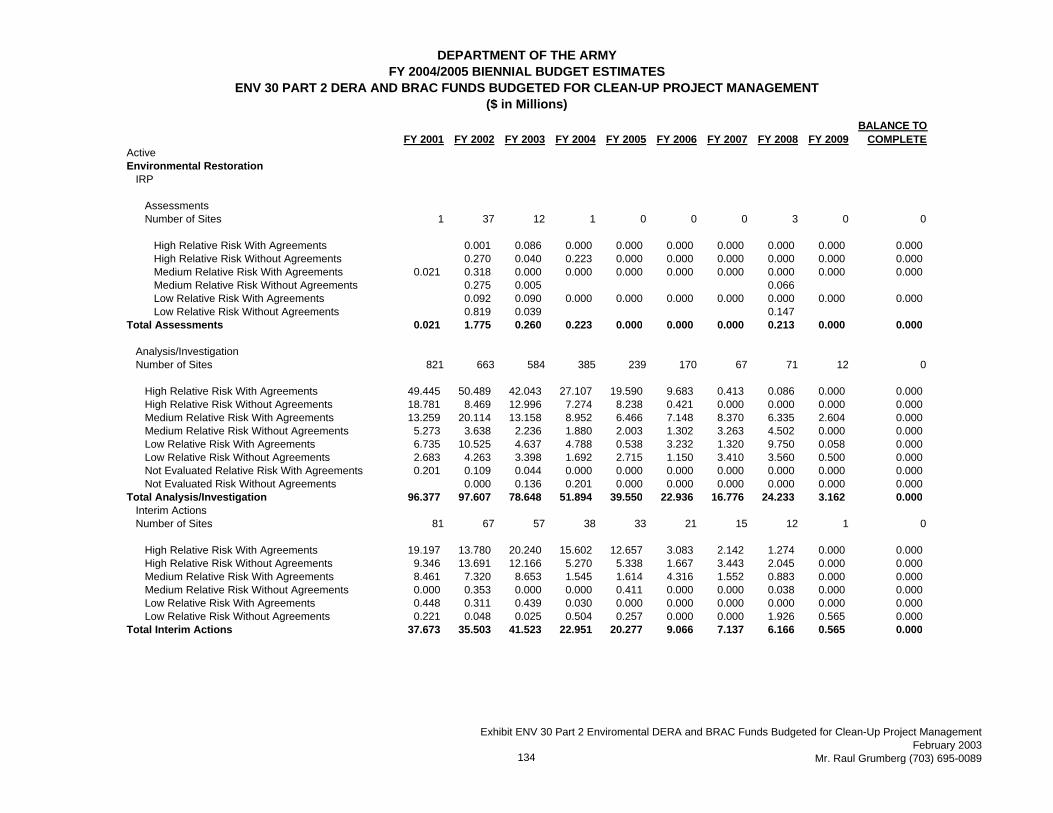
DEPARTMENT OF THE ARMYFY 2004/2005 BIENNIAL BUDGET ESTIMATES
ENV 30 PART 2 DERA AND BRAC FUNDS BUDGETED FOR CLEAN-UP PROJECT MANAGEMENT($ in Millions)
FY 2001 FY 2002 FY 2003 FY 2004 FY 2005 FY 2006 FY 2007 FY 2008 FY 2009BALANCE TO
COMPLETEActiveEnvironmental Restoration
IRP
AssessmentsNumber of Sites 1 37 12 1 0 0 0 3 0 0
High Relative Risk With Agreements 0.001 0.086 0.000 0.000 0.000 0.000 0.000 0.000 0.000High Relative Risk Without Agreements 0.270 0.040 0.223 0.000 0.000 0.000 0.000 0.000 0.000Medium Relative Risk With Agreements 0.021 0.318 0.000 0.000 0.000 0.000 0.000 0.000 0.000 0.000Medium Relative Risk Without Agreements 0.275 0.005 0.066Low Relative Risk With Agreements 0.092 0.090 0.000 0.000 0.000 0.000 0.000 0.000 0.000Low Relative Risk Without Agreements 0.819 0.039 0.147
Total Assessments 0.021 1.775 0.260 0.223 0.000 0.000 0.000 0.213 0.000 0.000
Analysis/InvestigationNumber of Sites 821 663 584 385 239 170 67 71 12 0
High Relative Risk With Agreements 49.445 50.489 42.043 27.107 19.590 9.683 0.413 0.086 0.000 0.000High Relative Risk Without Agreements 18.781 8.469 12.996 7.274 8.238 0.421 0.000 0.000 0.000 0.000Medium Relative Risk With Agreements 13.259 20.114 13.158 8.952 6.466 7.148 8.370 6.335 2.604 0.000Medium Relative Risk Without Agreements 5.273 3.638 2.236 1.880 2.003 1.302 3.263 4.502 0.000 0.000Low Relative Risk With Agreements 6.735 10.525 4.637 4.788 0.538 3.232 1.320 9.750 0.058 0.000Low Relative Risk Without Agreements 2.683 4.263 3.398 1.692 2.715 1.150 3.410 3.560 0.500 0.000Not Evaluated Relative Risk With Agreements 0.201 0.109 0.044 0.000 0.000 0.000 0.000 0.000 0.000 0.000Not Evaluated Risk Without Agreements 0.000 0.136 0.201 0.000 0.000 0.000 0.000 0.000 0.000
Total Analysis/Investigation 96.377 97.607 78.648 51.894 39.550 22.936 16.776 24.233 3.162 0.000Interim ActionsNumber of Sites 81 67 57 38 33 21 15 12 1 0
High Relative Risk With Agreements 19.197 13.780 20.240 15.602 12.657 3.083 2.142 1.274 0.000 0.000High Relative Risk Without Agreements 9.346 13.691 12.166 5.270 5.338 1.667 3.443 2.045 0.000 0.000Medium Relative Risk With Agreements 8.461 7.320 8.653 1.545 1.614 4.316 1.552 0.883 0.000 0.000Medium Relative Risk Without Agreements 0.000 0.353 0.000 0.000 0.411 0.000 0.000 0.038 0.000 0.000Low Relative Risk With Agreements 0.448 0.311 0.439 0.030 0.000 0.000 0.000 0.000 0.000 0.000Low Relative Risk Without Agreements 0.221 0.048 0.025 0.504 0.257 0.000 0.000 1.926 0.565 0.000
Total Interim Actions 37.673 35.503 41.523 22.951 20.277 9.066 7.137 6.166 0.565 0.000
134
Exhibit ENV 30 Part 2 Enviromental DERA and BRAC Funds Budgeted for Clean-Up Project ManagementFebruary 2003
Mr. Raul Grumberg (703) 695-0089

DEPARTMENT OF THE ARMYFY 2004/2005 BIENNIAL BUDGET ESTIMATES
ENV 30 PART 2 DERA AND BRAC FUNDS BUDGETED FOR CLEAN-UP PROJECT MANAGEMENT($ in Millions)
FY 2001 FY 2002 FY 2003 FY 2004 FY 2005 FY 2006 FY 2007 FY 2008 FY 2009BALANCE TO
COMPLETERemedial DesignsNumber of Sites 105 141 141 138 103 73 37 102 25 0
High Relative Risk With Agreements 9.041 9.185 9.295 11.890 8.206 4.102 2.825 0.583 1.678 0.000High Relative Risk Without Agreements 0.544 0.969 1.034 2.231 0.902 2.919 0.096 0.000 0.000 0.000Medium Relative Risk With Agreements 0.760 1.561 2.341 1.829 0.516 1.876 1.759 4.818 1.588 0.000Medium Relative Risk Without Agreements 0.077 0.595 0.313 0.647 0.514 0.254 0.254 0.303 0.451 0.000Low Relative Risk With Agreements 0.227 0.927 0.589 0.876 0.169 0.172 0.365 2.077 0.422 0.000Low Relative Risk Without Agreements 0.156 0.260 0.497 0.501 0.199 0.452 0.082 0.971 0.000 0.000Not Evaluated Relative Risk With Agreements 0.000 0.000 0.000 0.002 0.000 0.000 0.000 0.000 0.392 0.000
Total Remedial Designs 10.805 13.497 14.069 17.976 10.506 9.775 5.381 8.752 4.531 0.000
Remedial Action ConstructionNumber of Sites 157 224 234 192 206 175 150 94 107 0
High Relative Risk With Agreements 142.776 88.604 111.987 124.072 172.465 177.906 160.817 68.921 36.551 0.000High Relative Risk Without Agreements 6.796 7.676 8.890 17.504 23.792 35.305 29.791 0.000 0.000 0.000Medium Relative Risk With Agreements 1.977 19.803 22.702 29.815 11.488 15.534 46.167 91.681 151.459 0.000Medium Relative Risk Without Agreements 0.098 0.878 3.232 2.103 2.904 1.797 13.573 17.889 11.188 0.000Low Relative Risk With Agreements 1.814 5.221 4.016 6.543 3.654 4.964 10.285 41.362 37.647 0.000Low Relative Risk Without Agreements 0.120 1.062 1.351 3.729 2.872 5.996 2.996 4.016 10.362 0.000Not Evaluated Relative Risk With Agreements 0.000 0.000 0.000 0.000 0.000 0.000 0.000 0.000 6.609 0.000Not Evaluated Relative Risk Without Agreements 0.000 0.001 0.000 0.000 0.051 0.000 0.000 0.000 0.000 0.000
Total Remedial Action Construction 153.581 123.245 152.178 183.766 217.226 241.502 263.629 223.869 253.816 0.000Remedial Action OperationsNumber of Sites 90 96 94 94 106 108 110 105 96 77
Clean-Up 41.587 35.288 37.580 37.601 36.001 37.311 53.986 68.789 442.148Total Remedial Action Operations 0.000 41.587 35.288 37.580 37.601 36.001 37.311 53.986 68.789 442.148
Long Term ManagementNumber of Sites 154 177 256 330 399 583 603 603 594 652
Clean-Up 9.877 11.241 11.343 17.156 19.700 31.297 28.092 49.233 43.567 457.138Total Long Term Management 9.877 11.241 11.343 17.156 19.700 31.297 28.092 49.233 43.567 457.138
Potentially Responsible PartyClean-Up 0.000 0.000 0.200 1.030 1.047 1.072 1.079 1.074 1.097 2.720
Total Potentially Responsible Party 0.000 0.000 0.200 1.030 1.047 1.072 1.079 1.074 1.097 2.720Total IRPSites 1409 1405 1378 1178 1086 1130 982 990 835 729Funding 308.334 324.455 333.509 332.576 345.907 351.649 359.405 367.526 375.527 902.006
135
Exhibit ENV 30 Part 2 Enviromental DERA and BRAC Funds Budgeted for Clean-Up Project ManagementFebruary 2003
Mr. Raul Grumberg (703) 695-0089

DEPARTMENT OF THE ARMYFY 2004/2005 BIENNIAL BUDGET ESTIMATES
ENV 30 PART 2 DERA AND BRAC FUNDS BUDGETED FOR CLEAN-UP PROJECT MANAGEMENT($ in Millions)
FY 2001 FY 2002 FY 2003 FY 2004 FY 2005 FY 2006 FY 2007 FY 2008 FY 2009BALANCE TO
COMPLETEMunitions Response
AssessmentsNot Evaluated Threat 4.718 4.892 0.500 0.000 0.000 0.000 0.000 0.000 0.000
Total Assessments 4.718 4.892 0.500 0.000 0.000 0.000 0.000 0.000 0.000
Analysis/InvestigationNot Evaluated Threat 0.000 0.000 0.000 2.623 2.813 2.000 2.000 2.000 2.000 20.000
Total Analysis/Investigation 0.000 0.000 0.000 2.623 2.813 2.000 2.000 2.000 2.000 20.000
Interim ActionsNot Evaluated Threat 0.000 1.810 0.208 5.341 5.590 6.338 6.272 6.203 6.131 0.000
Total Interim Actions 0.000 1.810 0.208 5.341 5.590 6.338 6.272 6.203 6.131 0.000Remedial Designs
Not Evaluated Threat 46.833Total Remedial Designs 46.833
Remedial Action ConstructionNot Evaluated Threat 421.498
Total Remedial Action Construction 421.498
Total Munitions ResponseSites 0 0 0 0 0 0 0 0 0 0Funding 0.000 6.528 5.100 8.464 8.403 8.338 8.272 8.203 8.131 488.331
Total Environmental RestorationSites 1409 1405 1378 1178 1086 1130 982 990 835 729Funding 308.334 330.983 338.609 341.040 354.310 359.987 367.677 375.729 383.658 1390.337BRAC
IRP
AssessmentsNumber of Sites 13 107 2
High Relative Risk With Reuse 0.071 2.234 0.000 0.000 0.000 0.000 0.000 0.000 0.000 0.000Medium Relative Risk With Reuse 0.035 0.491 0.000 0.000 0.000 0.000 0.000 0.000 0.000 0.000Low Relative Risk With Reuse 2.095 0.665 0.178 0.000 0.000 0.000 0.000 0.000 0.000 0.000Not Evaluated Relative Risk With Reuse 0.019 0.128 0.000 0.000 0.000 0.000 0.000 0.000 0.000 0.000
Total Assessments 2.220 3.518 0.178 0.000 0.000 0.000 0.000 0.000 0.000 0.000
136
Exhibit ENV 30 Part 2 Enviromental DERA and BRAC Funds Budgeted for Clean-Up Project ManagementFebruary 2003
Mr. Raul Grumberg (703) 695-0089
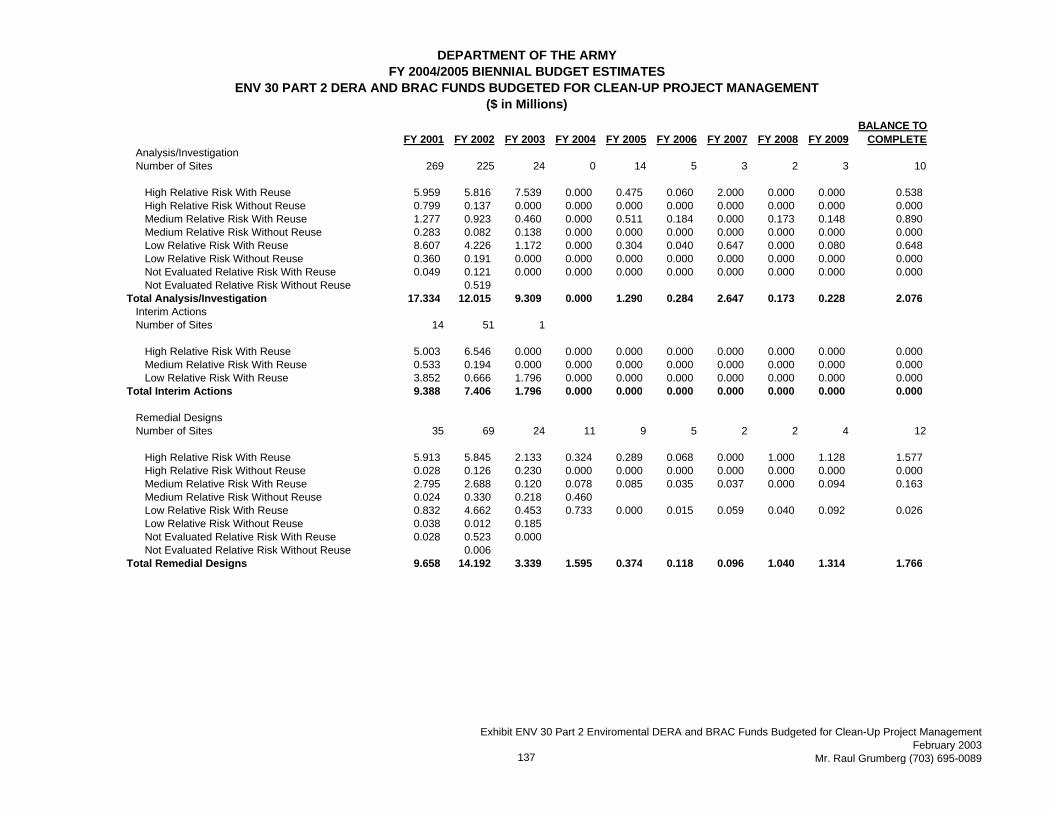
DEPARTMENT OF THE ARMYFY 2004/2005 BIENNIAL BUDGET ESTIMATES
ENV 30 PART 2 DERA AND BRAC FUNDS BUDGETED FOR CLEAN-UP PROJECT MANAGEMENT($ in Millions)
FY 2001 FY 2002 FY 2003 FY 2004 FY 2005 FY 2006 FY 2007 FY 2008 FY 2009BALANCE TO
COMPLETEAnalysis/InvestigationNumber of Sites 269 225 24 0 14 5 3 2 3 10
High Relative Risk With Reuse 5.959 5.816 7.539 0.000 0.475 0.060 2.000 0.000 0.000 0.538High Relative Risk Without Reuse 0.799 0.137 0.000 0.000 0.000 0.000 0.000 0.000 0.000 0.000Medium Relative Risk With Reuse 1.277 0.923 0.460 0.000 0.511 0.184 0.000 0.173 0.148 0.890Medium Relative Risk Without Reuse 0.283 0.082 0.138 0.000 0.000 0.000 0.000 0.000 0.000 0.000Low Relative Risk With Reuse 8.607 4.226 1.172 0.000 0.304 0.040 0.647 0.000 0.080 0.648Low Relative Risk Without Reuse 0.360 0.191 0.000 0.000 0.000 0.000 0.000 0.000 0.000 0.000Not Evaluated Relative Risk With Reuse 0.049 0.121 0.000 0.000 0.000 0.000 0.000 0.000 0.000 0.000Not Evaluated Relative Risk Without Reuse 0.519
Total Analysis/Investigation 17.334 12.015 9.309 0.000 1.290 0.284 2.647 0.173 0.228 2.076Interim ActionsNumber of Sites 14 51 1
High Relative Risk With Reuse 5.003 6.546 0.000 0.000 0.000 0.000 0.000 0.000 0.000 0.000Medium Relative Risk With Reuse 0.533 0.194 0.000 0.000 0.000 0.000 0.000 0.000 0.000 0.000Low Relative Risk With Reuse 3.852 0.666 1.796 0.000 0.000 0.000 0.000 0.000 0.000 0.000
Total Interim Actions 9.388 7.406 1.796 0.000 0.000 0.000 0.000 0.000 0.000 0.000
Remedial DesignsNumber of Sites 35 69 24 11 9 5 2 2 4 12
High Relative Risk With Reuse 5.913 5.845 2.133 0.324 0.289 0.068 0.000 1.000 1.128 1.577High Relative Risk Without Reuse 0.028 0.126 0.230 0.000 0.000 0.000 0.000 0.000 0.000 0.000Medium Relative Risk With Reuse 2.795 2.688 0.120 0.078 0.085 0.035 0.037 0.000 0.094 0.163Medium Relative Risk Without Reuse 0.024 0.330 0.218 0.460Low Relative Risk With Reuse 0.832 4.662 0.453 0.733 0.000 0.015 0.059 0.040 0.092 0.026Low Relative Risk Without Reuse 0.038 0.012 0.185Not Evaluated Relative Risk With Reuse 0.028 0.523 0.000Not Evaluated Relative Risk Without Reuse 0.006
Total Remedial Designs 9.658 14.192 3.339 1.595 0.374 0.118 0.096 1.040 1.314 1.766
137
Exhibit ENV 30 Part 2 Enviromental DERA and BRAC Funds Budgeted for Clean-Up Project ManagementFebruary 2003
Mr. Raul Grumberg (703) 695-0089

DEPARTMENT OF THE ARMYFY 2004/2005 BIENNIAL BUDGET ESTIMATES
ENV 30 PART 2 DERA AND BRAC FUNDS BUDGETED FOR CLEAN-UP PROJECT MANAGEMENT($ in Millions)
FY 2001 FY 2002 FY 2003 FY 2004 FY 2005 FY 2006 FY 2007 FY 2008 FY 2009BALANCE TO
COMPLETE
Remedial Action ConstructionNumber of Sites 58 107 33 19 18 18 7 5 1 22
High Relative Risk With Reuse 72.512 7.717 50.336 19.480 5.206 6.778 2.821 13.137 0.000 64.312High Relative Risk Without Reuse 1.642 0.126 0.207 3.136 0.000 0.000 0.000 0.257 3.650Medium Relative Risk With Reuse 29.595 3.916 4.318 0.828 0.142 1.266 0.426 0.000 0.000 6.135Medium Relative Risk Without Reuse 0.941 0.380 2.489 0.116 2.733 0.000 0.000 0.000 0.000 0.000Low Relative Risk With Reuse 19.751 5.928 3.378 3.462 9.665 4.546 3.059 0.010 0.000 3.865Low Relative Risk Without Reuse 2.676 0.012 0.578 0.117Not Evaluated Relative Risk With Reuse 5.564 0.751 0.000Not Evaluated Relative Risk Without Reuse 0.006
Total Remedial Action Construction 132.681 18.836 61.306 27.139 17.746 12.590 6.306 13.404 3.650 74.312Remedial Action OperationsNumber of Sites 32 11 12 20 16 19 18 16 12
N/A With Reuse 12.569 3.581 15.648 9.817 9.225 10.800 11.227 6.886 7.111 60.213N/A Without Reuse 0.230
Total Remedial Action Operations 12.569 3.581 15.648 9.817 9.455 10.800 11.227 6.886 7.111 60.213
Long Term ManagementNumber of Sites 117 66 76 82 88 79 79 77 98
N/A With Reuse 6.340 26.088 5.106 5.806 5.682 5.285 4.847 6.278 5.928 72.813N/A Without Reuse 0.443 0.482 0.336 0.519 0.373 0.329 0.395 0.162 8.045
Total Long Term Management 6.340 26.531 5.588 6.142 6.201 5.658 5.176 6.673 6.090 80.858
Total IRP
138
Exhibit ENV 30 Part 2 Enviromental DERA and BRAC Funds Budgeted for Clean-Up Project ManagementFebruary 2003
Mr. Raul Grumberg (703) 695-0089
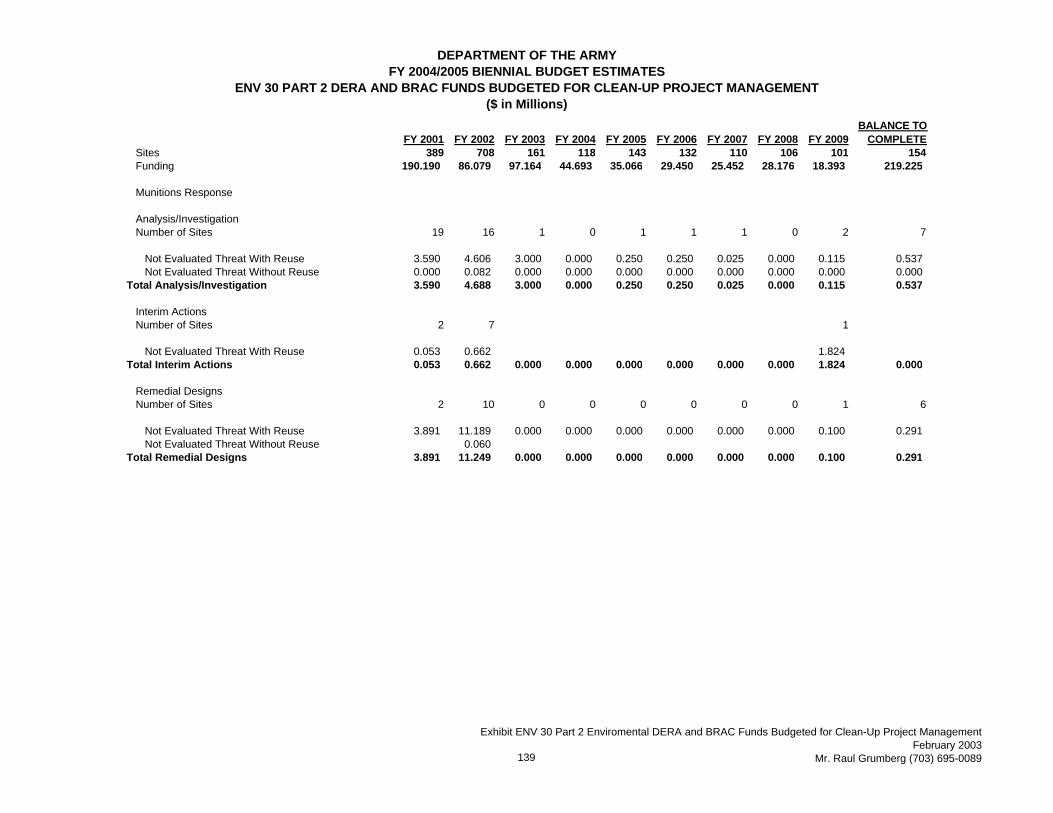
DEPARTMENT OF THE ARMYFY 2004/2005 BIENNIAL BUDGET ESTIMATES
ENV 30 PART 2 DERA AND BRAC FUNDS BUDGETED FOR CLEAN-UP PROJECT MANAGEMENT($ in Millions)
FY 2001 FY 2002 FY 2003 FY 2004 FY 2005 FY 2006 FY 2007 FY 2008 FY 2009BALANCE TO
COMPLETESites 389 708 161 118 143 132 110 106 101 154Funding 190.190 86.079 97.164 44.693 35.066 29.450 25.452 28.176 18.393 219.225
Munitions Response
Analysis/InvestigationNumber of Sites 19 16 1 0 1 1 1 0 2 7
Not Evaluated Threat With Reuse 3.590 4.606 3.000 0.000 0.250 0.250 0.025 0.000 0.115 0.537Not Evaluated Threat Without Reuse 0.000 0.082 0.000 0.000 0.000 0.000 0.000 0.000 0.000 0.000
Total Analysis/Investigation 3.590 4.688 3.000 0.000 0.250 0.250 0.025 0.000 0.115 0.537
Interim ActionsNumber of Sites 2 7 1
Not Evaluated Threat With Reuse 0.053 0.662 1.824Total Interim Actions 0.053 0.662 0.000 0.000 0.000 0.000 0.000 0.000 1.824 0.000
Remedial DesignsNumber of Sites 2 10 0 0 0 0 0 0 1 6
Not Evaluated Threat With Reuse 3.891 11.189 0.000 0.000 0.000 0.000 0.000 0.000 0.100 0.291Not Evaluated Threat Without Reuse 0.060
Total Remedial Designs 3.891 11.249 0.000 0.000 0.000 0.000 0.000 0.000 0.100 0.291
139
Exhibit ENV 30 Part 2 Enviromental DERA and BRAC Funds Budgeted for Clean-Up Project ManagementFebruary 2003
Mr. Raul Grumberg (703) 695-0089
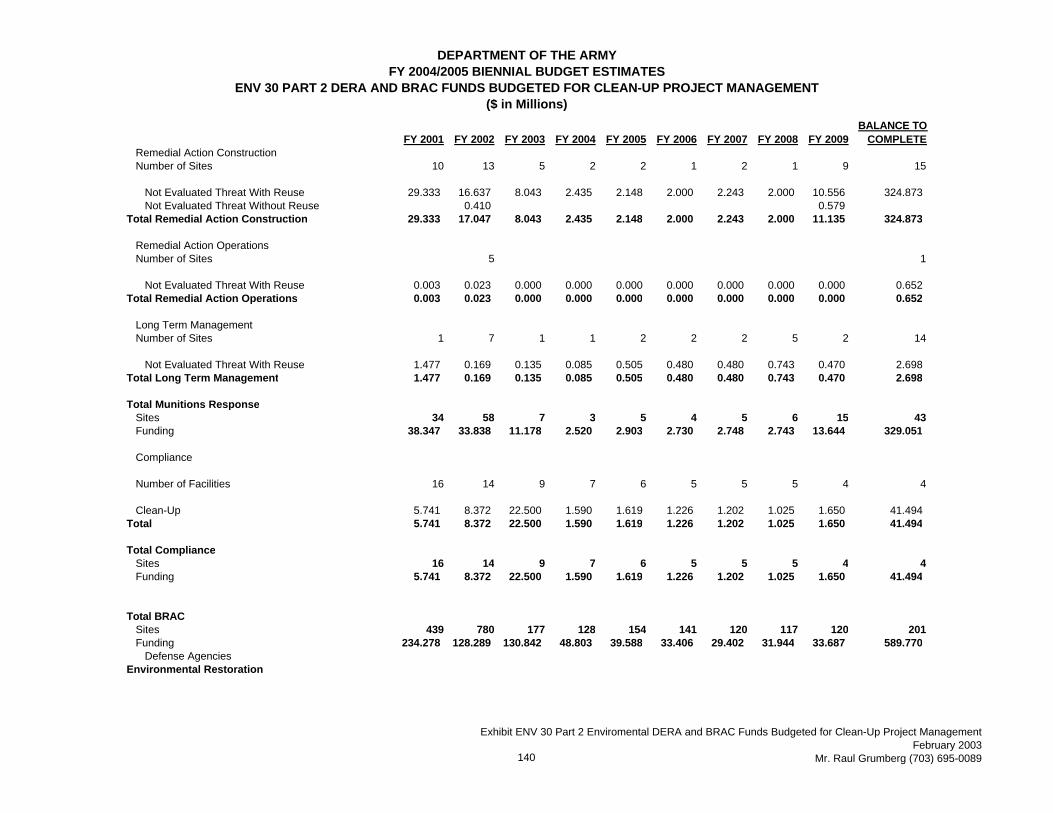
DEPARTMENT OF THE ARMYFY 2004/2005 BIENNIAL BUDGET ESTIMATES
ENV 30 PART 2 DERA AND BRAC FUNDS BUDGETED FOR CLEAN-UP PROJECT MANAGEMENT($ in Millions)
FY 2001 FY 2002 FY 2003 FY 2004 FY 2005 FY 2006 FY 2007 FY 2008 FY 2009BALANCE TO
COMPLETERemedial Action ConstructionNumber of Sites 10 13 5 2 2 1 2 1 9 15
Not Evaluated Threat With Reuse 29.333 16.637 8.043 2.435 2.148 2.000 2.243 2.000 10.556 324.873Not Evaluated Threat Without Reuse 0.410 0.579
Total Remedial Action Construction 29.333 17.047 8.043 2.435 2.148 2.000 2.243 2.000 11.135 324.873
Remedial Action OperationsNumber of Sites 5 1
Not Evaluated Threat With Reuse 0.003 0.023 0.000 0.000 0.000 0.000 0.000 0.000 0.000 0.652Total Remedial Action Operations 0.003 0.023 0.000 0.000 0.000 0.000 0.000 0.000 0.000 0.652
Long Term ManagementNumber of Sites 1 7 1 1 2 2 2 5 2 14
Not Evaluated Threat With Reuse 1.477 0.169 0.135 0.085 0.505 0.480 0.480 0.743 0.470 2.698Total Long Term Management 1.477 0.169 0.135 0.085 0.505 0.480 0.480 0.743 0.470 2.698
Total Munitions ResponseSites 34 58 7 3 5 4 5 6 15 43Funding 38.347 33.838 11.178 2.520 2.903 2.730 2.748 2.743 13.644 329.051
Compliance
Number of Facilities 16 14 9 7 6 5 5 5 4 4
Clean-Up 5.741 8.372 22.500 1.590 1.619 1.226 1.202 1.025 1.650 41.494Total 5.741 8.372 22.500 1.590 1.619 1.226 1.202 1.025 1.650 41.494
Total ComplianceSites 16 14 9 7 6 5 5 5 4 4Funding 5.741 8.372 22.500 1.590 1.619 1.226 1.202 1.025 1.650 41.494
Total BRACSites 439 780 177 128 154 141 120 117 120 201Funding 234.278 128.289 130.842 48.803 39.588 33.406 29.402 31.944 33.687 589.770
Defense AgenciesEnvironmental Restoration
140
Exhibit ENV 30 Part 2 Enviromental DERA and BRAC Funds Budgeted for Clean-Up Project ManagementFebruary 2003
Mr. Raul Grumberg (703) 695-0089
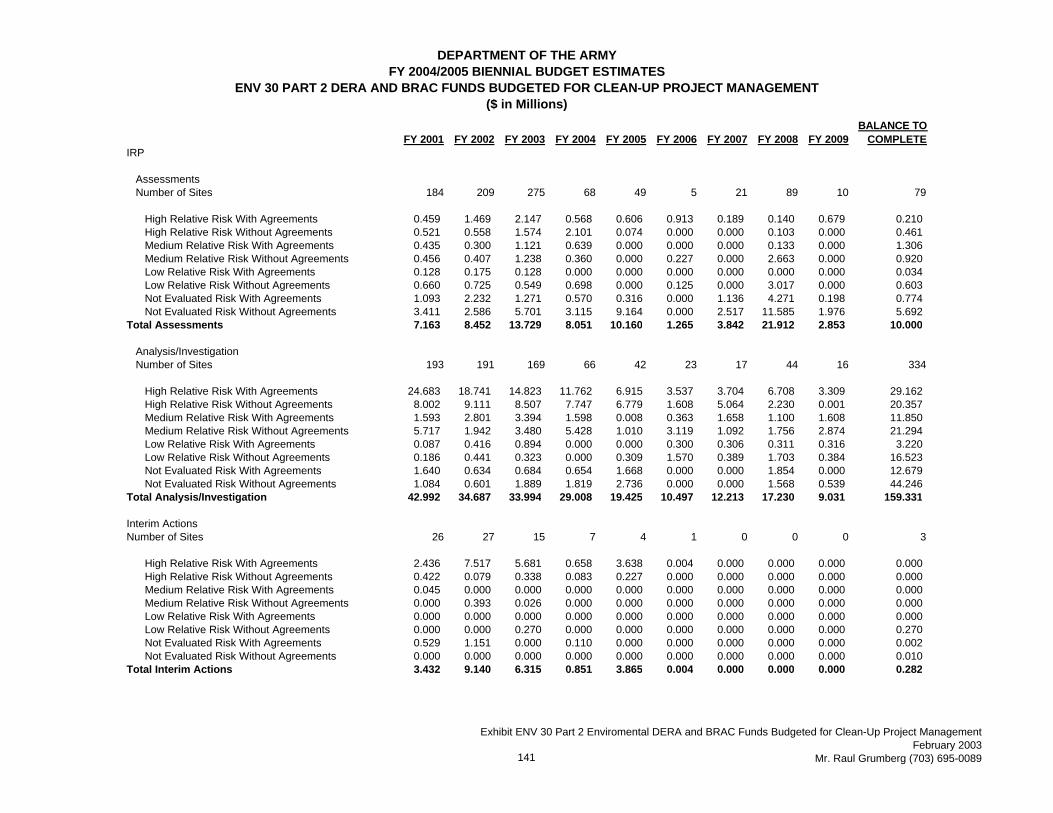
DEPARTMENT OF THE ARMYFY 2004/2005 BIENNIAL BUDGET ESTIMATES
ENV 30 PART 2 DERA AND BRAC FUNDS BUDGETED FOR CLEAN-UP PROJECT MANAGEMENT($ in Millions)
FY 2001 FY 2002 FY 2003 FY 2004 FY 2005 FY 2006 FY 2007 FY 2008 FY 2009BALANCE TO
COMPLETEIRP
AssessmentsNumber of Sites 184 209 275 68 49 5 21 89 10 79
High Relative Risk With Agreements 0.459 1.469 2.147 0.568 0.606 0.913 0.189 0.140 0.679 0.210High Relative Risk Without Agreements 0.521 0.558 1.574 2.101 0.074 0.000 0.000 0.103 0.000 0.461Medium Relative Risk With Agreements 0.435 0.300 1.121 0.639 0.000 0.000 0.000 0.133 0.000 1.306Medium Relative Risk Without Agreements 0.456 0.407 1.238 0.360 0.000 0.227 0.000 2.663 0.000 0.920Low Relative Risk With Agreements 0.128 0.175 0.128 0.000 0.000 0.000 0.000 0.000 0.000 0.034Low Relative Risk Without Agreements 0.660 0.725 0.549 0.698 0.000 0.125 0.000 3.017 0.000 0.603Not Evaluated Risk With Agreements 1.093 2.232 1.271 0.570 0.316 0.000 1.136 4.271 0.198 0.774Not Evaluated Risk Without Agreements 3.411 2.586 5.701 3.115 9.164 0.000 2.517 11.585 1.976 5.692
Total Assessments 7.163 8.452 13.729 8.051 10.160 1.265 3.842 21.912 2.853 10.000
Analysis/InvestigationNumber of Sites 193 191 169 66 42 23 17 44 16 334
High Relative Risk With Agreements 24.683 18.741 14.823 11.762 6.915 3.537 3.704 6.708 3.309 29.162High Relative Risk Without Agreements 8.002 9.111 8.507 7.747 6.779 1.608 5.064 2.230 0.001 20.357Medium Relative Risk With Agreements 1.593 2.801 3.394 1.598 0.008 0.363 1.658 1.100 1.608 11.850Medium Relative Risk Without Agreements 5.717 1.942 3.480 5.428 1.010 3.119 1.092 1.756 2.874 21.294Low Relative Risk With Agreements 0.087 0.416 0.894 0.000 0.000 0.300 0.306 0.311 0.316 3.220Low Relative Risk Without Agreements 0.186 0.441 0.323 0.000 0.309 1.570 0.389 1.703 0.384 16.523Not Evaluated Risk With Agreements 1.640 0.634 0.684 0.654 1.668 0.000 0.000 1.854 0.000 12.679Not Evaluated Risk Without Agreements 1.084 0.601 1.889 1.819 2.736 0.000 0.000 1.568 0.539 44.246
Total Analysis/Investigation 42.992 34.687 33.994 29.008 19.425 10.497 12.213 17.230 9.031 159.331
Interim ActionsNumber of Sites 26 27 15 7 4 1 0 0 0 3
High Relative Risk With Agreements 2.436 7.517 5.681 0.658 3.638 0.004 0.000 0.000 0.000 0.000High Relative Risk Without Agreements 0.422 0.079 0.338 0.083 0.227 0.000 0.000 0.000 0.000 0.000Medium Relative Risk With Agreements 0.045 0.000 0.000 0.000 0.000 0.000 0.000 0.000 0.000 0.000Medium Relative Risk Without Agreements 0.000 0.393 0.026 0.000 0.000 0.000 0.000 0.000 0.000 0.000Low Relative Risk With Agreements 0.000 0.000 0.000 0.000 0.000 0.000 0.000 0.000 0.000 0.000Low Relative Risk Without Agreements 0.000 0.000 0.270 0.000 0.000 0.000 0.000 0.000 0.000 0.270Not Evaluated Risk With Agreements 0.529 1.151 0.000 0.110 0.000 0.000 0.000 0.000 0.000 0.002Not Evaluated Risk Without Agreements 0.000 0.000 0.000 0.000 0.000 0.000 0.000 0.000 0.000 0.010
Total Interim Actions 3.432 9.140 6.315 0.851 3.865 0.004 0.000 0.000 0.000 0.282
141
Exhibit ENV 30 Part 2 Enviromental DERA and BRAC Funds Budgeted for Clean-Up Project ManagementFebruary 2003
Mr. Raul Grumberg (703) 695-0089
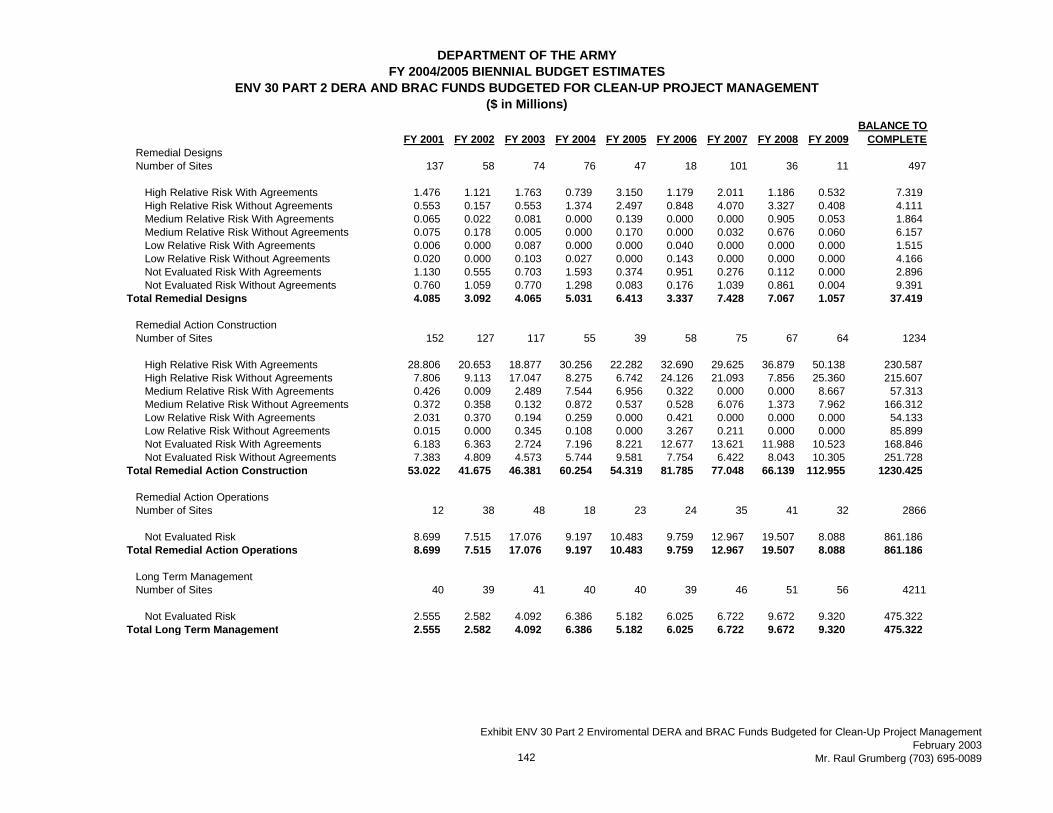
DEPARTMENT OF THE ARMYFY 2004/2005 BIENNIAL BUDGET ESTIMATES
ENV 30 PART 2 DERA AND BRAC FUNDS BUDGETED FOR CLEAN-UP PROJECT MANAGEMENT($ in Millions)
FY 2001 FY 2002 FY 2003 FY 2004 FY 2005 FY 2006 FY 2007 FY 2008 FY 2009BALANCE TO
COMPLETERemedial DesignsNumber of Sites 137 58 74 76 47 18 101 36 11 497
High Relative Risk With Agreements 1.476 1.121 1.763 0.739 3.150 1.179 2.011 1.186 0.532 7.319High Relative Risk Without Agreements 0.553 0.157 0.553 1.374 2.497 0.848 4.070 3.327 0.408 4.111Medium Relative Risk With Agreements 0.065 0.022 0.081 0.000 0.139 0.000 0.000 0.905 0.053 1.864Medium Relative Risk Without Agreements 0.075 0.178 0.005 0.000 0.170 0.000 0.032 0.676 0.060 6.157Low Relative Risk With Agreements 0.006 0.000 0.087 0.000 0.000 0.040 0.000 0.000 0.000 1.515Low Relative Risk Without Agreements 0.020 0.000 0.103 0.027 0.000 0.143 0.000 0.000 0.000 4.166Not Evaluated Risk With Agreements 1.130 0.555 0.703 1.593 0.374 0.951 0.276 0.112 0.000 2.896Not Evaluated Risk Without Agreements 0.760 1.059 0.770 1.298 0.083 0.176 1.039 0.861 0.004 9.391
Total Remedial Designs 4.085 3.092 4.065 5.031 6.413 3.337 7.428 7.067 1.057 37.419
Remedial Action ConstructionNumber of Sites 152 127 117 55 39 58 75 67 64 1234
High Relative Risk With Agreements 28.806 20.653 18.877 30.256 22.282 32.690 29.625 36.879 50.138 230.587High Relative Risk Without Agreements 7.806 9.113 17.047 8.275 6.742 24.126 21.093 7.856 25.360 215.607Medium Relative Risk With Agreements 0.426 0.009 2.489 7.544 6.956 0.322 0.000 0.000 8.667 57.313Medium Relative Risk Without Agreements 0.372 0.358 0.132 0.872 0.537 0.528 6.076 1.373 7.962 166.312Low Relative Risk With Agreements 2.031 0.370 0.194 0.259 0.000 0.421 0.000 0.000 0.000 54.133Low Relative Risk Without Agreements 0.015 0.000 0.345 0.108 0.000 3.267 0.211 0.000 0.000 85.899Not Evaluated Risk With Agreements 6.183 6.363 2.724 7.196 8.221 12.677 13.621 11.988 10.523 168.846Not Evaluated Risk Without Agreements 7.383 4.809 4.573 5.744 9.581 7.754 6.422 8.043 10.305 251.728
Total Remedial Action Construction 53.022 41.675 46.381 60.254 54.319 81.785 77.048 66.139 112.955 1230.425
Remedial Action OperationsNumber of Sites 12 38 48 18 23 24 35 41 32 2866
Not Evaluated Risk 8.699 7.515 17.076 9.197 10.483 9.759 12.967 19.507 8.088 861.186Total Remedial Action Operations 8.699 7.515 17.076 9.197 10.483 9.759 12.967 19.507 8.088 861.186
Long Term ManagementNumber of Sites 40 39 41 40 40 39 46 51 56 4211
Not Evaluated Risk 2.555 2.582 4.092 6.386 5.182 6.025 6.722 9.672 9.320 475.322Total Long Term Management 2.555 2.582 4.092 6.386 5.182 6.025 6.722 9.672 9.320 475.322
142
Exhibit ENV 30 Part 2 Enviromental DERA and BRAC Funds Budgeted for Clean-Up Project ManagementFebruary 2003
Mr. Raul Grumberg (703) 695-0089
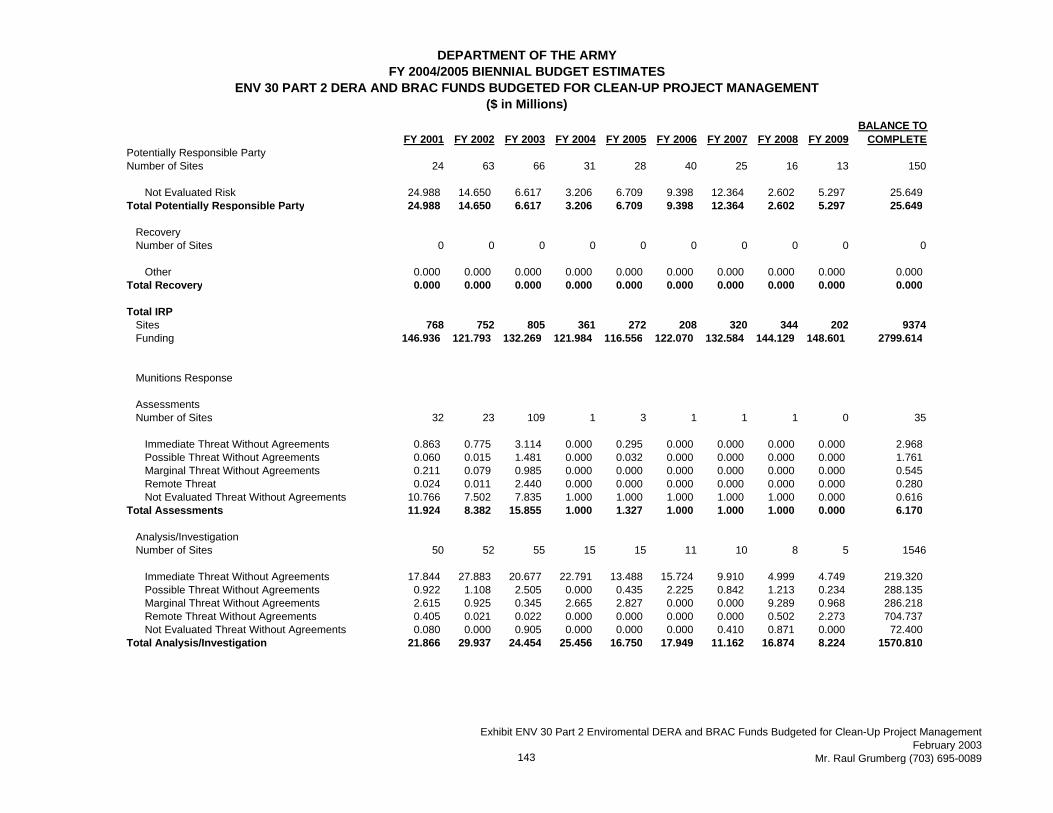
DEPARTMENT OF THE ARMYFY 2004/2005 BIENNIAL BUDGET ESTIMATES
ENV 30 PART 2 DERA AND BRAC FUNDS BUDGETED FOR CLEAN-UP PROJECT MANAGEMENT($ in Millions)
FY 2001 FY 2002 FY 2003 FY 2004 FY 2005 FY 2006 FY 2007 FY 2008 FY 2009BALANCE TO
COMPLETEPotentially Responsible PartyNumber of Sites 24 63 66 31 28 40 25 16 13 150
Not Evaluated Risk 24.988 14.650 6.617 3.206 6.709 9.398 12.364 2.602 5.297 25.649Total Potentially Responsible Party 24.988 14.650 6.617 3.206 6.709 9.398 12.364 2.602 5.297 25.649
RecoveryNumber of Sites 0 0 0 0 0 0 0 0 0 0
Other 0.000 0.000 0.000 0.000 0.000 0.000 0.000 0.000 0.000 0.000Total Recovery 0.000 0.000 0.000 0.000 0.000 0.000 0.000 0.000 0.000 0.000
Total IRPSites 768 752 805 361 272 208 320 344 202 9374Funding 146.936 121.793 132.269 121.984 116.556 122.070 132.584 144.129 148.601 2799.614
Munitions Response
AssessmentsNumber of Sites 32 23 109 1 3 1 1 1 0 35
Immediate Threat Without Agreements 0.863 0.775 3.114 0.000 0.295 0.000 0.000 0.000 0.000 2.968Possible Threat Without Agreements 0.060 0.015 1.481 0.000 0.032 0.000 0.000 0.000 0.000 1.761Marginal Threat Without Agreements 0.211 0.079 0.985 0.000 0.000 0.000 0.000 0.000 0.000 0.545Remote Threat 0.024 0.011 2.440 0.000 0.000 0.000 0.000 0.000 0.000 0.280Not Evaluated Threat Without Agreements 10.766 7.502 7.835 1.000 1.000 1.000 1.000 1.000 0.000 0.616
Total Assessments 11.924 8.382 15.855 1.000 1.327 1.000 1.000 1.000 0.000 6.170
Analysis/InvestigationNumber of Sites 50 52 55 15 15 11 10 8 5 1546
Immediate Threat Without Agreements 17.844 27.883 20.677 22.791 13.488 15.724 9.910 4.999 4.749 219.320Possible Threat Without Agreements 0.922 1.108 2.505 0.000 0.435 2.225 0.842 1.213 0.234 288.135Marginal Threat Without Agreements 2.615 0.925 0.345 2.665 2.827 0.000 0.000 9.289 0.968 286.218Remote Threat Without Agreements 0.405 0.021 0.022 0.000 0.000 0.000 0.000 0.502 2.273 704.737Not Evaluated Threat Without Agreements 0.080 0.000 0.905 0.000 0.000 0.000 0.410 0.871 0.000 72.400
Total Analysis/Investigation 21.866 29.937 24.454 25.456 16.750 17.949 11.162 16.874 8.224 1570.810
143
Exhibit ENV 30 Part 2 Enviromental DERA and BRAC Funds Budgeted for Clean-Up Project ManagementFebruary 2003
Mr. Raul Grumberg (703) 695-0089
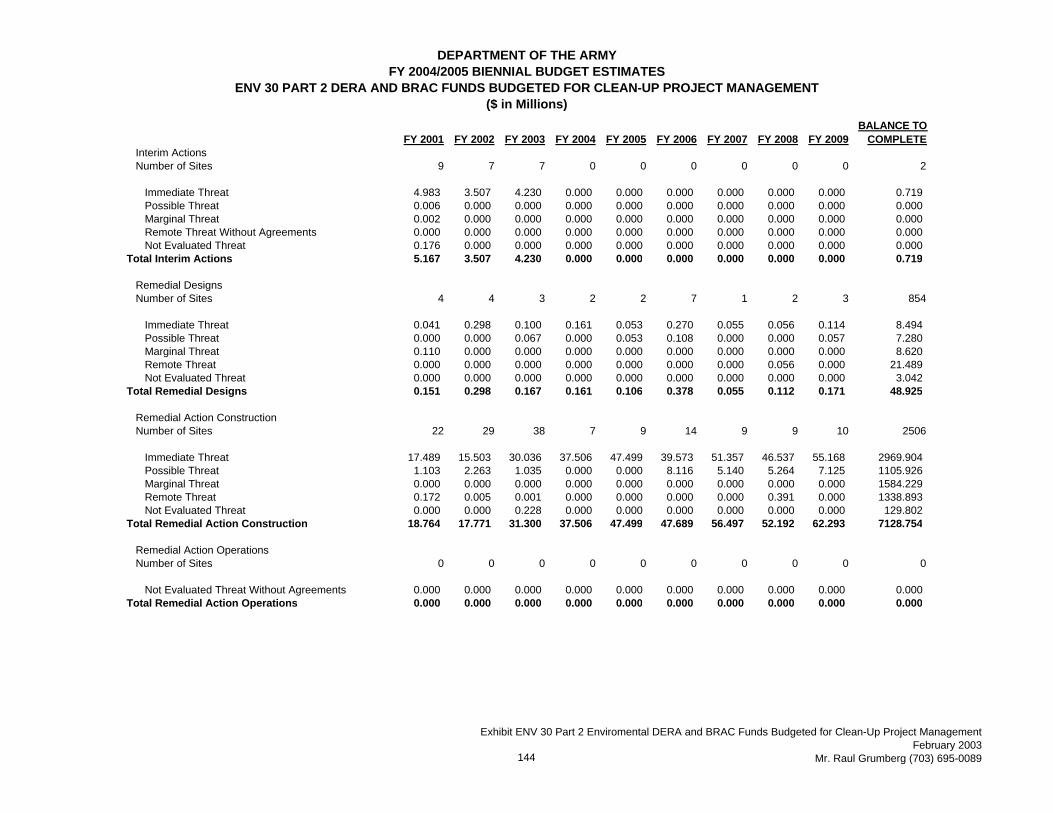
DEPARTMENT OF THE ARMYFY 2004/2005 BIENNIAL BUDGET ESTIMATES
ENV 30 PART 2 DERA AND BRAC FUNDS BUDGETED FOR CLEAN-UP PROJECT MANAGEMENT($ in Millions)
FY 2001 FY 2002 FY 2003 FY 2004 FY 2005 FY 2006 FY 2007 FY 2008 FY 2009BALANCE TO
COMPLETEInterim ActionsNumber of Sites 9 7 7 0 0 0 0 0 0 2
Immediate Threat 4.983 3.507 4.230 0.000 0.000 0.000 0.000 0.000 0.000 0.719Possible Threat 0.006 0.000 0.000 0.000 0.000 0.000 0.000 0.000 0.000 0.000Marginal Threat 0.002 0.000 0.000 0.000 0.000 0.000 0.000 0.000 0.000 0.000Remote Threat Without Agreements 0.000 0.000 0.000 0.000 0.000 0.000 0.000 0.000 0.000 0.000Not Evaluated Threat 0.176 0.000 0.000 0.000 0.000 0.000 0.000 0.000 0.000 0.000
Total Interim Actions 5.167 3.507 4.230 0.000 0.000 0.000 0.000 0.000 0.000 0.719
Remedial DesignsNumber of Sites 4 4 3 2 2 7 1 2 3 854
Immediate Threat 0.041 0.298 0.100 0.161 0.053 0.270 0.055 0.056 0.114 8.494Possible Threat 0.000 0.000 0.067 0.000 0.053 0.108 0.000 0.000 0.057 7.280Marginal Threat 0.110 0.000 0.000 0.000 0.000 0.000 0.000 0.000 0.000 8.620Remote Threat 0.000 0.000 0.000 0.000 0.000 0.000 0.000 0.056 0.000 21.489Not Evaluated Threat 0.000 0.000 0.000 0.000 0.000 0.000 0.000 0.000 0.000 3.042
Total Remedial Designs 0.151 0.298 0.167 0.161 0.106 0.378 0.055 0.112 0.171 48.925
Remedial Action ConstructionNumber of Sites 22 29 38 7 9 14 9 9 10 2506
Immediate Threat 17.489 15.503 30.036 37.506 47.499 39.573 51.357 46.537 55.168 2969.904Possible Threat 1.103 2.263 1.035 0.000 0.000 8.116 5.140 5.264 7.125 1105.926Marginal Threat 0.000 0.000 0.000 0.000 0.000 0.000 0.000 0.000 0.000 1584.229Remote Threat 0.172 0.005 0.001 0.000 0.000 0.000 0.000 0.391 0.000 1338.893Not Evaluated Threat 0.000 0.000 0.228 0.000 0.000 0.000 0.000 0.000 0.000 129.802
Total Remedial Action Construction 18.764 17.771 31.300 37.506 47.499 47.689 56.497 52.192 62.293 7128.754
Remedial Action OperationsNumber of Sites 0 0 0 0 0 0 0 0 0 0
Not Evaluated Threat Without Agreements 0.000 0.000 0.000 0.000 0.000 0.000 0.000 0.000 0.000 0.000Total Remedial Action Operations 0.000 0.000 0.000 0.000 0.000 0.000 0.000 0.000 0.000 0.000
144
Exhibit ENV 30 Part 2 Enviromental DERA and BRAC Funds Budgeted for Clean-Up Project ManagementFebruary 2003
Mr. Raul Grumberg (703) 695-0089
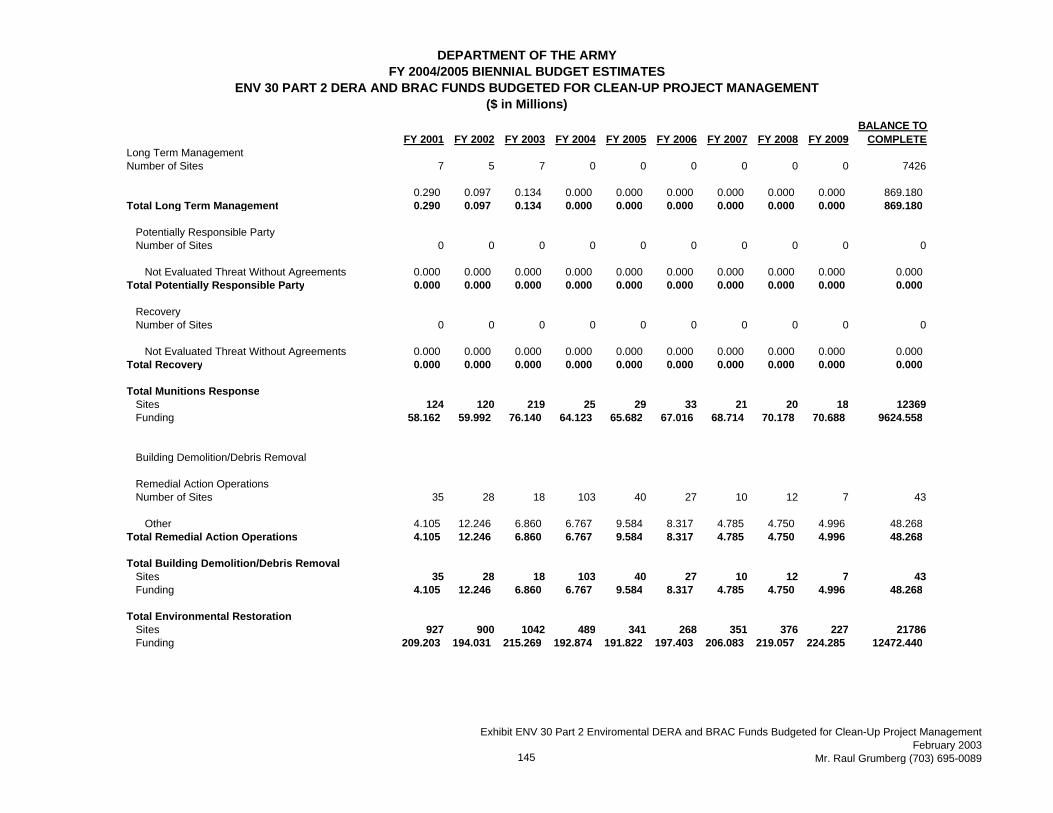
DEPARTMENT OF THE ARMYFY 2004/2005 BIENNIAL BUDGET ESTIMATES
ENV 30 PART 2 DERA AND BRAC FUNDS BUDGETED FOR CLEAN-UP PROJECT MANAGEMENT($ in Millions)
FY 2001 FY 2002 FY 2003 FY 2004 FY 2005 FY 2006 FY 2007 FY 2008 FY 2009BALANCE TO
COMPLETELong Term ManagementNumber of Sites 7 5 7 0 0 0 0 0 0 7426
0.290 0.097 0.134 0.000 0.000 0.000 0.000 0.000 0.000 869.180Total Long Term Management 0.290 0.097 0.134 0.000 0.000 0.000 0.000 0.000 0.000 869.180
Potentially Responsible PartyNumber of Sites 0 0 0 0 0 0 0 0 0 0
Not Evaluated Threat Without Agreements 0.000 0.000 0.000 0.000 0.000 0.000 0.000 0.000 0.000 0.000Total Potentially Responsible Party 0.000 0.000 0.000 0.000 0.000 0.000 0.000 0.000 0.000 0.000
RecoveryNumber of Sites 0 0 0 0 0 0 0 0 0 0
Not Evaluated Threat Without Agreements 0.000 0.000 0.000 0.000 0.000 0.000 0.000 0.000 0.000 0.000Total Recovery 0.000 0.000 0.000 0.000 0.000 0.000 0.000 0.000 0.000 0.000
Total Munitions ResponseSites 124 120 219 25 29 33 21 20 18 12369Funding 58.162 59.992 76.140 64.123 65.682 67.016 68.714 70.178 70.688 9624.558
Building Demolition/Debris Removal
Remedial Action OperationsNumber of Sites 35 28 18 103 40 27 10 12 7 43
Other 4.105 12.246 6.860 6.767 9.584 8.317 4.785 4.750 4.996 48.268Total Remedial Action Operations 4.105 12.246 6.860 6.767 9.584 8.317 4.785 4.750 4.996 48.268
Total Building Demolition/Debris RemovalSites 35 28 18 103 40 27 10 12 7 43Funding 4.105 12.246 6.860 6.767 9.584 8.317 4.785 4.750 4.996 48.268
Total Environmental RestorationSites 927 900 1042 489 341 268 351 376 227 21786Funding 209.203 194.031 215.269 192.874 191.822 197.403 206.083 219.057 224.285 12472.440
145
Exhibit ENV 30 Part 2 Enviromental DERA and BRAC Funds Budgeted for Clean-Up Project ManagementFebruary 2003
Mr. Raul Grumberg (703) 695-0089

DEPARTMENT OF THE ARMYFY 2004/2005 BIENNIAL BUDGET ESTIMATES
ENV 30 PART 3 DERA AND BRAC FUNDS BUDGETED FOR ENVIRONMENTAL CLEAN-UP PERFORMANCE METRICS
FY 2001 FY 2002 FY 2003 FY 2004 FY 2005 FY 2006 FY 2007 FY 2008 FY 2009Environmental RestorationHigh Relative RiskTotal Number of Sites Cleaned Up 598 771 886 979 1089 1238 1397 1410 1416Total Number of Sites 1384 1416 1416 1416 1416 1416 1416 1416 1416Percent of Sites Cleaned Up 43% 54% 63% 69% 77% 87% 99% 100% 100%Goal for Sites 50% 100%
Medium Relative RiskTotal Number of Sites Cleaned Up 300 291 342 416 459 519 558 586 630Total Number of Sites 666 680 680 680 680 680 680 680 680Percent of Sites Cleaned Up 45% 43% 50% 61% 68% 76% 82% 86% 93%Goal for Sites
Low Relative RiskTotal Number of Sites Cleaned Up 553 527 602 711 745 796 815 852 882Total Number of Sites 896 907 907 907 907 907 907 907 907Percent of Sites Cleaned Up 62% 58% 66% 78% 82% 88% 90% 94% 97%Goal for Sites
BRACTotal Number of Sites Cleaned Up 1547 1653 1772 1820 1850 1856 1869 1871 1876Total Number of Sites 1912 1901 1901 1901 1901 1901 1901 1901 1901Percent of Sites Cleaned Up 81% 87% 93% 96% 97% 98% 98% 98% 99%Goal for Sites 90 %
Total Number of Installations Cleaned Up 90 94 102 106 111 111 111 112 112Total Number of Installations 118 118 118 118 118 118 118 118 118Percent of Installations Cleaned Up 76% 80% 86% 90% 94% 94% 94% 95% 95%Goal for Installations 75% 100%
146
Exhibit ENV 30 Part 3 DERA and BRAC Funds Budgeted for Environmental Clean-Up Performance MetricsFebruary 2003
Mr. Raul Grumberg (703) 695-0089
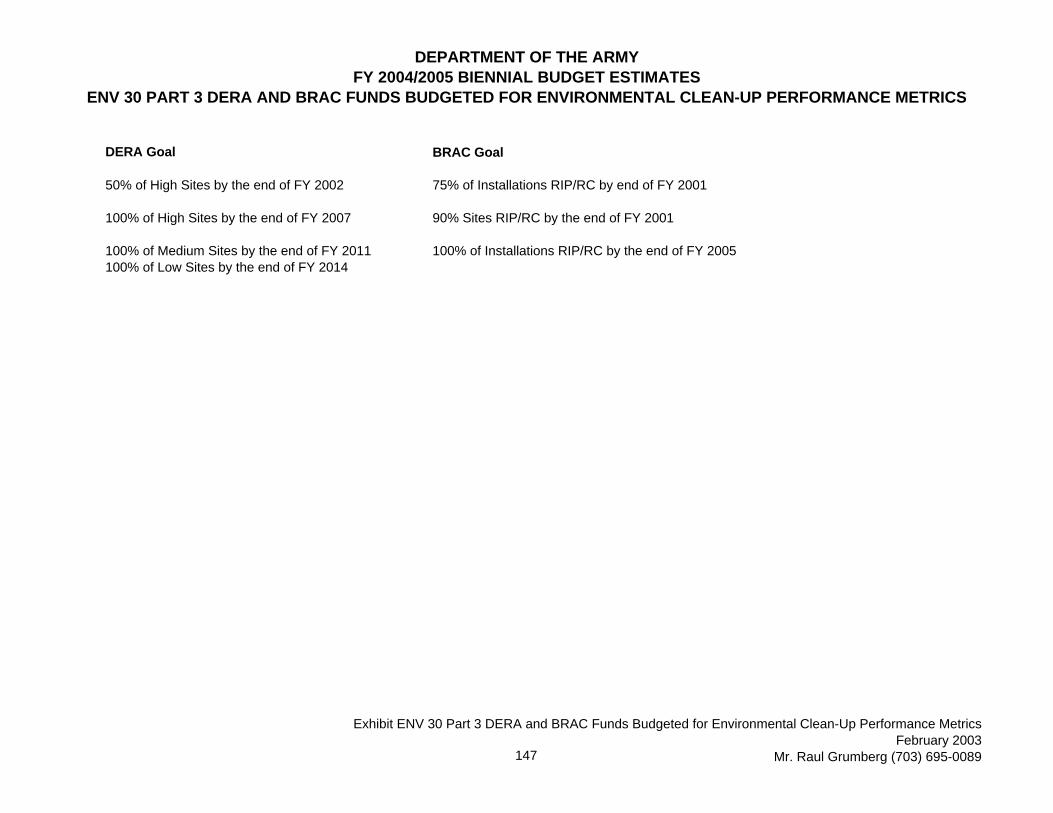
DEPARTMENT OF THE ARMYFY 2004/2005 BIENNIAL BUDGET ESTIMATES
ENV 30 PART 3 DERA AND BRAC FUNDS BUDGETED FOR ENVIRONMENTAL CLEAN-UP PERFORMANCE METRICS
DERA Goal BRAC Goal
50% of High Sites by the end of FY 2002 75% of Installations RIP/RC by end of FY 2001
100% of High Sites by the end of FY 2007 90% Sites RIP/RC by the end of FY 2001
100% of Medium Sites by the end of FY 2011 100% of Installations RIP/RC by the end of FY 2005100% of Low Sites by the end of FY 2014
147
Exhibit ENV 30 Part 3 DERA and BRAC Funds Budgeted for Environmental Clean-Up Performance MetricsFebruary 2003
Mr. Raul Grumberg (703) 695-0089

DEPARTMENT OF THE ARMY FY2004/2005 BIENNIAL BUDGET ESTIMATES
SUMMARY OF FUNDS BUDGETED FOR ENVIRONMENTAL PROJECTS ($ in Thousands)
Exhibit PB-28 Explanation of Changes: Environmental Quality: Appropriation: AFHO Change FY03/FY04: During the year of execution, installations complete family housing projects with associated environmental costs. Decreased funding in FY04 is related to decreased requirements for hazardous waste disposal for family housing projects. Decrease in requirements is the result of housing privatization in which costs are reflected in the privatization contract. Environmental Quality Appropriation: AMMO Change FY03/FY04: Funding is to meet environmental requirements for the Production Base Support for the Procurement of Ammunition, Army appropriation. Funding varies dramatically by media from year to year, depending on what projects are planned for a specific year. Some funding beginning in FY04 was realigned to the operations and maintenance account to fund environmental costs associated with disposal of 13 excess Industrial Properties (11 AMMO plants). Remaining funding was reprogrammed out of the environmental accounts to the PM, Production Base Support for Procurement of Ammunition. Subsequent programming for this activity will be accomplished through the PM, Procurement Army Ammunition.
Exhibit PB-28 Funds Budgeted for Evironmental Quality February 2003 Mr. Raul Grumberg (703) 695-0089 148

DEPARTMENT OF THE ARMY FY2004/2005 BIENNIAL BUDGET ESTIMATES
SUMMARY OF FUNDS BUDGETED FOR ENVIRONMENTAL PROJECTS ($ in Thousands)
Exhibit PB-28 Explanation of Changes: Environmental Quality Appropriation: AWCF Army Working Capital Fund (AWCF) data is a projection of Army Materiel Command's estimated execution for environmental requirements. Change FY03/FY04: Funding is realigned among media areas to support evolving mission requirements. Environmental Quality Appropriation: MCA Change FY03/FY04: FY02 funding supports a power plant cooling system upgrade at Fort Wainwright, Alaska that will reduce the condensation produced during the winter months to meet state air quality control requirements. The $23M MCA project has been deferred to FY03.
Exhibit PB-28 Funds Budgeted for Evironmental Quality February 2003 Mr. Raul Grumberg (703) 695-0089 149

DEPARTMENT OF THE ARMY FY2004/2005 BIENNIAL BUDGET ESTIMATES
SUMMARY OF FUNDS BUDGETED FOR ENVIRONMENTAL PROJECTS ($ in Thousands)
Environmental Quality: Appropriation: OMA Change FY03/FY04: The manpower increase reflects funding for Civil Service Retirement System Accruing Retirement costs. (PBD701C) In Compliance CONUS the decreases in Non Recurring Costs for Underground Storage Tanks (USTs), Clean Air Act, Clean Water Act, and Other are a result of projects completed in FY03. UST projects include emission inventories; control of mobile sources; and compliance with the National Ambient Air Quality Program and National Emission Standards for Hazardous Air Pollutants. Clean Water Act projects include implementing storm water best management practices, upgrade or removal of oil/water separators, repair of storm water outfalls, National Pollutant Discharge Elimination System (NPDES) phase II assessments and characterizations, storm water monitoring, and correction of non-compliant collection systems. Additionally, the reduction in Other Recurring Costs is attributed to completion of projects in FY03 for audits, cross connection backflow prevention, asbestos, lead, polychlorinated biphenyls (PCBs), cleanup, and National Environmental Policy Act. In Compliance Overseas the decrease in Non Recurring costs for Hazardous Waste (HW) is a result of improved estimates for HW storage areas. Decrease in Clean Water Act Costs is a result of reprogramming open vehicle maintenance area requirements to other than environmental funds. Increase in Non Recurring Costs for UST is to address Overseas UST issues. Projects include study of possible contamination areas; repair, removal and remediation of USTs; and installation of leak detection systems. Decrease in Overseas Other Recurring Costs is a result of reprogramming asbestos and lead-based paint abatement project requirements to operating budgets other than environmental accounts. In Conservation the decrease in Non Recurring Costs reflects the completion of a significant number of initial planning level surveys for Wetlands and Other Natural Resources (soils, fauna and flora, vegetation mapping, etc), and the completion of Integrated Cultural Resource Management Plans. In Pollution Prevention CONUS the increase in Non Recurring Costs for Hazardous Material Reduction is due to the Army initiating fielding of a standardized, Army-wide Hazardous Materials Management Program in FY04. In Pollution Prevention overseas, the overall decrease in Non Recurring Hazardous Waste Costs is the result of completion of hazardous waste minimization projects in FY03.
Exhibit PB-28 Funds Budgeted for Evironmental Quality February 2003 Mr. Raul Grumberg (703) 695-0089 150

DEPARTMENT OF THE ARMY FY2004/2005 BIENNIAL BUDGET ESTIMATES
SUMMARY OF FUNDS BUDGETED FOR ENVIRONMENTAL PROJECTS ($ in Thousands)
Environmental Quality Appropriation: OMAR Change FY03/FY04: Decrease in Compliance Other Recurring Costs is due to cyclical completion, update, and revision of plans and assessments for noise management, spill contingency, and storm water assessments and plans. Increase in Compliance Non Recurring Costs for Clean Water Act is due to increased number of projects for erosion control, wetlands construction, oil water separator repair/replacement, wash rack repair/replacement, and bringing wastewater systems into compliance. Decrease to Underground Storage Tanks Costs is due to completion of corrective and remedial actions at contaminated UST sites and UST removal and/or replacement project completions in FY03. Increases in Conservation Non Recurring costs are largely due to Historical and Cultural Resources which is a reflection of the Army Reserve requirement to prepare additional Integrated Cultural Resources Management Plans. The large decrease of Pollution Prevention recurring costs is the result of the Army Reserve completing its Pollution Prevention Plan Updates by 2003.
Exhibit PB-28 Funds Budgeted for Evironmental Quality February 2003 Mr. Raul Grumberg (703) 695-0089 151

DEPARTMENT OF THE ARMY FY2004/2005 BIENNIAL BUDGET ESTIMATES
SUMMARY OF FUNDS BUDGETED FOR ENVIRONMENTAL PROJECTS ($ in Thousands)
Environmental Quality Appropriation: OMNG Change FY03/FY04: In Compliance the decrease in Recurring Costs for Sampling, Analysis, and Monitoring, reflects the completion of monitoring projects. The decrease in Other Recurring Costs reflects the cyclical completion of plans and assessments for noise management, spill contingency, and storm water. The decrease in Non Recurring Costs for RCRA-C, Hazardous Waste reflects the construction completion of hazardous waste storage sites, reduction in amount of hazardous waste requiring disposal and completion of closure plans. The decrease in Non Recurring Costs for RCRA-I, Underground Storage Tanks reflects the completion of tank removal and tank upgrade projects. The decrease in Non Recurring Costs for Clean Air Act reflects control of mobile sources and compliance with the National Ambient Air Quality Program and National Emission Standards for Hazardous Air Pollutants. The decrease in Non Recurring Costs for the Clean Water Act reflects the completion of washrack and oil water separator repairs rehabilitations and upgrades, and the completion of cyclical spill plan updates and re-certifications and correction of non-compliant collections systems. The decrease in Non Recurring Planning Costs is related to the cyclical nature of plans reviews and updates. The decrease in Conservation Non Recurring Costs for T&E Species, Wetlands, Other Natural Resources, and Historical and Cultural Resources reflects the NGB completion of Endangered Species Management Plans, Integrated Cultural Resource Management Plans, and a significant number of natural resources planning level surveys. The large decrease of Pollution Prevention Recurring Costs is the result of the Army National Guard completing its Pollution Prevention Plan Updates by 2003.
Exhibit PB-28 Funds Budgeted for Evironmental Quality February 2003 Mr. Raul Grumberg (703) 695-0089 152

DEPARTMENT OF THE ARMY FY2004/2005 BIENNIAL BUDGET ESTIMATES
SUMMARY OF FUNDS BUDGETED FOR ENVIRONMENTAL PROJECTS ($ in Thousands)
Exhibit PB-28 Funds Budgeted for Evironmental Quality February 2003 Mr. Raul Grumberg (703) 695-0089 153
Environmental Quality: Appropriation: OPA Change FY03/FY04: The decrease in Compliance Non Recurring Other is due to the completion of the upgrade of computer hardware to support Army Environmental Reporting systems. The increase in Pollution Prevention Recurring costs starting in FY04 reflects the standardized fielding of hardware for the Hazardous Materials Management Program (HMMP).

DEPARTMENT OF THE ARMY FY2004/2005 BIENNIAL BUDGET ESTIMATES
FUNDS BUDGETED FOR ENVIRONMENTAL QUALITY ($ in Millions)
Change ChangeFY 2002 FY 2003 FY 2004 FY 2005 FY 2003/FY 2004 FY 2004/FY 2005
DWCFActiveDomesticComplianceRecurring-Class 0Manpower 9.922 10.656 10.476 10.708 (0.180) 0.232Education & Training 0.424 0.451 0.342 0.465 (0.109) 0.123
10.346 11.107 10.818 11.173 (0.289) 0.355
Permits & Fees 1.464 1.572 1.548 1.584 (0.024) 0.036Sampling, Analysis & Monitoring 1.483 1.592 1.569 1.604 (0.023) 0.035Waste Disposal 5.057 5.431 5.351 5.469 (0.080) 0.118Other Recurring Costs 2.183 2.344 2.309 2.471 (0.035) 0.162Total 20.533 22.046 21.595 22.301 (0.451) 0.706
Non Recurring-Class I/IIRCRA C-Hazardous Waste 1.335 1.433 1.412 1.443 (0.021) 0.031RCRA D-Solid Waste 0.000 0.000 0.000 0.000 0.000 0.000RCRA I-Underground Storage Tanks 0.432 0.464 0.457 0.467 (0.007) 0.010Clean Air Act 0.805 0.864 0.852 0.870 (0.012) 0.018Clean Water Act 1.245 1.337 1.317 1.347 (0.020) 0.030Planning 0.026 0.028 0.028 0.028 0.000 0.000Other Non-Recurring 0.102 0.110 0.108 0.000 (0.002) (0.108)Total 3.945 4.236 4.174 4.155 (0.062) (0.019)
Total Compliance 24.478 26.282 25.769 26.456 (0.513) 0.687
Pollution PreventionRecurring-Class 0Other Recurring Costs 1.281 1.481 1.541 1.588 0.060 0.047Total 1.281 1.481 1.541 1.588 0.060 0.047
154
Exhibit PB-28 Funds Budgeted for Evironmental QualityFebruary 2003
Mr. Raul Grumberg (703) 695-0089
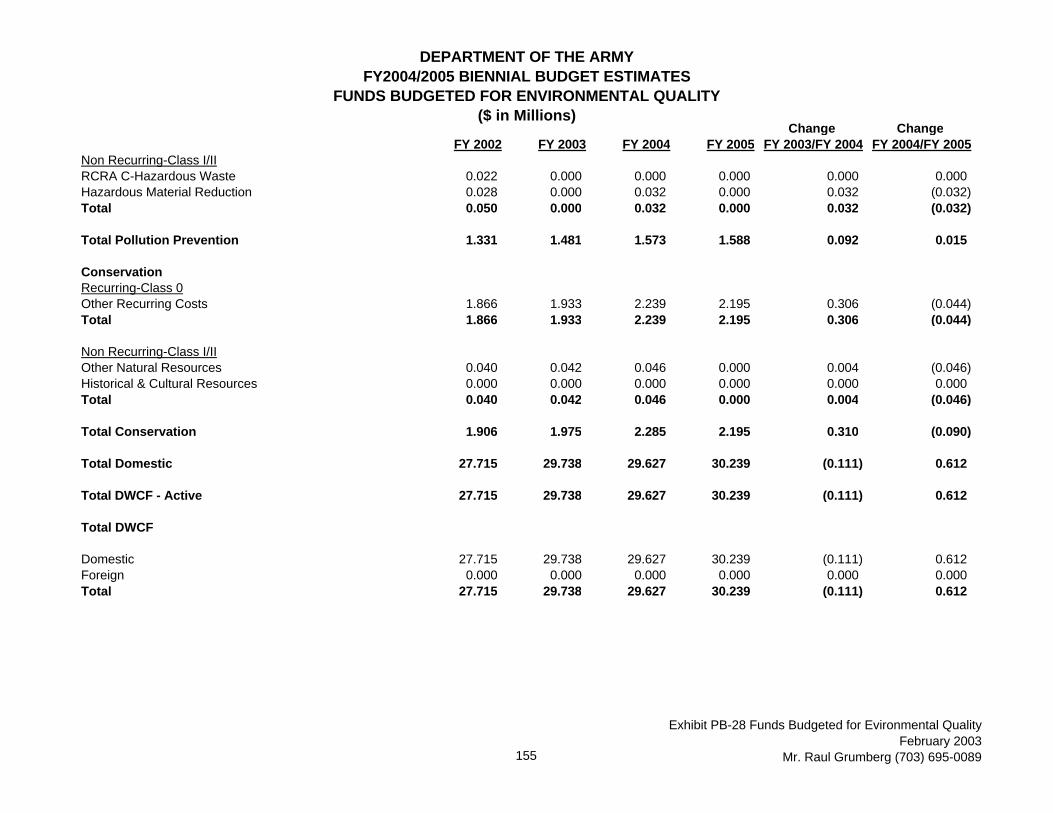
DEPARTMENT OF THE ARMY FY2004/2005 BIENNIAL BUDGET ESTIMATES
FUNDS BUDGETED FOR ENVIRONMENTAL QUALITY ($ in Millions)
Change ChangeFY 2002 FY 2003 FY 2004 FY 2005 FY 2003/FY 2004 FY 2004/FY 2005
Non Recurring-Class I/IIRCRA C-Hazardous Waste 0.022 0.000 0.000 0.000 0.000 0.000Hazardous Material Reduction 0.028 0.000 0.032 0.000 0.032 (0.032)Total 0.050 0.000 0.032 0.000 0.032 (0.032)
Total Pollution Prevention 1.331 1.481 1.573 1.588 0.092 0.015
ConservationRecurring-Class 0Other Recurring Costs 1.866 1.933 2.239 2.195 0.306 (0.044)Total 1.866 1.933 2.239 2.195 0.306 (0.044)
Non Recurring-Class I/IIOther Natural Resources 0.040 0.042 0.046 0.000 0.004 (0.046)Historical & Cultural Resources 0.000 0.000 0.000 0.000 0.000 0.000Total 0.040 0.042 0.046 0.000 0.004 (0.046)
Total Conservation 1.906 1.975 2.285 2.195 0.310 (0.090)
Total Domestic 27.715 29.738 29.627 30.239 (0.111) 0.612
Total DWCF - Active 27.715 29.738 29.627 30.239 (0.111) 0.612
Total DWCF
Domestic 27.715 29.738 29.627 30.239 (0.111) 0.612Foreign 0.000 0.000 0.000 0.000 0.000 0.000Total 27.715 29.738 29.627 30.239 (0.111) 0.612
155
Exhibit PB-28 Funds Budgeted for Evironmental QualityFebruary 2003
Mr. Raul Grumberg (703) 695-0089
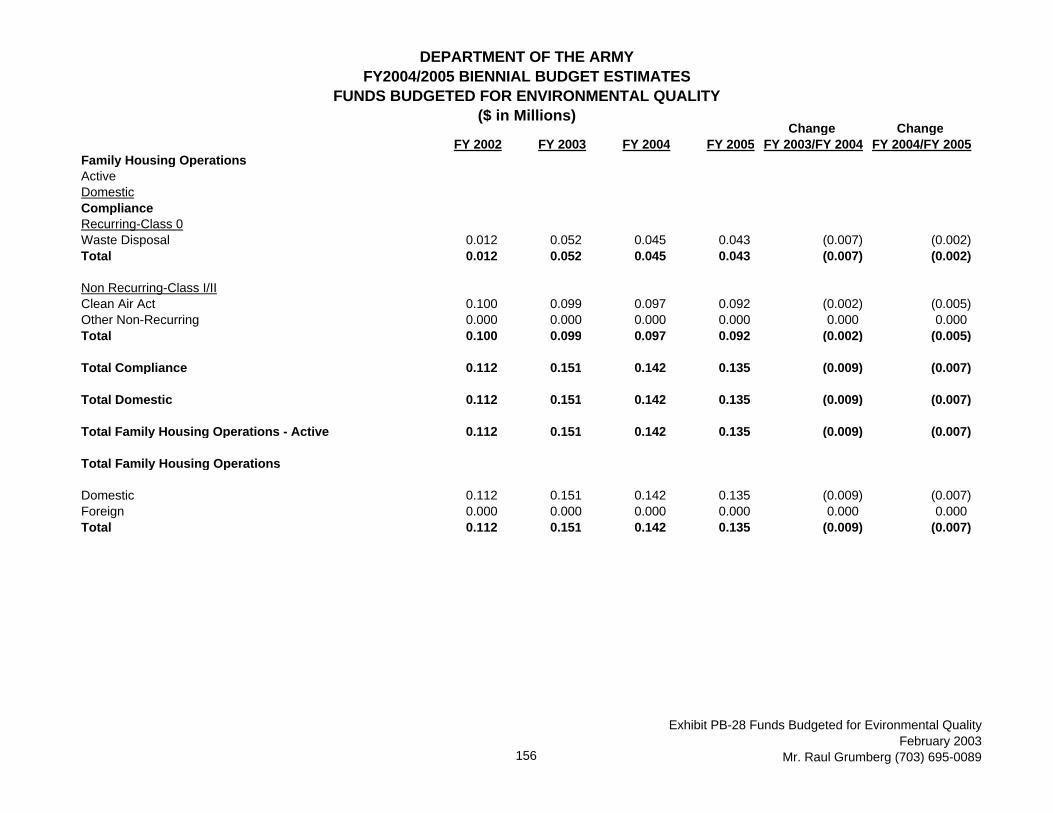
DEPARTMENT OF THE ARMY FY2004/2005 BIENNIAL BUDGET ESTIMATES
FUNDS BUDGETED FOR ENVIRONMENTAL QUALITY ($ in Millions)
Change ChangeFY 2002 FY 2003 FY 2004 FY 2005 FY 2003/FY 2004 FY 2004/FY 2005
Family Housing OperationsActiveDomesticComplianceRecurring-Class 0Waste Disposal 0.012 0.052 0.045 0.043 (0.007) (0.002)Total 0.012 0.052 0.045 0.043 (0.007) (0.002)
Non Recurring-Class I/IIClean Air Act 0.100 0.099 0.097 0.092 (0.002) (0.005)Other Non-Recurring 0.000 0.000 0.000 0.000 0.000 0.000Total 0.100 0.099 0.097 0.092 (0.002) (0.005)
Total Compliance 0.112 0.151 0.142 0.135 (0.009) (0.007)
Total Domestic 0.112 0.151 0.142 0.135 (0.009) (0.007)
Total Family Housing Operations - Active 0.112 0.151 0.142 0.135 (0.009) (0.007)
Total Family Housing Operations
Domestic 0.112 0.151 0.142 0.135 (0.009) (0.007)Foreign 0.000 0.000 0.000 0.000 0.000 0.000Total 0.112 0.151 0.142 0.135 (0.009) (0.007)
156
Exhibit PB-28 Funds Budgeted for Evironmental QualityFebruary 2003
Mr. Raul Grumberg (703) 695-0089
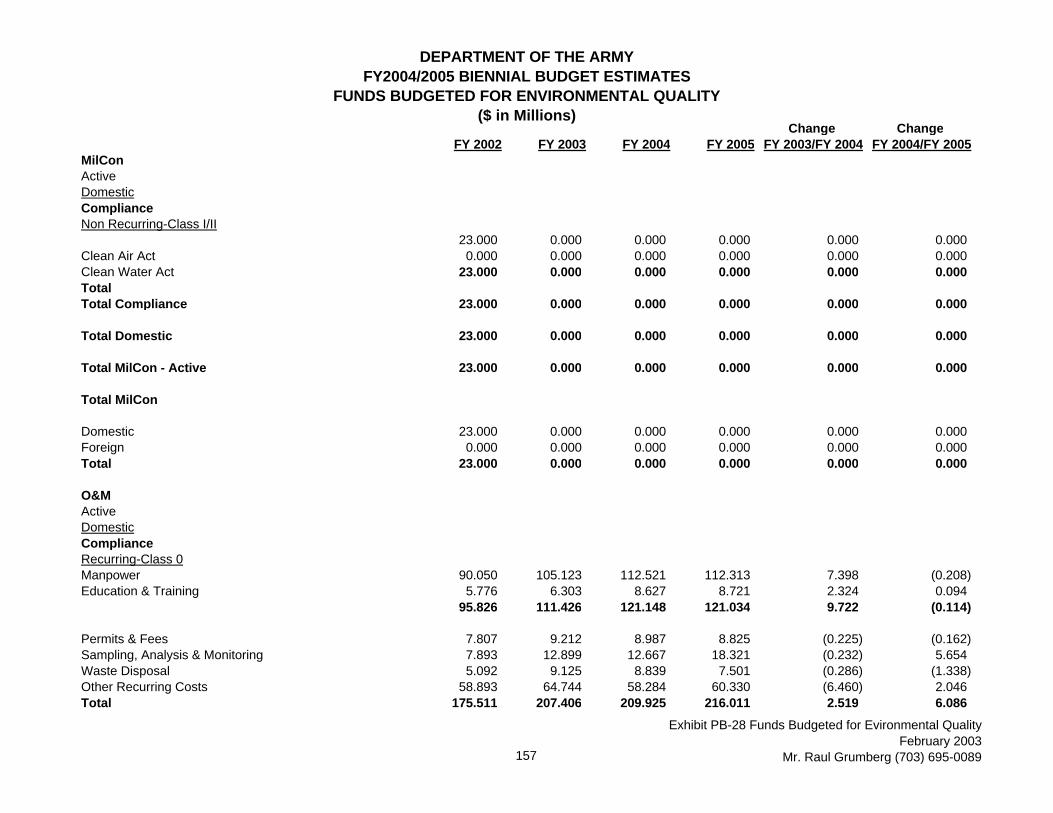
DEPARTMENT OF THE ARMY FY2004/2005 BIENNIAL BUDGET ESTIMATES
FUNDS BUDGETED FOR ENVIRONMENTAL QUALITY ($ in Millions)
Change ChangeFY 2002 FY 2003 FY 2004 FY 2005 FY 2003/FY 2004 FY 2004/FY 2005
MilConActiveDomesticComplianceNon Recurring-Class I/II
23.000 0.000 0.000 0.000 0.000 0.000Clean Air Act 0.000 0.000 0.000 0.000 0.000 0.000Clean Water Act 23.000 0.000 0.000 0.000 0.000 0.000Total Total Compliance 23.000 0.000 0.000 0.000 0.000 0.000
Total Domestic 23.000 0.000 0.000 0.000 0.000 0.000
Total MilCon - Active 23.000 0.000 0.000 0.000 0.000 0.000
Total MilCon
Domestic 23.000 0.000 0.000 0.000 0.000 0.000Foreign 0.000 0.000 0.000 0.000 0.000 0.000Total 23.000 0.000 0.000 0.000 0.000 0.000
O&MActiveDomesticComplianceRecurring-Class 0Manpower 90.050 105.123 112.521 112.313 7.398 (0.208)Education & Training 5.776 6.303 8.627 8.721 2.324 0.094
95.826 111.426 121.148 121.034 9.722 (0.114)
Permits & Fees 7.807 9.212 8.987 8.825 (0.225) (0.162)Sampling, Analysis & Monitoring 7.893 12.899 12.667 18.321 (0.232) 5.654Waste Disposal 5.092 9.125 8.839 7.501 (0.286) (1.338)Other Recurring Costs 58.893 64.744 58.284 60.330 (6.460) 2.046Total 175.511 207.406 209.925 216.011 2.519 6.086
157
Exhibit PB-28 Funds Budgeted for Evironmental QualityFebruary 2003
Mr. Raul Grumberg (703) 695-0089

DEPARTMENT OF THE ARMY FY2004/2005 BIENNIAL BUDGET ESTIMATES
FUNDS BUDGETED FOR ENVIRONMENTAL QUALITY ($ in Millions)
Change ChangeFY 2002 FY 2003 FY 2004 FY 2005 FY 2003/FY 2004 FY 2004/FY 2005
Non Recurring-Class I/IIRCRA C-Hazardous Waste 25.161 33.938 33.666 33.778 (0.272) 0.112RCRA D-Solid Waste 16.125 10.641 10.617 9.918 (0.024) (0.699)RCRA I-Underground Storage Tanks 5.774 11.204 5.195 5.580 (6.009) 0.385Clean Air Act 19.201 13.337 8.349 8.390 (4.988) 0.041Clean Water Act 34.724 27.718 17.451 17.629 (10.267) 0.178Planning 3.820 5.489 5.394 4.046 (0.095) (1.348)SDWA 10.816 9.637 5.288 4.561 (4.349) (0.727)Other Non-Recurring 7.129 13.363 7.086 7.135 (6.277) 0.049Total 122.750 125.327 93.046 91.037 (32.281) (2.009)
Total Compliance 298.261 332.733 302.971 307.048 (29.762) 4.077
Pollution PreventionRecurring-Class 0Other Recurring Costs 12.891 13.248 13.493 13.769 0.245 0.276Total 12.891 13.248 13.493 13.769 0.245 0.276
Non Recurring-Class I/IIRCRA C-Hazardous Waste 2.148 2.337 2.358 2.407 0.021 0.049RCRA D-Solid Waste 0.155 0.546 0.527 0.355 (0.019) (0.172)Clean Air Act 0.134 0.155 0.148 0.115 (0.007) (0.033)Clean Water Act 0.390 0.372 0.420 0.390 0.048 (0.030)Hazardous Material Reduction 8.842 9.175 12.584 12.949 3.409 0.365Other Non-Recurring 14.015 2.424 2.347 1.746 (0.077) (0.601)Total 25.684 15.009 18.384 17.962 3.375 (0.422)
Total Pollution Prevention 38.575 28.257 31.877 31.731 3.620 (0.146)
ConservationRecurring-Class 0Other Recurring Costs 20.983 29.643 30.898 30.217 1.255 (0.681)Total 20.983 29.643 30.898 30.217 1.255 (0.681)
158
Exhibit PB-28 Funds Budgeted for Evironmental QualityFebruary 2003
Mr. Raul Grumberg (703) 695-0089
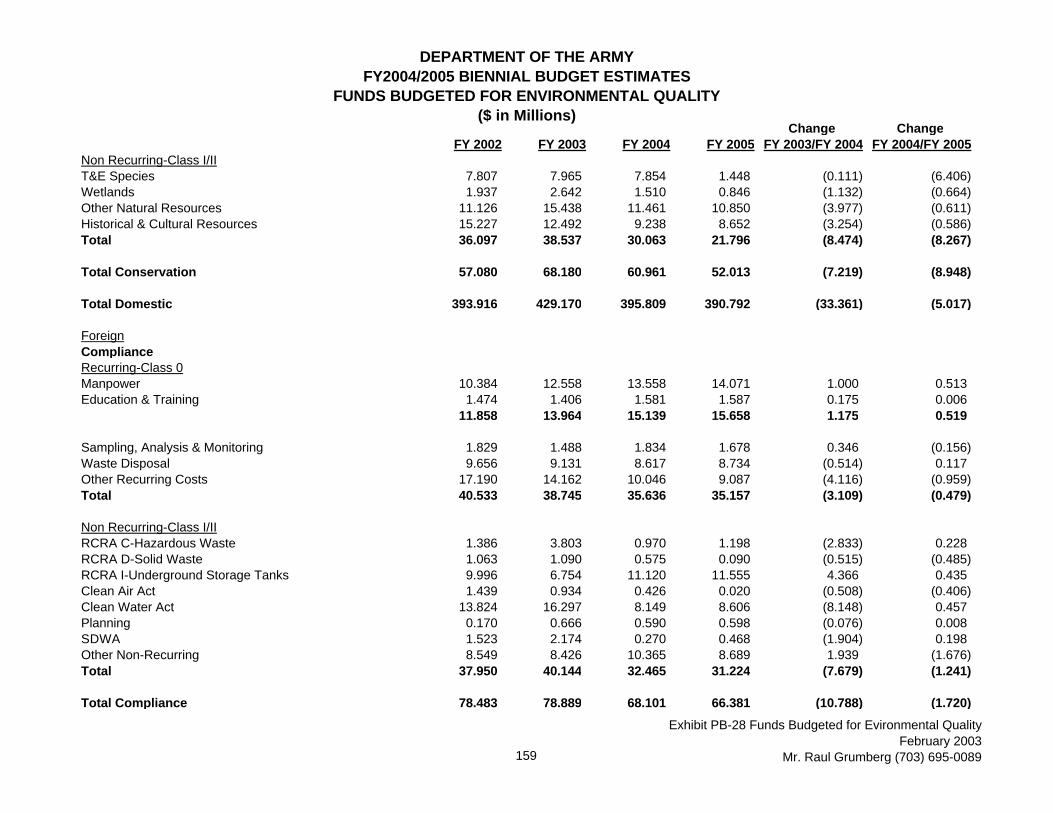
DEPARTMENT OF THE ARMY FY2004/2005 BIENNIAL BUDGET ESTIMATES
FUNDS BUDGETED FOR ENVIRONMENTAL QUALITY ($ in Millions)
Change ChangeFY 2002 FY 2003 FY 2004 FY 2005 FY 2003/FY 2004 FY 2004/FY 2005
Non Recurring-Class I/IIT&E Species 7.807 7.965 7.854 1.448 (0.111) (6.406)Wetlands 1.937 2.642 1.510 0.846 (1.132) (0.664)Other Natural Resources 11.126 15.438 11.461 10.850 (3.977) (0.611)Historical & Cultural Resources 15.227 12.492 9.238 8.652 (3.254) (0.586)Total 36.097 38.537 30.063 21.796 (8.474) (8.267)
Total Conservation 57.080 68.180 60.961 52.013 (7.219) (8.948)
Total Domestic 393.916 429.170 395.809 390.792 (33.361) (5.017)
ForeignComplianceRecurring-Class 0Manpower 10.384 12.558 13.558 14.071 1.000 0.513Education & Training 1.474 1.406 1.581 1.587 0.175 0.006
11.858 13.964 15.139 15.658 1.175 0.519
Sampling, Analysis & Monitoring 1.829 1.488 1.834 1.678 0.346 (0.156)Waste Disposal 9.656 9.131 8.617 8.734 (0.514) 0.117Other Recurring Costs 17.190 14.162 10.046 9.087 (4.116) (0.959)Total 40.533 38.745 35.636 35.157 (3.109) (0.479)
Non Recurring-Class I/IIRCRA C-Hazardous Waste 1.386 3.803 0.970 1.198 (2.833) 0.228RCRA D-Solid Waste 1.063 1.090 0.575 0.090 (0.515) (0.485)RCRA I-Underground Storage Tanks 9.996 6.754 11.120 11.555 4.366 0.435Clean Air Act 1.439 0.934 0.426 0.020 (0.508) (0.406)Clean Water Act 13.824 16.297 8.149 8.606 (8.148) 0.457Planning 0.170 0.666 0.590 0.598 (0.076) 0.008SDWA 1.523 2.174 0.270 0.468 (1.904) 0.198Other Non-Recurring 8.549 8.426 10.365 8.689 1.939 (1.676)Total 37.950 40.144 32.465 31.224 (7.679) (1.241)
Total Compliance 78.483 78.889 68.101 66.381 (10.788) (1.720)
159
Exhibit PB-28 Funds Budgeted for Evironmental QualityFebruary 2003
Mr. Raul Grumberg (703) 695-0089

DEPARTMENT OF THE ARMY FY2004/2005 BIENNIAL BUDGET ESTIMATES
FUNDS BUDGETED FOR ENVIRONMENTAL QUALITY ($ in Millions)
Change ChangeFY 2002 FY 2003 FY 2004 FY 2005 FY 2003/FY 2004 FY 2004/FY 2005
Pollution PreventionRecurring-Class 0Other Recurring Costs 0.429 0.257 0.220 0.220 (0.037) 0.000Total 0.429 0.257 0.220 0.220 (0.037) 0.000
Non Recurring-Class I/IIRCRA C-Hazardous Waste 0.000 0.345 0.015 0.000 (0.330) (0.015)RCRA D-Solid Waste 0.114 0.044 0.050 0.052 0.006 0.002Hazardous Material Reduction 0.000 0.000 0.000 0.000 0.000 0.000Total 0.114 0.389 0.065 0.052 (0.324) (0.013)
Total Pollution Prevention 0.543 0.646 0.285 0.272 (0.361) (0.013)
ConservationRecurring-Class 0Other Recurring Costs 0.227 0.230 0.261 0.231 0.031 (0.030)Total 0.227 0.230 0.261 0.231 0.031 (0.030)
Non Recurring-Class I/IIT&E Species 0.065 0.055 0.050 0.050 (0.005) 0.000Wetlands 0.141 0.000 0.080 0.000 0.080 (0.080)Other Natural Resources 0.450 0.625 0.525 0.568 (0.100) 0.043Historical & Cultural Resources 0.132 0.353 0.300 0.356 (0.053) 0.056Total 0.788 1.033 0.955 0.974 (0.078) 0.019
Total Conservation 1.015 1.263 1.216 1.205 (0.047) (0.011)
Total Foreign 80.041 80.798 69.602 67.858 (11.196) (1.744)
Total O&M - Active 473.957 509.968 465.411 458.650 (44.557) (6.761)
160
Exhibit PB-28 Funds Budgeted for Evironmental QualityFebruary 2003
Mr. Raul Grumberg (703) 695-0089

DEPARTMENT OF THE ARMY FY2004/2005 BIENNIAL BUDGET ESTIMATES
FUNDS BUDGETED FOR ENVIRONMENTAL QUALITY ($ in Millions)
Change ChangeFY 2002 FY 2003 FY 2004 FY 2005 FY 2003/FY 2004 FY 2004/FY 2005
GuardDomesticComplianceRecurring-Class 0Manpower 24.759 28.260 29.587 30.488 1.327 0.901Education & Training 3.736 3.987 3.074 4.394 (0.913) 1.320
28.495 32.247 32.661 34.882 0.414 2.221
Permits & Fees 0.493 1.027 1.027 1.300 0.000 0.273Sampling, Analysis & Monitoring 2.882 3.324 2.866 3.150 (0.458) 0.284Waste Disposal 4.380 4.389 4.247 4.580 (0.142) 0.333Other Recurring Costs 7.739 10.487 6.187 6.576 (4.300) 0.389Total 43.989 51.474 46.988 50.488 (4.486) 3.500
Non Recurring-Class I/IIRCRA C-Hazardous Waste 0.938 3.480 2.402 4.290 (1.078) 1.888RCRA D-Solid Waste 0.274 0.535 0.537 0.610 0.002 0.073RCRA I-Underground Storage Tanks 1.174 1.418 0.906 1.859 (0.512) 0.953Clean Air Act 1.003 0.886 0.428 1.122 (0.458) 0.694Clean Water Act 15.379 15.351 6.029 15.458 (9.322) 9.429Planning 3.961 4.255 2.851 4.949 (1.404) 2.098SDWA 48.548 70.032 52.576 57.405 (17.456) 4.829Other Non-Recurring 0.196 3.078 21.654 13.183 18.576 (8.471)Total 71.473 99.035 87.383 98.876 (11.652) 11.493
Total Compliance 115.462 150.509 134.371 149.364 (16.138) 14.993
Pollution PreventionRecurring-Class 0Other Recurring Costs 0.765 2.000 0.922 1.025 (1.078) 0.103Total 0.765 2.000 0.922 1.025 (1.078) 0.103
161
Exhibit PB-28 Funds Budgeted for Evironmental QualityFebruary 2003
Mr. Raul Grumberg (703) 695-0089

DEPARTMENT OF THE ARMY FY2004/2005 BIENNIAL BUDGET ESTIMATES
FUNDS BUDGETED FOR ENVIRONMENTAL QUALITY ($ in Millions)
Change ChangeFY 2002 FY 2003 FY 2004 FY 2005 FY 2003/FY 2004 FY 2004/FY 2005
Non Recurring-Class I/IIRCRA C-Hazardous Waste 0.474 0.330 0.149 0.138 (0.181) (0.011)RCRA D-Solid Waste 0.135 0.053 0.054 0.023 0.001 (0.031)Clean Air Act 0.043 0.099 0.099 0.101 0.000 0.002Clean Water Act 0.026 0.041 0.036 0.044 (0.005) 0.008Hazardous Material Reduction 0.031 0.031 0.022 0.060 (0.009) 0.038Other Non-Recurring 1.282 1.123 0.425 0.901 (0.698) 0.476Total 1.991 1.677 0.785 1.267 (0.892) 0.482
Total Pollution Prevention 2.756 3.677 1.707 2.292 (1.970) 0.585
ConservationRecurring-Class 0Other Recurring Costs 0.740 0.882 0.980 0.930 0.098 (0.050)Total 0.740 0.882 0.980 0.930 0.098 (0.050)
Non Recurring-Class I/IIT&E Species 0.485 2.324 1.152 1.240 (1.172) 0.088Wetlands 1.805 3.220 2.432 2.523 (0.788) 0.091Other Natural Resources 16.711 11.450 4.561 8.326 (6.889) 3.765Historical & Cultural Resources 4.125 5.429 3.430 5.465 (1.999) 2.035Total 23.126 22.423 11.575 17.554 (10.848) 5.979
Total Conservation 23.866 23.305 12.555 18.484 (10.750) 5.929
Total Domestic 142.084 177.491 148.633 170.140 (28.858) 21.507
Total O&M - Guard 142.084 177.491 148.633 170.140 (28.858) 21.507
162
Exhibit PB-28 Funds Budgeted for Evironmental QualityFebruary 2003
Mr. Raul Grumberg (703) 695-0089
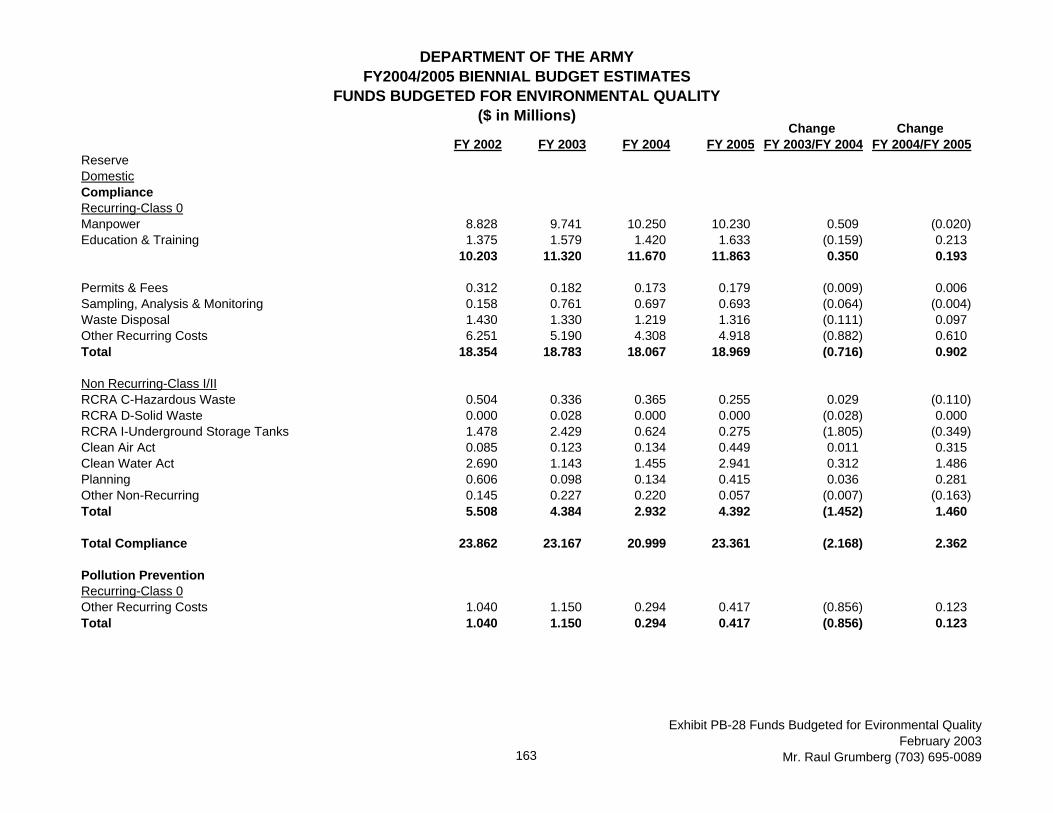
DEPARTMENT OF THE ARMY FY2004/2005 BIENNIAL BUDGET ESTIMATES
FUNDS BUDGETED FOR ENVIRONMENTAL QUALITY ($ in Millions)
Change ChangeFY 2002 FY 2003 FY 2004 FY 2005 FY 2003/FY 2004 FY 2004/FY 2005
ReserveDomesticComplianceRecurring-Class 0Manpower 8.828 9.741 10.250 10.230 0.509 (0.020)Education & Training 1.375 1.579 1.420 1.633 (0.159) 0.213
10.203 11.320 11.670 11.863 0.350 0.193
Permits & Fees 0.312 0.182 0.173 0.179 (0.009) 0.006Sampling, Analysis & Monitoring 0.158 0.761 0.697 0.693 (0.064) (0.004)Waste Disposal 1.430 1.330 1.219 1.316 (0.111) 0.097Other Recurring Costs 6.251 5.190 4.308 4.918 (0.882) 0.610Total 18.354 18.783 18.067 18.969 (0.716) 0.902
Non Recurring-Class I/IIRCRA C-Hazardous Waste 0.504 0.336 0.365 0.255 0.029 (0.110)RCRA D-Solid Waste 0.000 0.028 0.000 0.000 (0.028) 0.000RCRA I-Underground Storage Tanks 1.478 2.429 0.624 0.275 (1.805) (0.349)Clean Air Act 0.085 0.123 0.134 0.449 0.011 0.315Clean Water Act 2.690 1.143 1.455 2.941 0.312 1.486Planning 0.606 0.098 0.134 0.415 0.036 0.281Other Non-Recurring 0.145 0.227 0.220 0.057 (0.007) (0.163)Total 5.508 4.384 2.932 4.392 (1.452) 1.460
Total Compliance 23.862 23.167 20.999 23.361 (2.168) 2.362
Pollution PreventionRecurring-Class 0Other Recurring Costs 1.040 1.150 0.294 0.417 (0.856) 0.123Total 1.040 1.150 0.294 0.417 (0.856) 0.123
163
Exhibit PB-28 Funds Budgeted for Evironmental QualityFebruary 2003
Mr. Raul Grumberg (703) 695-0089
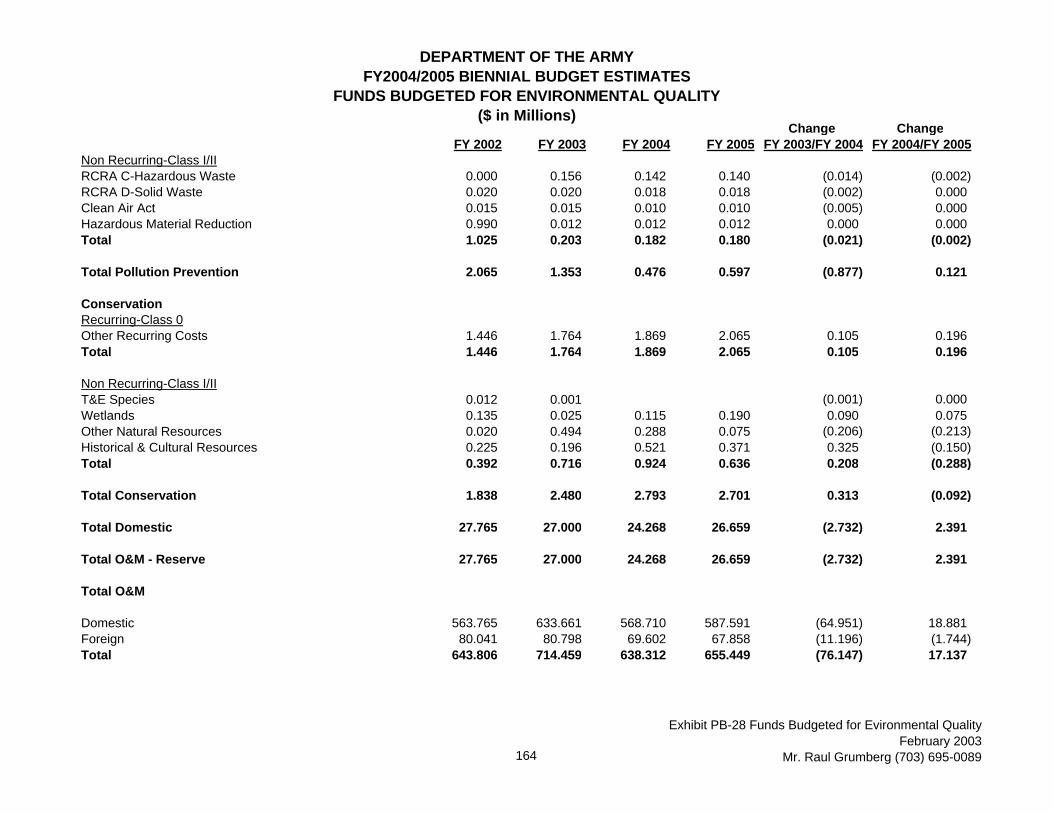
DEPARTMENT OF THE ARMY FY2004/2005 BIENNIAL BUDGET ESTIMATES
FUNDS BUDGETED FOR ENVIRONMENTAL QUALITY ($ in Millions)
Change ChangeFY 2002 FY 2003 FY 2004 FY 2005 FY 2003/FY 2004 FY 2004/FY 2005
Non Recurring-Class I/IIRCRA C-Hazardous Waste 0.000 0.156 0.142 0.140 (0.014) (0.002)RCRA D-Solid Waste 0.020 0.020 0.018 0.018 (0.002) 0.000Clean Air Act 0.015 0.015 0.010 0.010 (0.005) 0.000Hazardous Material Reduction 0.990 0.012 0.012 0.012 0.000 0.000Total 1.025 0.203 0.182 0.180 (0.021) (0.002)
Total Pollution Prevention 2.065 1.353 0.476 0.597 (0.877) 0.121
ConservationRecurring-Class 0Other Recurring Costs 1.446 1.764 1.869 2.065 0.105 0.196Total 1.446 1.764 1.869 2.065 0.105 0.196
Non Recurring-Class I/IIT&E Species 0.012 0.001 (0.001) 0.000Wetlands 0.135 0.025 0.115 0.190 0.090 0.075Other Natural Resources 0.020 0.494 0.288 0.075 (0.206) (0.213)Historical & Cultural Resources 0.225 0.196 0.521 0.371 0.325 (0.150)Total 0.392 0.716 0.924 0.636 0.208 (0.288)
Total Conservation 1.838 2.480 2.793 2.701 0.313 (0.092)
Total Domestic 27.765 27.000 24.268 26.659 (2.732) 2.391
Total O&M - Reserve 27.765 27.000 24.268 26.659 (2.732) 2.391
Total O&M
Domestic 563.765 633.661 568.710 587.591 (64.951) 18.881Foreign 80.041 80.798 69.602 67.858 (11.196) (1.744)Total 643.806 714.459 638.312 655.449 (76.147) 17.137
164
Exhibit PB-28 Funds Budgeted for Evironmental QualityFebruary 2003
Mr. Raul Grumberg (703) 695-0089
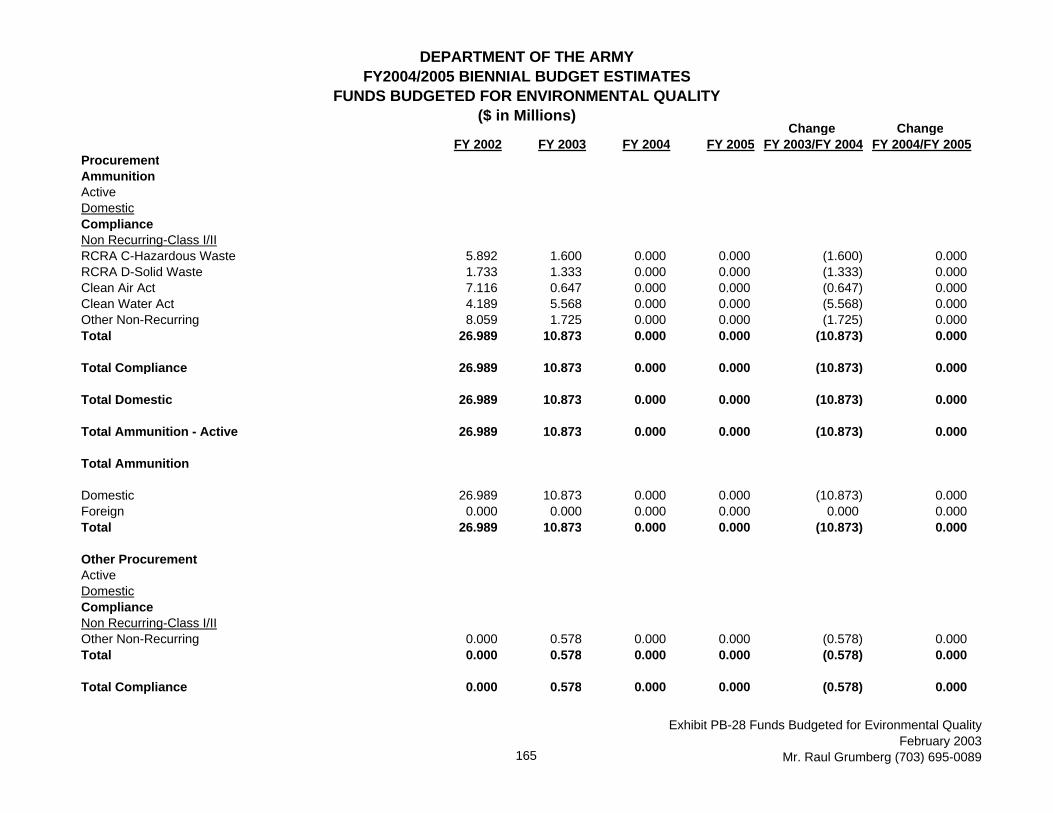
DEPARTMENT OF THE ARMY FY2004/2005 BIENNIAL BUDGET ESTIMATES
FUNDS BUDGETED FOR ENVIRONMENTAL QUALITY ($ in Millions)
Change ChangeFY 2002 FY 2003 FY 2004 FY 2005 FY 2003/FY 2004 FY 2004/FY 2005
ProcurementAmmunitionActiveDomesticComplianceNon Recurring-Class I/IIRCRA C-Hazardous Waste 5.892 1.600 0.000 0.000 (1.600) 0.000RCRA D-Solid Waste 1.733 1.333 0.000 0.000 (1.333) 0.000Clean Air Act 7.116 0.647 0.000 0.000 (0.647) 0.000Clean Water Act 4.189 5.568 0.000 0.000 (5.568) 0.000Other Non-Recurring 8.059 1.725 0.000 0.000 (1.725) 0.000Total 26.989 10.873 0.000 0.000 (10.873) 0.000
Total Compliance 26.989 10.873 0.000 0.000 (10.873) 0.000
Total Domestic 26.989 10.873 0.000 0.000 (10.873) 0.000
Total Ammunition - Active 26.989 10.873 0.000 0.000 (10.873) 0.000
Total Ammunition
Domestic 26.989 10.873 0.000 0.000 (10.873) 0.000Foreign 0.000 0.000 0.000 0.000 0.000 0.000Total 26.989 10.873 0.000 0.000 (10.873) 0.000
Other ProcurementActiveDomesticComplianceNon Recurring-Class I/IIOther Non-Recurring 0.000 0.578 0.000 0.000 (0.578) 0.000Total 0.000 0.578 0.000 0.000 (0.578) 0.000
Total Compliance 0.000 0.578 0.000 0.000 (0.578) 0.000
165
Exhibit PB-28 Funds Budgeted for Evironmental QualityFebruary 2003
Mr. Raul Grumberg (703) 695-0089

DEPARTMENT OF THE ARMY FY2004/2005 BIENNIAL BUDGET ESTIMATES
FUNDS BUDGETED FOR ENVIRONMENTAL QUALITY ($ in Millions)
Change ChangeFY 2002 FY 2003 FY 2004 FY 2005 FY 2003/FY 2004 FY 2004/FY 2005
Pollution PreventionRecurring-Class 0Other Recurring Costs 0.000 0.000 0.631 0.629 0.631 (0.002)Total 0.000 0.000 0.631 0.629 0.631 (0.002)
Total Pollution Prevention 0.000 0.000 0.631 0.629 0.631 (0.002)
Total Domestic 0.000 0.578 0.631 0.629 0.053 (0.002)
Total Other Procurement - Active 0.000 0.578 0.631 0.629 0.053 (0.002)
Total Other Procurement
Domestic 0.000 0.578 0.631 0.629 0.053 (0.002)Foreign 0.000 0.000 0.000 0.000 0.000 0.000Total 0.000 0.578 0.631 0.629 0.053 (0.002)
Total DoDARMYDWCF
Domestic 27.715 29.738 29.627 30.239 (0.111) 0.612Foreign 0.000 0.000 0.000 0.000 0.000 0.000Total 27.715 29.738 29.627 30.239 (0.111) 0.612
Family Housing Operations
Domestic 0.112 0.151 0.142 0.135 (0.009) (0.007)Foreign 0.000 0.000 0.000 0.000 0.000 0.000Total 0.112 0.151 0.142 0.135 (0.009) (0.007)
166
Exhibit PB-28 Funds Budgeted for Evironmental QualityFebruary 2003
Mr. Raul Grumberg (703) 695-0089

DEPARTMENT OF THE ARMY FY2004/2005 BIENNIAL BUDGET ESTIMATES
FUNDS BUDGETED FOR ENVIRONMENTAL QUALITY ($ in Millions)
Change ChangeFY 2002 FY 2003 FY 2004 FY 2005 FY 2003/FY 2004 FY 2004/FY 2005
MilCon
Domestic 23.000 0.000 0.000 0.000 0.000 0.000Foreign 0.000 0.000 0.000 0.000 0.000 0.000Total 23.000 0.000 0.000 0.000 0.000 0.000
O&M
Domestic 563.765 633.661 568.710 587.591 (64.951) 18.881Foreign 80.041 80.798 69.602 67.858 (11.196) (1.744)Total 643.806 714.459 638.312 655.449 (76.147) 17.137
Procurement
Ammunition
Domestic 26.989 10.873 0.000 0.000 (10.873) 0.000Foreign 0.000 0.000 0.000 0.000 0.000 0.000Total 26.989 10.873 0.000 0.000 (10.873) 0.000
Other Procurement
Domestic 0.000 0.578 0.631 0.629 0.053 (0.002)Foreign 0.000 0.000 0.000 0.000 0.000 0.000Total 0.000 0.578 0.631 0.629 0.053 (0.002)
Total Procurement
Domestic 26.989 11.451 0.631 0.629 (10.820) (0.002)Foreign 0.000 0.000 0.000 0.000 0.000 0.000Total 26.989 11.451 0.631 0.629 (10.820) (0.002)
167
Exhibit PB-28 Funds Budgeted for Evironmental QualityFebruary 2003
Mr. Raul Grumberg (703) 695-0089

DEPARTMENT OF THE ARMY FY2004/2005 BIENNIAL BUDGET ESTIMATES
SUMMARY OF FUNDS BUDGETED FOR ENVIRONMENTAL PROJECTS ($ in Thousands)
Operational Range Sustainment and Environmental Management Appropriation: OMA, OMNG Changes in FY04 and FY05 reflect program-funding decreases. This decrease impacts Range Response actions at Massachusetts Military Reservation only. Explanation of Information: All costs listed in exhibit PB-28B are also included in PB28. The Army has established a new account starting in FY04. Currently, there is no method to track the information listed in this exhibit. However, we are currently working to put in place the mechanisms to track environmental costs on operational ranges. Range Inventory: The operational range inventory is complete. The number of acres with baseline information is estimated for FY04-05. Range Studies: The monitoring is part of the constituent analysis. Range Response Actions: The only Range Response on Operational Ranges is MMR. Currently, the costs cannot be divided into the listed categories. Range Sustainment Actions are not environmental costs and are not reported as such.
Exhibit PB-28B Operational Ranges and Environmental Management February 2003 Mr. Raul Grumberg (703) 695-0089 168
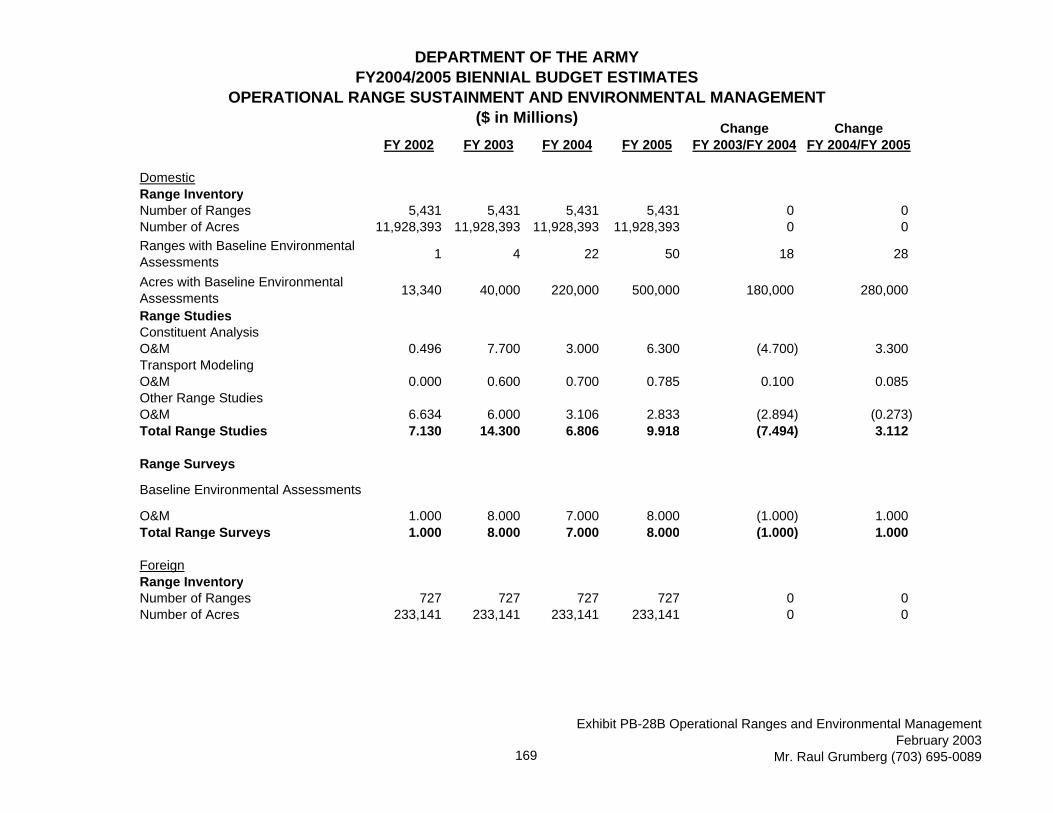
DEPARTMENT OF THE ARMYFY2004/2005 BIENNIAL BUDGET ESTIMATES
OPERATIONAL RANGE SUSTAINMENT AND ENVIRONMENTAL MANAGEMENT($ in Millions)
Change ChangeFY 2002 FY 2003 FY 2004 FY 2005 FY 2003/FY 2004 FY 2004/FY 2005
DomesticRange InventoryNumber of Ranges 5,431 5,431 5,431 5,431 0 0Number of Acres 11,928,393 11,928,393 11,928,393 11,928,393 0 0Ranges with Baseline Environmental Assessments
1 4 22 50 18 28
Acres with Baseline Environmental Assessments
13,340 40,000 220,000 500,000 180,000 280,000
Range StudiesConstituent AnalysisO&M 0.496 7.700 3.000 6.300 (4.700) 3.300Transport ModelingO&M 0.000 0.600 0.700 0.785 0.100 0.085Other Range StudiesO&M 6.634 6.000 3.106 2.833 (2.894) (0.273)Total Range Studies 7.130 14.300 6.806 9.918 (7.494) 3.112
Range Surveys
Baseline Environmental Assessments
O&M 1.000 8.000 7.000 8.000 (1.000) 1.000Total Range Surveys 1.000 8.000 7.000 8.000 (1.000) 1.000
ForeignRange InventoryNumber of Ranges 727 727 727 727 0 0Number of Acres 233,141 233,141 233,141 233,141 0 0
169
Exhibit PB-28B Operational Ranges and Environmental ManagementFebruary 2003
Mr. Raul Grumberg (703) 695-0089

DEPARTMENT OF THE ARMYFY2004/2005 BIENNIAL BUDGET ESTIMATES
OPERATIONAL RANGE SUSTAINMENT AND ENVIRONMENTAL MANAGEMENT($ in Millions)
Change ChangeFY 2002 FY 2003 FY 2004 FY 2005 FY 2003/FY 2004 FY 2004/FY 2005
DomesticRange InventoryNumber of Ranges 3,790 3,790 3,790 3,790 0 0Number of Acres 2,544,003 2,544,003 2,544,003 2,544,003 0 0
Ranges with Baseline Environmental Assessments
0 1 5 7 4 2
Acres with Baseline Environmental Assessments
0 10,000 50,000 70,000 40,000 20,000
Range Response ActionsOther Range Response ActionsO&M 0.000 18.200 28.373 19.611 10.173 (8.762)Response DesignO&M 36.200 35.700 23.373 19.611 (12.327) (3.762)Total Range Response Actions 36.200 53.900 51.746 39.222 (2.154) (12.524)
ForeignRange InventoryNumber of Ranges 0 0 0 0 0 0Number of Acres 0 0 0 0 0 0
DomesticRange InventoryNumber of Ranges 572 572 572 572 0 0Number of Acres 523,186 523,186 523,186 523,186 0 0Ranges with Baseline Environmental Assessments
0 1 2 3 1 1
Acres with Baseline Environmental Assessments
0 10,000 20,000 30,000 10,000 10,000
170
Exhibit PB-28B Operational Ranges and Environmental ManagementFebruary 2003
Mr. Raul Grumberg (703) 695-0089

DEPARTMENT OF THE ARMYFY2004/2005 BIENNIAL BUDGET ESTIMATES
FACILITIES SUSTAINMENT, RESTORATION AND MODERNIZATION (SRM), AND DEMOLITION SUMMARY
FY 2002 FY 2003 FY 2004 FY 2005Estimate Estimate Estimate Estimate
1. Funded Program ($ in Thousands)
a. Program Category (1) Sustainment 1,248,693 1,713,995 1,757,630 1,895,658 (2) Restoration and Modernization Projects 198,015 16,717 21,528 61,194 (3) Demolition 23,487 1,368 36,018 30,125
Total 1,470,195 1,732,080 1,815,176 1,986,977
b. Budget Activity BA 1 911,644 1,089,539 1,094,309 1,217,219 BA 2 13,509 10,450 6,933 3,454 BA 3 (USMA) 48,667 56,397 61,096 65,957 BA 3 (TRADOC) 242,743 338,914 392,550 387,161 BA 4 253,632 236,780 260,288 313,186
Total 1,470,195 1,732,080 1,815,176 1,986,977
c. Staffing (in end strength) Military Personnel 0 0 0 0 Civilian Personnel 0 0 0 0
2. Annual Deferred SustainmentAnnual deferred sustainment is the portion of required facilities sustainment that is not fundedduring the year.
451,009 0 130,785 0
171
Exhibit OP-28 Facilities Sustinment, Restoration and Modernization (SRM), and Demolition Summary February 2003
Ms. Carolyn Banks/(703) 692-9257

DEPARTMENT OF THE ARMYFY2004/2005 BIENNIAL BUDGET ESTIMATES
FACILITIES SUSTAINMENT, RESTORATION AND MODERNIZATION (SRM), AND DEMOLITION SUMMARY
3. Backlog of Restoration & ModernizationThe Installation Status Report (ISR) is used as a tool for estimating costs to improve facilities from current conditions to fully mission ready facilities. The ISR provides condition status ofactivities from good to poor (C-1 to C-4) and includes a parametric estimate of the cost associated with improving facility quality. The current annual cost (in FY04 $s) to improve OMAfacilities to C-2 over a period of 20 years is $263 million. This is based on the 2001 ISR quality cost to C-2 for the Activie Component and excludes already funded barracks and utilitiesplanned for privitization. The FY04 budget funds sustainment at 93% of requirements.
FY 2002 FY 2003 FY 2004 FY 20054 Facility Type ($ in Millions) Estimate Estimate Estimate Estimate
Operations and Training 89 93 96 105Maintenance and Production 231 242 249 274Research, Development, Test and Evaluation 42 44 45 49Supply 274 287 295 325Hospital and Medical 0 0 0 0Administrative 115 121 122 136Family Housing 0 0 0 0Unaccompanied Personnel Housing 169 233 240 264Community 132 138 142 156Utilities and Ground Improvements 395 573 590 648
Demolition 23 1 36 30
Total 1,470 1,732 1,815 1,987
172
Exhibit OP-28 Facilities Sustinment, Restoration and Modernization (SRM), and Demolition Summary February 2003
Ms. Carolyn Banks/(703) 692-9257
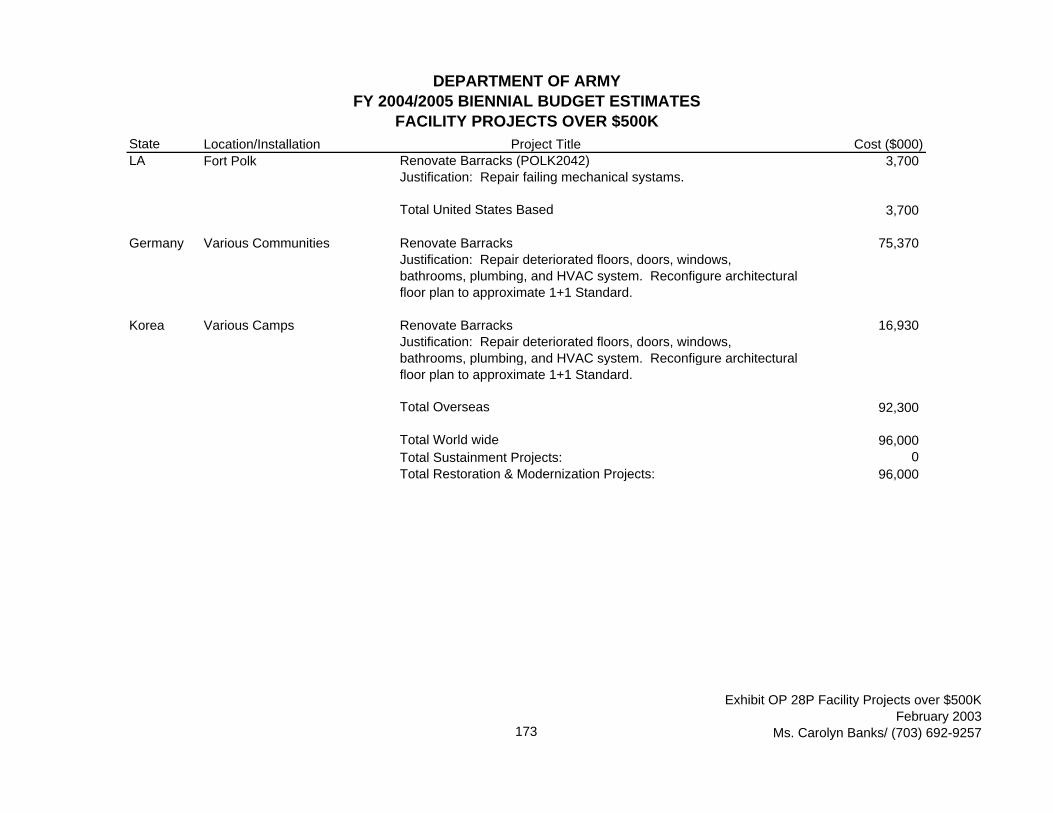
DEPARTMENT OF ARMYFY 2004/2005 BIENNIAL BUDGET ESTIMATES
FACILITY PROJECTS OVER $500KState Location/Installation Project Title Cost ($000)LA Fort Polk Renovate Barracks (POLK2042) 3,700
Justification: Repair failing mechanical systams.
Total United States Based 3,700
Germany Various Communities Renovate Barracks 75,370Justification: Repair deteriorated floors, doors, windows, bathrooms, plumbing, and HVAC system. Reconfigure architectural floor plan to approximate 1+1 Standard.
Korea Various Camps Renovate Barracks 16,930Justification: Repair deteriorated floors, doors, windows, bathrooms, plumbing, and HVAC system. Reconfigure architectural floor plan to approximate 1+1 Standard.
Total Overseas 92,300
Total World wide 96,000Total Sustainment Projects: 0Total Restoration & Modernization Projects: 96,000
173
Exhibit OP 28P Facility Projects over $500KFebruary 2003
Ms. Carolyn Banks/ (703) 692-9257

DEPARTMENT OF THE ARMYFY2004/2005 BIENNIAL BUDGET ESTIMATES
SPARES AND REPAIR PARTS
QTY $ QTY $ QTY $ QTY $ QTY $ QTY $(IN K's) (IN M's) (IN K's) (IN M's) (IN K's) (IN M's) (IN K's) (IN M's) (IN K's) (IN M's) (IN K's) (IN M's)
DEPOT LEVEL REPARABLES (DLR'S)SHIPSAIRFRAMES 61.5 469.1 47.2 451.5 47.9 461.9 45.2 418.3 0.7 10.4 -2.7 -43.6AIRCRAFT ENGINES 5.5 251.6 4.3 219.8 4.2 262.4 4.0 236.3 -0.1 42.6 -0.2 -26.1COMBAT VEHICLES 831.5 511.3 373.9 333.5 371.9 387.5 368.3 339.1 -2.0 54.0 -3.6 -48.3OTHER MISSILES 14.4 65.9 16.5 86.0 14.9 100.8 14.8 88.9 -1.5 14.8 -0.2 -11.9 COMMUNICATIONS EQUIPMENT 60.9 85.4 70.5 120.7 70.4 161.5 70.7 142.6 -0.2 40.8 0.4 -18.8 OTHER MISC. 188.7 146.8 216.6 210.4 214.8 236.8 211.1 208.9 -1.8 26.4 -3.7 -27.9
TOTAL 1162.5 1530.2 729.0 1421.9 724.2 1610.8 714.1 1434.1 -4.8 188.9 -10.0 -176.7
CONSUMABLESSHIPSAIRFRAMES 2652.2 195.5 1925.7 155.7 1664.9 123.4 1791.6 127.0 -260.8 -32.3 126.8 3.6AIRCRAFT ENGINES 47.9 12.2 42.2 13.0 69.0 17.3 74.3 18.9 26.9 4.3 5.3 1.6COMBAT VEHICLES 3852.6 233.0 4422.0 269.1 4255.9 223.3 4256.4 231.7 -166.1 -45.8 0.5 8.5OTHER MISSILES 537.5 73.4 507.6 69.3 530.8 58.0 529.0 60.8 23.2 -11.3 -1.8 2.7 COMMUNICATIONS EQUIPMENT 2225.5 95.1 1820.9 97.4 1937.2 93.0 1927.6 97.5 116.3 -4.3 -9.6 4.4 OTHER MISC. 5587.2 163.5 5300.5 169.8 5170.4 136.4 5157.8 142.7 -130.1 -33.4 -12.6 6.3
TOTAL 14902.9 772.7 14019.1 774.3 13628.3 651.5 13736.7 678.6 -390.7 -122.8 108.6 27.1
Funded Spare and Repair Parts Buys 250.0 * 406.0 **,*** 658.0 *** 100.0 ***
* FY 2002 Congressional add. All funds were used to procure additional Combat Vehicle DLR's.** FY 2003 funding includes $90 million in Operation & Maintenance (O&M) National Guard and $24 million in O&M Reserve.*** Plans are still being finalized on specific spares and consumables to be procured. However, estimate approximately 60 percent of the funds will support Aviation requirements, 20 percent Combat Vehicles and 20 percent all other commodities of equipment.
FY 2002 FY 2003 FY 2004 FY 2005 FY 2003-2004 FY 2004-2005CHANGE CHANGE
Over the past several years, the Army has experienced a spares shorfall due to increased OPTEMPO and contingency demands for spare parts. These have resulted in a decline in spares stock availablity and a corresponding increase in backorders. To help rectify this shortfall, Congress in FY 2002 and the Army in FY 2003 to 2005 have taken aggressive measures to replenish depleted spare and repair parts inventory levels. Amounts below have been funded to help fix this problem. These resources are in addition to amounts shown in the table above.
174
Exhibit OP-31 Spares and Repair PartsFebruary 2003
Mr. Tom Fergason (703) 693-3512

DEPARTMENT OF THE ARMYFY 2004/2005 BIENNAL BUDGET ESTIMATES
REVENUE FROM LEASING OUT OF DEPARTMENT OF DEFENSE ASSETS
FY 2002 FY 2003 FY 2004 FY 2005ALABAMA* LEASE: Multiple Leases $800 $800 $800 $800(A) Explanation of Lease
Multiple Locations/Housing(B) Explanation of Anticipated Expenditures Resulting from Rentals by Fiscal Year
Maintenance and Repair `(C) Actual Use of Revenue Generated from Rentals in Prior Year
Reference Distribution of Revenues(D) Explanation of Amendments Made to Existing Leases
Not Currently Available**
* LEASE: DACA01-1-95-0249 $5,400 $5,400 $5,400 $5,400(A) Explanation of Lease
Redstone Arsenal/Banking(B) Explanation of Anticipated Expenditures Resulting from Rentals by Fiscal Year
Maintenance and Repair(C) Actual Use of Revenue Generated from Rentals in Prior Year
Reference Distribution of Revenues(D) Explanation of Amendments Made to Existing Leases
Not Currently Available**
* LEASE: DACA01-1-78-0013 $3,500 $3,500 $3,500 $3,500(A) Explanation of Lease
Redstone Arsenal/Banking(B) Explanation of Anticipated Expenditures Resulting from Rentals by Fiscal Year
Maintenance and Repair(C) Actual Use of Revenue Generated from Rentals in Prior Year
Reference Distribution of Revenues(D) Explanation of Amendments Made to Existing Leases
Not Currently Available**
175
Exhibit PB-34 Revenue from Leasing Out of DoD AssetsFebruary 2003
Ms. Valerie Turner/(703) 695-7174
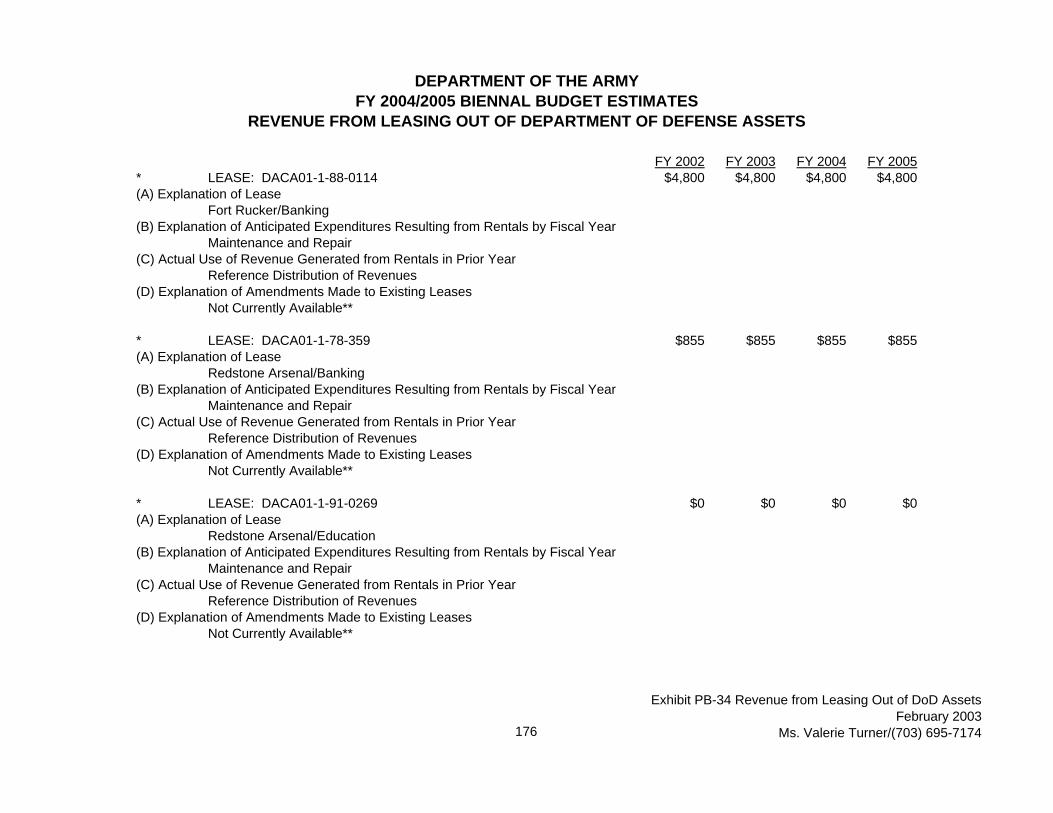
DEPARTMENT OF THE ARMYFY 2004/2005 BIENNAL BUDGET ESTIMATES
REVENUE FROM LEASING OUT OF DEPARTMENT OF DEFENSE ASSETS
FY 2002 FY 2003 FY 2004 FY 2005* LEASE: DACA01-1-88-0114 $4,800 $4,800 $4,800 $4,800(A) Explanation of Lease
Fort Rucker/Banking(B) Explanation of Anticipated Expenditures Resulting from Rentals by Fiscal Year
Maintenance and Repair(C) Actual Use of Revenue Generated from Rentals in Prior Year
Reference Distribution of Revenues(D) Explanation of Amendments Made to Existing Leases
Not Currently Available**
* LEASE: DACA01-1-78-359 $855 $855 $855 $855(A) Explanation of Lease
Redstone Arsenal/Banking(B) Explanation of Anticipated Expenditures Resulting from Rentals by Fiscal Year
Maintenance and Repair(C) Actual Use of Revenue Generated from Rentals in Prior Year
Reference Distribution of Revenues(D) Explanation of Amendments Made to Existing Leases
Not Currently Available**
* LEASE: DACA01-1-91-0269 $0 $0 $0 $0(A) Explanation of Lease
Redstone Arsenal/Education(B) Explanation of Anticipated Expenditures Resulting from Rentals by Fiscal Year
Maintenance and Repair(C) Actual Use of Revenue Generated from Rentals in Prior Year
Reference Distribution of Revenues(D) Explanation of Amendments Made to Existing Leases
Not Currently Available**
176
Exhibit PB-34 Revenue from Leasing Out of DoD AssetsFebruary 2003
Ms. Valerie Turner/(703) 695-7174

DEPARTMENT OF THE ARMYFY 2004/2005 BIENNAL BUDGET ESTIMATES
REVENUE FROM LEASING OUT OF DEPARTMENT OF DEFENSE ASSETS
FY 2002 FY 2003 FY 2004 FY 2005
* LEASE: DACA01-1-98-285 $325,500 $325,500 $325,500 $325,500(A) Explanation of Lease
Redstone Arsenal(B) Explanation of Anticipated Expenditures Resulting from Rentals by Fiscal Year
Maintenance and Repair(C) Actual Use of Revenue Generated from Rentals in Prior Year
Reference Distribution of Revenues(D) Explanation of Amendments Made to Existing Leases
Not Currently Available**
* LEASE: DACW01-1-83-0269 $2,160 $2,160 $2,160 $2,160(A) Explanation of Lease
Cottondale/Recreation(B) Explanation of Anticipated Expenditures Resulting from Rentals by Fiscal Year
Maintenance and Repair(C) Actual Use of Revenue Generated from Rentals in Prior Year
Reference Distribution of Revenues(D) Explanation of Amendments Made to Existing Leases
Not Currently Available**
* LEASE: DACW01-1-98-0483 $12,300 $12,300 $12,300 $12,300(A) Explanation of Lease
Northport/Industrial(B) Explanation of Anticipated Expenditures Resulting from Rentals by Fiscal Year
Maintenance and Repair(C) Actual Use of Revenue Generated from Rentals in Prior Year
Reference Distribution of Revenues(D) Explanation of Amendments Made to Existing Leases
Not Currently Available**
177
Exhibit PB-34 Revenue from Leasing Out of DoD AssetsFebruary 2003
Ms. Valerie Turner/(703) 695-7174

DEPARTMENT OF THE ARMYFY 2004/2005 BIENNAL BUDGET ESTIMATES
REVENUE FROM LEASING OUT OF DEPARTMENT OF DEFENSE ASSETS
FY 2002 FY 2003 FY 2004 FY 2005
* LEASE: DACA01-1-89-0381 $75,000 $75,000 $75,000 $75,000(A) Explanation of Lease
Redstone Arsenal/Industrial(B) Explanation of Anticipated Expenditures Resulting from Rentals by Fiscal Year
Maintenance and Repair(C) Actual Use of Revenue Generated from Rentals in Prior Year
Reference Distribution of Revenues(D) Explanation of Amendments Made to Existing Leases
Not Currently Available**
ALASKA* LEASE: DACA85-1-80-52 $6,600 $6,600 $6,600 $6,600(A) Explanation of Lease
Fort Richardson/Banking(B) Explanation of Anticipated Expenditures Resulting from Rentals by Fiscal Year
Maintenance and Repair(C) Actual Use of Revenue Generated from Rentals in Prior Year
Reference Distribution of Revenues(D) Explanation of Amendments Made to Existing Leases
Not Currently Available**
* LEASE: 95-507-ENG-58 $260 $260 $260 $260(A) Explanation of Lease
Anchorage/Housing(B) Explanation of Anticipated Expenditures Resulting from Rentals by Fiscal Year
Maintenance and Repair(C) Actual Use of Revenue Generated from Rentals in Prior Year
Reference Distribution of Revenues(D) Explanation of Amendments Made to Existing Leases
Not Currently Available**
178
Exhibit PB-34 Revenue from Leasing Out of DoD AssetsFebruary 2003
Ms. Valerie Turner/(703) 695-7174
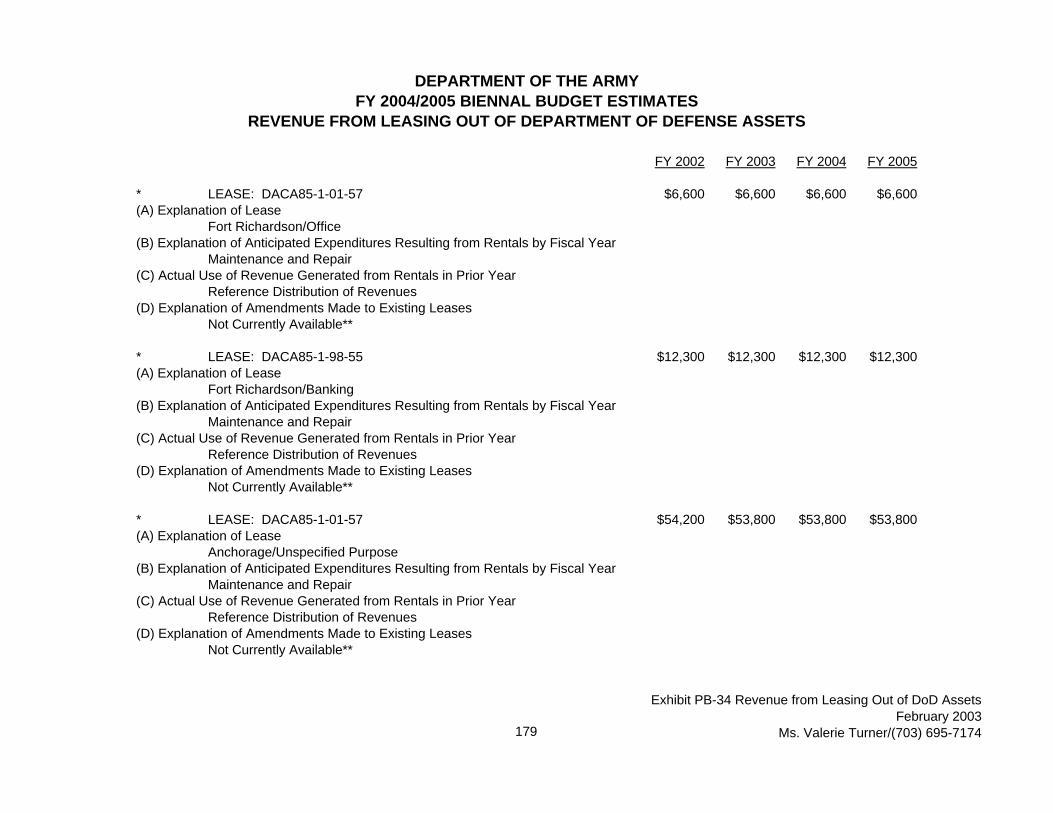
DEPARTMENT OF THE ARMYFY 2004/2005 BIENNAL BUDGET ESTIMATES
REVENUE FROM LEASING OUT OF DEPARTMENT OF DEFENSE ASSETS
FY 2002 FY 2003 FY 2004 FY 2005
* LEASE: DACA85-1-01-57 $6,600 $6,600 $6,600 $6,600(A) Explanation of Lease
Fort Richardson/Office(B) Explanation of Anticipated Expenditures Resulting from Rentals by Fiscal Year
Maintenance and Repair(C) Actual Use of Revenue Generated from Rentals in Prior Year
Reference Distribution of Revenues(D) Explanation of Amendments Made to Existing Leases
Not Currently Available**
* LEASE: DACA85-1-98-55 $12,300 $12,300 $12,300 $12,300(A) Explanation of Lease
Fort Richardson/Banking(B) Explanation of Anticipated Expenditures Resulting from Rentals by Fiscal Year
Maintenance and Repair(C) Actual Use of Revenue Generated from Rentals in Prior Year
Reference Distribution of Revenues(D) Explanation of Amendments Made to Existing Leases
Not Currently Available**
* LEASE: DACA85-1-01-57 $54,200 $53,800 $53,800 $53,800(A) Explanation of Lease
Anchorage/Unspecified Purpose(B) Explanation of Anticipated Expenditures Resulting from Rentals by Fiscal Year
Maintenance and Repair(C) Actual Use of Revenue Generated from Rentals in Prior Year
Reference Distribution of Revenues(D) Explanation of Amendments Made to Existing Leases
Not Currently Available**
179
Exhibit PB-34 Revenue from Leasing Out of DoD AssetsFebruary 2003
Ms. Valerie Turner/(703) 695-7174

DEPARTMENT OF THE ARMYFY 2004/2005 BIENNAL BUDGET ESTIMATES
REVENUE FROM LEASING OUT OF DEPARTMENT OF DEFENSE ASSETS
FY 2002 FY 2003 FY 2004 FY 2005
* LEASE: DACA85-1-01-57 $336 $336 $336 $336(A) Explanation of Lease
Delta Junction/Unspecified Purpose(B) Explanation of Anticipated Expenditures Resulting from Rentals by Fiscal Year
Maintenance and Repair(C) Actual Use of Revenue Generated from Rentals in Prior Year
Reference Distribution of Revenues(D) Explanation of Amendments Made to Existing Leases
Not Currently Available**
* LEASE: DACA85-1-01-57 $950 $950 $950 $950(A) Explanation of Lease
Fairbanks/Unspecified Purpose(B) Explanation of Anticipated Expenditures Resulting from Rentals by Fiscal Year
Maintenance and Repair(C) Actual Use of Revenue Generated from Rentals in Prior Year
Reference Distribution of Revenues(D) Explanation of Amendments Made to Existing Leases
Not Currently Available**ARIZONA* LEASE: 040353E0005747 $200 $200 $200 $200(A) Explanation of Lease
Yuma Proving Ground/Housing(B) Explanation of Anticipated Expenditures Resulting from Rentals by Fiscal Year
Maintenance and Repair(C) Actual Use of Revenue Generated from Rentals in Prior Year
Reference Distribution of Revenues(D) Explanation of Amendments Made to Existing Leases
Not Currently Available**
180
Exhibit PB-34 Revenue from Leasing Out of DoD AssetsFebruary 2003
Ms. Valerie Turner/(703) 695-7174

DEPARTMENT OF THE ARMYFY 2004/2005 BIENNAL BUDGET ESTIMATES
REVENUE FROM LEASING OUT OF DEPARTMENT OF DEFENSE ASSETS
FY 2002 FY 2003 FY 2004 FY 2005
* LEASE: 040353E0005748 $200 $200 $200 $200(A) Explanation of Lease
Yuma Proving Ground/Housing(B) Explanation of Anticipated Expenditures Resulting from Rentals by Fiscal Year
Maintenance and Repair(C) Actual Use of Revenue Generated from Rentals in Prior Year
Reference Distribution of Revenues(D) Explanation of Amendments Made to Existing Leases
Not Currently Available**
* LEASE: DACA09-1-99-0004 $9,700 $9,700 $9,700 $9,700(A) Explanation of Lease
Fort Huachuca/Banking(B) Explanation of Anticipated Expenditures Resulting from Rentals by Fiscal Year
Maintenance and Repair(C) Actual Use of Revenue Generated from Rentals in Prior Year
Reference Distribution of Revenues(D) Explanation of Amendments Made to Existing Leases
Not Currently Available**
* LEASE: DACW09-1-02-0033 $3,120 $3,120 $3,120 $3,120(A) Explanation of Lease
Wenden/Housing(B) Explanation of Anticipated Expenditures Resulting from Rentals by Fiscal Year
Maintenance and Repair(C) Actual Use of Revenue Generated from Rentals in Prior Year
Reference Distribution of Revenues(D) Explanation of Amendments Made to Existing Leases
Not Currently Available**
181
Exhibit PB-34 Revenue from Leasing Out of DoD AssetsFebruary 2003
Ms. Valerie Turner/(703) 695-7174

DEPARTMENT OF THE ARMYFY 2004/2005 BIENNAL BUDGET ESTIMATES
REVENUE FROM LEASING OUT OF DEPARTMENT OF DEFENSE ASSETS
FY 2002 FY 2003 FY 2004 FY 2005
* LEASE: DACW09-1-02-0034 $3,120 $3,120 $3,120 $3,120(A) Explanation of Lease
Wenden/Housing(B) Explanation of Anticipated Expenditures Resulting from Rentals by Fiscal Year
Maintenance and Repair(C) Actual Use of Revenue Generated from Rentals in Prior Year
Reference Distribution of Revenues(D) Explanation of Amendments Made to Existing Leases
Not Currently Available**
* LEASE: DACA09195122 $100 $100 $100 $100(A) Explanation of Lease
Yuma Proving Grounds/Education(B) Explanation of Anticipated Expenditures Resulting from Rentals by Fiscal Year
Maintenance and Repair(C) Actual Use of Revenue Generated from Rentals in Prior Year
Reference Distribution of Revenues(D) Explanation of Amendments Made to Existing Leases
Not Currently Available**
* LEASE: DACA09195122 $227 $227 $227 $227(A) Explanation of Lease
Fort Huachuca/Unspecified Purpose(B) Explanation of Anticipated Expenditures Resulting from Rentals by Fiscal Year
Maintenance and Repair(C) Actual Use of Revenue Generated from Rentals in Prior Year
Reference Distribution of Revenues(D) Explanation of Amendments Made to Existing Leases
Not Currently Available**
182
Exhibit PB-34 Revenue from Leasing Out of DoD AssetsFebruary 2003
Ms. Valerie Turner/(703) 695-7174

DEPARTMENT OF THE ARMYFY 2004/2005 BIENNAL BUDGET ESTIMATES
REVENUE FROM LEASING OUT OF DEPARTMENT OF DEFENSE ASSETS
FY 2002 FY 2003 FY 2004 FY 2005ARKANSAS* LEASE: Multiple Leases $13,910 $6,110 $6,110 $6,110(A) Explanation of Lease
Multiple Locations/Recreation(B) Explanation of Anticipated Expenditures Resulting from Rentals by Fiscal Year
Maintenance and Repair(C) Actual Use of Revenue Generated from Rentals in Prior Year
Reference Distribution of Revenues(D) Explanation of Amendments Made to Existing Leases
Not Currently Available**
* LEASE: DACA0319901201 $20 $20 $20 $20(A) Explanation of Lease
Fort Smith/Banking(B) Explanation of Anticipated Expenditures Resulting from Rentals by Fiscal Year
Maintenance and Repair(C) Actual Use of Revenue Generated from Rentals in Prior Year
Reference Distribution of Revenues(D) Explanation of Amendments Made to Existing Leases
Not Currently Available**
* LEASE: DACA63-1-73-0097 $4,500 $4,500 $4,500 $4,500(A) Explanation of Lease
Hot Springs/USAR Center(B) Explanation of Anticipated Expenditures Resulting from Rentals by Fiscal Year
Maintenance and Repair(C) Actual Use of Revenue Generated from Rentals in Prior Year
Reference Distribution of Revenues(D) Explanation of Amendments Made to Existing Leases
Not Currently Available**
183
Exhibit PB-34 Revenue from Leasing Out of DoD AssetsFebruary 2003
Ms. Valerie Turner/(703) 695-7174
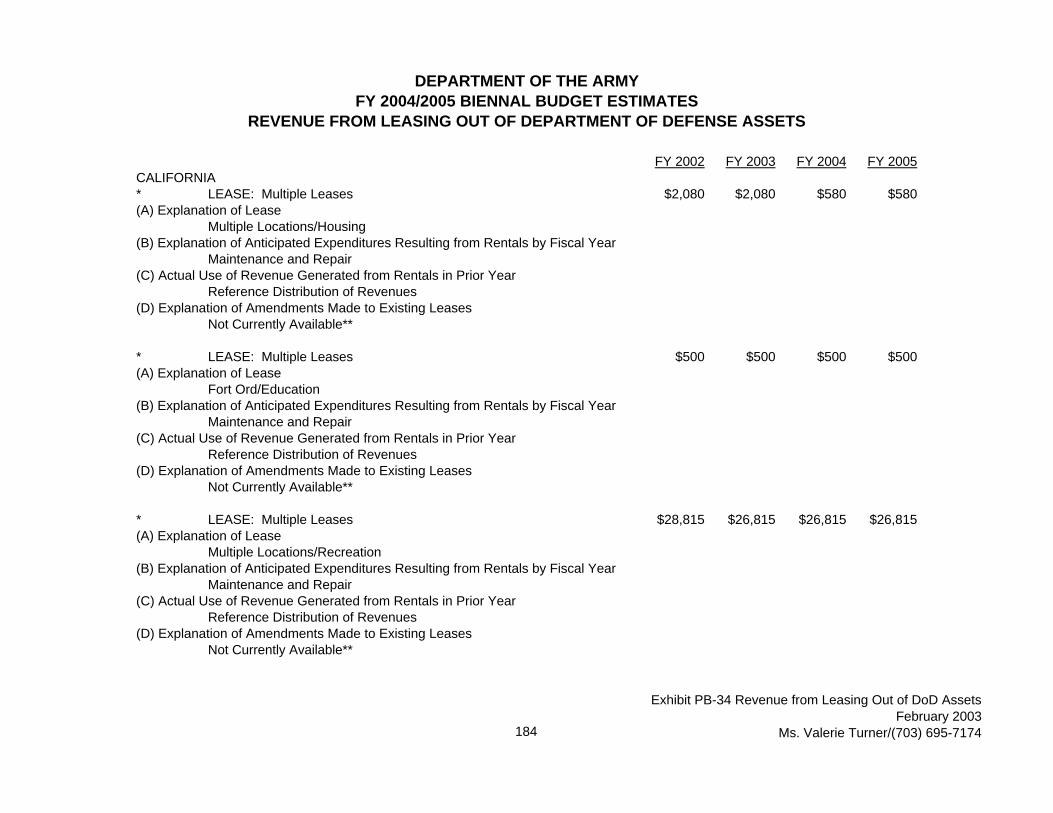
DEPARTMENT OF THE ARMYFY 2004/2005 BIENNAL BUDGET ESTIMATES
REVENUE FROM LEASING OUT OF DEPARTMENT OF DEFENSE ASSETS
FY 2002 FY 2003 FY 2004 FY 2005CALIFORNIA* LEASE: Multiple Leases $2,080 $2,080 $580 $580(A) Explanation of Lease
Multiple Locations/Housing(B) Explanation of Anticipated Expenditures Resulting from Rentals by Fiscal Year
Maintenance and Repair(C) Actual Use of Revenue Generated from Rentals in Prior Year
Reference Distribution of Revenues(D) Explanation of Amendments Made to Existing Leases
Not Currently Available**
* LEASE: Multiple Leases $500 $500 $500 $500(A) Explanation of Lease
Fort Ord/Education(B) Explanation of Anticipated Expenditures Resulting from Rentals by Fiscal Year
Maintenance and Repair(C) Actual Use of Revenue Generated from Rentals in Prior Year
Reference Distribution of Revenues(D) Explanation of Amendments Made to Existing Leases
Not Currently Available**
* LEASE: Multiple Leases $28,815 $26,815 $26,815 $26,815(A) Explanation of Lease
Multiple Locations/Recreation(B) Explanation of Anticipated Expenditures Resulting from Rentals by Fiscal Year
Maintenance and Repair(C) Actual Use of Revenue Generated from Rentals in Prior Year
Reference Distribution of Revenues(D) Explanation of Amendments Made to Existing Leases
Not Currently Available**
184
Exhibit PB-34 Revenue from Leasing Out of DoD AssetsFebruary 2003
Ms. Valerie Turner/(703) 695-7174

DEPARTMENT OF THE ARMYFY 2004/2005 BIENNAL BUDGET ESTIMATES
REVENUE FROM LEASING OUT OF DEPARTMENT OF DEFENSE ASSETS
FY 2002 FY 2003 FY 2004 FY 2005
* LEASE: DA04-353-CIVENG-64-123 $13,800 $13,800 $13,800 $13,800(A) Explanation of Lease
Los Angeles/National Guard(B) Explanation of Anticipated Expenditures Resulting from Rentals by Fiscal Year
Maintenance and Repair(C) Actual Use of Revenue Generated from Rentals in Prior Year
Reference Distribution of Revenues(D) Explanation of Amendments Made to Existing Leases
Not Currently Available**
LEASE: DACA05-1-00-577 $6,000 $6,000 $6,000 $6,000(A) Explanation of Lease
Presidio of Monterey/Banking(B) Explanation of Anticipated Expenditures Resulting from Rentals by Fiscal Year
Maintenance and Repair(C) Actual Use of Revenue Generated from Rentals in Prior Year
Reference Distribution of Revenues(D) Explanation of Amendments Made to Existing Leases
Not Currently Available**
* LEASE: DACA05-1-84-634 $1,000 $1,000 $1,000 $1,000(A) Explanation of Lease
Roseville/Banking(B) Explanation of Anticipated Expenditures Resulting from Rentals by Fiscal Year
Maintenance and Repair(C) Actual Use of Revenue Generated from Rentals in Prior Year
Reference Distribution of Revenues(D) Explanation of Amendments Made to Existing Leases
Not Currently Available**
185
Exhibit PB-34 Revenue from Leasing Out of DoD AssetsFebruary 2003
Ms. Valerie Turner/(703) 695-7174

DEPARTMENT OF THE ARMYFY 2004/2005 BIENNAL BUDGET ESTIMATES
REVENUE FROM LEASING OUT OF DEPARTMENT OF DEFENSE ASSETS
FY 2002 FY 2003 FY 2004 FY 2005
* LEASE: DACA05-1-98-522 $978 $978 $978 $978(A) Explanation of Lease
Rancho Cordova/Banking(B) Explanation of Anticipated Expenditures Resulting from Rentals by Fiscal Year
Maintenance and Repair(C) Actual Use of Revenue Generated from Rentals in Prior Year
Reference Distribution of Revenues(D) Explanation of Amendments Made to Existing Leases
Not Currently Available**
LEASE: DACA05-1-99-518 $6,000 $6,000 $6,000 $6,000(A) Explanation of Lease
Marysville/Banking(B) Explanation of Anticipated Expenditures Resulting from Rentals by Fiscal Year
Maintenance and Repair(C) Actual Use of Revenue Generated from Rentals in Prior Year
Reference Distribution of Revenues(D) Explanation of Amendments Made to Existing Leases
Not Currently Available**
* LEASE: DACA05-1-81-563 $2,400 $2,400 $2,400 $2,400(A) Explanation of Lease
Monterey/Industrial(B) Explanation of Anticipated Expenditures Resulting from Rentals by Fiscal Year
Maintenance and Repair(C) Actual Use of Revenue Generated from Rentals in Prior Year
Reference Distribution of Revenues(D) Explanation of Amendments Made to Existing Leases
Not Currently Available**
186
Exhibit PB-34 Revenue from Leasing Out of DoD AssetsFebruary 2003
Ms. Valerie Turner/(703) 695-7174

DEPARTMENT OF THE ARMYFY 2004/2005 BIENNAL BUDGET ESTIMATES
REVENUE FROM LEASING OUT OF DEPARTMENT OF DEFENSE ASSETS
FY 2002 FY 2003 FY 2004 FY 2005
* LEASE: Multiple Leases $129,723 $129,723 $129,723 $129,723(A) Explanation of Lease
Multiple Locations/Unspecified Purpose(B) Explanation of Anticipated Expenditures Resulting from Rentals by Fiscal Year
Maintenance and Repair(C) Actual Use of Revenue Generated from Rentals in Prior Year
Reference Distribution of Revenues(D) Explanation of Amendments Made to Existing Leases
Not Currently Available**
COLORADO* LEASE: DACA45-1-67-5102 $7,320 $7,320 $7,320 $7,320(A) Explanation of Lease
Fort Carson/Banking(B) Explanation of Anticipated Expenditures Resulting from Rentals by Fiscal Year
Maintenance and Repair(C) Actual Use of Revenue Generated from Rentals in Prior Year
Reference Distribution of Revenues(D) Explanation of Amendments Made to Existing Leases
Not Currently Available**
* LEASE: 25-066-E-3773 $100 $100 $100 $100(A) Explanation of Lease
Fort Carson/Education(B) Explanation of Anticipated Expenditures Resulting from Rentals by Fiscal Year
Maintenance and Repair(C) Actual Use of Revenue Generated from Rentals in Prior Year
Reference Distribution of Revenues(D) Explanation of Amendments Made to Existing Leases
Not Currently Available**
187
Exhibit PB-34 Revenue from Leasing Out of DoD AssetsFebruary 2003
Ms. Valerie Turner/(703) 695-7174

DEPARTMENT OF THE ARMYFY 2004/2005 BIENNAL BUDGET ESTIMATES
REVENUE FROM LEASING OUT OF DEPARTMENT OF DEFENSE ASSETS
FY 2002 FY 2003 FY 2004 FY 2005
* LEASE: 25-066-E-4488 $130 $130 $130 $130(A) Explanation of Lease
Fort Carson/Education(B) Explanation of Anticipated Expenditures Resulting from Rentals by Fiscal Year
Maintenance and Repair(C) Actual Use of Revenue Generated from Rentals in Prior Year
Reference Distribution of Revenues(D) Explanation of Amendments Made to Existing Leases
Not Currently Available**
* LEASE: Multiple Leases $5,855 $3,040 $3,040 $3,040(A) Explanation of Lease
Fort Carson/Unspecified Purpose(B) Explanation of Anticipated Expenditures Resulting from Rentals by Fiscal Year
Maintenance and Repair(C) Actual Use of Revenue Generated from Rentals in Prior Year
Reference Distribution of Revenues(D) Explanation of Amendments Made to Existing Leases
Not Currently Available**
* LEASE: DACA45-1-84-6170 $20,673 $20,673 $20,673 $20,673(A) Explanation of Lease
Fort Carson/Office(B) Explanation of Anticipated Expenditures Resulting from Rentals by Fiscal Year
Maintenance and Repair(C) Actual Use of Revenue Generated from Rentals in Prior Year
Reference Distribution of Revenues(D) Explanation of Amendments Made to Existing Leases
Not Currently Available**
188
Exhibit PB-34 Revenue from Leasing Out of DoD AssetsFebruary 2003
Ms. Valerie Turner/(703) 695-7174
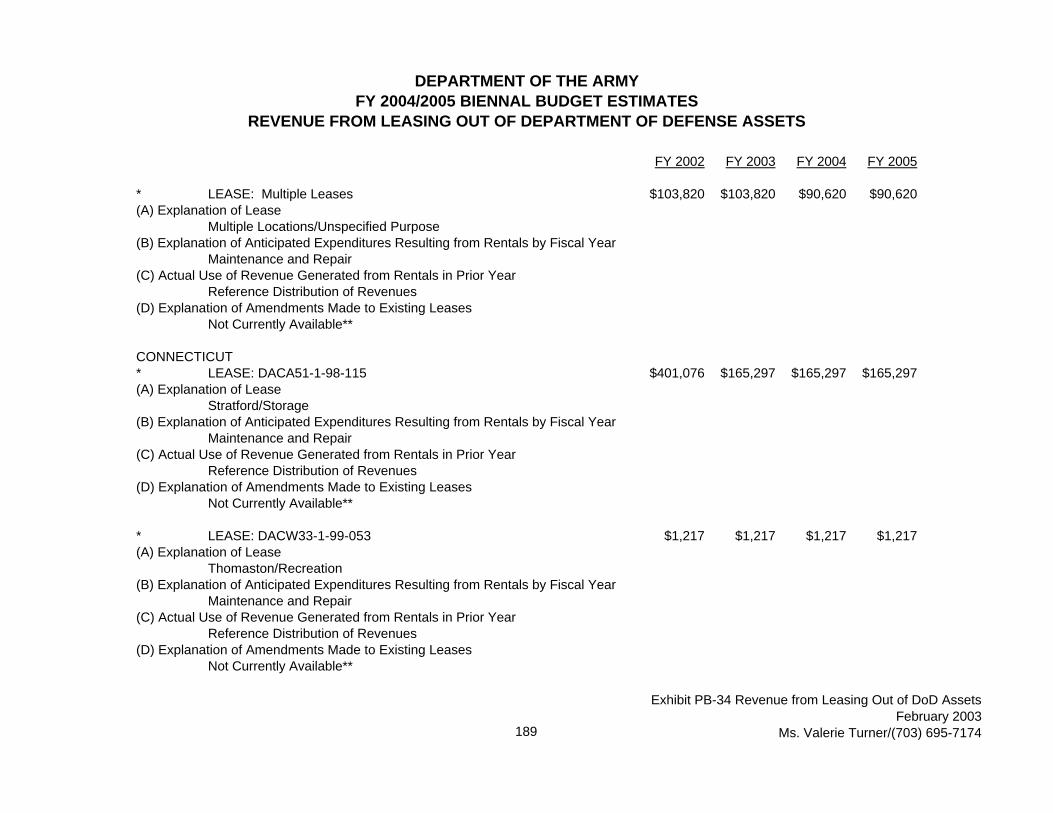
DEPARTMENT OF THE ARMYFY 2004/2005 BIENNAL BUDGET ESTIMATES
REVENUE FROM LEASING OUT OF DEPARTMENT OF DEFENSE ASSETS
FY 2002 FY 2003 FY 2004 FY 2005
* LEASE: Multiple Leases $103,820 $103,820 $90,620 $90,620(A) Explanation of Lease
Multiple Locations/Unspecified Purpose(B) Explanation of Anticipated Expenditures Resulting from Rentals by Fiscal Year
Maintenance and Repair(C) Actual Use of Revenue Generated from Rentals in Prior Year
Reference Distribution of Revenues(D) Explanation of Amendments Made to Existing Leases
Not Currently Available**
CONNECTICUT* LEASE: DACA51-1-98-115 $401,076 $165,297 $165,297 $165,297(A) Explanation of Lease
Stratford/Storage(B) Explanation of Anticipated Expenditures Resulting from Rentals by Fiscal Year
Maintenance and Repair(C) Actual Use of Revenue Generated from Rentals in Prior Year
Reference Distribution of Revenues(D) Explanation of Amendments Made to Existing Leases
Not Currently Available**
* LEASE: DACW33-1-99-053 $1,217 $1,217 $1,217 $1,217(A) Explanation of Lease
Thomaston/Recreation(B) Explanation of Anticipated Expenditures Resulting from Rentals by Fiscal Year
Maintenance and Repair(C) Actual Use of Revenue Generated from Rentals in Prior Year
Reference Distribution of Revenues(D) Explanation of Amendments Made to Existing Leases
Not Currently Available**
189
Exhibit PB-34 Revenue from Leasing Out of DoD AssetsFebruary 2003
Ms. Valerie Turner/(703) 695-7174
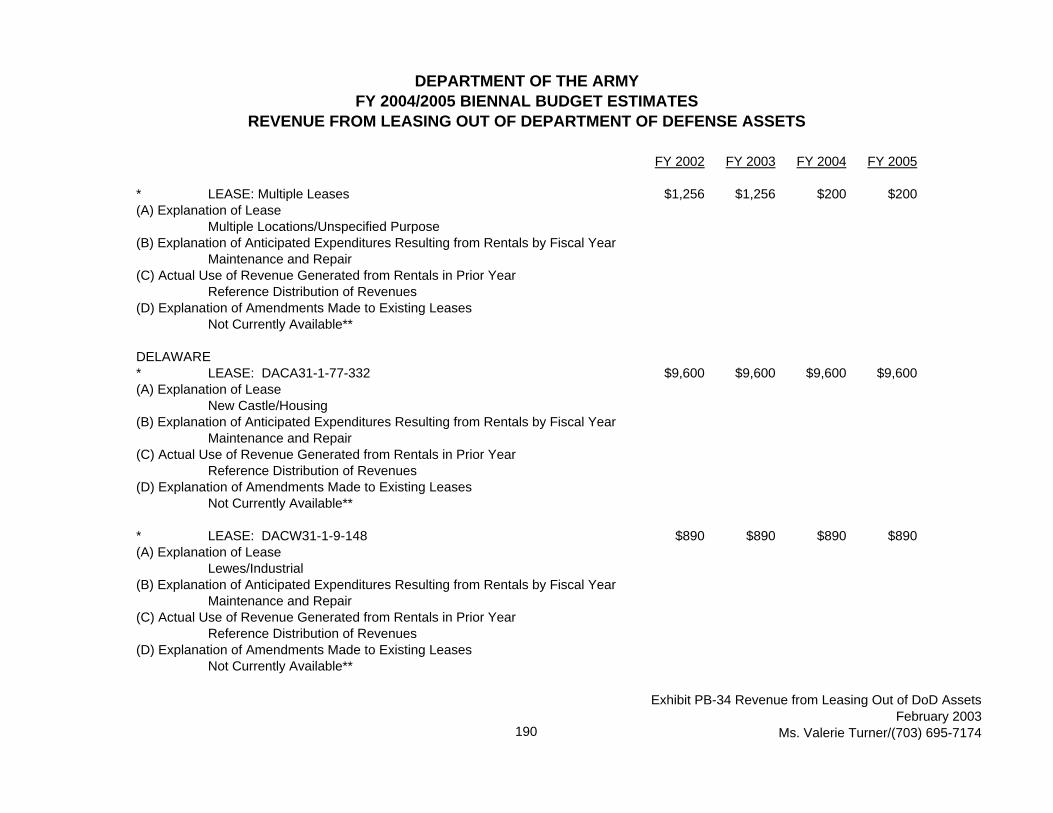
DEPARTMENT OF THE ARMYFY 2004/2005 BIENNAL BUDGET ESTIMATES
REVENUE FROM LEASING OUT OF DEPARTMENT OF DEFENSE ASSETS
FY 2002 FY 2003 FY 2004 FY 2005
* LEASE: Multiple Leases $1,256 $1,256 $200 $200(A) Explanation of Lease
Multiple Locations/Unspecified Purpose(B) Explanation of Anticipated Expenditures Resulting from Rentals by Fiscal Year
Maintenance and Repair(C) Actual Use of Revenue Generated from Rentals in Prior Year
Reference Distribution of Revenues(D) Explanation of Amendments Made to Existing Leases
Not Currently Available**
DELAWARE* LEASE: DACA31-1-77-332 $9,600 $9,600 $9,600 $9,600(A) Explanation of Lease
New Castle/Housing(B) Explanation of Anticipated Expenditures Resulting from Rentals by Fiscal Year
Maintenance and Repair(C) Actual Use of Revenue Generated from Rentals in Prior Year
Reference Distribution of Revenues(D) Explanation of Amendments Made to Existing Leases
Not Currently Available**
* LEASE: DACW31-1-9-148 $890 $890 $890 $890(A) Explanation of Lease
Lewes/Industrial(B) Explanation of Anticipated Expenditures Resulting from Rentals by Fiscal Year
Maintenance and Repair(C) Actual Use of Revenue Generated from Rentals in Prior Year
Reference Distribution of Revenues(D) Explanation of Amendments Made to Existing Leases
Not Currently Available**
190
Exhibit PB-34 Revenue from Leasing Out of DoD AssetsFebruary 2003
Ms. Valerie Turner/(703) 695-7174
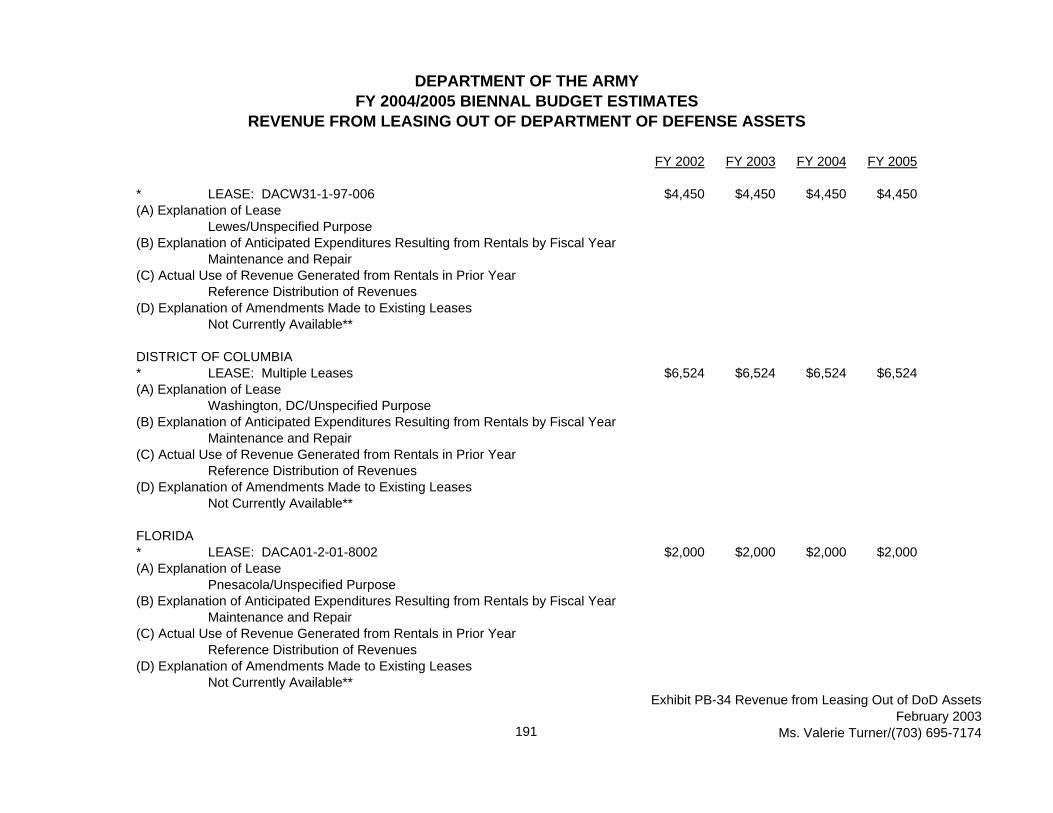
DEPARTMENT OF THE ARMYFY 2004/2005 BIENNAL BUDGET ESTIMATES
REVENUE FROM LEASING OUT OF DEPARTMENT OF DEFENSE ASSETS
FY 2002 FY 2003 FY 2004 FY 2005
* LEASE: DACW31-1-97-006 $4,450 $4,450 $4,450 $4,450(A) Explanation of Lease
Lewes/Unspecified Purpose(B) Explanation of Anticipated Expenditures Resulting from Rentals by Fiscal Year
Maintenance and Repair(C) Actual Use of Revenue Generated from Rentals in Prior Year
Reference Distribution of Revenues(D) Explanation of Amendments Made to Existing Leases
Not Currently Available**
DISTRICT OF COLUMBIA* LEASE: Multiple Leases $6,524 $6,524 $6,524 $6,524(A) Explanation of Lease
Washington, DC/Unspecified Purpose(B) Explanation of Anticipated Expenditures Resulting from Rentals by Fiscal Year
Maintenance and Repair(C) Actual Use of Revenue Generated from Rentals in Prior Year
Reference Distribution of Revenues(D) Explanation of Amendments Made to Existing Leases
Not Currently Available**
FLORIDA* LEASE: DACA01-2-01-8002 $2,000 $2,000 $2,000 $2,000(A) Explanation of Lease
Pnesacola/Unspecified Purpose(B) Explanation of Anticipated Expenditures Resulting from Rentals by Fiscal Year
Maintenance and Repair(C) Actual Use of Revenue Generated from Rentals in Prior Year
Reference Distribution of Revenues(D) Explanation of Amendments Made to Existing Leases
Not Currently Available**
191
Exhibit PB-34 Revenue from Leasing Out of DoD AssetsFebruary 2003
Ms. Valerie Turner/(703) 695-7174
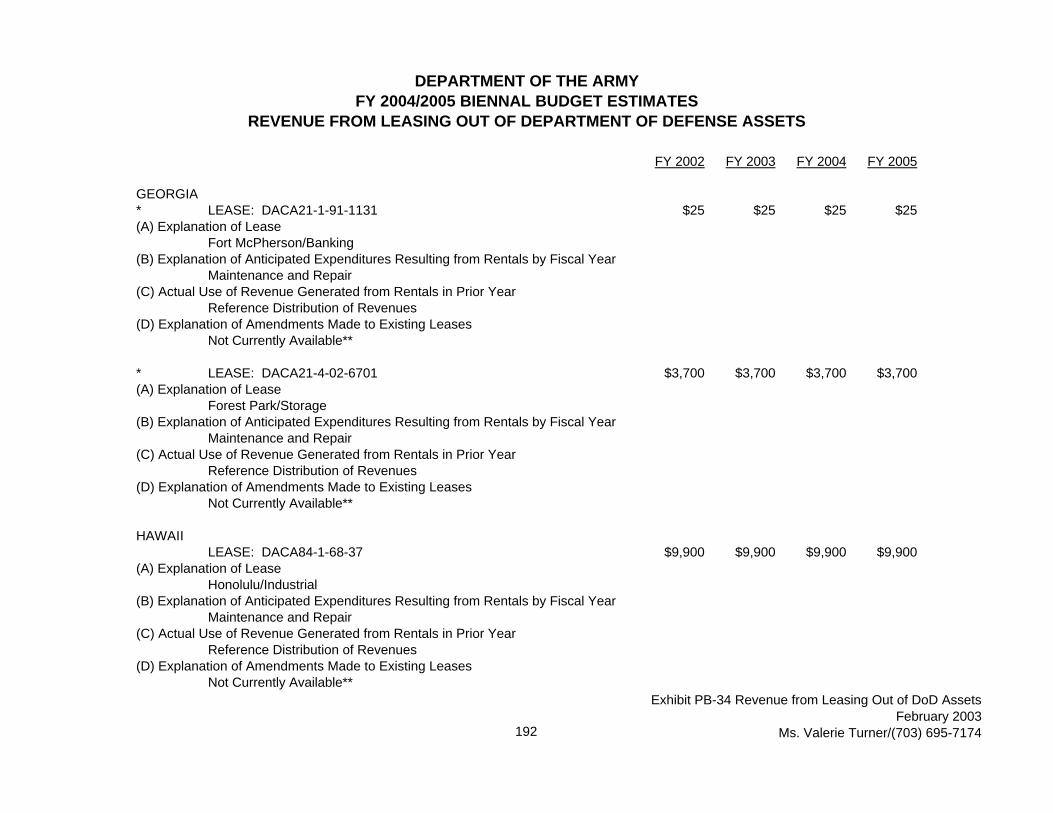
DEPARTMENT OF THE ARMYFY 2004/2005 BIENNAL BUDGET ESTIMATES
REVENUE FROM LEASING OUT OF DEPARTMENT OF DEFENSE ASSETS
FY 2002 FY 2003 FY 2004 FY 2005
GEORGIA* LEASE: DACA21-1-91-1131 $25 $25 $25 $25(A) Explanation of Lease
Fort McPherson/Banking(B) Explanation of Anticipated Expenditures Resulting from Rentals by Fiscal Year
Maintenance and Repair(C) Actual Use of Revenue Generated from Rentals in Prior Year
Reference Distribution of Revenues(D) Explanation of Amendments Made to Existing Leases
Not Currently Available**
* LEASE: DACA21-4-02-6701 $3,700 $3,700 $3,700 $3,700(A) Explanation of Lease
Forest Park/Storage(B) Explanation of Anticipated Expenditures Resulting from Rentals by Fiscal Year
Maintenance and Repair(C) Actual Use of Revenue Generated from Rentals in Prior Year
Reference Distribution of Revenues(D) Explanation of Amendments Made to Existing Leases
Not Currently Available**
HAWAIILEASE: DACA84-1-68-37 $9,900 $9,900 $9,900 $9,900
(A) Explanation of LeaseHonolulu/Industrial
(B) Explanation of Anticipated Expenditures Resulting from Rentals by Fiscal YearMaintenance and Repair
(C) Actual Use of Revenue Generated from Rentals in Prior YearReference Distribution of Revenues
(D) Explanation of Amendments Made to Existing LeasesNot Currently Available**
192
Exhibit PB-34 Revenue from Leasing Out of DoD AssetsFebruary 2003
Ms. Valerie Turner/(703) 695-7174

DEPARTMENT OF THE ARMYFY 2004/2005 BIENNAL BUDGET ESTIMATES
REVENUE FROM LEASING OUT OF DEPARTMENT OF DEFENSE ASSETS
FY 2002 FY 2003 FY 2004 FY 2005
LEASE: HONDE-22 $16,800 $16,800 $16,800 $16,800(A) Explanation of Lease
Schofield Barracks/Banking(B) Explanation of Anticipated Expenditures Resulting from Rentals by Fiscal Year
Maintenance and Repair(C) Actual Use of Revenue Generated from Rentals in Prior Year
Reference Distribution of Revenues(D) Explanation of Amendments Made to Existing Leases
Not Currently Available**
LEASE: DACA84-1-74-38 $21,960 $21,960 $21,960 $21,960(A) Explanation of Lease
Honolulu/Banking(B) Explanation of Anticipated Expenditures Resulting from Rentals by Fiscal Year
Maintenance and Repair(C) Actual Use of Revenue Generated from Rentals in Prior Year
Reference Distribution of Revenues(D) Explanation of Amendments Made to Existing Leases
Not Currently Available**
LEASE: DACA84-1-74-9 $20,130 $20,130 $20,130 $20,130(A) Explanation of Lease
Honolulu/Banking(B) Explanation of Anticipated Expenditures Resulting from Rentals by Fiscal Year
Maintenance and Repair(C) Actual Use of Revenue Generated from Rentals in Prior Year
Reference Distribution of Revenues(D) Explanation of Amendments Made to Existing Leases
Not Currently Available**
193
Exhibit PB-34 Revenue from Leasing Out of DoD AssetsFebruary 2003
Ms. Valerie Turner/(703) 695-7174

DEPARTMENT OF THE ARMYFY 2004/2005 BIENNAL BUDGET ESTIMATES
REVENUE FROM LEASING OUT OF DEPARTMENT OF DEFENSE ASSETS
FY 2002 FY 2003 FY 2004 FY 2005
LEASE: Multiple Leases $99,000 $79,000 $65,000 $65,000(A) Explanation of Lease
Multiple Locations/Unspecified Purpose(B) Explanation of Anticipated Expenditures Resulting from Rentals by Fiscal Year
Maintenance and Repair(C) Actual Use of Revenue Generated from Rentals in Prior Year
Reference Distribution of Revenues(D) Explanation of Amendments Made to Existing Leases
Not Currently Available**
LEASE: Multiple Leases $40 $40 $40 $40(A) Explanation of Lease
Multiple Locations/Housing(B) Explanation of Anticipated Expenditures Resulting from Rentals by Fiscal Year
Maintenance and Repair(C) Actual Use of Revenue Generated from Rentals in Prior Year
Reference Distribution of Revenues(D) Explanation of Amendments Made to Existing Leases
Not Currently Available**
IDAHOLEASE: DACW68-1-96-18 $8,678 $8,678 $8,678 $8,678
(A) Explanation of LeaseAhsahka/Recreation
(B) Explanation of Anticipated Expenditures Resulting from Rentals by Fiscal YearMaintenance and Repair
(C) Actual Use of Revenue Generated from Rentals in Prior YearReference Distribution of Revenues
(D) Explanation of Amendments Made to Existing LeasesNot Currently Available**
194
Exhibit PB-34 Revenue from Leasing Out of DoD AssetsFebruary 2003
Ms. Valerie Turner/(703) 695-7174

DEPARTMENT OF THE ARMYFY 2004/2005 BIENNAL BUDGET ESTIMATES
REVENUE FROM LEASING OUT OF DEPARTMENT OF DEFENSE ASSETS
FY 2002 FY 2003 FY 2004 FY 2005
ILLINOISLEASE: DA23065CIV64651 $17,940 $17,940 $17,940 $17,940
(A) Explanation of LeaseCharles Melvin Price Support Center
(B) Explanation of Anticipated Expenditures Resulting from Rentals by Fiscal YearMaintenance and Repair
(C) Actual Use of Revenue Generated from Rentals in Prior YearReference Distribution of Revenues
(D) Explanation of Amendments Made to Existing LeasesNot Currently Available**
LEASE: Multiple Leases $115,590 $115,590 $113,090 $113,090(A) Explanation of Lease
Multiple Locations/Recreation(B) Explanation of Anticipated Expenditures Resulting from Rentals by Fiscal Year
Maintenance and Repair(C) Actual Use of Revenue Generated from Rentals in Prior Year
Reference Distribution of Revenues(D) Explanation of Amendments Made to Existing Leases
Not Currently Available**
LEASE: Multiple Leases $11,100 $11,100 $11,100 $11,100(A) Explanation of Lease
Multiple Locations/Unspecified Purpose(B) Explanation of Anticipated Expenditures Resulting from Rentals by Fiscal Year
Maintenance and Repair(C) Actual Use of Revenue Generated from Rentals in Prior Year
Reference Distribution of Revenues(D) Explanation of Amendments Made to Existing Leases
Not Currently Available**
195
Exhibit PB-34 Revenue from Leasing Out of DoD AssetsFebruary 2003
Ms. Valerie Turner/(703) 695-7174

DEPARTMENT OF THE ARMYFY 2004/2005 BIENNAL BUDGET ESTIMATES
REVENUE FROM LEASING OUT OF DEPARTMENT OF DEFENSE ASSETS
FY 2002 FY 2003 FY 2004 FY 2005
IOWALEASE: DACA45-1-95-6056 $7,850 $7,850 $7,850 $7,850
(A) Explanation of LeaseCamp Dodge Army National Guard/Housing
(B) Explanation of Anticipated Expenditures Resulting from Rentals by Fiscal YearMaintenance and Repair
(C) Actual Use of Revenue Generated from Rentals in Prior YearReference Distribution of Revenues
(D) Explanation of Amendments Made to Existing LeasesNot Currently Available**
* LEASE: Multiple Leases $10,070 $10,070 $10,070 $10,070(A) Explanation of Lease
Dubuque/Housing(B) Explanation of Anticipated Expenditures Resulting from Rentals by Fiscal Year
Maintenance and Repair(C) Actual Use of Revenue Generated from Rentals in Prior Year
Reference Distribution of Revenues(D) Explanation of Amendments Made to Existing Leases
Not Currently Available**
* LEASE: Multiple Leases $335,895 $335,895 $335,895 $335,895(A) Explanation of Lease
Multiple Locations/Recreation(B) Explanation of Anticipated Expenditures Resulting from Rentals by Fiscal Year
Maintenance and Repair(C) Actual Use of Revenue Generated from Rentals in Prior Year
Reference Distribution of Revenues(D) Explanation of Amendments Made to Existing Leases
Not Currently Available**
196
Exhibit PB-34 Revenue from Leasing Out of DoD AssetsFebruary 2003
Ms. Valerie Turner/(703) 695-7174

DEPARTMENT OF THE ARMYFY 2004/2005 BIENNAL BUDGET ESTIMATES
REVENUE FROM LEASING OUT OF DEPARTMENT OF DEFENSE ASSETS
FY 2002 FY 2003 FY 2004 FY 2005
INDIANALEASE: DACA45-1-72-6106 $1,800 $1,800 $1,800 $1,800
(A) Explanation of LeaseUndisclosed Location/Banking
(B) Explanation of Anticipated Expenditures Resulting from Rentals by Fiscal YearMaintenance and Repair
(C) Actual Use of Revenue Generated from Rentals in Prior YearReference Distribution of Revenues
(D) Explanation of Amendments Made to Existing LeasesNot Currently Available**
LEASE: DACW27-1-74-107 $300 $300 $300 $300(A) Explanation of Lease
Brookville/Unspecified Purpose(B) Explanation of Anticipated Expenditures Resulting from Rentals by Fiscal Year
Maintenance and Repair(C) Actual Use of Revenue Generated from Rentals in Prior Year
Reference Distribution of Revenues(D) Explanation of Amendments Made to Existing Leases
Not Currently Available**
KANSASLEASE: Multiple Leases $17,000 $17,000 $17,000 $17,000
(A) Explanation of LeaseMultiple Locations/Recreation
(B) Explanation of Anticipated Expenditures Resulting from Rentals by Fiscal YearMaintenance and Repair
(C) Actual Use of Revenue Generated from Rentals in Prior YearReference Distribution of Revenues
(D) Explanation of Amendments Made to Existing LeasesNot Currently Available**
197
Exhibit PB-34 Revenue from Leasing Out of DoD AssetsFebruary 2003
Ms. Valerie Turner/(703) 695-7174

DEPARTMENT OF THE ARMYFY 2004/2005 BIENNAL BUDGET ESTIMATES
REVENUE FROM LEASING OUT OF DEPARTMENT OF DEFENSE ASSETS
FY 2002 FY 2003 FY 2004 FY 2005
LEASE: DA23-028ENG-9112 $1,560 $1,560 $1,560 $1,560(A) Explanation of Lease
Fort Riley/Banking(B) Explanation of Anticipated Expenditures Resulting from Rentals by Fiscal Year
Maintenance and Repair(C) Actual Use of Revenue Generated from Rentals in Prior Year
Reference Distribution of Revenues(D) Explanation of Amendments Made to Existing Leases
Not Currently Available**
LEASE: Multiple Leases $1,600 $1,600 $1,600 $1,600(A) Explanation of Lease
Fort Riley/Housing(B) Explanation of Anticipated Expenditures Resulting from Rentals by Fiscal Year
Maintenance and Repair(C) Actual Use of Revenue Generated from Rentals in Prior Year
Reference Distribution of Revenues(D) Explanation of Amendments Made to Existing Leases
Not Currently Available**
LEASE: Multiple Leases $29,159 $29,159 $29,159 $29,159(A) Explanation of Lease
Fort Leavenworth/Unspecified Purpose(B) Explanation of Anticipated Expenditures Resulting from Rentals by Fiscal Year
Maintenance and Repair(C) Actual Use of Revenue Generated from Rentals in Prior Year
Reference Distribution of Revenues(D) Explanation of Amendments Made to Existing Leases
Not Currently Available**
198
Exhibit PB-34 Revenue from Leasing Out of DoD AssetsFebruary 2003
Ms. Valerie Turner/(703) 695-7174

DEPARTMENT OF THE ARMYFY 2004/2005 BIENNAL BUDGET ESTIMATES
REVENUE FROM LEASING OUT OF DEPARTMENT OF DEFENSE ASSETS
FY 2002 FY 2003 FY 2004 FY 2005
LEASE: DACA41-1-98-549 $3,150 $3,150 $3,150 $3,150(A) Explanation of Lease
Fort Riley/Museum(B) Explanation of Anticipated Expenditures Resulting from Rentals by Fiscal Year
Maintenance and Repair(C) Actual Use of Revenue Generated from Rentals in Prior Year
Reference Distribution of Revenues(D) Explanation of Amendments Made to Existing Leases
Not Currently Available**
LEASE: DACA41-1-98-550 $6,000 $6,000 $6,000 $6,000(A) Explanation of Lease
Fort Riley/Storage(B) Explanation of Anticipated Expenditures Resulting from Rentals by Fiscal Year
Maintenance and Repair(C) Actual Use of Revenue Generated from Rentals in Prior Year
Reference Distribution of Revenues(D) Explanation of Amendments Made to Existing Leases
Not Currently Available**
LEASE: DACW41-1-98-553 $2,000 $2,000 $2,000 $2,000(A) Explanation of Lease
Fort Riley/Admin(B) Explanation of Anticipated Expenditures Resulting from Rentals by Fiscal Year
Maintenance and Repair(C) Actual Use of Revenue Generated from Rentals in Prior Year
Reference Distribution of Revenues(D) Explanation of Amendments Made to Existing Leases
Not Currently Available**
199
Exhibit PB-34 Revenue from Leasing Out of DoD AssetsFebruary 2003
Ms. Valerie Turner/(703) 695-7174

DEPARTMENT OF THE ARMYFY 2004/2005 BIENNAL BUDGET ESTIMATES
REVENUE FROM LEASING OUT OF DEPARTMENT OF DEFENSE ASSETS
FY 2002 FY 2003 FY 2004 FY 2005LEASE: DACW41-1-98-554 $2,500 $2,500 $2,500 $2,500
(A) Explanation of LeaseFort Riley/Operations
(B) Explanation of Anticipated Expenditures Resulting from Rentals by Fiscal YearMaintenance and Repair
(C) Actual Use of Revenue Generated from Rentals in Prior YearReference Distribution of Revenues
(D) Explanation of Amendments Made to Existing LeasesNot Currently Available**
LEASE: Mulitple Leases $18,379 $18,379 $15,879 $15,879(A) Explanation of Lease
Multiple Locations/Unspecified Purpose(B) Explanation of Anticipated Expenditures Resulting from Rentals by Fiscal Year
Maintenance and Repair(C) Actual Use of Revenue Generated from Rentals in Prior Year
Reference Distribution of Revenues(D) Explanation of Amendments Made to Existing Leases
Not Currently Available**
LEASE: Multiple Leases $135,150 $135,150 $135,150 $135,150(A) Explanation of Lease
DeSoto/Industrial(B) Explanation of Anticipated Expenditures Resulting from Rentals by Fiscal Year
Maintenance and Repair(C) Actual Use of Revenue Generated from Rentals in Prior Year
Reference Distribution of Revenues(D) Explanation of Amendments Made to Existing Leases
Not Currently Available**
200
Exhibit PB-34 Revenue from Leasing Out of DoD AssetsFebruary 2003
Ms. Valerie Turner/(703) 695-7174
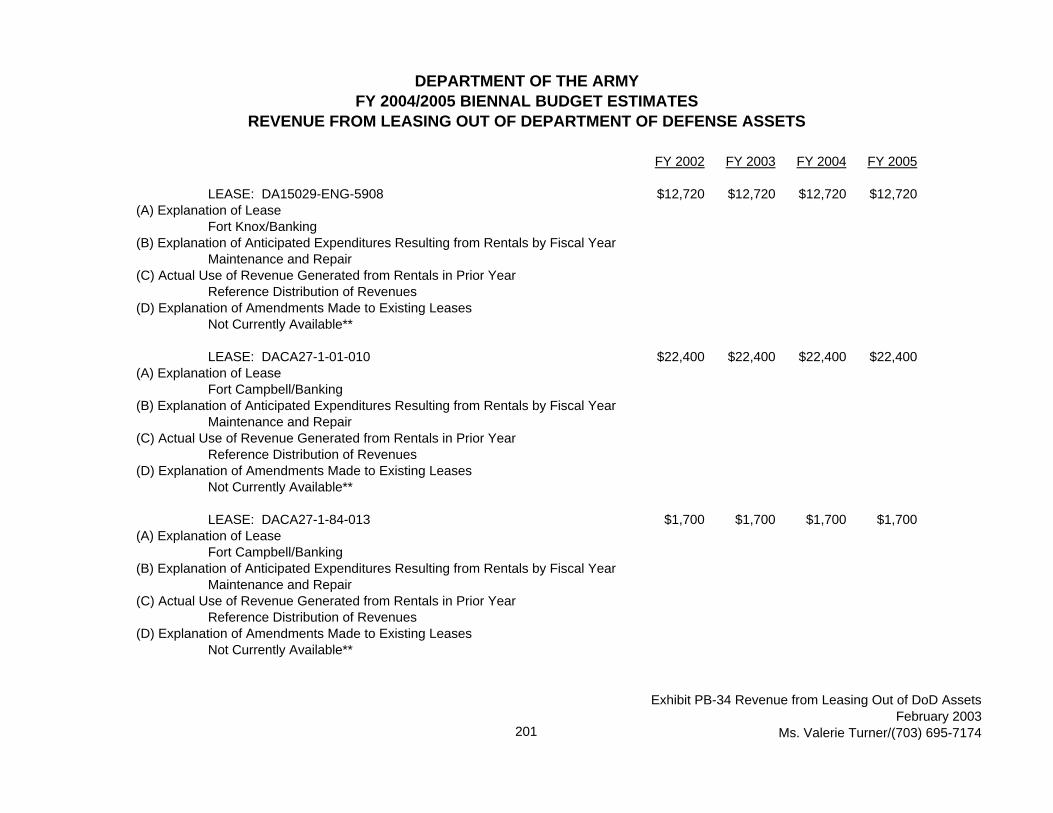
DEPARTMENT OF THE ARMYFY 2004/2005 BIENNAL BUDGET ESTIMATES
REVENUE FROM LEASING OUT OF DEPARTMENT OF DEFENSE ASSETS
FY 2002 FY 2003 FY 2004 FY 2005
LEASE: DA15029-ENG-5908 $12,720 $12,720 $12,720 $12,720(A) Explanation of Lease
Fort Knox/Banking(B) Explanation of Anticipated Expenditures Resulting from Rentals by Fiscal Year
Maintenance and Repair(C) Actual Use of Revenue Generated from Rentals in Prior Year
Reference Distribution of Revenues(D) Explanation of Amendments Made to Existing Leases
Not Currently Available**
LEASE: DACA27-1-01-010 $22,400 $22,400 $22,400 $22,400(A) Explanation of Lease
Fort Campbell/Banking(B) Explanation of Anticipated Expenditures Resulting from Rentals by Fiscal Year
Maintenance and Repair(C) Actual Use of Revenue Generated from Rentals in Prior Year
Reference Distribution of Revenues(D) Explanation of Amendments Made to Existing Leases
Not Currently Available**
LEASE: DACA27-1-84-013 $1,700 $1,700 $1,700 $1,700(A) Explanation of Lease
Fort Campbell/Banking(B) Explanation of Anticipated Expenditures Resulting from Rentals by Fiscal Year
Maintenance and Repair(C) Actual Use of Revenue Generated from Rentals in Prior Year
Reference Distribution of Revenues(D) Explanation of Amendments Made to Existing Leases
Not Currently Available**
201
Exhibit PB-34 Revenue from Leasing Out of DoD AssetsFebruary 2003
Ms. Valerie Turner/(703) 695-7174
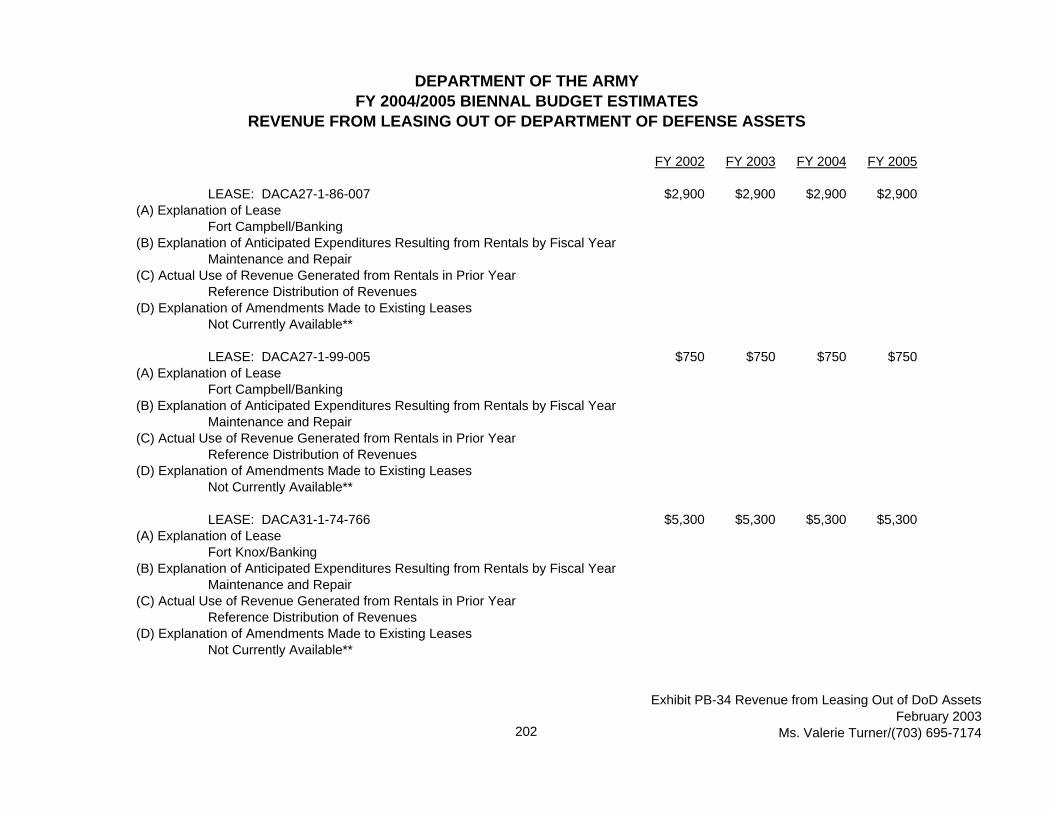
DEPARTMENT OF THE ARMYFY 2004/2005 BIENNAL BUDGET ESTIMATES
REVENUE FROM LEASING OUT OF DEPARTMENT OF DEFENSE ASSETS
FY 2002 FY 2003 FY 2004 FY 2005
LEASE: DACA27-1-86-007 $2,900 $2,900 $2,900 $2,900(A) Explanation of Lease
Fort Campbell/Banking(B) Explanation of Anticipated Expenditures Resulting from Rentals by Fiscal Year
Maintenance and Repair(C) Actual Use of Revenue Generated from Rentals in Prior Year
Reference Distribution of Revenues(D) Explanation of Amendments Made to Existing Leases
Not Currently Available**
LEASE: DACA27-1-99-005 $750 $750 $750 $750(A) Explanation of Lease
Fort Campbell/Banking(B) Explanation of Anticipated Expenditures Resulting from Rentals by Fiscal Year
Maintenance and Repair(C) Actual Use of Revenue Generated from Rentals in Prior Year
Reference Distribution of Revenues(D) Explanation of Amendments Made to Existing Leases
Not Currently Available**
LEASE: DACA31-1-74-766 $5,300 $5,300 $5,300 $5,300(A) Explanation of Lease
Fort Knox/Banking(B) Explanation of Anticipated Expenditures Resulting from Rentals by Fiscal Year
Maintenance and Repair(C) Actual Use of Revenue Generated from Rentals in Prior Year
Reference Distribution of Revenues(D) Explanation of Amendments Made to Existing Leases
Not Currently Available**
202
Exhibit PB-34 Revenue from Leasing Out of DoD AssetsFebruary 2003
Ms. Valerie Turner/(703) 695-7174

DEPARTMENT OF THE ARMYFY 2004/2005 BIENNAL BUDGET ESTIMATES
REVENUE FROM LEASING OUT OF DEPARTMENT OF DEFENSE ASSETS
FY 2002 FY 2003 FY 2004 FY 2005
LEASE: DACA31-1-77-241 $500 $500 $500 $500(A) Explanation of Lease
Fort Knox/Banking(B) Explanation of Anticipated Expenditures Resulting from Rentals by Fiscal Year
Maintenance and Repair(C) Actual Use of Revenue Generated from Rentals in Prior Year
Reference Distribution of Revenues(D) Explanation of Amendments Made to Existing Leases
Not Currently Available**
LEASE: Multiple Leases $6,630 $6,630 $6,630 $6,630(A) Explanation of Lease
Multiple Locations/Housing(B) Explanation of Anticipated Expenditures Resulting from Rentals by Fiscal Year
Maintenance and Repair(C) Actual Use of Revenue Generated from Rentals in Prior Year
Reference Distribution of Revenues(D) Explanation of Amendments Made to Existing Leases
Not Currently Available**
LEASE: Multiple Leases $86,215 $86,215 $86,215 $86,215(A) Explanation of Lease
Multiple Locations/Recreation(B) Explanation of Anticipated Expenditures Resulting from Rentals by Fiscal Year
Maintenance and Repair(C) Actual Use of Revenue Generated from Rentals in Prior Year
Reference Distribution of Revenues(D) Explanation of Amendments Made to Existing Leases
Not Currently Available**
203
Exhibit PB-34 Revenue from Leasing Out of DoD AssetsFebruary 2003
Ms. Valerie Turner/(703) 695-7174

DEPARTMENT OF THE ARMYFY 2004/2005 BIENNAL BUDGET ESTIMATES
REVENUE FROM LEASING OUT OF DEPARTMENT OF DEFENSE ASSETS
FY 2002 FY 2003 FY 2004 FY 2005
LEASE: DACW62-1-95-0033 $5,135 $5,135 $5,135 $5,135(A) Explanation of Lease
Grand Rivers/Industrial(B) Explanation of Anticipated Expenditures Resulting from Rentals by Fiscal Year
Maintenance and Repair(C) Actual Use of Revenue Generated from Rentals in Prior Year
Reference Distribution of Revenues(D) Explanation of Amendments Made to Existing Leases
Not Currently Available**
LEASE: DACA27-1-02-417 $33,000 $33,000 $33,000 $33,000(A) Explanation of Lease
Fort Campbell/Banking(B) Explanation of Anticipated Expenditures Resulting from Rentals by Fiscal Year
Maintenance and Repair(C) Actual Use of Revenue Generated from Rentals in Prior Year
Reference Distribution of Revenues(D) Explanation of Amendments Made to Existing Leases
Not Currently Available**
LEASE: Multiple Leases $31,389 $31,389 $31,389 $31,389(A) Explanation of Lease
Multiple Locations/Unspecified Purpose(B) Explanation of Anticipated Expenditures Resulting from Rentals by Fiscal Year
Maintenance and Repair(C) Actual Use of Revenue Generated from Rentals in Prior Year
Reference Distribution of Revenues(D) Explanation of Amendments Made to Existing Leases
Not Currently Available**
204
Exhibit PB-34 Revenue from Leasing Out of DoD AssetsFebruary 2003
Ms. Valerie Turner/(703) 695-7174
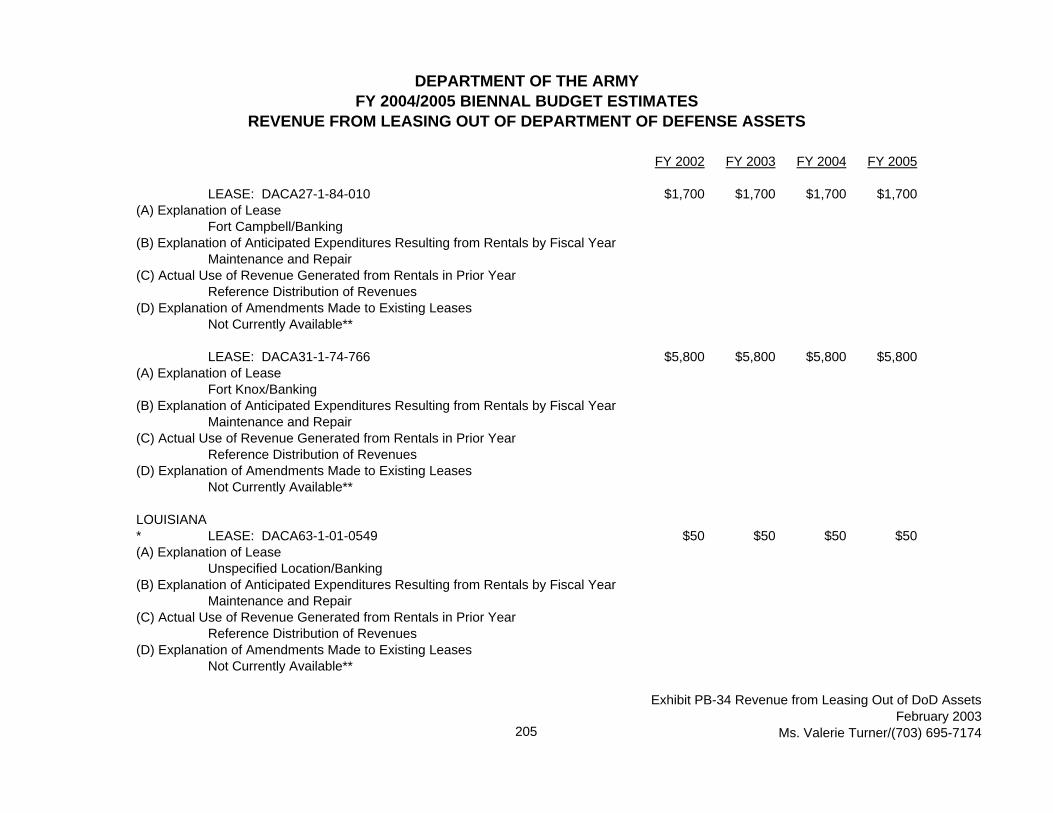
DEPARTMENT OF THE ARMYFY 2004/2005 BIENNAL BUDGET ESTIMATES
REVENUE FROM LEASING OUT OF DEPARTMENT OF DEFENSE ASSETS
FY 2002 FY 2003 FY 2004 FY 2005
LEASE: DACA27-1-84-010 $1,700 $1,700 $1,700 $1,700(A) Explanation of Lease
Fort Campbell/Banking(B) Explanation of Anticipated Expenditures Resulting from Rentals by Fiscal Year
Maintenance and Repair(C) Actual Use of Revenue Generated from Rentals in Prior Year
Reference Distribution of Revenues(D) Explanation of Amendments Made to Existing Leases
Not Currently Available**
LEASE: DACA31-1-74-766 $5,800 $5,800 $5,800 $5,800(A) Explanation of Lease
Fort Knox/Banking(B) Explanation of Anticipated Expenditures Resulting from Rentals by Fiscal Year
Maintenance and Repair(C) Actual Use of Revenue Generated from Rentals in Prior Year
Reference Distribution of Revenues(D) Explanation of Amendments Made to Existing Leases
Not Currently Available**
LOUISIANA* LEASE: DACA63-1-01-0549 $50 $50 $50 $50(A) Explanation of Lease
Unspecified Location/Banking(B) Explanation of Anticipated Expenditures Resulting from Rentals by Fiscal Year
Maintenance and Repair(C) Actual Use of Revenue Generated from Rentals in Prior Year
Reference Distribution of Revenues(D) Explanation of Amendments Made to Existing Leases
Not Currently Available**
205
Exhibit PB-34 Revenue from Leasing Out of DoD AssetsFebruary 2003
Ms. Valerie Turner/(703) 695-7174

DEPARTMENT OF THE ARMYFY 2004/2005 BIENNAL BUDGET ESTIMATES
REVENUE FROM LEASING OUT OF DEPARTMENT OF DEFENSE ASSETS
FY 2002 FY 2003 FY 2004 FY 2005
* LEASE: DACA63-1-01-0555 $16,000 $16,000 $16,000 $16,000(A) Explanation of Lease
Unspecified Location/Banking(B) Explanation of Anticipated Expenditures Resulting from Rentals by Fiscal Year
Maintenance and Repair(C) Actual Use of Revenue Generated from Rentals in Prior Year
Reference Distribution of Revenues(D) Explanation of Amendments Made to Existing Leases
Not Currently Available**
* LEASE: DACA63-1-76-0617 $1,020 $1,020 $1,020 $1,020(A) Explanation of Lease
Unspecified Location/Industrial(B) Explanation of Anticipated Expenditures Resulting from Rentals by Fiscal Year
Maintenance and Repair(C) Actual Use of Revenue Generated from Rentals in Prior Year
Reference Distribution of Revenues(D) Explanation of Amendments Made to Existing Leases
Not Currently Available**
* LEASE: DACA63-1-84-0607 $2,400 $2,400 $2,400 $2,400(A) Explanation of Lease
Unspecified Location/Banking(B) Explanation of Anticipated Expenditures Resulting from Rentals by Fiscal Year
Maintenance and Repair(C) Actual Use of Revenue Generated from Rentals in Prior Year
Reference Distribution of Revenues(D) Explanation of Amendments Made to Existing Leases
Not Currently Available**
206
Exhibit PB-34 Revenue from Leasing Out of DoD AssetsFebruary 2003
Ms. Valerie Turner/(703) 695-7174

DEPARTMENT OF THE ARMYFY 2004/2005 BIENNAL BUDGET ESTIMATES
REVENUE FROM LEASING OUT OF DEPARTMENT OF DEFENSE ASSETS
FY 2002 FY 2003 FY 2004 FY 2005
* LEASE: DACA63-1-98-0552 $3,600 $3,600 $3,600 $3,600(A) Explanation of Lease
Fort Polk/Admin(B) Explanation of Anticipated Expenditures Resulting from Rentals by Fiscal Year
Maintenance and Repair(C) Actual Use of Revenue Generated from Rentals in Prior Year
Reference Distribution of Revenues(D) Explanation of Amendments Made to Existing Leases
Not Currently Available**
* LEASE: DACA63-1-98-0553 $2,000 $2,000 $2,000 $2,000(A) Explanation of Lease
Unspecified Location/Industrial(B) Explanation of Anticipated Expenditures Resulting from Rentals by Fiscal Year
Maintenance and Repair(C) Actual Use of Revenue Generated from Rentals in Prior Year
Reference Distribution of Revenues(D) Explanation of Amendments Made to Existing Leases
Not Currently Available**
* LEASE: DACA63-1-98-0554 $50 $50 $50 $50(A) Explanation of Lease
Unspecified Location/Banking(B) Explanation of Anticipated Expenditures Resulting from Rentals by Fiscal Year
Maintenance and Repair(C) Actual Use of Revenue Generated from Rentals in Prior Year
Reference Distribution of Revenues(D) Explanation of Amendments Made to Existing Leases
Not Currently Available**
207
Exhibit PB-34 Revenue from Leasing Out of DoD AssetsFebruary 2003
Ms. Valerie Turner/(703) 695-7174

DEPARTMENT OF THE ARMYFY 2004/2005 BIENNAL BUDGET ESTIMATES
REVENUE FROM LEASING OUT OF DEPARTMENT OF DEFENSE ASSETS
FY 2002 FY 2003 FY 2004 FY 2005
* LEASE: DACA63-1-99-0542 $50 $50 $50 $50(A) Explanation of Lease
Unspecified Location/Banking(B) Explanation of Anticipated Expenditures Resulting from Rentals by Fiscal Year
Maintenance and Repair(C) Actual Use of Revenue Generated from Rentals in Prior Year
Reference Distribution of Revenues(D) Explanation of Amendments Made to Existing Leases
Not Currently Available**
LEASE: DACW29-1-96-18 $2,600 $2,600 $2,600 $2,600(A) Explanation of Lease
Venice/Industrial(B) Explanation of Anticipated Expenditures Resulting from Rentals by Fiscal Year
Maintenance and Repair(C) Actual Use of Revenue Generated from Rentals in Prior Year
Reference Distribution of Revenues(D) Explanation of Amendments Made to Existing Leases
Not Currently Available**
LEASE: Multiple Leases $6,833 $5,428 $5,428 $5,428(A) Explanation of Lease
Venice/Unspecified Purpose(B) Explanation of Anticipated Expenditures Resulting from Rentals by Fiscal Year
Maintenance and Repair(C) Actual Use of Revenue Generated from Rentals in Prior Year
Reference Distribution of Revenues(D) Explanation of Amendments Made to Existing Leases
Not Currently Available**
208
Exhibit PB-34 Revenue from Leasing Out of DoD AssetsFebruary 2003
Ms. Valerie Turner/(703) 695-7174

DEPARTMENT OF THE ARMYFY 2004/2005 BIENNAL BUDGET ESTIMATES
REVENUE FROM LEASING OUT OF DEPARTMENT OF DEFENSE ASSETS
FY 2002 FY 2003 FY 2004 FY 2005
MAINE* LEASE: DACA51-1-78-493 $250 $250 $250 $250(A) Explanation of Lease
Bedford/Banking(B) Explanation of Anticipated Expenditures Resulting from Rentals by Fiscal Year
Maintenance and Repair(C) Actual Use of Revenue Generated from Rentals in Prior Year
Reference Distribution of Revenues(D) Explanation of Amendments Made to Existing Leases
Not Currently Available**
MASSACHUSETTSLEASE: DACW33-1-93-28 $200 $200 $200 $200
(A) Explanation of LeaseFiskdale/Recreation
(B) Explanation of Anticipated Expenditures Resulting from Rentals by Fiscal YearMaintenance and Repair
(C) Actual Use of Revenue Generated from Rentals in Prior YearReference Distribution of Revenues
(D) Explanation of Amendments Made to Existing LeasesNot Currently Available**
LEASE: DACW33-1-98-37 $27 $27 $27 $27(A) Explanation of Lease
Charleston/Storage(B) Explanation of Anticipated Expenditures Resulting from Rentals by Fiscal Year
Maintenance and Repair(C) Actual Use of Revenue Generated from Rentals in Prior Year
Reference Distribution of Revenues(D) Explanation of Amendments Made to Existing Leases
Not Currently Available**
209
Exhibit PB-34 Revenue from Leasing Out of DoD AssetsFebruary 2003
Ms. Valerie Turner/(703) 695-7174

DEPARTMENT OF THE ARMYFY 2004/2005 BIENNAL BUDGET ESTIMATES
REVENUE FROM LEASING OUT OF DEPARTMENT OF DEFENSE ASSETS
FY 2002 FY 2003 FY 2004 FY 2005
LEASE: Multiple Leases $30,184 $30,184 $30,184 $30,184(A) Explanation of Lease
Multiple Locations/Unspecified Purpose(B) Explanation of Anticipated Expenditures Resulting from Rentals by Fiscal Year
Maintenance and Repair(C) Actual Use of Revenue Generated from Rentals in Prior Year
Reference Distribution of Revenues(D) Explanation of Amendments Made to Existing Leases
Not Currently Available**
LEASE: Multiple Leases $3,818 $3,818 $3,818 $3,818(A) Explanation of Lease
Fort Meade/Housing(B) Explanation of Anticipated Expenditures Resulting from Rentals by Fiscal Year
Maintenance and Repair(C) Actual Use of Revenue Generated from Rentals in Prior Year
Reference Distribution of Revenues(D) Explanation of Amendments Made to Existing Leases
Not Currently Available**
LEASE: DACA31-1-84-121 $621 $621 $621 $621(A) Explanation of Lease
Aberdeen Proving Grounds/Banking(B) Explanation of Anticipated Expenditures Resulting from Rentals by Fiscal Year
Maintenance and Repair(C) Actual Use of Revenue Generated from Rentals in Prior Year
Reference Distribution of Revenues(D) Explanation of Amendments Made to Existing Leases
Not Currently Available**
210
Exhibit PB-34 Revenue from Leasing Out of DoD AssetsFebruary 2003
Ms. Valerie Turner/(703) 695-7174

DEPARTMENT OF THE ARMYFY 2004/2005 BIENNAL BUDGET ESTIMATES
REVENUE FROM LEASING OUT OF DEPARTMENT OF DEFENSE ASSETS
FY 2002 FY 2003 FY 2004 FY 2005
LEASE: DA49-080-ENG-794 $100 $100 $100 $100(A) Explanation of Lease
Aberdeen Proving Grounds/Housing(B) Explanation of Anticipated Expenditures Resulting from Rentals by Fiscal Year
Maintenance and Repair(C) Actual Use of Revenue Generated from Rentals in Prior Year
Reference Distribution of Revenues(D) Explanation of Amendments Made to Existing Leases
Not Currently Available**
LEASE: DA49-080-ENG-739 $100 $100 $100 $100(A) Explanation of Lease
Fort Meade/Education(B) Explanation of Anticipated Expenditures Resulting from Rentals by Fiscal Year
Maintenance and Repair(C) Actual Use of Revenue Generated from Rentals in Prior Year
Reference Distribution of Revenues(D) Explanation of Amendments Made to Existing Leases
Not Currently Available**
LEASE: DACA31-1-00-0286 $16,000 $16,000 $16,000 $16,000(A) Explanation of Lease
Aberdeen Proving Ground/Banking(B) Explanation of Anticipated Expenditures Resulting from Rentals by Fiscal Year
Maintenance and Repair(C) Actual Use of Revenue Generated from Rentals in Prior Year
Reference Distribution of Revenues(D) Explanation of Amendments Made to Existing Leases
Not Currently Available**
211
Exhibit PB-34 Revenue from Leasing Out of DoD AssetsFebruary 2003
Ms. Valerie Turner/(703) 695-7174

DEPARTMENT OF THE ARMYFY 2004/2005 BIENNAL BUDGET ESTIMATES
REVENUE FROM LEASING OUT OF DEPARTMENT OF DEFENSE ASSETS
FY 2002 FY 2003 FY 2004 FY 2005
LEASE: DACA31-1-2000-0246 $20,088 $20,088 $20,088 $20,088(A) Explanation of Lease
Fort Meade/Banking(B) Explanation of Anticipated Expenditures Resulting from Rentals by Fiscal Year
Maintenance and Repair(C) Actual Use of Revenue Generated from Rentals in Prior Year
Reference Distribution of Revenues(D) Explanation of Amendments Made to Existing Leases
Not Currently Available**
LEASE: 31-4-00-799 $22,500 $22,500 $22,500 $22,500(A) Explanation of Lease
Fort Meade/Administrative(B) Explanation of Anticipated Expenditures Resulting from Rentals by Fiscal Year
Maintenance and Repair(C) Actual Use of Revenue Generated from Rentals in Prior Year
Reference Distribution of Revenues(D) Explanation of Amendments Made to Existing Leases
Not Currently Available**
LEASE: DA49-080ENG-3918 $150 $150 $150 $150(A) Explanation of Lease
Fort Meade/Education(B) Explanation of Anticipated Expenditures Resulting from Rentals by Fiscal Year
Maintenance and Repair(C) Actual Use of Revenue Generated from Rentals in Prior Year
Reference Distribution of Revenues(D) Explanation of Amendments Made to Existing Leases
Not Currently Available**
212
Exhibit PB-34 Revenue from Leasing Out of DoD AssetsFebruary 2003
Ms. Valerie Turner/(703) 695-7174

DEPARTMENT OF THE ARMYFY 2004/2005 BIENNAL BUDGET ESTIMATES
REVENUE FROM LEASING OUT OF DEPARTMENT OF DEFENSE ASSETS
FY 2002 FY 2003 FY 2004 FY 2005
LEASE: DACA31-4-97-634 $1,000 $1,000 $1,000 $1,000(A) Explanation of Lease
Fort Meade/Education(B) Explanation of Anticipated Expenditures Resulting from Rentals by Fiscal Year
Maintenance and Repair(C) Actual Use of Revenue Generated from Rentals in Prior Year
Reference Distribution of Revenues(D) Explanation of Amendments Made to Existing Leases
Not Currently Available**
LEASE: Mulitple Leases $104,918 $56,374 $36,774 $36,774(A) Explanation of Lease
Mulitple Locations/Unspecified Purpose(B) Explanation of Anticipated Expenditures Resulting from Rentals by Fiscal Year
Maintenance and Repair(C) Actual Use of Revenue Generated from Rentals in Prior Year
Reference Distribution of Revenues(D) Explanation of Amendments Made to Existing Leases
Not Currently Available**
LEASE: Multiple Leases $564 $564 $564 $564(A) Explanation of Lease
Elkton/Recreation(B) Explanation of Anticipated Expenditures Resulting from Rentals by Fiscal Year
Maintenance and Repair(C) Actual Use of Revenue Generated from Rentals in Prior Year
Reference Distribution of Revenues(D) Explanation of Amendments Made to Existing Leases
Not Currently Available**
213
Exhibit PB-34 Revenue from Leasing Out of DoD AssetsFebruary 2003
Ms. Valerie Turner/(703) 695-7174
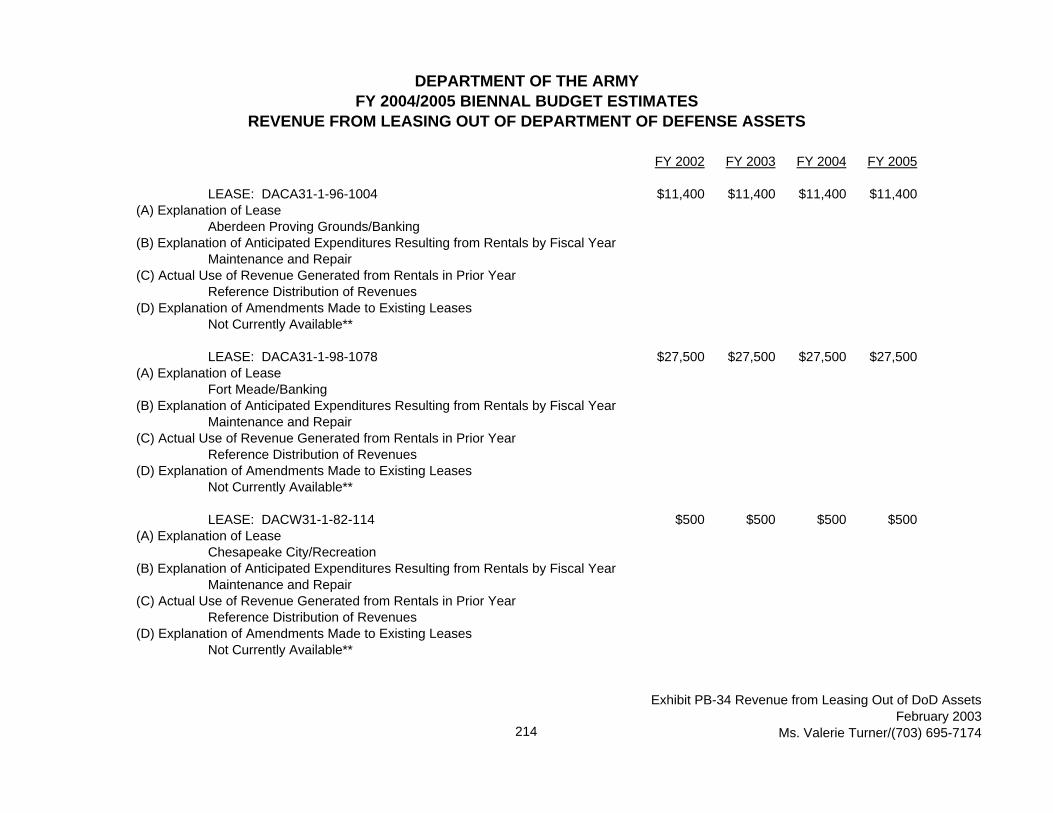
DEPARTMENT OF THE ARMYFY 2004/2005 BIENNAL BUDGET ESTIMATES
REVENUE FROM LEASING OUT OF DEPARTMENT OF DEFENSE ASSETS
FY 2002 FY 2003 FY 2004 FY 2005
LEASE: DACA31-1-96-1004 $11,400 $11,400 $11,400 $11,400(A) Explanation of Lease
Aberdeen Proving Grounds/Banking(B) Explanation of Anticipated Expenditures Resulting from Rentals by Fiscal Year
Maintenance and Repair(C) Actual Use of Revenue Generated from Rentals in Prior Year
Reference Distribution of Revenues(D) Explanation of Amendments Made to Existing Leases
Not Currently Available**
LEASE: DACA31-1-98-1078 $27,500 $27,500 $27,500 $27,500(A) Explanation of Lease
Fort Meade/Banking(B) Explanation of Anticipated Expenditures Resulting from Rentals by Fiscal Year
Maintenance and Repair(C) Actual Use of Revenue Generated from Rentals in Prior Year
Reference Distribution of Revenues(D) Explanation of Amendments Made to Existing Leases
Not Currently Available**
LEASE: DACW31-1-82-114 $500 $500 $500 $500(A) Explanation of Lease
Chesapeake City/Recreation(B) Explanation of Anticipated Expenditures Resulting from Rentals by Fiscal Year
Maintenance and Repair(C) Actual Use of Revenue Generated from Rentals in Prior Year
Reference Distribution of Revenues(D) Explanation of Amendments Made to Existing Leases
Not Currently Available**
214
Exhibit PB-34 Revenue from Leasing Out of DoD AssetsFebruary 2003
Ms. Valerie Turner/(703) 695-7174

DEPARTMENT OF THE ARMYFY 2004/2005 BIENNAL BUDGET ESTIMATES
REVENUE FROM LEASING OUT OF DEPARTMENT OF DEFENSE ASSETS
FY 2002 FY 2003 FY 2004 FY 2005
MICHIGANLEASE: DACW22-1-73-0012 $8,490 $8,490 $8,490 $8,490
(A) Explanation of LeaseDetroit Arsenal/Industrial
(B) Explanation of Anticipated Expenditures Resulting from Rentals by Fiscal YearMaintenance and Repair
(C) Actual Use of Revenue Generated from Rentals in Prior YearReference Distribution of Revenues
(D) Explanation of Amendments Made to Existing LeasesNot Currently Available**
LEASE: DACW35-1-89-3001 $32,500 $32,500 $32,500 $32,500(A) Explanation of Lease
Holland/Unspecified Purpose(B) Explanation of Anticipated Expenditures Resulting from Rentals by Fiscal Year
Maintenance and Repair(C) Actual Use of Revenue Generated from Rentals in Prior Year
Reference Distribution of Revenues(D) Explanation of Amendments Made to Existing Leases
Not Currently Available**
LEASE: Mulitple Leases $3,745 $45 $45 $45(A) Explanation of Lease
Multiple Locations/Unspecified Purpose(B) Explanation of Anticipated Expenditures Resulting from Rentals by Fiscal Year
Maintenance and Repair(C) Actual Use of Revenue Generated from Rentals in Prior Year
Reference Distribution of Revenues(D) Explanation of Amendments Made to Existing Leases
Not Currently Available**
215
Exhibit PB-34 Revenue from Leasing Out of DoD AssetsFebruary 2003
Ms. Valerie Turner/(703) 695-7174

DEPARTMENT OF THE ARMYFY 2004/2005 BIENNAL BUDGET ESTIMATES
REVENUE FROM LEASING OUT OF DEPARTMENT OF DEFENSE ASSETS
FY 2002 FY 2003 FY 2004 FY 2005
LEASE: DA23065CIV6229 $1,750 $1,750 $1,750 $1,750(A) Explanation of Lease
Saint Louis/Industrial(B) Explanation of Anticipated Expenditures Resulting from Rentals by Fiscal Year
Maintenance and Repair(C) Actual Use of Revenue Generated from Rentals in Prior Year
Reference Distribution of Revenues(D) Explanation of Amendments Made to Existing Leases
Not Currently Available**
LEASE: DA23065CIV6244 $34,060 $34,060 $34,060 $34,060(A) Explanation of Lease
Saint Louis/Industrial(B) Explanation of Anticipated Expenditures Resulting from Rentals by Fiscal Year
Maintenance and Repair(C) Actual Use of Revenue Generated from Rentals in Prior Year
Reference Distribution of Revenues(D) Explanation of Amendments Made to Existing Leases
Not Currently Available**
LEASE: DA23065CIV6531 $22,550 $22,550 $22,550 $22,550(A) Explanation of Lease
Clarksville/Industrial(B) Explanation of Anticipated Expenditures Resulting from Rentals by Fiscal Year
Maintenance and Repair(C) Actual Use of Revenue Generated from Rentals in Prior Year
Reference Distribution of Revenues(D) Explanation of Amendments Made to Existing Leases
Not Currently Available**
216
Exhibit PB-34 Revenue from Leasing Out of DoD AssetsFebruary 2003
Ms. Valerie Turner/(703) 695-7174
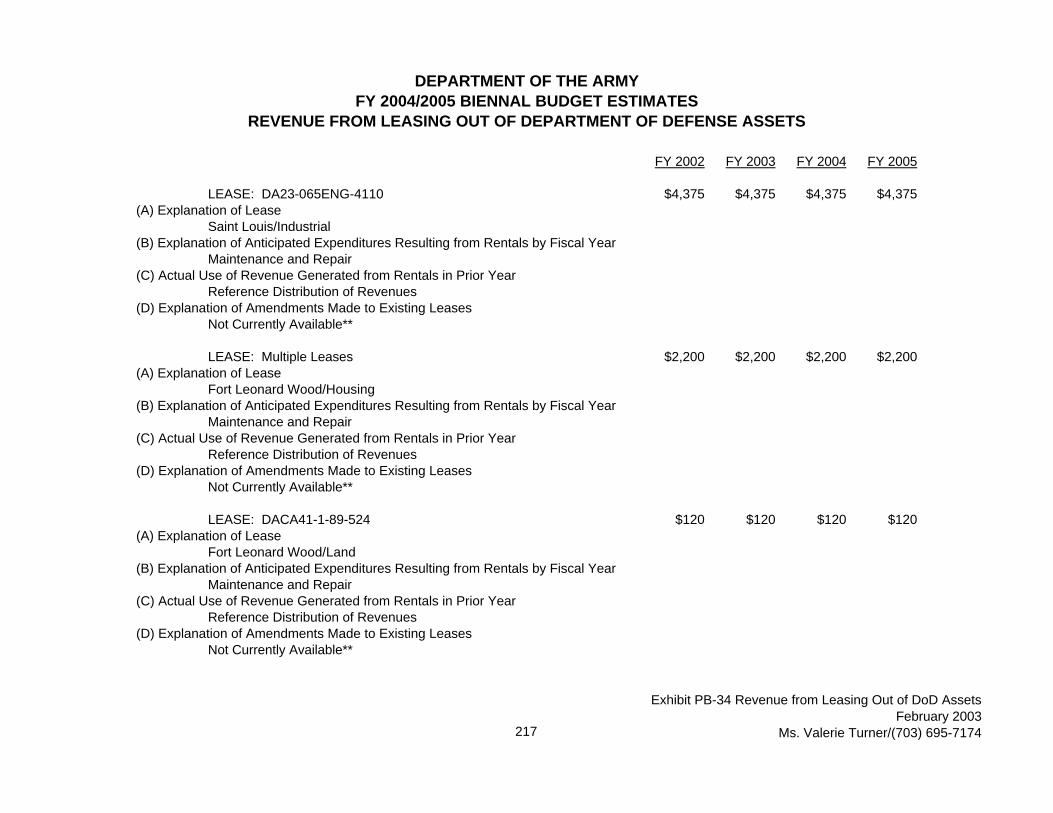
DEPARTMENT OF THE ARMYFY 2004/2005 BIENNAL BUDGET ESTIMATES
REVENUE FROM LEASING OUT OF DEPARTMENT OF DEFENSE ASSETS
FY 2002 FY 2003 FY 2004 FY 2005
LEASE: DA23-065ENG-4110 $4,375 $4,375 $4,375 $4,375(A) Explanation of Lease
Saint Louis/Industrial(B) Explanation of Anticipated Expenditures Resulting from Rentals by Fiscal Year
Maintenance and Repair(C) Actual Use of Revenue Generated from Rentals in Prior Year
Reference Distribution of Revenues(D) Explanation of Amendments Made to Existing Leases
Not Currently Available**
LEASE: Multiple Leases $2,200 $2,200 $2,200 $2,200(A) Explanation of Lease
Fort Leonard Wood/Housing(B) Explanation of Anticipated Expenditures Resulting from Rentals by Fiscal Year
Maintenance and Repair(C) Actual Use of Revenue Generated from Rentals in Prior Year
Reference Distribution of Revenues(D) Explanation of Amendments Made to Existing Leases
Not Currently Available**
LEASE: DACA41-1-89-524 $120 $120 $120 $120(A) Explanation of Lease
Fort Leonard Wood/Land(B) Explanation of Anticipated Expenditures Resulting from Rentals by Fiscal Year
Maintenance and Repair(C) Actual Use of Revenue Generated from Rentals in Prior Year
Reference Distribution of Revenues(D) Explanation of Amendments Made to Existing Leases
Not Currently Available**
217
Exhibit PB-34 Revenue from Leasing Out of DoD AssetsFebruary 2003
Ms. Valerie Turner/(703) 695-7174

DEPARTMENT OF THE ARMYFY 2004/2005 BIENNAL BUDGET ESTIMATES
REVENUE FROM LEASING OUT OF DEPARTMENT OF DEFENSE ASSETS
FY 2002 FY 2003 FY 2004 FY 2005
LEASE: DACW43-1-97-22 $3,500 $3,500 $3,500 $3,500(A) Explanation of Lease
Clarksville/Industrial(B) Explanation of Anticipated Expenditures Resulting from Rentals by Fiscal Year
Maintenance and Repair(C) Actual Use of Revenue Generated from Rentals in Prior Year
Reference Distribution of Revenues(D) Explanation of Amendments Made to Existing Leases
Not Currently Available**
LEASE: DACW43-1-98-2 $5,900 $5,900 $5,900 $5,900(A) Explanation of Lease
Saint Louis/Industrial(B) Explanation of Anticipated Expenditures Resulting from Rentals by Fiscal Year
Maintenance and Repair(C) Actual Use of Revenue Generated from Rentals in Prior Year
Reference Distribution of Revenues(D) Explanation of Amendments Made to Existing Leases
Not Currently Available**
LEASE: DACW43-1-98-34 $5,265 $5,265 $5,265 $5,265(A) Explanation of Lease
Clarksville/Industrial(B) Explanation of Anticipated Expenditures Resulting from Rentals by Fiscal Year
Maintenance and Repair(C) Actual Use of Revenue Generated from Rentals in Prior Year
Reference Distribution of Revenues(D) Explanation of Amendments Made to Existing Leases
Not Currently Available**
218
Exhibit PB-34 Revenue from Leasing Out of DoD AssetsFebruary 2003
Ms. Valerie Turner/(703) 695-7174

DEPARTMENT OF THE ARMYFY 2004/2005 BIENNAL BUDGET ESTIMATES
REVENUE FROM LEASING OUT OF DEPARTMENT OF DEFENSE ASSETS
FY 2002 FY 2003 FY 2004 FY 2005
LEASE: Multiple Leases $47,868 $47,868 $38,968 $38,968(A) Explanation of Lease
Multiple Locations/Recreation(B) Explanation of Anticipated Expenditures Resulting from Rentals by Fiscal Year
Maintenance and Repair(C) Actual Use of Revenue Generated from Rentals in Prior Year
Reference Distribution of Revenues(D) Explanation of Amendments Made to Existing Leases
Not Currently Available**
LEASE: Multiple Leases $10,075 $10,075 $10,075 $10,075(A) Explanation of Lease
Ft. Leonard Wood/Banking(B) Explanation of Anticipated Expenditures Resulting from Rentals by Fiscal Year
Maintenance and Repair(C) Actual Use of Revenue Generated from Rentals in Prior Year
Reference Distribution of Revenues(D) Explanation of Amendments Made to Existing Leases
Not Currently Available**
LEASE: Multiple Leases $28,015 $17,565 $16,365 $16,365(A) Explanation of Lease
Multiple Locations/Unspecified Purpose(B) Explanation of Anticipated Expenditures Resulting from Rentals by Fiscal Year
Maintenance and Repair(C) Actual Use of Revenue Generated from Rentals in Prior Year
Reference Distribution of Revenues(D) Explanation of Amendments Made to Existing Leases
Not Currently Available**
219
Exhibit PB-34 Revenue from Leasing Out of DoD AssetsFebruary 2003
Ms. Valerie Turner/(703) 695-7174
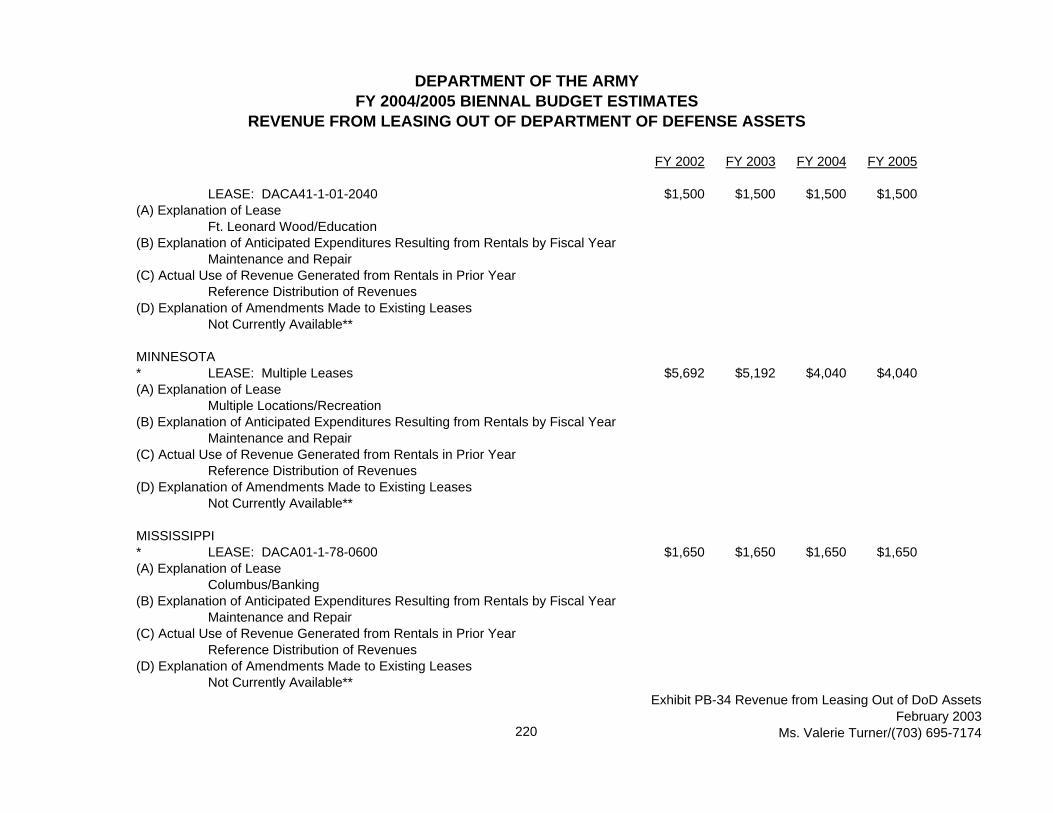
DEPARTMENT OF THE ARMYFY 2004/2005 BIENNAL BUDGET ESTIMATES
REVENUE FROM LEASING OUT OF DEPARTMENT OF DEFENSE ASSETS
FY 2002 FY 2003 FY 2004 FY 2005
LEASE: DACA41-1-01-2040 $1,500 $1,500 $1,500 $1,500(A) Explanation of Lease
Ft. Leonard Wood/Education(B) Explanation of Anticipated Expenditures Resulting from Rentals by Fiscal Year
Maintenance and Repair(C) Actual Use of Revenue Generated from Rentals in Prior Year
Reference Distribution of Revenues(D) Explanation of Amendments Made to Existing Leases
Not Currently Available**
MINNESOTA* LEASE: Multiple Leases $5,692 $5,192 $4,040 $4,040(A) Explanation of Lease
Multiple Locations/Recreation(B) Explanation of Anticipated Expenditures Resulting from Rentals by Fiscal Year
Maintenance and Repair(C) Actual Use of Revenue Generated from Rentals in Prior Year
Reference Distribution of Revenues(D) Explanation of Amendments Made to Existing Leases
Not Currently Available**
MISSISSIPPI* LEASE: DACA01-1-78-0600 $1,650 $1,650 $1,650 $1,650(A) Explanation of Lease
Columbus/Banking(B) Explanation of Anticipated Expenditures Resulting from Rentals by Fiscal Year
Maintenance and Repair(C) Actual Use of Revenue Generated from Rentals in Prior Year
Reference Distribution of Revenues(D) Explanation of Amendments Made to Existing Leases
Not Currently Available**
220
Exhibit PB-34 Revenue from Leasing Out of DoD AssetsFebruary 2003
Ms. Valerie Turner/(703) 695-7174
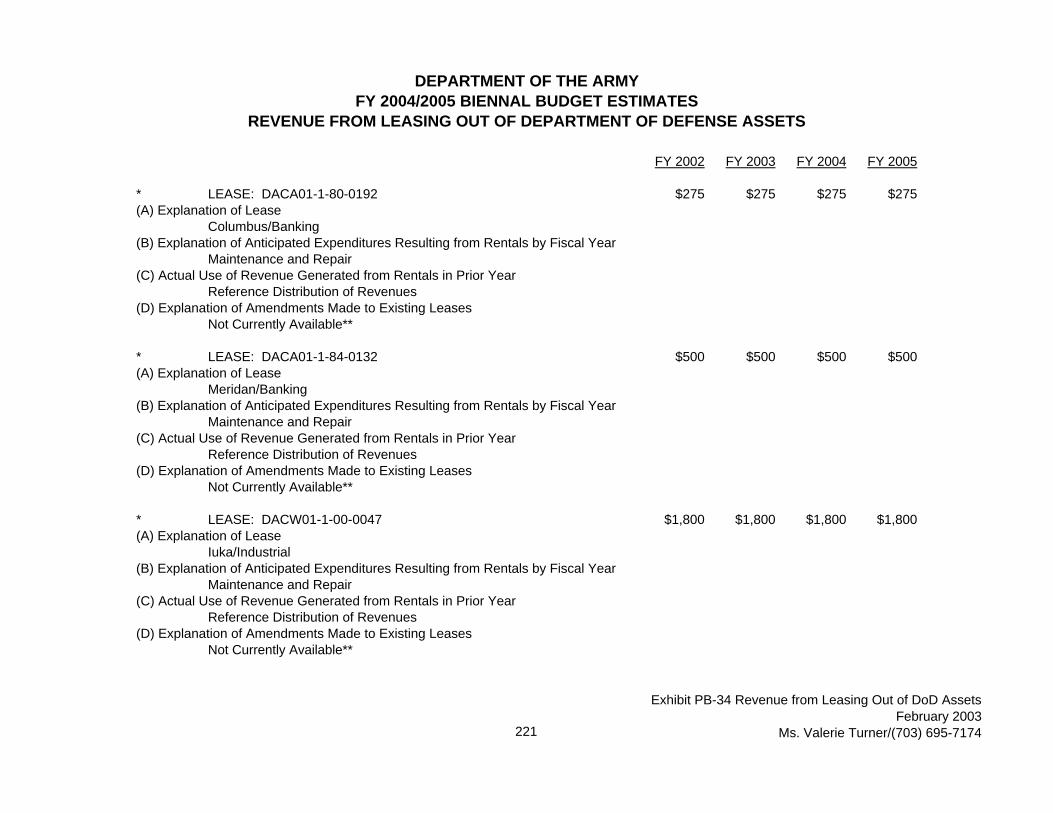
DEPARTMENT OF THE ARMYFY 2004/2005 BIENNAL BUDGET ESTIMATES
REVENUE FROM LEASING OUT OF DEPARTMENT OF DEFENSE ASSETS
FY 2002 FY 2003 FY 2004 FY 2005
* LEASE: DACA01-1-80-0192 $275 $275 $275 $275(A) Explanation of Lease
Columbus/Banking(B) Explanation of Anticipated Expenditures Resulting from Rentals by Fiscal Year
Maintenance and Repair(C) Actual Use of Revenue Generated from Rentals in Prior Year
Reference Distribution of Revenues(D) Explanation of Amendments Made to Existing Leases
Not Currently Available**
* LEASE: DACA01-1-84-0132 $500 $500 $500 $500(A) Explanation of Lease
Meridan/Banking(B) Explanation of Anticipated Expenditures Resulting from Rentals by Fiscal Year
Maintenance and Repair(C) Actual Use of Revenue Generated from Rentals in Prior Year
Reference Distribution of Revenues(D) Explanation of Amendments Made to Existing Leases
Not Currently Available**
* LEASE: DACW01-1-00-0047 $1,800 $1,800 $1,800 $1,800(A) Explanation of Lease
Iuka/Industrial(B) Explanation of Anticipated Expenditures Resulting from Rentals by Fiscal Year
Maintenance and Repair(C) Actual Use of Revenue Generated from Rentals in Prior Year
Reference Distribution of Revenues(D) Explanation of Amendments Made to Existing Leases
Not Currently Available**
221
Exhibit PB-34 Revenue from Leasing Out of DoD AssetsFebruary 2003
Ms. Valerie Turner/(703) 695-7174
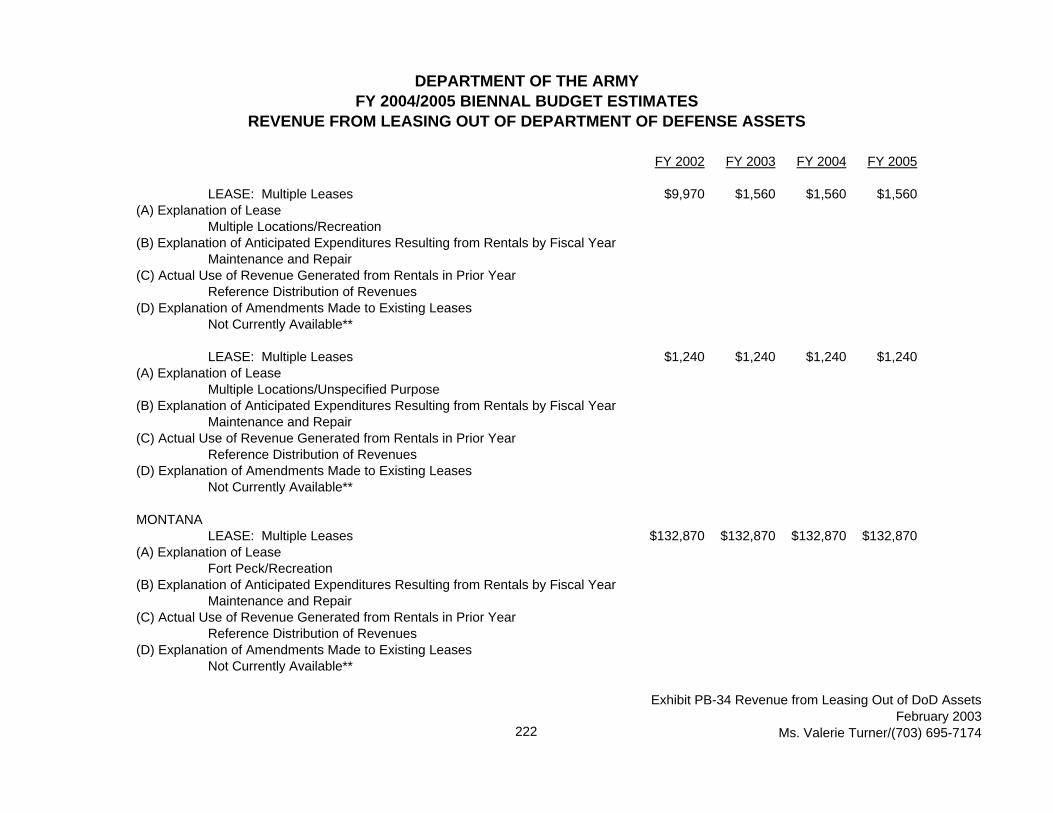
DEPARTMENT OF THE ARMYFY 2004/2005 BIENNAL BUDGET ESTIMATES
REVENUE FROM LEASING OUT OF DEPARTMENT OF DEFENSE ASSETS
FY 2002 FY 2003 FY 2004 FY 2005
LEASE: Multiple Leases $9,970 $1,560 $1,560 $1,560(A) Explanation of Lease
Multiple Locations/Recreation(B) Explanation of Anticipated Expenditures Resulting from Rentals by Fiscal Year
Maintenance and Repair(C) Actual Use of Revenue Generated from Rentals in Prior Year
Reference Distribution of Revenues(D) Explanation of Amendments Made to Existing Leases
Not Currently Available**
LEASE: Multiple Leases $1,240 $1,240 $1,240 $1,240(A) Explanation of Lease
Multiple Locations/Unspecified Purpose(B) Explanation of Anticipated Expenditures Resulting from Rentals by Fiscal Year
Maintenance and Repair(C) Actual Use of Revenue Generated from Rentals in Prior Year
Reference Distribution of Revenues(D) Explanation of Amendments Made to Existing Leases
Not Currently Available**
MONTANALEASE: Multiple Leases $132,870 $132,870 $132,870 $132,870
(A) Explanation of LeaseFort Peck/Recreation
(B) Explanation of Anticipated Expenditures Resulting from Rentals by Fiscal YearMaintenance and Repair
(C) Actual Use of Revenue Generated from Rentals in Prior YearReference Distribution of Revenues
(D) Explanation of Amendments Made to Existing LeasesNot Currently Available**
222
Exhibit PB-34 Revenue from Leasing Out of DoD AssetsFebruary 2003
Ms. Valerie Turner/(703) 695-7174

DEPARTMENT OF THE ARMYFY 2004/2005 BIENNAL BUDGET ESTIMATES
REVENUE FROM LEASING OUT OF DEPARTMENT OF DEFENSE ASSETS
FY 2002 FY 2003 FY 2004 FY 2005
NEBRASKALEASE: Multiple Leases $323,112 $250,539 $56,271 $56,271
(A) Explanation of LeaseCornhusker AAP/Storage
(B) Explanation of Anticipated Expenditures Resulting from Rentals by Fiscal YearMaintenance and Repair
(C) Actual Use of Revenue Generated from Rentals in Prior YearReference Distribution of Revenues
(D) Explanation of Amendments Made to Existing LeasesNot Currently Available**
LEASE: Multiple Leases $8,945 $8,945 $8,945 $8,945(A) Explanation of Lease
Republican City/Recreation(B) Explanation of Anticipated Expenditures Resulting from Rentals by Fiscal Year
Maintenance and Repair(C) Actual Use of Revenue Generated from Rentals in Prior Year
Reference Distribution of Revenues(D) Explanation of Amendments Made to Existing Leases
Not Currently Available**
LEASE: Multiple Leases $29,898 $29,898 $29,898 $29,898(A) Explanation of Lease
Mead/Unspecified Purpose(B) Explanation of Anticipated Expenditures Resulting from Rentals by Fiscal Year
Maintenance and Repair(C) Actual Use of Revenue Generated from Rentals in Prior Year
Reference Distribution of Revenues(D) Explanation of Amendments Made to Existing Leases
Not Currently Available**
223
Exhibit PB-34 Revenue from Leasing Out of DoD AssetsFebruary 2003
Ms. Valerie Turner/(703) 695-7174

DEPARTMENT OF THE ARMYFY 2004/2005 BIENNAL BUDGET ESTIMATES
REVENUE FROM LEASING OUT OF DEPARTMENT OF DEFENSE ASSETS
FY 2002 FY 2003 FY 2004 FY 2005
NEVADALEASE: DACA05-1-98-516 $150 $150 $150 $150
(A) Explanation of LeaseHawthorne/Unspecified Purpose
(B) Explanation of Anticipated Expenditures Resulting from Rentals by Fiscal YearMaintenance and Repair
(C) Actual Use of Revenue Generated from Rentals in Prior YearReference Distribution of Revenues
(D) Explanation of Amendments Made to Existing LeasesNot Currently Available**
NEW HAMPSHIRELEASE: DACW33-1-95-5 $440 $440 $440 $440
(A) Explanation of LeaseKeene/Recreation
(B) Explanation of Anticipated Expenditures Resulting from Rentals by Fiscal YearMaintenance and Repair
(C) Actual Use of Revenue Generated from Rentals in Prior YearReference Distribution of Revenues
(D) Explanation of Amendments Made to Existing LeasesNot Currently Available**
LEASE: Mulitple Leases $320 $320 $320 $320(A) Explanation of Lease
Multiple Locations/Unspecified Purpose(B) Explanation of Anticipated Expenditures Resulting from Rentals by Fiscal Year
Maintenance and Repair(C) Actual Use of Revenue Generated from Rentals in Prior Year
Reference Distribution of Revenues(D) Explanation of Amendments Made to Existing Leases
Not Currently Available**
224
Exhibit PB-34 Revenue from Leasing Out of DoD AssetsFebruary 2003
Ms. Valerie Turner/(703) 695-7174
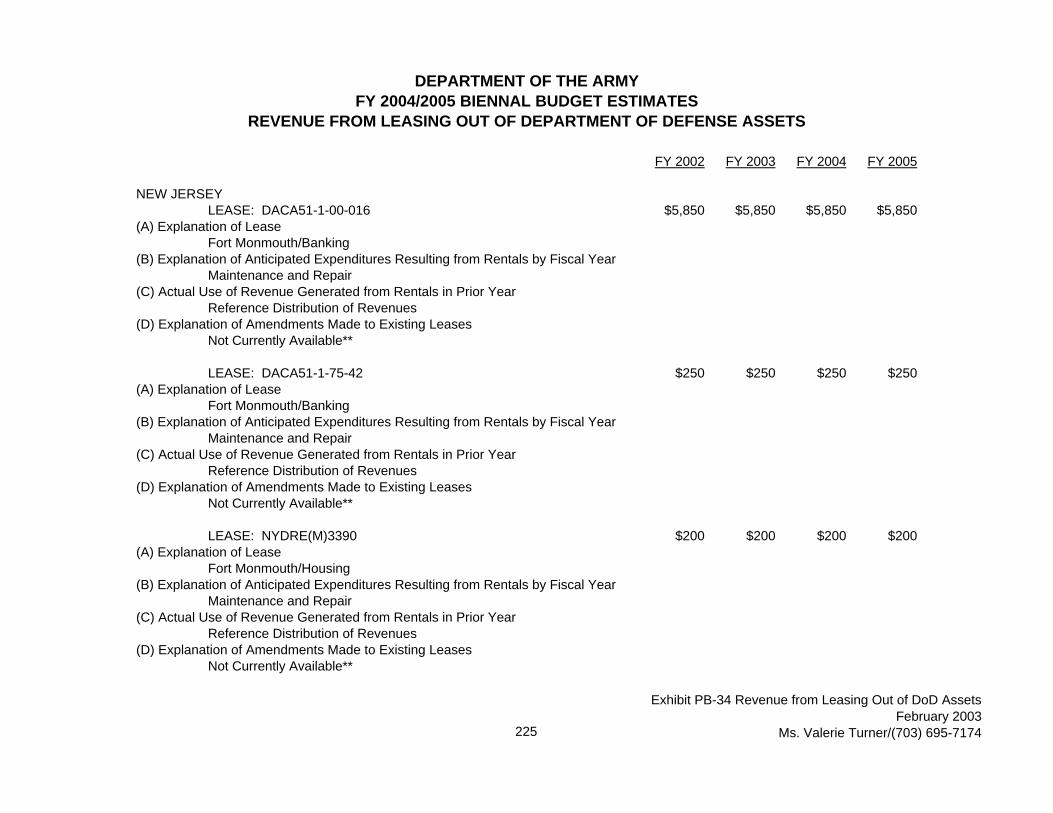
DEPARTMENT OF THE ARMYFY 2004/2005 BIENNAL BUDGET ESTIMATES
REVENUE FROM LEASING OUT OF DEPARTMENT OF DEFENSE ASSETS
FY 2002 FY 2003 FY 2004 FY 2005
NEW JERSEYLEASE: DACA51-1-00-016 $5,850 $5,850 $5,850 $5,850
(A) Explanation of LeaseFort Monmouth/Banking
(B) Explanation of Anticipated Expenditures Resulting from Rentals by Fiscal YearMaintenance and Repair
(C) Actual Use of Revenue Generated from Rentals in Prior YearReference Distribution of Revenues
(D) Explanation of Amendments Made to Existing LeasesNot Currently Available**
LEASE: DACA51-1-75-42 $250 $250 $250 $250(A) Explanation of Lease
Fort Monmouth/Banking(B) Explanation of Anticipated Expenditures Resulting from Rentals by Fiscal Year
Maintenance and Repair(C) Actual Use of Revenue Generated from Rentals in Prior Year
Reference Distribution of Revenues(D) Explanation of Amendments Made to Existing Leases
Not Currently Available**
LEASE: NYDRE(M)3390 $200 $200 $200 $200(A) Explanation of Lease
Fort Monmouth/Housing(B) Explanation of Anticipated Expenditures Resulting from Rentals by Fiscal Year
Maintenance and Repair(C) Actual Use of Revenue Generated from Rentals in Prior Year
Reference Distribution of Revenues(D) Explanation of Amendments Made to Existing Leases
Not Currently Available**
225
Exhibit PB-34 Revenue from Leasing Out of DoD AssetsFebruary 2003
Ms. Valerie Turner/(703) 695-7174

DEPARTMENT OF THE ARMYFY 2004/2005 BIENNAL BUDGET ESTIMATES
REVENUE FROM LEASING OUT OF DEPARTMENT OF DEFENSE ASSETS
FY 2002 FY 2003 FY 2004 FY 2005
LEASE: NYDRE(M)3670 $200 $200 $200 $200(A) Explanation of Lease
Fort Monmouth/Housing(B) Explanation of Anticipated Expenditures Resulting from Rentals by Fiscal Year
Maintenance and Repair(C) Actual Use of Revenue Generated from Rentals in Prior Year
Reference Distribution of Revenues(D) Explanation of Amendments Made to Existing Leases
Not Currently Available**
LEASE: NYDRE(M)3670(A) Explanation of Lease $421,913 $421,870 $421,870 $421,870
Fort Monmouth/Housing(B) Explanation of Anticipated Expenditures Resulting from Rentals by Fiscal Year
Maintenance and Repair(C) Actual Use of Revenue Generated from Rentals in Prior Year
Reference Distribution of Revenues(D) Explanation of Amendments Made to Existing Leases
Not Currently Available**
NEW MEXICOLEASE: Multiple Leases $1,578 $1,098 $1,098 $1,098
(A) Explanation of LeaseMultiple Leases/Unspecified Purpose
(B) Explanation of Anticipated Expenditures Resulting from Rentals by Fiscal YearMaintenance and Repair
(C) Actual Use of Revenue Generated from Rentals in Prior YearReference Distribution of Revenues
(D) Explanation of Amendments Made to Existing LeasesNot Currently Available**
226
Exhibit PB-34 Revenue from Leasing Out of DoD AssetsFebruary 2003
Ms. Valerie Turner/(703) 695-7174

DEPARTMENT OF THE ARMYFY 2004/2005 BIENNAL BUDGET ESTIMATES
REVENUE FROM LEASING OUT OF DEPARTMENT OF DEFENSE ASSETS
FY 2002 FY 2003 FY 2004 FY 2005
LEASE: DACA47-1-95-156 $10 $10 $10 $10(A) Explanation of Lease
Abiquiu/Housing(B) Explanation of Anticipated Expenditures Resulting from Rentals by Fiscal Year
Maintenance and Repair(C) Actual Use of Revenue Generated from Rentals in Prior Year
Reference Distribution of Revenues(D) Explanation of Amendments Made to Existing Leases
Not Currently Available**
LEASE: DACW47-1-00-0008 $480 $480 $480 $480(A) Explanation of Lease
Conchas Dam/recreation(B) Explanation of Anticipated Expenditures Resulting from Rentals by Fiscal Year
Maintenance and Repair(C) Actual Use of Revenue Generated from Rentals in Prior Year
Reference Distribution of Revenues(D) Explanation of Amendments Made to Existing Leases
Not Currently Available**
NEW YORKLEASE: DACA51-1-00-050 $2,124 $2,124 $2,124 $2,124
(A) Explanation of LeaseFort Drum/Industrial
(B) Explanation of Anticipated Expenditures Resulting from Rentals by Fiscal YearMaintenance and Repair
(C) Actual Use of Revenue Generated from Rentals in Prior YearReference Distribution of Revenues
(D) Explanation of Amendments Made to Existing LeasesNot Currently Available**
227
Exhibit PB-34 Revenue from Leasing Out of DoD AssetsFebruary 2003
Ms. Valerie Turner/(703) 695-7174

DEPARTMENT OF THE ARMYFY 2004/2005 BIENNAL BUDGET ESTIMATES
REVENUE FROM LEASING OUT OF DEPARTMENT OF DEFENSE ASSETS
FY 2002 FY 2003 FY 2004 FY 2005
LEASE: Multiple Leases $2,825 $2,825 $2,825 $2,825(A) Explanation of Lease
Mulitple Locations/Unspecified Purpose(B) Explanation of Anticipated Expenditures Resulting from Rentals by Fiscal Year
Maintenance and Repair(C) Actual Use of Revenue Generated from Rentals in Prior Year
Reference Distribution of Revenues(D) Explanation of Amendments Made to Existing Leases
Not Currently Available**
NORTH CAROLINALEASE: DACA21-1-00-3414 & 3418 $36,860 $36,860 $36,860 $36,860
(A) Explanation of LeaseFort BraggCommunications Centers
(B) Explanation of Anticipated Expenditures Resulting from Rentals by Fiscal YearMaintenance and Repair
(C) Actual Use of Revenue Generated from Rentals in Prior YearReference Distribution of Revenues
(D) Explanation of Amendments Made to Existing LeasesNot Currently Available**
LEASE: Multiple Leases $12,540 $12,540 $12,540 $12,540(A) Explanation of Lease
Fort Bragg/Banking(B) Explanation of Anticipated Expenditures Resulting from Rentals by Fiscal Year
Maintenance and Repair(C) Actual Use of Revenue Generated from Rentals in Prior Year
Reference Distribution of Revenues(D) Explanation of Amendments Made to Existing Leases
Not Currently Available**
228
Exhibit PB-34 Revenue from Leasing Out of DoD AssetsFebruary 2003
Ms. Valerie Turner/(703) 695-7174
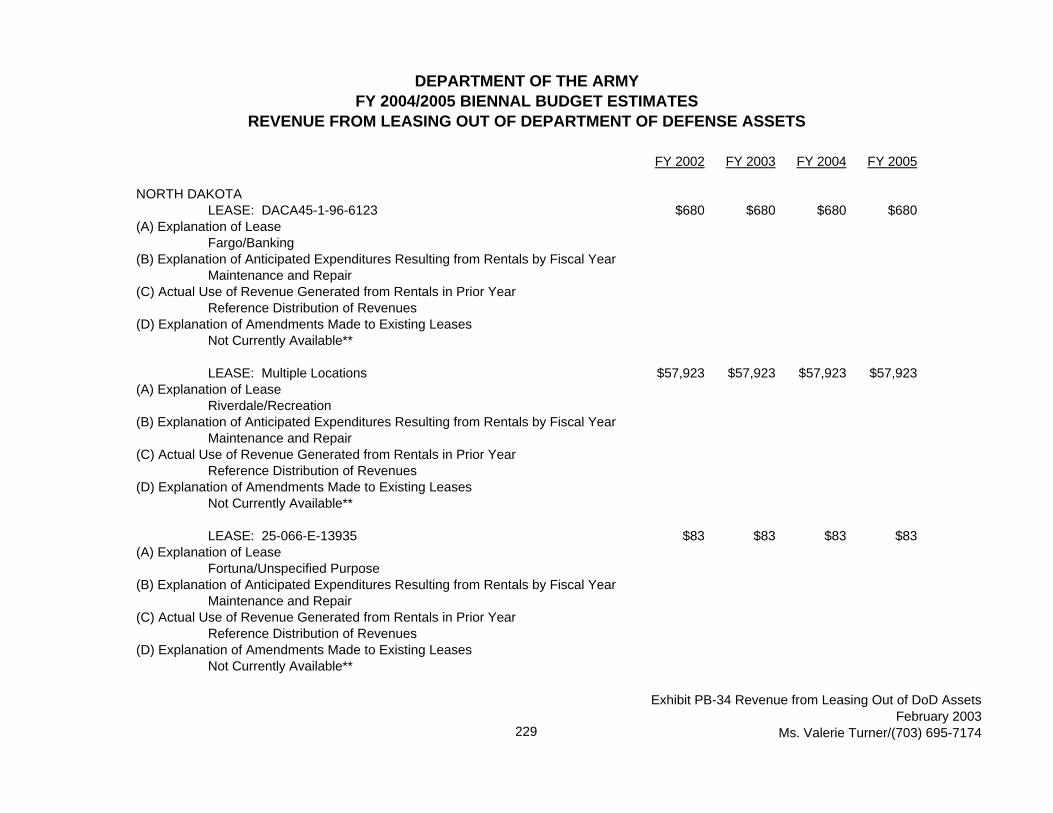
DEPARTMENT OF THE ARMYFY 2004/2005 BIENNAL BUDGET ESTIMATES
REVENUE FROM LEASING OUT OF DEPARTMENT OF DEFENSE ASSETS
FY 2002 FY 2003 FY 2004 FY 2005
NORTH DAKOTALEASE: DACA45-1-96-6123 $680 $680 $680 $680
(A) Explanation of LeaseFargo/Banking
(B) Explanation of Anticipated Expenditures Resulting from Rentals by Fiscal YearMaintenance and Repair
(C) Actual Use of Revenue Generated from Rentals in Prior YearReference Distribution of Revenues
(D) Explanation of Amendments Made to Existing LeasesNot Currently Available**
LEASE: Multiple Locations $57,923 $57,923 $57,923 $57,923(A) Explanation of Lease
Riverdale/Recreation(B) Explanation of Anticipated Expenditures Resulting from Rentals by Fiscal Year
Maintenance and Repair(C) Actual Use of Revenue Generated from Rentals in Prior Year
Reference Distribution of Revenues(D) Explanation of Amendments Made to Existing Leases
Not Currently Available**
LEASE: 25-066-E-13935 $83 $83 $83 $83(A) Explanation of Lease
Fortuna/Unspecified Purpose(B) Explanation of Anticipated Expenditures Resulting from Rentals by Fiscal Year
Maintenance and Repair(C) Actual Use of Revenue Generated from Rentals in Prior Year
Reference Distribution of Revenues(D) Explanation of Amendments Made to Existing Leases
Not Currently Available**
229
Exhibit PB-34 Revenue from Leasing Out of DoD AssetsFebruary 2003
Ms. Valerie Turner/(703) 695-7174
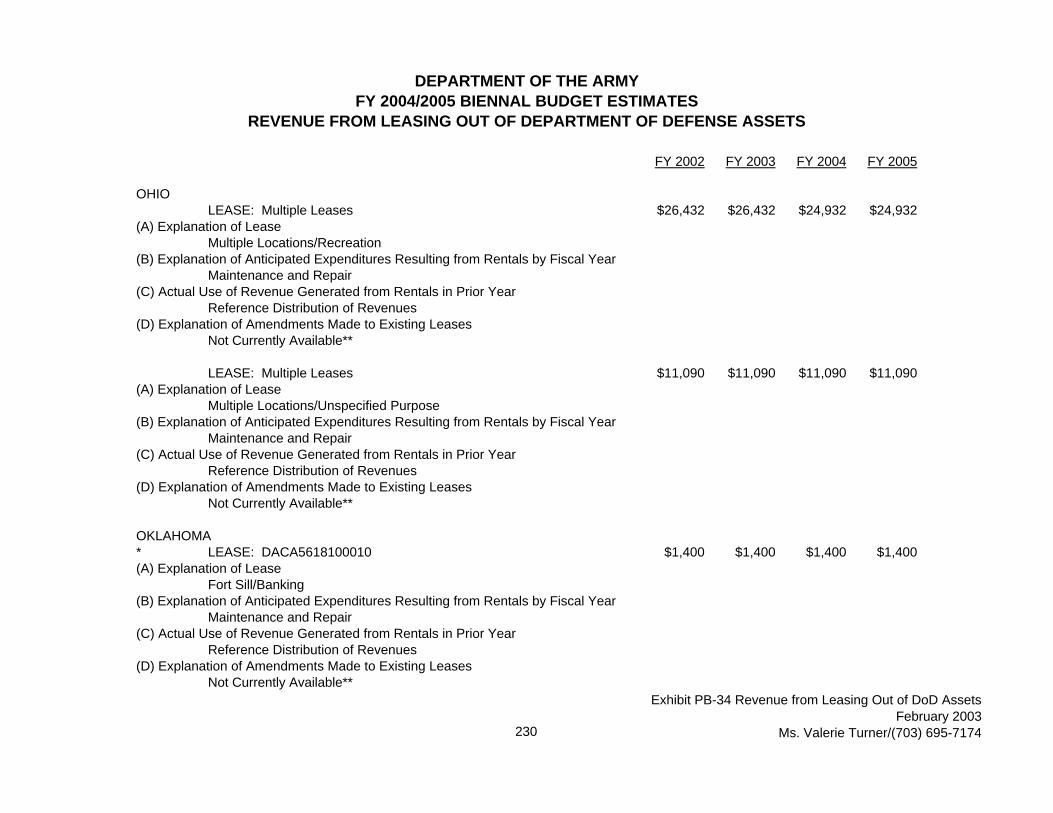
DEPARTMENT OF THE ARMYFY 2004/2005 BIENNAL BUDGET ESTIMATES
REVENUE FROM LEASING OUT OF DEPARTMENT OF DEFENSE ASSETS
FY 2002 FY 2003 FY 2004 FY 2005
OHIOLEASE: Multiple Leases $26,432 $26,432 $24,932 $24,932
(A) Explanation of LeaseMultiple Locations/Recreation
(B) Explanation of Anticipated Expenditures Resulting from Rentals by Fiscal YearMaintenance and Repair
(C) Actual Use of Revenue Generated from Rentals in Prior YearReference Distribution of Revenues
(D) Explanation of Amendments Made to Existing LeasesNot Currently Available**
LEASE: Multiple Leases $11,090 $11,090 $11,090 $11,090(A) Explanation of Lease
Multiple Locations/Unspecified Purpose(B) Explanation of Anticipated Expenditures Resulting from Rentals by Fiscal Year
Maintenance and Repair(C) Actual Use of Revenue Generated from Rentals in Prior Year
Reference Distribution of Revenues(D) Explanation of Amendments Made to Existing Leases
Not Currently Available**
OKLAHOMA* LEASE: DACA5618100010 $1,400 $1,400 $1,400 $1,400(A) Explanation of Lease
Fort Sill/Banking(B) Explanation of Anticipated Expenditures Resulting from Rentals by Fiscal Year
Maintenance and Repair(C) Actual Use of Revenue Generated from Rentals in Prior Year
Reference Distribution of Revenues(D) Explanation of Amendments Made to Existing Leases
Not Currently Available**
230
Exhibit PB-34 Revenue from Leasing Out of DoD AssetsFebruary 2003
Ms. Valerie Turner/(703) 695-7174

DEPARTMENT OF THE ARMYFY 2004/2005 BIENNAL BUDGET ESTIMATES
REVENUE FROM LEASING OUT OF DEPARTMENT OF DEFENSE ASSETS
FY 2002 FY 2003 FY 2004 FY 2005
* LEASE: DACA5618400010 $8,175 $8,175 $8,175 $8,175(A) Explanation of Lease
Fort Sill/Banking(B) Explanation of Anticipated Expenditures Resulting from Rentals by Fiscal Year
Maintenance and Repair(C) Actual Use of Revenue Generated from Rentals in Prior Year
Reference Distribution of Revenues(D) Explanation of Amendments Made to Existing Leases
Not Currently Available**
* LEASE: 290005E0003897 $31,495 $31,495 $31,495 $31,495(A) Explanation of Lease
Fort Sill/Banking(B) Explanation of Anticipated Expenditures Resulting from Rentals by Fiscal Year
Maintenance and Repair(C) Actual Use of Revenue Generated from Rentals in Prior Year
Reference Distribution of Revenues(D) Explanation of Amendments Made to Existing Leases
Not Currently Available**
* LEASE: Multiple Leases $800 $800 $800 $800(A) Explanation of Lease
Undisclosed Location/Housing(B) Explanation of Anticipated Expenditures Resulting from Rentals by Fiscal Year
Maintenance and Repair(C) Actual Use of Revenue Generated from Rentals in Prior Year
Reference Distribution of Revenues(D) Explanation of Amendments Made to Existing Leases
Not Currently Available**
231
Exhibit PB-34 Revenue from Leasing Out of DoD AssetsFebruary 2003
Ms. Valerie Turner/(703) 695-7174

DEPARTMENT OF THE ARMYFY 2004/2005 BIENNAL BUDGET ESTIMATES
REVENUE FROM LEASING OUT OF DEPARTMENT OF DEFENSE ASSETS
FY 2002 FY 2003 FY 2004 FY 2005
* LEASE: Multiple Leases $61,340 $47,670 $45,510 $45,510(A) Explanation of Lease
Multiple Locations/Recreation(B) Explanation of Anticipated Expenditures Resulting from Rentals by Fiscal Year
Maintenance and Repair(C) Actual Use of Revenue Generated from Rentals in Prior Year
Reference Distribution of Revenues(D) Explanation of Amendments Made to Existing Leases
Not Currently Available**
* LEASE: Multiple Leases $8,804 $8,804 $8,804 $8,804(A) Explanation of Lease
Multiple Locations/Industrial(B) Explanation of Anticipated Expenditures Resulting from Rentals by Fiscal Year
Maintenance and Repair(C) Actual Use of Revenue Generated from Rentals in Prior Year
Reference Distribution of Revenues(D) Explanation of Amendments Made to Existing Leases
Not Currently Available**
OREGONLEASE: Multiple Leases $15,968 $15,968 $15,968 $15,968
(A) Explanation of LeaseUmatilla/Multiple Purposes
(B) Explanation of Anticipated Expenditures Resulting from Rentals by Fiscal YearMaintenance and Repair
(C) Actual Use of Revenue Generated from Rentals in Prior YearReference Distribution of Revenues
(D) Explanation of Amendments Made to Existing LeasesNot Currently Available**
232
Exhibit PB-34 Revenue from Leasing Out of DoD AssetsFebruary 2003
Ms. Valerie Turner/(703) 695-7174

DEPARTMENT OF THE ARMYFY 2004/2005 BIENNAL BUDGET ESTIMATES
REVENUE FROM LEASING OUT OF DEPARTMENT OF DEFENSE ASSETS
FY 2002 FY 2003 FY 2004 FY 2005
LEASE: Multiple Leases $12,667 $12,667 $12,667 $12,667(A) Explanation of Lease
The Dalles/Multiple Purposes(B) Explanation of Anticipated Expenditures Resulting from Rentals by Fiscal Year
Maintenance and Repair(C) Actual Use of Revenue Generated from Rentals in Prior Year
Reference Distribution of Revenues(D) Explanation of Amendments Made to Existing Leases
Not Currently Available**
LEASE: Multiple Leases $10,885 $10,885 $10,885 $10,885(A) Explanation of Lease
Multiple Locations/Multiple Purposes(B) Explanation of Anticipated Expenditures Resulting from Rentals by Fiscal Year
Maintenance and Repair(C) Actual Use of Revenue Generated from Rentals in Prior Year
Reference Distribution of Revenues(D) Explanation of Amendments Made to Existing Leases
Not Currently Available**
PENNSYLVANIALEASE: DA49-080-ENG-0166 $125 $125 $125 $125
(A) Explanation of LeaseCarlisle Barracks/Housing
(B) Explanation of Anticipated Expenditures Resulting from Rentals by Fiscal YearMaintenance and Repair
(C) Actual Use of Revenue Generated from Rentals in Prior YearReference Distribution of Revenues
(D) Explanation of Amendments Made to Existing LeasesNot Currently Available**
233
Exhibit PB-34 Revenue from Leasing Out of DoD AssetsFebruary 2003
Ms. Valerie Turner/(703) 695-7174

DEPARTMENT OF THE ARMYFY 2004/2005 BIENNAL BUDGET ESTIMATES
REVENUE FROM LEASING OUT OF DEPARTMENT OF DEFENSE ASSETS
FY 2002 FY 2003 FY 2004 FY 2005
LEASE: DA49-080-ENG-1412 $100 $100 $100 $100(A) Explanation of Lease
Letterkenny Army Depot/Housing(B) Explanation of Anticipated Expenditures Resulting from Rentals by Fiscal Year
Maintenance and Repair(C) Actual Use of Revenue Generated from Rentals in Prior Year
Reference Distribution of Revenues(D) Explanation of Amendments Made to Existing Leases
Not Currently Available**
LEASE: DA-49-080-ENG-1625 $100 $100 $100 $100(A) Explanation of Lease
Tobyhanna Army Depot/Housing(B) Explanation of Anticipated Expenditures Resulting from Rentals by Fiscal Year
Maintenance and Repair(C) Actual Use of Revenue Generated from Rentals in Prior Year
Reference Distribution of Revenues(D) Explanation of Amendments Made to Existing Leases
Not Currently Available**
LEASE: DACA31-1-00-597 $166,658 $166,658 $166,658 $166,658(A) Explanation of Lease
Letterkenny Army Depot/Office(B) Explanation of Anticipated Expenditures Resulting from Rentals by Fiscal Year
Maintenance and Repair(C) Actual Use of Revenue Generated from Rentals in Prior Year
Reference Distribution of Revenues(D) Explanation of Amendments Made to Existing Leases
Not Currently Available**
234
Exhibit PB-34 Revenue from Leasing Out of DoD AssetsFebruary 2003
Ms. Valerie Turner/(703) 695-7174

DEPARTMENT OF THE ARMYFY 2004/2005 BIENNAL BUDGET ESTIMATES
REVENUE FROM LEASING OUT OF DEPARTMENT OF DEFENSE ASSETS
FY 2002 FY 2003 FY 2004 FY 2005
LEASE: DACW-31-1-99-557 $19,000 $19,000 $19,000 $19,000(A) Explanation of Lease
Philadelphia/Industrial(B) Explanation of Anticipated Expenditures Resulting from Rentals by Fiscal Year
Maintenance and Repair(C) Actual Use of Revenue Generated from Rentals in Prior Year
Reference Distribution of Revenues(D) Explanation of Amendments Made to Existing Leases
Not Currently Available**
LEASE: Multiple Leases $1,506 $506 $506 $506(A) Explanation of Lease
Multiple Locations/Recreation(B) Explanation of Anticipated Expenditures Resulting from Rentals by Fiscal Year
Maintenance and Repair(C) Actual Use of Revenue Generated from Rentals in Prior Year
Reference Distribution of Revenues(D) Explanation of Amendments Made to Existing Leases
Not Currently Available**
LEASE: Multiple Leases $90,495 $62,995 $61,426 $61,426(A) Explanation of Lease
Multiple Locations/Unspecified Purposes(B) Explanation of Anticipated Expenditures Resulting from Rentals by Fiscal Year
Maintenance and Repair(C) Actual Use of Revenue Generated from Rentals in Prior Year
Reference Distribution of Revenues(D) Explanation of Amendments Made to Existing Leases
Not Currently Available**
235
Exhibit PB-34 Revenue from Leasing Out of DoD AssetsFebruary 2003
Ms. Valerie Turner/(703) 695-7174

DEPARTMENT OF THE ARMYFY 2004/2005 BIENNAL BUDGET ESTIMATES
REVENUE FROM LEASING OUT OF DEPARTMENT OF DEFENSE ASSETS
FY 2002 FY 2003 FY 2004 FY 2005
PUERTO RICO* LEASE: DACA17-1-96-3010 $10,200 $10,200 $10,200 $10,200(A) Explanation of Lease
Fort Buchanan/Banking(B) Explanation of Anticipated Expenditures Resulting from Rentals by Fiscal Year
Maintenance and Repair(C) Actual Use of Revenue Generated from Rentals in Prior Year
Reference Distribution of Revenues(D) Explanation of Amendments Made to Existing Leases
Not Currently Available**
* LEASE: DACA17-1-01-3010 $9,600 $9,600 $9,600 $9,600(A) Explanation of Lease
Fort Buchanan/Banking(B) Explanation of Anticipated Expenditures Resulting from Rentals by Fiscal Year
Maintenance and Repair(C) Actual Use of Revenue Generated from Rentals in Prior Year
Reference Distribution of Revenues(D) Explanation of Amendments Made to Existing Leases
Not Currently Available**
SOUTH CAROLINALEASE: DACA21-2-89-1027 $2,200 $2,200 $2,200 $2,200
(A) Explanation of LeaseFort Jackson/Storage
(B) Explanation of Anticipated Expenditures Resulting from Rentals by Fiscal YearMaintenance and Repair
(C) Actual Use of Revenue Generated from Rentals in Prior YearReference Distribution of Revenues
(D) Explanation of Amendments Made to Existing LeasesNot Currently Available**
236
Exhibit PB-34 Revenue from Leasing Out of DoD AssetsFebruary 2003
Ms. Valerie Turner/(703) 695-7174
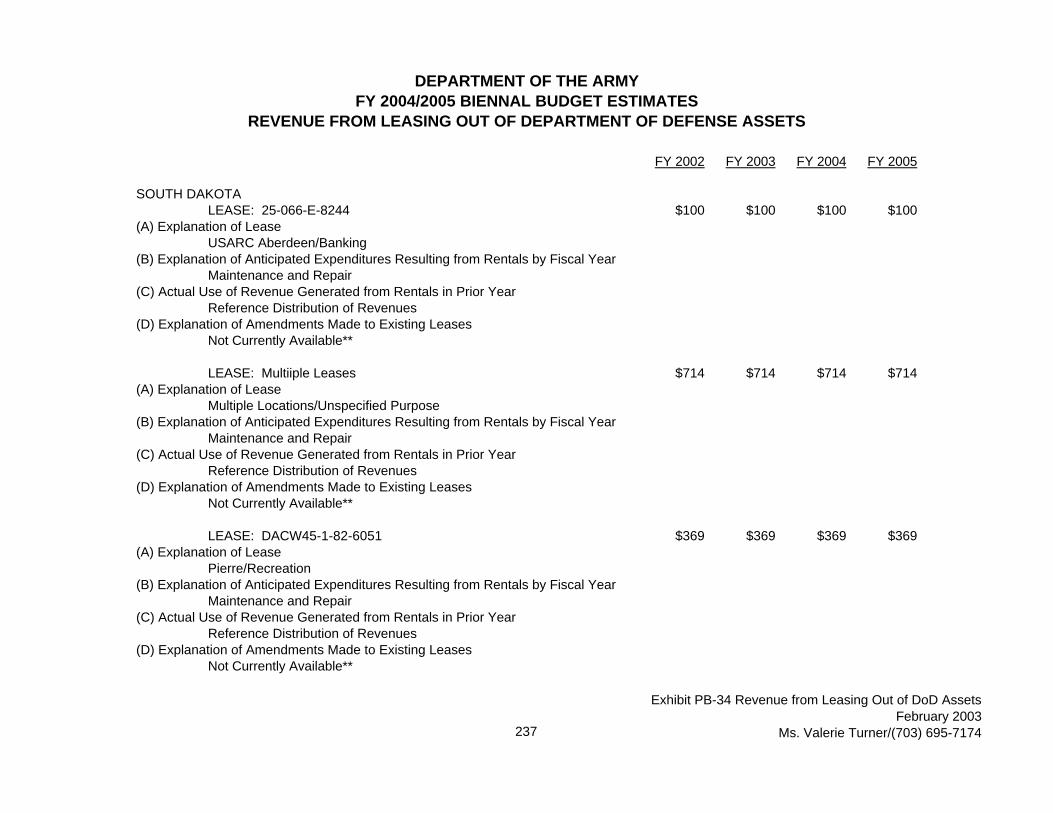
DEPARTMENT OF THE ARMYFY 2004/2005 BIENNAL BUDGET ESTIMATES
REVENUE FROM LEASING OUT OF DEPARTMENT OF DEFENSE ASSETS
FY 2002 FY 2003 FY 2004 FY 2005
SOUTH DAKOTALEASE: 25-066-E-8244 $100 $100 $100 $100
(A) Explanation of LeaseUSARC Aberdeen/Banking
(B) Explanation of Anticipated Expenditures Resulting from Rentals by Fiscal YearMaintenance and Repair
(C) Actual Use of Revenue Generated from Rentals in Prior YearReference Distribution of Revenues
(D) Explanation of Amendments Made to Existing LeasesNot Currently Available**
LEASE: Multiiple Leases $714 $714 $714 $714(A) Explanation of Lease
Multiple Locations/Unspecified Purpose(B) Explanation of Anticipated Expenditures Resulting from Rentals by Fiscal Year
Maintenance and Repair(C) Actual Use of Revenue Generated from Rentals in Prior Year
Reference Distribution of Revenues(D) Explanation of Amendments Made to Existing Leases
Not Currently Available**
LEASE: DACW45-1-82-6051 $369 $369 $369 $369(A) Explanation of Lease
Pierre/Recreation(B) Explanation of Anticipated Expenditures Resulting from Rentals by Fiscal Year
Maintenance and Repair(C) Actual Use of Revenue Generated from Rentals in Prior Year
Reference Distribution of Revenues(D) Explanation of Amendments Made to Existing Leases
Not Currently Available**
237
Exhibit PB-34 Revenue from Leasing Out of DoD AssetsFebruary 2003
Ms. Valerie Turner/(703) 695-7174

DEPARTMENT OF THE ARMYFY 2004/2005 BIENNAL BUDGET ESTIMATES
REVENUE FROM LEASING OUT OF DEPARTMENT OF DEFENSE ASSETS
FY 2002 FY 2003 FY 2004 FY 2005
TENNESSEELEASE: Multiple Leases $91,295 $89,295 $89,295 $89,295
(A) Explanation of LeaseMultiple Locations/Recreation
(B) Explanation of Anticipated Expenditures Resulting from Rentals by Fiscal YearMaintenance and Repair
(C) Actual Use of Revenue Generated from Rentals in Prior YearReference Distribution of Revenues
(D) Explanation of Amendments Made to Existing LeasesNot Currently Available**
LEASE: DACA01-1-00-569 $600 $600 $600 $600(A) Explanation of Lease
Chattanooga/Industrial(B) Explanation of Anticipated Expenditures Resulting from Rentals by Fiscal Year
Maintenance and Repair(C) Actual Use of Revenue Generated from Rentals in Prior Year
Reference Distribution of Revenues(D) Explanation of Amendments Made to Existing Leases
Not Currently Available**
LEASE: DACA2719578(A) Explanation of Lease $11,200 $11,200 $11,200 $11,200
Fort Campbell/Admin(B) Explanation of Anticipated Expenditures Resulting from Rentals by Fiscal Year
Maintenance and Repair(C) Actual Use of Revenue Generated from Rentals in Prior Year
Reference Distribution of Revenues(D) Explanation of Amendments Made to Existing Leases
Not Currently Available**
238
Exhibit PB-34 Revenue from Leasing Out of DoD AssetsFebruary 2003
Ms. Valerie Turner/(703) 695-7174
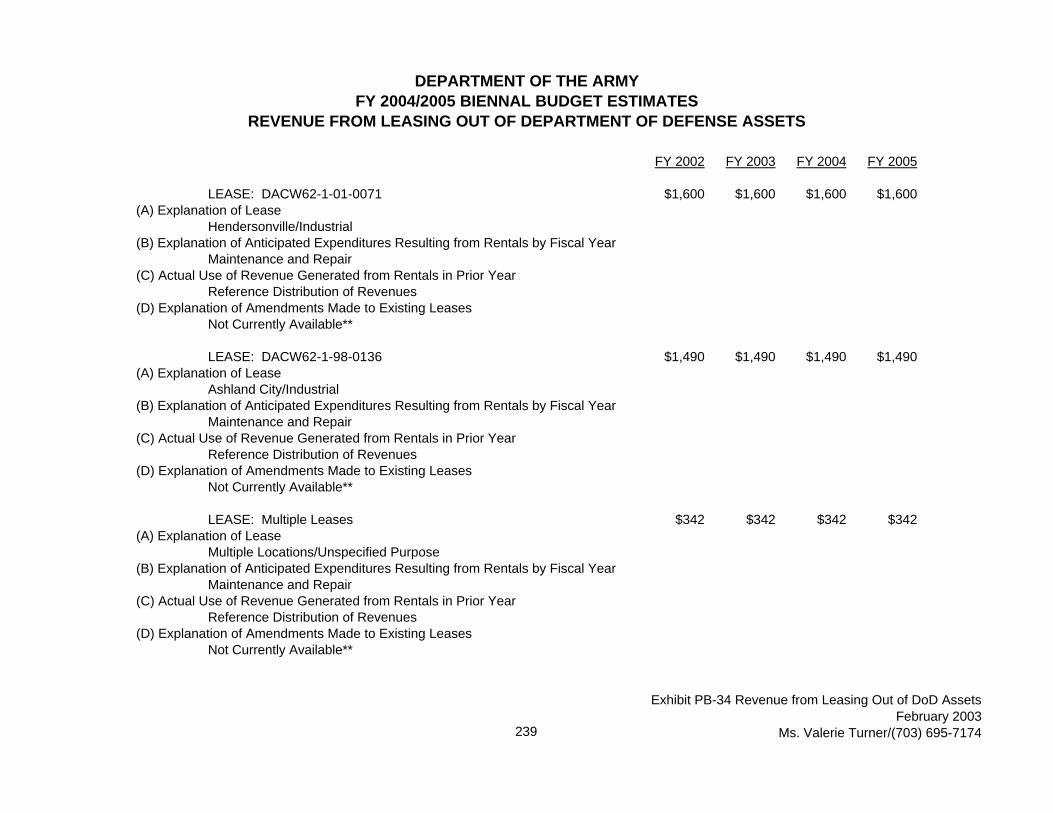
DEPARTMENT OF THE ARMYFY 2004/2005 BIENNAL BUDGET ESTIMATES
REVENUE FROM LEASING OUT OF DEPARTMENT OF DEFENSE ASSETS
FY 2002 FY 2003 FY 2004 FY 2005
LEASE: DACW62-1-01-0071 $1,600 $1,600 $1,600 $1,600(A) Explanation of Lease
Hendersonville/Industrial(B) Explanation of Anticipated Expenditures Resulting from Rentals by Fiscal Year
Maintenance and Repair(C) Actual Use of Revenue Generated from Rentals in Prior Year
Reference Distribution of Revenues(D) Explanation of Amendments Made to Existing Leases
Not Currently Available**
LEASE: DACW62-1-98-0136 $1,490 $1,490 $1,490 $1,490(A) Explanation of Lease
Ashland City/Industrial(B) Explanation of Anticipated Expenditures Resulting from Rentals by Fiscal Year
Maintenance and Repair(C) Actual Use of Revenue Generated from Rentals in Prior Year
Reference Distribution of Revenues(D) Explanation of Amendments Made to Existing Leases
Not Currently Available**
LEASE: Multiple Leases $342 $342 $342 $342(A) Explanation of Lease
Multiple Locations/Unspecified Purpose(B) Explanation of Anticipated Expenditures Resulting from Rentals by Fiscal Year
Maintenance and Repair(C) Actual Use of Revenue Generated from Rentals in Prior Year
Reference Distribution of Revenues(D) Explanation of Amendments Made to Existing Leases
Not Currently Available**
239
Exhibit PB-34 Revenue from Leasing Out of DoD AssetsFebruary 2003
Ms. Valerie Turner/(703) 695-7174
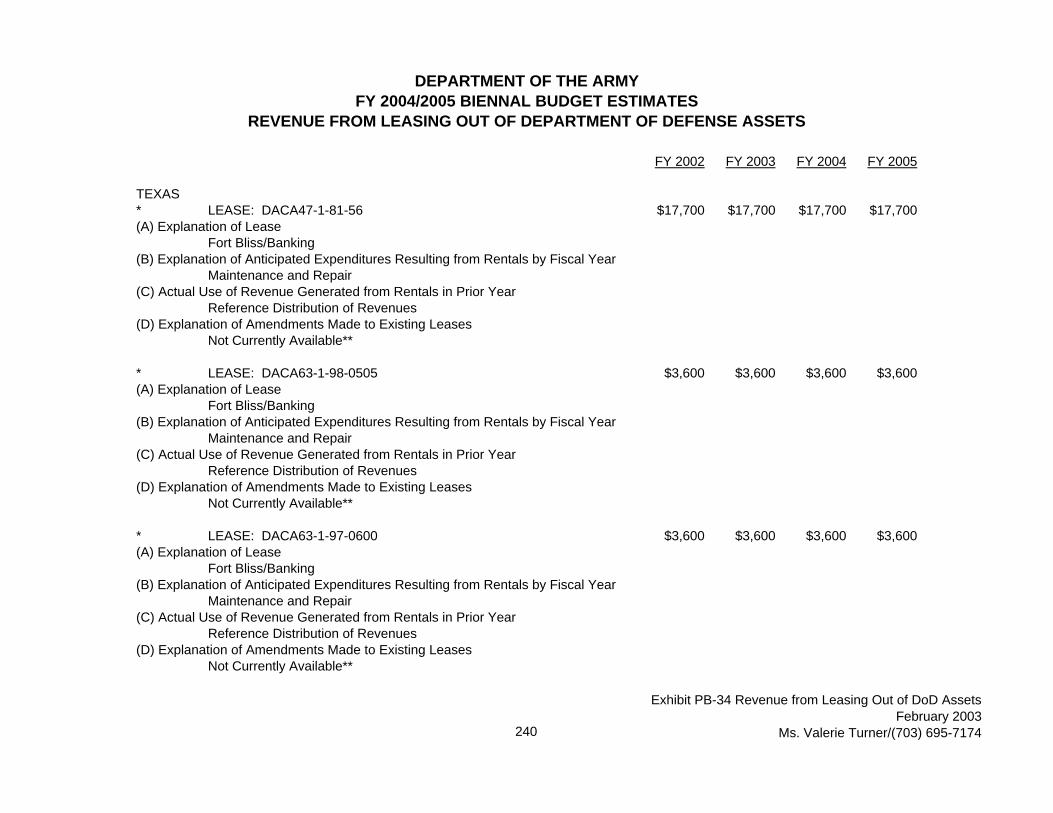
DEPARTMENT OF THE ARMYFY 2004/2005 BIENNAL BUDGET ESTIMATES
REVENUE FROM LEASING OUT OF DEPARTMENT OF DEFENSE ASSETS
FY 2002 FY 2003 FY 2004 FY 2005
TEXAS* LEASE: DACA47-1-81-56 $17,700 $17,700 $17,700 $17,700(A) Explanation of Lease
Fort Bliss/Banking(B) Explanation of Anticipated Expenditures Resulting from Rentals by Fiscal Year
Maintenance and Repair(C) Actual Use of Revenue Generated from Rentals in Prior Year
Reference Distribution of Revenues(D) Explanation of Amendments Made to Existing Leases
Not Currently Available**
* LEASE: DACA63-1-98-0505 $3,600 $3,600 $3,600 $3,600(A) Explanation of Lease
Fort Bliss/Banking(B) Explanation of Anticipated Expenditures Resulting from Rentals by Fiscal Year
Maintenance and Repair(C) Actual Use of Revenue Generated from Rentals in Prior Year
Reference Distribution of Revenues(D) Explanation of Amendments Made to Existing Leases
Not Currently Available**
* LEASE: DACA63-1-97-0600 $3,600 $3,600 $3,600 $3,600(A) Explanation of Lease
Fort Bliss/Banking(B) Explanation of Anticipated Expenditures Resulting from Rentals by Fiscal Year
Maintenance and Repair(C) Actual Use of Revenue Generated from Rentals in Prior Year
Reference Distribution of Revenues(D) Explanation of Amendments Made to Existing Leases
Not Currently Available**
240
Exhibit PB-34 Revenue from Leasing Out of DoD AssetsFebruary 2003
Ms. Valerie Turner/(703) 695-7174
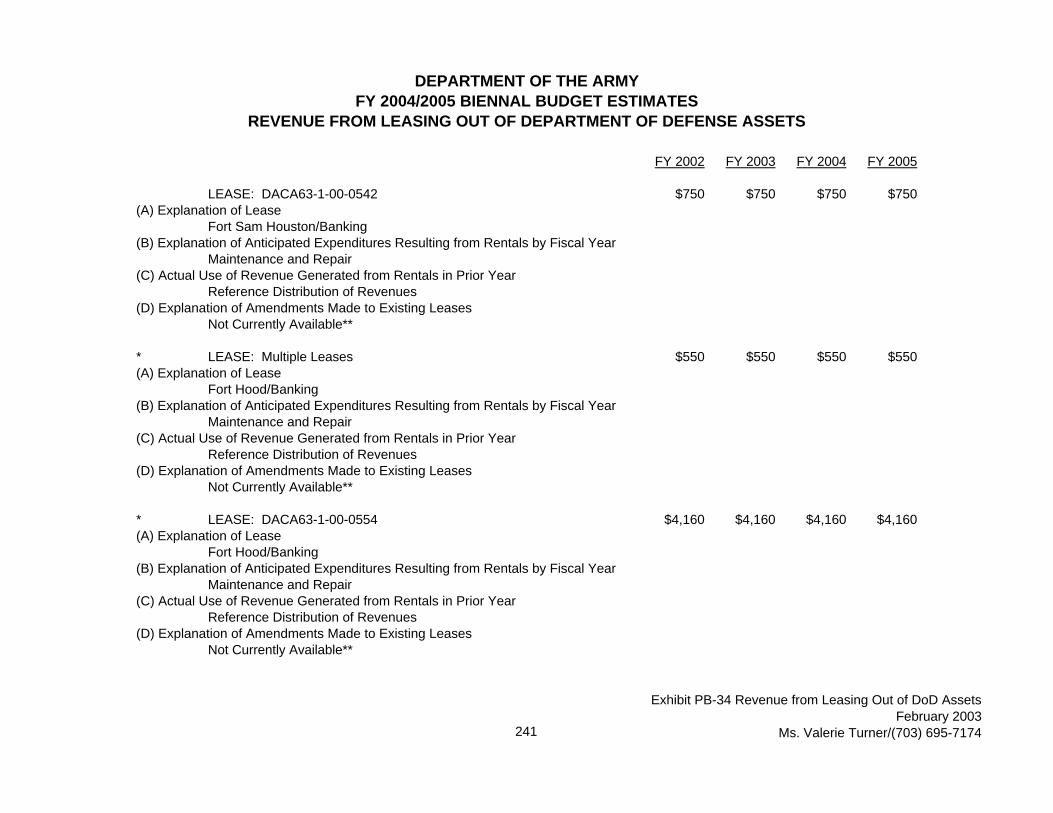
DEPARTMENT OF THE ARMYFY 2004/2005 BIENNAL BUDGET ESTIMATES
REVENUE FROM LEASING OUT OF DEPARTMENT OF DEFENSE ASSETS
FY 2002 FY 2003 FY 2004 FY 2005
LEASE: DACA63-1-00-0542 $750 $750 $750 $750(A) Explanation of Lease
Fort Sam Houston/Banking(B) Explanation of Anticipated Expenditures Resulting from Rentals by Fiscal Year
Maintenance and Repair(C) Actual Use of Revenue Generated from Rentals in Prior Year
Reference Distribution of Revenues(D) Explanation of Amendments Made to Existing Leases
Not Currently Available**
* LEASE: Multiple Leases $550 $550 $550 $550(A) Explanation of Lease
Fort Hood/Banking(B) Explanation of Anticipated Expenditures Resulting from Rentals by Fiscal Year
Maintenance and Repair(C) Actual Use of Revenue Generated from Rentals in Prior Year
Reference Distribution of Revenues(D) Explanation of Amendments Made to Existing Leases
Not Currently Available**
* LEASE: DACA63-1-00-0554 $4,160 $4,160 $4,160 $4,160(A) Explanation of Lease
Fort Hood/Banking(B) Explanation of Anticipated Expenditures Resulting from Rentals by Fiscal Year
Maintenance and Repair(C) Actual Use of Revenue Generated from Rentals in Prior Year
Reference Distribution of Revenues(D) Explanation of Amendments Made to Existing Leases
Not Currently Available**
241
Exhibit PB-34 Revenue from Leasing Out of DoD AssetsFebruary 2003
Ms. Valerie Turner/(703) 695-7174

DEPARTMENT OF THE ARMYFY 2004/2005 BIENNAL BUDGET ESTIMATES
REVENUE FROM LEASING OUT OF DEPARTMENT OF DEFENSE ASSETS
FY 2002 FY 2003 FY 2004 FY 2005
* LEASE: DACA47-1-82-03 $17,700 $17,700 $17,700 $17,700(A) Explanation of Lease
Fort Bliss/Banking(B) Explanation of Anticipated Expenditures Resulting from Rentals by Fiscal Year
Maintenance and Repair(C) Actual Use of Revenue Generated from Rentals in Prior Year
Reference Distribution of Revenues(D) Explanation of Amendments Made to Existing Leases
Not Currently Available**
* LEASE: DACA47-1-95-064 $1,228 $1,228 $1,228 $1,228(A) Explanation of Lease
Fort Bliss/Banking(B) Explanation of Anticipated Expenditures Resulting from Rentals by Fiscal Year
Maintenance and Repair(C) Actual Use of Revenue Generated from Rentals in Prior Year
Reference Distribution of Revenues(D) Explanation of Amendments Made to Existing Leases
Not Currently Available**
* LEASE: DACA63-1-98-0502 $10,800 $10,800 $10,800 $10,800(A) Explanation of Lease
Fort Bliss/Banking(B) Explanation of Anticipated Expenditures Resulting from Rentals by Fiscal Year
Maintenance and Repair(C) Actual Use of Revenue Generated from Rentals in Prior Year
Reference Distribution of Revenues(D) Explanation of Amendments Made to Existing Leases
Not Currently Available**
242
Exhibit PB-34 Revenue from Leasing Out of DoD AssetsFebruary 2003
Ms. Valerie Turner/(703) 695-7174

DEPARTMENT OF THE ARMYFY 2004/2005 BIENNAL BUDGET ESTIMATES
REVENUE FROM LEASING OUT OF DEPARTMENT OF DEFENSE ASSETS
FY 2002 FY 2003 FY 2004 FY 2005
* LEASE: DACA631010525 $530 $530 $530 $530(A) Explanation of Lease
Fort Hood/Museum(B) Explanation of Anticipated Expenditures Resulting from Rentals by Fiscal Year
Maintenance and Repair(C) Actual Use of Revenue Generated from Rentals in Prior Year
Reference Distribution of Revenues(D) Explanation of Amendments Made to Existing Leases
Not Currently Available**
* LEASE: Multiple Leases $10,800 $10,800 $10,800 $10,800(A) Explanation of Lease
Fort Hood/Housing(B) Explanation of Anticipated Expenditures Resulting from Rentals by Fiscal Year
Maintenance and Repair(C) Actual Use of Revenue Generated from Rentals in Prior Year
Reference Distribution of Revenues(D) Explanation of Amendments Made to Existing Leases
Not Currently Available**
* LEASE: DACA47-1-72-0022 $20,600 $20,600 $20,600 $20,600(A) Explanation of Lease
Fort Bliss/Banking(B) Explanation of Anticipated Expenditures Resulting from Rentals by Fiscal Year
Maintenance and Repair(C) Actual Use of Revenue Generated from Rentals in Prior Year
Reference Distribution of Revenues(D) Explanation of Amendments Made to Existing Leases
Not Currently Available**
243
Exhibit PB-34 Revenue from Leasing Out of DoD AssetsFebruary 2003
Ms. Valerie Turner/(703) 695-7174

DEPARTMENT OF THE ARMYFY 2004/2005 BIENNAL BUDGET ESTIMATES
REVENUE FROM LEASING OUT OF DEPARTMENT OF DEFENSE ASSETS
FY 2002 FY 2003 FY 2004 FY 2005
* LEASE: DACA63-1-97-0505 $5,000 $5,000 $5,000 $5,000(A) Explanation of Lease
Fort Bliss/Education(B) Explanation of Anticipated Expenditures Resulting from Rentals by Fiscal Year
Maintenance and Repair(C) Actual Use of Revenue Generated from Rentals in Prior Year
Reference Distribution of Revenues(D) Explanation of Amendments Made to Existing Leases
Not Currently Available**
* LEASE: DA29005-ENG-1990 $1,700 $1,700 $1,700 $1,700(A) Explanation of Lease
Fort Bliss/Education(B) Explanation of Anticipated Expenditures Resulting from Rentals by Fiscal Year
Maintenance and Repair(C) Actual Use of Revenue Generated from Rentals in Prior Year
Reference Distribution of Revenues(D) Explanation of Amendments Made to Existing Leases
Not Currently Available**
* LEASE: DA29005-ENG-2362 $960 $960 $960 $960(A) Explanation of Lease
Fort Bliss/Education(B) Explanation of Anticipated Expenditures Resulting from Rentals by Fiscal Year
Maintenance and Repair(C) Actual Use of Revenue Generated from Rentals in Prior Year
Reference Distribution of Revenues(D) Explanation of Amendments Made to Existing Leases
Not Currently Available**
244
Exhibit PB-34 Revenue from Leasing Out of DoD AssetsFebruary 2003
Ms. Valerie Turner/(703) 695-7174

DEPARTMENT OF THE ARMYFY 2004/2005 BIENNAL BUDGET ESTIMATES
REVENUE FROM LEASING OUT OF DEPARTMENT OF DEFENSE ASSETS
FY 2002 FY 2003 FY 2004 FY 2005
* LEASE: Multiple Leases $103,474 $99,974 $85,416 $85,416(A) Explanation of Lease
Multiple Locations/Recreation(B) Explanation of Anticipated Expenditures Resulting from Rentals by Fiscal Year
Maintenance and Repair(C) Actual Use of Revenue Generated from Rentals in Prior Year
Reference Distribution of Revenues(D) Explanation of Amendments Made to Existing Leases
Not Currently Available**
* LEASE: DACA47-1-88-149 $9,560 $9,560 $9,560 $9,560(A) Explanation of Lease
Fort Bliss/Industrial(B) Explanation of Anticipated Expenditures Resulting from Rentals by Fiscal Year
Maintenance and Repair(C) Actual Use of Revenue Generated from Rentals in Prior Year
Reference Distribution of Revenues(D) Explanation of Amendments Made to Existing Leases
Not Currently Available**
* LEASE: DACA63-1-97-0554 $750 $750 $750 $750(A) Explanation of Lease
Fort Bliss/Industrial(B) Explanation of Anticipated Expenditures Resulting from Rentals by Fiscal Year
Maintenance and Repair(C) Actual Use of Revenue Generated from Rentals in Prior Year
Reference Distribution of Revenues(D) Explanation of Amendments Made to Existing Leases
Not Currently Available**
245
Exhibit PB-34 Revenue from Leasing Out of DoD AssetsFebruary 2003
Ms. Valerie Turner/(703) 695-7174

DEPARTMENT OF THE ARMYFY 2004/2005 BIENNAL BUDGET ESTIMATES
REVENUE FROM LEASING OUT OF DEPARTMENT OF DEFENSE ASSETS
FY 2002 FY 2003 FY 2004 FY 2005
* LEASE: DACA631010537 $4,545 $4,545 $4,545 $4,545(A) Explanation of Lease
Fort Sam Houston/Admin(B) Explanation of Anticipated Expenditures Resulting from Rentals by Fiscal Year
Maintenance and Repair(C) Actual Use of Revenue Generated from Rentals in Prior Year
Reference Distribution of Revenues(D) Explanation of Amendments Made to Existing Leases
Not Currently Available**
LEASE: DACA63-1-01-0573 $250 $250 $250 $250(A) Explanation of Lease
Fort Sam Houston/Banking(B) Explanation of Anticipated Expenditures Resulting from Rentals by Fiscal Year
Maintenance and Repair(C) Actual Use of Revenue Generated from Rentals in Prior Year
Reference Distribution of Revenues(D) Explanation of Amendments Made to Existing Leases
Not Currently Available**
* LEASE: DACA63-1-73-0196 $3,750 $3,750 $3,750 $3,750(A) Explanation of Lease
Fort Sam Houston(B) Explanation of Anticipated Expenditures Resulting from Rentals by Fiscal Year
Maintenance and Repair(C) Actual Use of Revenue Generated from Rentals in Prior Year
Reference Distribution of Revenues(D) Explanation of Amendments Made to Existing Leases
Not Currently Available**
246
Exhibit PB-34 Revenue from Leasing Out of DoD AssetsFebruary 2003
Ms. Valerie Turner/(703) 695-7174
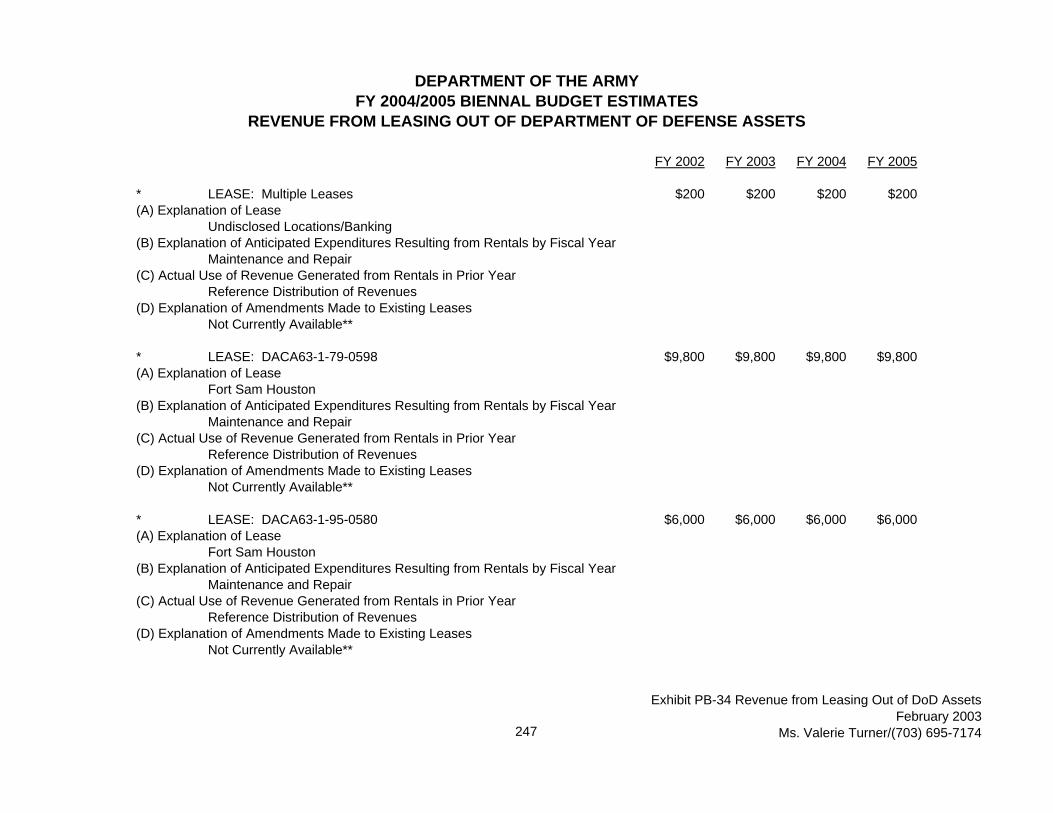
DEPARTMENT OF THE ARMYFY 2004/2005 BIENNAL BUDGET ESTIMATES
REVENUE FROM LEASING OUT OF DEPARTMENT OF DEFENSE ASSETS
FY 2002 FY 2003 FY 2004 FY 2005
* LEASE: Multiple Leases $200 $200 $200 $200(A) Explanation of Lease
Undisclosed Locations/Banking(B) Explanation of Anticipated Expenditures Resulting from Rentals by Fiscal Year
Maintenance and Repair(C) Actual Use of Revenue Generated from Rentals in Prior Year
Reference Distribution of Revenues(D) Explanation of Amendments Made to Existing Leases
Not Currently Available**
* LEASE: DACA63-1-79-0598 $9,800 $9,800 $9,800 $9,800(A) Explanation of Lease
Fort Sam Houston (B) Explanation of Anticipated Expenditures Resulting from Rentals by Fiscal Year
Maintenance and Repair(C) Actual Use of Revenue Generated from Rentals in Prior Year
Reference Distribution of Revenues(D) Explanation of Amendments Made to Existing Leases
Not Currently Available**
* LEASE: DACA63-1-95-0580 $6,000 $6,000 $6,000 $6,000(A) Explanation of Lease
Fort Sam Houston (B) Explanation of Anticipated Expenditures Resulting from Rentals by Fiscal Year
Maintenance and Repair(C) Actual Use of Revenue Generated from Rentals in Prior Year
Reference Distribution of Revenues(D) Explanation of Amendments Made to Existing Leases
Not Currently Available**
247
Exhibit PB-34 Revenue from Leasing Out of DoD AssetsFebruary 2003
Ms. Valerie Turner/(703) 695-7174

DEPARTMENT OF THE ARMYFY 2004/2005 BIENNAL BUDGET ESTIMATES
REVENUE FROM LEASING OUT OF DEPARTMENT OF DEFENSE ASSETS
FY 2002 FY 2003 FY 2004 FY 2005
LEASE: DACA63-1-98-0538 $50 $0 $0 $0(A) Explanation of Lease
Fort Sam HoustonExchange (B) Explanation of Anticipated Expenditures Resulting from Rentals by Fiscal Year
Maintenance and Repair(C) Actual Use of Revenue Generated from Rentals in Prior Year
Reference Distribution of Revenues(D) Explanation of Amendments Made to Existing Leases
Not Currently Available**
LEASE: DACA63-1-98-0556 $50 $50 $0 $0(A) Explanation of Lease
Fort Sam HoustonExchange (B) Explanation of Anticipated Expenditures Resulting from Rentals by Fiscal Year
Maintenance and Repair(C) Actual Use of Revenue Generated from Rentals in Prior Year
Reference Distribution of Revenues(D) Explanation of Amendments Made to Existing Leases
Not Currently Available**
* LEASE: DACA63-1-98-0578 $240 $240 $240 $240(A) Explanation of Lease
Fort Sam Houston (B) Explanation of Anticipated Expenditures Resulting from Rentals by Fiscal Year
Maintenance and Repair(C) Actual Use of Revenue Generated from Rentals in Prior Year
Reference Distribution of Revenues(D) Explanation of Amendments Made to Existing Leases
Not Currently Available**
248
Exhibit PB-34 Revenue from Leasing Out of DoD AssetsFebruary 2003
Ms. Valerie Turner/(703) 695-7174
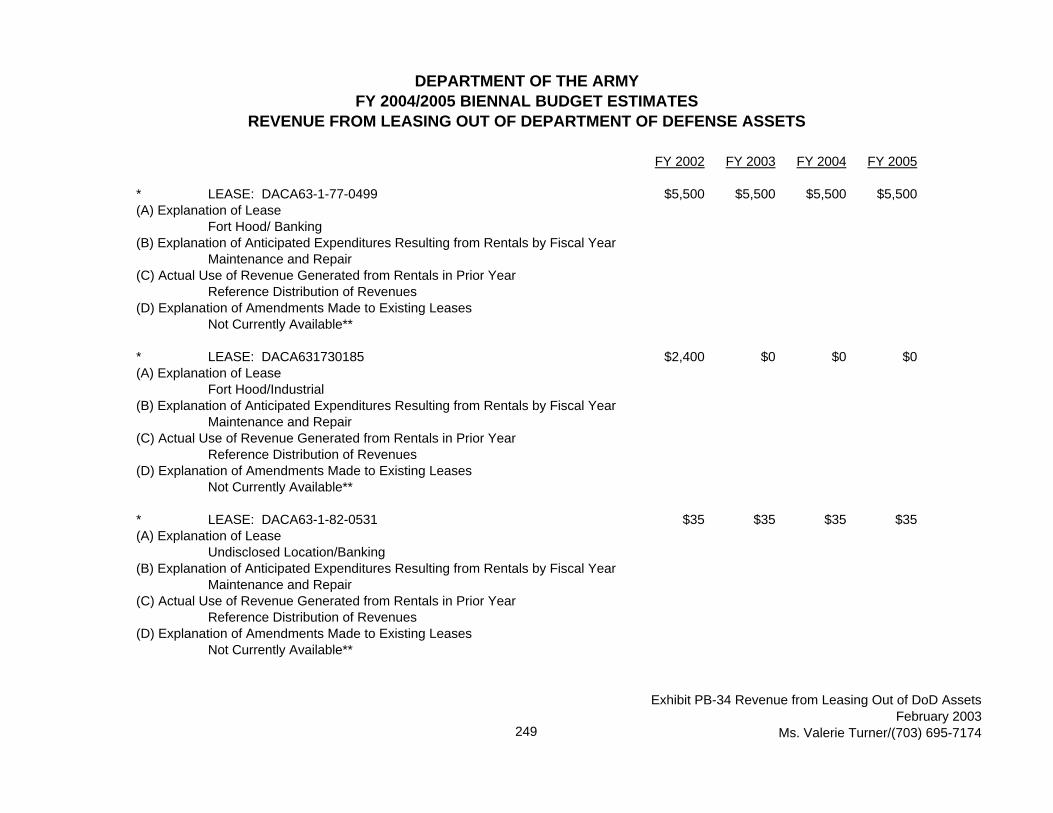
DEPARTMENT OF THE ARMYFY 2004/2005 BIENNAL BUDGET ESTIMATES
REVENUE FROM LEASING OUT OF DEPARTMENT OF DEFENSE ASSETS
FY 2002 FY 2003 FY 2004 FY 2005
* LEASE: DACA63-1-77-0499 $5,500 $5,500 $5,500 $5,500(A) Explanation of Lease
Fort Hood/ Banking(B) Explanation of Anticipated Expenditures Resulting from Rentals by Fiscal Year
Maintenance and Repair(C) Actual Use of Revenue Generated from Rentals in Prior Year
Reference Distribution of Revenues(D) Explanation of Amendments Made to Existing Leases
Not Currently Available**
* LEASE: DACA631730185 $2,400 $0 $0 $0(A) Explanation of Lease
Fort Hood/Industrial(B) Explanation of Anticipated Expenditures Resulting from Rentals by Fiscal Year
Maintenance and Repair(C) Actual Use of Revenue Generated from Rentals in Prior Year
Reference Distribution of Revenues(D) Explanation of Amendments Made to Existing Leases
Not Currently Available**
* LEASE: DACA63-1-82-0531 $35 $35 $35 $35(A) Explanation of Lease
Undisclosed Location/Banking(B) Explanation of Anticipated Expenditures Resulting from Rentals by Fiscal Year
Maintenance and Repair(C) Actual Use of Revenue Generated from Rentals in Prior Year
Reference Distribution of Revenues(D) Explanation of Amendments Made to Existing Leases
Not Currently Available**
249
Exhibit PB-34 Revenue from Leasing Out of DoD AssetsFebruary 2003
Ms. Valerie Turner/(703) 695-7174

DEPARTMENT OF THE ARMYFY 2004/2005 BIENNAL BUDGET ESTIMATES
REVENUE FROM LEASING OUT OF DEPARTMENT OF DEFENSE ASSETS
FY 2002 FY 2003 FY 2004 FY 2005
* LEASE: DACA63-1-82-0560 $345 $345 $345 $345(A) Explanation of Lease
Fort Hood/Storage(B) Explanation of Anticipated Expenditures Resulting from Rentals by Fiscal Year
Maintenance and Repair(C) Actual Use of Revenue Generated from Rentals in Prior Year
Reference Distribution of Revenues(D) Explanation of Amendments Made to Existing Leases
Not Currently Available**
* LEASE: DACA63-1-85-0505 $3,250 $3,250 $3,250 $3,250(A) Explanation of Lease
Fort Hood/Industrial(B) Explanation of Anticipated Expenditures Resulting from Rentals by Fiscal Year
Maintenance and Repair(C) Actual Use of Revenue Generated from Rentals in Prior Year
Reference Distribution of Revenues(D) Explanation of Amendments Made to Existing Leases
Not Currently Available**
* LEASE: Multiple Leases $21,803 $21,803 $20,880 $20,880(A) Explanation of Lease
Fort Hood/Banking(B) Explanation of Anticipated Expenditures Resulting from Rentals by Fiscal Year
Maintenance and Repair(C) Actual Use of Revenue Generated from Rentals in Prior Year
Reference Distribution of Revenues(D) Explanation of Amendments Made to Existing Leases
Not Currently Available**
250
Exhibit PB-34 Revenue from Leasing Out of DoD AssetsFebruary 2003
Ms. Valerie Turner/(703) 695-7174

DEPARTMENT OF THE ARMYFY 2004/2005 BIENNAL BUDGET ESTIMATES
REVENUE FROM LEASING OUT OF DEPARTMENT OF DEFENSE ASSETS
FY 2002 FY 2003 FY 2004 FY 2005
* LEASE: Multiple Leases $7,250 $7,250 $50 $50(A) Explanation of Lease
Undisclosed Locations/Banking(B) Explanation of Anticipated Expenditures Resulting from Rentals by Fiscal Year
Maintenance and Repair(C) Actual Use of Revenue Generated from Rentals in Prior Year
Reference Distribution of Revenues(D) Explanation of Amendments Made to Existing Leases
Not Currently Available**
* LEASE: DACA63-1-92-0892 $1,294 $1,294 $1,294 $1,294(A) Explanation of Lease
Undisclosed Location/Industrial(B) Explanation of Anticipated Expenditures Resulting from Rentals by Fiscal Year
Maintenance and Repair(C) Actual Use of Revenue Generated from Rentals in Prior Year
Reference Distribution of Revenues(D) Explanation of Amendments Made to Existing Leases
Not Currently Available**
* LEASE: DACA63-1-97-0562 $4,845 $4,845 $4,845 $4,845(A) Explanation of Lease
Austin/Armed Forces Center(B) Explanation of Anticipated Expenditures Resulting from Rentals by Fiscal Year
Maintenance and Repair(C) Actual Use of Revenue Generated from Rentals in Prior Year
Reference Distribution of Revenues(D) Explanation of Amendments Made to Existing Leases
Not Currently Available**
251
Exhibit PB-34 Revenue from Leasing Out of DoD AssetsFebruary 2003
Ms. Valerie Turner/(703) 695-7174

DEPARTMENT OF THE ARMYFY 2004/2005 BIENNAL BUDGET ESTIMATES
REVENUE FROM LEASING OUT OF DEPARTMENT OF DEFENSE ASSETS
FY 2002 FY 2003 FY 2004 FY 2005
* LEASE: DACA63-1-98-0520 $324 $0 $0 $0(A) Explanation of Lease
Fort Hood/Industrial(B) Explanation of Anticipated Expenditures Resulting from Rentals by Fiscal Year
Maintenance and Repair(C) Actual Use of Revenue Generated from Rentals in Prior Year
Reference Distribution of Revenues(D) Explanation of Amendments Made to Existing Leases
Not Currently Available**
LEASE: DACA63-1-98-0580 $405 $405 $405 $405(A) Explanation of Lease
Fort Sam Houston/Admin(B) Explanation of Anticipated Expenditures Resulting from Rentals by Fiscal Year
Maintenance and Repair(C) Actual Use of Revenue Generated from Rentals in Prior Year
Reference Distribution of Revenues(D) Explanation of Amendments Made to Existing Leases
Not Currently Available**
LEASE: DACA63-3-00-0541 $250 $250 $250 $250(A) Explanation of Lease
Fort Sam Houston/Banking(B) Explanation of Anticipated Expenditures Resulting from Rentals by Fiscal Year
Maintenance and Repair(C) Actual Use of Revenue Generated from Rentals in Prior Year
Reference Distribution of Revenues(D) Explanation of Amendments Made to Existing Leases
Not Currently Available**
252
Exhibit PB-34 Revenue from Leasing Out of DoD AssetsFebruary 2003
Ms. Valerie Turner/(703) 695-7174
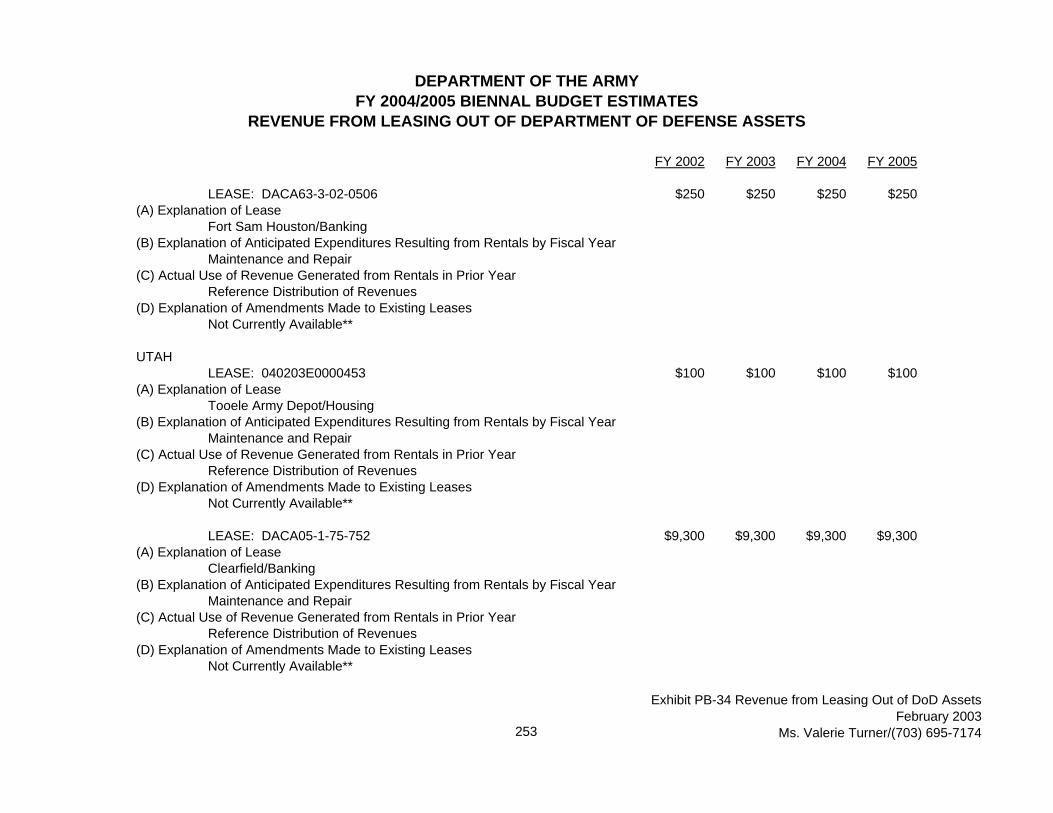
DEPARTMENT OF THE ARMYFY 2004/2005 BIENNAL BUDGET ESTIMATES
REVENUE FROM LEASING OUT OF DEPARTMENT OF DEFENSE ASSETS
FY 2002 FY 2003 FY 2004 FY 2005
LEASE: DACA63-3-02-0506 $250 $250 $250 $250(A) Explanation of Lease
Fort Sam Houston/Banking(B) Explanation of Anticipated Expenditures Resulting from Rentals by Fiscal Year
Maintenance and Repair(C) Actual Use of Revenue Generated from Rentals in Prior Year
Reference Distribution of Revenues(D) Explanation of Amendments Made to Existing Leases
Not Currently Available**
UTAHLEASE: 040203E0000453 $100 $100 $100 $100
(A) Explanation of LeaseTooele Army Depot/Housing
(B) Explanation of Anticipated Expenditures Resulting from Rentals by Fiscal YearMaintenance and Repair
(C) Actual Use of Revenue Generated from Rentals in Prior YearReference Distribution of Revenues
(D) Explanation of Amendments Made to Existing LeasesNot Currently Available**
LEASE: DACA05-1-75-752 $9,300 $9,300 $9,300 $9,300(A) Explanation of Lease
Clearfield/Banking(B) Explanation of Anticipated Expenditures Resulting from Rentals by Fiscal Year
Maintenance and Repair(C) Actual Use of Revenue Generated from Rentals in Prior Year
Reference Distribution of Revenues(D) Explanation of Amendments Made to Existing Leases
Not Currently Available**
253
Exhibit PB-34 Revenue from Leasing Out of DoD AssetsFebruary 2003
Ms. Valerie Turner/(703) 695-7174

DEPARTMENT OF THE ARMYFY 2004/2005 BIENNAL BUDGET ESTIMATES
REVENUE FROM LEASING OUT OF DEPARTMENT OF DEFENSE ASSETS
FY 2002 FY 2003 FY 2004 FY 2005
LEASE: DACA05-1-99-512 $244 $244 $244 $244(A) Explanation of Lease
Dugway/Education(B) Explanation of Anticipated Expenditures Resulting from Rentals by Fiscal Year
Maintenance and Repair(C) Actual Use of Revenue Generated from Rentals in Prior Year
Reference Distribution of Revenues(D) Explanation of Amendments Made to Existing Leases
Not Currently Available**
LEASE: Multiple Leases $1,353 $1,353 $1,353 $1,353(A) Explanation of Lease
Multiple Locations/Unspecified Purpose(B) Explanation of Anticipated Expenditures Resulting from Rentals by Fiscal Year
Maintenance and Repair(C) Actual Use of Revenue Generated from Rentals in Prior Year
Reference Distribution of Revenues(D) Explanation of Amendments Made to Existing Leases
Not Currently Available**VIRGINIA
LEASE: DA49-080ENG-3991 $200 $200 $200 $200(A) Explanation of Lease
Fort Belvoir/Housing(B) Explanation of Anticipated Expenditures Resulting from Rentals by Fiscal Year
Maintenance and Repair(C) Actual Use of Revenue Generated from Rentals in Prior Year
Reference Distribution of Revenues(D) Explanation of Amendments Made to Existing Leases
Not Currently Available**
254
Exhibit PB-34 Revenue from Leasing Out of DoD AssetsFebruary 2003
Ms. Valerie Turner/(703) 695-7174

DEPARTMENT OF THE ARMYFY 2004/2005 BIENNAL BUDGET ESTIMATES
REVENUE FROM LEASING OUT OF DEPARTMENT OF DEFENSE ASSETS
FY 2002 FY 2003 FY 2004 FY 2005
LEASE: DA49-080ENG-443 $15,552 $15,552 $15,552 $15,552(A) Explanation of Lease
Fort Belvoir/Housing(B) Explanation of Anticipated Expenditures Resulting from Rentals by Fiscal Year
Maintenance and Repair(C) Actual Use of Revenue Generated from Rentals in Prior Year
Reference Distribution of Revenues(D) Explanation of Amendments Made to Existing Leases
Not Currently Available**
LEASE: DA49-080ENG-512 $100 $100 $100 $100(A) Explanation of Lease
Fort Belvoir/Housing(B) Explanation of Anticipated Expenditures Resulting from Rentals by Fiscal Year
Maintenance and Repair(C) Actual Use of Revenue Generated from Rentals in Prior Year
Reference Distribution of Revenues(D) Explanation of Amendments Made to Existing Leases
Not Currently Available**
LEASE: DACA65-1-97-9 $250 $0 $0 $0(A) Explanation of Lease
Fort Eustis/Receiver Building(B) Explanation of Anticipated Expenditures Resulting from Rentals by Fiscal Year
Maintenance and Repair(C) Actual Use of Revenue Generated from Rentals in Prior Year
Reference Distribution of Revenues(D) Explanation of Amendments Made to Existing Leases
Not Currently Available**
255
Exhibit PB-34 Revenue from Leasing Out of DoD AssetsFebruary 2003
Ms. Valerie Turner/(703) 695-7174

DEPARTMENT OF THE ARMYFY 2004/2005 BIENNAL BUDGET ESTIMATES
REVENUE FROM LEASING OUT OF DEPARTMENT OF DEFENSE ASSETS
FY 2002 FY 2003 FY 2004 FY 2005
* LEASE: DACA31-1-01-003 $5,950 $5,950 $5,950 $5,950(A) Explanation of Lease
FortMyer/Banking(B) Explanation of Anticipated Expenditures Resulting from Rentals by Fiscal Year
Maintenance and Repair(C) Actual Use of Revenue Generated from Rentals in Prior Year
Reference Distribution of Revenues(D) Explanation of Amendments Made to Existing Leases
Not Currently Available**
LEASE: DACA31-1-97-087 $46,000 $46,000 $46,000 $46,000(A) Explanation of Lease
Fort Belvoir/Banking(B) Explanation of Anticipated Expenditures Resulting from Rentals by Fiscal Year
Maintenance and Repair(C) Actual Use of Revenue Generated from Rentals in Prior Year
Reference Distribution of Revenues(D) Explanation of Amendments Made to Existing Leases
Not Currently Available**
LEASE: DACW31-1-01-003 $10,000 $10,000 $10,000 $10,000(A) Explanation of Lease
Fort Myer/Recreation(B) Explanation of Anticipated Expenditures Resulting from Rentals by Fiscal Year
Maintenance and Repair(C) Actual Use of Revenue Generated from Rentals in Prior Year
Reference Distribution of Revenues(D) Explanation of Amendments Made to Existing Leases
Not Currently Available**
256
Exhibit PB-34 Revenue from Leasing Out of DoD AssetsFebruary 2003
Ms. Valerie Turner/(703) 695-7174

DEPARTMENT OF THE ARMYFY 2004/2005 BIENNAL BUDGET ESTIMATES
REVENUE FROM LEASING OUT OF DEPARTMENT OF DEFENSE ASSETS
FY 2002 FY 2003 FY 2004 FY 2005
LEASE: DACA-31-1-82-126 $5,950 $5,950 $5,950 $5,950(A) Explanation of Lease
Fort Myer/Banking(B) Explanation of Anticipated Expenditures Resulting from Rentals by Fiscal Year
Maintenance and Repair(C) Actual Use of Revenue Generated from Rentals in Prior Year
Reference Distribution of Revenues(D) Explanation of Amendments Made to Existing Leases
Not Currently Available**
LEASE: Multiple Leases $71,173 $33,421 $31,049 $31,049(A) Explanation of Lease
Multiple Locations/Unspecified Purpose(B) Explanation of Anticipated Expenditures Resulting from Rentals by Fiscal Year
Maintenance and Repair(C) Actual Use of Revenue Generated from Rentals in Prior Year
Reference Distribution of Revenues(D) Explanation of Amendments Made to Existing Leases
Not Currently Available**
LEASE: Multiple Leases $26,330 $18,830 $18,830 $18,830(A) Explanation of Lease
Multiple Locations/Banking(B) Explanation of Anticipated Expenditures Resulting from Rentals by Fiscal Year
Maintenance and Repair(C) Actual Use of Revenue Generated from Rentals in Prior Year
Reference Distribution of Revenues(D) Explanation of Amendments Made to Existing Leases
Not Currently Available**
257
Exhibit PB-34 Revenue from Leasing Out of DoD AssetsFebruary 2003
Ms. Valerie Turner/(703) 695-7174

DEPARTMENT OF THE ARMYFY 2004/2005 BIENNAL BUDGET ESTIMATES
REVENUE FROM LEASING OUT OF DEPARTMENT OF DEFENSE ASSETS
FY 2002 FY 2003 FY 2004 FY 2005
WASHINGTONLEASE: DA45-164C-63-290 $665 $665 $665 $665
(A) Explanation of LeasePasco/Industrial
(B) Explanation of Anticipated Expenditures Resulting from Rentals by Fiscal YearMaintenance and Repair
(C) Actual Use of Revenue Generated from Rentals in Prior YearReference Distribution of Revenues
(D) Explanation of Amendments Made to Existing LeasesNot Currently Available**
LEASE: DACA67-1-01-064 $550 $550 $550 $550(A) Explanation of Lease
Fort Lewis/Child Development Center(B) Explanation of Anticipated Expenditures Resulting from Rentals by Fiscal Year
Maintenance and Repair(C) Actual Use of Revenue Generated from Rentals in Prior Year
Reference Distribution of Revenues(D) Explanation of Amendments Made to Existing Leases
Not Currently Available**
* LEASE: DACA671690010400 $25 $25 $25 $25(A) Explanation of Lease
Fort Lewis/Education(B) Explanation of Anticipated Expenditures Resulting from Rentals by Fiscal Year
Maintenance and Repair(C) Actual Use of Revenue Generated from Rentals in Prior Year
Reference Distribution of Revenues(D) Explanation of Amendments Made to Existing Leases
Not Currently Available**
258
Exhibit PB-34 Revenue from Leasing Out of DoD AssetsFebruary 2003
Ms. Valerie Turner/(703) 695-7174

DEPARTMENT OF THE ARMYFY 2004/2005 BIENNAL BUDGET ESTIMATES
REVENUE FROM LEASING OUT OF DEPARTMENT OF DEFENSE ASSETS
FY 2002 FY 2003 FY 2004 FY 2005
LEASE: DACA67-1-80-241 $100 $100 $100 $100(A) Explanation of Lease
Fort Lewis/Museum(B) Explanation of Anticipated Expenditures Resulting from Rentals by Fiscal Year
Maintenance and Repair(C) Actual Use of Revenue Generated from Rentals in Prior Year
Reference Distribution of Revenues(D) Explanation of Amendments Made to Existing Leases
Not Currently Available**
LEASE: DACA67-1-83-328 $75 $75 $75 $75(A) Explanation of Lease
Fort Lewis/Admin(B) Explanation of Anticipated Expenditures Resulting from Rentals by Fiscal Year
Maintenance and Repair(C) Actual Use of Revenue Generated from Rentals in Prior Year
Reference Distribution of Revenues(D) Explanation of Amendments Made to Existing Leases
Not Currently Available**
LEASE: DACA671850034700 $100 $100 $100 $100(A) Explanation of Lease
Fort Lewis/Banking(B) Explanation of Anticipated Expenditures Resulting from Rentals by Fiscal Year
Maintenance and Repair(C) Actual Use of Revenue Generated from Rentals in Prior Year
Reference Distribution of Revenues(D) Explanation of Amendments Made to Existing Leases
Not Currently Available**
259
Exhibit PB-34 Revenue from Leasing Out of DoD AssetsFebruary 2003
Ms. Valerie Turner/(703) 695-7174
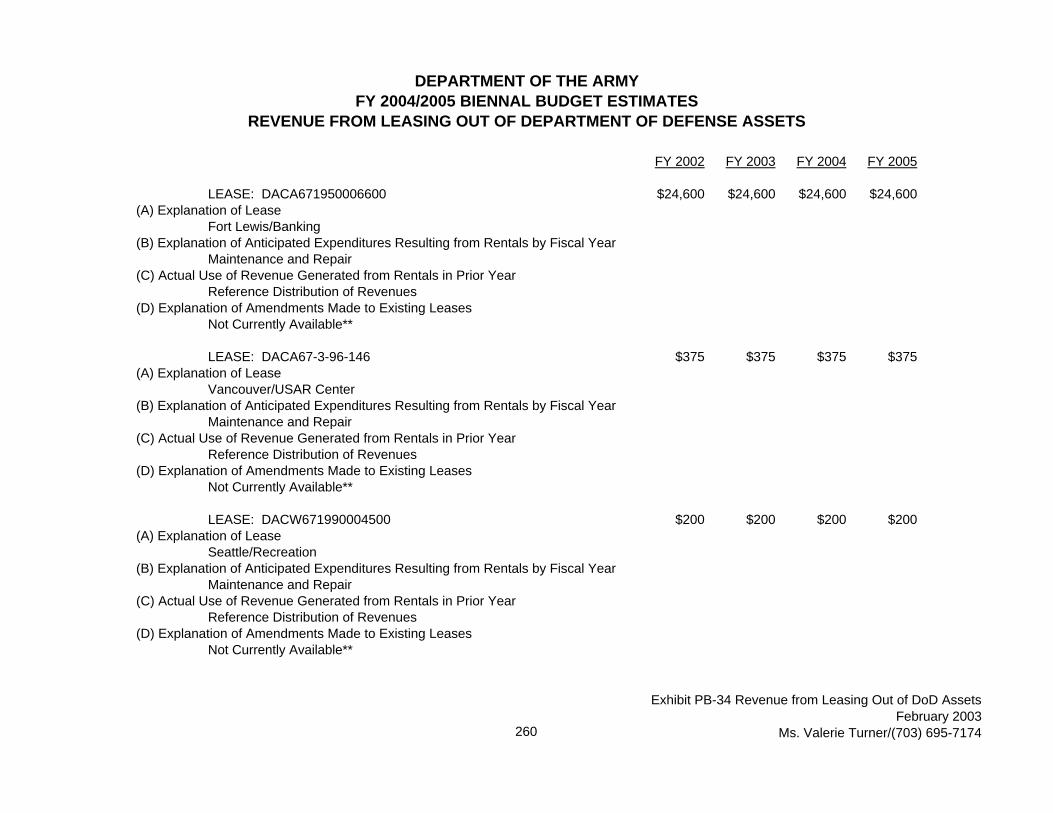
DEPARTMENT OF THE ARMYFY 2004/2005 BIENNAL BUDGET ESTIMATES
REVENUE FROM LEASING OUT OF DEPARTMENT OF DEFENSE ASSETS
FY 2002 FY 2003 FY 2004 FY 2005
LEASE: DACA671950006600 $24,600 $24,600 $24,600 $24,600(A) Explanation of Lease
Fort Lewis/Banking(B) Explanation of Anticipated Expenditures Resulting from Rentals by Fiscal Year
Maintenance and Repair(C) Actual Use of Revenue Generated from Rentals in Prior Year
Reference Distribution of Revenues(D) Explanation of Amendments Made to Existing Leases
Not Currently Available**
LEASE: DACA67-3-96-146 $375 $375 $375 $375(A) Explanation of Lease
Vancouver/USAR Center(B) Explanation of Anticipated Expenditures Resulting from Rentals by Fiscal Year
Maintenance and Repair(C) Actual Use of Revenue Generated from Rentals in Prior Year
Reference Distribution of Revenues(D) Explanation of Amendments Made to Existing Leases
Not Currently Available**
LEASE: DACW671990004500 $200 $200 $200 $200(A) Explanation of Lease
Seattle/Recreation(B) Explanation of Anticipated Expenditures Resulting from Rentals by Fiscal Year
Maintenance and Repair(C) Actual Use of Revenue Generated from Rentals in Prior Year
Reference Distribution of Revenues(D) Explanation of Amendments Made to Existing Leases
Not Currently Available**
260
Exhibit PB-34 Revenue from Leasing Out of DoD AssetsFebruary 2003
Ms. Valerie Turner/(703) 695-7174

DEPARTMENT OF THE ARMYFY 2004/2005 BIENNAL BUDGET ESTIMATES
REVENUE FROM LEASING OUT OF DEPARTMENT OF DEFENSE ASSETS
FY 2002 FY 2003 FY 2004 FY 2005
LEASE: Mulitiple Leases $202,599 $182,669 $119,944 $119,944(A) Explanation of Lease
Multiple Locations/Unspecified Purpose(B) Explanation of Anticipated Expenditures Resulting from Rentals by Fiscal Year
Maintenance and Repair(C) Actual Use of Revenue Generated from Rentals in Prior Year
Reference Distribution of Revenues(D) Explanation of Amendments Made to Existing Leases
Not Currently Available**
WEST VIRGINIALEASE: DACA31-1-97-633 $1,400 $1,400 $1,400 $1,400
(A) Explanation of LeaseMartinsburg/Banking
(B) Explanation of Anticipated Expenditures Resulting from Rentals by Fiscal YearMaintenance and Repair
(C) Actual Use of Revenue Generated from Rentals in Prior YearReference Distribution of Revenues
(D) Explanation of Amendments Made to Existing LeasesNot Currently Available**
LEASE: DACA69-1-82-0154 $20,000 $20,000 $20,000 $20,000(A) Explanation of Lease
Hinton/Storage(B) Explanation of Anticipated Expenditures Resulting from Rentals by Fiscal Year
Maintenance and Repair(C) Actual Use of Revenue Generated from Rentals in Prior Year
Reference Distribution of Revenues(D) Explanation of Amendments Made to Existing Leases
Not Currently Available**
261
Exhibit PB-34 Revenue from Leasing Out of DoD AssetsFebruary 2003
Ms. Valerie Turner/(703) 695-7174

DEPARTMENT OF THE ARMYFY 2004/2005 BIENNAL BUDGET ESTIMATES
REVENUE FROM LEASING OUT OF DEPARTMENT OF DEFENSE ASSETS
FY 2002 FY 2003 FY 2004 FY 2005
LEASE: DACA69-1-91-0018 $12 $12 $12 $12(A) Explanation of Lease
Justice/Industrial(B) Explanation of Anticipated Expenditures Resulting from Rentals by Fiscal Year
Maintenance and Repair(C) Actual Use of Revenue Generated from Rentals in Prior Year
Reference Distribution of Revenues(D) Explanation of Amendments Made to Existing Leases
Not Currently Available**
LEASE: Multiple Leases $9,340 $4,900 $4,900 $4,900(A) Explanation of Lease
Multiple Locations/Recreation(B) Explanation of Anticipated Expenditures Resulting from Rentals by Fiscal Year
Maintenance and Repair(C) Actual Use of Revenue Generated from Rentals in Prior Year
Reference Distribution of Revenues(D) Explanation of Amendments Made to Existing Leases
Not Currently Available**WISCONSIN
LEASE: Multiple Leases $68,790 $68,790 $68,790 $68,790(A) Explanation of Lease
Badger AAP/Storage & Industrial(B) Explanation of Anticipated Expenditures Resulting from Rentals by Fiscal Year
Maintenance and Repair(C) Actual Use of Revenue Generated from Rentals in Prior Year
Reference Distribution of Revenues(D) Explanation of Amendments Made to Existing Leases
Not Currently Available**
262
Exhibit PB-34 Revenue from Leasing Out of DoD AssetsFebruary 2003
Ms. Valerie Turner/(703) 695-7174

DEPARTMENT OF THE ARMYFY 2004/2005 BIENNAL BUDGET ESTIMATES
REVENUE FROM LEASING OUT OF DEPARTMENT OF DEFENSE ASSETS
FY 2002 FY 2003 FY 2004 FY 2005
LEASE: Multiple Leases $14,405 $11,805 $11,805 $11,805(A) Explanation of Lease
Multiple Locations/Recreation(B) Explanation of Anticipated Expenditures Resulting from Rentals by Fiscal Year
Maintenance and Repair(C) Actual Use of Revenue Generated from Rentals in Prior Year
Reference Distribution of Revenues(D) Explanation of Amendments Made to Existing Leases
Not Currently Available**
$5,381,878 $4,844,063 $4,491,129 $4,491,129
263
Exhibit PB-34 Revenue from Leasing Out of DoD AssetsFebruary 2003
Ms. Valerie Turner/(703) 695-7174