Embed Size (px)
Citation preview

2012/13 • EPRE • Vote 8 - Roads and Transport
345
VOTE 8
DEPARTMENT OF ROADS AND TRANSPORT
To be appropriated by vote R 4 363 790 000Responsible MEC MEC for Roads and TransportAdministering Department Department of Roads and TransportAccounting Offi cer Head of Department
1. OVERVIEW
The Gauteng Department of Roads and Transport (GDRT) is the main contributor to the provincial outcomes of providing an environmentally sustainable road infrastructure and integrated transport system that is reliable, accessible, safe and affordable and has a broad range of socio-economic effects. These include the benefits flowing from increased accessibility, employment creation, increased efficiency and social inclusion of all citizens of the province.
VisionWorld-class roads and transport infrastructure networks and systems that facilitate seamless mobility of goods and people within Gauteng.
MissionTo provide an environmentally sustainable road infrastructure and integrated transport systems and services that are reliable, accessible, safe, and affordable and which promote socio-economic development in Gauteng.
Key Strategic objectives • To ensure the availability of overall management and administrative support functions; • To provide a balanced and equitable road network; • To plan, regulate and facilitate the provision of public and freight transport services ; and • To ensure the efficient management and implementation of the Gautrain.
Departmental measurable objectives • To contribute to the achievement of departmental outcomes; • To develop and maintain a sustainable road infrastructure that contributes to the increased economic growth
and enhanced quality of life in Gauteng; • To develop the policy framework in support of a modern, integrated and intelligent transport system; • To contribute to the regulation of transport-related carbon emissions; • Through green transport, to contribute to environmental protection; • To provide public transport infrastructure to promote integration and inter-modality of public transport modes ; • To regulate public transport operations through the issuing of operating licenses and permits; • To regulate public transport operations through the registration of associations; • To issue valid drivers’ licenses; and • To issue valid vehicle licenses.
Acts, rules and regulations Schedule 4 and 5 of the Constitution of South Africa empowers provinces with concurrent competencies with national government, and with exclusive legislative competencies in specific functional areas such as public transport, provincial road and public works.

Vote 8 - Roads and Transport • EPRE • 2012/13
346
Key legislation and policies that impact on the mandate of the GDRT include: • Gauteng Transport Framework Revision Bill, 2008; • Government Immoveable Assets Management Bill, 2006; • Gautrain Agency Management Act, 2006; • Gauteng Planning and Development Act, 2003; • Gauteng Transport Framework Revision Act, 2002; • Planning Professions Act, 2002; • Gauteng Public Passenger Road Transport Act, 2001; • Gauteng Transport Infrastructure Act, 2001; • National Spatial Development Perspective; • Architectural Profession Act, 2000; • Built Environment Professions Act, 2000; • Construction Industry Development Board Act, 2000; • Engineering Profession Act, 2000; • Landscape Architectural Profession Act, 2000; • National Land Transport Transition Act, 2000; • Project and Construction Management Act, 2000; • Property Valuers’ Profession Act, 2000; • Road Traffic Management Corporation Act, 1999; • National Environmental Management Act, 1998; • National Road Traffic Act, 1996; • Occupational Health and Safety Act, 1993 (and particularly the associated construction regulations) • Road Traffic Act, 1989; and • Standards Act, 1982 (and particularly the associated National Building Regulations).
1.1 Aligning departmental budgets to achieve prescribed outcomesThe functions of the Department relate to delivery of outputs that support four government outcomes: creating decent work and building a growing, inclusive economy; vibrant, equitable and sustainable rural communities and food security for all; sustainable human settlements and improved quality of household life; and an efficient, effective and development-oriented public service and empowered, fair and inclusive citizenship.
The DRT has initiated the development of outcome statements in relation to the relevant government outcomes. It has consulted lead and support departments pivotal to the realization of the decent work outcome, including consultations focused on the content, costing and budgeting for key projects that support the outcome statements.The Department plays a key role in the implementation of the decent work outcome through the provision of transport infrastructure, transport regulation services and transport planning services. The Department contributes to the Provincial Rural Development Strategy through the construction of the rural roads infrastructure. It will contribute to the Inner City Renewal Programme through the construction of road linkages, which in turn contribute to the provincial outcome of sustainable human settlements.
The administrative functions of the Department contribute to the public service and inclusive citizenship outcome.As it is a new focus within government, the outcomes planning and budgeting process has required extra effort within limited timeframes, and departments have had to focus on developing their plans for their own lead roles and at the same time on their supporting roles aligned with the lead roles of other departments. Ensuring proper alignment has therefore posed a challenge. The province will continue to confront this challenge during further implementation of outcomes planning and budgeting.
2. REVIEW OF THE CURRENT FINANCIAL YEAR (2011 /12)
The budget that was allocated for the 2011/12 financial year was in line with the provincial outcomes that the Department contributes towards; the projects are also accordingly aligned with these outcomes.
Outcome 4: Decent employment through inclusive economic growthThe work of the Department is linked to this outcome and it will strive to provide affordable new transport infrastructure and upgraded current infrastructure and systems. There will also be a focus on promoting accessibility to economic hubs and creating jobs for the citizens in the province. The Department will contribute to this outcome through the construction and maintenance of the provincial road network.

2012/13 • EPRE • Vote 8 - Roads and Transport
347
DesignThe designs on the Tarlton, K154 and R25 roads have been completed over the 2011/12 financial year. The land appropriation on K46 and K71 have progressed during the financial year with substantial payments being made, however the other land projects as per the ECE did not materialise because negotiations between the Department and land owners that could not be finalised before the end of the financial year and the results of the surveys on the land were also not finalised.
ConstructionThe construction projects purpose is to construct, upgrade, rehabilitate and manage the execution of transport infrastructure in order to have a complete transport network which provides access and mobility for the people of Gauteng in execution of economic and social activities. This is all done in pursuit of economic growth and investments through the provision of appropriate transport systems and socio-economic infrastructure.
The projects under construction are grouped into two classes namely the Capital Projects which involves the upgrading rehabilitation and construction of provincial roads and the 20 Prioritised Township Projects (20PTP), which involves the upgrading of gravel roads in previously disadvantaged black communities including deteriorated or gravel arterial township roads. In both project classes job creation, skills development and contractor development are priority aspects which are enhanced through the project management systems.
The achievements related to construction include: • The completion of the K29 Malibongwe road (Phase 3), from the N14 highway to the Lanseria airport; • The completion of Road LE3 which is one of the 20PTP projects located in Soshanguve in Tshwane. It
was being upgraded from gravel to surfaced, and included the construction of the related stormwater infrastructure and paving;
• The commencement of project R82 which along the Eikenhof- Vereniging Road; and • The completion of Bolani Road which is a 20PTP road in Soweto, just next to Jabulani.
MaintenanceThe purpose of maintenance is to maintain provincial roads, preserving them to their original design and includes routine maintenance, safety maintenance, reseals and re-gravelling. The preventative maintenance programme was revived in the current financial year and mainly funded the following roads: • There has been budget allocated to the rehabilitation of the N14, specifically the sinkhole that has not been
given attention over the last financial years. The work commenced in the 4th quarter and is expected to continue over the 2012/13 financial year.
• The project to perform heavy rehabilitation on the M1 highway (between the Buccleugh interchange and Corlett drive) has commenced in the 4th quarter.
• The project to perform heavy rehabilitation on the Ben Schoeman highway (between the Brakfontein interchange and Potgieter Street in Pretoria city centre) has commenced in the 4th quarter.
There has been site handover to perform rehabilitation on the Tarlton as well as the R25 Bapsfontein roads. These projects have commenced in the 4th quarter and will continue into the following financial year. Furthermore, there is light rehabilitation and reseals currently being performed on a total of 15 projects throughout the province.
Transport projectsIntermodal Public Transport Facilities (IPTN)Construction on the Bophelong and Zandspruit IPTNs has been in progress during the financial year and is anticipated to continue into the following financial year. The planning for the Vereeniging and Germiston IPTNs has progressed well and there are clear indications that the construction can commence in the following financial year.
Non-Motorised Transport (NMT)A total of 17km walkways have been constructed in Metsweding and West Rand municipalities. This project will continue in the following financial year within different locations throughout the province.
TOLABSThe plan was for the Department to implement 2 TOLABS in the current financial year, Tshwane and Derek Masoek, and as such significant budget allocations were made for both projects. However, the delays in the Derek Masoek project resulted in the budget being reprioritised to other areas that were experiencing pressure during the 2011 Adjustment budget process. In relation to the Tshwane, which includes 2 phases, refurbishment

Vote 8 - Roads and Transport • EPRE • 2012/13
348
of the existing location as well as the construction of testing facilities, there has been significant progress over the last 2 quarters of the financial year. All the testing equipment has been procured and the project is expected to close in the following financial year.
Bus SubsidiesThe Department has managed all 34 bus contracts successfully, and plans are underway to ensure that the monitoring that is currently occurring on some of the contracts is extended to all the contracts. The Department was allocated with a roll-over on the Public Transport Operations Grant that will allow the Department to settle all the payments on the bus contracts in the current financial year.
Registration processThe Department is responsible for the registration of all public transport modes and operators. The focus of this programme for the 2011/12 planning cycle is on expanding their service delivery infrastructure to increase the volume of properly registered operators and fully registered associations. A further priority is the formalisation of public transport.
DLTCThe Department has, embarked on a process to locate Driving License Testing Centres (DLTC) in municipalities. This initiative is responding to the government’s call of taking services to the people, thereby promoting access to Government services and service improvement and eliminating fraud and corruption at the Driving License Testing Centres. According to the Departmental plans the Kliptown DLTC was a major deliverable for the 2011/12 financial year, and as such the procurement processes commenced during the 3rd quarter, with the service provider commencing construction during the 4th quarter.
Vehicle RegistrationIt is a legal requirement that all vehicles by law are registered, whether on the road or not, until they are officially deregistered. The number of vehicles registered during the first 3 quarters of the financial year was over 4 million, with over 60 per cent of them being paid on time. This has resulted in revenue accruing to the Department of R1.7 billion that was more than the targeted R1.3 billion for the same period. Extensive effort was made to ensure that targets were met or exceeded, and the accessibility of the services at post offices has greatly assisted, and that is reflected in the higher than targeted 84 per cent of vehicles being registered.
Operator License and PermitsThe Department plays a regulatory role in issuing permits and operating licences to public transport operators. During the financial year, a total of 4 997 permits were issued, which was more than the targeted output of 5 000 mainly as a result of the increased applications received from bus companies contracted with Gautrain. Furthermore, a total of 2 750 permits were converted of a target of 3 500 for the 3 quarters of the financial year as a result of the reported challenges encountered with the NLTIS, the system that issues these licenses. This system is managed by the National Department of Transport (NDOT) and is extremely slow and is often not available, however NDOT is preparing to re-design the system.
Gautrain Management Agency (GMA)The GMA, established in terms of the GMA Act has a responsibility to ensure that the Gautrain Concession Agreement is fully implemented. The major achievements of the GMA over the 2011/12 financial year include the following: • On the 28th of July 2011, Bombela and Province reached agreement to commence operations over part of
the Phase 2 System (Extended Phase 1), prior to the completion of the water ingress tunnel works; • The Railway Safety Regulator issued the Safety Certificate on 11 July 2011, and Bombela commenced with
revenue services on the North-South railway line between Hatfield and Rosebank Stations on 2 August 2011; • On 29 August 2011, a temporary bus service was opened between Rosebank Station and Johannesburg
CBD; • Since the commencement of EP1, ridership on the system has steadily increased and the Gautrain has built
up a good patronage base; • Through ongoing marketing efforts on the Dedicated Feeder and Distribution Service routes, the patronage
on DFDS has grown exceptionally well; and • The tunnel remedial works are progressing fairly well, and Province believes that depending on the outcome
of the works, OCD2 may occur between March and April 2012.

2012/13 • EPRE • Vote 8 - Roads and Transport
349
Outcome 5: Vibrant, equitable, sustainable rural communities contributing to food security for allRegarding the contribution of the department to the development of rural communities’ road infrastructure, In relation to the re-gravelling of rods, the Department has managed to re-gravel 203km on the 347km as per the target. This project is mainly to increase mobility and access to and from the rural nodes within the province. The lower output is mainly as a result of the rainy season that has not abated in the 4th quarter.
In relation to the Department’s Corporate Social Responsibility programme, the Shovakalula programme, the planning and construction of bicycle storage facilities was completed with the identification of the schools and beneficiaries done. The distribution of the bicycles commenced in the 4th quarter in line with the start of the school calendar.
Outcome 6: Sustainable human settlements and improved quality of household lifeThe 20 prioritised townships programme that has been running over the last few financial years and is continuing as scheduled. The achievements related to this in the 2011/12 financial year were: • The finalisation of Bolani road in Jabulani, Soweto. The construction was meant to eliminate the traffic
congestion around the area. Only the retentions will be paid in the 2012/13 financial year. • Road LE3 is one of the 20PTP projects located in Soshanguve, Tshwane. It has been upgraded from gravel
to surfaced road, and included the construction of the related stormwater infrastructure and paving.
Outcome 8: An ef cient, effective and development-orientated public service and empowered, fair and inclusive citizenship In order to build the capacity of the Department for good governance and effective service delivery, a total of 11 bursaries have been awarded to external candidates in a range of disciplines including transport engineering and economics. Notwithstanding the financial constraints, there has also been expenditure in relation to training and development of employees during the financial year.
The personnel structure has also posed serious challenges for the Department, with the units unable to recruit any for any required posts, even the critical posts, until this structure has been finalised. All the consultations with labour have been conducted in line with the requirements of the Departmental Change Management Project Team (DMPT). The proposed structure has been submitted to the Department of Public Service and Administration (DPSA) for approval.
3. OUTLOOK FOR THE COMING FINANCIAL YEAR (2012 /13)
The Department has allocated the budget for the 2012/13 financial year in line with the provincial outcomes it is contributing towards; projects are thus aligned with the outcomes.
Outcome 4: Decent employment through inclusive economic growthThe overall mandate of the Department is linked to this outcome, in the plans to provide affordable new transport infrastructure and upgrade the current infrastructure and systems. There will also be a focus on promoting accessibility to major economic hubs and creating jobs for the citizens in the province. The Department will contribute to this outcome through the construction and maintenance of the provincial road network.
ConstructionAll the roads that would have been committed in the 2011/12 financial year will continue into this financial year, with some expected to be finalised by the end of the financial year. Some of the major projects that will be implemented in the funding allocated to the Construction sub-unit include: • The upgrading of Voortrekker road (R55) between Wierda Road (M10, Sunderlandridge) and Main Road
(M26, Laudium) - P66/1; • Doubling of Old Vereeniging Road between Eikenhof (D766) and Walkerville (D1073) ; • Tarring of Cayman Rd as an access road to the Eye of Africa Development (phase 2); • Upgrading of road K154 from a gravel road to a surfaced carriageway as part of the Gauteng Highlands
project (Eikenhof); and • Upgrading of Nederveen Rd (R103), from Leondale Forsdick Road (R554) to Barry Marias Road (R21).
MaintenanceThe goal of the province of performing maintenance on the provincial road network will continue to be the main focus of the Department, and resources will be directed towards this. The Provincial Roads Maintenance Grant

Vote 8 - Roads and Transport • EPRE • 2012/13
350
(PRMG) from the National Department Of Transport (NDOT) will be utilised for the attainment of this goal, through the routine maintenance programme.
A number of the preventative maintenance projects will continue in this financial year. This programme will involve single and double reseal, light and heavy rehabilitation and the re-gravelling of gravel roads within the rural nodes in order to increase accessibility into these rural areas. In the long run, it is expected to reduce the amount of routine maintenance that the Department undertakes on the roads, by eliminating or reducing the reactionary approach that has been followed over the years.
GautrainThe focus of the GMA over this financial year will be on the following performance milestones: • Stabilizing the System through conducting various audits and ensuring that all systems built to manage
service and technical processes are operating as designed; • Optimizing the System through various options and expanding capacity to accommodate peak period spikes
and general increase in patronage; • Finalizing the new train plan (timetable); • Further developing the Dedicated Feeder and Distribution Service by expanding on routes, and acquiring
additional, lower capacity buses; • Expanding parking capacity at Rhodesfield Station by constructing additional parking bays at existing station,
and acquiring additional land for further expansion; • Informally identifying and investigating possible future extensions to the system.
Intermodal Public Transport FacilitiesThe Department will be focusing on the construction of 3 facilities within the province, within the Vereeniging and Germiston areas; and will commence planning for the Pienaarspoort transport facility. There are other facilities that are planned over the MTEF.
NMTThe completion of the West Rand and Metsweding District municipalities in the previous financial year will result in the payments of the retentions in line with the contract in the 2012/13 financial year. The Department will be focusing on the construction of walkways and bicycle lanes in Ekurhuleni, Sedibeng (along the Wessil Mota Street) as well as Tshwane (along the Phatudi and Hinterland streets). The planning and construction of the NMTs in other areas within the province will occur over the MTEF.
TOLABSThe Tshwane TOLAB will continue as scheduled in line with the project plan. It expected that the renovations at the Germiston TOLAB will commence in the second quarter of the 2012/13 financial year, whilst during the first quarter focus will be on the tendering and procurement processes. This TOLAB has over the years been utilised as a base for testing of vehicles and uplifting of operating licenses. However with the envisaged renovations, it is expected that the TOLAB will also be utilised to render services on the registration of public transport operators located in this respective region and process and issue operating licenses.
Bus SubsidiesBus subsidisation is set to continue during this year, with the budget for the conditional grant growing marginally to allow for these payments. The services will continue within the same municipalities, and research is underway to assess the viability of extending the services to other municipalities. There will be rigorous monitoring on the services offered by the bus operators to ensure that the services being offered are as per the contract conditions. To enforce the regulatory frameworks that ensure the safety of the public and private transport on the roads, the Department will continue to facilitate the issuing of operating licences or permits to public transport operators, and drivers’ licences.
Outcome 5: Vibrant, equitable, sustainable rural communities contributing to food security for allThe Department aims to contribute to the development of rural communities’ road infrastructure through the construction of rural roads to ensure accessibility by farm communities to mainstream economic hubs. With the designs and market analysis done in the 2011/12 financial year, the main focus for the 2012/13 financial year will be the upgrading of the identified within the Maize Triangle corridor, as well as develop a transport plan in liaison with the Department of Agriculture and Rural Development which will be focusing on a range of objectives, some of which are the following:

2012/13 • EPRE • Vote 8 - Roads and Transport
351
• Analysing the capacity of the network from a rail and road perspective; • Improving the transportation links from farming areas around Johannesburg and Sedibeng, Kungwini and
Westrand District Municipalities; and • Link proposed solutions with the Gauteng Strategic Road Network and other existing transport plans.
Outcome 6: Sustainable human settlements and improved quality of household lifeThese are township projects involving the upgrading of gravel roads in previously disadvantaged black communities established before 1994. To date, six additional townships have been added to the original twenty which were covered under the programme. The mandate of the programme was also recently revised to accommodate deteriorated or gravel arterial township roads regardless of the year the township was established.In the 2012/13 the following 20 PT projects will be completed: • Thulani B roads in Soweto ; • Sekweri in Metsweding; and • Mogo in Soshanguve.
Outcome 8: An ef cient, effective and development-orientated public service and empowered, fair and inclusive citizenship In order to build the capacity of the Department for good governance and effective service delivery, it will be offering bursaries to external candidates in a range of disciplines including transport engineering and economics, as well as allocating funds for training and development of employees. The personnel structure will be implemented in phases depending on the availability of funding.
4. RECEIPTS AND FINANCING
4.1 Summary of receiptsThe Department’s revenue is sourced from the equitable share and conditional grants. The conditional grants allocated to the Department are: • Public Transport Operations grant to fund bus subsidization within the province ; • The Gautrain DORA Conditional grant, utilized to fund the Gautrain Rapid Rail Link Project for the
implementation of the Gautrain system; and • The Provincial Roads Maintenance grant that will be utilised for the maintenance of roads.
TABLE 1: SUMMARY OF RECEIPTS: ROADS AND TRANSPORT
OutcomeMain
appropriationAdjusted
appropriationRevised estimate
Medium-term estimates
R thousand 2008/09 2009/10 2010/11 2011/12 2012/13 2013/14 2014/15Equitable share 6 097 551 4 975 899 1 353 823 4 091 675 4 207 849 4 207 849 2 158 963 4 542 053 4 794 646Conditional grants 3 265 993 4 424 799 5 613 824 2 149 829 2 149 829 2 149 829 2 204 827 2 369 592 2 489 380Gautrain Rapid Rail Link Grant 3 265 993 2 976 720 912 498 5 300 5 300 5 300 Overload Control Grant 5 034 Public Transport Operations Grant 1 043 826 1 496 442 1 577 612 1 577 612 1 577 612 1 625 746 1 714 344 1 801 078Infrastructure Grant to Provinces 399 219 Provincial Roads Maintenance Grant 462 164 566 917 566 917 566 917 579 081 655 248 688 302Total receipts 9 363 544 9 400 698 6 967 647 6 241 504 6 357 678 6 357 678 4 363 790 6 911 645 7 284 026
The Department is funded from both equitable share and conditional grants, and is the highest revenue collector for the province through the vehicle licensing fees. The allocation for the Department decreases from R6.2 billion in 2011/12 to R4.4 billion in 2012/13 mainly as a result of the reduced equitable share allocation for the Gautrain, then increases to R6.9 billion and R7.3 billion in 2013/14 and 2014/15 respectively.
The equitable share allocation increases from R4.1 billion in 2011/12 to R4.8 billion in the last year of the MTEF, an annual increase of 17 per cent. The Gautrain, Overload Control and the Infrastructure conditional grants that the Department was allocated in the previous financial years were stopped in the 2011/12 financial year,

Vote 8 - Roads and Transport • EPRE • 2012/13
352
and will not be allocated over the MTEF. The Provincial Roads Maintenance Grant (PRMG) that was introduced in 2011/12 will continue over the MTEF, growing by 21 percent, from R567 million in 2011/12 to R688 million in the 2014/15 financial year.
4.2 Departmental receipts
TABLE 2: DEPARTMENTAL RECEIPTS: ROADS AND TRANSPORT
OutcomeMain
appropriationAdjusted
appropriationRevised estimate
Medium-term estimates
R thousand 2008/09 2009/10 2010/11 2011/12 2012/13 2013/14 2014/15Tax receipts 1 183 906 1 534 213 1 705 814 1 775 498 1 775 498 2 151 489 2 120 000 2 247 200 2 382 032Casino taxes Horse racing taxes Liquor licences Motor vehicle licences 1 183 906 1 534 213 1 705 814 1 775 498 1 775 498 2 151 489 2 120 000 2 247 200 2 382 032Sales of goods and services other than capital assets 3 849 20 125 24 004 39 970 23 145 26 615 26 615Transfers received Fines, penalties and forfeits Interest, dividends and rent on land 431 349 4 410 1 380 315 731 1 587 1 825 1 825Sales of capital assets Transactions in fi nancial assets and liabilities 6 489 5 101 8 823 1 507 1 821 3 596 Total departmental receipts 1 190 826 1 539 663 1 722 896 1 798 510 1 801 638 2 195 786 2 144 732 2 275 640 2 410 472
The tax receipts category is largely made up of motor vehicle registration and licensing fees. This revenue is deposited directly into the Provincial Revenue Fund and does not form part of the allocation of the Department. The revenue collected over the past three financial years grew slightly at about 45 per cent over the period. During the 2011/12 financial year, the Department anticipated collecting R1.8 billion but this was marginally increased to R1.8 billion during the Adjustment budget process, and this is further expected to be exceeded judging by the amount that has already been collected and the projection to the end of the financial year as reflected in the revised estimate. This revenue category is expected to show growth over the MTEF as a result of the increases made to the tariffs, increasing from R2.1 billion in the 2012/13 financial year to R2.4 billion in the 2014/15 financial year.
The Department is liable for direct costs which emanate from the collection of motor vehicle licenses by agencies such as municipalities and the South African Post Office on behalf of the Department. The Sales of goods and services other than capital assets comprises fees in respect of abnormal loads licences, duplicate documents licences, permits of authorised officials, sport gathering public road permits, and sale of personalised motor vehicle registrations. This revenue category is projected to record modest growth over the MTEF.
Legal frameworkThe Road Traffic Act provides for collection of motor vehicle licenses. The Act also provides for agreements between the Department, metropolitan areas and local authorities for the collection of license fees on an agency basis. The Department is then liable for about 33 per cent of the collected sum in the form of direct charges to the other agencies.

2012/13 • EPRE • Vote 8 - Roads and Transport
353
Analysis of existing own revenue sources
Motor Vehicle Licence Fees (MVLF)In terms of the National Road Traffic Act (NRTA), the Minister of Transport has devolved certain functions to the provinces. These functions are governed by the NRTA, 1996 and its Regulations as well as the Gauteng Provincial Road Traffic Act, 1997. One of the functions devolved to the province is motor vehicle licence fees and revenue collection in respect of this function.
The Department believes that the cumulative decline in interest rates should improve the financial position of households and make a positive contribution towards the business of the Department. The strong rand should reduce cost pressures on motor vehicles, facilitating stable new vehicle pricing for some time.
5. PAYMENT SUMMARY
5.1 Key assumptionsGuidelines for the compensation budget for the 2011 MTEF were based on the latest wage agreement within the public sector and also take into account the CPIX inflation rate over that period. The rates utilised are 5.6 per cent for 2011/12 and 5 per cent for each of the outer years of the MTEF.
The following have been taken into account when determining personnel budgets for the new MTEF: • Numbers of staff and possible changes over the MTEF; • Basic salary costs including ICS adjustments from 1 July and January each year; • Salary increases for people with scarce skills; • Grades and level of staff; • Increased take up of benefits such as medical aid and homeowners allowance, etc.; • Contract employees; • Overtime pay; • Merit bonuses; • Pension fund contributions, thirteenth cheque and overtime all linked to the basic salary cost (increases at
the same rate); • Medical aid contributions which normally increase more rapidly than inflation; and • Homeowners allowance which changes with the interest rate, and skills development.
5.2 Programme summary
TABLE 3: SUMMARY OF PAYMENTS AND ESTIMATES: ROADS AND TRANSPORT
OutcomeMain
appropriationAdjusted
appropriationRevised estimate
Medium-term estimates
R thousand 2008/09 2009/10 2010/11 2011/12 2012/13 2013/14 2014/151. Administration 118 944 191 409 174 771 164 171 159 171 165 033 210 923 226 572 244 2622. Transport Infrastructure 1 398 716 1 418 555 1 381 685 1 826 437 1 696 817 1 695 567 1 438 342 2 184 885 2 317 6523. Transport Operations 213 658 1 554 562 1 452 124 1 790 525 2 042 880 2 042 880 1 772 129 1 907 037 2 009 7034. Transport Regulation 108 211 175 385 244 279 266 841 239 265 239 248 204 685 176 032 164 7665. Gautrain 7 524 015 6 060 787 3 714 788 2 193 530 2 219 545 2 219 545 737 711 2 417 119 2 547 643Total payments and estimates 9 363 544 9 400 698 6 967 647 6 241 504 6 357 678 6 362 273 4 363 790 6 911 645 7 284 026
The table above indicates the expenditure outcomes and budget allocations as categorised by the programmes within the Department. Total payments over the history were high as a result of payments made in relation to the construction of the Gautrain project which were mainly concluded in the 2010/11 financial year. During 2011/12, the Department’s budget was increased by about 2 percent, mainly as a result of the roll-over approved for the Public Transport Operations Grant (PTOG) and the extra Gautrain allocation received.
Over the MTEF, the budget for the Department will increase from R4.4 billion in 2012/13 to R7.3 billion in 2014/15. The marginal increase of 35 per cent is mainly as a result of the Gautrain allocation that has been

Vote 8 - Roads and Transport • EPRE • 2012/13
354
reduced in the 2012/13 financial year in order to start with the loan repayments, and further increased in the other 2 years of the MTEF, as well as increases in the infrastructure and conditional grants allocations of the Department.
The MTEF allocation will fund the maintenance of the provincial road network, the construction of some of the major roads within the province, the construction of intermodal facilities and the upgrading and construction of DLTCs. The Gautrain has also been funded for maintenance and capacitation of the current system as well as research into future extension of the project. The current budget includes the PRMG within Programme 2 that has been allocated to the Department for the road maintenance programme, as well as the PTOG within Programme 3 for the provision of transport services to the Gauteng public.
5.3 Summary of economic classi cation
TABLE 4: SUMMARY OF PROVINCIAL PAYMENTS AND ESTIMATES BY ECONOMIC CLASSIFICATION: ROADS AND TRANSPORT
R thousand
OutcomeMain
appropriationAdjusted
appropriationRevised estimate
Medium-term estimates
2008/09 2009/10 2010/11 2011/12 2012/13 2013/14 2014/15Current payments 1 644 709 2 172 468 1 833 087 3 931 573 2 117 500 2 121 725 1 414 290 1 697 947 2 002 726Compensation of employees 228 668 346 693 370 159 426 237 418 949 439 804 494 061 527 597 563 410Goods and services 1 411 445 1 824 701 1 446 875 3 505 336 1 694 231 1 677 572 918 429 1 168 550 1 437 516Interest and rent on land 4 596 1 074 16 053 4 320 4 349 1 800 1 800 1 800Transfers and subsidies to: 7 675 747 7 182 349 5 087 711 2 193 530 4 123 527 4 123 895 2 379 129 4 134 182 4 351 440Provinces and municipalities 5 717 8 611 1 500 1 500 1 000 1 000 1 000Departmental agencies and accounts 7 661 641 6 126 118 3 714 778 2 193 530 2 219 545 2 219 547 737 711 2 417 119 2 547 643Universities Foreign governments and international organisations Public corporations and private enterprises 2 563 1 043 946 1 363 564 1 899 222 1 899 222 1 639 199 1 714 844 1 801 578Non-profi t institutions 875 Households 4 951 3 674 9 369 3 260 3 626 1 219 1 219 1 219Payments for capital assets 43 088 45 207 41 473 116 401 116 651 116 653 570 371 1 079 516 929 860Buildings and other fi xed structures 25 477 61 901 61 901 61 901 518 371 1 045 521 903 160Machinery and equipment 12 083 2 960 3 043 22 000 22 250 22 250 12 000 12 000 12 000Heritage Assets Specialised military assets Biological assets Land and sub-soil assets 5 528 42 247 37 091 32 500 32 500 32 502 40 000 21 995 14 700Software and other intangible assets 1 339

2012/13 • EPRE • Vote 8 - Roads and Transport
355
R thousand
OutcomeMain
appropriationAdjusted
appropriationRevised estimate
Medium-term estimates
2008/09 2009/10 2010/11 2011/12 2012/13 2013/14 2014/15Payments for fi nancial assets 674 5 376 Total economic classifi cation 9 363 544 9 400 698 6 967 647 6 241 504 6 357 678 6 362 273 4 363 790 6 911 645 7 284 026
The budget for the compensation of employees has increased steadily from the 2008/09 financial year and will continue to do so over the MTEF period. This budget will however not be adequate for the Department to implement the departmental structure, therefore the Department will ensure that the structure is phased-in up to the total budget allocation to ensure that there is no over expenditure or irregular expenditure under the personnel budget for each of the financial years of the MTEF. The compensation budget is supplemented with an additional amount during the current MTEF to address the capacity of the Department, particularly focusing on the employment of engineers. This intervention is aimed at ensuring that the Department is able to respond to the demands of planning and delivery.
Total payments for goods and services grew steadily as audited, and will continue to grow at a rate of 8.8 per cent over the MTEF. This item includes the budget for Maintenance projects, the departmental operations, the DLTCs as well as the public transport facilities. The budget within the interest on rent and land is for the interest portion on the finance leases of the Department in accordance with the Standard Chart of Accounts (SCOA) classification. Transfers and subsidies mainly consist of Department transfers in relation to the Gautrain project and transfers to bus operators in terms of the PTOG.
The transfers and subsidies item includes payments and budget in relation to the Gautrain project, the transfers to the bus operators in terms of the Public Transport Operations Grants (PTOG), as well as other marginal amounts in terms of vehicle registration for the construction fleet as well as households. The massive reduction in the allocation of the departmental agencies and accounts items in the 2012/13 financial year is as a result of the reduction of the Gautrain allocation as a result of the re-payments on the loan that needed to be made commencing in that financial year. The other major item within transfers and subsidies is in relation to the PTOG as well as transfers in relation to the North-West Star subsidies; these grow marginally over the MTEF.
The budget for payment for capital assets increases substantially over the MTEF mainly as a result of the re-allocation of the capital projects budget, including the construction budget within the Roads infrastructure programme, in line with the SCOA instruction to Departments. Other items within CAPEX are for the proclamation of land for road construction.
5.4 Infrastructure payments
5.4.1 Departmental Infrastracture Payments TABLE 5: DEPARTMENTAL INFRASTRUCTURE PAYMENTS: ROADS AND TRANSPORT
OutcomesMain
appropriationAdjusted
appropriationRevised estimate
Medium-term estimates
R Thousand 2008/09 2009/10 2010/11 2011/12 2012/13 2013/14 2014/15Payments for infrastructure by category New and replacement assets 5 015 443 5 212 691 82 644 144 202 97 314 80 875 63 150 156 800 130 000
Existing infrastructure assets 1 141 823 1 194 452 1 022 808 1 502 265 1 401 089 975 367 1 181 830 1 887 685 1 997 891
Upgrades and additions 993 200 967 157 416 439 575 046 411 499 374 675 429 019 629 604 741 813Rehabilitation, renovations and refurbishments 18 703 634 634 582 256 268 682 181 469 479 400 214 564
Maintenance and repairs 148 623 227 295 587 666 292 585 407 334 332 010 571 342 778 681 1 066 528
Infrastructure transfers 222
Current 222
Capital
Current infrastructure 148 623 227 295 587 888 292 585 407 334 332 010 571 342 778 681 1 007 554

Vote 8 - Roads and Transport • EPRE • 2012/13
356
OutcomesMain
appropriationAdjusted
appropriationRevised estimate
Medium-term estimates
R Thousand 2008/09 2009/10 2010/11 2011/12 2012/13 2013/14 2014/15
Capital infrastructure 6 008 643 6 179 848 517 786 1 353 882 1 091 069 724 232 673 638 1 265 804 1 145 004
Total 6 157 266 6 407 143 1 105 674 1 646 467 1 498 403 1 056 242 1 244 980 2 044 485 2 152
905
The budget for infrastructure decreased from R6.2 billion in 2008/09 to R1.1 billion in 2010/11. This amount increased marginally to R1.2 billion in 2012/12. Over the MTEF, the budget for the Department will increase from R1.2 billion in 2012/13 to R2.2 billion in 2014/15 mainly to take care of the construction and maintenance of the roads.
The Department’s focus continues to be on maintenance of the provincial road network and that is evidenced by the high allocation within the Maintenance and repair item of infrastructure. This item includes the PRMG which will be utilised to augment maintenance activities.
New and replacement assetsThe category of infrastructure payments includes the construction of the Vereeniging, Pienaarspoort and Germiston Intermodal Public Transport Facilities. The Department will also be identifying other facilities to construct over the MTEF period within the Tshwane, Ekurhuleni and Johannesburg municipalities; however their actual locations are still to be determined.
Upgrades and additionsThe projects in this category include, but are not limited to, those within the Maize Triangle, the maintenance of rural roads that continue to be a provincial priority, other construction projects that are continuing into the MTEF, the public transport projects that relate to the construction of walkways along the routes with a high volume of pedestrians, and upgrading of the DLTCs across the province.
Rehabilitation, renovations and refurbishmentsThe preventative maintenance budget falls under this item. It covers a range of roads in the province.
Maintenance and repairsThis item is constituted of the maintenance of: • The provincial road network • Weighbridges
The ongoing in-house and outsourced maintenance programmes also form part of this category of infrastructure.
6. PROGRAMME DESCRIPTION
PROGRAMME1: ADMINISTRATION
Programme descriptionTo provide the Department with overall management and administrative, strategic, financial and corporate support services in order to ensure that it delivers on its mandate in an integrated, efficient, effective and sustainable manner.
Programme objectives • To render advisory, parliamentary, secretarial, administrative and office support service to the MEC; • To provide overall management and support of the Department; and • To manage personnel, procurement, finance, administration and related support services.

2012/13 • EPRE • Vote 8 - Roads and Transport
357
TABLE 6: SUMMARY OF PAYMENTS AND ESTIMATES: ADMINISTRATION
OutcomeMain
appropriationAdjusted
appropriationRevised estimate
Medium-term estimates
R thousand 2008/09 2009/10 2010/11 2011/12 2012/13 2013/14 2014/151. Offi ce of the MEC 3 952 13 044 7 372 14 147 10 704 7 207 11 962 13 288 14 054
2. Management 31 715 22 416 36 540 30 409 30 409 26 351 34 149 40 015 41 5773. Corporate Services 83 277 155 949 130 859 119 615 118 058 131 475 164 812 173 269 188 631Total payments and estimates 118 944 191 409 174 771 164 171 159 171 165 033 210 923 226 572 244 262
TABLE 7:SUMMARY OF ECONOMIC CLASSIFICATION: ADMINISTRATION
OutcomeMain
appropriationAdjusted
appropriationRevised estimate
Medium-term estimates
R thousand 2008/09 2009/10 2010/11 2011/12 2012/13 2013/14 2014/15Current payments 117 593 187 918 168 458 164 171 156 921 162 783 208 124 223 773 241 463Compensation of employees 47 076 80 109 93 280 92 769 92 769 101 069 100 749 106 898 112 231Goods and services 70 517 107 749 75 178 71 402 63 952 61 514 106 475 115 975 128 332Interest and rent on land 60 200 200 900 900 900Transfers and subsidies to: 12 1 480 48 2 000 2 000 Provinces and municipalities (43) Departmental agencies and accounts Universities Foreign governments and international organisations Public corporations and private enterprises Non-profi t institutions Households 12 1 523 48 2 000 2 000 Payments for capital assets 1 339 1 337 889 250 250 2 799 2 799 2 799Buildings and other fi xed structures Machinery and equipment 1 339 1 337 889 250 250 2 799 2 799 2 799Heritage Assets Specialised military assets Biological assets Land and sub-soil assets Software and other intangible assets Payments for fi nancial assets 674 5 376 Total economic classifi cation 118 944 191 409 174 771 164 171 159 171 165 033 210 923 226 572 244 262
For the period 2008/09 to 2010/11, expenditure for the programme increased from R119 million to R175 million, a substantial growth of 46 per cent. During 2011/12, the budget allocated to the programme was decreased to R164 million as a result of the departmental reprioritisation process. The increase of the budget

Vote 8 - Roads and Transport • EPRE • 2012/13
358
within the programme over the MTEF is as a result of the centralisation of the property payments in relation to the 5 regional offices of the Department in a bid to control expenditure, as evidenced by the substantial increase in the Corporate Services budget.
PROGRAMME 2: TRANSPORT INFRASTRUCTURE
Programme descriptionTo promote accessibility and the safe, affordable movement of people, goods and services through the delivery and maintenance of transport infrastructure that is sustainable, integrated and environmentally sensitive, and which supports and facilitates social empowerment and economic growth.
Programme objectives • Provide planning for all modes of transport including the movement of goods and passengers to integrate
transport and spatial planning; • Provide for planning and co-ordination towards the formulation of provincial transport policies and statutory
plans; • Plan integrated modal transport facilities and systems for all modes of transport including non motorised
transport; • Promote and improve safety on the transport infrastructure; • Facilitate the provision of road safety audits on all roads and transport infrastructure to ensure safe traffic
and people movement; • Provide data collection services; research to provide management information systems for the provincial
road network; • Provide design of road and transport infrastructure including all necessary support functions such
as environmental impact assessments, traffic impact assessments, surveys, expropriations, material investigations and testing;
• Develop new roads and re-construct, upgrade and rehabilitate road and transport infrastructure; and • Effectively maintain road and transport infrastructure.
TABLE 8: SUMMARY OF PAYMENTS AND ESTIMATES: TRANSPORT INFRASTRUCTURE
OutcomeMain
appropriationAdjusted
appropriationRevised estimate
Medium-term estimates
R thousand 2008/09 2009/10 2010/11 2011/12 2012/13 2013/14 2014/151. Infrastructure Planning 35 204 190 940 213 418 64 567 42 967 42 967 59 962 50 614 54 8102. Infrastructure Design 82 216 85 643 56 482 173 153 106 860 105 608 129 465 158 144 188 2423. Construction 504 117 502 851 470 199 417 466 344 466 344 470 341 590 524 854 630 0234. Maintenance 777 179 639 121 641 586 1 171 251 1 202 524 1 202 522 907 325 1 451 273 1 444 577Total payments and estimates 1 398 716 1 418 555 1 381 685 1 826 437 1 696 817 1 695 567 1 438 342 2 184 885 2 317 652
TABLE 9:SUMMARY OF ECONOMIC CLASSIFICATION: TRANSPORT INFRASTRUCTURE
R thousand
OutcomeMain
appropriationAdjusted
appropriationRevised estimate
Medium-term estimates
2008/09 2009/10 2010/11 2011/12 2012/13 2013/14 2014/15Current payments 1 211 948 1 363 919 1 334 652 1 718 036 1 585 206 1 583 663 946 531 1 235 230 1 524 448Compensation of employees 126 009 180 778 179 559 197 030 196 430 229 955 245 671 258 126 274 560Goods and services 1 081 343 1 183 077 1 155 093 1 521 006 1 384 776 1 349 708 700 310 976 554 1 249 338Interest and rent on land 4 596 64 4 000 4 000 550 550 550Transfers and subsidies to: 145 788 10 901 8 946 3 210 3 501 2 719 2 719 2 719Provinces and municipalities 4 543 8 602 1 500 1 500 1 000 1 000 1 000

2012/13 • EPRE • Vote 8 - Roads and Transport
359
R thousand
OutcomeMain
appropriationAdjusted
appropriationRevised estimate
Medium-term estimates
2008/09 2009/10 2010/11 2011/12 2012/13 2013/14 2014/15Departmental agencies and accounts 135 606 80 Universities a Foreign governments and international organisations Public corporations and private enterprises 874 120 500 500 500 500 500Non-profi t institutions 875 Households 3 890 2 099 8 946 1 210 1 501 1 219 1 219 1 219Payments for capital assets 40 980 43 735 38 087 108 401 108 401 108 403 489 092 946 936 790 485Buildings and other fi xed structures 25 477 61 901 61 901 61 901 441 467 917 316 768 160Machinery and equipment 9 975 1 488 996 14 000 14 000 14 000 7 625 7 625 7 625Heritage Assets Specialised military assets Biological assets Land and sub-soil assets 5 528 42 247 37 091 32 500 32 500 32 502 40 000 21 995 14 700Software and other intangible assets Payments for fi nancial assets Total economic classifi cation 1 398 716 1 418 555 1 381 685 1 826 437 1 696 817 1 695 567 1 438 342 2 184 885 2 317 652
This is the core programme of the Department in line with the mandate and the focus of the next MTEF period. The total reduction of the budget is as a result of the centralisation of property payments in relation to the regional offices; however, the infrastructure projects budget is still mainly within this programme. Programme expenditure remained constant from 2008/09 to 2010/11. The budget for the programme is set to rise from R1.4 billion in 2011/12 to R2.3 billion over the MTEF. The budget for the sub-programme Maintenance increases in line with the Department’s focus on the maintenance of existing roads as opposed to the construction of new ones. The PRMG will continue to be allocated to the Department to allow it to focus on the routine maintenance programme and the creation of jobs.The increased allocation for the compensation of employees within the programme is as a result of the extra allocation that has been to allow the Department to fill critical engineer posts in order to reduce the reliance on external service providers. The reduction within the goods and services item is as a result of the re-allocation of the budget in relation to the upgrading of roads to the CAPEX items in line with the SCOA classification. The CAPEX budget then further has the budget for land purchases and general machinery of the units within this programme.
SERVICE DELIVERY MEASURES
PROGRAMME 2: TRANSPORT INFRASTRUCTURE
Performance MeasuresEstimated Annual Targets
2012/13 2013/14 2014/15Number of infrastructure designs for the Maize Triangle belt completed 4 8 8
K164 1
K154 1 1 1
K11 1

Vote 8 - Roads and Transport • EPRE • 2012/13
360
Performance MeasuresEstimated Annual Targets
2012/13 2013/14 2014/15
P1-1 (Phase 2)(R82) 1
K77 1 1
K148/N3 1 1
K97(P1-3) 1 1
K54 1 1
K69 1 1
K60 1 1
Mohlakeng Ext 11 1 1
Number of kms of roads upgraded 15.2 17 17
K15 4 4
K46 6 2 2 R55 Phase 1 4.4
P126/1 3 3
K154 0.8
P1-1(R 82) 4 4 4
P4-1 4 4
Number of kms of rural roads developed (Construction and Maintenance) 12.2 10 10
Number of kms of roads completed 20.2 17.2 17.2
Number of 20PTP kms of roads completed 2.8
Mogo street and LE 3 in Soshanguve 0.7
Sekweri street in Refi lwe 2.1
Number of roads rehabilitated 103.76 31.69 31.69
Number of jobs created through EPWP (Construction and Maintenance) 6 700 10 100 10 100
Number of contractors 189 230 230
Women
Youth
People with disabilities
Number of kms of existing roads on routine maintenance 5 637.54 5 637.54 5 637.54
Number of km’s of roads resealed 10.97 8.75 8.75
Number of kms of roads re-graveled 128.93 203.14 203.14Number of kms of roads patched 360 000 sqm 360 000 sqm 360 000 sqm
Number of kms of roads bladed 1 042 1 042 1 042
PROGRAMME 3: TRANSPORT OPERATIONS
Programme descriptionTo plan, regulate and facilitate the provision of integrated land transport services through co-ordination and co-operation with national planning authorities, CBOs, NGOs and the private sector in order to enhance the mobility of all communities particularly those currently without or with limited access.
Programme objectives • Management of integrated land transport contracts to provide mobility to commuters; and • Manage, co-ordinate and facilitate transport safety and compliance in all modes with related legislation,
regulations and policies through pro-active and reactive tactics and strategies.

2012/13 • EPRE • Vote 8 - Roads and Transport
361
TABLE 10: SUMMARY OF PAYMENTS AND ESTIMATES: TRANSPORT OPERATIONS
OutcomeMain
appropriationAdjusted
appropriationRevised estimate Medium-term estimates
R thousand 2008/09 2009/10 2010/11 2011/12 2012/13 2013/14 2014/151. Public Transport Services 213 658 1 554 562 1 452 124 1 790 525 2 042 880 2 042 880 1 772 129 1 907 037 2 009 703Total payments and estimates 213 658 1 554 562 1 452 124 1 790 525 2 042 880 2 042 880 1 772 129 1 907 037 2 009 703
TABLE 11:SUMMARY OF ECONOMIC CLASSIFICATION: TRANSPORT OPERATIONS
OutcomeMain
appropriationAdjusted
appropriationRevised estimate
Medium-term estimates
R thousand 2008/09 2009/10 2010/11 2011/12 2012/13 2013/14 2014/15Current payments 207 519 510 683 88 535 1 786 525 140 158 140 158 56 001 63 963 73 100Compensation of employees 18 665 14 596 14 729 34 462 28 774 25 444 31 001 33 263 37 645Goods and services 188 854 495 137 57 753 1 752 063 111 384 114 714 24 900 30 600 35 355Interest and rent on land 950 16 053 100 100 100Transfers and subsidies to: 6 028 1 043 854 1 363 564 1 898 722 1 898 722 1 638 699 1 714 344 1 801 078Provinces and municipalities 950 Departmental agencies and accounts 2 340 Universities Foreign governments and international organisations Public corporations and private enterprises 1 689 1 043 826 1 363 564 1 898 722 1 898 722 1 638 699 1 714 344 1 801 078Non-profi t institutions Households 1 049 28 Payments for capital assets 111 25 25 4 000 4 000 4 000 77 429 128 730 135 525Buildings and other fi xed structures 76 904 128 205 135 000Machinery and equipment 111 25 25 4 000 4 000 4 000 525 525 525Heritage Assets Specialised military assets Biological assets Land and sub-soil assets Software and other intangible assets Payments for fi nancial assets Total economic classifi cation 213 658 1 554 562 1 452 124 1 790 525 2 042 880 2 042 880 1 772 129 1 907 037 2 009 703
Spending for the programme increased from R214 million in 2008/09 to R1.5 billion in the 2010/11 financial year. The increase in expenditure during 2009/10 was due to the introduction of a conditional grant, the Public Transport Operations Grant. This was put in place to finance the new programme in terms of the subsidisation of the provision of public transport services to bus operators within the province. The grant will marginally increase

Vote 8 - Roads and Transport • EPRE • 2012/13
362
over the MTEF period hence the 13 per cent growth of the programme from R1.8 billion in 2012/13 to R2 billion in the 2014/15 financial year.
The other major allocation within this programme is in relation to the Intermodal Public Transfer Facilities (IPTNs) within the province. The Department will be constructing about 3 IPTNs on an annual basis over the next MTEF as well as conducting extensive planning for others to be constructed at a later stage. The construction of walkways and bicycle lanes has also been allocated a budget over the MTEF.
SERVICE DELIVERY MEASURES
PROGRAMME 3: TRANSPORT OPERATIONS
Performance Measure
Estimated Annual Targets
2012/13 2013/14 2014/15Number of subsidized bus transport contracts managed 34 34 34Number of subsidized bus contracts physically monitored 34 34 34Number of kms of public transport routes subsidized 100 956 480.66 100 956 480.66 100 956 480.66Number of kms monitored 100 956 480 .66 100 956 480.66 100 956 480.66Number of public transport operators subsidized 12 12 12Number of fully registered associations in the province 25 35 35Number of metered taxis regulated and legalised 100 100 100Number of learner transport operators regulated and legalised 130 150 150Number of bus operators regulated and legalised 20 20 20Number of audited routes 1 171 530 530Number of public transport transfer facilities constructed 1 2 2Number of km’s of non-motorised transport infrastructure (walkways &cycle lanes) constructed 25 20 20Number of weighbridges maintained 4 4 4Number of abnormal load permits issued 18 480 20 328 20 328
PROGRAMME 4: TRANSPORT REGULATION
Programme descriptionTo ensure the provision of a safe environment through the regulation of traffic on public infrastructure, law enforcement, implementation of road safety education and awareness programmes and registration and licensing of vehicles and drivers.
Programme objectives • To monitor and control registration and licensing of all motor vehicles and to render services regarding the
administration of applications in terms of the National Road Traffic Act (Act 93 of 1996); • Implementation of laws and regulations relating to vehicle registration and licensing, vehicle fitness testing
and driver fitness testing; • Management, approval and control of registration of transport operators and the issuing of all licenses and
permits required in terms of legislation; and • Management, approval and control of registration of transport operators and the issuing of all licenses and
permits required in terms of legislation.
TABLE 12: SUMMARY OF PAYMENTS AND ESTIMATES: TRANSPORT REGULATION
OutcomeMain
appropriationAdjusted
appropriationRevised estimate
Medium-term estimates
R thousand 2008/09 2009/10 2010/11 2011/12 2012/13 2013/14 2014/151. Transport Administration and Licensing 48 972 127 655 200 949 168 100 172 100 172 083 139 296 105 332 95 3532. Operator Licence and Permits 59 239 47 730 43 330 98 741 67 165 67 165 65 389 70 700 69 413Total payments and estimates 108 211 175 385 244 279 266 841 239 265 239 248 204 685 176 032 164 766

2012/13 • EPRE • Vote 8 - Roads and Transport
363
TABLE 13:SUMMARY OF ECONOMIC CLASSIFICATION: TRANSPORT REGULATION
OutcomeMain
appropriationAdjusted
appropriationRevised estimate
Medium-term estimates
R thousand 2008/09 2009/10 2010/11 2011/12 2012/13 2013/14 2014/15Current payments 107 329 105 272 241 432 262 841 235 215 235 121 203 634 174 981 163 715Compensation of employees 36 918 71 210 82 591 101 976 100 976 83 336 116 640 129 310 138 974Goods and services 70 411 34 062 158 841 160 865 134 119 151 636 86 744 45 421 24 491Interest and rent on land 120 149 250 250 250Transfers and subsidies to: 224 70 003 375 50 127 Provinces and municipalities 224 52 Departmental agencies and accounts 69 927 2 Universities Foreign governments and international organisations Public corporations and private enterprises Non-profi t institutions Households 24 375 50 125 Payments for capital assets 658 110 2 472 4 000 4 000 4 000 1 051 1 051 1 051Buildings and other fi xed structures Machinery and equipment 658 110 1 133 4 000 4 000 4 000 1 051 1 051 1 051Heritage Assets Specialised military assets Biological assets Land and sub-soil assets Software and other intangible assets 1 339 Payments for fi nancial assets Total economic classifi cation 108 211 175 385 244 279 266 841 239 265 239 248 204 685 176 032 164 766
Total payments for the programme grew from R108 million in 2008/09 to R244 million in 2010/11. The main cost driver for programme expenditure was the sub-programme: Transport Administration and Licensing. For the 2011/12 financial year, the programme received R267 million, slightly declining to R204 million for 2012/13 and decreasing to R165 million in 2014/15.
The budget for the programme is mainly to enforce the regulatory frameworks that ensure the safety of the public and private transport on the roads. The allocation of about R18 million in the 2012/13 financial year for the management, upgrading and establishment of the DLTCs also forms part of this programme. The management and capacitating of the Provincial Regulatory Entity (PRE) will be facilitated with an allocation of R4 million over the 2012/13 financial year, and set to grow over the MTEF.

Vote 8 - Roads and Transport • EPRE • 2012/13
364
SERVICE DELIVERY MEASURES
PROGRAMME 4: TRANSPORT REGULATIONS
Performance MeasureEstimated Annual Targets
2012/13 2013/14 2014/15Registering authority established 1Number of license compliance inspections executed 110 120 120 Number of new vehicles registered 269 454 280 232 280 232Number of vehicles registered 4 384 083 4 559 446 4 559 446
Number of vehicles licensed 4 238 797 4 408 349 4 408 349
Number of vehicles licenses paid on time 3 391 039 3 526 681 3 526 681
Percentage of registered vehicles licensed 97% 97% 97%
Percentage of registered vehicles licenses paid on time 80% 80% 80%
Administration costs as % of total license revenue 31% 31% 31%
Number of permits converted 5 000 5 000 5 000
Number of valid operating licenses/permits issued to Public Transport Operators 4 500 5 000 5 000
PROGRAMME 5: GAUTRAIN RAPID RAIL LINK
Programme descriptionTo plan, design and construct the Rapid Rail Link and ensure efficient management and implementation of the Gautrain.
Management of the concession agreement will remain one of the most important functions of the Gautrain Management Agency. The agreement was concluded between the province, through the Department of Roads and Transport, on the one hand and the Concessionaire on the other for the design, construction and operation of the railway line for the Gautrain Rapid Rail Project.
The agreement was concluded in terms of Treasury Regulation 16 as a PPP on the basis that the Concessionaire will perform the institutional function of the province for the design, construction and operation of the railway line, acquiring the use of the land on which the railway line is established and use of the railway line itself when constructed.
Programme objectives The strategic objectives of the Gautrain Management Agency are to manage, co-ordinate and oversee the Gautrain Rapid Rail Link Project in terms of the concession agreement.
In order for the GMA to manage, co-ordinate and oversee the Gautrain Project, it must discharge the following main functions: • Manage the concession agreement; • Manage the Project’s finances, financial securities, insurance, socio-economic development (SED) objectives,
assets and the maintenance thereof; • Liaise and exchange information with the three spheres of government, interested and affected parties,
institutions and professional bodies in South Africa and other countries; • Enhance integration with the province’s public transport system; • Monitor government policies and legislation; • Perform duties assigned by the Railway Safety Regulator; • Protect the rail reserve and provincial transport infrastructure involved in the Project in terms of the Gauteng
Transport Infrastructure Act (GTIA); and • Establish and operate information and management systems.

2012/13 • EPRE • Vote 8 - Roads and Transport
365
TABLE 14: SUMMARY OF PAYMENTS AND ESTIMATES: GAUTRAIN
OutcomeMain
appropriationAdjusted
appropriationRevised estimate
Medium-term estimates
R thousand 2008/09 2009/10 2010/11 2011/12 2012/13 2013/14 2014/151. Gautrain Rapid Rail Link 7 524 015 6 060 787 3 714 788 2 193 530 2 219 545 2 219 545 737 711 2 417 119 2 547 643Total payments and estimates 7 524 015 6 060 787 3 714 788 2 193 530 2 219 545 2 219 545 737 711 2 417 119 2 547 643
TABLE 15:SUMMARY OF ECONOMIC CLASSIFICATION: GAUTRAIN
OutcomeMain
appropriationAdjusted
appropriationRevised estimate
Medium-term estimates
R thousand 2008/09 2009/10 2010/11 2011/12 2012/13 2013/14 2014/15Current payments 320 4 676 10 Compensation of employees Goods and services 320 4 676 10 Interest and rent on land Transfers and subsidies 7 523 695 6 056 111 3 714 778 2 193 530 2 219 545 2 219 545 737 711 2 417 119 2 547 643Provinces and municipalities Departmental agencies and accounts 7 523 695 6 056 111 3 714 778 2 193 530 2 219 545 2 219 545 737 711 2 417 119 2 547 643Universities Foreign governments and international organisations Public corporations and private enterprises Non-profi t institutions Households Payments for capital assets Buildings and other fi xed structures Machinery and equipment Heritage Assets Specialised military assets Biological assets Land and sub-soil assets Software and other intangible assets Payments for fi nancial assets Total economic classifi cation 7 524 015 6 060 787 3 714 788 2 193 530 2 219 545 2 219 545 737 711 2 417 119 2 547 643

Vote 8 - Roads and Transport • EPRE • 2012/13
366
Total payments for the programme grew from R7.5 billion in 2008/09 to R3.7 million in 2010/11, and the main cost driver was the construction of the Gautrain. For the 2011/12 financial year, the allocation to Gautrain was reduced to R2.2 billion in line with the completion of the construction phase, and the focus was then the maintenance of the system. The allocation for the 2012/13 is drastically reduced to R737.711 in order to start the loan repayments, and further increased in the other 2 years of the MTEF.
7. OTHER INFORMATION
7.1 Personnel numbers and costs
TABLE 16: PERSONNEL NUMBERS AND COSTS: ROADS AND TRANSPORT
Personnel numbersAs at
31 March 2008
As at 31 March
2009
As at 31 March
2010
As at 31 March 2011
As at 31 March
2012
As at 31 March
2013
As at 31 March
20141. Administration 211 211 211 211 337 337 3372. Transport Infrastructure 6 630 1 421 1 391 1 102 1 102 1 102 1 1023. Transport Operations 234 234 282 125 125 125 1254. Transport Regulation 256 256 270 200 200 200 2005. Gautrain Total Department personnel numbers 7 331 2 122 2 154 1 638 1 764 1 764 1 764Total Department personnel cost (R thousand) 228 668 346 693 370 159 418 949 494 061 527 597 563 410Unit cost (R thousand) 3% 1% 1% 0% 0% 0% 0%
TABLE 17: SUMMARY OF DEPARTMENTAL PERSONNEL NUMBERS AND COSTS
OutcomeMain
appropriationAdjusted
appropriationRevised estimate
Medium-term estimates
2008/09 2009/10 2010/11 2011/12 2012/13 2013/14 2014/15Total for department
Personnel numbers (head count) 7 331 2 122 2 154 1 638 1 638 3 315 1 764 1 764 1 764Personnel cost (R thousands) 228 668 346 693 370 159 426 237 418 949 439 804 494 061 527 597 563 410Human resources componentPersonnel numbers (head count) 55 55 55 77 77 77 77 77 77Personnel cost (R thousands) 8 000 9 000 10 000 11 000 11 825 18 000 16 000 16 000 16 000Head count as % of total for department 1% 3% 3% 5% 5% 2% 4% 4% 4%Personnel cost as % of total for department 3% 3% 3% 3% 3% 4% 3% 3% 3%Finance component Personnel numbers (head count) 90 90 90 110 110 110 110 110 110Personnel cost (R thousands) 18 000 18 700 19 500 20 000 21 500 21 500 22 000 22 000 22 000Head count as % of total for department 1% 4% 4% 7% 7% 3% 6% 6% 6%Personnel cost as % of total for department 8% 5% 5% 5% 5% 5% 4% 4% 4%
2012/13 • EPRE • Vote 8 - Roads and Transport
367
OutcomeMain
appropriationAdjusted
appropriationRevised estimate
Medium-term estimates
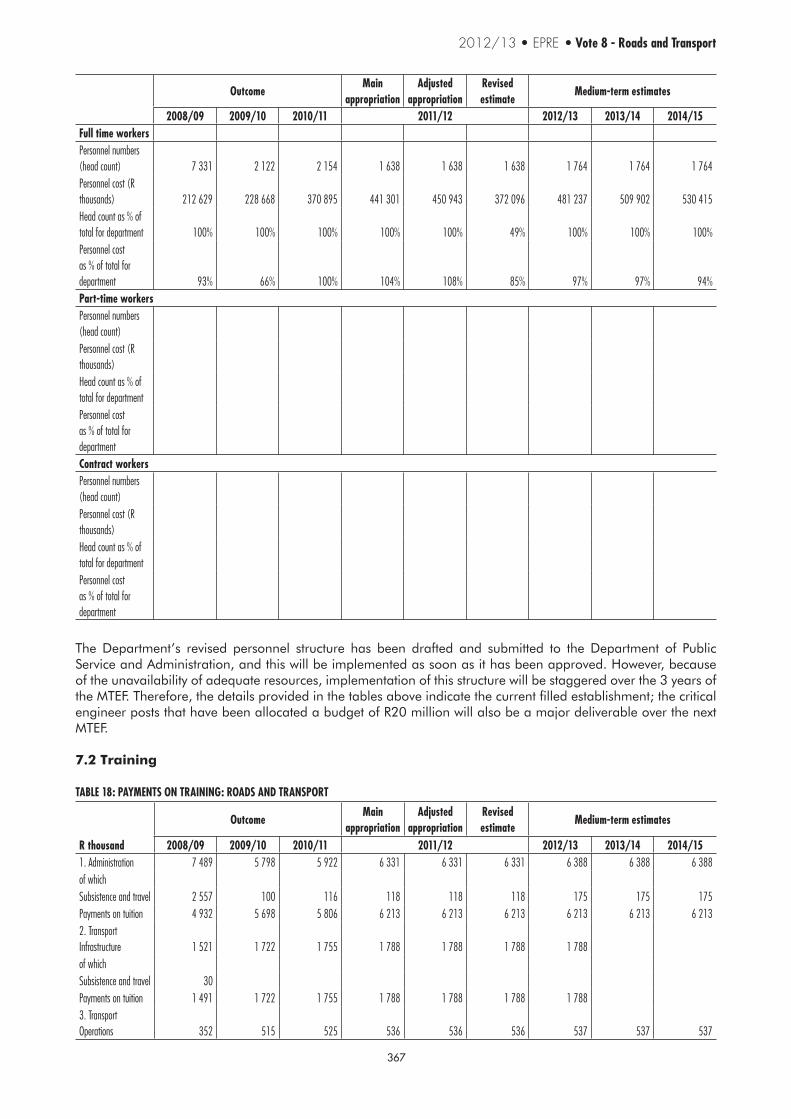
2008/09 2009/10 2010/11 2011/12 2012/13 2013/14 2014/15Full time workers Personnel numbers (head count) 7 331 2 122 2 154 1 638 1 638 1 638 1 764 1 764 1 764Personnel cost (R thousands) 212 629 228 668 370 895 441 301 450 943 372 096 481 237 509 902 530 415Head count as % of total for department 100% 100% 100% 100% 100% 49% 100% 100% 100%Personnel cost as % of total for department 93% 66% 100% 104% 108% 85% 97% 97% 94%Part-time workers Personnel numbers (head count) Personnel cost (R thousands) Head count as % of total for department Personnel cost as % of total for department Contract workersPersonnel numbers (head count) Personnel cost (R thousands) Head count as % of total for department Personnel cost as % of total for department
The Department’s revised personnel structure has been drafted and submitted to the Department of Public Service and Administration, and this will be implemented as soon as it has been approved. However, because of the unavailability of adequate resources, implementation of this structure will be staggered over the 3 years of the MTEF. Therefore, the details provided in the tables above indicate the current filled establishment; the critical engineer posts that have been allocated a budget of R20 million will also be a major deliverable over the next MTEF.
7.2 Training
TABLE 18: PAYMENTS ON TRAINING: ROADS AND TRANSPORT
R thousand
OutcomeMain
appropriationAdjusted
appropriationRevised estimate
Medium-term estimates
2008/09 2009/10 2010/11 2011/12 2012/13 2013/14 2014/151. Administration 7 489 5 798 5 922 6 331 6 331 6 331 6 388 6 388 6 388of which Subsistence and travel 2 557 100 116 118 118 118 175 175 175Payments on tuition 4 932 5 698 5 806 6 213 6 213 6 213 6 213 6 213 6 2132. Transport Infrastructure 1 521 1 722 1 755 1 788 1 788 1 788 1 788 of which Subsistence and travel 30 Payments on tuition 1 491 1 722 1 755 1 788 1 788 1 788 1 788 3. Transport Operations 352 515 525 536 536 536 537 537 537

Vote 8 - Roads and Transport • EPRE • 2012/13
368
R thousand
OutcomeMain
appropriationAdjusted
appropriationRevised estimate
Medium-term estimates
2008/09 2009/10 2010/11 2011/12 2012/13 2013/14 2014/15of which Subsistence and travel 9 11 12 13 13 13 14 14 14Payments on tuition 343 504 513 523 523 523 523 523 5234. Transport Regulation of which Subsistence and travel Payments on tuition 5. Gautrain of which Subsistence and travel Payments on tuition Total payments on training 9 362 8 035 8 202 8 655 8 655 8 655 8 713 6 925 6 925
TABLE 19: INFORMATION ON TRAINING: ROADS AND TRANSPORT
OutcomeMain
appropriationAdjusted
appropriationRevised estimate
Medium-term estimates
R thousand 2008/09 2009/10 2010/11 2011/12 2012/13 2013/14 2014/15Number of staff 940 993 1 015 1 062 1 062 1 062 1 062 1 062 1 062Number of personnel trained 678 722 736 739 739 739 739 739 739of which Male 584 621 633 636 636 636 636 636 636Female 94 101 103 103 103 103 103 103 103Number of training opportunities 50 50 50 50 50 50 50 50 50of which Tertiary 50 502 50 50 50 50 50 50 50Workshops Seminars Other Number of bursaries offered 50 53 53 53 53 53 53 53 53Number of interns appointed 69 74 75 72 72 72 72 72 72Number of learnerships appointed 93 94 101 148 148 148 148 148 148Number of days spent on training
The Department has identified engineering as a scarce skill, and as part of the intervention plan is sponsoring studies for young people studying civil engineering in order to alleviate the shortage within the profession and specifically within the Department. An allocation has been provided to allow other employees to attend training programmes in line with their respective job descriptions.
2012/13 • EPRE • Vote 8 - Roads and Transport
369
ANNEXURES TO THE ESTIMATES OF PROVINCIAL REVENUE AND EXPENDITURE

Vote 8 - Roads and Transport • EPRE • 2012/13
370
TABLE 20: SPECIFICATION OF RECEIPTS: ROADS AND TRANSPORT
R thousand
Outcome
Main appropriation
Adjusted appropriation
Revised estimate
Medium-term estimates
2008/09 2009/10 2010/11 2011/12 2012/13 2013/14 2014/15Tax receipts 1 183 906 1 534 213 1 705 814 1 775 498 1 775 498 2 151 489 2 120 000 2 247 200 2 382 032Casino taxes Horse racing taxes Liquor licenses Motor vehicle licenses 1 183 906 1 534 213 1 705 814 1 775 498 1 775 498 2 151 489 2 120 000 2 247 200 2 382 032Sales of goods and services other than capital assets 3 849 20 125 24 004 39 970 23 145 26 615 26 615Sale of goods and services produced by department (excluding capital assets) Sales by market establishments 20 125 24 004 39 970 23 145 26 615 26 615Administrative fees Other sales Of which Health patient fees Sales of scrap, waste, arms and other used current goods (excluding capital assets) 3 849 Transfers received from: Other governmental units Universities Foreign governments International organisations Public corporations and private enterprises Households and non-profi t institutions Fines, penalties and forfeits Interest, dividends and rent on land 431 349 4 410 1 380 315 731 1 587 1 825 1 825Interest 431 49 4 410 1 380 315 731 1 587 1 825 1 825Dividends Rent on land 300 Sales of capital assets Land and sub-soil assets

2012/13 • EPRE • Vote 8 - Roads and Transport
371
R thousand
Outcome
Main appropriation
Adjusted appropriation
Revised estimate
Medium-term estimates
2008/09 2009/10 2010/11 2011/12 2012/13 2013/14 2014/15Other capital assets Transactions in fi nancial assets and liabilities 6 489 5 101 8 823 1 507 1 821 3 596 Total departmental receipts 1 190 826 1 539 663 1 722 896 1 798 510 1 801 638 2 195 786 2 144 732 2 275 640 2 410 472
TABLE 22:PAYMENTS AND ESTIMATES BY ECONOMIC CLASSIFICATION: ADMINISTRATION
R thousand
Outcome
Main appropriation
Adjusted appropriation
Revised estimate
Medium-term estimates
2008/09 2009/10 2010/11 2011/12 2012/13 2013/14 2014/15Current payments 117 593 187 918 168 458 164 171 156 921 162 783 208 124 223 773 241 463Compensation of employees 47 076 80 109 93 280 92 769 92 769 101 069 100 749 106 898 112 231Salaries and wages 47 076 72 610 83 323 64 482 64 482 78 576 69 079 78 033 81 922Social contributions 7 499 9 957 28 287 28 287 22 493 31 670 28 865 30 309Goods and services 70 517 107 749 75 178 71 402 63 952 61 514 106 475 115 975 128 332of which Administrative fees 143 ( 11) 77 370 261 Advertising 6 192 7 181 9 029 8 307 4 920 3 990 5 000 5 000 5 000Assets <R5000 554 29 206 1 089 889 1 203 Audit cost: External 2 120 413 8 862 9 000 6 000 6 268 8 000 10 000 12 000Bursaries (employees) 2 050 1 223 600 381 2 000 2 000 2 000Catering: Departmental activities 115 403 179 4 022 977 1 193 1 000 1 250 1 500Communication 3 302 7 876 11 581 11 385 8 685 9 475 11 600 14 250 18 500Computer services 3 876 3 713 6 277 7 087 4 787 3 146 6 000 6 000 6 000Cons/prof:business & advisory services 27 605 16 861 5 500 6 435 5 375 21 000 21 000 21 000Cons/prof: Infrastructre & planning 2 752 7 467 9 635 216 Cons/prof: Laboratory services Cons/prof: Legal cost 1 752 5 603 3 608 1 000 3 837 2 756 5 000 5 000 5 000Contractors 2 861 64 472 3 000 700 120 Agency & support/outsourced services 4 351 40 166 12 449 2 247 8 687 9 528 13 000 15 000 20 314Entertainment 433 ( 27) 30 1 851 851 170 Fleet Services (F/SER) Housing Inventory: Food and food supplies 522 175 65 300 175 50 Inventory: Fuel, oil and gas ( 115) Inventory:Learn & teacher support material 243 8

Vote 8 - Roads and Transport • EPRE • 2012/13
372
R thousand
Outcome
Main appropriation
Adjusted appropriation
Revised estimate
Medium-term estimates
2008/09 2009/10 2010/11 2011/12 2012/13 2013/14 2014/15Inventory: Materials and supplies ( 386) 2 1
Inventory: Medical supplies
Inventory: Medicine
Medsas inventory interface
Inventory: Military stores
Inventory: Other consumbles 51 ( 510) 306 2 111 711 183 Inventory: Stationery and printing 1 990 1 342 1 932 3 445 2 025 2 006 4 834 4 834 4 834Lease payments 1 119 1 636 2 410 1 500 1 399 5 100 5 100 5 100Rental and Hiring Property payments 104 ( 283) 792 123 608 13 400 16 000 16 543Transport provided dept activity 105 1 000 400 490 Travel and subsistence 5 229 9 792 3 849 3 286 4 536 5 671 7 541 7 541 7 541Training & development 3 078 1 947 2 102 1 320 1 940 2 000 2 000 2 000Operating payments 645 268 6 772 4 182 4 354 Venues and facilities 1 480 1 990 86 1 240 730 1 000 1 000 1 000Interest and rent on land 60 200 200 900 900 900Interest 60 200 200 900 900 900Rent on land Transfers and subsidies to1: 12 1 480 48 2 000 2 000 Provinces and municipalities ( 43) Provinces2 Provincial Revenue Funds Provincial agencies and funds Municipalities3 ( 43) Municipal bank accounts Municipal agencies and funds ( 43) Departmental agencies and accounts Subsidies on production Other transfers Non-profi t institutions Households 12 1 523 48 2 000 2 000 Social benefi ts 12 48 48 2 000 2 000 Other transfers to households 1 475 Payments for capital assets 1 339 1 337 889 250 250 2 799 2 799 2 799

2012/13 • EPRE • Vote 8 - Roads and Transport
373
R thousand
Outcome
Main appropriation
Adjusted appropriation
Revised estimate
Medium-term estimates
2008/09 2009/10 2010/11 2011/12 2012/13 2013/14 2014/15Buildings and other fi xed structures Buildings Other fi xed structures Machinery and equipment 1 339 1 337 889 250 250 2 799 2 799 2 799Transport equipment 1 118 Other machinery and equipment 221 1 337 889 250 250 2 799 2 799 2 799Heritage Assets Specialised military assets Biological assets Land and sub-soil assets Software and other intangible assets Payments for fi nancial assets 674 5 376 Total economic classifi cation 118 944 191 409 174 771 164 171 159 171 165 033 210 923 226 572 244 262
TABLE 23:PAYMENTS AND ESTIMATES BY ECONOMIC CLASSIFICATION: TRANSPORT INFRASTRUCTURE
R thousand
OutcomeMain
appropriationAdjusted
appropriationRevised estimate
Medium-term estimates
2008/09 2009/10 2010/11 2011/12 2012/13 2013/2014 2014/15Current payments 1 211 948 1 363 919 1 334 652 1 718 036 1 585 206 1 583 663 946 531 1 235 230 1 524 448Compensation of employees 126 009 180 778 179 559 197 030 196 430 229 955 245 671 258 126 274 560Salaries and wages 114 625 160 353 157 234 136 950 136 350 190 834 188 064 197 231 204 616Social contributions 11 384 20 425 22 325 60 080 60 080 39 121 57 607 60 895 69 944Goods and services 1 081 343 1 183 077 1 155 093 1 521 006 1 384 776 1 349 708 700 310 976 554 1 249 338of which Administrative fees 1 640 237 616 822 872 598 Advertising 488 102 582 15 168 4 054 1 850 1 350 Assets <R5000 722 416 119 12 766 1 096 6 535 Audit cost: External 2 Bursaries (employees) 17 Catering: Departmental activities 62 4 131 114 184 185 Communication 2 771 3 689 2 750 16 073 2 432 2 433 Computer services 363 519 978 1 300 800 800 Cons/prof:business & advisory services 53 921 71 084 1 485 212 592 19 093 5 649 26 000 13 200 15 000Cons/prof: Infrastructre & planning 239 948 211 387 253 981 215 819 166 074 151 072 137 756 230 256 315 692Cons/prof: Laboratory services Cons/prof: Legal cost 16 837 3 501 3 337 2 835 2 944 3 346 Contractors 615 417 730 046 829 797 449 323 1 078 254 1 059 332 511 508 706 038 904 006

Vote 8 - Roads and Transport • EPRE • 2012/13
374
R thousand
OutcomeMain
appropriationAdjusted
appropriationRevised estimate
Medium-term estimates
2008/09 2009/10 2010/11 2011/12 2012/13 2013/2014 2014/15Agency & support/outsourced services 105 287 17 328 3 329 97 217 1 956 7 356 Entertainment 41 9 Fleet Services (F/SER) 653 9 637 878 30 500 30 500 Housing Inventory: Food and food supplies 63 37 18 11 637 348 347 Inventory: Fuel, oil and gas 524 1 952 5 508 10 634 1 500 1 502 18 000 20 014 7 594Inventory:Learn & teacher support material 10 ( 4 690) Inventory: Materials and supplies 8 209 382 157 17 658 Inventory: Medical supplies Inventory: Medicine Medsas inventory interface Inventory: Military stores 341 Inventory: Other consumbles 5 381 2 547 2 562 Inventory: Stationery and printing 1 053 13 234 1 115 3 021Lease payments 16 379 13 881 33 802 3 116Rental and Hiring Property payments 3 312 7 459 Transport provided dept activity ( 16) 15 292 Travel and subsistence 6 645 3 100 11 801 909Training & development 1 230 1 727 Operating payments 123 54 390 2 539 Venues and facilities 263 40 Interest and rent on land 4 596 4 000 550Interest 4 358 4 000 550Rent on land 238 Transfers and subsidies to1: 145 788 3 501 2 719Provinces and municipalities 4 543 1 500 1 000Provinces2 2 486 1 439 Provincial Revenue Funds 1 289 Provincial agencies and funds 2 486 150 Municipalities3 2 057 61 1 000Municipal bank accounts 1 967 61 1 000Municipal agencies and funds 90

2012/13 • EPRE • Vote 8 - Roads and Transport
375
R thousand
OutcomeMain
appropriationAdjusted
appropriationRevised estimate
Medium-term estimates
2008/09 2009/10 2010/11 2011/12 2012/13 2013/2014 2014/15Departmental agencies and accounts 135 606 Social security funds 128 074 Departmental agencies (non-business entities) 7 532 Universities Foreign governments and international organisations Public corporations and private enterprises5 874 500 500Public corporations 874 Subsidies on production Other transfers 874 Private enterprises 500 500Subsidies on production Other transfers 500 500Non-profi t institutions 875 Households 3 890 1 501 1 219Social benefi ts 3 887 513 1 219Other transfers to households 3 988 Payments for capital assets 40 980 108 401 108 403 489 092Buildings and other fi xed structures 25 477 61 901 61 901 441 467Buildings 19 477 Other fi xed structures 6 000 61 901 61 901 441 467Machinery and equipment 9 975 14 000 14 000 7 625Transport equipment Other machinery and equipment 9 975 14 000 14 000 7 625Heritage Assets Specialised military assets Biological assets Land and sub-soil assets 5 528 32 500 32 502 40 000Software and other intangible assets Payments for fi nancial assets Total economic classifi cation 1 398 716 1 826 437 1 695 567 1 438 342

Vote 8 - Roads and Transport • EPRE • 2012/13
376
TABLE 24:PAYMENTS AND ESTIMATES BY ECONOMIC CLASSIFICATION: TRANSPORT OPERATIONS
R thousand
OutcomeMain
appropriationAdjusted
appropriationRevised estimate
Medium-term estimates
2008/09 2009/10 2010/11 2011/12 2012/13 2013/2014 2014/15Current payments 207 519 510 683 88 535 1 786 525 140 158 140 158 56 001 63 963 73 100Compensation of employees 18 665 14 596 14 729 34 462 28 774 25 444 31 001 33 263 37 645Salaries and wages 17 037 12 741 12 927 23 954 18 266 24 003 24 925 26 578 29 317Social contributions 1 628 1 855 1 802 10 508 10 508 1 441 6 076 6 685 8 328Goods and services 188 854 495 137 57 753 1 752 063 111 384 114 714 24 900 30 600 35 355of which Administrative fees 159 122 7 Advertising 537 863 877 258 258 258 Assets <R5000 319 4 310 60 60 Audit cost: External Bursaries (employees) Catering: Departmental activities 458 503 533 313 Communication 932 821 537 838 688 688 Computer services 165 119 41 41 Cons/prof:business & advisory services 172 186 88 482 44 923 113 901 18 613 21 597 15 000 15 000 19 000Cons/prof: Infrastructure & planning 612 7 253 81 846 81 846 8 545 14 245 15 000Cons/prof: Laboratory services Cons/prof: Legal cost 470 207 911 130 130 Contractors 808 6 323 Agency & support/outsourced services 651 122 Entertainment 10 27 191 10 Fleet Services (F/SER) Housing Inventory: Food and food supplies 543 127 2 10 10 Inventory: Fuel, oil and gas Inventory:Learn & teacher support material 48 Inventory: Materials and supplies Inventory: Medical supplies Inventory: Medicine Medsas inventory interface Inventory: Military stores 20 Inventory: Other consumables 25 162 5 Inventory: Stationery and printing 261 101 993 208 18 18 604 604 604Lease payments 1 304 392 315 200 200 567 567 567

2012/13 • EPRE • Vote 8 - Roads and Transport
377
R thousand
OutcomeMain
appropriationAdjusted
appropriationRevised estimate
Medium-term estimates
2008/09 2009/10 2010/11 2011/12 2012/13 2013/2014 2014/15Rental and Hiring Property payments Transport provided dept activity 64 242 1 500 191 Travel and subsistence 6 194 3 339 957 500 799 1 006 184 184 184Training & development 2 988 12 868 68 11 Operating payments 18 397 278 1 632 563 8 653 8 653 Venues and facilities 150 2 853 12 Interest and rent on land 950 16 053 100 100 100Interest 853 16 053 100 100 100Rent on land 97 Transfers and subsidies to1: 6 028 1 043 854 1 363 564 1 898 722 1 898 722 1 638 699 1 714 344 1 801 078Provinces and municipalities 950 Provinces2 950 Provincial Revenue Funds Provincial agencies and funds 950 Municipalities3 Municipal bank accounts Municipal agencies and funds Departmental agencies and accounts 2 340 Social security funds 2 340 Departmental agencies (non-business entities) Universities Foreign governments and international organisations Public corporations and private enterprises5 1 689 1 043 826 1 363 564 1 898 722 1 898 722 1 638 699 1 714 344 1 801 078Public corporations 1 043 826 1 363 564 1 898 722 1 898 722 1 638 699 1 714 344 1 801 078Subsidies on production Other transfers 1 043 826 1 363 564 1 898 722 1 898 722 1 638 699 1 714 344 1 801 078Private enterprises 1 689 Subsidies on production 1 689 Other transfers Non-profi t institutions Households 1 049 28 Social benefi ts 28 Other transfers to households 1 049

Vote 8 - Roads and Transport • EPRE • 2012/13
378
R thousand
OutcomeMain
appropriationAdjusted
appropriationRevised estimate
Medium-term estimates
2008/09 2009/10 2010/11 2011/12 2012/13 2013/2014 2014/15Payments for capital assets 111 25 25 4 000 4 000 4 000 77 429 128 730 135 525Buildings and other fi xed structures 76 904 128 205 135 000Buildings Other fi xed structures 76 904 128 205 135 000Machinery and equipment 111 25 25 4 000 4 000 4 000 525 525 525Transport equipment Other machinery and equipment 111 25 25 4 000 4 000 4 000 525 525 525Heritage Assets Specialised military assets Biological assets Land and sub-soil assets Software and other intangible assets Payments for fi nancial assets Total economic classifi cation 213 658 1 554 562 1 452 124 1 790 525 2 042 880 2 042 880 1 772 129 1 907 037 2 009 703
TABLE 25:PAYMENTS AND ESTIMATES BY ECONOMIC CLASSIFICATION: TRANSPORT REGULATION
R thousand
Outcome Main
appropriationAdjusted
appropriationRevised estimate
Medium-term estimates
2008/09 2009/10 2010/11 2011/12 2012/13 2013/2014 2014/15Current payments 107 329 105 272 241 432 262 841 235 215 235 121 203 634 174 981 163 715Compensation of employees 36 918 71 210 82 591 101 976 100 976 83 336 116 640 129 310 138 974Salaries and wages 32 722 63 058 72 317 70 881 69 881 64 994 88 436 96 687 105 782Social contributions 4 196 8 152 10 274 31 095 31 095 18 342 28 204 32 623 33 192Goods and services 70 411 34 062 158 841 160 865 134 119 151 636 86 744 45 421 24 491of which Administrative fees 1 287 Advertising 122 756 410 1 500 13 Assets <R5000 882 19 421 991 3 141 931 Audit cost: External Bursaries (employees) 27 Catering: Departmental activities 460 217 9 15 Communication 5 639 1 242 1 846 3 000 1 808 1 811 Computer services 11 973 313 3 224 3 300 503 503 Cons/prof:business & advisory services 24 152 7 133 26 428 86 520 106 000 54 953 8 000 9 500Cons/prof: Infrastructre & planning 1 20 000 3 840 2 722 2 880 10 643 12 000Cons/prof: Laboratory services

2012/13 • EPRE • Vote 8 - Roads and Transport
379
R thousand
Outcome Main
appropriationAdjusted
appropriationRevised estimate
Medium-term estimates
2008/09 2009/10 2010/11 2011/12 2012/13 2013/2014 2014/15Cons/prof: Legal cost 871 557 1 394 991 4 391 3 119 Contractors 1 877 1 172 46 424 6 000 25 920 23 787 Agency & support/outsourced services 11 176 6 012 74 986 18 305 1 927 1 928 Entertainment Fleet Services (F/SER) 1 000 1 000 Housing Inventory: Food and food supplies 17 16 11 370 55 55 Inventory: Fuel, oil and gas 11 Inventory:Learn & teacher support material Inventory: Materials and supplies 421 2 2 Inventory: Medical supplies Inventory: Medicine Medsas inventory interface Inventory: Military stores 41 Inventory: Other consumbles 13 42 274 16 195 20 20 Inventory: Stationery and printing 4 631 6 267 9 034 12 199 6 251 7 120 1 208 1 208 1 208Lease payments 238 1 659 8 774 30 8 730 12 036 1 417 1 417 1 417Rental and Hiring Property payments 9 5 607 59 6 500 6 583 Transport provided dept activity 23 13 833 Travel and subsistence 7 277 7 428 4 812 12 818 2 818 2 501 366 366 366Training & development 581 547 1 337 11 240 190 20 Operating payments 423 50 4 065 4 865 5 197 Venues and facilities 18 200 60 60 Interest and rent on land 120 149 250 250 250Interest 120 149 250 250 250Rent on land Transfers and subsidies to1: 224 70 003 375 50 127 Provinces and municipalities 224 52 Provinces2 79 52 Provincial Revenue Funds Provincial agencies and funds 79 52 Municipalities3 145 Municipal bank accounts 145

Vote 8 - Roads and Transport • EPRE • 2012/13
380
R thousand
Outcome Main
appropriationAdjusted
appropriationRevised estimate
Medium-term estimates
2008/09 2009/10 2010/11 2011/12 2012/13 2013/2014 2014/15Municipal agencies and funds Departmental agencies and accounts 69 927 2 Social security funds 69 927 2 Departmental agencies (non-business entities) Universities Other transfers Non-profi t institutions Households 24 375 50 125 Social benefi ts 24 119 50 125 Other transfers to households 256 Payments for capital assets 658 110 2 472 4 000 4 000 4 000 1 051 1 051 1 051Buildings and other fi xed structures Buildings Other fi xed structures Machinery and equipment 658 110 1 133 4 000 4 000 4 000 1 051 1 051 1 051Transport equipment Other machinery and equipment 658 110 1 133 4 000 4 000 4 000 1 051 1 051 1 051Heritage Assets Specialised military assets Biological assets Land and sub-soil assets Software and other intangible assets 1 339 Payments for fi nancial assets Total economic classifi cation 108 211 175 385 244 279 266 841 239 265 239 248 204 685 176 032 164 766
TABLE 26:PAYMENTS AND ESTIMATES BY ECONOMIC CLASSIFICATION: GAUTRAIN
R thousand
OutcomeMain
appropriationAdjusted
appropriationRevised estimate
Medium-term estimates
2008/09 2009/10 2010/11 2011/12 2012/13 2013/2014 2014/15Current payments 320 4 676 10 Compensation of employees Salaries and wages Social contributions Goods and services 320 4 676 10 of which Administrative fees

2012/13 • EPRE • Vote 8 - Roads and Transport
381
R thousand
OutcomeMain
appropriationAdjusted
appropriationRevised estimate
Medium-term estimates
2008/09 2009/10 2010/11 2011/12 2012/13 2013/2014 2014/15Advertising Cons/prof: Laboratory services Cons/prof: Legal cost 320 10 10 Contractors 4 652 Agency & support/outsourced services Entertainment Fleet Services (F/SER) Housing Inventory: Food and food supplies Inventory: Fuel, oil and gas Inventory:Learn & teacher support material Inventory: Materials and supplies Inventory: Medical supplies Inventory: Medicine Medsas inventory interface Inventory: Military stores Inventory: Other consumbles 14 Interest and rent on land Interest Rent on land Transfers and subsidies to1: 7 523 695 6 056 111 3 714 778 2 193 530 2 219 545 2 219 545 737 711 2 417 119 2 547 643Provinces and municipalities Provinces2 Provincial Revenue Funds Provincial agencies and funds Municipalities3 Municipal bank accounts Municipal agencies and funds Departmental agencies and accounts 7 523 695 6 056 111 3 714 778 2 193 530 2 219 545 2 219 545 737 711 2 417 119 2 547 643Social security funds Departmental agencies (non-business entities) 7 523 695 6 056 111 3 714 778 2 193 530 2 219 545 2 219 545 737 711 2 417 119 2 547 643Universities

Vote 8 - Roads and Transport • EPRE • 2012/13
382
R thousand
OutcomeMain
appropriationAdjusted
appropriationRevised estimate
Medium-term estimates
2008/09 2009/10 2010/11 2011/12 2012/13 2013/2014 2014/15Foreign governments and international organisations Public corporations and private enterprises5 Social benefi ts Other transfers to households Payments for capital assets Buildings and other fi xed structures Buildings Other fi xed structures Machinery and equipment Transport equipment Other machinery and equipment Heritage Assets Specialised military assets Biological assets Land and sub-soil assets Software and other intangible assets Payments for fi nancial assets Total economic classifi cation 7 524 015 6 060 787 3 714 788 2 193 530 2 219 545 2 219 545 737 711 2 417 119 2 547 643