Embed Size (px)
Citation preview

i
DEPARTMENT OF ENERGY
DRAFT 2012 INTEGRATED ENERGY PLANNING REPORT ANNEXURE A – TECHNICAL REPORT
PART 1: DEMAND MODELLING REPORT

i
CONTENTS PAGE
DEPARTMENT OF ENERGY ..................................................................................... i 1. Introduction .................................................................................................... 1
1.1 Scope ............................................................................................................ 1
2. Demand Modelling Approach ........................................................................ 3
2.1 Activity Variables ........................................................................................... 4
3. Modelling Assumptions ................................................................................. 5
3.1 Key Drivers of Energy Demand ..................................................................... 5 3.1.1 Population Dynamics .......................................................................................................... 5 3.1.2 Economic Growth ................................................................................................................ 6 3.1.3 Energy Efficiency................................................................................................................. 6 3.1.4 Energy Prices ...................................................................................................................... 6 3.1.5 Climate ................................................................................................................................ 7
3.2 Macroeconomic and Demographics Assumptions ........................................ 7 3.2.1 Gross Domestic Product and Gross Value-Added per Sector ............................................ 7 3.2.2 Gross Value Add – Agricultural Sector ............................................................................... 9 3.2.3 Iron Ore Production ............................................................................................................. 9 3.2.4 Per Capita GDP ................................................................................................................. 10 3.2.5 Number of Persons per Household ................................................................................... 11 3.2.6 Percentage of Households with grid connection ............................................................... 12 3.2.7 Number of Households ..................................................................................................... 13
3.3 Main Sources of Historical Data .................................................................. 14
4. Industrial Demand Projections .................................................................... 16
4.1 Chemical Sector .......................................................................................... 16 4.1.1 Energy End Use ................................................................................................................ 17 4.1.2 Electricity End Use ............................................................................................................ 18 4.1.3 Projected Demand............................................................................................................. 19
4.2 Iron and Steel Sector .................................................................................. 20 4.2.1 Energy End Use ................................................................................................................ 22 4.2.2 Electricity End Use ............................................................................................................ 23 4.2.3 Projected Demand............................................................................................................. 25
4.3 Nonferrous Metals Sector ........................................................................... 25 4.3.1 Energy End Use ................................................................................................................ 26 4.3.2 Electricity End Use ............................................................................................................ 27 4.3.3 Projected Demand............................................................................................................. 28
4.4 Rest of Manufacturing ................................................................................. 28 4.4.1 Energy End Use ................................................................................................................ 30 4.4.2 Electricity End Use ............................................................................................................ 30 4.4.3 Projected Demand............................................................................................................. 31
4.5 Mining Sector .............................................................................................. 32 4.5.1 Energy End Use ................................................................................................................ 33 4.5.2 Electricity End Use ............................................................................................................ 35 4.5.3 Projected Demand............................................................................................................. 38
4.6 Industrial Sector .......................................................................................... 39 4.6.1 Projected Demand............................................................................................................. 39 4.6.2 Industrial Sector Energy Intensity ..................................................................................... 40 4.6.3 Energy Efficiency Opportunities in the Industrial Sector ................................................... 43
5. Residential Demand Projections ................................................................. 47
5.1 Energy Ladder and Multiple Fuel Use ......................................................... 47

ii
5.1.1 Multiple Fuel Use Cooking ................................................................................................ 48 5.1.2 Multiple Fuel Use Space Heating ...................................................................................... 49 5.1.3 Multiple Fuel Use Lighting ................................................................................................. 49
5.2 Household Trends in Biomass Use ............................................................. 49 5.3 Household Trends in Coal Use ................................................................... 50 5.4 Household Trends in Illuminating Paraffin Use ........................................... 51 5.5 Household Trends in Electricity Use ........................................................... 52 5.6 Projected Demand ...................................................................................... 53 5.7 Residential Sector Energy Intensity ............................................................ 55 5.8 Energy Efficiency Opportunities in the Residential Sector .......................... 57
6. Commercial Demand Projections ............................................................... 60
6.1 Projected Demand ...................................................................................... 61 6.2 Commercial Sector Energy Intensity ........................................................... 62 6.3 Energy Efficiency Opportunities in the Commercial Sector ......................... 63
7. Agricultural Demand Projections ................................................................ 66
7.1 Projected Demand ...................................................................................... 67 7.2 Agricultural Sector Energy Intensity ............................................................ 67 7.3 Energy Efficiency Opportunities in the Agricultural Sector .......................... 69
8. Transport Demand Projections ................................................................... 72
8.1 Scope and procedure of transport demand analysis ................................... 72 8.2 Drivers of transport demand ........................................................................ 73 8.3 Existing vehicle fleet capacity...................................................................... 73 8.4 Future vehicle fleet capacity requirements .................................................. 75 8.5 Projected vehicle kilometres travelled ......................................................... 76 8.6 Projected passenger and tonne kilometres ................................................. 78 8.7 Required future capacity in fleet capacity .................................................... 79
9. References .................................................................................................... 81
iii
TABLE OF FIGURES PAGE Figure 1-1: Final Energy Consumption (Source: DoE, 2009) ..................................... 1 Figure 3-1: Proportion of Urban and Rural Population by Development Regions
1950, 2011 and 2050 (Source: United Nations, 2011) .............................. 6 Figure 3-2: Gross Value Added (Source: Historical Data (1980-2010), Statistics
South Africa; Projected Values (2010-2050), Model Output) ..................... 8 Figure 3-3: Percentage Share of Gross Value Added (Source: Historical Data
(1980-2010), Statistics South Africa; Projected Values (2010-2050), Model Output,) ........................................................................................... 8
Figure 3-4: Gross Value Added in the Agricultural Sector (Source: Historical Data (1980- 2010), Statistics South Africa; Projected Values (2010-2050), Model Output) ................................................................................ 9
Figure 3-5: Iron Ore Production in South Africa (Source: Historical (1980-2010), Statistics South Africa; Projected Values (2010-2050), Model Output) ... 10
Figure 3-6: GDP per Capita (Source: Historical Data (1980- 2010), Statistics South Africa; Projected Values (2010-2050), Model Output) ................... 11
Figure 3-7: Number of persons per household (Source: Historical (1995- 2010), Statistics South Africa; Projected Values (2010-2050), Model Output) ... 12
Figure 3-8: Percentage of household with grid connections (Source: Historical (1995 - 2010), Statistics South Africa; Projected Values (2010-2050), Model Output) .......................................................................................... 13
Figure 3-9: Number of households (Source: Historical (1995- 2010), Statistics South Africa; Projected Values (2010-2050), Model Output) ................... 14
Figure 4-1: Chemical Sector Energy Use (Source: DoE, 2009) ............................... 17 Figure 4-2: Chemical Sector Energy End Use (Source: DoE Analysis) .................... 18 Figure 4-3: Chemical Sector Electricity End Use (Source: Eskom IDM) .................. 19 Figure 4-4: Chemical Sector Projected Demand (Source: Model Output) ................ 20 Figure 4-5: Users of Steel (Source: Kumba Iron Ore and Anglo American, 2011) ... 21
Figure 4-6: Iron and Steel Sector Energy Use (Source: DoE, 2009) ........................ 22 Figure 4-7: Iron and Steel Sector Energy End Use (Source: DoE Analysis) ............ 23 Figure 4-8: Iron and Steel Sector Electricity End Use (Source: Eskom IDM) ........... 24 Figure 4-9: Current Energy Savings Potential For Iron and Steel Based on Best
Available Technologies (Source: IEA, 2012b) ......................................... 24 Figure 4-10: Iron and Steel Sector Projected Demand (Source: Model Output) ....... 25 Figure 4-11: Regional Specific Power Consumption in Aluminium Smelting
(Source: IAI, 2008) .................................................................................. 26 Figure 4-12: Nonferrous Metals Sector Energy End Use (Source: DoE Analysis) ... 27
Figure 4-13: Nonferrous Metals Sector Electricity End Use (Source: Eskom IDM) ........................................................................................................ 27
Figure 4-14: Nonferrous Metals Sector Projected Demand (Source: Model Output) .................................................................................................... 28
Figure 4-15: Rest of Manufacturing Energy Use (Source: DoE, 2009) ..................... 29 Figure 4-16: Rest of Manufacturing Energy End Use (Source: DoE Analysis) ......... 30 Figure 4-17: Rest of Manufacturing Electricity End Use (Source: Eskom IDM) ........ 31
Figure 4-18: Rest of Manufacturing Projected Demand (Source: Model Output) ..... 32 Figure 4-19: Mining Sector Energy Use (Source: DoE, 2009) .................................. 33 Figure 4-20: Mining Sector Energy End Use (Source: DoE Analysis) ...................... 34 Figure 4-21: Gold Mining Sector Electricity End Use (Source: Eskom IDM) ............ 35 Figure 4-22: Platinum Mining Sector Electricity End Use (Source: Eskom IDM) ...... 36

iv
Figure 4-23: Coal Mining Sector Electricity End Use (Source: Eskom IDM) ............. 36
Figure 4-24: Rest of Mining Sector Electricity End Use (Source: Eskom IDM) ......... 37 Figure 4-25: Mining Sector Projected Demand (Source: Model Output) .................. 38 Figure 4-26: Mining Sector Projected Electricity Demand (Source: Model
Output) .................................................................................................... 39 Figure 4-27: Industrial Sector-Total Projected Energy Demand (Source: Model
Output) .................................................................................................... 40 Figure 4-28: Manufacturing Sector Energy Intensity (Source: DoE Analysis) .......... 42 Figure 4-29: Mining Sector Energy Intensity (Source: DoE Analysis) ...................... 43 Figure 4-30: Industrial Sector Energy End Use (Source: DoE Analysis) .................. 44 Figure 5-1: Residential Sector Energy Use (Source: DoE, 2009) ............................. 47 Figure 5-2: Energy Ladder for Cooking (Source: World Health Organization,
2006) ....................................................................................................... 48 Figure 5-3: Trends in Household Use of Wood for Energy Services (Source:
Statistics South Africa, 1998, 2003, 2007, 2012a) ................................... 50
Figure 5-4: Trends in Household Use of Coal for Energy Services (Source: Statistics South Africa, 1998, 2003, 2007, 2012a) ................................... 51
Figure 5-5: Trends in Household Use of Illuminating Paraffin for Energy Services (Source: Statistics South Africa, 1998, 2003, 2007, 2012a) ..... 52
Figure 5-6: Trends in Household Use of Electricity for Energy Services (Source: Statistics South Africa, 1998, 2003, 2007, 2012a) ................................... 53
Figure 5-7: Residential Sector Projected Demand 2010-2050 (Source Model Output) .................................................................................................... 55
Figure 5-8: The United Nations’ Human Development Index and Electricity Use (Source: Pasternak, 2000)....................................................................... 56
Figure 5-9: Residential Sector Energy Intensity (Source: DoE Analysis) ................. 57 Figure 5-10: Residential Sector Energy End Use (Source: DoE Analysis) ............... 58 Figure 5-11: Residential Sector Electricity End Use (Source: Eskom IDM) .............. 59 Figure 6-1: Commercial Sector Energy Use (Source: DoE, 2009) ........................... 61
Figure 6-2: Commercial Sector Projected Demand 2010-2050 (Source: Model Output) .................................................................................................... 62
Figure 6-3: Commercial Sector Energy Intensity (Source: DoE Analysis) ................ 63 Figure 6-4: Commercial Sector Energy End Use (Source: DoE Analysis)................ 64 Figure 6-5: Commercial Sector Electricity End Use (Source: Eskom IDM) .............. 65 Figure 7-1: Agricultural Sector Energy Use (Source: DoE, 2009) ............................ 66 Figure 7-2: Agricultural Sector Projected Demand 2010-2050 (Source: Model
Output) .................................................................................................... 67 Figure 7-3: Agricultural Sector Energy Intensity (Source: DoE Analysis) ................. 69
Figure 7-4: Agricultural Sector Energy End Use (Source: DoE Analysis) ................. 70 Figure 7-5: Agricultural Sector Electricity End Use (Source: Eskom IDM)................ 71 Figure 8-1: Decay of the vehicle fleet by individual vehicle types ............................. 74 Figure 8-2: Residual passenger vehicle fleet capacity ............................................. 74
Figure 8-3: Residual freight vehicle fleet capacity .................................................... 75 Figure 8-4: Historical and projected vehicle fleet ...................................................... 76 Figure 8-5: Historical and projected vehicle kilometres ............................................ 77
Figure 8-6: Historical and projected passenger kilometres ....................................... 78 Figure 8-7: Historical and projected freight tonne kilometres ................................... 79 Figure 8-8: Existing passenger fleet capacity (shaded) and future demand ............. 80 Figure 8-9: Existing total freight capacity (shaded) and future demand ................... 80

v
TABLES
Table 2-1: Activity Variables ....................................................................................... 4 Table 3-1: Main Sources of Historical Data .............................................................. 14 Table 8.1: Distances travelled by vehicle type and class (ERC, 2012) .................... 77
1
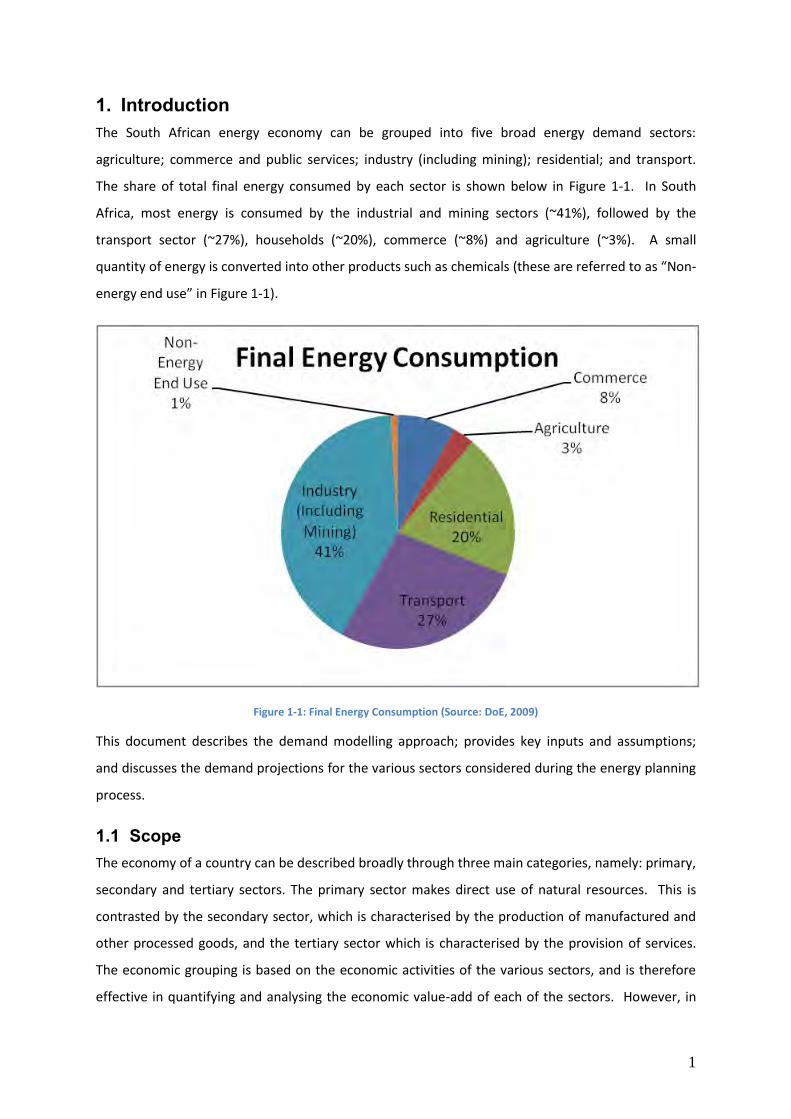
1. Introduction The South African energy economy can be grouped into five broad energy demand sectors:
agriculture; commerce and public services; industry (including mining); residential; and transport.
The share of total final energy consumed by each sector is shown below in Figure 1-1. In South
Africa, most energy is consumed by the industrial and mining sectors (~41%), followed by the
transport sector (~27%), households (~20%), commerce (~8%) and agriculture (~3%). A small
quantity of energy is converted into other products such as chemicals (these are referred to as “Non-
energy end use” in Figure 1-1).
Figure 1-1: Final Energy Consumption (Source: DoE, 2009)
This document describes the demand modelling approach; provides key inputs and assumptions;
and discusses the demand projections for the various sectors considered during the energy planning
process.
1.1 Scope The economy of a country can be described broadly through three main categories, namely: primary,
secondary and tertiary sectors. The primary sector makes direct use of natural resources. This is
contrasted by the secondary sector, which is characterised by the production of manufactured and
other processed goods, and the tertiary sector which is characterised by the provision of services.
The economic grouping is based on the economic activities of the various sectors, and is therefore
effective in quantifying and analysing the economic value-add of each of the sectors. However, in

2
order to effectively quantify energy consumption within each of the economic sectors, a grouping
aligned to energy end-use becomes more constructive. While energy demand can be closely linked
to economic activity, this approach also becomes effective in quantifying energy demand in those
sectors whose productivity may not always have a high level of correlation with energy demand (for
example energy consumed in offices and public buildings).
Six demand sectors were considered, namely: agriculture; commerce; industry, mining; residential;
and transport.
The agricultural sector includes animal husbandry, crop farming, forestry and fishing.
The commerce and public services sector includes wholesale and retail, public services,
financial and business services, hospitality, education, entertainment, information and
communication. It does however exclude commercial transport.
The transport sector includes passenger transportation (private and public) and freight
transportation. While economically, freight transport forms a part of commercial services,
this has been separated and quantified separately for better clarity.
The industrial sector includes all manufacturing (manufacturing and production of all goods
and products including fast moving consumer goods) and also includes construction.
The mining sector includes mining of all commodities through different mining techniques.
(In the analysis mining is included within industry).
The residential sector (households) includes all personal dwellings (i.e. formal and informal
households in rural and urban areas).
3
2. Demand Modelling Approach The two traditional approaches which are used in projecting demand for energy are econometric
and end-use accounting. A brief description of each approach is as follows:
Econometric models are based on economic theory and try to validate the economic rules
empirically using time series data.
End-use accounting demand models attempt to establish accounting coherence using a
detailed engineering representation of the energy system.
Combined or hybrid models attempt to reduce the methodological divergence between the
econometric and engineering models by combining the features of the two techniques.
The aim of econometric analysis is to establish a quantitative relationship between the dependent
variable and the independent variable by statistical analysis of historical data. By using the projected
values of the independent variable, the derived relationship is then used to determine the future
value of the dependent variable.
While the end-use energy accounting demand models allow a detailed sectoral representation of the
different uses of energy and hence produce more realistic projections, when compared with
econometric models, these models are highly data dependent and require significant and low-level
data which is not often readily available (Battacharyya et. al, 2009).
While the ultimate objective is to conduct demand projections for all energy services (cooking,
lighting, industrial processes, transportation, etc.) within each major energy demand sector
(agriculture, commerce, industry, mining, residential and transport), due to paucity of energy
consumption data at an energy end-use level, demand projections were conducted for the energy
demand sectors as follows:
For the agricultural, commercial, industrial , mining and residential sectors, energy demand
was estimated and projected for individual energy carriers (i.e. electricity, natural gas,
LPGas, coal, diesel, etc.); and
For the transport sector, energy demand was projected for energy end-use (i.e. mobility
measured by passenger kilometres or freight tonne kilometres) as opposed to individual
fuels (i.e. petrol, diesel, jet fuel, etc.).This approach makes it possible to quantify the extent
to which different fuels can be used to meet the same end-use/need.

4
2.1 Activity Variables Within energy demand modelling, the independent variable is represented by an activity variable
which often is an indicator or measure of economic activity or output within the various economic
sectors. While the ideal activity variable is the level of production or output within the various
sectors, the final choice of activity variable was informed by the availability of the relevant data.
Table 2-1 below provides a mapping of economic sectors to energy demand sectors, with the key
activity variables used within the respective sectors in the last column.
Table 2-1: Activity Variables
ECONOMIC
GROUPING
ECONOMIC SECTOR ENERGY
DEMAND SECTOR
SUB-SECTORS SUB-SECTORS INCLUDED ENERGY CARRIERS
CONSIDERED
ACTIVITY VARIABLE
Agriculture, forestry and
fishing
Agricultural Sector N/A N/A Electricity, Coal, Diesel Value-Added in the
Agriculture Sector
Mining and Quarrying Mining Sector N/A N/A Electricity, Coal, Diesel GDP
Chemicals N/A Electricity, Coal, Natural
Gas
Value-Added in the
Secondary Sector
Iron and Steel N/A Electricity, Coal, Natural
Gas
Production Activity (Iron
Ore Mined)
Non-Ferrous Metals N/A Electricity, Natural Gas Value-Added in the
Secondary Sector
Construction
Electricity, gas and water
Wholesale and retail trade;
hotels and restaurants
Finance, real estate and
business services
General government services
Personal services
Storage and communication
Private passenger
transport
N/A Diesel, petrol, electricity,
aviation fuel
GDP/Capita
Public passenger
transport
Diesel, petrol, electricity,
aviation fuel
GDP/Capita
Freight transport Diesel, petrol, electricity
(rail)
GDP
HOUSEHOLDS N/A Residential Sector N/A N/A Electricity, Coal, LPG,
Paraffin
Population growth,
Number of households
and electrification rate
Electricity, Coal, LPG,
Residual Fuel Oil
Value-Added Tertiary
Sector
PRIMARY
Commercial Sector
Manufacturing
N/ATERTIARY
Transport Transport Sector
SECONDARY
N/A
Other Manufacturing Non-Metallic Minerals, Food
and Tobacco, Paper and Pulp,
Construction, Machinery,
Textile, Wood and Wood
Products, Transport
Equipment
Electricity, Coal, Natural
Gas
Value-Added in the
Secondary Sector
Industrial Sector
(Excluding Mining)
or Manufacturing
Sector
5
3. Modelling Assumptions 3.1 Key Drivers of Energy Demand How much and what kind of energy service is demanded depends on various factors such as:
climate, size of dwellings, number of people per dwelling, floor area of service sector buildings per
unit of service sector output; share of energy-intensive products in manufacturing output; tonne-km
of transported goods per GDP; average distance travelled per capita; and the share of different
modes of transport activities, amongst other factors (IEA, 2012). These factors are themselves
influenced by exogenous elements which are briefly discussed in the following sub-sections. While
each of these elements can be further analysed, the intention is to provide a very high-level
overview of each.
3.1.1 Population Dynamics Population growth affects the quantity of energy consumed, while the general standard of living of a
population determines the composition of the energy services demanded. Other demographic
factors such as the average age of the population, affect both the level and pattern of energy use.
Older people, for example, tend to travel less for work and leisure. The rapid growth of cities and
towns in the developing world is often accompanied by a decline in the growth of the rural
population. The rate of urbanisation therefore remains an important determinant of energy
demand, as city and town dwellers in the developing world tend to have higher incomes and better
access to energy services than people dwelling in rural areas. Strong buying power and the resultant
increase in ownership of household goods and appliances tend to propel the increase in energy
consumption.
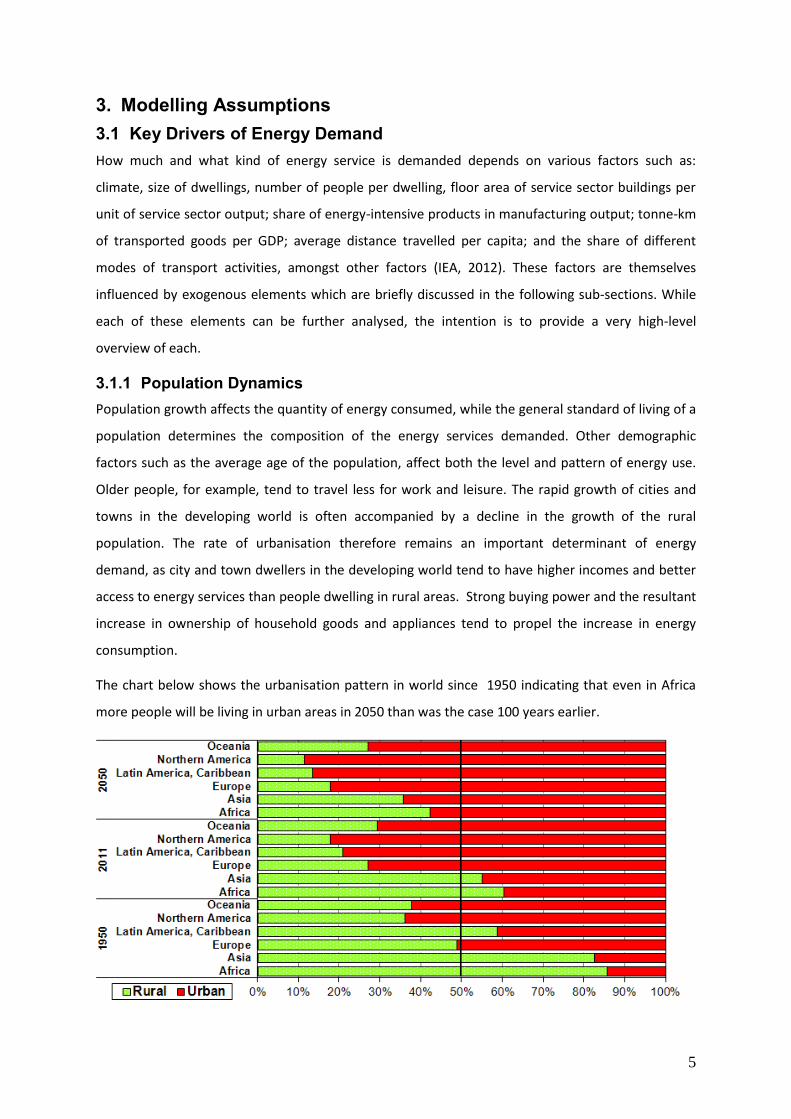
The chart below shows the urbanisation pattern in world since 1950 indicating that even in Africa
more people will be living in urban areas in 2050 than was the case 100 years earlier.

6
Figure 3-1: Proportion of Urban and Rural Population by Development Regions 1950, 2011 and 2050 (Source: United Nations, 2011)
3.1.2 Economic Growth Economic growth is by far the most significant indicator of the overall demand for energy services,
with energy consumption having a positive correlation to economic activity although typically at a
lower rate.
Economic activities in the primary sector tend to be more energy intensive compared to those in the
secondary and tertiary or services sectors, with the tertiary sector being the least energy intensive.
The structure of the economy and changes thereof have an impact on the energy-intensity of the
economy and therefore on final energy demand.
Mobility (for both the movement of people and goods) is a key component of economic growth and
transportation demand therefore tends to increase substantially with economic growth.
3.1.3 Energy Efficiency Improved energy efficiency has an impact on energy demand and has been the main reason why
final energy use has been decoupled from economic growth in most economies.
Energy efficiency improvements are however often fuelled by other factors, for example, high
energy prices may provide an incentive for the use of more energy efficiency equipment and
appliances, or even switching to alternative energy sources.
Technological developments and the adoption of technologies that are more efficient, methods and
processes can have significant impacts on reducing total energy consumption. Better use of
different energy sources – i.e. using the most appropriate forms of energy for the intended
application or energy end-use, results in overall reduction in energy intensity.
Non-price factors which have an impact on energy efficiency are often introduced through
appropriate policy and standards which generally promote the adaptation of more efficient
equipment, appliances and methods.
3.1.4 Energy Prices Energy prices have an impact on final energy demand and in particular on the choice of fuel used to
provide a particular energy service. However while the impact of energy prices (especially in a
developing economy such a South Africa) is a factor influencing final energy demand, determining
the impact of increases in energy prices is difficult to quantify and it is itself a changing variable
highly influenced by many other factors.
The choice of primary energy source and energy technology used to provide secondary energy both
have a high bearing on the final price of energy. However, additional factors such as the pricing of

7
CO2 emissions into the final energy price come to play and affect investment decisions in the energy
sector by altering the relative costs of competing fuels.
3.1.5 Climate Local climate and weather patterns have a significant impact not only on the quantity of energy
demanded, but also on the form of energy demanded. With the onset of climate change, energy
consumption patterns are likely to be highly impacted.
3.2 Macroeconomic and Demographics Assumptions While the previous section outlines some of the key drivers for energy demand not all the possible
factors that influence energy demand have been considered. This section provides the assumptions
on the key demand drivers which were considered. Efforts to include more explanatory variables in
the demand projections in order to enhance the demand projections are on-going.
3.2.1 Gross Domestic Product and Gross Value-Added per Sector The Gross Domestic Product (GDP) is one of the primary indicators of a countries economic
performance and has been widely used as a proxy to estimate energy demand. Historical GDP
figures were obtained from Statistics South Africa, while projections of the domestic average
potential economic growth for the country were provided by the National Treasury. The projections
of domestic average potential economic growth provided by National Treasury were then used to
derive the estimated average potential growth or value-added for the primary, secondary and
tertiary sectors.
As mentioned above, the primary sector of the economy is the sector of an economy making direct
use of natural resources and includes agriculture, forestry and fishing, mining, and extraction of oil
and gas. The secondary sector includes those industries or sub-sectors responsible for producing
manufactured and other processed goods, while the tertiary sector includes all economic sectors
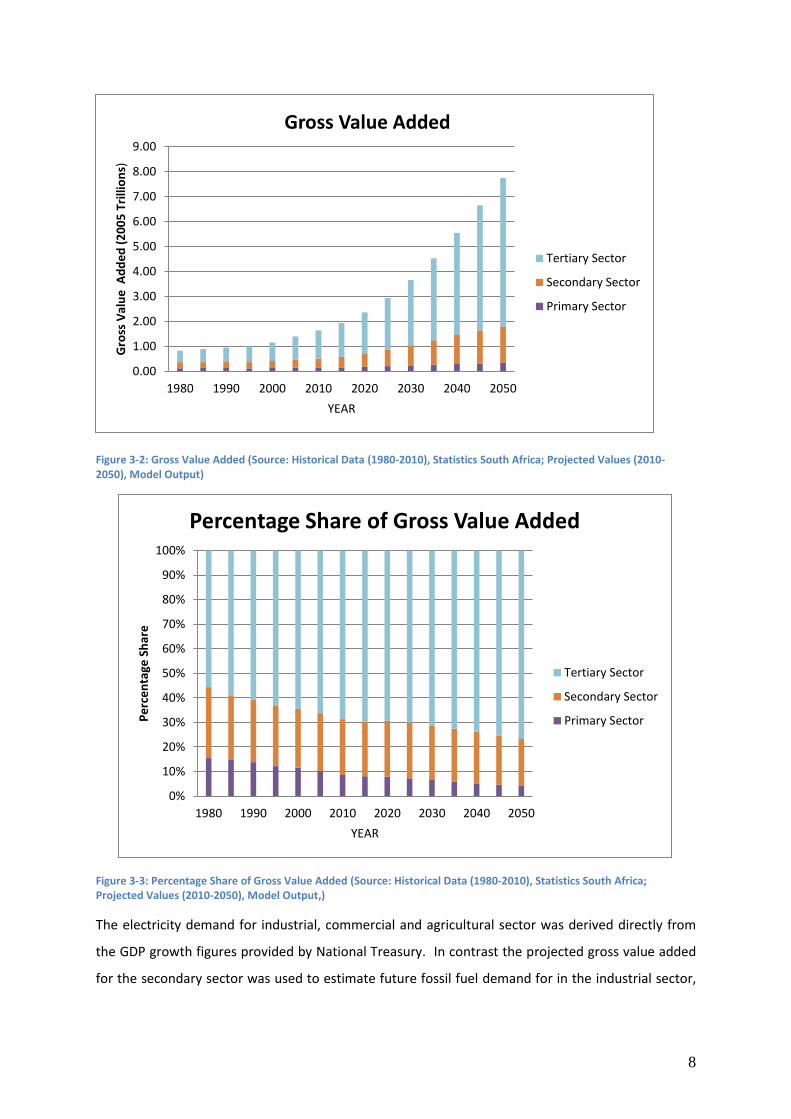
which provide various services. As illustrated in Figure 3-3 below, over the last 30 years the
contribution of the primary and secondary sector towards total GDP has declined while that of the
tertiary sector has continued to grow. This trend is projected to continue into the future.
8
Figure 3-2: Gross Value Added (Source: Historical Data (1980-2010), Statistics South Africa; Projected Values (2010-2050), Model Output)
Figure 3-3: Percentage Share of Gross Value Added (Source: Historical Data (1980-2010), Statistics South Africa; Projected Values (2010-2050), Model Output,)
The electricity demand for industrial, commercial and agricultural sector was derived directly from
the GDP growth figures provided by National Treasury. In contrast the projected gross value added
for the secondary sector was used to estimate future fossil fuel demand for in the industrial sector,
0.00
1.00
2.00
3.00
4.00
5.00
6.00
7.00
8.00
9.00
1980 1990 2000 2010 2020 2030 2040 2050
Gro
ss V
alu
e A
dd
ed
(2
00
5 T
rilli
on
s)
YEAR
Gross Value Added
Tertiary Sector
Secondary Sector
Primary Sector
0%
10%
20%
30%
40%
50%
60%
70%
80%
90%
100%
1980 1990 2000 2010 2020 2030 2040 2050
Pe
rce
nta
ge S
har
e
YEAR
Percentage Share of Gross Value Added
Tertiary Sector
Secondary Sector
Primary Sector

9
while projected gross value added for the tertiary sector was used to derive future fossil fuel
demand for the commercial sector.
3.2.2 Gross Value Add – Agricultural Sector Historical values for gross value added for the agricultural sector were obtained from Statistics South
Africa while projected values were estimated based on the historical contribution of the agricultural
sector to GDP. The projected values were used to derive total final fossil fuel demand for the
agricultural sector and are shown in Figure 3-4.
Figure 3-4: Gross Value Added in the Agricultural Sector (Source: Historical Data (1980- 2010), Statistics South Africa; Projected Values (2010-2050), Model Output)
3.2.3 Iron Ore Production Iron and steel (representing almost 95% of all metals used per year globally) are the world’s most
commonly used metals, with iron ore as the key component. World production of iron ore averages
around two billion metric tons of raw ore annually. In 2010, South Africa produced 55 million metric
tons ranking seventh in the world and being responsible for just over 2% of the world’s production,
of iron ore.
0.00
0.01
0.02
0.03
0.04
0.05
0.06
0.07
0.08
0.09
0.10
19
80
19
85
19
90
19
95
20
00
20
05
20
10
20
15
20
20
20
25
20
30
20
35
20
40
20
45
20
50
Gro
ss v
alu
e a
dd
ed
(2
00
5 R
Tri
llio
ns)
Gross Value Added - Agricultural Sector

10
Figure 3-5: Iron Ore Production in South Africa (Source: Historical (1980-2010), Statistics South Africa; Projected Values (2010-2050), Model Output)
As illustrated in Figure 3-5 above from 1980 to 2010 iron ore production in South Africa has more
than tripled and going into the future iron production is expected to continue increasing albeit at a
slower rate. The projected iron ore production in South Africa was used to estimate future fossil fuel
demand in the iron and steel sector.
3.2.4 Per Capita GDP Per capita GDP - calculated as the total GDP divided by the total population - has been commonly
used as an indicator of standard of living. Although not a measure of personal income, a higher per
capita GDP is generally interpreted as an indication of a higher standard of living as compared to a
lower value. In 2010, South Africa’s per capita GDP was R53 238. The projected GDP per capita has
been used to estimate future demand for passenger transportation for South Africa.
0
50
100
150
200
250
300
350
400
19
80
19
85
19
90
19
95
20
00
20
05
20
10
20
15
20
20
20
25
20
30
20
35
20
40
20
45
20
50
Pro
du
ctio
n In
de
x (2
00
5=1
00
)
Year
Iron Ore Production in South Africa

11
Figure 3-6: GDP per Capita (Source: Historical Data (1980- 2010), Statistics South Africa; Projected Values (2010-2050), Model Output)
3.2.5 Number of Persons per Household The number, size and structure of households in South Africa have undergone a dramatic change
since 1996. While the total number of households in South Africa has increased from an estimated 9,
059, 571 in 1996 to 14, 756, 000 in 2011, the average household size has declined from about 4.48 in
1996 to 3.4 in 2011. Similar trends are seen in other developing countries as they transition into a
developed country over time. The average number of persons per household, together with the
estimated population growth in the future, was used to derive the estimated number of households.

12
Figure 3-7: Number of persons per household (Source: Historical (1995- 2010), Statistics South Africa; Projected Values (2010-2050), Model Output)
3.2.6 Percentage of Households with grid connection Universal access to modern forms of clean energy is a strategic objective of the Department of
Energy. Electrification is a cornerstone of social upliftment and has been proven to positively
contribute to South Africa’s developmental goals. More than 5.6 million grid connections have been
made between 1994 and 2012 as a result of Government’s National Integrated Electrification
Programme (INEP) managed by the Department of Energy. In the period from 2002 to 2013, a little
over 65 000 households were supplied with non-grid technologies such as solar home systems as
part of the non-grid electrification programme. According to the General Household Survey 2011,
the percentage of households connected to the grid has increased relatively consistently from a little
over 76% in 2002 to just fewer than 83% in 2011 (Statistics South Africa, 2012).
3.0
3.2
3.4
3.6
3.8
4.0
4.2
4.4
4.6
4.8
5.0
19
96
19
98
20
00
20
02
20
04
20
06
20
08
20
10
20
12
20
14
20
16
20
18
20
20
20
22
20
24
20
26
20
28
20
30
20
32
20
34
20
36
20
38
20
40
20
42
20
44
20
46
20
48
20
50
# o
f P
ers
on
s p
er
HH
Year
Number of persons per household
13
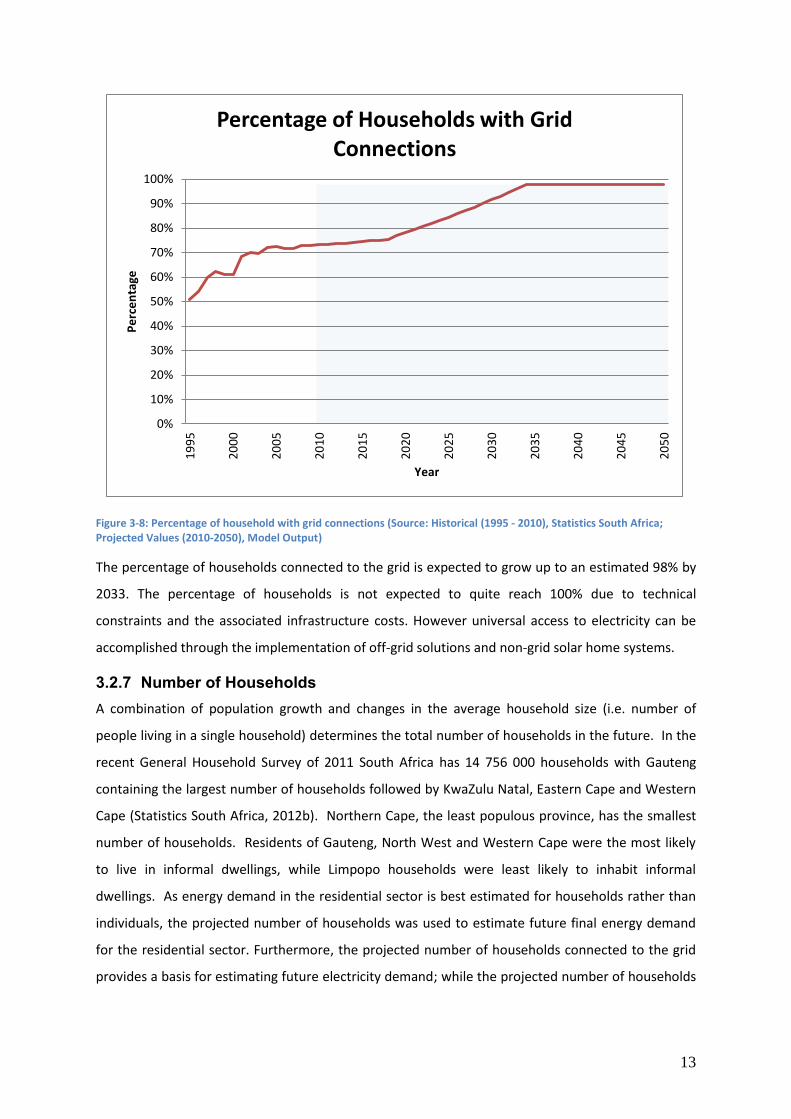
Figure 3-8: Percentage of household with grid connections (Source: Historical (1995 - 2010), Statistics South Africa; Projected Values (2010-2050), Model Output)
The percentage of households connected to the grid is expected to grow up to an estimated 98% by
2033. The percentage of households is not expected to quite reach 100% due to technical
constraints and the associated infrastructure costs. However universal access to electricity can be
accomplished through the implementation of off-grid solutions and non-grid solar home systems.
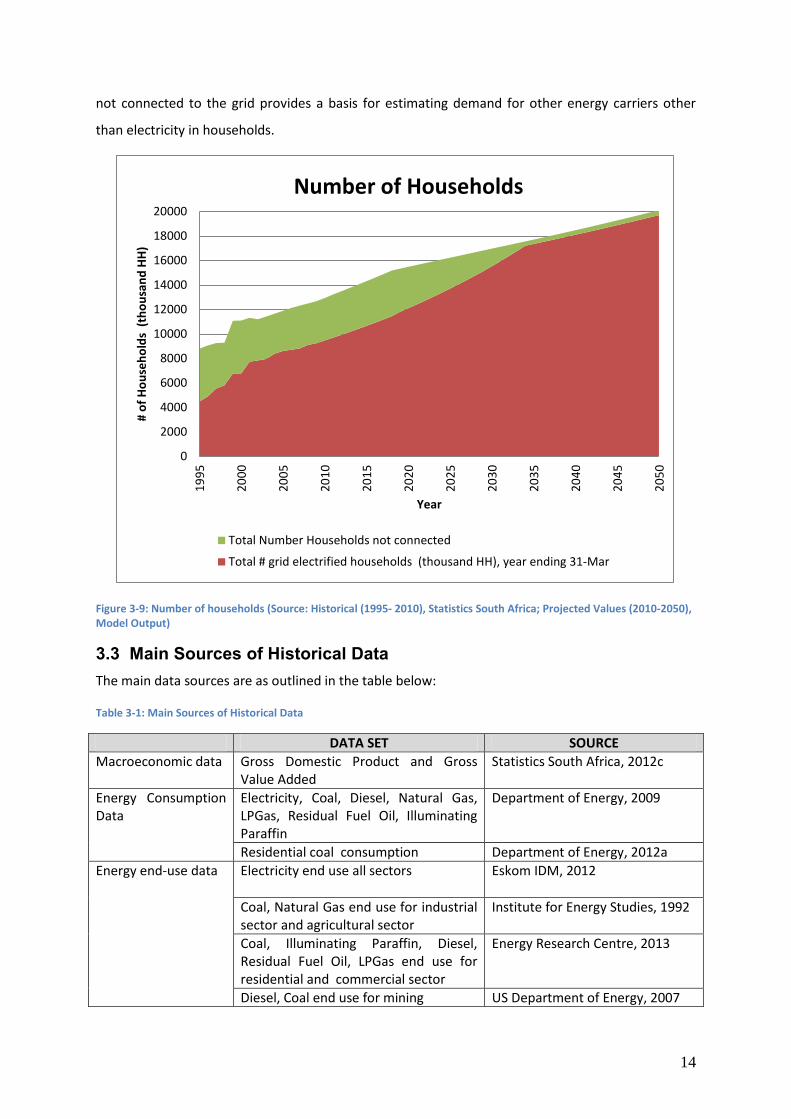
3.2.7 Number of Households A combination of population growth and changes in the average household size (i.e. number of
people living in a single household) determines the total number of households in the future. In the
recent General Household Survey of 2011 South Africa has 14 756 000 households with Gauteng
containing the largest number of households followed by KwaZulu Natal, Eastern Cape and Western
Cape (Statistics South Africa, 2012b). Northern Cape, the least populous province, has the smallest
number of households. Residents of Gauteng, North West and Western Cape were the most likely
to live in informal dwellings, while Limpopo households were least likely to inhabit informal
dwellings. As energy demand in the residential sector is best estimated for households rather than
individuals, the projected number of households was used to estimate future final energy demand
for the residential sector. Furthermore, the projected number of households connected to the grid
provides a basis for estimating future electricity demand; while the projected number of households
0%
10%
20%
30%
40%
50%
60%
70%
80%
90%
100%1
99
5
20
00
20
05
20
10
20
15
20
20
20
25
20
30
20
35
20
40
20
45
20
50
Pe
rce
nta
ge
Year
Percentage of Households with Grid Connections
14
not connected to the grid provides a basis for estimating demand for other energy carriers other
than electricity in households.
Figure 3-9: Number of households (Source: Historical (1995- 2010), Statistics South Africa; Projected Values (2010-2050), Model Output)
3.3 Main Sources of Historical Data The main data sources are as outlined in the table below:
Table 3-1: Main Sources of Historical Data
DATA SET SOURCE
Macroeconomic data Gross Domestic Product and Gross Value Added
Statistics South Africa, 2012c
Energy Consumption Data
Electricity, Coal, Diesel, Natural Gas, LPGas, Residual Fuel Oil, Illuminating Paraffin
Department of Energy, 2009
Residential coal consumption Department of Energy, 2012a
Energy end-use data Electricity end use all sectors Eskom IDM, 2012
Coal, Natural Gas end use for industrial sector and agricultural sector
Institute for Energy Studies, 1992
Coal, Illuminating Paraffin, Diesel, Residual Fuel Oil, LPGas end use for residential and commercial sector
Energy Research Centre, 2013
Diesel, Coal end use for mining US Department of Energy, 2007
0
2000
4000
6000
8000
10000
12000
14000
16000
18000
200001
99
5
20
00
20
05
20
10
20
15
20
20
20
25
20
30
20
35
20
40
20
45
20
50
# o
f H
ou
seh
old
s (
tho
usa
nd
HH
)
Year
Number of Households
Total Number Households not connected
Total # grid electrified households (thousand HH), year ending 31-Mar

15
Demographic data Total number of households and total population
Statistics South Africa,1998, 2003, 2007,2012a,2012b, 2012d
Electrification rates for households Statistics South Africa, 1998, 2003,2007, 2012a

16
4. Industrial Demand Projections South Africa is a highly energy intensive economy. According to the 2012 Energy Sustainability Index
developed by the World Energy Council, the energy intensity of South Africa is 0.05 million BTU per
USD. The Industrial sector which comprises of mining, iron and steel, chemicals, non-ferrous metals,
non-metallic minerals, pulp and paper, food and tobacco, and other manufacturing consumes ~41%
of the final energy demand in the country. The largest of these is iron and steel which consumes
~27% of the total energy used by the industry sector. Mining consumes ~26% of the energy used in
industry. Key drivers for potential changes in energy demand trends in the industrial sector will
include structural changes within the economy as South Africa moves towards a low carbon
economy and the tertiary sector grows; an increased focus on climate change and emissions
associated with energy end-use; increases in energy prices and adoption of less energy-intensive
technologies and practices.
4.1 Chemical Sector The South African chemical industry is dominated by local companies which developed from the
industry’s historical base in explosives for the mining industry, followed by the development of
nitrogen based fertilizers and sulphuric acid. The chemical sector of South Africa is an integral
component of the economy, converting various raw materials (e.g. petroleum, natural gas, minerals,
coal, air and water) into more than 70,000 diverse products. In South Africa the chemical sector is a
key component of the country’s industrial base with a contribution of R318 million to the GDP in
2011, which is about 21% of total manufacturing sales (Statistics South Africa, 2012c). As shown in
Figure 4-1 close to 68% of total energy requirements in the chemical sector were met using fossil
fuels with coal accounting for the majority.

17
Figure 4-1: Chemical Sector Energy Use (Source: DoE, 2009)
4.1.1 Energy End Use Figure 4-2 below shows end use attributed to both fossil fuels and electricity. From an energy
perspective the main step chemical manufacturing involves combining feedstock to achieve specific
chemical reactions followed by separating out the desired product. For example within the
pharmaceutical industry the primary step produces the active ingredient which is followed by
secondary processing to turn the active drugs into products suitable for administration (Kema,
2012). Energy is consumed in chemicals manufacture to provide process heating, industrial cooling
to power motor-driven systems and for other purposes. The chemical industry is diverse ranging
from plastics to pharmaceuticals hence energy usage within individual sub sectors is closely tied to
product configurations as well as whether or not fuels are used as a raw material (feedstock). For
example, inorganic chemicals are produced from a variety of feedstock with methane for the
fertilizer industry, air for the production of main industrial gases, and minerals for the production of
acids and bases (Kema, 2012). Hence the proportion of energy attributed to different end use is an
average for the chemicals industry and may not reflect sub-sector differences.
As shown in Figure 4-2 technologies which process heat particularly used for fluid heating represent
the bulk of energy use in chemicals manufacture at approximately 88%. These include steam
systems, fired systems such as furnaces and reboilers. Motor systems which include motor driven
units such as pumps, conveyor belts, compressors, fans, and mixers as well as grinders and other
material handling or process equipment rank second with just over 7% of total energy end use.
Coal 42.18%
Electricity 31.32%
Natural Gas 26.50%
Chemical Sector Energy Use
18
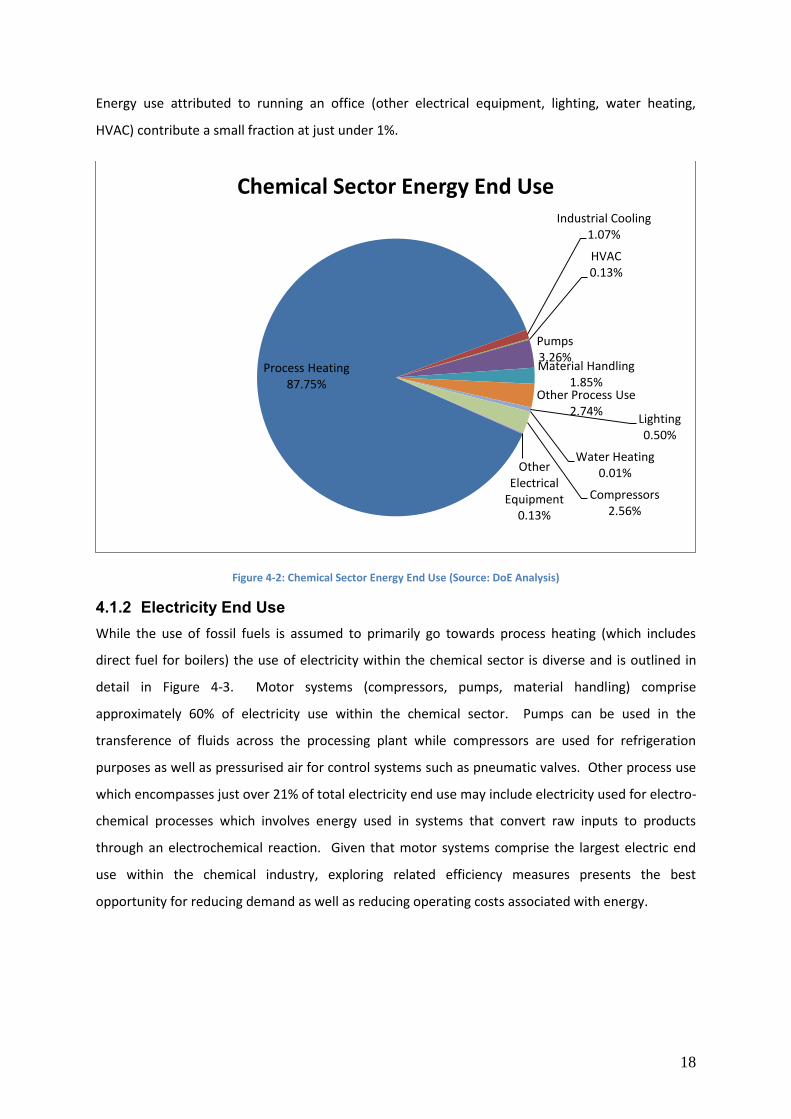
Energy use attributed to running an office (other electrical equipment, lighting, water heating,
HVAC) contribute a small fraction at just under 1%.
Figure 4-2: Chemical Sector Energy End Use (Source: DoE Analysis)
4.1.2 Electricity End Use While the use of fossil fuels is assumed to primarily go towards process heating (which includes
direct fuel for boilers) the use of electricity within the chemical sector is diverse and is outlined in
detail in Figure 4-3. Motor systems (compressors, pumps, material handling) comprise
approximately 60% of electricity use within the chemical sector. Pumps can be used in the
transference of fluids across the processing plant while compressors are used for refrigeration
purposes as well as pressurised air for control systems such as pneumatic valves. Other process use
which encompasses just over 21% of total electricity end use may include electricity used for electro-
chemical processes which involves energy used in systems that convert raw inputs to products
through an electrochemical reaction. Given that motor systems comprise the largest electric end
use within the chemical industry, exploring related efficiency measures presents the best
opportunity for reducing demand as well as reducing operating costs associated with energy.
Process Heating 87.75%
Industrial Cooling 1.07%
HVAC 0.13%
Pumps 3.26% Material Handling
1.85% Other Process Use
2.74% Lighting 0.50%
Water Heating 0.01%
Compressors 2.56%
Other Electrical
Equipment 0.13%
Chemical Sector Energy End Use

19
Figure 4-3: Chemical Sector Electricity End Use (Source: Eskom IDM)
4.1.3 Projected Demand Chemical products are critical components of consumer goods and are found in everything from
automobiles to plastics and electronics. The historical demand for fossil fuel consumption in the
chemical, nonferrous and other manufacturing sector was analysed against value-added within the
secondary sector. The future demand for energy within the chemical sector was then projected
using the relationship between the historical values. The fuel mix represents the share of various
fuels such as coal, oil, natural gas, heat, and electricity that make up the final energy use.
Historically the fuel mix for the chemical sector has been dominated by fossil fuels. Overall total
energy consumption in the chemical sector increases despite the decline in coal consumption. The
decline in coal consumption in the chemical sector is a recent trend seen in the last few years.
Process Heating 4.20%
Industrial Cooling 8.40%
HVAC 1.00%
Pumps 25.50%
Material Handling 14.50%
Other Process Use 21.40%
Lighting 3.90%
Water Heating 0.10%
Compressors 20.00%
Other Electrical Equipment
1.00%
Chemical Sector Electricity End Use
20
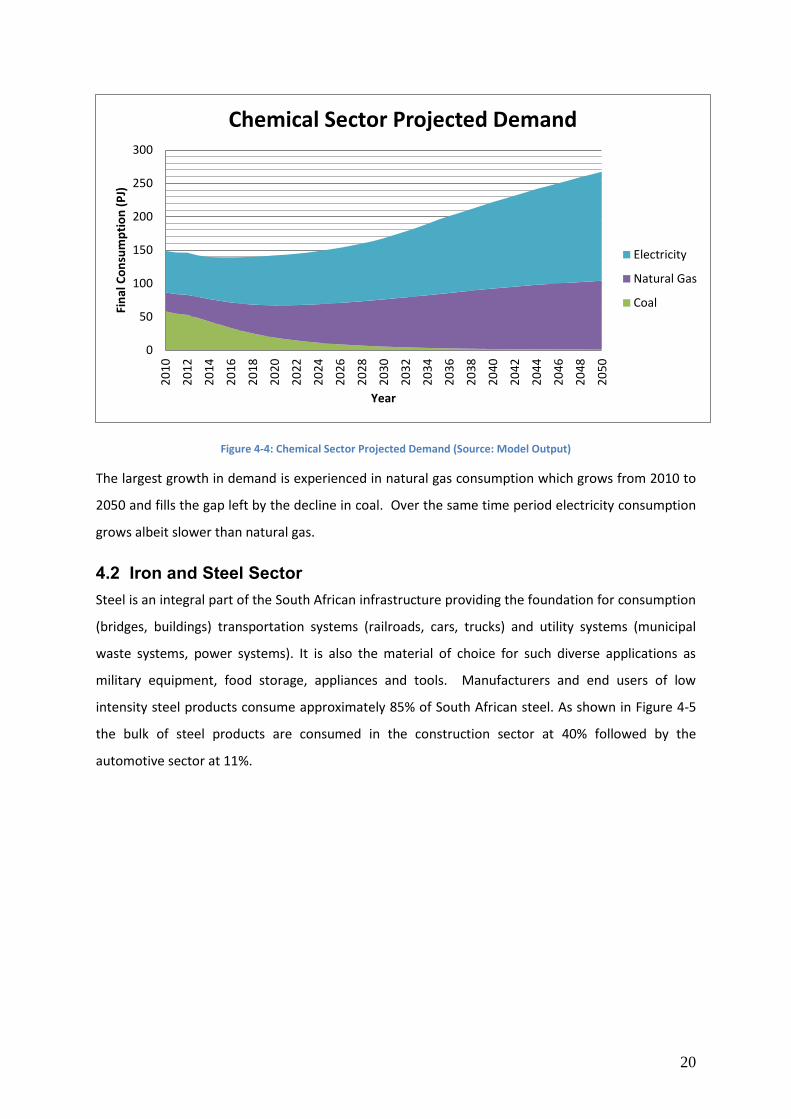
Figure 4-4: Chemical Sector Projected Demand (Source: Model Output)
The largest growth in demand is experienced in natural gas consumption which grows from 2010 to
2050 and fills the gap left by the decline in coal. Over the same time period electricity consumption
grows albeit slower than natural gas.
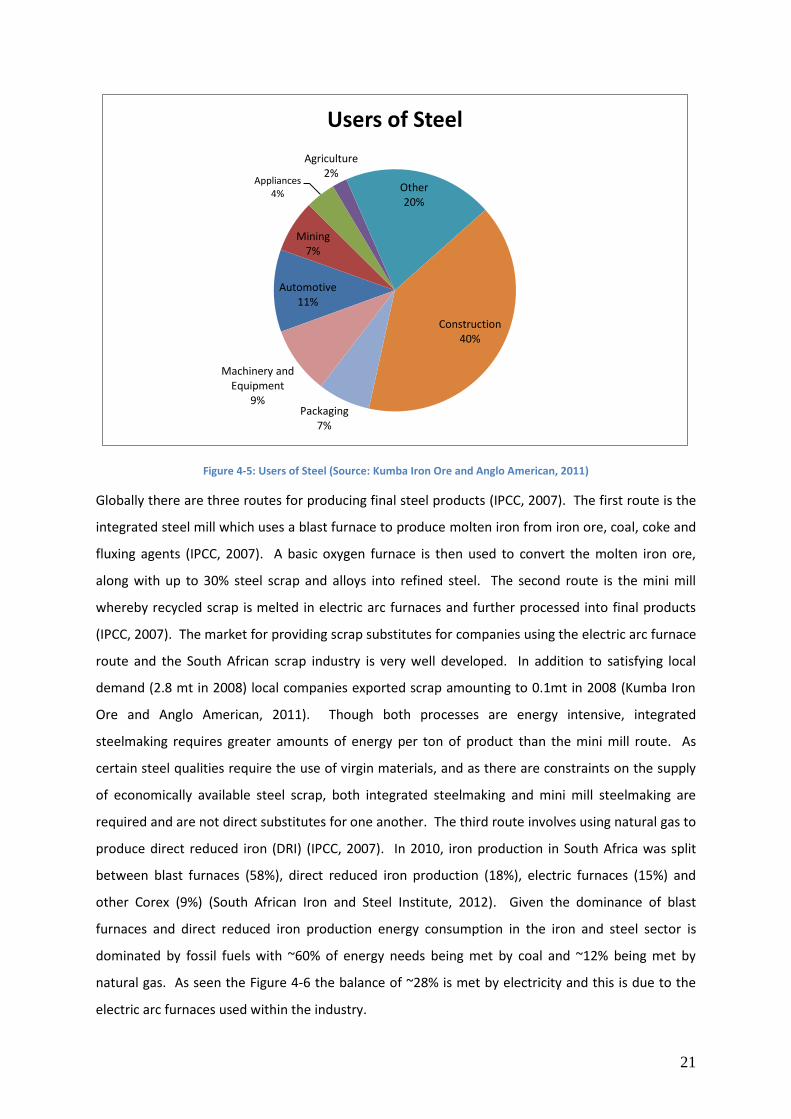
4.2 Iron and Steel Sector Steel is an integral part of the South African infrastructure providing the foundation for consumption
(bridges, buildings) transportation systems (railroads, cars, trucks) and utility systems (municipal
waste systems, power systems). It is also the material of choice for such diverse applications as
military equipment, food storage, appliances and tools. Manufacturers and end users of low
intensity steel products consume approximately 85% of South African steel. As shown in Figure 4-5
the bulk of steel products are consumed in the construction sector at 40% followed by the
automotive sector at 11%.
0
50
100
150
200
250
3002
01
0
20
12
20
14
20
16
20
18
20
20
20
22
20
24
20
26
20
28
20
30
20
32
20
34
20
36
20
38
20
40
20
42
20
44
20
46
20
48
20
50
Fin
al C
on
sum
pti
on
(P
J)
Year
Chemical Sector Projected Demand
Electricity
Natural Gas
Coal
21
Figure 4-5: Users of Steel (Source: Kumba Iron Ore and Anglo American, 2011)
Globally there are three routes for producing final steel products (IPCC, 2007). The first route is the
integrated steel mill which uses a blast furnace to produce molten iron from iron ore, coal, coke and
fluxing agents (IPCC, 2007). A basic oxygen furnace is then used to convert the molten iron ore,
along with up to 30% steel scrap and alloys into refined steel. The second route is the mini mill
whereby recycled scrap is melted in electric arc furnaces and further processed into final products
(IPCC, 2007). The market for providing scrap substitutes for companies using the electric arc furnace
route and the South African scrap industry is very well developed. In addition to satisfying local
demand (2.8 mt in 2008) local companies exported scrap amounting to 0.1mt in 2008 (Kumba Iron
Ore and Anglo American, 2011). Though both processes are energy intensive, integrated
steelmaking requires greater amounts of energy per ton of product than the mini mill route. As
certain steel qualities require the use of virgin materials, and as there are constraints on the supply
of economically available steel scrap, both integrated steelmaking and mini mill steelmaking are
required and are not direct substitutes for one another. The third route involves using natural gas to
produce direct reduced iron (DRI) (IPCC, 2007). In 2010, iron production in South Africa was split
between blast furnaces (58%), direct reduced iron production (18%), electric furnaces (15%) and
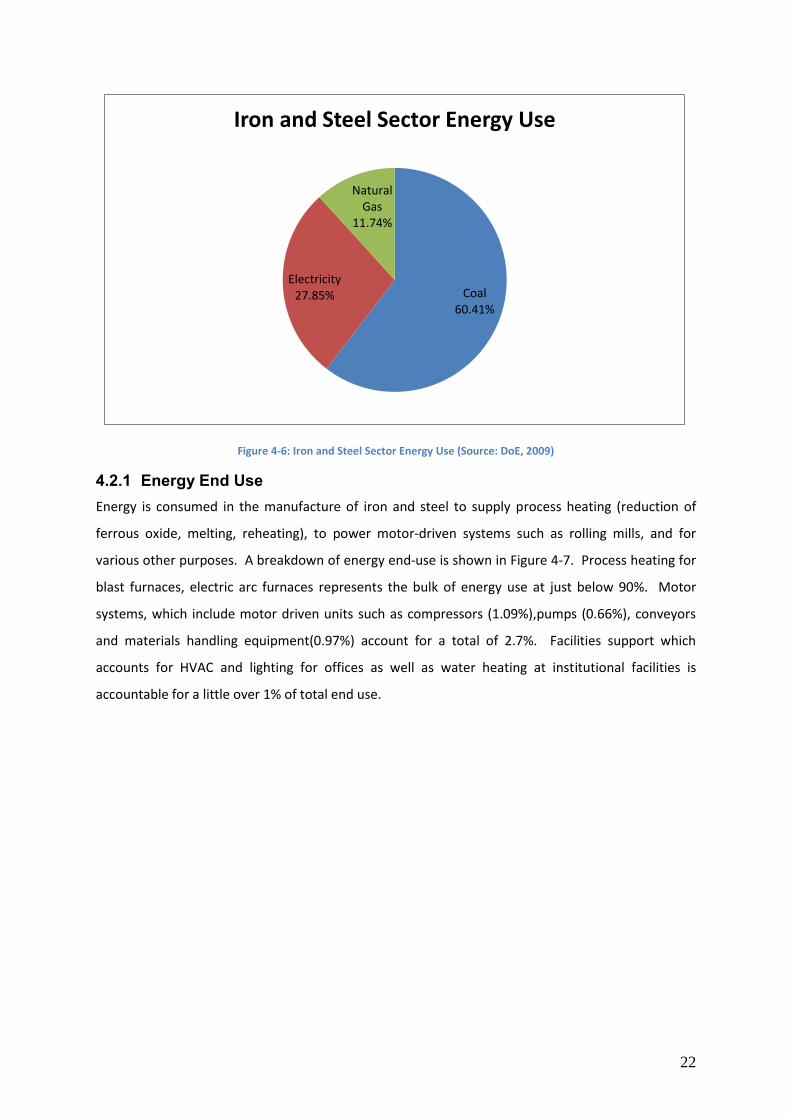
other Corex (9%) (South African Iron and Steel Institute, 2012). Given the dominance of blast
furnaces and direct reduced iron production energy consumption in the iron and steel sector is
dominated by fossil fuels with ~60% of energy needs being met by coal and ~12% being met by
natural gas. As seen the Figure 4-6 the balance of ~28% is met by electricity and this is due to the
electric arc furnaces used within the industry.
Automotive 11%
Mining 7%
Appliances 4%
Agriculture 2%
Other 20%
Construction 40%
Packaging 7%
Machinery and Equipment
9%
Users of Steel
22
Figure 4-6: Iron and Steel Sector Energy Use (Source: DoE, 2009)
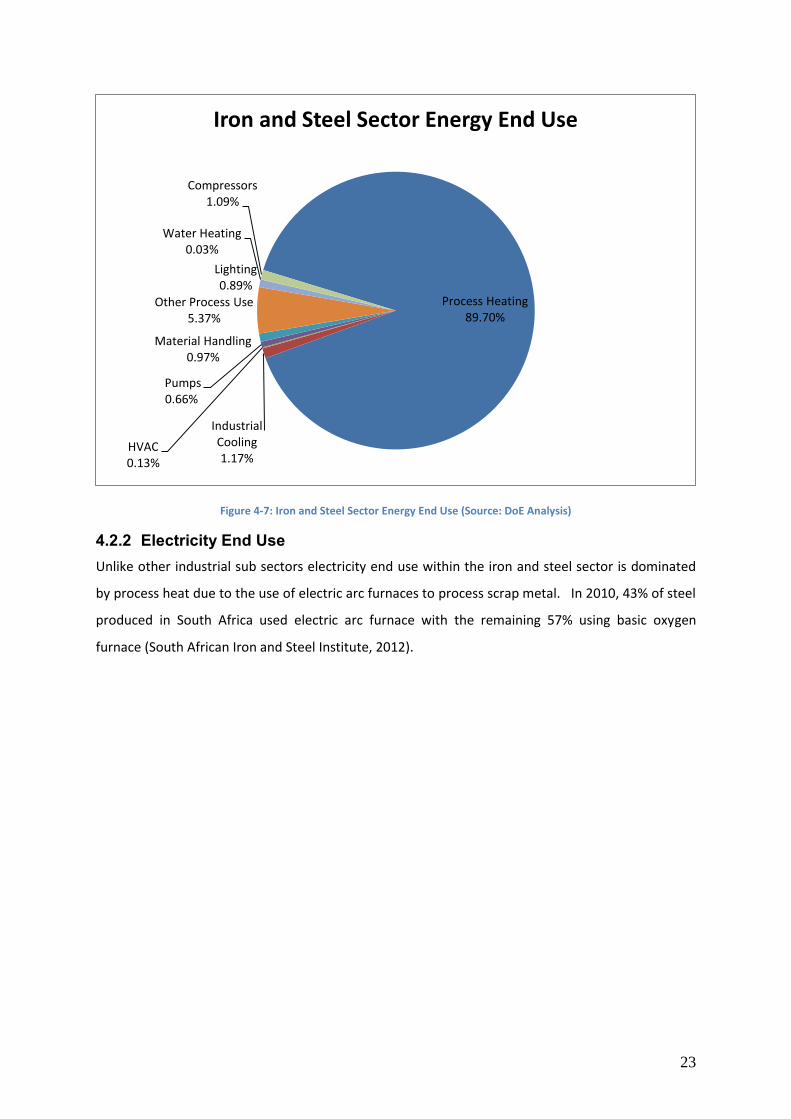
4.2.1 Energy End Use Energy is consumed in the manufacture of iron and steel to supply process heating (reduction of
ferrous oxide, melting, reheating), to power motor-driven systems such as rolling mills, and for
various other purposes. A breakdown of energy end-use is shown in Figure 4-7. Process heating for
blast furnaces, electric arc furnaces represents the bulk of energy use at just below 90%. Motor
systems, which include motor driven units such as compressors (1.09%),pumps (0.66%), conveyors
and materials handling equipment(0.97%) account for a total of 2.7%. Facilities support which
accounts for HVAC and lighting for offices as well as water heating at institutional facilities is
accountable for a little over 1% of total end use.
Coal 60.41%
Electricity 27.85%
Natural Gas
11.74%
Iron and Steel Sector Energy Use
23
Figure 4-7: Iron and Steel Sector Energy End Use (Source: DoE Analysis)
4.2.2 Electricity End Use Unlike other industrial sub sectors electricity end use within the iron and steel sector is dominated
by process heat due to the use of electric arc furnaces to process scrap metal. In 2010, 43% of steel
produced in South Africa used electric arc furnace with the remaining 57% using basic oxygen
furnace (South African Iron and Steel Institute, 2012).
Process Heating 89.70%
Industrial Cooling 1.17%
HVAC 0.13%
Pumps 0.66%
Material Handling 0.97%
Other Process Use 5.37%
Lighting 0.89%
Water Heating 0.03%
Compressors 1.09%
Iron and Steel Sector Energy End Use
24
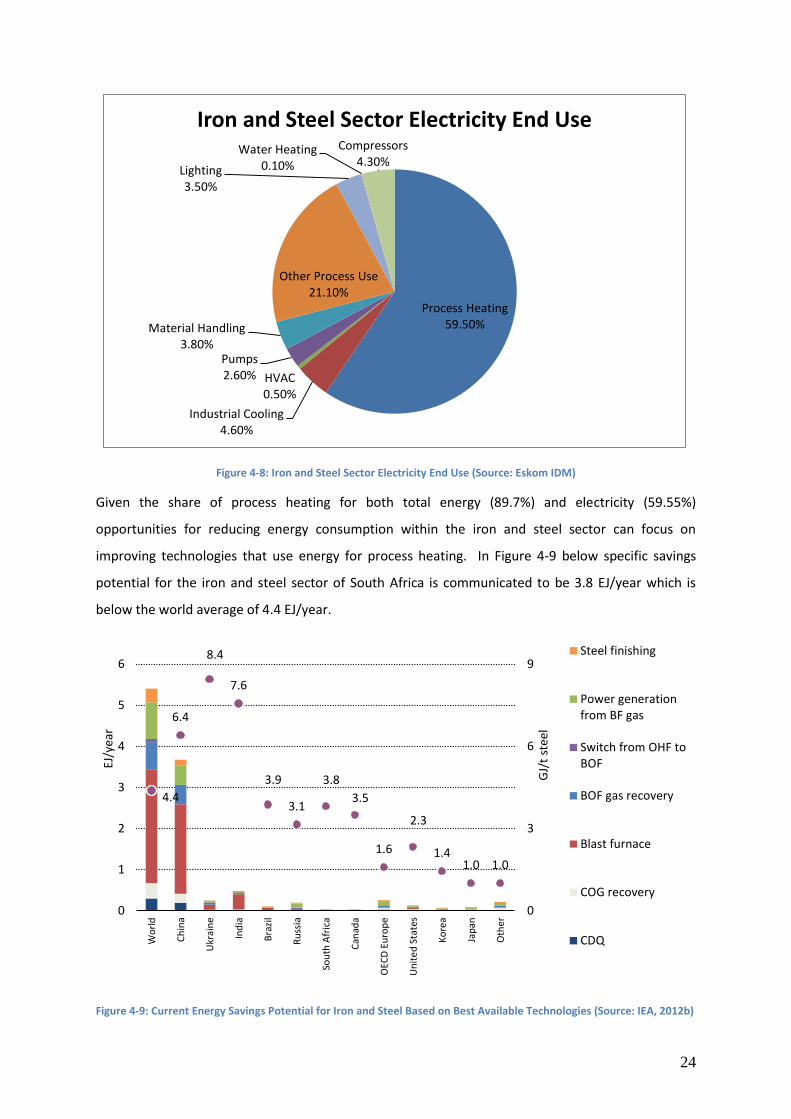
Figure 4-8: Iron and Steel Sector Electricity End Use (Source: Eskom IDM)
Given the share of process heating for both total energy (89.7%) and electricity (59.55%)
opportunities for reducing energy consumption within the iron and steel sector can focus on
improving technologies that use energy for process heating. In Figure 4-9 below specific savings
potential for the iron and steel sector of South Africa is communicated to be 3.8 EJ/year which is
below the world average of 4.4 EJ/year.
Figure 4-9: Current Energy Savings Potential for Iron and Steel Based on Best Available Technologies (Source: IEA, 2012b)
Process Heating 59.50%
Industrial Cooling 4.60%
HVAC 0.50%
Pumps 2.60%
Material Handling 3.80%
Other Process Use 21.10%
Lighting 3.50%
Water Heating 0.10%
Compressors 4.30%
Iron and Steel Sector Electricity End Use
4.4
6.4
8.4
7.6
3.9
3.1
3.8
3.5
1.6
2.3
1.4 1.0 1.0
0
3
6
9
0
1
2
3
4
5
6
Wo
rld
Ch
ina
Ukr
ain
e
Ind
ia
Bra
zil
Ru
ssia
Sou
th A
fric
a
Can
ada
OEC
D E
uro
pe
Un
ite
d S
tate
s
Ko
rea
Jap
an
Oth
er
GJ/
t st
eel
EJ/y
ear
Steel finishing
Power generationfrom BF gas
Switch from OHF toBOF
BOF gas recovery
Blast furnace
COG recovery
CDQ

25
4.2.3 Projected Demand The fuel mix for iron and steel continues to be dominated by fossil fuels with a slight increase in the
share of natural gas from 14% to 22% from 2010 to 2050. Electricity consumption within the iron
and steel is still necessary as electric arc furnaces provide process heating for blending scrap steel
with pig iron produced from blast furnaces.
Figure 4-10: Iron and Steel Sector Projected Demand (Source: Model Output)
4.3 Nonferrous Metals Sector South Africa’s nonferrous metal industry is comprised of aluminium and other metals including
copper, brass, lead, zinc and tin. Aluminium is a strong, light and durable metal that is resistant to
corrosion, a good reflector and conductor of electricity and heat. The main uses of aluminium are in
the building and construction sectors, in containers and packaging, for electrical application, in road,
air and seagoing transport and industrial machinery and equipment. Due to its favourable properties
and the environmental benefits the demand for aluminium has increased significantly over the past
decade.
In 2007 South Africa was the ninth largest primary aluminium producer responsible for 2.4% of
global production (United States Geological Survey, 2009). South Africa does not have economically
exploitable deposits of bauxite thus all bauxite is imported primarily from Australia. The domestic
primary production of aluminium is a remnant of a history of access to inexpensive electricity.
0
50
100
150
200
250
300
350
400
450
500
20
10
20
12
20
14
20
16
20
18
20
20
20
22
20
24
20
26
20
28
20
30
20
32
20
34
20
36
20
38
20
40
20
42
20
44
20
46
20
48
20
50
Fin
al C
on
sum
pti
on
(P
J)
Year
Iron and Steel Sector Projected Demand
Electricity
Natural Gas
Coal
26
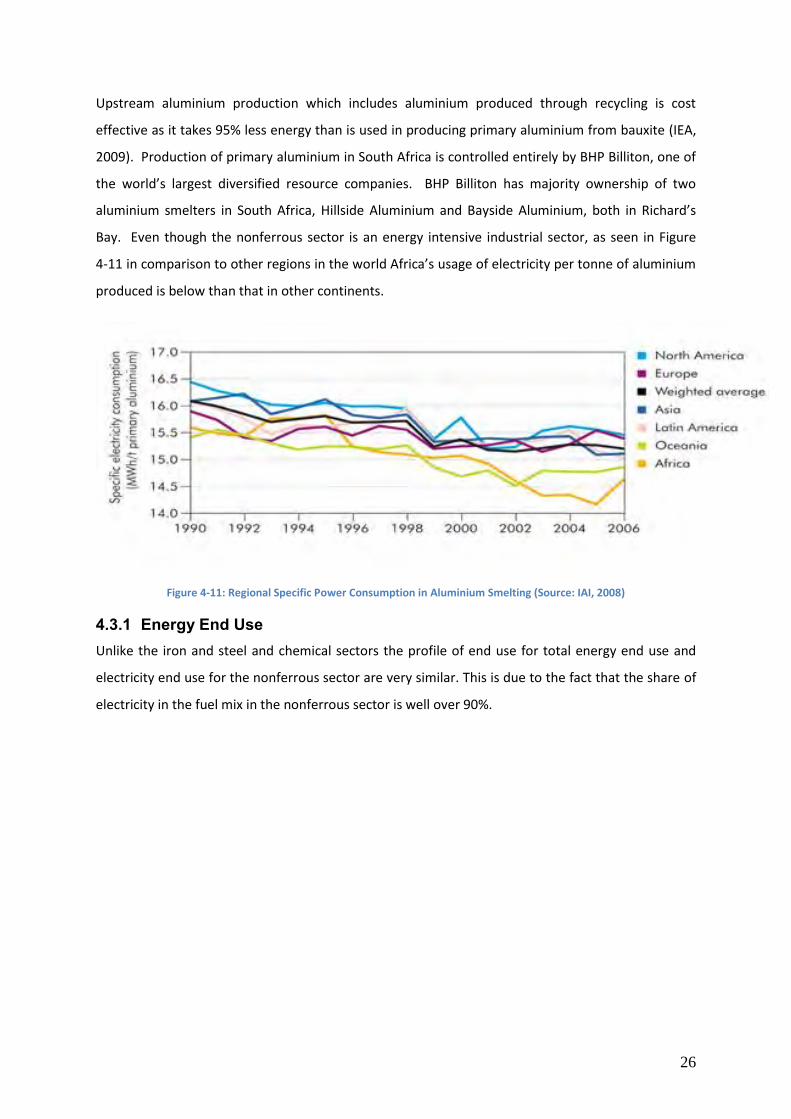
Upstream aluminium production which includes aluminium produced through recycling is cost
effective as it takes 95% less energy than is used in producing primary aluminium from bauxite (IEA,
2009). Production of primary aluminium in South Africa is controlled entirely by BHP Billiton, one of
the world’s largest diversified resource companies. BHP Billiton has majority ownership of two
aluminium smelters in South Africa, Hillside Aluminium and Bayside Aluminium, both in Richard’s
Bay. Even though the nonferrous sector is an energy intensive industrial sector, as seen in Figure
4-11 in comparison to other regions in the world Africa’s usage of electricity per tonne of aluminium
produced is below than that in other continents.
Figure 4-11: Regional Specific Power Consumption in Aluminium Smelting (Source: IAI, 2008)
4.3.1 Energy End Use Unlike the iron and steel and chemical sectors the profile of end use for total energy end use and
electricity end use for the nonferrous sector are very similar. This is due to the fact that the share of
electricity in the fuel mix in the nonferrous sector is well over 90%.

27
Figure 4-12: Nonferrous Metals Sector Energy End Use (Source: DoE Analysis)
4.3.2 Electricity End Use As shown in Figure 4-13 process heat used by smelters comprise the largest use of electricity in the
nonferrous sector at 22.8%. Motor systems (compressors (7.0%), pumps (8.6%)), materials handling
(4.5%)) provide the second largest component of total electricity end use totalling 20.1%.
Figure 4-13: Nonferrous Metals Sector Electricity End Use (Source: Eskom IDM)
Process Heating 25.81%
Industrial Cooling 8.65%
HVAC 0.67%
Pumps 8.26%
Material Handling 4.32%
Other Process Use
18.45%
Lighting 10.47%
Water Heating 0.10%
Compressors 6.73%
Other Electrical
Equipment 16.53%
Nonferrous Metals Sector Energy End Use
Process Heating 22.80%
Industrial Cooling 9.00%
HVAC 0.70%
Irrigation (Pumps) 8.60%
Material Handling 4.50%
Other Process Use 19.20%
Lighting 10.90%
Water Heating 0.10%
Compressors 7.00%
Other Electrical Equipment
17.20%
Nonferrous Metals Sector Electricity End Use
28
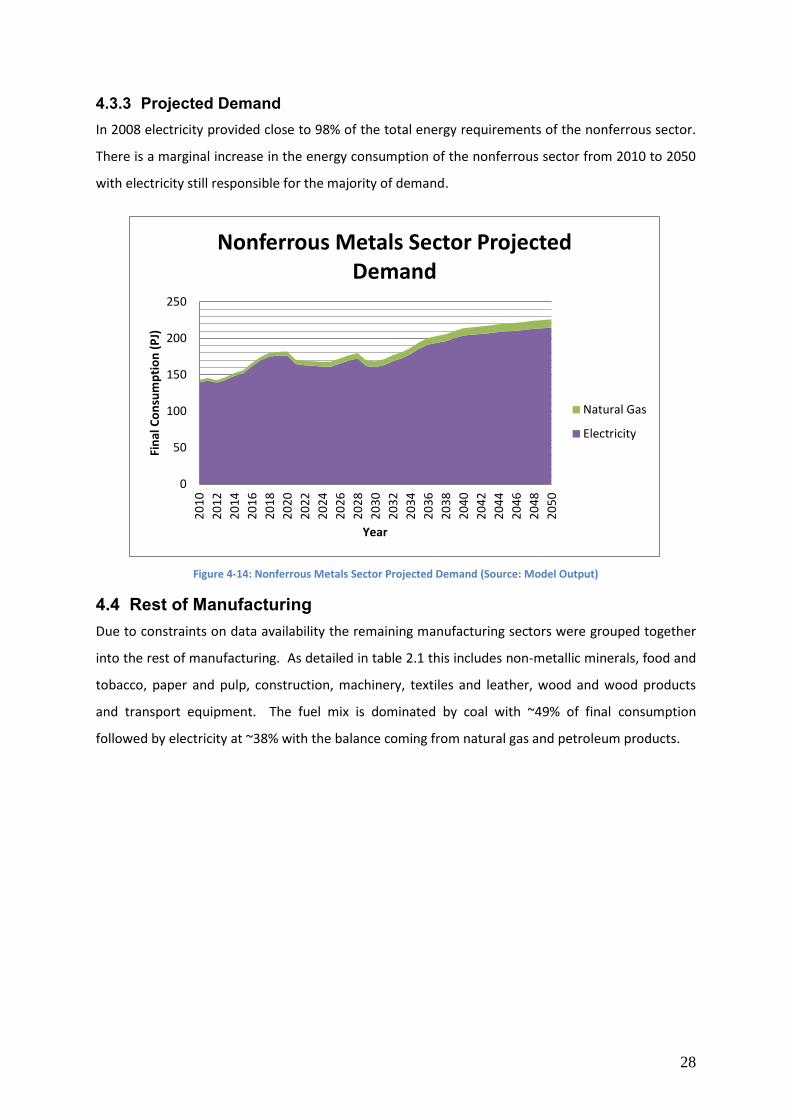
4.3.3 Projected Demand In 2008 electricity provided close to 98% of the total energy requirements of the nonferrous sector.
There is a marginal increase in the energy consumption of the nonferrous sector from 2010 to 2050
with electricity still responsible for the majority of demand.
Figure 4-14: Nonferrous Metals Sector Projected Demand (Source: Model Output)
4.4 Rest of Manufacturing Due to constraints on data availability the remaining manufacturing sectors were grouped together
into the rest of manufacturing. As detailed in table 2.1 this includes non-metallic minerals, food and
tobacco, paper and pulp, construction, machinery, textiles and leather, wood and wood products
and transport equipment. The fuel mix is dominated by coal with ~49% of final consumption
followed by electricity at ~38% with the balance coming from natural gas and petroleum products.
0
50
100
150
200
250
20
10
20
12
20
14
20
16
20
18
20
20
20
22
20
24
20
26
20
28
20
30
20
32
20
34
20
36
20
38
20
40
20
42
20
44
20
46
20
48
20
50
Fin
al C
on
sum
pti
on
(P
J)
Year
Nonferrous Metals Sector Projected Demand
Natural Gas
Electricity

29
Figure 4-15: Rest of Manufacturing Energy Use (Source: DoE, 2009)
Coal 49.31%
Electricity 38.09%
Natural Gas 3.57%
Petroleum Products
9.02%
Rest of Manufacturing Energy Use

30
4.4.1 Energy End Use The energy end use breakdown is indicative of averages across many sectors which combine both
energy intensive subsectors such as non-metallic minerals with less intensive sectors such as textiles
and leather. The majority of energy end use in the rest of manufacturing sector goes toward process
heating. For instance the production of cement clinker from limestone and chalk is the main energy
consuming process in the cement industry which is a subsector of non-metallic minerals. Fuels are
burned to produce intense heat at levels of 15000C to transform raw feedstock into clinker. Other
non-metallic mineral subsectors use process heating for instance when sand, limestone and other
ingredients are melted together in a furnace to create molten glass which is then formed into a final
product.
Figure 4-16: Rest of Manufacturing Energy End Use (Source: DoE Analysis)
4.4.2 Electricity End Use As illustrated in Figure 4-17 the use of electricity in the rest of manufacturing is very diverse with the
majority going towards process heating. Industrial cooling is important in the food and tobacco
industry where food needs to be stored at optimal temperatures before being used further
downstream in the services sector. Unlike the iron and steel, nonferrous metals and chemical sector
lighting, HVAC and other electrical equipment feature more strongly with lighting encompassing 10%
of electricity demand, HVAC just over 2% and other electrical equipment just over 1%.
Process Heating 76.16%
Industrial Cooling 2.12% HVAC
0.92%
Pumps 4.97%
Material Handling 1.58%
Other Process Use 5.55%
Lighting 3.85%
Compressors 4.28%
Other Electrical Equipment
0.58%
Rest of Manufacturing Energy End Use
31
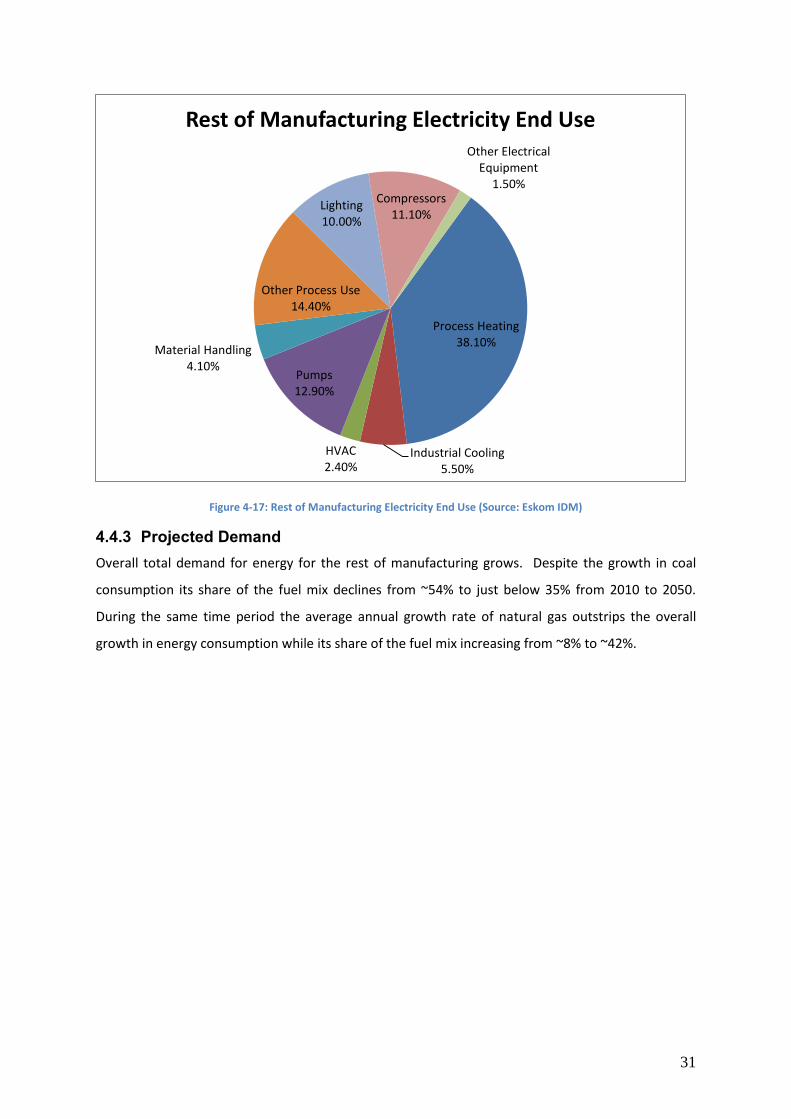
Figure 4-17: Rest of Manufacturing Electricity End Use (Source: Eskom IDM)
4.4.3 Projected Demand Overall total demand for energy for the rest of manufacturing grows. Despite the growth in coal
consumption its share of the fuel mix declines from ~54% to just below 35% from 2010 to 2050.
During the same time period the average annual growth rate of natural gas outstrips the overall
growth in energy consumption while its share of the fuel mix increasing from ~8% to ~42%.
Process Heating 38.10%
Industrial Cooling 5.50%
HVAC 2.40%
Pumps 12.90%
Material Handling 4.10%
Other Process Use 14.40%
Lighting 10.00%
Compressors 11.10%
Other Electrical Equipment
1.50%
Rest of Manufacturing Electricity End Use
32
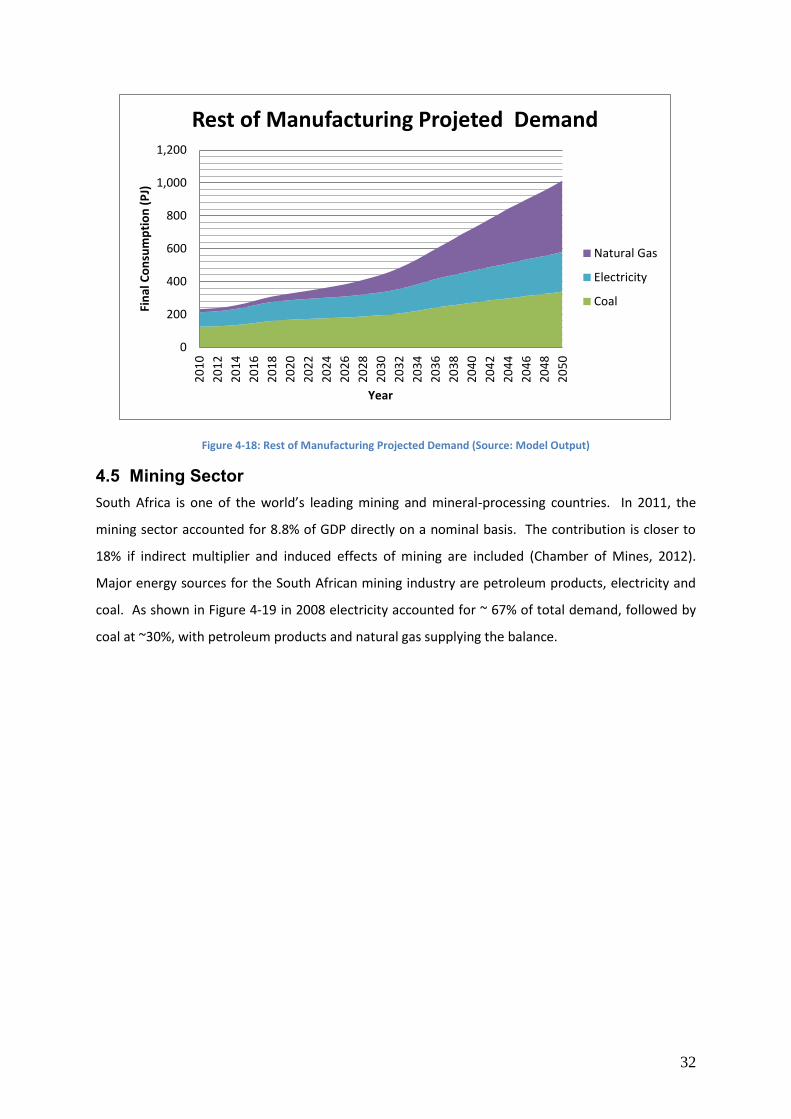
Figure 4-18: Rest of Manufacturing Projected Demand (Source: Model Output)
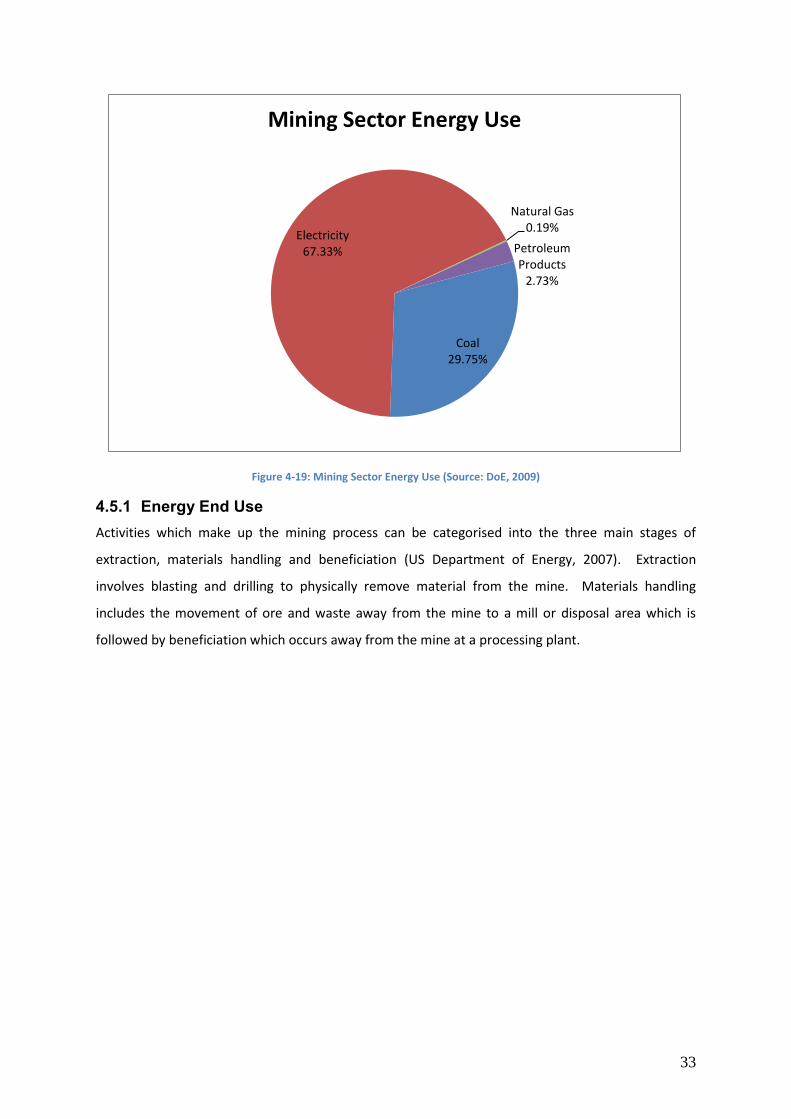
4.5 Mining Sector South Africa is one of the world’s leading mining and mineral-processing countries. In 2011, the
mining sector accounted for 8.8% of GDP directly on a nominal basis. The contribution is closer to
18% if indirect multiplier and induced effects of mining are included (Chamber of Mines, 2012).
Major energy sources for the South African mining industry are petroleum products, electricity and
coal. As shown in Figure 4-19 in 2008 electricity accounted for ~ 67% of total demand, followed by
coal at ~30%, with petroleum products and natural gas supplying the balance.
0
200
400
600
800
1,000
1,200
20
10
20
12
20
14
20
16
20
18
20
20
20
22
20
24
20
26
20
28
20
30
20
32
20
34
20
36
20
38
20
40
20
42
20
44
20
46
20
48
20
50
Fin
al C
on
sum
pti
on
(P
J)
Year
Rest of Manufacturing Projeted Demand
Natural Gas
Electricity
Coal
33
Figure 4-19: Mining Sector Energy Use (Source: DoE, 2009)
4.5.1 Energy End Use Activities which make up the mining process can be categorised into the three main stages of
extraction, materials handling and beneficiation (US Department of Energy, 2007). Extraction
involves blasting and drilling to physically remove material from the mine. Materials handling
includes the movement of ore and waste away from the mine to a mill or disposal area which is
followed by beneficiation which occurs away from the mine at a processing plant.
Coal 29.75%
Electricity 67.33%
Natural Gas 0.19%
Petroleum Products
2.73%
Mining Sector Energy Use

34
Figure 4-20: Mining Sector Energy End Use (Source: DoE Analysis)
In the first stage energy is used in drilling, digging, ventilation and dewatering. As shown in Figure
4-20 drills which use electricity indirectly from compressed air represent 10.73% of total energy use.
Deep mine cooling and ventilation which is a process for bringing fresh air to the underground mines
while removing stale or contaminated air as well as cooling work areas in deep underground mines
accounts for 8.82%. Pumps at 9.23% are critical to de-watering deep underground mines as well as
to pump water into flotation tanks in platinum processing and coal washing facilities.
Material handling accounts for 25.65% of total energy end use and encompasses both diesel and
electric equipment. In general, diesel fuel is used by rubber tire or track vehicles that deliver
material in batches while electricity powers continuous delivery systems such as conveyor belts or
slurry lines.
Other process use which accounts for 12.85% of total energy end use occurs within the third stage of
beneficiation. Activities such as crushing, grinding and separations, while processing operations
include roasting, smelting and refining to produce the final mined product.
Within the industrial and mining sector water heating is defined as water heated for use in
institutional living quarters which is defined as space provided by a business or organisation for long-
term housing of individuals whose reason for shared residence is their association. In comparison to
the previous industrial sectors analysed above where the share of water heating was negligible (Iron
Process Heating 22.19%
Deep Mine Cooling 8.82%
HVAC 0.13%
Pumps 9.23%
Material Handling 29.47%
Other Process
Use 12.85%
Lighting 3.04%
Water Heating 2.60%
Compressors 10.73%
Other Electrical Equipment
0.94%
Mining Sector Energy End Use

35
and Steel (0.03%), Chemicals (0.01%), Nonferrous Metals (0.10%)) water heating within mining
comprises 2.6% of the energy consumed. This is due to the fact that unlike the manufacturing sector
employees of mines may live onsite at the facility.
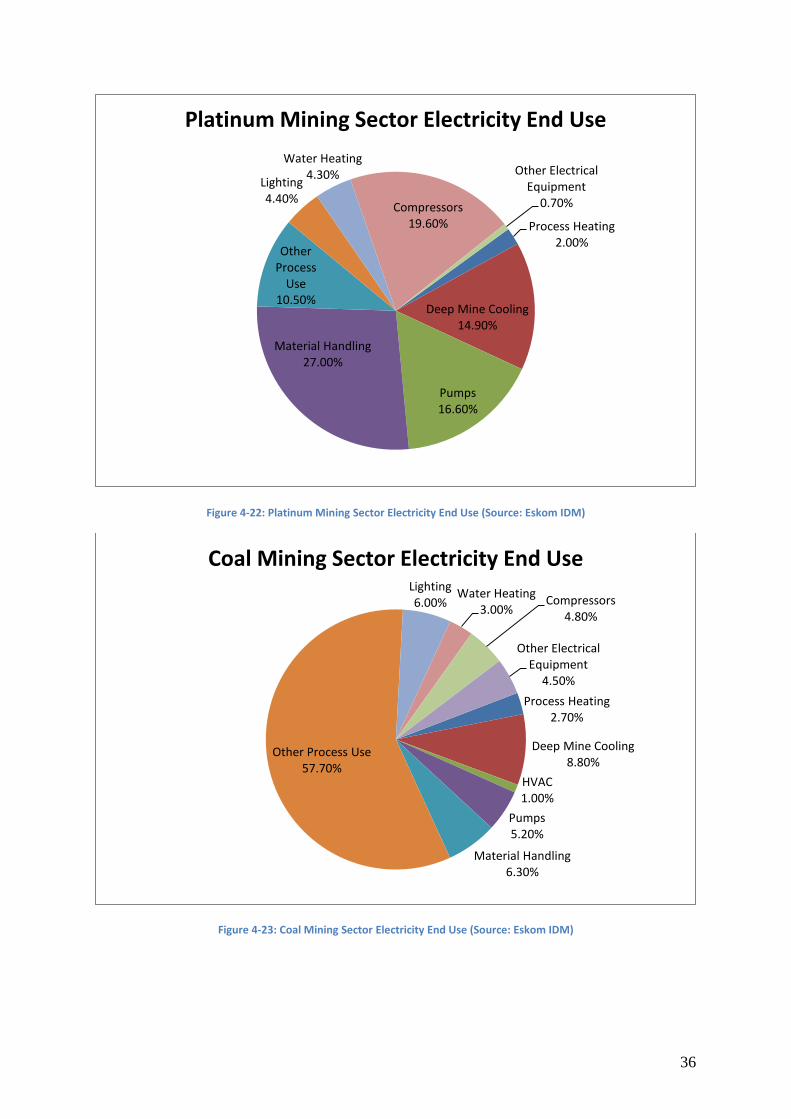
4.5.2 Electricity End Use The extraction of precious metals or minerals involves either surface or underground mining.
Factors which impact upon the method chosen are the nature and location of the deposit, the size,
depth and grade of the deposit (US Department of Energy, 2007). Underground mining is used when
mineralisation is deep beneath the surface and/or when ore grade or quality is sufficient to justify
more targeted mining. About 46.5 % of the country’s coal mining is underground and 53.5 % is
produced from open-cast mining methods (GCIS, 2008). 95% of South Africa’s gold mines are
underground operations reaching depths of over 3.8 km (Mbendi, 2013). Underground mining is
more energy intensive than surface mining due to the extra requirement for materials handling,
deep mining cooling and water pumping. When comparing the percentage share of electricity used
in gold and platinum mining for deep mine cooling and ventilation against coal and the rest of
mining, 14.9% of electricity in gold and platinum goes towards deep mine cooling while only 8.8% of
electricity goes towards the same end use in coal and the rest of mining.
Figure 4-21: Gold Mining Sector Electricity End Use (Source: Eskom IDM)
Process Heating 2.00%
Deep Mine Cooling 14.90%
Pumps 16.60%
Material Handling 27.00%
Other Process Use 10.50%
Lighting 4.40%
Water Heating 4.30%
Compressors 19.60%
Other Electrical Equipment
0.70%
Gold Mining Sector Electricity End Use
36
Figure 4-22: Platinum Mining Sector Electricity End Use (Source: Eskom IDM)
Figure 4-23: Coal Mining Sector Electricity End Use (Source: Eskom IDM)
Process Heating 2.00%
Deep Mine Cooling 14.90%
Pumps 16.60%
Material Handling 27.00%
Other Process
Use 10.50%
Lighting 4.40%
Water Heating 4.30%
Compressors 19.60%
Other Electrical Equipment
0.70%
Platinum Mining Sector Electricity End Use
Process Heating 2.70%
Deep Mine Cooling 8.80%
HVAC 1.00%
Pumps 5.20%
Material Handling 6.30%
Other Process Use 57.70%
Lighting 6.00%
Water Heating 3.00%
Compressors 4.80%
Other Electrical Equipment
4.50%
Coal Mining Sector Electricity End Use

37
Figure 4-24: Rest of Mining Sector Electricity End Use (Source: Eskom IDM)
Process Heating 2.70%
Deep Mine Cooling 8.80%
HVAC 1.00%
Pumps 5.20%
Material Handling 6.30%
Other Process Use 57.70%
Lighting 6.00%
Water Heating 3.00%
Compressors 4.80%
Other Electrical Equipment
4.50%
Rest of Mining Sector Electricity End Use

38
4.5.3 Projected Demand Energy requirements vary considerably for each commodity and depend upon the type of ore being
mined, whether it is underground or surface, whether it is beneficiated or processed, and the extent
to which it must be beneficiated or processed. For example, energy requirements in underground
gold mining are significantly on a per-ton basis than underground coal mining where the resource
can be obtained in larger quantities. From 2010 to 2018 the energy consumption in the mining
sector grows steeply but post 2018 growth in energy consumption stagnates.
Figure 4-25: Mining Sector Projected Demand (Source: Model Output)
Electricity continues to dominate the fuel mix being responsible for the majority of energy use within
the mining sector up to 2050. With regards to electricity gold mining’s share of total electricity
declines while electricity consumption in platinum mining fills in the gap.
0
50
100
150
200
250
300
20
10
20
12
20
14
20
16
20
18
20
20
20
22
20
24
20
26
20
28
20
30
20
32
20
34
20
36
20
38
20
40
20
42
20
44
20
46
20
48
20
50
Fin
al C
on
sum
pti
on
(P
J)
Year
Mining Sector Projected Demand
Electricity
Diesel
Coal
39
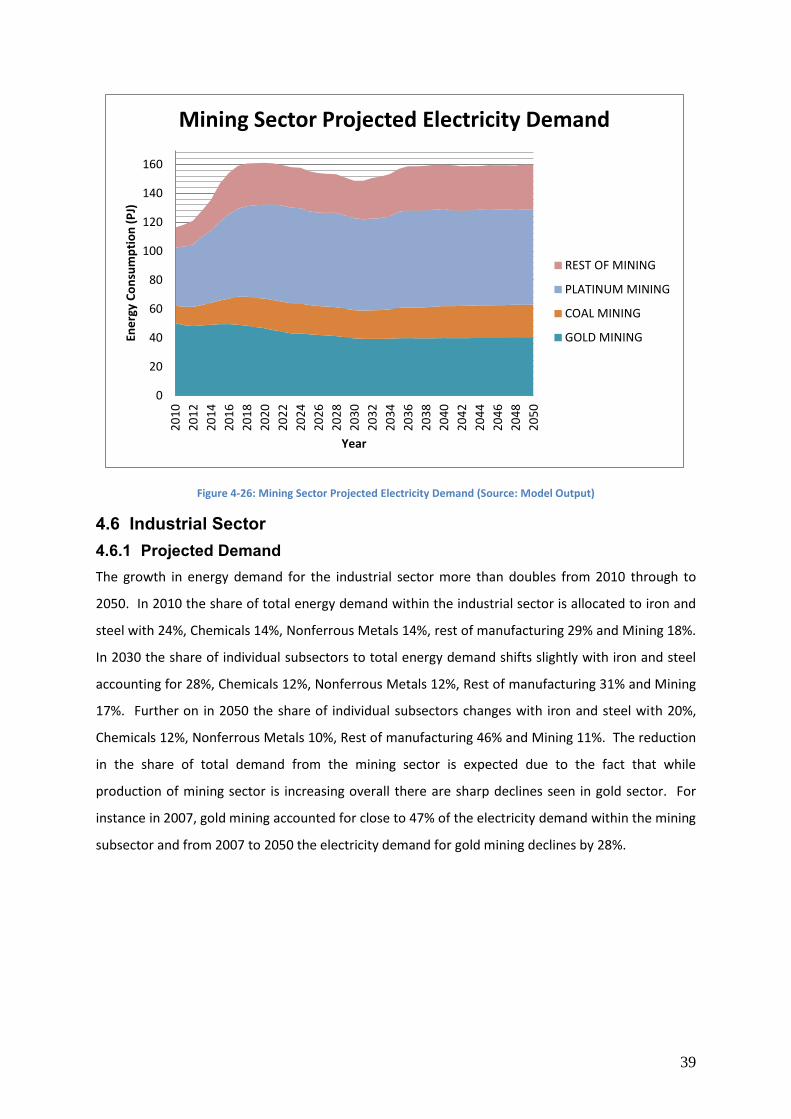
Figure 4-26: Mining Sector Projected Electricity Demand (Source: Model Output)
4.6 Industrial Sector 4.6.1 Projected Demand The growth in energy demand for the industrial sector more than doubles from 2010 through to
2050. In 2010 the share of total energy demand within the industrial sector is allocated to iron and
steel with 24%, Chemicals 14%, Nonferrous Metals 14%, rest of manufacturing 29% and Mining 18%.
In 2030 the share of individual subsectors to total energy demand shifts slightly with iron and steel
accounting for 28%, Chemicals 12%, Nonferrous Metals 12%, Rest of manufacturing 31% and Mining
17%. Further on in 2050 the share of individual subsectors changes with iron and steel with 20%,
Chemicals 12%, Nonferrous Metals 10%, Rest of manufacturing 46% and Mining 11%. The reduction
in the share of total demand from the mining sector is expected due to the fact that while
production of mining sector is increasing overall there are sharp declines seen in gold sector. For
instance in 2007, gold mining accounted for close to 47% of the electricity demand within the mining
subsector and from 2007 to 2050 the electricity demand for gold mining declines by 28%.
0
20
40
60
80
100
120
140
1602
01
0
20
12
20
14
20
16
20
18
20
20
20
22
20
24
20
26
20
28
20
30
20
32
20
34
20
36
20
38
20
40
20
42
20
44
20
46
20
48
20
50
Ene
rgy
Co
nsu
mp
tio
n (
PJ)
Year
Mining Sector Projected Electricity Demand
REST OF MINING
PLATINUM MINING
COAL MINING
GOLD MINING
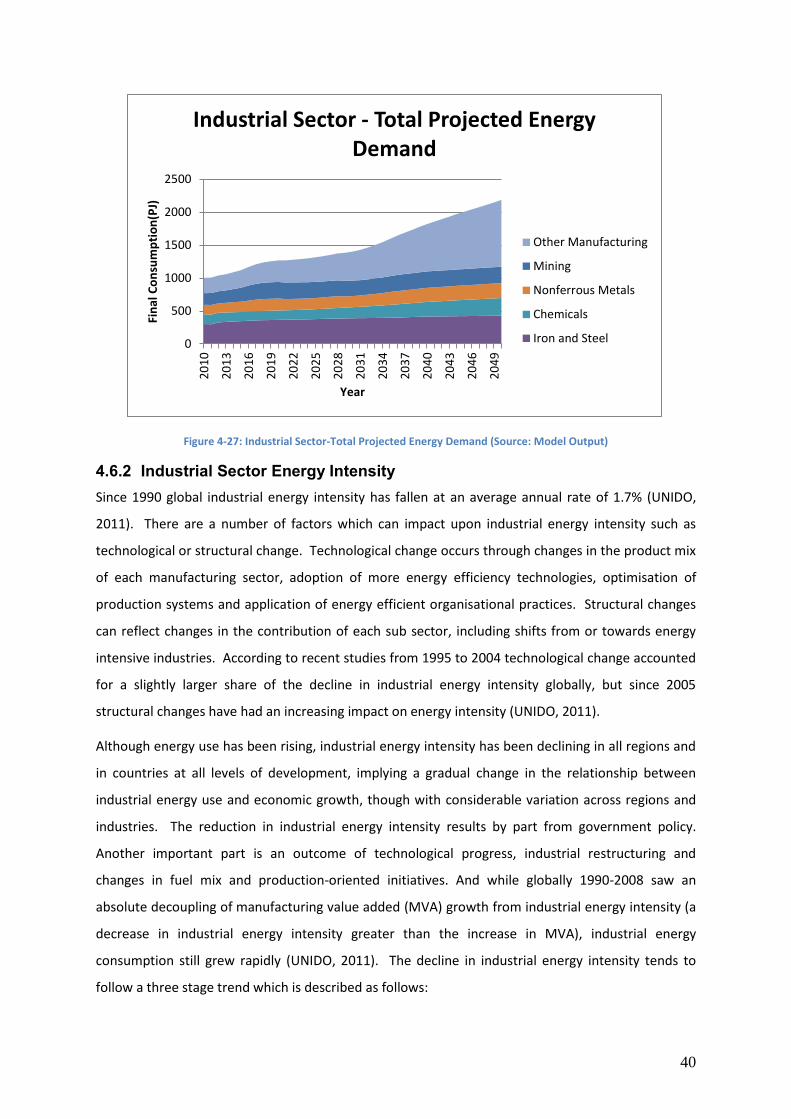
40
Figure 4-27: Industrial Sector-Total Projected Energy Demand (Source: Model Output)
4.6.2 Industrial Sector Energy Intensity Since 1990 global industrial energy intensity has fallen at an average annual rate of 1.7% (UNIDO,
2011). There are a number of factors which can impact upon industrial energy intensity such as
technological or structural change. Technological change occurs through changes in the product mix
of each manufacturing sector, adoption of more energy efficiency technologies, optimisation of
production systems and application of energy efficient organisational practices. Structural changes
can reflect changes in the contribution of each sub sector, including shifts from or towards energy
intensive industries. According to recent studies from 1995 to 2004 technological change accounted
for a slightly larger share of the decline in industrial energy intensity globally, but since 2005
structural changes have had an increasing impact on energy intensity (UNIDO, 2011).
Although energy use has been rising, industrial energy intensity has been declining in all regions and
in countries at all levels of development, implying a gradual change in the relationship between
industrial energy use and economic growth, though with considerable variation across regions and
industries. The reduction in industrial energy intensity results by part from government policy.
Another important part is an outcome of technological progress, industrial restructuring and
changes in fuel mix and production-oriented initiatives. And while globally 1990-2008 saw an
absolute decoupling of manufacturing value added (MVA) growth from industrial energy intensity (a
decrease in industrial energy intensity greater than the increase in MVA), industrial energy
consumption still grew rapidly (UNIDO, 2011). The decline in industrial energy intensity tends to
follow a three stage trend which is described as follows:
0
500
1000
1500
2000
2500
20
10
20
13
20
16
20
19
20
22
20
25
20
28
20
31
20
34
20
37
20
40
20
43
20
46
20
49
Fin
al C
on
sum
pti
on
(PJ)
Year
Industrial Sector - Total Projected Energy Demand
Other Manufacturing
Mining
Nonferrous Metals
Chemicals
Iron and Steel

41
Total industrial energy intensity tends to be high at early and intermediate stages of
industrialisation, when energy intensive materials processing industries dominated,
technical energy efficiency is poor and low quality fuels (such as coal) predominate.
Industrial energy intensity decreases at later stages or industrialisation, as the structure of
industry shifts from energy-intensive raw material processing to less energy-intensive
processes from “brown” process industries to greener industries- and technical energy
efficiency and the quality of the fuel mix improve.
Industrial energy intensity declines substantially at the most advanced stages of
industrialisation, with further technological improvements, structural change, production
shifts towards more skill-intensive industries and increasing use of high quality fuels (gas and
electricity).
There is considerable regional variation in energy intensity for the industrial sector. For example,
industry uses on average 4.7 times more energy to produce a unit of MVA in developing Europe than
in Latin America and the Caribbean (UNIDO, 2011). This is due mostly to the vintage of industrial
facilities. There have been continual improvements in nearly every aspect of industrial activities, so
countries with newer industries tend to have newer, more efficient facilities (IEA, 2007). Many non-
OECD European countries have inherited inefficient, coal based, energy intensive industries that
operate at a small fraction of their output capacity.
Of the ~22% decline in global industrial energy intensity over 1995-2008, 56% was due to changes in
industrial structure. A study by the United Nations Industrial Development Organization (UNIDO,
2011) found that there had been a major reduction in the share of energy –intensive process sectors
in global manufacturing value added and a large increase in the share of the machinery sector (from
plant equipment to consumer electronics and electrical appliances) - from around 29% in 1995 to
44% in 2008 (UNIDO, 2011). It has been further found that changes in demand patterns as
standards of living improve account for much of the shift in the structure of industry. Long term
studies show that as disposable income grows, so does the demand for certain products. At lower
incomes, demand is greatest for basic infrastructure- housing, roads and other services. This
requires energy-intensive inputs like steel rods, aluminium castings, and copper lead wires. As
incomes grow, people want higher quality products, a wider choice of goods and new products that
upgrade an existing service (e.g. electronic reader in place of a book) (Schafer 2005 in UNIDO 2011).
The manufacturing sector energy intensity was calculated by dividing the energy consumption of
manufacturing subsectors of iron and steel, nonferrous metals, chemicals and rest of manufacturing

42
by the gross value added of the manufacturing sector. The specific energy intensity of the
manufacturing sector declines from 2010 to 2050.
Figure 4-28: Manufacturing Sector Energy Intensity (Source: DoE Analysis)
The specific energy intensity of the mining was calculated by dividing the total energy consumption
of the mining sector by the mining index. The decline in specific energy intensity in the mining sector
is due to the decline in electricity used in gold mining. Electricity dominates energy use within the
mining sector and the share of electricity used for gold mining declines markedly over from 2010 to
2050.
-
0.50
1.00
1.50
2.00
2.50
3.00
3.50
20
10
20
12
20
14
20
16
20
18
20
20
20
22
20
24
20
26
20
28
20
30
20
32
20
34
20
36
20
38
20
40
20
42
20
44
20
46
20
48
20
50
PJ/
R
Year
Manufacturing Sector Energy Intensity
Manufacturing

43
Figure 4-29: Mining Sector Energy Intensity (Source: DoE Analysis)
4.6.3 Energy Efficiency Opportunities in the Industrial Sector Cutting edge technologies for industrial energy efficiency can reduce the widespread environmental
impact of industrial energy use. These include cross cutting and industry wide technologies (such as
cogeneration, energy recovery and efficient motors and steam systems), inter-industry opportunities
(such as water heat or by-products by other industries), and process specific technologies. Further
on industrial energy intensity can be reduced through technological progress and system changes
that improve technical energy efficiency- changes that increase output using the same amount of
energy or that deliver the same output using less energy. These changes include replacing old
technologies, adopting energy-saving technologies (preferably best available technologies),
improving processes and optimising systems, and employing energy management practices. They
also include using more high-quality energy such as gas and electricity; innovative product designs;
and changing the output mix. These improvements, especially those related to new technologies
and processes, vary in complexity-from simple add-ons to complex system change.
-
0.50
1.00
1.50
2.00
2.50
20
10
20
12
20
14
20
16
20
18
20
20
20
22
20
24
20
26
20
28
20
30
20
32
20
34
20
36
20
38
20
40
20
42
20
44
20
46
20
48
20
50
PJ/
min
ing
ind
ex)
Year
Mining Sector Energy Intensity
Mining

44
Figure 4-30: Industrial Sector Energy End Use (Source: DoE Analysis)
As show in Figure 4-30 the majority of energy used within the industrial sector is for process heating.
In energy intensive industrial sub sectors such as iron and steel and chemicals process heating
comprises 90% and 88% respectively. The use of energy for motor driven systems which are
accounted for under pumps, compressors and material handling contribute the second largest share
of total energy use at 14.73%. Industrial cooling which is designated as deep mine cooling within the
mining subsector is the third largest share. In the mining subsector deep mine cooling and
ventilation is used for bringing fresh air to the underground mines while removing stale or
contaminated air. Other process use has been used in cases in which the exact end use is not well
defined and cannot be attributed to a specific purpose.
While the use of fossils fuels within the industrial sector is primarily used for process heating the end
use of electricity for individual end use is very diverse. In the table 4.6.1 a breakdown of electricity
end use within the industrial sector is outlined.
Process Heating 66.27%
Industrial Cooling (Deep Mine Cooling
within Mining Subsector)
3.38% HVAC 0.51%
Pumps 4.13%
Material Handling 6.51%
Other Process Use 9.76%
Lighting 3.17%
Water Heating 0.50% Compressors
4.09% Other Electrical
Equipment 1.68%
Industrial Sector Energy End Use

45
Table 4.6.1: Electricity End Use: Industry
End Use Chemicals Iron and
Steel
Non-ferrous Metals
Other Manufac
turing Gold
Mining Coal
Mining Platinum Mining
Other Mining
Process Heating 4% 60% 23% 38% 2% 3% 2% 3%
Industrial Cooling/Deep Mine Cooling 8% 5% 9% 6% 15% 9% 15% 9%
HVAC 1% 1% 1% 2% 0% 1% 0% 1%
Pumps 26% 3% 9% 13% 17% 5% 17% 5%
Material Handling 15% 4% 5% 4% 27% 6% 27% 6%
Other Process Use 21% 21% 19% 14% 11% 58% 11% 58%
Lighting 4% 4% 11% 10% 4% 6% 4% 6%
Water Heating 0% 0% 0% 0% 4% 3% 4% 3%
Compressors 20% 4% 7% 11% 20% 5% 20% 5%
Other Electrical Equipment 1% 0% 17% 2% 1% 5% 1% 5%
Total 100% 100% 100% 100% 100% 100% 100% 100%
Source: Eskom IDM
Most notable is that outside the use of electricity for process heating in iron and steel (59.5%) the
majority of electricity end use within the individual manufacturing sectors goes towards motor
systems (compressors, material handling, pumps). Within the manufacturing subsectors, the
chemical sector ranks first with 61% of total electricity end use going towards motor systems,
followed by nonferrous at 37.3% and rest of manufacturing at 29.6%. Worldwide motor-driven
equipment accounts for approximately 60% of manufacturing final electricity use (UNIDO, 2010).
Despite the fact that improvements in the use of motor systems within industry can contribute to
substantial reductions in electricity consumption this potential is largely unrealised (IEA 2007).
A system is a set of connected unit operations or pieces of equipment that perform a service
together. There is growing evidence that systems optimisation and systems solutions hold the
greatest potential for energy efficiency gains (UNIDO, 2010). Globally, the energy consuming
systems with the highest potential energy savings are motors, compressor and steam systems.
Motor systems, consisting of drives, pumps and fans, are a largely untapped, cost-effective source of
industrial energy efficiency savings that could be realised with existing technologies.
Lastly most industrial energy efficiency improvements achieved are by changing how energy is
managed rather than by installing new technologies. Energy management systems include the
technical systems, management programmes and trained staff needed to conduct energy audits,
gather energy data, maintain sub-metering systems, analyse and compare consumption data to

46
trends and benchmarks, correct for influencing factors (IEA, 2012a). Governments can encourage
companies to establish an energy management system by providing information on best practices,
issuing standards, providing training in compliance and recognising or certifying firms that meet the
standards.

47
5. Residential Demand Projections Access to energy services using cleaner forms of energy has been identified as critical to both social
and economic development such that increased access to energy services has been identified as
essential to achieving all of the Millennium Development Goals (Modi et al., 2006). For instance
cooking with firewood and dung is associated with a significantly higher disease burden than
modern energy carriers, due to indoor pollution. Using modern forms of energy such as LPGas for
cooking lowers smoke exposure thus reducing the disease burden from smoke, lowering child
mortality rates, and improving maternal health. In other circumstances access to electricity for
lighting can enhance a student’s ability to study after hours with proper illumination thus improving
education levels. In 2008 household energy use was split between electricity, coal, petroleum
products and biomass with the majority coming from biomass.
Figure 5-1: Residential Sector Energy Use (Source: DoE, 2009)
5.1 Energy Ladder and Multiple Fuel Use An energy ladder shows the improvement of energy use corresponding to an increase in household
income. The assumption is that as income increases, the energy sources used to meet household
energy needs would be cleaner and more efficient, but more expensive. Socioeconomic status
largely influences the extent of multiple fuel use. Indigent households are more likely to use wood
and coal for thermal household tasks and accompany these fuels with paraffin for lighting. Slightly
higher on the energy ladder are households who use paraffin for cooking and heating and use
COAL 28%
ELECTRICITY 20%
ILLUMINATING PARRAFIN
2%
BIOMASS 49%
LPG 1%
RESIDENTIAL SECTOR ENERGY USE

48
electricity for lighting purposes. Highest on the ladder are households who use electricity exclusively
as their main energy source (Masera et. al 2000).
5.1.1 Multiple Fuel Use Cooking Climbing up the energy ladder tends to occur gradually as most low income households use a
combination of fuels to meet their cooking needs. In Figure 5-2 below the overlaps are shown in
detail for very low income, low income, middle income and high income households.
Figure 5-2: Energy Ladder for Cooking (Source: World Health Organization, 2006)
The United Nations Development Programme (UNDP) explicitly defines energy poverty as the
“inability to cook with modern cooking fuels and the lack of a bare minimum of electric lighting to
read or for other households and productive activities at sunset” (Gaye, 2007). In 2011, 52% of
South African households reported the use of one fuel for cooking and of the households that
reported the use of one fuel 42% used electricity only (Department of Energy, 2012a). Thus at a
national level 48% of all households use multiple fuels to meet energy needs for cooking. There are
large discrepancies which exist with the socioeconomic status and location of a household having an
impact on the prevalence towards multiple fuel use. Low income households are more likely to use
multiple fuels for cooking with 59% of households within this category being affected.
49
5.1.2 Multiple Fuel Use Space Heating In 2011, 55% of South African households used one energy carrier to meet space heating needs with
27% using multiple fuels and 18% use no energy by relying on warm clothes and blankets. Electrified
households were most likely to depend solely on electricity with 38% relying on electricity while in
contrast 38% of non-electrified households rely solely on firewood (Department of Energy, 2012a).
5.1.3 Multiple Fuel Use Lighting One measure of energy poverty at the level of the poorest is lack of a bare minimum of electric
lighting to read or for other household and productive activities after dark. As outlined in the Free
Basic Electricity Policy indigent households are given 50kWh per month of electricity which support
basic lighting and cooking as well as minimal use of radio and television. Multiple fuel use for
lighting still persists in South Africa with 46% of households reporting single use of an energy carrier;
Out of the households which use one energy source for lighting 40% report electricity as the sole
carrier followed by candles at 5% and illuminating paraffin at 1% (Department of Energy, 2012a).
With regards to households which use multiple fuels 29% of electrified households use electricity
and candles due to interruption of service caused by technical reasons or cut off for reasons such as
prepaid vouchers running out or non-payment.
5.2 Household Trends in Biomass Use Biomass usage in South Africa is primarily for thermal purposes such as space heating, water heating
and cooking. Trends in biomass usage vary substantially by location with more than 74% of rural
households in South Africa indicating recent use of biomass versus 17% of urban informal and 11%
of urban formal households (Department of Energy, 2012a). At the provincial level 70% of
households in Limpopo have recently reported the use of firewood whereas only 8% and 14% of
households in Gauteng and Western Cape respectively have recently used firewood (Department of
Energy, 2012a). An analysis of time series data from the Census 1996, 2001 and 2011 show a steady
decline in the percentage of households that use wood for cooking by at least a half. With regards
to space heating from 1996 to 2001 there was a sharp decrease in the percentage of households
using wood for space heating but the percentage of households using wood for space heating has
shown a slower decline between the 2001 and 2011 Census from approximately 6% to 2%.

50
Figure 5-3: Trends in Household Use of Wood for Energy Services (Source: Statistics South Africa, 1998, 2003, 2007, 2012a)
5.3 Household Trends in Coal Use Only 7% of households in South Africa reported the use of coal in 2011 (Department of Energy,
2012a). While the percentage of households that use coal across most provinces is close to the
national average there is a notable difference in Mpumalanga which features 26% of households
within the province using coal to meet energy needs (Department of Energy, 2012a). The
prevalence of coal use in Mpumalanga is as a result of the close proximity of town such as Ermelo,
Witbank and Secunda to major coal fields (Department of Energy, 2012a). As shown in Figure 5-4,
since 1996 there has been a steep decline in the use of coal for space heating but in 2011 a larger
percentage of households use coal for space heating than cooking.
0
5
10
15
20
25
30
Cooking Space Heating
Pe
rce
nta
ge o
f H
ou
seh
old
s
Energy Service
Trends in Household Use of Wood for Energy Services
Census 1996
Census 2001
CS 2007
Census 2011

51
Figure 5-4: Trends in Household Use of Coal for Energy Services (Source: Statistics South Africa, 1998, 2003, 2007, 2012a)
The inefficient burning of solid fuels on an open fire or coal stove creates a dangerous mix of
pollutants primarily carbon monoxide and small particles, but also many other health-damaging
chemicals. When coal is used, additional contaminants such as sulphur, arsenic and fluorine may
also be present in the air. As shown in Figure 5-4 the use of coal for cooking has declined in South
Africa from just over 3% of households to just below 1% of households between 1996 and 2011.
5.4 Household Trends in Illuminating Paraffin Use Illuminating paraffin is versatile and as such households use the fuel both for lighting and thermal
purposes with the largest share (38%) going towards cooking. Since 1996 the percentage of
households using illuminating paraffin for cooking, lighting and space heating has declined with the
greatest decline seen in households that use illuminating paraffin for cooking. The decline in
illuminating paraffin can be attributed to increased electrification rates as most households switch
from illuminating paraffin to electricity once electrified.
0
5
10
15
20
25
30
Cooking Space Heating
Pe
rce
nta
ge o
f H
ou
seh
old
s
Energy Service
Trends in Household Use of Coal for Energy Services
Census 1996
Census 2001
CS 2007
Census 2011

52
Figure 5-5: Trends in Household Use of Illuminating Paraffin for Energy Services (Source: Statistics South Africa, 1998, 2003, 2007, 2012a)
5.5 Household Trends in Electricity Use In contrast to illuminating paraffin, coal and biomass the percentage of households that use
electricity for space heating, cooking and lighting has increased from 1996 to 2011. The greatest
increase in electricity end usage has been for lighting with close to 85% of households using
electricity for lighting in the 2011 census compared to less than 60% in 1996. The increase in the
percentage of households that use electricity for space heating since 1996 to 2011 has been fairly
modest - this could be attributed to behavioural patterns identified in a recent study which shows
that 18% of households choose to forgo electricity or other energy carriers to keep warm and rely
mainly on blankets or warm clothing (Department of Energy, 2012a).
0
5
10
15
20
25
Cooking Lighting Space Heating
Pe
rce
nta
ge o
f H
ou
seh
old
s
Energy Service
Trends in Household Use of Illuminating Paraffin for Energy Services
Census 1996
Census 2001
CS 2007
Census 2011

53
Figure 5-6: Trends in Household Use of Electricity for Energy Services (Source: Statistics South Africa, 1998, 2003, 2007, 2012a)
The increase in the percentage of households that use electricity for various energy services is
directly impacted upon by the national electrification programme of Government which has ensured
that 85% of households in South Africa have access to electricity.
5.6 Projected Demand While historical trends in the use of biomass was expanded upon earlier in this section demand
projections for biomass were not conducted due to the lack of a consistent time series for biomass
consumption in South Africa. Trends which can be inferred from household energy usage statistics
from Statistics South Africa illustrated in Figure 5-3 show that the use of biomass by households
should continue to decrease into the future. The ability to effectively quantify the extent and rate
of decline should be informed by recent and relevant studies on biomass usage in the residential
sector which can be the focus of future research studies. Despite the decrease in the percentage of
households that depend on biomass to meet household energy needs, households that continue to
rely on biomass will face cumulative negative social and environmental consequences. Low income
households and rural households may continue to spend a large proportion of income on the
purchase of biomass or can devote up to a quarter of household labour collecting firewood, and will
then suffer the life-endangering pollution that results from inefficient combustion.
0
10
20
30
40
50
60
70
80
90
Cooking Lighting Space Heating
Pe
rce
tnag
e o
f To
tal H
ou
seh
old
s
Energy Service
Trends in Household Use of Electricity for Energy Services
Census 1996
Census 2001
CS 2007
Census 2011

54
As shown in Figure 5-7 below, the increase in energy demand is driven by an increase in the number
of households, higher ownership rates for existing energy consuming devices and increasing demand
for new types of energy services. The consumption of fossil fuels declines significantly with the
transition from coal and illuminating paraffin to more modern fuels of LPGas and electricity.
Historical trends in the decline in coal consumption in households continue as cleaner forms of
energy become available for space heating and cooking.
While the historical energy balances were used to inform the projections for most energy carriers a
recent study on energy consumption in South African households was used to derive the residential
coal consumption in the starting year of the demand projections. Before going into more detail it is
important to note that with regards to electricity, wood, illuminating paraffin and LPGas that
household consumption trends between 1999 and 2009 mirror those shown in Statistics South Africa
studies which were independently conducted. The only deviation between energy consumption
trends for the Department of Energy data (DoE, 2012b) and Statistics South Africa residential data
(Statistics South Africa 1998, Statistics South Africa 2003, Statistics South Africa 2007, Statistics
South Africa 2012a) was for coal. The percentage of households which use coal to provide the
demand for energy services has steadily declined from 1996 to 2011 while over the same period
there is an increase in coal consumption for the residential sector in the energy balances published
by the Department of Energy. Hence a different approach was taken to complete the projection for
coal consumption in the residential sector.
A recent study on energy related behaviour and perceptions in South Africa provided information on
household expenditure in coal for 2011 (DoE, 2012a). The residential coal consumption for 2011
was derived from household expenditure data for coal and the coal price for the domestics and
merchants category in published data for the Department of Mineral Resources. In line with trends
shown in Figure 5-4 an assumption was made that the coal consumption in the residential sector
would continue to decline into the future by 2% on an annual basis. Despite the fact that the use of
coal is known to have a negative impact on health, households will continue to use coal to meet
household’s energy needs due to the continuing convenience associated with living close to coal
fields as well as the prevalence of low income households to use multiple fuels to meet energy
service needs.

55
Figure 5-7: Residential Sector Projected Demand 2010-2050 (Source Model Output)
Overall the use of petroleum products increases from 2010 to 2050 but illuminating paraffin
decreases. Similar trends have been seen from 1996 to 2011 and are expected to continue given
that increases in the share of households with access to electricity will move away from the use of
illuminating paraffin for lighting to electricity. The use of LPGas in the residential sector increases
with its share of the final consumption energy mix (excluding biomass) moving from just above 6% to
just below 9%.
Energy poverty at the household level is defined as a household which is negatively affected by very
low consumption of energy, use of dirty or polluting fuels, and excessive time spent collecting fuel to
meet basic needs. It is inversely related to access to modern energy services, although improving
access is only one factor in efforts to reduce energy poverty. Given the proven success of
Government’s electrification programme as well as the firm commitment to continue efforts to
ensure universal access to cleaner forms of energy it is reasonable to expect that electricity demand
will continue to increase. Electricity’s share of the total energy mix (excluding biomass) grows from
approximately 60% to about 83% by 2050. The increase in electricity usage can also be attributed to
increased ownership of electrical appliances.
5.7 Residential Sector Energy Intensity The Human Development Index represents a combination of several indices and it is used by the
United Nations to rank countries according to human development. The HDI combines data for
0
50
100
150
200
250
300
350
400
450
500
20
10
20
12
20
14
20
16
20
18
20
20
20
22
20
24
20
26
20
28
20
30
20
32
20
34
20
36
20
38
20
40
20
42
20
44
20
46
20
48
20
50
Fin
al C
on
sum
pti
on
(P
J)
Year
Residential Sector Projected Demand
Electricity
LPG
Illuminating Paraffin
Coal
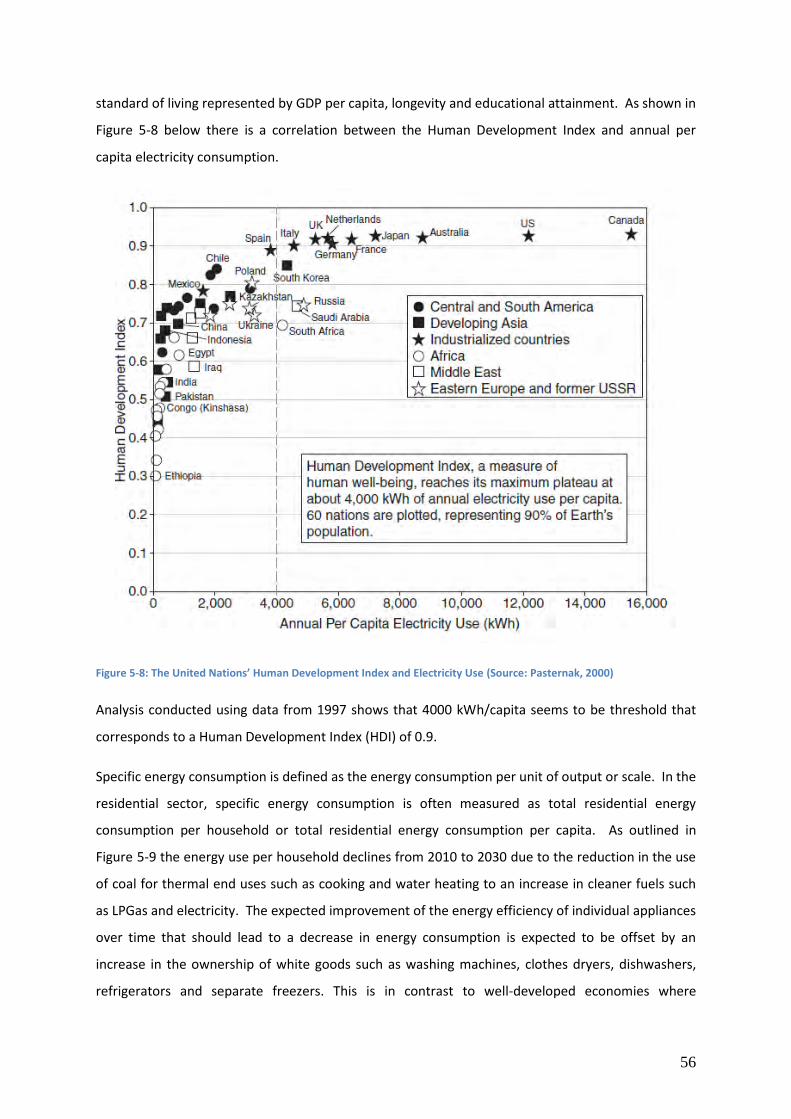
56
standard of living represented by GDP per capita, longevity and educational attainment. As shown in
Figure 5-8 below there is a correlation between the Human Development Index and annual per
capita electricity consumption.
Figure 5-8: The United Nations’ Human Development Index and Electricity Use (Source: Pasternak, 2000)
Analysis conducted using data from 1997 shows that 4000 kWh/capita seems to be threshold that
corresponds to a Human Development Index (HDI) of 0.9.
Specific energy consumption is defined as the energy consumption per unit of output or scale. In the
residential sector, specific energy consumption is often measured as total residential energy
consumption per household or total residential energy consumption per capita. As outlined in
Figure 5-9 the energy use per household declines from 2010 to 2030 due to the reduction in the use
of coal for thermal end uses such as cooking and water heating to an increase in cleaner fuels such
as LPGas and electricity. The expected improvement of the energy efficiency of individual appliances
over time that should lead to a decrease in energy consumption is expected to be offset by an
increase in the ownership of white goods such as washing machines, clothes dryers, dishwashers,
refrigerators and separate freezers. This is in contrast to well-developed economies where

57
household ownership of electrical appliances and white goods has reached an upper saturation level
and the improvement in energy efficiencies of electrical appliances is still expected to have a direct
and immediate impact on the energy use per household. Thus, the increase in energy use per
household post 2030 can be attributed to the increased ownership of household appliances that use
electricity and is as such a reasonable expectation in South Africa where the market penetration of
electrical appliances is not at the level of more developed economies.
Figure 5-9: Residential Sector Energy Intensity (Source: DoE Analysis)
The increase in energy intensity can also be attributed to the decline in the number of persons per
households. Similar trends have been seen in other countries where the increase in the energy
consumption per household is driven by a decline in the number of persons per household, as there
are some forms of fixed energy consumption that are associated with each household despite the
number of people that occupy the home.
5.8 Energy Efficiency Opportunities in the Residential Sector Energy efficiency is quoted as being the “hidden fuel” which provides a win-win situation for
reducing emissions while improving access to cleaner forms of energy. A recently released
publication by the IEA (IEA, 2013b) has identified four measures which can be implemented by
countries to reduce emissions in the short term without having a negative impact on economic
development. At the top of the list is the wider adoption of energy efficiency measures in industry,
0
5
10
15
20
25
20
10
20
12
20
14
20
16
20
18
20
20
20
22
20
24
20
26
20
28
20
30
20
32
20
34
20
36
20
38
20
40
20
42
20
44
20
46
20
48
20
50
Ene
rgy
Use
pe
r H
ou
seh
old
(P
J/h
ou
seh
old
)
Year
Residential Sector Energy Intensity
Residential
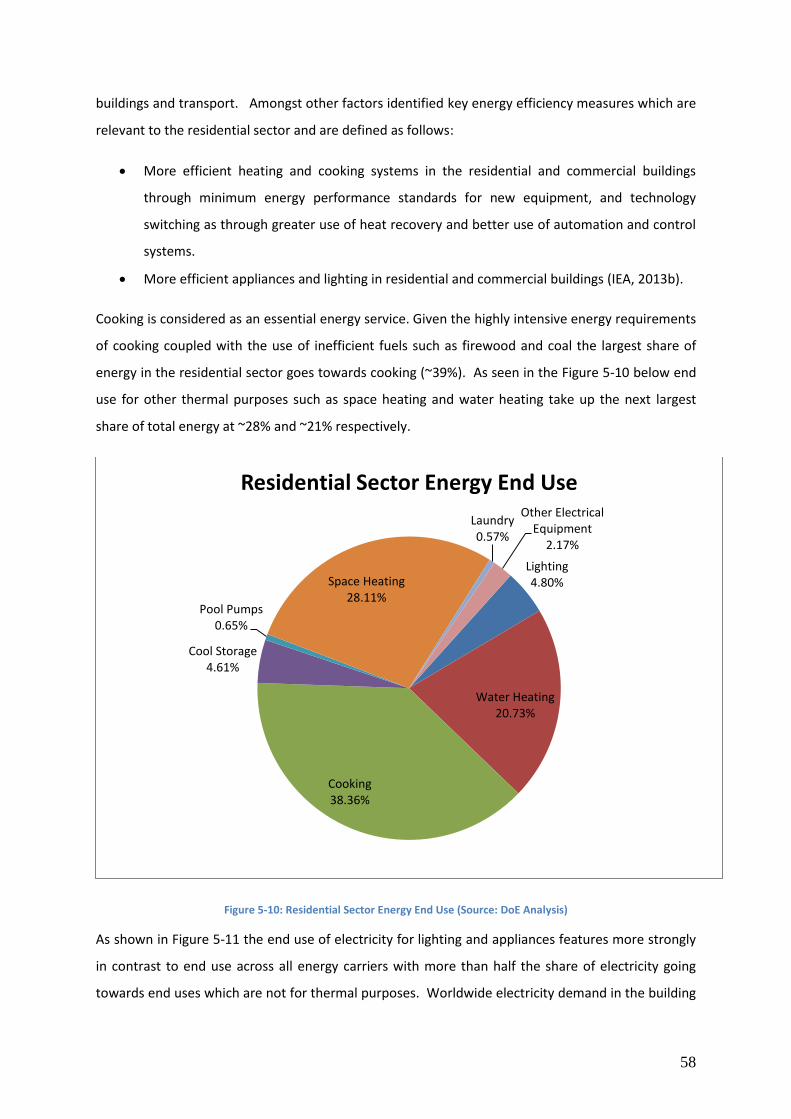
58
buildings and transport. Amongst other factors identified key energy efficiency measures which are
relevant to the residential sector and are defined as follows:
More efficient heating and cooking systems in the residential and commercial buildings
through minimum energy performance standards for new equipment, and technology
switching as through greater use of heat recovery and better use of automation and control
systems.
More efficient appliances and lighting in residential and commercial buildings (IEA, 2013b).
Cooking is considered as an essential energy service. Given the highly intensive energy requirements
of cooking coupled with the use of inefficient fuels such as firewood and coal the largest share of
energy in the residential sector goes towards cooking (~39%). As seen in the Figure 5-10 below end
use for other thermal purposes such as space heating and water heating take up the next largest
share of total energy at ~28% and ~21% respectively.
Figure 5-10: Residential Sector Energy End Use (Source: DoE Analysis)
As shown in Figure 5-11 the end use of electricity for lighting and appliances features more strongly
in contrast to end use across all energy carriers with more than half the share of electricity going
towards end uses which are not for thermal purposes. Worldwide electricity demand in the building
Lighting 4.80%
Water Heating 20.73%
Cooking 38.36%
Cool Storage 4.61%
Pool Pumps 0.65%
Space Heating 28.11%
Laundry 0.57%
Other Electrical Equipment
2.17%
Residential Sector Energy End Use

59
sector is dominated by lighting and appliances with 37% of electricity demand within the building
sector going towards lighting and appliances within OECD countries and 26% in non-OECD countries
(IEA, 2013a). Due to the relatively short lifespan of appliances and lighting minimum energy
performance standards can be effective to implement change relatively quickly and are used widely
in many countries. With regards to electricity consumption in the residential sector lighting
accounts for approximately 17% of household end use. As shown in Figure 5-11, white goods such
as stoves, refrigerator/freezers and laundry account for approximately 10%, 17% and 2%
respectively. The balance of non-thermal end use is made up of pool pumps and other electrical
appliances which include cell phones, computers, laptops and printers.
Figure 5-11: Residential Sector Electricity End Use (Source: Eskom IDM)
Government initiatives such as the 1 million solar water heater programme and more ambitious
targets of 5 million solar water heaters as outlined the Industrial Policy Action Plan will go a long way
to impacting upon the use of electricity in the residential sector given that the largest share of
electricity in the residential sector goes toward water heating at approximately 39%.
Lighting 16.80% Water Heating
38.90%
Cooking 9.80%
Cool Storage 17.00%
Pool Pumps 2.40% Space Heating
5.00%
Laundry 2.10%
Other Electrical Equipment
8.00%
Residential Sector Electricity End Use

60
6. Commercial Demand Projections The commercial sector comprises of the following economic sub-sectors: finance, real estate and
business services; general government services; personal services; storage and communication; and
wholesale, retail, motor trade and accommodation. The commercial sector therefore largely
comprises of the tertiary or services group of industries, but specifically excludes the transport
sector. In this analysis the commercial sector therefore describes all industries within the tertiary
sector excluding transportation of passengers and freight. The basis for the exclusion is that
transportation demand requires a separate and focused analysis for energy consumption. However
in describing the characteristics of the tertiary sector, transportation of goods and passengers are
implicitly included. The commercial sector is considerably more heterogeneous than residential
buildings, encompassing hospitals, schools, offices, houses of worship, lodging and the retail sector
with its big box stores, strip malls, fast food and sit down restaurants. Each of these commercial
sub-sectors is unique in its market structure, energy use, energy intensity and in the set of decision
makers involved in design and construction projects.
For the last 100 years, there has been a substantial shift from the primary and secondary sectors to
the tertiary sector in industrialised countries. The tertiary sector is now the largest sector of the
economy in the Western world, and is also the fastest-growing sector. As a result of a wealth of
mineral resources and favourable agricultural conditions, South Africa's economy has historically
been rooted in the primary sectors. However, over the past four decades, the economy has been
characterised by a structural shift in output. Since the early 1990s, economic growth has been driven
mainly by the tertiary sector and more recently South Africa is moving towards becoming a
knowledge-based economy, with a greater focus on technology, e-commerce and financial and other
services. Some of the fastest growing tertiary industries over the last couple of years include
transport and financial services, with most value-add having occurred in information and
communications technology; communications; retail as well as finance and business services.
The fuel mix for the commercial sector for 2008 is depicted in Figure 6-1. Unlike the manufacturing
sector petroleum products such as residual fuel oil and LPGas feature more strongly being
responsible for ~17% of total consumption. Electricity and coal account for almost equal shares of
energy consumption in the commercial sector at approximately 40%.

61
Figure 6-1: Commercial Sector Energy Use (Source: DoE, 2009)
6.1 Projected Demand Given the fact that the tertiary sector is predominant in highly-electrified urban areas, electricity
dominates total energy usage as it is the most modern and convenient source of energy. It is also no
surprise that the historical consumption of electricity has shown a steady increase aligned with the
growth of the tertiary sector.
As economies develop, the commercial and public sector usually grows faster than other sectors and
this has been true for South Africa. Continued expansion of the tertiary sector will see continued
increases in the demand for energy, and more specifically electricity. The projected demand for the
commercial sector is depicted in Figure 6-2. Similar to the residential sector the coal consumption in
the commercial sector for the beginning of 2010 deviates markedly from the total consumption
reported in the 2008 energy balance. This deviation was due to issues which were identified with
respect to the time series data for coal consumption in the commercial sector and hence the
projected demand is based on the assumption that coal usage within the commercial sector will
decline at an average annual rate of 2% from 2010 to 2050. The fuel mix in the commercial sector
continues to be dominated by electricity despite a slight decline in the total share of energy use in
the commercial sector from ~77% to ~74%. The share in LPGas increases marginally from ~3% to
Coal 41.68%
Electricity 40.86%
Natural Gas 0.02%
Petroleum Products 17.44%
Commercial Sector Energy Use

62
~4% over the same time period while the share of residual fuel oil which is mostly used in boilers
increases from ~18% to ~22%.
Figure 6-2: Commercial Sector Projected Demand 2010-2050 (Source: Model Output)
6.2 Commercial Sector Energy Intensity With the on-going improvement in equipment efficiency and building shells, the growth in energy
consumption is slower that the growth of value added in the tertiary sector Also the decline in solid
fuels such as coal for heating within commercial buildings to more modern energy carriers such as
electricity and petroleum products, has a positive impact on the energy intensity of the commercial
sector.
0
50
100
150
200
250
300
350
400
450
20
10
20
12
20
14
20
16
20
18
20
20
20
22
20
24
20
26
20
28
20
30
20
32
20
34
20
36
20
38
20
40
20
42
20
44
20
46
20
48
20
50
Fin
al C
on
sum
pti
on
(P
J)
Year
Commercial Sector Projected Demand
Electricity
Residual Fuel Oil
LPG
Coal

63
Figure 6-3: Commercial Sector Energy Intensity (Source: DoE Analysis)
6.3 Energy Efficiency Opportunities in the Commercial Sector How energy is used in a commercial building has a large effect on energy efficiency strategies. The
wide range of building types is one factor contributing to the complexity of end use in the
commercial sector. The graphs shown in Figure 6-4 and Figure 6-5 below are indicative of average
end use profile across the entire sector. In 2005, the majority of floor space in the commercial sector
was comprised of offices at around 34% of total area followed by retail outlets which take up the
second largest percentage (Haws & Hughes, 2007). The most important energy end use across the
stock of commercial buildings is HVAC accounting for close to 34% of energy use. Water heating and
cooking are next in importance, each close to 20% of the total. The remaining energy is consumed
by lighting; cool storage as well as other miscellaneous uses.
The largest single influence on building energy consumption is the design of the building. New
building envelope designs have been shown to reduce energy consumption through optimisation of
thermal mass for local climate; optimal insulation; glazing; correct orientation; and building shape.
However some barriers to improved thermal design include increased initial cost, split incentives
(the developer often does not have to pay for the energy bill), and lack of training of architects and
consulting engineers in efficient building practices (IEA, 2013b). Although energy demand in the
tertiary sector is relatively low when compared to other industrialised countries, significant
-
0.02
0.04
0.06
0.08
0.10
0.12
0.14
20
10
20
12
20
14
20
16
20
18
20
20
20
22
20
24
20
26
20
28
20
30
20
32
20
34
20
36
20
38
20
40
20
42
20
44
20
46
20
48
20
50
PJ/
R (
20
05
bas
e y
ear
)
Year
Commercial Sector Energy Intensity
Commercial

64
opportunities for improvements in energy efficiency exist especially in the heating and cooling of
office buildings, office equipment and lighting. Water heating is slowly starting to see a shift to
alternative energy sources such as solar and more energy efficient heat pumps. To this effect, the
government has also introduced various legal and policy instruments aimed at improving efficiency.
These include the National Building Regulations which include specifications and standards for the
energy efficiency of new buildings as well as standards for the labelling of the efficiency of
appliances. Various incentives schemes have also been introduced which are aimed at encouraging
more energy efficient practices and behaviour from all industries including those that fall within the
commercial sector.
Figure 6-4: Commercial Sector Energy End Use (Source: DoE Analysis)
HVAC 33.74%
Pumping Water for Reticulation
0.20%
Lighting 14.05%
Water Heating 20.56%
Cooking 17.30%
Cool Storage 5.11%
Other Electrical Equipment
9.04%
Commercial Sector Energy End Use
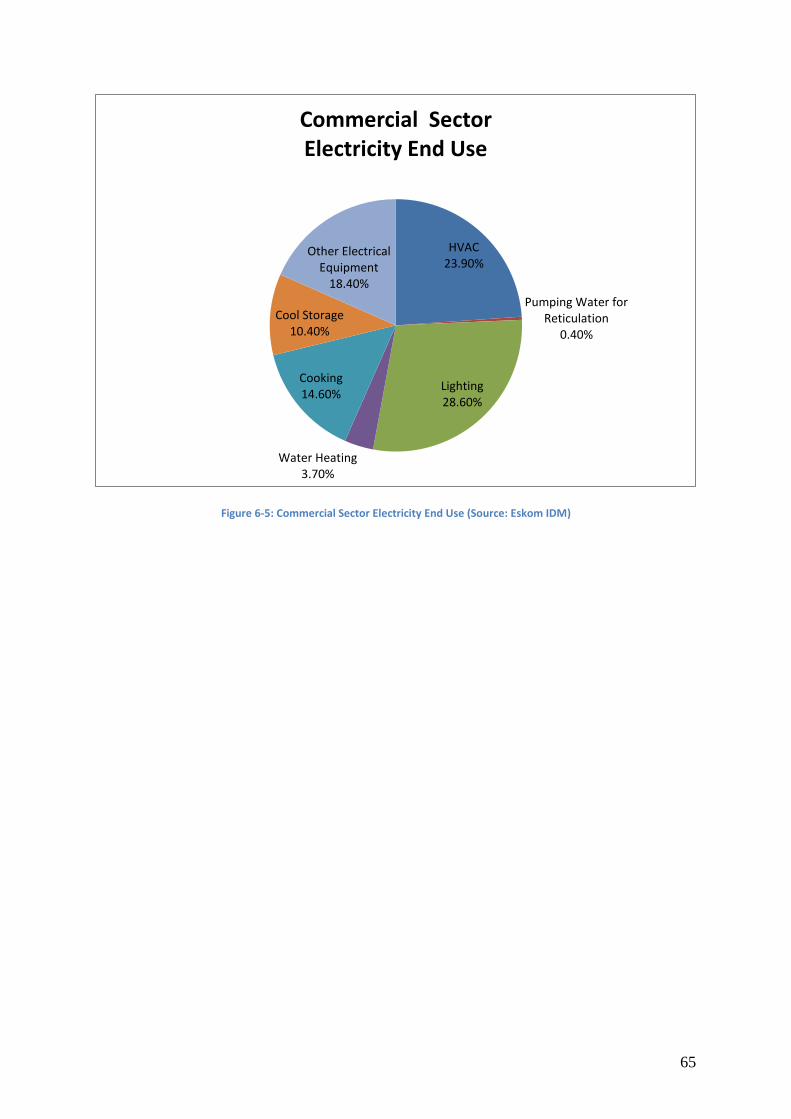
65
Figure 6-5: Commercial Sector Electricity End Use (Source: Eskom IDM)
HVAC 23.90%
Pumping Water for Reticulation
0.40%
Lighting 28.60%
Water Heating 3.70%
Cooking 14.60%
Cool Storage 10.40%
Other Electrical Equipment
18.40%
Commercial Sector Electricity End Use

66
7. Agricultural Demand Projections South Africa has a dual agricultural economy which comprises a well-developed commercial sector
and a predominately subsistence-oriented sector in the rural areas. Primary commercial agriculture
contributes about 3% to South Africa’s gross domestic product (GDP) and about 7% to formal
employment. However, there are strong backward and forward linkages into the economy, so that
the agro industrial sector is estimated to contribute about 12% to GDP (GCIS, 2012).
Since South Africa’s re-admittance into world-trade, the agricultural sector has undergone significant
structural changes over the past 15 years some, of which has seen the sector shift to large-scale
intensive farming, as well as a shift from low-value, high-volume products intended for domestic
consumption, such as wheat and milk, to high-value products intended for export, such as deciduous
fruit, citrus and game. Intensive farming practices are highly dependent on water and fuel with fuel
making up the second biggest expenditure item after farm feeds. On the other hand, land-reform
could see the emergence of a large number of small-scale farmers, most likely to use traditional
farming methods. Fuel usage (predominantly diesel) in the agricultural sector is primarily used for
traction and other farm machinery as well as the onsite transportation of agricultural produce and is
the predominant energy source in the sector.
Figure 7-1: Agricultural Sector Energy Use (Source: DoE, 2009)
Coal 2.06%
Electricity 29.94%
Geothermal Solar etc
0.17%
Petroleum Products 67.84%
Agricultural Sector Energy Use

67
7.1 Projected Demand
Despite the relative importance of the agricultural sector to economic activity and employment,
agricultural energy use is very small in comparison to the industrial and the commercial sector. In
2010 the majority of energy needs within in the agricultural sector are met from diesel and this
continues to persist with diesel being responsible for the largest share of total energy consumption
in the future. Overall total energy consumption increases with a modest increase in electricity
demand coupled with a decline in coal over the same time period.
Figure 7-2: Agricultural Sector Projected Demand 2010-2050 (Source: Model Output)
7.2 Agricultural Sector Energy Intensity For agriculture, the three-stage evolution can be considered as follows:
Basic human work for tilling, harvesting and processing, together with rain-fed irrigation,
none of which involve an input from an external fuel source;
Then the use of animal work to provide various energy inputs;
Finally, the application of renewable energy technologies such as wind pumps, solar dryers
and water wheels, together with modern renewable and fossil fuel base technologies for
motive and stationary power applications, and for processing agricultural products (FAO,
2013)
In the agricultural sector energy intensity changes over the three stages identified above. In the first
and second stage, where agriculture is more traditional, human and animal power plays a significant
role, energy intensity is lower since productivity is also low. In the initial phase of the third stage the
0
20
40
60
80
100
120
140
160
20
10
20
12
20
14
20
16
20
18
20
20
20
22
20
24
20
26
20
28
20
30
20
32
20
34
20
36
20
38
20
40
20
42
20
44
20
46
20
48
20
50
Fin
al C
on
sum
pti
on
(P
J)
Year
Agricultural Sector Projected Demand
Diesel
Coal
Electricity

68
modernisation of agriculture, energy intensity increases because of increased energy investment to
develop the infrastructure, application of chemical fertilizer and the introduction of machines. In
the later phase of the third stage, energy intensity decreases due to increased efficiency of
agricultural productivity through modern technology and efficient utilisation of various forms of
energy (Khosruzzaman et.al, 2010).
South Africa has 2.76 million hectares of cultivated land, of which nearly 10.45 million hectares
(82%) is used for commercial farming purposes. A total of 0.79 million hectares (only 6.19%) is
permanently under cultivation and more than 10.83 million hectares (85%) is rain‐fed (Agriseta,
2010). The formal sector which is comprised of well-established commercial farms is complemented
by an informal or emergent sector. Within the commercial sector there are large established
farming businesses and smaller ones that struggle to survive and within the less formal sector there
are emergent farmers striving to achieve commercial success. The emerging farmer is neither an
established commercial farmer nor subsistence in nature and is the focus of many of the
government’s efforts to achieve transformation within the sector as a whole. For instance the
Department of Agriculture Forestry and Fisheries has promoted mechanisation through tractor
distribution programmes in support of the Mechnanisation Policy for Household Food Security which
targets households in rural areas with access to land with the potential to produce food
(Department of Agriculture, Forestry and Fisheries, 2013). Other initiatives such as the
Comprehensive Agricultural Support Programme has also supported farmers with access to
equipment in an effort to increase agricultural production as mechanisation is key to moving from
the first and second stage of agricultural production to the third stage (Department of Agriculture,
Forestry and Fisheries, 2013).

69
Figure 7-3: Agricultural Sector Energy Intensity (Source: DoE Analysis)
As shown in Figure 7-3 the energy intensity of the agricultural sector decreases from 2010 to 2034
but increases afterward from 2035 to 2050. Decreases in energy intensity from 2010 to 2034 can be
attributed to the reduction in coal. Increases in agricultural intensity post 2034 can be attributed to
the increase in the diesel demand as well as the increased usage of farm equipment by emergent
farmers that look to expand agricultural production by moving from the first and second stage to the
third stage of production.
7.3 Energy Efficiency Opportunities in the Agricultural Sector
The agricultural sector has at its core the production process for foodstuff (e.g. grains, fruits and
vegetables, meat, fish, poultry, and milk), and non-food vegetable products of economic value (e.g.
tobacco). However the sector also comprises or has close links with processes that take place before
and after this core production process, such as fertilizer production, post-harvest processing, and
transport of foodstuff. Farmers have many expenses, including chemicals like fertilizers and
pesticides, farm labour, and seed, as well as energy expenses like lighting and diesel fuel for farm
equipment. By lowering farm expenditure for energy through improved energy efficiency, the
chance that a farm can become profitable will increase. Opportunities for improvements in energy
efficiency should focus on the end uses within the agricultural sector which have the most impact on
energy consumption. The majority of energy in the agricultural sector goes toward traction (~66%)
followed by irrigation (~8%). With regards to electricity the largest share is used for irrigation (~28%)
followed by water heating (~22%). As most of the energy consumed in the agricultural sector goes
towards traction efforts to reduce energy consumption in the agricultural sector should focus on
0
0.2
0.4
0.6
0.8
1
1.2
1.4
1.6
1.8
2
20
10
20
12
20
14
20
16
20
18
20
20
20
22
20
24
20
26
20
28
20
30
20
32
20
34
20
36
20
38
20
40
20
42
20
44
20
46
20
48
20
50
PJ/
R (
20
05
bas
e y
ear
)
Year
Agricultural Sector Energy Intensity
Agriculture

70
increasing the efficiency of tractors or minimising the need for traction through low tillage
agriculture in cases when it is appropriate.
Figure 7-4: Agricultural Sector Energy End Use (Source: DoE Analysis)
Reduction in energy used for irrigation while providing the desired service is possible through the
use of more efficient pump sets and water frugal farming methods. To improve the efficiency of
irrigation pumps farmers can use foot valves that have low-flow resistance; replace undersized pipes
and reduce number of elbows and other fittings that cause frictional losses; use high efficiency
pumps; select pumps better matched to the required lift characteristics. As various agricultural
products are subjected to drying or cold storage before they are sent to market, 10% of electricity
used in the agricultural sector is used for industrial cooling. The efficiency of these processes used
for industrial cooling can generally be improved through use of better equipment and proper
maintenance. Reducing post-harvest food and grain losses through improved storage methods
impervious to pests and rodents, the need for crop production can be reduced hence saving the
energy that would have been used in that production.
Process Heating 5.84% Industrial Cooling
2.86% HVAC 1.20%
Irrigation 8.01%
Material Handling 3.92%
Other Process Use 2.86% Lighting
1.43%
Water Heating 6.49%
Other Electrical
Equipment 0.69%
Traction 66.71%
Agricultural Sector Energy End Use
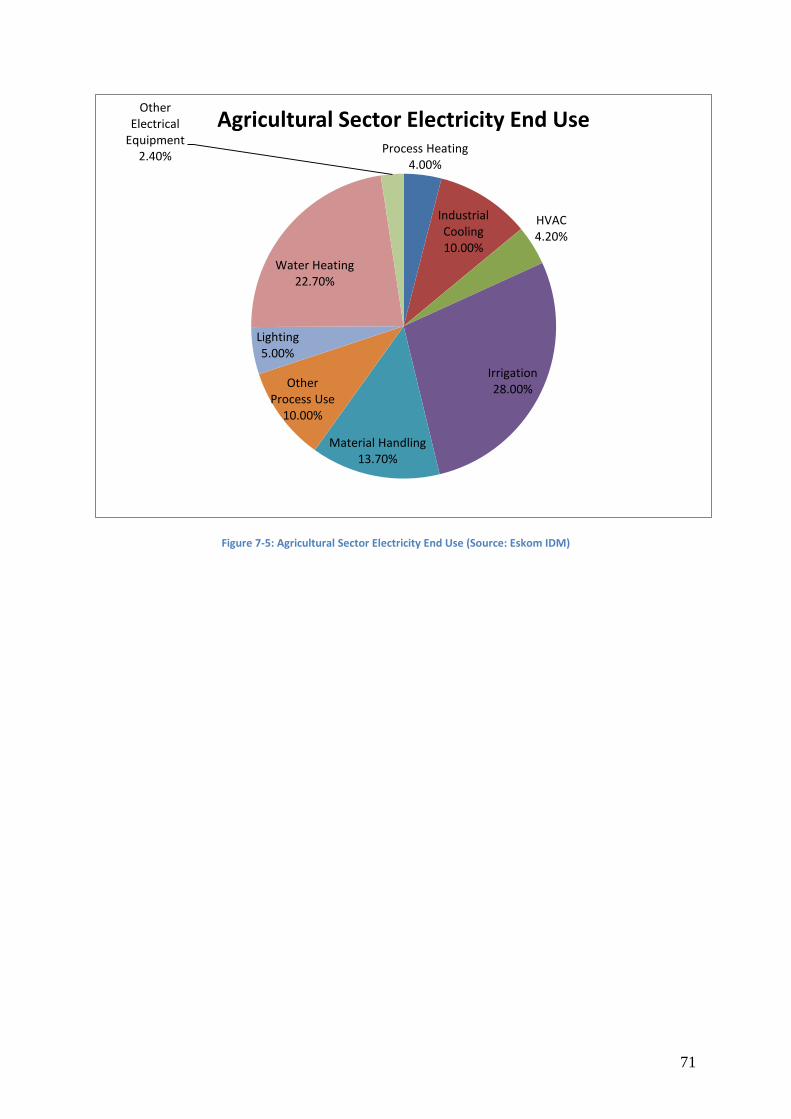
71
Figure 7-5: Agricultural Sector Electricity End Use (Source: Eskom IDM)
Process Heating 4.00%
Industrial Cooling 10.00%
HVAC 4.20%
Irrigation 28.00%
Material Handling 13.70%
Other Process Use
10.00%
Lighting 5.00%
Water Heating 22.70%
Other Electrical
Equipment 2.40%
Agricultural Sector Electricity End Use

72
8. Transport Demand Projections Transport uses a significant amount of the total final energy consumed in South Africa which results
in high greenhouse gas emissions in comparison to many other countries. This is largely driven by
the use of coal to produce liquid fuels for the transport sector.
There are multiple options in providing transport services from the primary resources of energy
available to the country, the types of energy transformation to prepare transport fuels, the choice of
vehicle type and mode of transport chosen by the end consumer. The optimum provision of
transport services needs to consider all these possibilities in terms of their total costs (including
externalities caused by such factors as GHG emissions and pollution) and benefits across the whole
value chain.
The detailed assumptions on transport demand technologies are provided in ANNEXURE B: Inputs
and Assumptions for the Optimisation Model. This section presents the output from the transport
demand projections (i.e. transportation demand). It should be noted that this does not provide the
demand for the vehicle technology or consequent demand for transport energy carriers. The latter is
dependent on the optimisation model which is informed by the constraints of specific test cases and
the least cost options within the constraints. The results for the total energy use for the transport
sector in the base case and the various test cases is provided in ANNEXURE A: Part 2: Optimisation
Modelling Report.
8.1 Scope and procedure of transport demand analysis The scope of the analysis for the transport demand modelling was constrained by available data and
limited to road transport including private passenger, public passenger and road freight. Air
transport was considered by projecting demand for aviation fuels, but no aircraft technologies were
considered. Private passenger vehicle types were disaggregated into cars and sport utility vehicles
(SUVs) of petrol and diesel fuel types for the existing fleet. Future vehicle types include hybrids and
electric vehicles. Public passenger vehicles were divided into busses (diesel only) and minibus taxis
(both petrol and diesel). Freight vehicles were disaggregated into three classes, heavy, medium and
light duty. Traction by rail is excluded as it is considered under electricity demand.
The modelling procedure to analyse the transport demand involves determining transport demand,
person kilometres and ton kilometres travelled for passenger and freight transport respectively,
based on correlations between transport demand and macroeconomic indicators taking into account
typical vehicle usage, occupancy, and loading and projecting these correlations to 2050.

73
8.2 Drivers of transport demand The relationship between transport services and macroeconomic indicators, used to project future
demand for transport services, are discussed in this section. The decay of the residual vehicle fleet
and projections of future fleet requirements, passenger kilometre and freight kilometre demand are
detailed. Finally the required service demand to be met by new vehicles is presented.
Demand for transport services are assumed to be driven by economic activity represented by GDP
for freight and public transport and GDP per capita for private passenger transport. The assumptions
on GDP and GDP per capita are provided in previous sections in this document.
8.3 Existing vehicle fleet capacity Investments in transportation technologies are informed by the difference between future transport
demand and the capacity of the current vehicle fleet. Overtime the existing vehicle fleet decays due
to age and deterioration. However, the existing vehicle fleet could to a certain extent meet a
substantial portion of future transportation demand if demand-side interventions such as efficient
driving, increasing passenger vehicle occupancy rates, increased usage of public transportation,
amongst others, are introduced.
Normalised calibrated curves for the rate at which vehicle are scrapped were obtained from
ERC (2012). These curves together with information about the current vehicles fleet are used to
determine the absolute number of vehicles of a certain vintage remaining in the projected future.
The scrapping of the various vehicle types in the vehicle fleet into the future is shown in Figure 8-1
(petrol cars are shown on the right vertical axis the remaining vehicles use the left vertical axis). The
total remaining passenger fleet over the modelling period is shown in Figure 8-2 and the total
remaining freight fleet is shown in Figure 8-3.

74
Figure 8-1: Decay of the vehicle fleet by individual vehicle types
Figure 8-2: Residual passenger vehicle fleet capacity
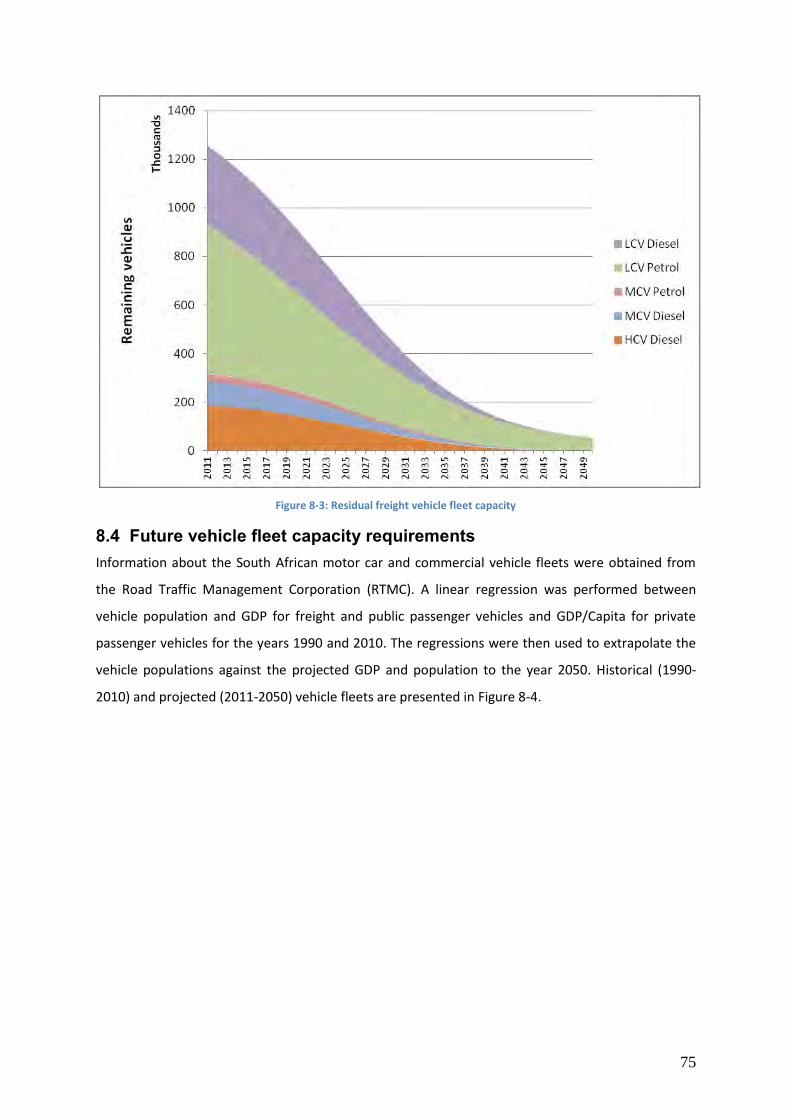
75
Figure 8-3: Residual freight vehicle fleet capacity
8.4 Future vehicle fleet capacity requirements Information about the South African motor car and commercial vehicle fleets were obtained from
the Road Traffic Management Corporation (RTMC). A linear regression was performed between
vehicle population and GDP for freight and public passenger vehicles and GDP/Capita for private
passenger vehicles for the years 1990 and 2010. The regressions were then used to extrapolate the
vehicle populations against the projected GDP and population to the year 2050. Historical (1990-
2010) and projected (2011-2050) vehicle fleets are presented in Figure 8-4.

76
Figure 8-4: Historical and projected vehicle fleet
Many Light Delivery Vehicles (LDVs) are multipurpose vehicles used for both commercial and
passenger services. This was accommodated by sharing the total distance travelled by LDVs evenly
between passenger and ton kilometres.
Motorcars form the majority of the vehicle fleet at present and within the projected period. The
numbers of cars together with a proportion of the LDVs used for passenger transport in the year
2050 indicate vehicle ownership of approximately 500 cars per thousand people. This is equivalent
to current vehicle ownership rates in many developed nations.
8.5 Projected vehicle kilometres travelled Vehicle usage varies by vehicle type and age. Average vehicle kilometres for various vehicle types
were obtained from ERC (2012). These are listed in Table 8.1 for existing and new vehicles. Vehicle
use by age was not considered.

77
Table 8.1: Distances travelled by vehicle type and class (ERC, 2012)
Residual vehicles New vehicles Vehicle class Fuel type Ave km/a km/a Motorcars Diesel 21254 24000 Motorcars Petrol 16169 24000 Motorcars Petrol hybrid 23678 24000 SUV Diesel 20314 24000 SUV Petrol hybrid 24000 24000 SUV Petrol 19128 24000 Minibuses (taxis) Diesel 43474 50000 Minibuses (taxis) Petrol 30927 50000 Buses Diesel 22072 40000 Motorcycle Petrol 8340 10000 Light Commercial Vehicles (LCV - LDV) Diesel 19202 25000 Light Commercial Vehicles (LCV - LDV) Petrol 16662 25000 Medium Commercial Vehicles (MCV - trucks) Diesel 33417 45000 Medium Commercial Vehicles (MCV - trucks) Petrol 13575 25000 Heavy Commercial Vehicles (HCV - trucks) Diesel 48403 70500
Total vehicle kilometres per vehicle type were calculated from the product of the distance travelled
per vehicle type and the number of vehicles of that type for each projected year. The historical and
projected vehicle kilometres are shown in Figure 8-5.
Figure 8-5: Historical and projected vehicle kilometres

78
8.6 Projected passenger and tonne kilometres Occupancy rates of 1.1, 1.4, 14, and 25 were obtained from ERC (2012) and were used to determine
total vehicle kilometres for motorcycles, cars, mini bus taxis and busses respectively. Total passenger
kilometres are calculated from the product of the vehicle kilometres and the occupancy of the
respective vehicles types. Total person kilometres by vehicle type are shown in Figure 8-6.
Passenger kilometres by the “other” modes of transport were taken directly from ERC (2012). The
use of motorcycles is too small to feature in the figure.
Figure 8-6: Historical and projected passenger kilometres
Similar to passenger vehicles, the freight tonne kilometres were calculated from the product of
freight vehicle kilometres and the average loading of freight vehicles. (Different Truck types obtained
from the RTMC data were aggregated into light, medium and heavy duty classes by determining the
share of trucks in three engine capacity groups using data from the National Transport Information
System). Tonne kilometres by freight class are shown in Figure 8-7. Heavy commercial vehicles (HCV)
constitute the majority of freight transport.

79
Figure 8-7: Historical and projected freight tonne kilometres
8.7 Required future capacity in fleet capacity The required future transport capacity is the difference between the existing capacity in a particular
year and the transport demand. Capacity of the current passenger vehicle fleet and the demand for
future passenger kilometres is shown in Figure 8-8. Existing capacity of the current freight fleet and
the future freight demand is shown in Figure 8-9.

80
Figure 8-8: Existing passenger fleet capacity (shaded) and future demand
Figure 8-9: Existing total freight capacity (shaded) and future demand
Transport technologies available for new investments to fill the gap between future demand and
residual capacity are provided in Annexure B - Appendix C.

81
9. References AgriSETA (2010), Sector Analysis Agriculture, AgriSETA, Pretoria.
Battacharyya, S. and Govinda Timilsina (2009). Energy Demand Models for Policy Formulation: A
Comparative Study of Energy Demand, Policy Research Working Paper 4866. The World Bank.
Development Research Group: Environment and Energy Team
Chamber of Mines (2012). Facts and Figures_2011. Chamber of Mines
http://www.bullion.org.za/documents/F_F_2012_Final_Web.pdf.
Department of Agriculture, Forestry and Fisheries (2013). Mechanization Support Policy for
Household Food Secturity. DAFF http://www.pmg.org.za/report/20130305-department-agriculture-
forestry-and-fisheries-and-provincial-departme
Department of Energy (2012a). A survey of energy-related behaviour and perceptions in South Africa:
The Residential Sector. DoE, Pretoria.
Department of Energy (2009) Digest of South African Energy Statistics, DoE, Pretoria.
Department of Energy (2012b), Energy Balances in TJ (1999-2009). www.energy.gov.za. Accessed
September 2012.
Energy Research Centre (2013) Assumptions and Methodologies in the South African TIMES Model
Energy Research Centre (2012): Quantifying the energy needs of the Transport Sector for South
Africa: A Bottom up Model, report prepared for the South African National Energy Development
Institute (SANEDI).
Food and Agriculture Organization of the United Nations (2013), The Energy and Agriculture Nexus.
Chapter 2: Energy for Agriculture. Environment and Natural Resources Working Paper, No4
Government Communication Information Systems (2008), South Africa Yearbook 2007/08, GCIS,
Pretoria
Government Communication Information Systems (2012), South Africa Yearbook 2011/12, GCIS,
Pretoria.
Gaye, Amie (2007) Access to Energy and Human Development. Human Development Report
2007/2008. United Nations Development Program, Human Development Report Office Paper.
Haws, M. and A. Hughes (2007). Policies for Sustainable Development: Background data, Energy
Research Centre
82
Heltberg, R. (2003), Household Fuel and Energy Use in Developing Countries: A multi-country study,
Oil and Gas Policy Division. The World Bank
Intergovernmental Panel on Climate Change (2007) Climate Change 2007:Mitigation Contribution of
Working Group III to the Fourth Assessment Report of the Intergovernmental Panel on Climate
Change [B. Metz, O.R. Davidson, P.R. Bosch, R. Dave, L.A. Meyer (eds.), Cambridge University Press,
Cambridge, United Kingdom and New York, New York.
International Aluminium Industry (2008). IAI Statistics, http://www.world-aluminium.org/Statistics.
International Energy Agency (2007). Tracking Industrial Energy Efficiency and CO2 Emissions.
OECD/IEA, Paris.
International Energy Agency (2009). Energy Technology Transitions for Industry: Strategies for the
Next Industrial Revolution. OECD/IEA, Paris.
International Energy Agency (2012a) Energy Management Programmes for Industry. OECD/IEA,
Paris.
International Energy Agency (2012b) Energy Technology Perspective 2012. OECD/IEA, Paris.
International Energy Agency (2013a) Transition to Sustainable Buildings: Strategies and
Opportunities to 2050, OECD/IEA, Paris.
International Energy Agency (2013b) World Energy Outlook: Redrawing the Energy-Climate Map,
OECD/IEA, Paris.
Institute for Energy Studies (1992) South African Energy Database. Rand Afrikans University,
Johannesburg.
Kema, Inc. (2012). Industrial Sectors Market Characterization: Chemicals Sector. Oakland, California.
Khosruzzaman, S.M., Ali Asgar, K.M. Rezaur Rahman and Shawkat Akbar (2010). Energy intensity and
productivity in relation to agriculture-Bangladesh Perspective, Journal of Bangladesh Academy of
Sciences. Vol 34, No 1 59-70.
Kumba Iron Ore and Anglo American (2011). The South African Iron and Steel Value Chain
Masera, Omar, Saatkamp, B. and Kammen, D. (2000). From Linear Fuel Switching to Multiple Cooking
Strategies: A Critique and Alternative to the Energy Ladder Model. World Development vol 28, No 12
pp. 2083- 2103.
Mbendi (2013), Gold Mining in South Africa-Overview.
http://www.mbendi.com/indy/ming/gold/af/sa/p0005.htm. Accessed February 2013.
83
Modi, V, S. McDade, D. Lallement, and J. Saghir (2006), Energy and the Millennium Development
Goals, New York: Energy Sector Management Assistance Programme, United Nations Development
Programme, United Nations Millennium Project and World Bank
Pasternak, Alan (2000). Global Energy Futures and Human Development: A Framework for Analysis,
Lawrence Livermore National Laboratory.
Statistics South Africa (1998) Census 1996. Report Number 03-01-11. Statistics South Africa. Pretoria
Statistics South Africa (2003). Census 2001. Report Number 03-02-03. Statistics South Africa,
Pretoria.
Statistics South Africa (2007). Community Survey, 2007. Statistical Release P0301. Statistics South
Africa, Pretoria.
Statistics South Africa (2012a). Census 2011. Statistical Release P0301.4. Statistics South Africa,
Pretoria.
Statistics South Africa (2012b) General Household Survey, Statistical Release P0318, Statistics South
Africa, Pretoria.
Statistics South Africa(2012c) Gross Domestic Product, Statistical Release P0441. Statistics South
Africa, Pretoria.
Statistics South Africa (2012d) Mid-Year Population Estimates, Statistical Release P0302, Statistics
South Africa, Pretoria.
South African Iron and Steel Institute (2012) Steel Stats. www.saisi.co.za. Accessed December 2012.
United Nations Department of Economic Studies and Social Affairs (2012), Population Division: World
Urbanization Prospects, the 2011 Revision, New York.
United Nations Industrial Development Organization (2010). Motor Systems Efficiency Supply Curves.
UNIDO, Vienna.
United Nations Industrial Development Organization (2011). Industrial Development Report 2011,
Industry Energy Efficiency for Sustainable Wealth Creation: Capturing environmental, economic and
social dividends. UNIDO, Vienna
USA Department of Energy, (2007), Industrial Technologies Program, Mining Energy Bandwidth
Study
United States Geological Survey (2009), Mineral Commodity Summaries, Aluminium, January 2008,
USGS, Reston, Virginia.
World Health Organization (2006) Fuel for Life: Household Energy and Health. WHO, Geneva.