Embed Size (px)
Citation preview

Department of Homeland Security Border Security Metrics Report February 26, 2019

2
Message from the Senior Official Performing the Duties of the Under Secretary for the Office of Strategy, Policy, and Plans February 26, 2019
The “Department of Homeland Security Border Security Metrics Report” is submitted pursuant to the Fiscal Year (FY) 2017 National Defense Authorization Act (NDAA), which directs that “Not later than 180 days after the date of the enactment of this section, the Secretary (of Homeland Security) shall develop metrics, informed by situational awareness, to measure the effectiveness of security between ports of entry, at ports of entry, in the maritime environment and to measure the effectiveness of the aviation assets and operations of Air and Marine Operations of U.S. Customs and Border Protection.” The Act further directs the Secretary to annually assess, report, and implement the specified metrics.
The outcome-based performance measures called for by the Act are the most comprehensive, rigorous set of border security metrics required of the Department of Homeland Security (DHS) to date. Through previous efforts, DHS has established processes and procedures to collect and analyze essential data to meet most, but not all, of the Act’s requirements. This FY 2018 report identifies which measures are still unavailable; DHS commits to continuing efforts to produce all the measures required by the Act.
Thank you for your continuing support and commitment to strengthening the operating effectiveness of DHS.
Pursuant to congressional requirements, this notification is being provided to the following Members of Congress:
The Honorable Ron Johnson Chairman, Senate Committee on Homeland Security and Governmental Affairs
The Honorable Claire McCaskill Ranking Member, Senate Committee on Homeland Security and Governmental Affairs
The Honorable Michael McCaul Chairman, House Committee on Homeland Security
The Honorable Bennie Thompson Ranking Member, House Committee on Homeland Security
Inquiries relating to this report may be directed to the DHS Office of Legislative Affairs at (202) 447-5890.
Sincerely,
James W. McCament Deputy Under Secretary Office of Strategy, Policy, and Plans

3
DHS Border Security Metrics Report
TABLE OF CONTENTS I. Legislative Language ................................................................................................................ 4
II. Introduction ............................................................................................................................... 5
III. SEC. 1092 BORDER SECURITY METRICS ......................................................................... 7
§ 1092(b) METRICS FOR SECURING THE BORDER BETWEEN PORTS OF ENTRY ........................ 7
§ 1092(c) METRICS FOR SECURING THE BORDER AT PORTS OF ENTRY ................................. 32
§ 1092(d) METRICS FOR SECURING THE MARITIME BORDER ................................................. 44
§ 1092(e) AIR AND MARINE SECURITY METRICS IN THE LAND DOMAIN ............................... 53
§ 1092(g)(3)(D) Other Appropriate Information .................................................................... 58
IV. Conclusion .............................................................................................................................. 63
Appendix A – Repeated Trials Model Methodology ........................................................................... 64
Appendix B – Drugs Seizures – All Ports of Entry .............................................................................. 67

4
I. LEGISLATIVE LANGUAGE
Section 1092 of the FY 2017 National Defense Authorization Act (NDAA), signed into law December 23, 2016, directs the Secretary of Homeland Security to provide annually to the Committee on Homeland Security of the House of Representatives and the Committee on Homeland Security and Governmental Affairs of the Senate specific “Metrics for Securing the Border Between Ports of Entry,” “Metrics for Securing the Border At Ports of Entry,” “Metrics for Securing the Maritime Border,” and “Air and Marine Security Metrics in the Land Domain.” The NDAA further directs that the Secretary “in accordance with applicable privacy laws, make data related to apprehensions, inadmissible aliens, drug seizures, and other enforcement actions available to the public, law enforcement communities, and academic research communities.”

5
II. INTRODUCTION As President Donald Trump indicated in Executive Order 13767 “Border Security and Immigration Enforcement Improvements” (January 25, 2017), border security is critically important to the national security of the United States. The Department’s ability to measure its border-security inputs, activities, outputs, and outcomes is essential to the effective and efficient management of the Department, including management of the new activities and investments directed by the President’s Executive Orders on border security and immigration enforcement.
Comprehensive and rigorous performance management data provide DHS leadership with the foundation to support responsible evidence-based decision-making for resource allocation and investments and for operational and mission management. Further, DHS implementation of this approach provides a pair of unifying border security goals under the Department’s mission to secure and manage U.S. borders. As summarized in the 2014 DHS Quadrennial Homeland Security Review (QHSR), the Department’s first two goals under the border security mission area are to “Secure U.S. Air, Land, and Sea Borders and Approaches” by preventing illegal entry and to “Safeguard and Expedite Lawful Travel and Trade” by safeguarding key nodes, conveyances, and pathways, and by managing the risk of people and goods in transit. Ultimately, the border security metrics described in this report are designed to assess the ability of the Department’s border security policies and investments to achieve these outcomes.
For analytic purposes, the metrics included in this report may be divided into four categories: • Inputs: Resources acquired or expended to secure the border. Examples of border security inputs
include the number of U.S. Customs and Border Protection (CBP) Office of Field Operations (OFO) officers and U.S. Border Patrol (USBP) agents deployed, miles of fencing and other border infrastructure, and numbers of aircraft committed to the border security mission.
• Activities: Specific actions taken to secure the border. Examples of border security activities include illegal border crossers apprehended, travelers admitted or denied admission at ports of entry (POE), and pounds of narcotics seized.
• Outputs: Immediate results of enforcement activities as they relate to the border security goals. Examples of border security outputs include the rate at which intending unlawful border crossers are apprehended or interdicted, and the accuracy of screening results for travelers and goods at POEs.
• Outcomes: The ultimate impacts of border security policies. As defined by the QHSR, the most important border security outcomes are the numbers of illegal migrants and quantities of illegal goods entering the United States (Goal 2.1), and the ease with which lawful travelers and goods pass through POEs (Goal 2.2).
In general, border security inputs and activities are directly observable and can be measured with a high degree of reliability. Policymakers have direct control over resource allocation, and data on inputs are available in budget and acquisitions documents. Operational agencies also track enforcement activities as part of their case management process. In short, the Department knows exactly how many agents it deploys, how many miles of fence it erects, how many aliens it apprehends, and how many travelers it admits. Input and activity measures tend to provide insight into the level and type of enforcement effort undertaken—what the Department is doing—that are useful for workload management and tactical decision-making; but in and of themselves these metrics typically provide limited insight into the state of border security.
Outcome and output measures often provide more insight than inputs and activities when it comes to evaluating border security and may be powerful tools for policy and program evaluation. Yet many output and outcome metrics are difficult to measure directly because illegal border crossers actively seek to evade detection, and some flows are undetected and therefore can never be measured directly. This challenge is nearly universal when measuring illegal activities, which is why law enforcement agencies typically rely on crime reports as indicators of total criminal activities, for example. Measuring border security outputs and outcomes is also difficult because of the diversity and complexity of the enforcement mission along the United States’ 6,000

6
miles of land borders, 95,471 miles of coastline, and 350 POEs. Moreover, enforcement outcomes only partially depend on border security policies, since immigration flows also reflect numerous factors outside enforcement agencies’ control, including the broader set of U.S. immigration policies and numerous economic, demographic, and other structural factors.
Historically, DHS and the legacy Immigration and Naturalization Service addressed these measurement challenges by relying on alien apprehensions (an activity metric) as a proxy measure of illegal immigration between POEs (an outcome metric). More recently, CBP and DHS have initiated a number of new estimation strategies to better model unknown flows. These efforts have focused primarily on border security between POEs in the land domain (NDAA § 1092(b)), a domain that has been identified by Congress and the last several Administrations as a top enforcement priority.
Some of this research remains a work in progress, as DHS is not yet able to validate certain modeling assumptions or to quantify the uncertainty around its new estimation techniques. In addition, many of the metrics in this report remain limited to the southwest border. The current version of this report includes several methodological updates to the FY 2017 report, along with certain updated or expanded datasets. These updates are flagged in the report text. The Department’s future work on border metrics will continue to refine these new indicators of border security between POEs and expand data collection and methodologies to the northern border, while also developing additional indicators of border security, including those still identified as incomplete in this report.
Pursuant to the NDAA, this report covers a mix of input, activity, output, and outcome metrics between POEs, at POEs, in the maritime domain, and with respect to air and marine security in the land domain for fiscal year 2017. While most of these measures involve data the Department has tracked for many years, some remain under development or fall outside the scope of the Department’s existing measurement methodologies. This report includes the following information for each border security metric:
• Definition of the metric and brief description of how the metric contributes to the Department’s understanding of border security;
• Discussion of the Department’s current methodology for producing the metric and related methodological limitations; and
• Available data, including historical data where possible, and brief discussion of implications for the current state of border security.
The following sections of this report provide this information for each metric directed by the NDAA. In addition to the specific metrics identified in sections §1092(b) – (e), this report includes supplemental measures that inform the Department’s assessment of the state of border security between POEs, as directed by NDAA § 1092(g)(3)(D).

7
III. SEC. 1092 BORDER SECURITY METRICS
§ 1092(b) METRICS FOR SECURING THE BORDER BETWEEN PORTS OF ENTRY
§ 1092(b)(1)(A)(i) Attempted unlawful border crosser apprehension rate
Definition
In general, the attempted unlawful border crosser apprehension rate is defined as the proportion of attempted border crossers that is apprehended by USBP:
𝐴𝐴𝐴𝐴𝐴𝐴𝐴𝐴𝐴𝐴ℎ𝐴𝐴𝑒𝑒𝑒𝑒𝑒𝑒𝑒𝑒𝑒𝑒 𝐴𝐴𝑟𝑟𝑟𝑟𝐴𝐴 = 𝐴𝐴𝐴𝐴𝐴𝐴𝐴𝐴𝐴𝐴ℎ𝐴𝐴𝑒𝑒𝑒𝑒𝑒𝑒𝑒𝑒𝑒𝑒𝑒𝑒
𝑈𝑈𝑒𝑒𝑈𝑈𝑟𝑟𝑈𝑈𝑈𝑈𝑈𝑈𝑈𝑈 𝐴𝐴𝑒𝑒𝑟𝑟𝐴𝐴𝑒𝑒 𝑟𝑟𝑟𝑟𝑟𝑟𝐴𝐴𝑎𝑎𝐴𝐴𝑟𝑟𝑒𝑒
While USBP has reliable administrative data on apprehensions, the Department does not have an exact count of unlawful entry attempts since an unknown number of illegal border crossers evade detection. As a result of this so-called “denominator problem,” the Department must estimate the apprehension rate. Current methodologies allow DHS to produce two apprehension rate estimates:
Model-based apprehension rate (ARModel-based) – Based on statistical modeling, the estimated share of all attempted unlawful border crossers between land POEs that is apprehended.
Observational apprehension rate (ARObservational) – Based on direct (unlawful border crossers observed by USBP) and indirect (residual evidence of a border crosser, e.g. footprints) observations of attempted unlawful border crossers, the estimated share of observed attempted unlawful border crossers that is apprehended.
The apprehension rate is an output measure that describes the difficulty of illegally crossing the border successfully.
A conceptual limitation of apprehension rate data is that they include information about border apprehensions, but exclude information about turn backs (see section 1092 (b)(1)(A)(iv) for definition), which are a key element of USBP’s enforcement strategy, with underlying operational implications. In this sense, measures of the apprehension rate understate USBP’s overall enforcement success rate. On the other hand, some analysts consider information about turn backs difficult to interpret since an unknown share of turn backs make additional entry attempts.
Methodology and Limitations
Model-based apprehension rate
The model-based apprehension rate is based on the repeated trials model (RTM) methodology. As explained in detail in Appendix A, the RTM methodology yields an estimated partial apprehension rate (PAR) for southwest border crossers, which focuses on a relatively small share of attempted unlawful border crossers. Following the calculation of the PAR, the ARModel-based methodology consists of four additional steps.
First, all attempted unlawful border crossers are divided into two groups, which are labeled “impactable” and “non-impactable” by traditional DHS enforcement policies. Impactable border crossers include adults without children who are not asylum seekers and (prior to 2017) are not from Cuba. Aliens in this group are described as impactable because they are generally subject to the full range of DHS and Department of Justice (DOJ) enforcement consequences, and therefore potentially impacted by existing border enforcement. Non-impactable

8
border crossers include unaccompanied minors, family units, individuals who request asylum, and (prior to 2017) Cubans. Aliens in this group are described as non-impactable because, historically, they have usually been released into the United States with a Notice to Appear in immigration court for legal proceedings on a future date, rather than being subject to immediate DHS enforcement consequences. These aliens are assumed generally to be non-impactable by traditional DHS enforcement activities at the border because even if they are apprehended they are typically unlikely to be immediately removed or returned.1 The current version of this report updates the methodology used to divide the USBP apprehensions dataset into its impactable and non-impactable sub-groups (see Appendix A).
Second, the ARModel-based methodology assumes an apprehension rate for each of these two groups: 1) all attempted unlawful border crossers in the impactable population are assumed to be apprehended at the partial apprehension rate generated by the RTM methodology; and 2) all unlawful border crossers in the non-impactable population are assumed to intentionally present themselves to a USBP agent or OFO officer and therefore to have a 100 percent apprehension rate. Notably, these assumptions do not reflect the actual behavior of all border crossers, as noted below, but they serve to construct a probability model.
Third, the partial apprehension rate is used to calculate the total number of impactable aliens making illegal entry attempts. The methodology assumes (in the previous step) that all impactable aliens are apprehended at the PAR rate generated by the RTM methodology:
𝑃𝑃𝐴𝐴𝑃𝑃 =𝐴𝐴𝐴𝐴𝐴𝐴𝐴𝐴𝐴𝐴ℎ𝐴𝐴𝑒𝑒𝑒𝑒𝑒𝑒𝑒𝑒𝑒𝑒𝑒𝑒𝐼𝐼𝐼𝐼𝐼𝐼𝐼𝐼𝐼𝐼𝐼𝐼𝐼𝐼𝐼𝐼𝐼𝐼𝐼𝐼
𝐴𝐴𝑟𝑟𝑟𝑟𝐴𝐴𝑎𝑎𝐴𝐴𝑟𝑟𝑒𝑒𝐼𝐼𝐼𝐼𝐼𝐼𝐼𝐼𝐼𝐼𝐼𝐼𝐼𝐼𝐼𝐼𝐼𝐼𝐼𝐼
Mathematically, this equation can be re-arranged to define the total number of impactable aliens making an illegal entry attempt as follows:
𝐴𝐴𝑟𝑟𝑟𝑟𝐴𝐴𝑎𝑎𝐴𝐴𝑟𝑟𝑒𝑒𝐼𝐼𝐼𝐼𝐼𝐼𝐼𝐼𝐼𝐼𝐼𝐼𝐼𝐼𝐼𝐼𝐼𝐼𝐼𝐼 =𝐴𝐴𝐴𝐴𝐴𝐴𝐴𝐴𝐴𝐴ℎ𝐴𝐴𝑒𝑒𝑒𝑒𝑒𝑒𝑒𝑒𝑒𝑒𝑒𝑒𝐼𝐼𝐼𝐼𝐼𝐼𝐼𝐼𝐼𝐼𝐼𝐼𝐼𝐼𝐼𝐼𝐼𝐼𝐼𝐼
𝑃𝑃𝐴𝐴𝑃𝑃
Since non-impactable aliens are assumed to have a 100% apprehension rate, the number of entry attempts of non-impactable aliens is equal to the number of their apprehensions.
Finally, the total apprehension rate is calculated as a weighted average of the total numbers of impactable and non-impactable aliens attempting unlawful entry times their respective apprehension rates:
𝐴𝐴𝑃𝑃𝑀𝑀𝑀𝑀𝑀𝑀𝐼𝐼𝐼𝐼−𝐼𝐼𝐼𝐼𝑏𝑏𝐼𝐼𝑀𝑀 =
The current ARModel-based methodology makes a number of assumptions that cannot be fully validated. First, the ARModel-based methodology builds on the RTM’s partial apprehension rate, and so incorporates all of the RTM modeling assumptions and associated limitations discussed in Appendix A. In addition, the current ARModel-based methodology also assumes: that the entire cohort of border crossers can be divided into impactable and non-impactable groups, that the entire impactable group is apprehended at the same rate as RTM aliens included in the PAR analysis, and that the entire non-impactable group is apprehended 100 percent of the time. Each of these additional assumptions introduces potential biases into the estimated apprehension rate.
The Department has not precisely quantified the impact of these assumptions on the ARModel-based estimates. For these reasons, DHS continues to consider the ARModel-based methodology to be a work in progress. The estimated
1 Cubans were considered non-impactable between 1995 and January 2017 because they were routinely granted parole into the United States if they reached U.S. soil, under the wet-foot/dry-foot policy. The Obama Administration terminated the special parole component of the wet-foot/dry-foot policy in January 2017.

9
apprehension rates reported here represent an update to those reported in the FY 2017 report and may be further updated in the future as the Department continues to refine the model-based estimation methodology.
Observational apprehension rate
The observational apprehension rate is calculated as the ratio of USBP apprehensions to the sum of apprehensions and observed (directly or indirectly) got aways:
𝐴𝐴𝑃𝑃𝑂𝑂𝐼𝐼𝑏𝑏𝐼𝐼𝑂𝑂𝑂𝑂𝐼𝐼𝐼𝐼𝑖𝑖𝑀𝑀𝑁𝑁𝐼𝐼𝐼𝐼 =𝐴𝐴𝐴𝐴𝐴𝐴𝐴𝐴𝐴𝐴ℎ𝐴𝐴𝑒𝑒𝑒𝑒𝑒𝑒𝑒𝑒𝑒𝑒𝑒𝑒
𝐴𝐴𝐴𝐴𝐴𝐴𝐴𝐴𝐴𝐴ℎ𝐴𝐴𝑒𝑒𝑒𝑒𝑒𝑒𝑒𝑒𝑒𝑒𝑒𝑒 + 𝐺𝐺𝑒𝑒𝑟𝑟 𝑟𝑟𝑈𝑈𝑟𝑟𝑒𝑒𝑒𝑒
“Got aways” are defined as subjects at the southwest border who, after making an illegal entry, are not turned back or apprehended, and are no longer being actively pursued by USBP agents.
Since 2014, USBP has implemented a standard, southwest border-wide methodology for determining when to report a subject as a got away. Some subjects are observed directly as evading apprehension or turning back; others are acknowledged as got aways or turn backs after agents follow evidence that indicate entries have occurred such as foot sign (i.e. tracks), sensor activations, interviews with apprehended subjects, camera views, and communication between and among stations and sectors. The scope of these data includes all areas of the southwest land border at or below the northernmost law enforcement posture (typically a USBP checkpoint) within a given area of responsibility, and those individuals apprehended less than 30 days after entering the United States.
In an effort to maintain reliable best practices, command staff at all southern border stations ensure all agents are aware of and utilize proper definitions for apprehensions, got aways and turn backs at their respective stations. They also ensure the necessary communication takes place between and among sectors and stations to minimize double-counting when subjects cross more than one station’s area of responsibility. In addition to station-level safeguards, designated USBP Headquarters components validate data integrity by utilizing various data quality reports.
The primary limitation to ARObservational is that the denominator excludes an unknown number of unobserved got aways. Over the past several years, DHS has invested millions of dollars in technology that has facilitated the ability to see and detect more at the border. Improvements in situational awareness give DHS an ever-increasing, real-time ability to understand how much illegal activity agents are encountering at the immediate border and their ability to respond. As a result, despite the fact that overall border entries are substantially lower today than in any previous fiscal year, agents are currently interdicting slightly lower percentages of the total known flow. This observation reflects USBP’s increased domain awareness—i.e., that through technological advances, the agency has improved its awareness of illegal entry attempts (known got aways)—rather than experienced a drop in enforcement effectiveness. Increasing situational awareness narrows the gap between the known and unknown flow, and puts DHS in a position to build ever better observational estimates of border security. The Department will continue to refine these observational estimates and is currently working on a methodology to estimate their statistical reliability.
An additional methodological limitation is that the estimated count of got aways aggregates potentially subjective observations from thousands of individual agents. USBP has taken a number of steps to establish reliable turn back and got away methodologies, as discussed above.
Ongoing Modeling Efforts
Other model-based estimation methodologies can supplement the Department’s current RTM. USBP has contracted with Johns Hopkins University Applied Physics Lab to develop a different approach by examining each station along the Southwest Border from an operational perspective. The method utilizes modeling and simulation of operational data and conditions, and incorporates: terrain and sensor models; resource deployment

10
of infrastructure and agents; and the movement of both Border Patrol Agents and border threats across known trails and patrol routes. Pilot analysis and testing in a limited number of stations are complete and established a proof of process. The remaining stations along the Southwest Border are planned for analysis in FY 2019, and subsequent work will include compiling a unified understanding of total flow along the Southwest Border, as well as a verification and validation of the methodology.
Available Data and Discussion
Table 1 provides the estimated model-based apprehensions rate for FY 2000 – FY 2016 and the estimated observational apprehension rate for FYs 2006-2016, the years for which these data are available.
Table 1: Model-Based and Observational Apprehension Rates, FY 2000 – FY 2017
Model-based Apprehension
Rate (%)
Observational Apprehension
Rate (%)
FY 2000 42.5 NA FY 2001 41.1 NA FY 2002 35.7 NA FY 2003 32.5 NA FY 2004 36.0 NA FY 2005 35.8 NA FY 2006 37.5 63.5 FY 2007 38.6 64.1 FY 2008 40.9 67.7 FY 2009 43.7 70.7 FY 2010 44.2 74.4 FY 2011 41.6 79.4 FY 2012 43.8 77.5 FY 2013 50.8 70.8 FY 2014 64.0 74.8 FY 2015 67.7 76.7 FY 2016 73.4 79.4 FY 2017 65.4 74.5
Note: Model-based apprehension rate estimates for FY 2000-FY 2016 update previously reported estimates; see Appendix A for details.
The model-based apprehension rate has climbed from 43 percent in FY 2000 and a low point of 33 percent in FY 2003 to 73 percent in FY 2016 before falling back to 65 percent in FY 2017. Increases in the model-based apprehension rate have been sharpest since FY 2012, reflecting increases in the estimated apprehension rate for impactable border crossers (i.e., the PAR) during this period as well as an increase in the share of border crossers who are non-impactable and therefore assumed to be apprehended 100 percent of the time.
The observational apprehension rate has also shown improvements since FY 2006. Despite its limitations, the upward trend in ARObservational is noteworthy because it independently reinforces the upward trend observed in the model-based estimate. Moreover, with increasing situational awareness along the border during this period, it is

11
likely that CBP detects an increasing share of total got aways over time, as noted above. As a result, the upward trend in ARObservational likely under-estimates the actual increase in the total share of attempted border crossers that is apprehended.
§ 1092(b)(1)(A)(ii) Detected unlawful entries
Definition
Detected unlawful entries – The total number of attempted unlawful border crossers between land POEs who are directly or indirectly observed or detected by USBP.
Detected unlawful entries is an outcome measure that describes the numbers of migrants detected crossing or attempting to cross the border unlawfully. Detected unlawful entries is not a comprehensive outcome measure since it excludes undetected unlawful entries, as discussed below. The ratio of detected to undetected unlawful entries, also discussed below, is an output measure that describes the Department’s ability to detect unlawful entries.
Methodology and Limitations
The number of detected unlawful entries is calculated as the sum of turn backs, got aways, and apprehensions. Turn backs are defined as subjects who, after making an illegal entry into the United States, return to the country from which they entered, not resulting in an apprehension or got away. Got aways are defined as subjects who, after making an illegal entry, are not turned back or apprehended, and are no longer being actively pursued by USBP agents. Apprehensions are defined as removable aliens arrested by USBP.
Turn backs and got aways are observational estimates; USBP records total and by-sector estimates of turn backs and got aways based on direct and indirect observations as described above. Apprehensions are calculated based on nationwide DHS administrative data and are not limited to the southwest border; USBP apprehension data are considered a reliable count of apprehensions.
The primary limitation to detected unlawful entries is that this metric incorporates turn back and got away estimates that aggregate potentially subjective observations from thousands of individual agents. USBP has taken a number of steps to address this problem by establishing consistent and reliable turn back and got away methodologies, as discussed above.

12
Available Data and Discussion
Figure 1: Estimated Detected Unlawful Entries Nationwide Between POEs, FY 2006 – FY 2017
Figure 1 depicts available data on estimated detected unlawful entries for FY 2006 – FY 2017, the years for which data are available. As the figure indicates, estimated detected unlawful entries (the sum of apprehensions, turn backs, and got aways) fell from 2.0 million to roughly 500 thousand during this period, a 75 percent decrease.
0
500,000
1,000,000
1,500,000
2,000,000
2,500,000
2006 2007 2008 2009 2010 2011 2012 2013 2014 2015 2016 2017

13
§ 1092(b)(1)(A)(iii) Estimated undetected unlawful entries
Definition
Undetected unlawful entries – An estimate of the number of attempted unlawful border crossers between land POEs who are not directly or indirectly observed or detected by USBP. By assumption, undetected unlawful entries evade apprehension and enter the United States unlawfully.
Undetected unlawful entries is an outcome measure that describe the numbers of migrants who completely evade detection and successfully enter the United States unlawfully. Undetected unlawful entries is not a comprehensive outcome measure since it excludes detected unlawful entries, discussed above. The ratio of detected to total unlawful entries (i.e., the probability of detection) is an output measure that describes the Department’s ability to detect unlawful entries, as discussed below. At present, this methodology only exists for the southwest land border between ports of entry. Research is underway on methods to produce this estimate for the northern border.
Methodology and Limitations
Currently, the Department’s best available methodology for estimating undetected unlawful entries builds on the repeated trials model (RTM) methodology to produce a model-based estimate of total successful unlawful entries. The estimated number of undetected unlawful entries is calculated as the difference between the model-based estimate of total successful unlawful entries and the estimated number of got aways (i.e., detected successful unlawful entries):
𝑈𝑈𝑒𝑒𝑈𝑈𝐴𝐴𝑟𝑟𝐴𝐴𝑈𝑈𝑟𝑟𝐴𝐴𝑈𝑈 𝑈𝑈𝑒𝑒𝑈𝑈𝑟𝑟𝑈𝑈𝑈𝑈𝑈𝑈𝑈𝑈 𝐸𝐸𝑒𝑒𝑟𝑟𝐴𝐴𝑒𝑒𝐴𝐴𝑒𝑒 = 𝑇𝑇𝑒𝑒𝑟𝑟𝑟𝑟𝑈𝑈 𝑆𝑆𝑈𝑈𝑈𝑈𝑈𝑈𝐴𝐴𝑒𝑒𝑒𝑒𝑈𝑈𝑈𝑈𝑈𝑈 𝑈𝑈𝑒𝑒𝑈𝑈𝑟𝑟𝑈𝑈𝑈𝑈𝑈𝑈𝑈𝑈 𝐸𝐸𝑒𝑒𝑟𝑟𝐴𝐴𝑒𝑒𝐴𝐴𝑒𝑒 − 𝐷𝐷𝐴𝐴𝑟𝑟𝐴𝐴𝑈𝑈𝑟𝑟𝐴𝐴𝑈𝑈 𝐺𝐺𝑒𝑒𝑟𝑟 𝐴𝐴𝑈𝑈𝑟𝑟𝑒𝑒𝑒𝑒
As explained in detail in Appendix A, the RTM methodology yields an estimated partial apprehension rate (PAR) for southwest border crossers. Note that this year’s Border Security Metrics Report includes updates to certain datasets used to calculate the PAR (see Appendix A). Following the calculation of the PAR, the methodology for estimating total successful unlawful entries consists of three additional steps.
First, as in the calculation of the model-based apprehension rate discussed above, all attempted unlawful border crossers are divided into “impactable” and “non-impactable” groups. Second, based on the assumption that impactable aliens apprehended at the same rate as RTM aliens included in the PAR analysis, the PAR is used to estimate the odds of successful entry for aliens within the impactable population group.2 Third, the number of successful unlawful entries is estimated based on the number of impactable aliens apprehended times the odds of successful entry among this group. Because non-impactable aliens are assumed to be apprehended 100 percent of the time—i.e., so none of them successfully enter without being apprehended--only impactable aliens contribute to the estimated count of successful unlawful entries:
𝑇𝑇𝑒𝑒𝑟𝑟𝑟𝑟𝑈𝑈 𝑒𝑒𝑈𝑈𝑈𝑈𝑈𝑈𝐴𝐴𝑒𝑒𝑒𝑒𝑈𝑈𝑈𝑈𝑈𝑈 𝑈𝑈𝑒𝑒𝑈𝑈𝑟𝑟𝑈𝑈𝑈𝑈𝑈𝑈𝑈𝑈 𝐴𝐴𝑒𝑒𝑟𝑟𝐴𝐴𝑒𝑒𝐴𝐴𝑒𝑒= 𝐴𝐴𝐴𝐴𝐴𝐴𝐴𝐴𝐴𝐴ℎ𝐴𝐴𝑒𝑒𝑒𝑒𝑒𝑒𝑒𝑒𝑒𝑒𝑒𝑒 𝑒𝑒𝑈𝑈 𝑒𝑒𝑎𝑎𝐴𝐴𝑟𝑟𝑈𝑈𝑟𝑟𝑟𝑟𝑖𝑖𝑈𝑈𝐴𝐴 𝑟𝑟𝑈𝑈𝑒𝑒𝐴𝐴𝑒𝑒𝑒𝑒 ∗ 𝑂𝑂𝑈𝑈𝑈𝑈𝑒𝑒 𝑒𝑒𝑈𝑈 𝑒𝑒𝑈𝑈𝑈𝑈𝑈𝑈𝐴𝐴𝑒𝑒𝑒𝑒𝑈𝑈𝑈𝑈𝑈𝑈 𝐴𝐴𝑒𝑒𝑟𝑟𝐴𝐴𝑒𝑒
The estimated number of undetected unlawful entries is derived from the observational estimate of detected unlawful entries, with limitations discussed above, and the model-based estimate of total successful unlawful entries, which in turn is derived from the RTM methodology and the model-based apprehension rate, with additional limitations discussed above. DHS continues to refine both the observational and model-based methodologies.
2 Mathematically, odds of successful entry = .

14
Available Data and Discussion
Figure 2: Estimated Southwest Border Undetected Unlawful Entries, FY 2006 – FY 2017
Note: Data for FY 2006 – FY 2016 update previously reported estimates; see Appendix A for details.
Figure 2 depicts available data on estimated undetected unlawful entries. As the figure indicates, estimated undetected unlawful entries fell from over one million in FY 2006 to fewer than 57,000 in FY 2017, a 95 percent decrease.
0
200,000
400,000
600,000
800,000
1,000,000
1,200,000
1,400,000
2006 2007 2008 2009 2010 2011 2012 2013 2014 2015 2016 2017

15
§ 1092(b)(1)(A)(iv) Turn backs
Definition
Turn backs – An estimate of the number of subjects who, after making an illegal entry into the United States, return to the country from which they entered, not resulting in an apprehension or got away.
Turn backs are an activity measure that USBP uses for tactical decision-making.
Turn backs also contribute to several other border security metrics, including Detected Unlawful Entries, discussed above, and the Unlawful Border Crossing Effectiveness Rate, discussed below.
Methodology and Limitations
Turn backs are a nationwide observational estimate; USBP records total and by-sector estimates of turn backs based on direct and indirect observations as described above.
The primary limitation to detected turn backs is that the estimate aggregates potentially subjective observations from thousands of individual agents. USBP has taken a number of steps to address this problem by establishing consistent and reliable turn back and got away methodologies, as discussed above. In addition, some unlawful border crossers may enter the United States to drop off drug loads or to act as decoys to lure agents away from a certain area and then return to Mexico, and therefore may be misidentified as turn backs.3
Available Data and Discussion
Table 2: Southwest Border Turn Backs between POEs, FY 2007 – FY 2017
FY2007 FY2008 FY2009 FY2010 FY2011 FY2012 FY2013 FY2014 FY2015 FY2016 FY2017 254,490 204,176 178,566 150,005 121,007 121,079 156,433 147,025 105,670 108,601 91,998
The number of turn backs has decreased by more than 63 percent since FY 2007. This decrease is consistent with numerous other between-POE metrics that suggest a decrease in flow over the past 10 years.
3 U.S. Government Accountability Office, “Border Patrol: Goals and Measures Not Yet in Place to Inform Border Security Status and Resource Needs,” GAO-13-330T, February 26, 2013, p. 15.

16
§ 1092(b)(1)(A)(v) Got aways
Definition
Got aways – An estimate of the number of subjects who, after making an illegal entry, are not turned back or apprehended, and are no longer being actively pursued by USBP agents.
Total Successful Unlawful Entries – An estimate of the total number of subjects who cross the border unlawfully and who enter the United States without being apprehended.
Methodology and Limitations
Got Aways
Got aways are an observational estimate; USBP records total and by-sector estimates of got aways based on direct and indirect observations as described above. While got aways are recorded by USBP at all borders, got aways in this section refer to the southwest border between-ports of entry only.
The primary methodological limitation of got aways is that the estimate aggregates potentially subjective observations from thousands of individual agents. USBP has taken a number of steps to address this problem by establishing consistent and reliable turn back and got away methodologies, as discussed above.
Conceptually, the got aways metric is limited to observed (directly or indirectly) flows; it is not a comprehensive measure of successful unlawful entries. USBP’s recent work to increase situational awareness, including through the use of Geospatial Intelligence, gives the Department growing confidence in its got away count. As situational awareness continues to improve, observed got aways will become an increasingly comprehensive measure of successful unlawful entries. USBP and DHS are working to refine USBP’s observational methodology and to more precisely describe the gap between observed and unobserved got aways.
Total Successful Unlawful Entries
The current methodology for estimating total successful unlawful entries is based on the repeated trials model (RTM) methodology. As explained in detail in Appendix A, the RTM methodology yields an estimated partial apprehension rate (PAR) for southwest border crossings, which focuses on a relatively small share of attempted unlawful border crossers. Following the calculation of the PAR, the methodology for estimating total successful unlawful entries consists of three additional steps, as described above: attempted border crossers are divided into impactable and non-impactable groups; the PAR is used to estimate the odds of successful entry; and the number of successful unlawful entries is estimated based on the odds of successful entry among this group times the number of apprehensions of impactable aliens.
The RTM methodology to estimate the PAR confronts a number of methodological limitations, as discussed in Appendix A. Each of the additional assumptions involved in using the PAR to estimate total successful unlawful entries introduces additional methodological limitations and potential biases. DHS is working to refine the model-based methodology and to more precisely describe the impact of these limitations on estimates of total successful unlawful entries.

17
Available Data and Discussion
Figure 3: Southwest Border Got Aways and Estimated Total Successful Unlawful Entries between POEs, FY 2000 – FY 2017
Note: Data for Estimated Total Successful Unlawful Entries for FY 2000 – FY 2016 update previously reported estimates; see Appendix A for details.
Figure 3 depicts southwest border between-ports of entry detected got aways for FY 2006 – FY 2017 and estimated total successful unlawful entries for FY 2000 – FY 2017, the years for which data are available. As the figure illustrates, estimated total successful unlawful entries declined from over 2.1 million to 160 thousand between FY 2000 and FY 2017, a 92 percent decrease. Estimated got aways declined from 615 thousand to 104 thousand between FY 2006 and FY 2017, an 83 percent decrease.
Notably, the model-based estimate of total successful unlawful entries declined at a faster rate than observed got aways, with the model based estimate falling 91 percent between FY 2006 and FY 2017 (the period for which both data series are available), versus an 83 percent decrease for detected got aways during this period. Relatedly, the two series have substantially converged over this time period, with observed got aways accounting for 42 percent of total estimated successful unlawful entries in FY 2006 versus 65 percent in FY 2017. These facts suggest that USBP detects an increasingly comprehensive share of all attempted unlawful border crossers.
-
250,000
500,000
750,000
1,000,000
1,250,000
1,500,000
1,750,000
2,000,000
2,250,000
2,500,000
Estimated Total Successful Unlawful Entries Detected Got Aways

18
§ 1092(b)(1)(B) A measurement of situational awareness achieved in each U.S. Border Patrol sector
Definition
Situational awareness – Knowledge and understanding of current unlawful cross-border activity.
Situational awareness is an output measure that describes the Department’s awareness of unlawful cross-border activity.
Methodology and Limitations
DHS is in the process of developing a defensible, analytically sound measure for situational awareness for each USBP sector that meets the intent of the NDAA § 1092(b)(1)(B). DHS anticipates this measure will be reported in the annual report due to Congress in November 2020. In the interim, a number of the Department’s existing metrics are informed by the Department’s awareness of migrants and other threats in the near border regions (CBP has operational jurisdiction within 100 miles of U.S. borders) and in the approaches [See § 1092(b)(1)(A)(ii to v) and § 1092(b)(1)(D)].
§ 1092(b)(1)(C) Unlawful border crossing effectiveness rate
Definition
Unlawful border crossing effectiveness rate – The estimated percentage of all attempted unlawful border crossers that is interdicted by USBP, where interdictions include apprehensions and turn backs.
The unlawful border crossing effectiveness rate is an output measure that describes how difficult it is for unlawful border crossers to enter the United States without being interdicted.
Methodology and Limitations
The unlawful border crossing effectiveness rate is calculated by dividing the number of apprehensions and turn backs between land POEs by the sum of the number of apprehensions, turn backs, and total estimated successful unlawful entries:
𝐸𝐸𝑈𝑈𝑈𝑈𝐴𝐴𝑈𝑈𝑟𝑟𝑒𝑒𝐸𝐸𝐴𝐴𝑒𝑒𝐴𝐴𝑒𝑒𝑒𝑒 𝑃𝑃𝑟𝑟𝑟𝑟𝐴𝐴 = 𝐴𝐴𝐴𝐴𝐴𝐴𝐴𝐴𝐴𝐴ℎ𝐴𝐴𝑒𝑒𝑒𝑒𝑒𝑒𝑒𝑒𝑒𝑒𝑒𝑒 + 𝑇𝑇𝑈𝑈𝐴𝐴𝑒𝑒 𝑖𝑖𝑟𝑟𝑈𝑈𝑏𝑏𝑒𝑒
𝐴𝐴𝐴𝐴𝐴𝐴𝐴𝐴𝐴𝐴ℎ𝐴𝐴𝑒𝑒𝑒𝑒𝑒𝑒𝑒𝑒𝑒𝑒𝑒𝑒 + 𝑇𝑇𝑈𝑈𝐴𝐴𝑒𝑒 𝑖𝑖𝑟𝑟𝑈𝑈𝑏𝑏𝑒𝑒 + 𝑆𝑆𝑈𝑈𝑈𝑈𝑈𝑈𝐴𝐴𝑒𝑒𝑒𝑒𝑈𝑈𝑈𝑈𝑈𝑈 𝑈𝑈𝑒𝑒𝑈𝑈𝑟𝑟𝑈𝑈𝑈𝑈𝑈𝑈𝑈𝑈 𝐴𝐴𝑒𝑒𝑟𝑟𝐴𝐴𝑒𝑒𝐴𝐴𝑒𝑒
The NDAA calls for an effectiveness rate that incorporates USBP’s observational estimate of turn backs and DHS’s current model-based estimate of total estimated successful unlawful entries. This measure would confront all of the methodological challenges associated with each of its component parts, as discussed above.
The Unlawful Border Crossing Effectiveness Rate is conceptually similar to USBP’s Interdiction Effectiveness Rate (IER), which USBP reports in its Annual Performance Report pursuant to the Government Performance and Results Modernization Act (GPRMA) of 2010. The Unlawful Border Crossing Effectiveness Rate differs from the IER in that the former includes total estimated successful unlawful entries in its denominator and IER includes known got aways.

19
The Unlawful Border Crossing Effectiveness Rate is also conceptually similar to the estimated apprehension rate, with the difference being that the Effectiveness Rate includes data on turn backs and apprehensions while the apprehension rate focuses exclusively on apprehensions. An advantage to examining the effectiveness rate, rather than the apprehension rate, is that effectiveness rate more completely captures USBP’s actual enforcement practices, which include efforts to turn back border crossers, in addition to efforts to apprehend them. On the other hand, some analysts consider the effectiveness rate (along with IER) to be an ambiguous indicator of enforcement success since an unknown share of turn backs make additional entry attempts.
Despite its shortcomings as an analytic tool, to date, only the IER is available for analysis at the sector level. While a southwest border-wide estimate has been developed for the Model-Based Apprehension Rate, sector-level estimates of unlawful entries and attempts for this metric have not yet been produced and validated by DHS. These sector level estimates are being evaluated for inclusion in future reports.
Available Data and Discussion
Table 3: Interdiction Effectiveness Rate by Southwest Border Sector, FY 2014 – FY 2017
Big Bend,
TX
Del Rio, TX
EL Centro,
CA
EL Paso, TX
Laredo, TX
Rio Grande Valley,
TX
San Diego,
CA
Tucson, AZ
Yuma, AZ
FY2014 72% 76% 85% 92% 74% 80% 89% 75% 91% FY2015 77% 73% 83% 90% 74% 82% 88% 80% 95% FY2016 70% 79% 81% 89% 78% 83% 89% 82% 96% FY2017 67% 72% 81% 91% 72% 80% 87% 71% 96%
Most sectors saw decreases in IER during FY 2017 with the exception of El Paso (two percent increase), and Yuma, which held constant at 96 percent. Tucson reported the largest loss in FY 2017, decreasing by 11 percentage points to 71 percent. On the Northern Border, the concern of physical security of the immediate border does not focus on the apprehension rate of illegal entrants, since the number of such attempted and successful entries is small.
§ 1092(b)(1)(D) Probability of detection rate
Definition
Estimated probability of detection - The estimated probability that DHS detects attempted unlawful border crossers between land POEs.
The estimated probability of detection is an output measure that describes the ability of attempted unlawful border crossers to enter without being detected. Because successful unlawful entry estimates are available only for the southwest border between-ports of entry, data in this section refer exclusively to this region.
Methodology and Limitations
The estimated probability of detection is defined as the ratio of detected unlawful entries to estimated total unlawful entries:
𝑃𝑃𝐴𝐴𝑒𝑒𝑖𝑖𝑟𝑟𝑖𝑖𝑒𝑒𝑈𝑈𝑒𝑒𝑟𝑟𝑒𝑒 𝑒𝑒𝑈𝑈 𝐷𝐷𝐴𝐴𝑟𝑟𝐴𝐴𝑈𝑈𝑟𝑟𝑒𝑒𝑒𝑒𝑒𝑒 = 𝐷𝐷𝐴𝐴𝑟𝑟𝐴𝐴𝑈𝑈𝑟𝑟𝐴𝐴𝑈𝑈 𝑈𝑈𝑒𝑒𝑈𝑈𝑟𝑟𝑈𝑈𝑈𝑈𝑈𝑈𝑈𝑈 𝐴𝐴𝑒𝑒𝑟𝑟𝐴𝐴𝑒𝑒𝐴𝐴𝑒𝑒
𝐸𝐸𝑒𝑒𝑟𝑟𝑒𝑒𝑎𝑎𝑟𝑟𝑟𝑟𝐴𝐴𝑈𝑈 𝑟𝑟𝑒𝑒𝑟𝑟𝑟𝑟𝑈𝑈 𝑈𝑈𝑒𝑒𝑈𝑈𝑟𝑟𝑈𝑈𝑈𝑈𝑈𝑈𝑈𝑈 𝐴𝐴𝑒𝑒𝑟𝑟𝐴𝐴𝑒𝑒𝐴𝐴𝑒𝑒

20
As described above, the number of detected unlawful entries is calculated as the sum of turn backs, got aways, and apprehensions, a mix of observational estimates and administrative data. The primary limitation to detected unlawful entries is that this metric incorporates turn back and got away estimates that aggregate potentially subjective observations from thousands of individual agents. USBP has taken a number of steps to address this problem by establishing consistent and reliable turn back and got away methodologies, as discussed above.
Estimated total unlawful entries is calculated as the sum of turn backs, apprehensions, and the model-based estimate of total successful unlawful entries. As described above, the methodology for estimating total successful unlawful entries begins with the RTM methodology’s partial apprehension rate, discussed in detail in Appendix A. Following the calculation of the PAR, the methodology for estimating total successful unlawful entries consists of three additional steps: attempted border crossers are divided into impactable and non-impactable groups; the PAR is used to estimate the odds of successful entry; and the number of successful unlawful entries is estimated based on the odds of successful entry among this group times the apprehension count among impactable aliens.
The RTM methodology to estimate the PAR confronts a number of methodological limitations, as discussed in Appendix A. Each of the additional assumptions involved in using the PAR to estimate total successful unlawful entries introduces additional methodological limitations and potential biases. DHS is working to refine the model-based methodology and to more precisely describe the impact of these limitations on estimates of total successful unlawful entries in future Border Security Metrics reports.
Available Data and Discussion
Figure 4: Southwest Border Between-Ports of Entry Estimated Probability of Detection, FY 2006 – FY 2017
Note: Data for Estimated Total Successful Unlawful Entries for FY 2000 – FY 2016 update previously reported estimates; see Appendix A for details.
Figure 4 depicts the estimated probability of detection for FY 2006 – FY 2017, the years for which data are available. As the figure indicates, the estimated probability increased from 63 percent in FY 2006 (when an estimated 2.0 million unlawful border crossers were detected out of an estimated 3.2 million total unlawful border crossers) to 89 percent in FY 2017 (500 thousand detected out of 557 thousand total estimated unlawful border crossers).
0
0.1
0.2
0.3
0.4
0.5
0.6
0.7
0.8
0.9
1
2006 2007 2008 2009 2010 2011 2012 2013 2014 2015 2016 2017
Prob
abili
ty o
f Det
ectio
n
Year

21
§ 1092(b)(1)(E) Apprehensions in Each U.S Border Patrol Sector
Definition
Apprehension - The arrest of a removable alien by DHS USBP.
Apprehensions are activity measures that provide information used for program planning and operational purposes, among other uses. Historically, the Department has also used apprehensions as a proxy indicator of illegal entries, an outcome measure.
For many years, DHS and the legacy Immigration and Naturalization Service also used apprehensions as a proxy indicator of successful unlawful border crossings, i.e., an outcome measure. Over the long-term and across multiple locations, apprehensions are a problematic indicator of enforcement outcomes since the relationship between apprehensions and successful unlawful entries depends on the apprehension rate, which changes over time and may also differ by location. But in the short-term and in a fixed geographic area, DHS continues to view changes in apprehensions as a useful outcome indicator because short term changes in apprehensions are more likely to be driven by changes in the number of unlawful border crossing attempts than by changes in the apprehension rate.
Methodology and Limitations
Apprehensions are recorded in administrative record systems with a unique identifier created for each apprehension. USBP’s count of apprehensions is considered reliable.
Apprehensions displayed below are event counts, meaning each apprehension of the same alien in a fiscal year is counted separately. These data do not represent a count of unique aliens apprehended.
Available Data and Discussion
Table 4a: Southwest Border Apprehensions by USBP sector, FY 2007 – FY 2017
Big
Bend, TX
Del Rio, TX
EL Centro,
CA
EL Paso, TX
Laredo, TX
Rio Grande Valley,
TX
San Diego,
CA
Tucson, AZ
Yuma, AZ Total
FY2007 5,536 22,920 55,883 75,464 56,714 73,430 152,460 378,239 37,992 858,638 FY2008 5,391 20,761 40,961 30,312 43,668 75,473 162,390 317,696 8,363 705,015 FY2009 6,360 17,082 33,521 14,999 40,569 60,989 118,721 241,673 6,951 540,865 FY2010 5,288 14,694 32,562 12,251 35,287 59,766 68,565 212,202 7,116 447,731 FY2011 4,036 16,144 30,191 10,345 36,053 59,243 42,447 123,285 5,833 327,577 FY2012 3,964 21,720 23,916 9,678 44,872 97,762 28,461 120,000 6,500 356,873 FY2013 3,684 23,510 16,306 11,154 50,749 154,453 27,496 120,939 6,106 414,397 FY2014 4,096 24,255 14,511 12,339 44,049 256,393 29,911 87,915 5,902 479,371 FY2015 5,031 19,013 12,820 14,495 35,888 147,257 26,290 63,397 7,142 331,333 FY2016 6,366 23,078 19,448 25,634 36,562 186,830 31,891 64,891 14,170 408,970 FY2017 6,002 13,476 18,633 25,193 25,460 137,562 26,086 38,657 12,847 303,916
Total southwest border apprehensions fell by over 25 percent between FY 2016 and FY 2017. Since FY 2013, the Rio Grande Valley (RGV) sector has displaced the Tucson sector as the leader in apprehensions, with roughly 100 thousand more apprehensions than the next leading sector in FY 2017. Apprehensions were down

22
across the board in FY 2017, with each sector reporting decreases. The largest numeric decrease was in the Rio Grande Valley Sector (RGV) with roughly 50,000 fewer apprehensions in FY 2017 than in FY 2016, while the largest percentage decrease was in Tucson, where apprehensions fell by 40 percent. Tucson and San Diego, historically major sectors for apprehensions, continue to report considerably lower numbers than those seen a decade earlier, with Tucson reporting 38,657 apprehensions in FY 2017, as compared to 378,239 in FY 2007 (a 90 percent decrease).
Table 4b: Northern Border Apprehensions by USBP sector, FY 2017
Blaine, WA
Buffalo, NY
Detroit, MI
Grand Forks,
ND
Houlton, ME
Havre, MT
Spokane, WA
Swanton, VT Total
FY2017 288 447 1,070 496 30 39 208 449 3,027
Northern border apprehensions represented about one percent of total USBP apprehensions in FY 2017. Detroit was the leading northern border sector with 1,070 aliens apprehended – more than double the next leading sector, Grand Forks (496 apprehensions). Houlton reported the fewest apprehensions in FY 2017 (30).
Table 4c: Coastal Border Apprehensions by USBP sector, FY 2017
Miami, FL
New Orleans,
LA
Ramey, PR Total
FY2017 2,280 920 388 3,588
Coastal border apprehensions also represented about one percent of total USBP apprehensions in FY 2017. Of the 3,588 coastal apprehensions, more than 63 percent occurred in the Miami sector (2,280). Ramey reported the fewest apprehensions in FY 2017 (388).
§ 1092(b)(1)(F) Apprehensions of unaccompanied alien children
Definition
Unaccompanied alien child (UAC) - one who has no lawful immigration status in the United States; has not attained 18 years of age, and with respect to whom; 1) there is no parent or legal guardian in the United States; or 2) no parent or legal guardian in the United States is available to provide care and physical custody [6 U.S.C. § 279(g)(2)].
UAC apprehensions are an activity measure that provide information used for program planning and operational purposes, among other uses. Historically, the Department has also used apprehensions as a proxy indicator of illegal entries, an outcome measure.
Methodology and Limitations
Apprehensions are recorded in administrative record systems with a unique identifier created for each apprehension. Since 2008, USBP systems have included a flag for children who are found to meet the legal definition of a UAC. USBP’s count of apprehensions is considered reliable, but some outside analysts have raised questions about agents’ ability to reliably distinguish among older children and young adults (e.g., to

23
distinguish between 17 and 18 year-olds) and to confirm whether children are traveling alone or in family groups.4
USBP began collecting data on UACs apprehended between ports of entry in FY 2008; data are unavailable for earlier years.
Data and Discussion
Tables 5a – 5d provide counts of UAC apprehensions by citizenship and by USBP sector for FY 2008 through FY 2017, the years for which data are available.
Table 5a: Total Southwest Border Apprehensions of UACs, FY 2008 – FY 2017
Big
Bend, TX
Del Rio, TX
EL Centro,
CA
EL Paso, TX
Laredo, TX
Rio Grande Valley,
TX
San Diego,
CA
Tucson, AZ
Yuma, AZ Total
FY2008 84 834 337 1,139 799 2,523 888 1,271 47 7,922 FY2009 147 1,085 673 889 1,901 3,835 3,028 7,606 276 19,440 FY2010 197 1,014 448 1,011 1,570 4,977 980 7,998 216 18,411 FY2011 189 1,113 457 697 1,608 5,236 549 5,878 222 15,949 FY2012 168 1,618 498 659 2,658 10,759 524 7,239 280 24,403 FY2013 125 2,135 434 744 3,795 21,553 656 9,070 247 38,759 FY2014 256 3,268 662 1,029 3,800 49,959 954 8,262 351 68,541 FY2015 839 2,285 668 1,662 2,459 23,864 1,084 6,019 1,090 39,970 FY2016 951 2,689 1,379 3,885 2,953 36,714 1,553 6,302 3,266 59,692 FY2017 811 1,349 1,531 3,926 2,033 23,708 1,551 3,659 2,867 41,435
Table 5b: Southwest Border Apprehensions of UACs from Mexico, FY 2008 – FY 2017
Big
Bend, TX
Del Rio, TX
EL Centro,
CA
EL Paso, TX
Laredo, TX
Rio Grande Valley,
TX
San Diego,
CA
Tucson, AZ
Yuma, AZ Total
FY2008 59 396 306 1,067 118 365 879 79 33 3,302 FY2009 127 851 631 841 1,308 2,401 2,990 6,582 258 15,989 FY2010 180 772 404 947 886 2,787 950 6,485 204 13,615 FY2011 183 801 427 663 1,022 3,009 523 4,893 192 11,713 FY2012 137 911 418 616 1,369 4,361 480 5,405 246 13,943 FY2013 104 1,082 328 654 1,652 6,366 598 6,241 194 17,219 FY2014 102 821 278 698 1,354 7,081 740 4,394 166 15,634 FY2015 73 798 397 823 1,299 3,243 823 3,412 144 11,012 FY2016 118 867 610 1,149 1,515 3,389 851 3,293 134 11,926 FY2017 166 512 688 768 1,112 2,791 702 2,004 134 8,877
4 OIG-10-12 Department of Homeland Security Office of Inspector General. Age Determination Practices for Unaccompanied Alien Children in ICE Custody. November 2009

24
Table 5c: Southwest Border Apprehensions of UACs from Northern Triangle Countries, FY 2008 – FY 2017
Big
Bend, TX
Del Rio, TX
EL Centro,
CA
EL Paso, TX
Laredo, TX
Rio Grande Valley,
TX
San Diego,
CA
Tucson, AZ
Yuma, AZ Total
FY2008 23 423 28 65 627 2,051 9 1,091 14 4,331 FY2009 19 229 42 46 523 1,389 37 938 15 3,238 FY2010 16 238 42 58 598 2,057 28 1,326 8 4,371 FY2011 6 307 29 32 528 2,030 25 927 28 3,912 FY2012 29 701 70 40 1,228 6,229 44 1,753 34 10,128 FY2013 18 1,044 104 80 2,028 14,696 48 2,731 36 20,785 FY2014 151 2,422 379 290 2,329 42,020 209 3,727 178 51,705 FY2015 760 1,479 269 824 1,113 20,260 255 2,497 930 28,387 FY2016 824 1,806 641 2,685 1,382 32,935 625 2,904 3,091 46,893 FY2017 633 821 667 3,093 858 20,620 701 1,639 2,722 31,754
Note: Northern Triangle Countries refers to El Salvador, Guatemala, and Honduras.
Table 5d: Southwest Border Apprehensions of UACs from All Other Countries, FY 2008 – FY 2017
Big
Bend, TX
Del Rio, TX
EL Centro,
CA
EL Paso, TX
Laredo, TX
Rio Grande Valley,
TX
San Diego,
CA
Tucson, AZ
Yuma, AZ Total
FY2008 2 15 3 7 54 107 0 101 0 289 FY2009 1 5 0 2 70 45 1 86 3 213 FY2010 1 4 2 6 86 133 2 187 4 425 FY2011 0 5 1 2 58 199 1 58 2 326 FY2012 2 6 10 5 61 169 0 82 0 335 FY2013 3 9 2 10 115 491 10 98 17 755 FY2014 3 25 5 41 117 858 5 141 7 1,202 FY2015 6 8 2 15 47 361 6 110 16 571 FY2016 9 16 128 51 56 390 77 105 41 873 FY2017 12 16 176 65 63 297 148 16 11 804
After averaging 15,000 per year from FY 2008 – FY 2011, UAC apprehensions along the southwest border increased an average of more than 60 percent per year in FY 2012 – FY 2014, peaking at 68,541 in FY 2014. UAC numbers returned to their FY 2013 level in FY 2015, but climbed again in FY 2016 to 59,692. In FY 2017, UACs nearly returned to 2014 levels with 41,435 apprehensions across the southwest border. As in previous years, more than half of all UACs were reported in RGV (23,708), most of whom were from the Northern Triangle countries of Honduras, Guatemala, and El Salvador (20,620). Despite the overall decrease in UACs, El Paso and El Centro sectors reported an increase in UAC apprehensions as compared to FY 2016.
While apprehensions of UACs from countries other than Mexico and the Northern Triangle represented a small portion of total UAC apprehensions, new trends have emerged in the past couple of years that represent a shift in the movements of these UACs. Recently, the majority of these UACs were apprehended in Tucson and RGV sector; however, both sectors have reported a decline in UACs in FY 2017, with Tucson dropping from 105 in

25
FY 2016 to only 16 in FY 2017. Conversely, El Centro and San Diego have reported large increases in UAC apprehensions, with El Centro jumping from two UAC apprehensions in FY 2015 to 128 in FY 2016 and 176 in FY 2017, and San Diego rising from six total UAC apprehensions in FY 2015 to 77 in FY 2016 and 148 in FY 2017. The leading countries of citizenship of UACs from countries other than Mexico and the Northern Triangle were India (234), Nicaragua (182), and Bangladesh (132).
The vast majority of UAC apprehensions in FY 2017 occurred along the southwest border. A total of only 46 UACs were apprehended across the northern border, while 65 were apprehended along the coastal borders.
§ 1092(b)(1)(G) Apprehensions of family units
Definition
Family unit - the number of individuals apprehended in a group consisting of a minor with his or her adult parent or legal guardian by the USBP. For example, a mother and child apprehended together are counted as two family units.
Family unit apprehensions (FMUA) are activity measures that provide information used for program planning and operational purposes, among other uses. Historically, the Department has also used apprehensions as a proxy indicator of illegal entries, an outcome measure.
Methodology and Limitations
Apprehensions are recorded in administrative record systems with a unique identifier created for each apprehension. USBP’s count of apprehensions is considered reliable, but agents may not always be able to reliably identify family units.
USBP began collecting data on family units apprehended between POEs in FY 2012; data on FMUA are unavailable for earlier years.
Data and Discussion
Table 6a: Total Southwest Border Apprehensions of FMUAs, FY 2012 – FY 2017
Big
Bend, TX
Del Rio, TX
EL Centro,
CA
EL Paso, TX
Laredo, TX
Rio Grande Valley,
TX
San Diego,
CA
Tucson, AZ
Yuma, AZ Total
FY2012 76 349 1,127 265 1,825 2,625 1,373 3,254 222 11,116 FY2013 102 711 365 298 1,688 7,265 1,576 2,630 220 14,855
FY2014 176 4,950 630 562 3,591 52,326 1,723 3,812 675 68,445
FY2015 807 2,141 675 1,220 1,372 27,409 1,550 2,930 1,734 39,838
FY2016 1,051 3,549 1,593 5,664 1,640 52,006 2,863 3,139 6,169 77,674
FY2017 941 2,453 1,798 8,609 865 49,896 2,944 2,042 6,074 75,622

26
Table 6b: Southwest Border Apprehensions of FMUAs from Mexico, FY 2012 – FY 2017
Big
Bend, TX
Del Rio, TX
EL Centro,
CA
EL Paso, TX
Laredo, TX
Rio Grande Valley,
TX
San Diego,
CA
Tucson, AZ
Yuma, AZ Total
FY2012 56 218 699 241 1,623 1,555 1,325 2,940 194 8,851
FY2013 90 177 294 267 1,116 1,690 1,343 2,216 163 7,356
FY2014 61 141 260 213 779 1,832 1,213 1,057 83 5,639
FY2015 40 174 196 188 713 1,326 854 696 89 4,276
FY2016 38 229 163 224 518 1,392 346 487 84 3,481
FY2017 37 118 158 213 363 815 257 256 54 2,271
Table 6c: Southwest Border Apprehensions of FMUAs from Northern Triangle Countries, FY 2012 – FY 2017
Big
Bend, TX
Del Rio, TX
EL Centro,
CA
EL Paso, TX
Laredo, TX
Rio Grande Valley,
TX
San Diego,
CA
Tucson, AZ
Yuma, AZ Total
FY2012 10 120 12 19 175 989 31 130 3 1,489
FY2013 8 522 40 23 522 5,354 39 254 19 6,781
FY2014 100 4,753 337 291 2,767 49,790 351 2,553 392 61,334
FY2015 764 1929 470 1,002 602 25,296 617 2,127 1,556 34,363
FY2016 1,005 3,233 1,380 4,634 827 49,919 1,615 2,496 5,298 70,407
FY2017 900 2,290 1,502 7,134 477 48,732 2,414 1,755 5,941 71,145
Note: Northern Triangle Countries refers to El Salvador, Guatemala, and Honduras.
Table 6d: Southwest Border Apprehensions of FMUAs from All Other Countries, FY 2012 – FY 2017
Big
Bend, TX
Del Rio, TX
EL Centro,
CA
EL Paso, TX
Laredo, TX
Rio Grande Valley,
TX
San Diego,
CA
Tucson, AZ
Yuma, AZ Total
FY2012 10 11 416 5 27 81 17 184 25 776
FY2013 4 12 31 8 50 221 194 160 38 718
FY2014 15 56 33 58 45 704 159 202 200 1,472
FY2015 3 38 9 30 57 787 79 107 89 1,199
FY2016 8 87 50 806 295 695 902 156 787 3,786
FY2017 4 45 138 1,262 25 349 273 31 79 2,260
From 2015 to 2016, total FMUA numbers increased considerably across all sectors. This total increase held relatively stable into 2017, although the distribution varied by sector. In Laredo, the number of FMUA apprehensions decreased by almost half, but El Paso apprehensions jumped from 5,664 in FY 2016 to a record high of 8,609 in FY 2017. FMUA apprehensions from Mexico fell for the fifth year in a row, with only 2,271 apprehensions in FY 2017 (a 35 percent decrease from FY 2016). At the same time, Northern Triangle FMUA apprehensions, which accounted for 94 percent of all southwest border FMUA apprehensions, increased slightly,

27
with most of the growth coming in the El Paso Sector where 7,134 FMUAs were apprehended in FY 2017 (a 700 percent increase from the FY 2015 southwest border surge). FMUA apprehensions from countries other than Mexico and the Northern Triangle dropped in FY 2017, with large decreases in San Diego, Laredo, Tucson, and Yuma only partially offset by increased apprehensions in El Paso. Of the 2,260 FMUAs from other countries, more than half were citizens of Brazil (1,442).
Northern and coastal border apprehensions represented a small portion of the FMUA count in FY 2017. A total of 131 FMUAs were apprehended across the northern border, while 49 were apprehended along the coastal border.
§ 1092(b)(1)(H) Between the ports illicit drugs seizure rate
Definition
Between the ports illicit drug seizure rate – For each type of illicit drug seized by USBP between POEs, the ratio of the amount of illicit drugs seized in any fiscal year relative to the average amount seized in the immediately preceding five FYs.
The illicit drug seizure rate is an activity measure, which compares trends in activity data over time.
Methodology and Limitations
Between-the-ports drug seizure data are obtained from USBP administrative records. These data are considered reliable.
Pursuant to the definition of the illicit drug seizure rate directed by NDAA § 1092 (b)(1)(H), the drug seizure rate describes the ratio of each year’s seizures relative to illicit drugs seizures in the preceding five years; the measure does not describe the rate at which illicit drugs are seized.
Available Data and Discussion
Table 7: Illicit Drugs Seized Relative to Preceding Five Years (“Illicit Drug Seizure Rate”) between POEs, FY 2012 – FY 2017
FY2012 FY2013 FY2014 FY2015 FY2016 FY2017
Marijuana Rate 101% 100% 83% 81% 72% 45% Lbs
seized 2,299,864 2,430,123 1,922,545 1,538,307 1,294,052 861,231
Cocaine Rate 117% 53% 57% 206% 71% 123% Lbs
seized 12,161 4,596 4,554 11,220 5,473 9,346
Heroin Rate 151% 142% 142% 141% 129% 177% Oz
seized 6,873 9,212 9,691 8,282 9,062 15,244
Methamphetamines Rate 228% 160% 149% 215% 168% 199% Lbs
seized 3,715 3,580 3,930 6,443 8,224 10,328
Fentanyl Rate N/A N/A N/A N/A N/A N/A Lbs
seized N/A N/A N/A N/A 105 181

28
Drug seizure trends varied in FY 2017 by type of illicit drug. Marijuana seizures continued to decline in FY 2017 as compared to the previous five years (45 percent of the previous five-year average). Cocaine seizures have fluctuated over the past few years, with a 200 percent jump in seizures in FY 2015 to 11,220 lbs, followed by a large dip in FY 2016. In FY 2017 cocaine seizures rose again to 9,346 lbs. Heroin and methamphetamines seizures continue to increase, as they have in each year at least since FY 2012. Heroin rose most precipitously, with a 68 percent increase since FY 2016.
USBP began recording fentanyl seizures in FY 2016. Since that time, seizures have increased from 105 lbs to 181 lbs in FY 2017.
§ 1092(b)(1)(I) Estimates of the impact of the consequence delivery system on recidivism
Definition
Consequence delivery system (CDS) – a process implemented by USBP to uniquely evaluate each apprehended subject and to identify the most effective and efficient consequences to deliver to impede and deter further illegal activity.
Recidivist rate – The share of subjects apprehended by USBP who are apprehended more than once in the same fiscal year.
The annual recidivist rate is an output measure that offers insight into what share of returned aliens are deterred from making additional unlawful entry attempts, though not accounting for unknown attempts/entries. USBP use the annual recidivist rate as one of its 15 metrics of the effectiveness of enforcement consequences under the CDS.
Methodology and Limitations
Since 2007, USBP has collected biometric data (including fingerprints and digital photographs) from most unlawful border crossers it apprehends. For the purpose of this report, these data are used to identify subjects apprehended more than once in a given fiscal year. USBP data on re-apprehensions in the same fiscal year is considered reliable. The annual recidivist rate is defined as the number of unique subjects apprehended multiple times in a fiscal year divided by the total number of unique subjects in the fiscal year:
𝐴𝐴𝑒𝑒𝑒𝑒𝑈𝑈𝑟𝑟𝑈𝑈 𝐴𝐴𝐴𝐴𝑈𝑈𝑒𝑒𝑈𝑈𝑒𝑒𝐸𝐸𝑒𝑒𝑒𝑒𝑟𝑟 𝐴𝐴𝑟𝑟𝑟𝑟𝐴𝐴 =𝑁𝑁𝑈𝑈𝑎𝑎𝑖𝑖𝐴𝐴𝐴𝐴 𝑒𝑒𝑈𝑈 𝑈𝑈𝑒𝑒𝑒𝑒𝑢𝑢𝑈𝑈𝐴𝐴 𝑒𝑒𝑈𝑈𝑖𝑖𝑠𝑠𝐴𝐴𝑈𝑈𝑟𝑟𝑒𝑒 𝑟𝑟𝐴𝐴𝐴𝐴𝐴𝐴𝐴𝐴ℎ𝐴𝐴𝑒𝑒𝑈𝑈𝐴𝐴𝑈𝑈 𝑎𝑎𝑈𝑈𝑈𝑈𝑟𝑟𝑒𝑒𝐴𝐴𝑈𝑈𝐴𝐴 𝑟𝑟𝑒𝑒𝑎𝑎𝐴𝐴𝑒𝑒
𝑇𝑇𝑒𝑒𝑟𝑟𝑟𝑟𝑈𝑈 𝑒𝑒𝑈𝑈𝑎𝑎𝑖𝑖𝐴𝐴𝐴𝐴 𝑒𝑒𝑈𝑈 𝑈𝑈𝑒𝑒𝑒𝑒𝑢𝑢𝑈𝑈𝐴𝐴 𝑒𝑒𝑈𝑈𝑖𝑖𝑠𝑠𝐴𝐴𝑈𝑈𝑟𝑟𝑒𝑒
The annual recidivism rate is a valid indicator of the probability that individuals previously apprehended make subsequent attempts at unlawful re-entry in that a drop in the annual recidivism rate very likely reflects a drop in re-apprehensions. The measure has the further advantages that USBP can calculate annual recidivism based strictly on its own apprehension data and that it can reliably be calculated at the end of each fiscal year. These features make the annual recidivism rate a useful measure for USBP performance management and an important operational measure.
Nonetheless, as the U.S. Government Accountability Office (GAO) has argued, if the goal is to accurately describe the share of individuals previously apprehended who make additional unlawful entry attempts, the current measure of recidivism could be strengthened in at least two ways: 1) count re-apprehensions based on the date on which a subject is removed or returned, rather than that the date of apprehension; 2) count re-apprehensions that occur within a fixed period of time defined by the subject’s repatriation date, rather than by

29
the fiscal year.5 When based on a one year window, these refinements yield a more expansive definition of the recidivism rate that DHS refers to as the “Total One-Year Recidivism Rate”; future versions of this report will include estimates of the impact of CDS on both the annual recidivism rate and a longer-term recidivism rate.
Interpreting recidivism rates must be done with caution. While declines in recidivism may suggest greater deterrence and/or improvements by USBP, changes in the overall flow may be the result of more first-attempt border crossers, thus driving down the recidivism rate; changes to the recidivism rate should be examined alongside the overall flow. Furthermore, changes to push factors over time may also play a role in a decrease in subsequent entry attempts.
Additionally, the impact of CDS on recidivism within a given year is not solely a measure of USBP consequences and operations. All enforcement actions that occur after apprehension and processing subjects into a consequence are controlled and timed by other components. Some subjects are never returned and therefore would not be represented in the metric. A subject that remains in the United States, pending a hearing five years out, has been successfully prevented from re-entry. Recidivism, calculated as described here, is influenced by court schedules and the operational ability of other immigration components as well as USBP consequences.
Available Data and Discussion
Table 8: CDS Recidivism Rate by Sector: FY 2012 - FY 2017
Big
Bend, TX
Del Rio, TX
EL Centro,
CA
EL Paso, TX
Laredo, TX
Rio Grande Valley,
TX
San Diego,
CA
Tucson, AZ
Yuma, AZ Total
FY 2012 6.90% 6.80% 38.28% 8.12% 13.35% 12.73% 30.49% 19.32% 18.20% 16.60% FY 2013 7.58% 7.28% 35.94% 10.22% 12.27% 11.62% 32.34% 21.24% 17.01% 15.73% FY 2014 6.74% 5.22% 32.63% 11.16% 11.59% 11.81% 32.46% 18.59% 13.26% 14.06% FY 2015 4.95% 6.14% 31.70% 8.63% 11.82% 12.66% 31.35% 15.71% 11.32% 14.02% FY 2016 5.59% 6.73% 24.52% 8.32% 13.01% 9.93% 27.34% 15.73% 5.37% 12.27% FY 2017 4.73% 5.51% 22.73% 6.22% 13.29% 8.27% 21.76% 12.46% 3.77% 10.48%
Since the implementation of CDS in 2012, all Southwest Border sectors have seen decreases in annual recidivism rates. While rates have varied over the past five years, in general, there have been steady declines in recidivism leading up to FY 2017. The largest decreases in recidivism were observed in El Centro (from 38.28 percent in FY 2012 to 22.73 percent in FY 2017) and Yuma (from 18.20 percent in FY 2012 to 3.77 percent in FY 2017). Laredo saw declines in recidivism in FY 2013-2015, but the rate has roughly returned to the FY 2012 level over the past two years.
Recidivism data are not available to calculate the impact of CDS at the Northern or Coastal Borders.
5 U.S. Government Accountability Office, “Border Patrol: Actions Needed to Improve Oversight of Post-Apprehension Consequences,” GAO-17-66, January 2017, pp. 13-17.

30
§ 1092(b)(1)(J) Examination of each consequence under the CDS
Definition
Consequence – An administrative, programmatic, or criminal justice process imposed on a subject following the subject’s apprehension. CDS is designed to identify, for any given subject, the ideal consequences to deliver to impede and deter further illegal activity.
Methodology and Limitations
USBP’s current methodology for assessing the CDS involves analyzing the effectiveness and efficiency of each enforcement consequence. One of the key effectiveness metrics is the annual recidivism rate, which is calculated separately for each enforcement consequence.
Under the CDS, USBP specifically targets aliens with more extensive records of unlawful border crossing behavior for consequences that are designed to have a greater deterrent impact. For example, the Target Enforcement Initiative utilizes partnerships with the U.S. Department of Justice to prioritize and prosecute individuals with six or more apprehensions. As a result, differences in recidivism rates by enforcement consequence may reflect differences in the propensity of the targeted population to make further re-entry attempts, in addition to the possible impact of each consequence on recidivism.
An additional limitation of currently-available data is that they are based on apprehension data for a given fiscal year, not repatriation data. Depending on the consequence and the timing of the apprehension, some individuals may not be repatriated to their country of origin during the fiscal year of their apprehension, and therefore may not have an opportunity to attempt re-entry. Long waits to appear in immigration courts for non-detained aliens mean very few aliens issued warrants of arrest and notices to appear are removed in the same year as their apprehension, for example, a factor that results in artificially low recidivism rates for aliens subject to that consequence. DHS and CBP are working to refine their analysis of CDS and will seek to address these limitations in the FY 2019 version of this report.
Available Data and Discussion
Table 9: Annual Recidivism Rate by Consequence, FY 2012 – FY 2017
FY 2012 FY 2013 FY 2014 FY 2015 FY 2016 FY 2017
Voluntary Return 27.06 28.61 30.5 27.03 24.55 24.65
Warrant of Arrest/Notice to Appear 3.83 1.44 0.6 0.89 0.41 0.36
Expedited Removal 16.44 16.66 17.54 18.08 15.46 13.5
Reinstatement of Removal 15.88 16.42 15.8 15.41 16.62 15.02
Alien Transfer Exit Program 23.82 25.48 28.63 27.17 28.8 27.89
Criminal Consequence Initiative 10.3 9.26 8.24 6.67 8.36 6.17
Standard Prosecution 9.09 10.17 9.18 8.79 8.16 6.98
Operation Against Smugglers Initiative on Safety and Security
10.24 18.04 18.25 22.97 30.93 -

31
While these data should be interpreted with caution for the reasons identified above, some trends are noteworthy. For example, the more punitive consequence programs such as the criminal consequence initiative (CCI) and standard prosecution (SP) generally showed lower recidivism rates (6.17 percent, 6.98 percent) than less punitive programs like voluntary return (24.55 percent) or expedited removal (15.46 percent).
In FY 2017, most categories continued to result in decreases in recidivism from the previous years. CCP and expedited removal saw the largest decreases (2.19 and 1.96 percentage points, respectively).

32
§ 1092(c) METRICS FOR SECURING THE BORDER AT PORTS OF ENTRY
§ 1092(c)(1)(A)(i) Total inadmissible travelers at ports of entry
Definition
Inadmissible alien – An alien seeking admission at a POE who does not meet the criteria in the INA for admission.
Known inadmissible aliens – Aliens seeking admission at a POE who are found by OFO to be inadmissible.
Total attempted inadmissible aliens – The estimated number of inadmissible aliens who attempt to enter the United States. Total attempted inadmissible aliens include known inadmissible aliens and successful unlawful entries at POEs.
Inadmissible aliens and known inadmissible aliens are activity measures that describes OFO officer workload. Known inadmissible aliens may also be used as a proxy indicator of total attempted inadmissible aliens, which is an outcome measure.
Methodology and Limitations
Known inadmissible aliens are recorded in OFO administrative records with a unique identifier created for each inadmissibility determination. OFO’s count of known inadmissible aliens is considered reliable.
In FY 2018 the Department developed a new methodology to estimate the number of attempted inadmissible aliens or total inadmissible aliens, however, the statistical reliability of the new metric has not yet been established. DHS and CBP are working to validate this estimate.
Available Data and Discussion
Table 10: Known Inadmissible Aliens at Ports of Entry, FY 2007 - FY2017
FY 2007 FY 2008 FY 2009 FY 2010 FY 2011 FY 2012 FY 2013 FY 2014 FY 2015 FY 2016 FY 2017 203,310 224,770 225,149 231,306 216,355 197,362 205,920 224,927 254,637 292,614 216,157
The number of aliens identified as inadmissible at POEs climbed four years in a row to peak at 292,614 in FY 2016 before falling 26 percent to 216,157 in FY 2017.
§ 1092(c)(1)(A)(ii) Refusal and Interdiction Rates at Ports of Entry
Definition
Refusal rate – The share of all travelers seeking admission at a port of entry that is found inadmissible. Refusal Rate is an activity measure that describes OFO officer workload.
Port of entry interdiction rate – The share of attempted inadmissible aliens that is found inadmissible. POE Interdiction Rate is an output measure that describes the difficulty of entering the United States unlawfully through a POE.

33
Methodology and Limitations
The refusal rate is calculated by dividing known inadmissible aliens (i.e., aliens found inadmissible by OFO officers at POEs) by the total number of travelers (i.e., all persons seeking admission at POEs):
𝑃𝑃𝐴𝐴𝑈𝑈𝑈𝑈𝑒𝑒𝑟𝑟𝑈𝑈 𝑃𝑃𝑟𝑟𝑟𝑟𝐴𝐴 = 𝐼𝐼𝑒𝑒𝑟𝑟𝑈𝑈𝑎𝑎𝑒𝑒𝑒𝑒𝑒𝑒𝑒𝑒𝑖𝑖𝑒𝑒𝑈𝑈𝑒𝑒𝑟𝑟𝑒𝑒 𝐷𝐷𝐴𝐴𝑟𝑟𝐴𝐴𝐴𝐴𝑎𝑎𝑒𝑒𝑒𝑒𝑟𝑟𝑟𝑟𝑒𝑒𝑒𝑒𝑒𝑒𝑒𝑒
𝑇𝑇𝐴𝐴𝑟𝑟𝐸𝐸𝐴𝐴𝑈𝑈𝐴𝐴𝐴𝐴𝑒𝑒
Data on inadmissibility determinations and total travelers is obtained from OFO administrative records; these data are considered reliable.
In FY 2018 the Department developed a new methodology to estimate the number of attempted inadmissible aliens or total inadmissible aliens, however, the statistical reliability of the new metric has not yet been established. DHS and CBP are working to validate this estimate.
Available Data and Discussion
Table 11: Inadmissible Aliens and Refusal Rate at Ports of Entry FY 2007 - FY2017
Travelers Inadmissibles Refusal Rate
FY 2007 407,677,568 203,310 0.05%
FY 2008 401,481,071 224,770 0.06%
FY 2009 361,191,781 225,149 0.06%
FY 2010 352,980,607 231,306 0.07%
FY 2011 340,364,884 216,355 0.06%
FY 2012 351,551,007 197,362 0.06%
FY 2013 362,333,988 205,920 0.06%
FY 2014 374,974,750 224,927 0.06%
FY 2015 383,200,225 254,637 0.07%
FY 2016 390,592,745 292,614 0.07%
FY 2017 397,407,840 216,157 0.05%
The number of travelers at POEs has continuously increased from FY 2011 to FY 2017 (from 340 million to 397 million), though traveler arrivals remain below the levels observed prior to the 2008-2009 recession. Growth in the number of inadmissibles slightly outpaced growth in arriving passengers from FY 2012 to FY 2016, yielding a slight increase in the refusal rate over this period; but this trend ended in FY 2017, when falling inadmissibles led to a drop in the refusal rate for the first time since FY 2011. This decrease may indicate that inadmissible aliens represent an increasingly small share of travelers, that OFO was less effective at detecting inadmissible aliens, or both. With refusal rates consistently falling well below 0.1 percent of traveler arrivals, however, the number of known inadmissible aliens is always a very small share of travelers coming through POEs.

34
§ 1092(c)(1)(A)(iii) Unlawful entries at ports of entry
Definition
Successful unlawful entries - The estimated number of inadmissible aliens who unlawfully enter the United States through POEs.
Successful unlawful entries is an outcome measure.
Methodology and Limitations
In FY 2018 the Department developed a new methodology to estimate the number of attempted inadmissible aliens or total inadmissible aliens, however, the statistical reliability of the new metric has not yet been established. DHS and CBP are working to validate this estimate.
§ 1092(c)(1)(B) Illicit drugs seized at ports of entry
Definition
Drug seizures – Seizures of illicit drugs by CBP officers at POEs.
Drug seizures are an activity measure. Drug seizures may also be interpreted as a proxy indicator of illicit drug inflows through POEs, an outcome measure.
Methodology and Limitations
Drugs seizure data are obtained from OFO administrative records, measured in kilograms. These data are considered reliable.
OFO reports that due to a conflict between data collection system and reporting system resulting from major IT modernization, it is unable to provide some FY 2017 drug seizure data at this time.
Available Data and Discussion
Drug seizure data at POEs is contained in Appendix B. A total of 367,612.58 kilos of illicit drugs were seized at POEs in FY 2016, which represents a nine percent decline from a total of 400,719.44 kilos in FY 2015, but is still higher than the previous five-year average of 352,399.84 kilos.
§ 1092(c)(1)(C) Port of entry illicit drug seizure rate
Definition
Port of entry illicit drug seizure rate – For each type of illicit drug seized by OFO at POEs, the ratio of the amount of illicit drugs seized in any fiscal year to the average of the amount seized in the immediately preceding five fiscal years.

35
Methodology and Limitations
At-ports-of-entry drug seizure data are obtained from OFO administrative records. These data are considered reliable.
Pursuant to the definition of the illicit drug seizure rate directed by NDAA § 1092(c)(1)(C), the drug seizure rate describes recent seizure trends (i.e., current year compared to five previous years); the measure does not describe the rate at which illicit drugs are seized.
The drug seizure rate is an activity measure, which compares trends in activity data over time. Drug seizures may be interpreted as a proxy indicator of illicit drug inflows through POEs, an outcome measure.
OFO reports that due to a conflict between data collection system and reporting system resulting from major IT modernization, it is unable to provide some FY 2017 drug seizure data at this time.
Available Data and Discussion
Table 12: Port of Entry Illicit Drug Seizure Rate, FY 2012 – FY 2017
FY2012 FY2013 FY2014 FY2015 FY2016 FY2017
Marijuana Rate 88% 81% 77% 118% 102% 77% Kg
seized 219,344 195,270 180,686 250,637 219,960 163,952
Cocaine Rate 73% 82% 71% 87% 103% 135% Kg
seized 20,596 17,658 18,721 17,347 23,967 26,595
Heroin Rate 209% 208% 168% 174% 106% 118% Kg
seized 1,125 1,475 1,556 1,984 1,483 1,792
Methamphetamines Rate 233% 263% 200% 200% 203% 230% Kg
seized 4,888 7,503 8,285 10,861 14,279 21,061
Fentanyl Rate NA NA NA NA NA NA Kg
seized NA NA NA NA 199 NA
Marijuana seizures at POEs continued to decline in FY 2017 to a record low since FY 2012. Cocaine seizures, however saw record highs in FY 2017, continuing a steady increase of nearly 50 percent since FY 2013. Heroin and methamphetamines seizures also both saw continued increases into FY 2017, with methamphetamines more than doubling its previous five-year average. Fentanyl seizures, which were first reported in FY 2016 were not available for FY 2017.

36
§ 1092(c)(1)(D) Major infractions at ports of entry
Definition
Major infractions – OFO considers major infractions to include all offenses subject to criminal arrest, including arrests related to terrorism, drugs, immigration crimes (including zero tolerance arrests), currency, merchandise, agriculture products, National Crime Information Center (NCIC) hits, and Terrorist Screening Database (TSDB) hits, among others. Infractions are not equivalent to arrests of individuals, as each individual may be charged with multiple infractions and all infractions may not ultimately lead to an arrest.
Known major infractions – The number of major infractions interdicted by OFO.
Undetected major infractions – The estimated number of major infractions not interdicted by OFO.
Known major infractions are an activity measure. Undetected major infractions are an outcome measure.
Methodology and Limitations
Known major infractions are recorded in OFO administrative records and are considered reliable.
Undetected major infractions are estimated through comprehensive audits on a statistical sampling of travelers known as COMPEX who were processed by CBP without secondary inspection and admitted into the United States. The randomly selected travelers undergo a systematic series of checks to reveal any admissibility, customs, or agriculture infractions. The rate of infractions found within the sample is applied to the population of travelers processed by CBP without secondary inspections. The program to develop these estimates operates at 19 airports and all POV crossings and is being expanded to pedestrian operations. Numbers reported below are for the airports and POV crossings within the program. Estimates are limited to the assumption that CBP secondary inspections and comprehensive audits find all infractions. This assumption is likely more valid for customs related screenings at airports than passenger screening given the 100 percent search of all baggage. Additionally, true random sampling is more likely at POV lanes where automated systems select vehicles for additional screening – these automated systems to do yet exist for airports.
This is the best available estimate of undetected major infractions with major reliability enhancements implemented in FY 2015 and FY 2016.

37
Available Data and Discussion
Table 13: Known Major Infractions at Ports of Entry, FY 2007 – FY 2017
Travelers Seizure Counts
Infraction Rate
FY 2007 407,677,568 90,718 0.02%
FY 2008 401,481,071 96,330 0.02%
FY 2009 361,191,781 108,941 0.03%
FY 2010 352,980,607 112,446 0.03%
FY 2011 340,364,884 120,491 0.04%
FY 2012 351,551,007 111,185 0.03%
FY 2013 362,333,988 112,471 0.03%
FY 2014 374,974,750 106,354 0.03%
FY 2015 383,200,225 112,562 0.03%
FY 2016 390,592,745 113,665 0.03%
FY 2017 397,407,840 109,643 0.03%
OFO officers made 109,643 seizures based on major infractions at ports of entry in FY 2017, a four percent drop from FY2016, and a similar number to those observed each year since FY 2009.
Table 14: Estimated Undetected Major Infractions at Ports of Entry, FY 2011 – FY 2017
Air POV
FY 2011 12,506 36,149
FY 2012 14,970 32,499
FY 2013 16,114 28,659
FY 2014 13,334 12,376
FY 2015 14,852 27,432
FY 2016 16,158 29,251
FY 2017 12,386 30,295
Despite an increase in air travelers in FY 2017, the estimated number of undetected major infractions at airports decreased by 23 percent, dropping from 16,158 in FY 2016 to 12,386 in FY 2017. Undetected major infractions in POV lanes, however, are estimated to have increased slightly, rising from 29,251 in FY 2016 to 30,295 in FY 2017.

38
§ 1092(c)(1)(E) Cocaine seizure effectiveness rate
Definition
Cocaine seizure effectiveness rate – In consultation with the Office of National Drug Control Policy (ONDCP), the amount of cocaine seized by OFO at land POEs compared to the total estimated flow of cocaine through land POEs.
Cocaine seizures is an activity measure. Seizures may also be used as a proxy indicator of total attempts to import cocaine, an outcome measure. Seizure effectiveness rate (i.e., cocaine seized as compared to the total estimate cocaine flow) is an output measure.
Methodology and Limitations
Seizure data is obtained from OFO administrative records and is considered reliable. Estimates of the total cocaine flow are provided by ONDCP. The U.S. Government does not have an estimate of the share of the total cocaine flow that passes through land POEs, but the U.S. Drug Enforcement Agency’s National Drug Threat Assessment states that the southwest border remains the key entry point for the majority of the cocaine entering the Unites States.
The source for the flow estimates prior to 2015 were the annual Interagency Assessment of Cocaine Movement (IACM) reports. The IACM methodology was to incorporate three measures (potential production, domestic consumption, and CCDB documented movements) into a “mid-point” estimate.
These IACM flow estimates were the amount of cocaine, in impure metric tons, that were estimated to depart South America headed for U.S. markets. The impure quantities were called “export quality” to contrast them with other supply measures, such as potential production, and consumption measures, that were routinely reported in pure metric tons.
Each IACM report would report the flow estimate for the previous year, plus addition years prior to that. Thus, each IACM report would “update” prior year estimates, while adding the latest year’s estimate. The last published IACM was for 2013. The 2014 IACM report was never published, but did report flow estimates.
Available Data and Discussion
Table 15: Estimates of Cocaine Seizure at Land Ports of Entry FY 2012 – FY 2017
FY2012 FY2013 FY2014 FY2015 FY2016 FY2017 Estimated Flow
479 475 479 684 1,152 1,155
Seizures 45,260.18 39,074.63 41,311.88 38,145.00 52,900.67 62,331.00 Seizure Effectiveness Rate
4.29% 3.73% 3.91% 2.53% 2.20% 2.45%
Notes: Estimated flow is measure in metric tons. Cocaine seizure estimates reported in pounds. Estimated cocaine flows are based on the IACM mid-point estimate for 2012-2014 and based on confirmed and substantiated CCDB estimate for 2015-2016. Cocaine seizures at ports of entry continued to rise in FY 2017, increasing from 52,900 pounds seized in FY 2016 to the recent high of 62,331 pounds seized. The flow, however, did not increase significantly, resulting in the increased seizure effectiveness rate increasing to 2.45 percent.

39
§ 1092(c)(1)(F)(i) Average wait times and traffic volume
Definition
Average wait time – Average minute wait time for vehicles to pass through a land POE.
Private vehicle volume – The number of private vehicles passing through a land POE per year.
Commercial vehicle volume – The number of commercial vehicles passing through a land POE per year.
Average wait time is an output measure describing the ease of crossing the border. Vehicle volume is an activity measure.
Methodology and Limitations
OFO calculates average wait times for each POE by a variety of methods, some automated using Radio Frequency Identification and others manually using either surveying or line of sight determinations. For manual wait time determinations, OFO officers record average minute wait times in the Border Wait Time tool, for automated wait times the time is recorded automatically every 30 minutes. Wait time data is not available for all POEs, particularly small northern border POEs with negligible wait times. OFO leadership directed POEs to provide wait times in March 2014. The policy is currently under review and OFO expects to issue new guidance in the near future to account for the improvements in automation and recording.
OFO records counts of Personally Owned Vehicles (POV) and Commercially Owned Vehicles (COV) as administrative data in its Operations Management Report (OMR); these data are considered reliable.
Available Data and Discussion
Data on average wait times, and counts of private and commercial vehicles for each land POE for which data are available are contained in Appendix C. Comparisons should be made with caution given the differences in flow and type of traffic at each port. Appendix C contains law enforcement sensitive information and has been redacted from this public report.
El Paso and Rio Grande City reported notable improvements in POV wait time as compared to FY 2016, with El Paso cutting more than eight minutes from the average wait time, despite an increase in flow. The largest increases in wait times were seen in the Calexico stations as well as San Luis, which continues to report an increase in POV wait time. Following a recent low of 28 minutes in FY 2013, the average wait time at San Luis has risen to over 51 minutes.
COV wait times vary more from year to year for each station and are consistently lower than POV wait times. Notable changes in FY 2017 include the continued increase in wait time at Pharr, from 13 minutes in FY 2013 to 27 minutes in FY 2017 – an average well beyond the average COV wait time and more than 10 minutes greater than the next highest POE.

40
§ 1092(c)(1)(F)(ii) Infrastructure Capacity Utilization Rate
Definition
Infrastructure capacity utilization rate – Average number of vehicles processed per booth, per hour at each land POE.
The infrastructure capacity utilization rate is an output measure that describes OFO’s ability to process traffic relative to the physical and staffing capacity.
Methodology and Limitations
Data are obtained from OFO administrative records. The data comes from CBP systems with booth hours and throughput as calculated fields. The hours serve as a proxy measure for the number of CBP officer hours spent processing and are measured on a one-for-one basis. Throughput is then calculated by summing all vehicles that passed through a site in a year and then dividing it by total booth hours.
Available Data and Discussion
Infrastructure capacity utilization rate data is contained in Appendix D. Appendix D contains law enforcement sensitive information and has been redacted from this public report.
Each OFO land POE is unique in terms of staffing authorizations and physical layouts. Land POEs may be physically constrained by the available space around them and so unable to expand to yield greater capacity. Land POEs in the United States are also impacted by the adjoining Canadian and Mexican land POE management decisions on staffing and physical layouts. Both the OFO Mission Support Facilities Division and the CBP Office of Facilities and Asset Management are working on establishing methods to determine resourcing decisions for land POEs.
Table 16: Average infrastructure capacity utilization rate FY 2012 – FY 2017
FY 2012 FY 2013 FY 2014 FY 2015 FY 2016 FY 2017 OFO National Average 43.1 43.5 45.3 46.6 47.4 49.6
Northern Border 36.2 38.2 39 35.7 34.6 36.3 Southern Border 47.7 46.8 49.1 53 54.4 56.6
In general, the southern border reports higher utilization rates because of higher flows through the POEs. The overall utilization rate continued to increase in FY 2017, due to a combination of increased efficiency and increased traffic demand for a fixed number of processing lanes. CBP processed an average of 49.6 vehicles per lane, per hour in FY 2017 (36.3 on the northern border; 56.6 on the southern border). Stanton Street in the El Paso Field Office averaged 132 vehicles per hour, per lane in FY 2016 – once again the highest in the country by a sizeable margin. However, Stanton Street only processes vehicles eligible for Dedicated Commuter Lanes (SENTRI and NEXUS program members) – the fastest-to-process class of travelers.

41
§ 1092(c)(1)(F)(iii) Secondary examination rate
Definition
Secondary examination rate – Percentage of passengers subject to secondary inspection at each land POE.
Secondary examination rate is an activity measure that describes OFO workload and practices.
Methodology and Limitations
Data are obtained from OFO administrative records. Secondary examination rate is determined by the recorded number of passengers sent for secondary inspection versus the total number of recorded passengers.
Available Data and Discussion
Frequency of secondary inspections data is contained in Appendix E. Appendix E contains law enforcement sensitive information and has been redacted from this public report.
Among the northern border POEs, the rate of secondary inspection declined from 8.52 percent in FY 2012 to 7.23 percent in FY 2017. The southern border Secondary Inspection Rate remained relatively stable over the past four years, with 12.2 percent of passengers receiving secondary inspection in FY 2017. This number is down from the prior three year average from FY 2010 to FY 2012, when closer to 15 percent of passengers received secondary inspection. The highest secondary inspection rates were reported at northern border POEs including Raymond (15.44 percent) and Morgan (16.87 percent). Certain smaller land POEs have high secondary examination rates due to low volume of traffic that allow officers increased time to thoroughly examine a larger share of passengers.
§ 1092(c)(1)(F)(iv) Secondary examinations effectiveness rate
This measure is under review. OFO does not presently measure the effectiveness of secondary examinations at the enterprise level.
§ 1092(c)(1)(G)(i) Number of potentially “high-risk” cargo containers
Definition
Potentially high-risk cargo containers – Shipping containers carrying cargo shipments identified as potentially high-risk using National Targeting Center (NTC) security criteria.
Potentially high-risk cargo containers is an activity measure that describes OFO workload.
Methodology and Limitations
All international cargo containers coming to the United States via the sea, land, and air modes of transportation are screened by the NTC using the Automated Targeting System (ATS) to identify those shipments that may be considered potentially high-risk according to NTC security criteria. Any cargo container traveling via the maritime environment carrying a shipment identified as potentially high-risk is identified for immediate review and assessed or scanned prior to lading at a Container Security Initiative (CSI) member foreign port of origin or at arrival at a U.S. POE. Assessing, resolving, and when required, scanning and physically inspecting cargo

42
found to be potentially high-risk ensures the safety of the public and minimizes the impact to the trade through the effective use of risk-focused targeting.
The NTC periodically refines, improves, and revises the security criteria applied by the ATS, which in turn improves the focus of the risk assessment applied and somewhat reduces the overall number of cargo containers identified as potentially high-risk.
Available Date and Discussion
Table 17: Potentially High-Risk Cargo Containers at Seaports, FY 2013 – FY 2017
FY2013 FY2014 FY2015 FY2016 FY2017
89,598 74,509 72,974 71,815 36,209
The NTC’s process of continual review and refinement in the security criteria applied and ATS methodology has led to realignment in the total number of maritime cargo containers identified as potentially high-risk since FY 2013, even as the amount of cargo arriving at U.S. POEs has increased over the same time period. The number of potentially high-risk cargo containers dropped precipitously in FY 2017, continuing the downward trend since FY 2013 (60 percent decrease). Roughly half as many cargo containers at seaports were identified as being potentially high-risk in FY 2017 (36,209) as compared to 2016 (71,815).

43
§ 1092(c)(1)(G)(ii) Ratio of potentially high-risk cargo containers scanned relative to high-risk containers entering in previous fiscal year
Definition
Ratio of potentially high-risk containers scanned – The ratio of potentially high-risk containers scanned relative to the number of potentially high-risk containers entering in the previous fiscal year.
The ratio of potentially high-risk containers scanned is an activity measure, which compares trends in activity data over time. Ratio of High-Risk Containers may also be interpreted as a proxy indicator of high-risk containers successfully be scanned and entering through ports of entry, an outcome measure.
Methodology and Limitations
Inspection data are obtained from OFO administrative records. These data include potentially high-risk cargo containers reviewed, assessed, or scanned. These three methods of inspection are not currently distinguishable with available data sources.
The ratio compares potentially high-risk containers in one year to the number entering in the previous year and should not be confused with the percentage of potentially high-risk containers scanned relative to the number entering in the current year.
A container is considered “high-risk” if even one shipment within it is designated high-risk. One container may have multiple high-risk shipments within it which could cause the same container to be reviewed or scanned multiple times.
Available Data and Discussion
The ratio of potentially high-risk containers reviewed, assessed, or scanned relative to previous years’ entries along with the percentage scanned in the current year are contained in Appendix F. Appendix F contains law enforcement sensitive information and has been redacted from this public report.
With respect to the percentage scanned, all sea POEs reported 100 percent scanning of high-risk cargo containers in FY 2017 or indicated that no high-risk containers passed through the POE.
§ 1092(c)(1)(G)(iii) Potentially high-risk cargo containers scanned upon arrival at a U.S. POE
This measure is under review and will be provided in a future report.
§ 1092(c)(1)(G)(iv) Potentially high-risk cargo containers scanned before arrival at a U.S. POE
This measure is under review and will be provided in a future report.

44
§ 1092(d) METRICS FOR SECURING THE MARITIME BORDER
§ 1092(d)(1)(A) Situational awareness in the maritime environment
Definition
The NDAA calls for DHS to develop a measure for situational awareness based on “knowledge and understanding of current unlawful cross-border activity, including the following: (A) Threats and trends concerning illicit trafficking and unlawful crossings; (B) The ability to forecast future shifts in such threats and trends; (C) The ability to evaluate such threats and trends at a level sufficient to create actionable plans; and (D) The operational capability to conduct persistent and integrated surveillance of the international borders of the United States.”
Situational awareness is an output measure.
Methodology and Limitations
To improve the efficiency, effectiveness, and accountability of DHS aviation programs, the Department is developing the ability to analyze and report flight hour data consistently across Components and assess the contribution of aviation activity to DHS missions. This is an ongoing and multi-year effort that the Department will report the progress and results of in future versions of this report.
In the interim, the Department reports on the following operational activity metrics contributing to maritime domain situational awareness:
• CBP Aircraft Hours Flown for Situational Awareness or Interdiction Support• USCG Aircraft Hours Flown for Situational Awareness or Interdiction Support• USCG Cutter Hours Contributing to Situational Awareness or Interdiction• CBP Boat Hours Contributing to Situational Awareness or Interdiction• USCG Boat Hours Contributing to Situational Awareness or Interdiction• CBP Tethered Aerostat Radar System (TARS) Radar Operating Hours• Number of Vessel Manifests Screened by Coastwatch
Available Data and Discussion
Table 18a: CBP Aircraft Flight Hours Within/Outside Transit Zone, FY 2016 - FY 2017
FY2016 FY2017 Inside Transit Zone - CBP 6,420 6,273 Outside Transit Zone – CBP 13,188 12,422
In comparison to FY 2016, there was a slight decrease in FY 2017’s CBP aircraft hours flown inside and outside of the transit zone; 147 hours (2%) and 766 hours (6%) respectively.

45
Table 18b: USCG Aircraft Flight Hours Within/Outside Transit Zone, FY 2012 – FY 2017
FY2012 FY2013 FY2014 FY2015 FY2016 FY2017
Inside Transit Zone – USCG
5,082 4,599 4,567 5,426 4,110 4,361
Outside Transit Zone – USCG
14,721 14,258 13,896 14,003 13,736 11,452
USCG reported a decrease in the number of flight hours outside the transit zone in FY 2017, continuing the downward trend from FY 2012. Inside the transit zone hours increased from 4,110 to 4,361 in FY 2017, following a sizeable drop from FY 2015 to FY 2016. Flight hours both inside and outside the transit zone in FY 2017, however, are both lower than the previous five year average from FY 2012 to FY 2016.
Table 19: USCG Cutter underway hours within/outside transit zone FY 2012 – FY 2017
FY2012 FY2013 FY2014 FY2015 FY2016 FY2017
Inside Transit Zone
37,866 25,388 14,456 16,964 28,205 49,935
Outside Transit Zone
127,671 117,114 117,093 112,773 78,462 114,216
Inside the transit zone USCG cutter underway hours nearly doubled in FY 2017 from 28,205 to 49,935. Outside the transit zone hours also increased, from a historical low of 78,462 hours in FY 2016 back to 114,216 hours in FY 2017, similar to levels seen in prior years.
Table 20a: USCG Boat underway hours within/outside transit zone FY 2012 – FY 2017
FY2012 FY2013 FY2014 FY2015 FY2016 FY2017
Inside Transit Zone
0 2,031 0 0 0 0
Outside Transit Zone
46,326 37,640 30,726 32,701 28,525 29,667
Outside of the transit zone, USCG reported 29,667 boat underway hours – a slight increase from 28,525 in FY 2016, though still below the previous five year average. USCG boat underway hours inside the transit zone remained at zero in FY 2017.

46
Table 20b: CBP Boat underway hours within/outside transit zone FY 2016 – FY 2017
FY2016 FY2017 Inside Transit Zone 0 9 Outside Transit Zone 40,241 34,451
Note: CBP maritime hours include Air and Marine Operations vessel underway hours.
In 2017, CBP recorded nine boat underway hours within the transit zone, as compared to zero in the previous year. At the same time, there was a 5,790 hours (14 percent) decrease in the number of CBP boat underway hours outside of the transit zone.
Table 21: Total operational hours for TARS radars FY 2012 – FY 2017
FY2012 FY2013 FY2014 FY2015 FY2016 FY2017 Cudjoe Key, FL 5,752 6,289 6,165 6,306 4,886 5,728 Lajas, PR 0 0 12,301 5,049 4,559 3,922
1 TARS site at Lajas, Puerto Rico crashed in 2011; CBP re-established operations in May 2014. Source: CBP administrative records
CBP’s Air and Marine Operations (AMO) uses TARS to provide long-range detection of low-altitude aircraft and maritime traffic at the radar’s maximum range. The elevated sensor mitigates curvature of the earth and terrain masking limitations. The number of TARS operational hours for FY2017 were adversely affected by considerable tropical storm activity in the Caribbean and Gulf of Mexico environments. Cudjoe Key saw an overall increase of 842 surveillance hours (a 17 percent increase from FY 2016) but the site was destroyed in early September 2017 following a direct hit from Hurricane Irma. Lajas continued to report a decrease in hours due to site deactivation as a result of hurricanes.
Table 22: Vessel Manifests Screened by Coastwatch for National Security Concerns Prior to Arrival at U.S. POE, FY 2012 – FY 2017
FY2012 FY2013 FY2014 FY2015 FY2016 FY2017
118,098 126,112 124,661 122,133 117,736 115,006
The number of vessel manifest screened by Coastwatch for National Security Concerns dropped slightly in FY 2017 from less than 118,000 to roughly 115,000, continuing a downward trend from the recent high of 126,000 in FY 2013.
§ 1092(d)(1)(B) Known maritime migrant flow rate
Definition
Known maritime migrant flow - Total maritime migrant flow interdicted, identified directly or indirectly but not interdicted, or otherwise believed to have unlawfully entered the United States
Known maritime migrant interdiction rate – Migrant interdictions in the maritime domain as a share of the known migrant flow.
Known maritime migrant flow is an outcome measure. Known maritime migrant interdiction rate is an output measure.

47
Methodology and Limitations
Migrant flow data are obtained from USCG and CBP administrative records. The USCG maintains a robust accounting of USCG, international partner, and domestic partner interdictions and sightings of undocumented maritime migrants. The USCG relies upon its partners to report their interdictions to the USCG for compilation in the database. At times, undocumented maritime migrants are counted by both USCG and CBP (or other partners) when interdicted as agencies often cooperate during these operations. In certain limited cases undocumented maritime migrant interdictions by partners are not reported to the USCG, and these cases are not accounted for in the figures below. Additionally, while partners report cases to the USCG when undocumented maritime migrants are apprehended on shore or evidence is found of their arrival on shore, some migrants arrive without being apprehended and leave no evidence. These cases are never reported and are also excluded from the known maritime migrant flow figures below.
To improve the efficiency, effectiveness, and accountability of DHS aviation and marine programs, the Department will provide de-conflicted data when interdictions involve assets from multiple Components in future versions of this report. The Department will also report metrics on coordinated operations.
Available Data and Discussion
Table 23: Migrants interdicted in the maritime domain by DHS Component FY 2007 – FY 2017
USCG CBP DHS and
Partners FY 2007 5,981 NA NA FY 2008 4,565 NA NA FY 2009 3,682 NA NA FY 2010 2,121 NA NA FY 2011 2,458 NA NA FY 2012 2,732 NA NA FY 2013 2,093 NA NA FY 2014 3,587 NA 7,752 FY 2015 3,825 NA 6,028 FY 2016 6,326 2,683 8,167 FY 2017 2,512 1,229 3,952
Note: Some interdictions may be counted by both USCG and CBP as some migrant interdictions involve assets from both agencies. Interdictions by DHS and partners may include international partners.
Table 24: Known maritime migrant flow, FY 2007 – FY 2017
FY2007 FY2008 FY2009 FY2010 FY2011 FY2012 FY2013 FY2014 FY2015 FY2016 FY2017
14,682 10,879 9,850 4,443 4,566 5,298 7,631 10,631 8,057 10,319 4,760

48
Table 25: Known maritime migrant interdiction rate, FY 2013 – FY 2017
FY2013 FY2014 FY2015 FY2016 FY2017 96.6% 72.9% 74.8% 79.3% 83.0%
The number of migrants interdicted in the maritime domain dropped in FY 2017 (3,952) following the recent record high number of migrants in FY 2016 (8,167). In part, the FY 2017 drop may be the result of immigration policy changes affecting Cuban migrants. The known maritime flow has also decreased dramatically, resulting in a slightly higher interdiction rate of migrants in the maritime domain.
§ 1092(d)(1)(C) Illicit drugs removal rate
Terms Illicit drugs removal rate – The ratio of illicit drugs removed by DHS maritime security in any fiscal year, including drugs abandoned at sea, relative to the average amount removed or abandoned in the immediately preceding five fiscal years.
The illicit drug removal rate is an activity measure, which compares trends in activity data over time.
Methodology and Limitations Drug removals are obtained from USCG administrative records; these data are considered reliable.
Pursuant to the definition of the illicit drug removal rate directed by NDAA § 1092 (d)(1)(C), the Drug Removal Rate describes recent trends in drugs removed or abandoned at sea (i.e., current year compared to five previous years); the measure does not describe the rate at which illicit drugs are removed.
Non-commercial maritime drug removals includes those seized by the USCG, CBP, other law enforcement agencies, and international partners, as well as those disrupted or abandoned by drug trafficking organizations. At present, only USCG data are reported; however, in future NDAA reports, the Department will provide removal data from CBP.
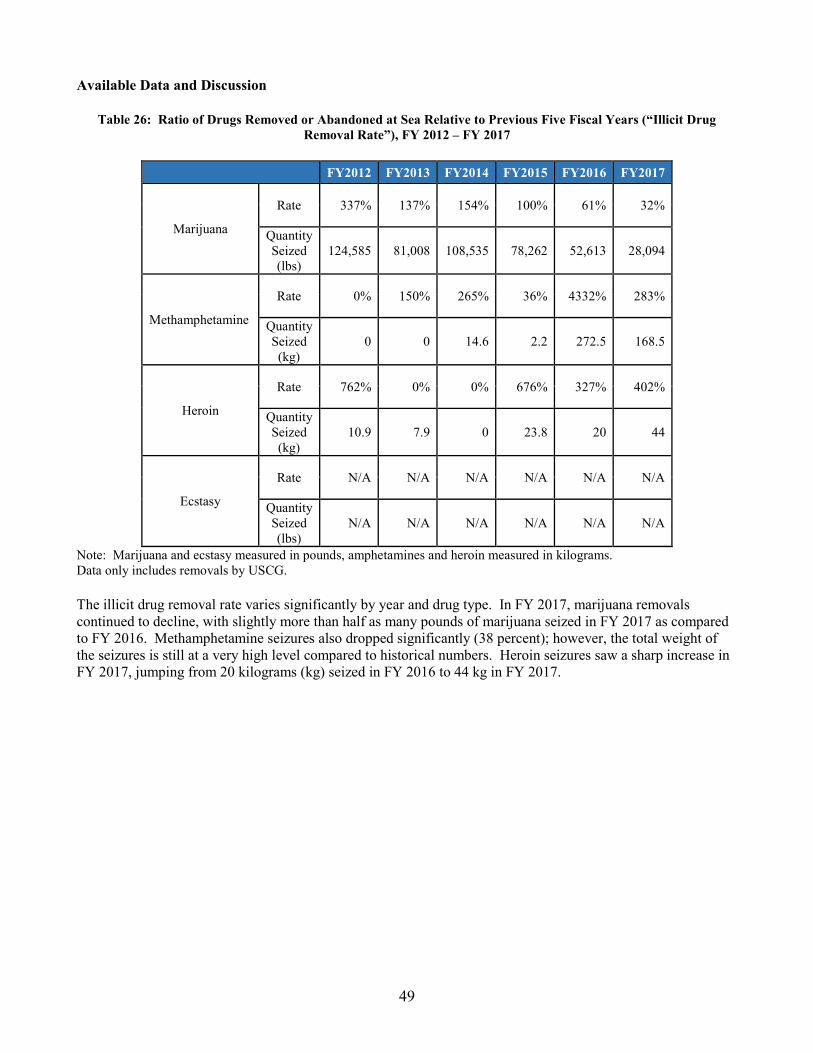
49
Available Data and Discussion
Table 26: Ratio of Drugs Removed or Abandoned at Sea Relative to Previous Five Fiscal Years (“Illicit Drug Removal Rate”), FY 2012 – FY 2017
FY2012 FY2013 FY2014 FY2015 FY2016 FY2017
Marijuana
Rate 337% 137% 154% 100% 61% 32%
Quantity Seized (lbs)
124,585 81,008 108,535 78,262 52,613 28,094
Methamphetamine
Rate 0% 150% 265% 36% 4332% 283%
Quantity Seized (kg)
0 0 14.6 2.2 272.5 168.5
Heroin
Rate 762% 0% 0% 676% 327% 402%
Quantity Seized (kg)
10.9 7.9 0 23.8 20 44
Ecstasy
Rate N/A N/A N/A N/A N/A N/A
Quantity Seized (lbs)
N/A N/A N/A N/A N/A N/A
Note: Marijuana and ecstasy measured in pounds, amphetamines and heroin measured in kilograms. Data only includes removals by USCG.
The illicit drug removal rate varies significantly by year and drug type. In FY 2017, marijuana removals continued to decline, with slightly more than half as many pounds of marijuana seized in FY 2017 as compared to FY 2016. Methamphetamine seizures also dropped significantly (38 percent); however, the total weight of the seizures is still at a very high level compared to historical numbers. Heroin seizures saw a sharp increase in FY 2017, jumping from 20 kilograms (kg) seized in FY 2016 to 44 kg in FY 2017.

50
§ 1092(d)(1)(D) Cocaine Removal Effectiveness Rate
Definition
Cocaine Removal Effectiveness Rate – In consultation with ONDCP, the amount of cocaine removed by DHS inside and outside the maritime transit zone compared to total estimated flow of cocaine through the maritime domain.
Cocaine Removals is an activity measure. Removals may also be used as a proxy indicator of total attempts to import cocaine, an outcome measure. Cocaine Removal Effectiveness rate (i.e., cocaine seized as compared to the total estimate cocaine flow) is an output measure.
Methodology and Limitations
Drug removal data obtained from ONDCP, JIATF-S and USCG administrative records through the Consolidated Counter Drug Database (CCDB) are considered reliable. Flow quantities are the best estimates available based on intelligence reporting and case data. Additionally, while other government estimates for production in major cocaine producing countries in South America and consumption of cocaine within America do not align with the estimated non-commercial maritime flow figures inside the transit zone derived from the CCDB, this metric was derived based upon the non-commercial maritime flow estimates.
For the purposes of this metric, based upon where the data was gathered, the transit zone is defined by the Joint Interagency Task Force South area of responsibility. Non-commercial maritime drug removals include those seized by USCG and other law enforcement agencies, and international partners, as well as those disrupted by anti-drug trafficking operations. The cocaine removal rate is based on estimates of noncommercial maritime cocaine flow from the CCDB. Outside the transit zone data is not considered as robust with regard to intelligence on flow. As a result, the interdiction rate for cocaine outside the transit zone is not considered reliable.
In future versions of this report, the Department will report removal data from CBP.
Available Data and Discussion
Table 27: Cocaine Removed by DHS Relative to the Total Estimated Flow in the Maritime Transit Zone, FY 2012 – FY 2017
Location FY 2012 FY 2013 FY 2014 FY 2015 FY 2016 FY 2017
Inside Transit Zone
Rate 23% 12% 17% 21% 17% 17% Quantity Removed 186.4 155.4 178.8 277.2 482.7 467
Estimated Flow 799.5 1,260.4 1,042.2 1,308.8 2,852.6 2,729.3
Outside Transit Zone
Rate 49% 19% 50% 73% 28% NA Quantity Removed 21.3 15.1 13.2 39 17.7 NA
Estimated Flow 43.8 81.5 26.2 53.2 62.3 NA Note: Removal and estimated flow quantities measured in metric tons.

51
Figure 5: Flow and Removal of Cocaine in the Maritime Transit Zone, FY 2012 – FY 2017
The flow of cocaine is estimated to have risen in FY 2016 to over 2,800 metric tons based on the decrease in aerial eradication of cocaine crops in Colombia and improved intelligence reporting throughout the Transit Zone. This new flow held relatively constant in FY 2017, with 17 percent of the flow in the transit zone removed by DHS and partner agencies.
0
500
1000
1500
2000
2500
3000
2012 2013 2014 2015 2016 2017
Met
ric T
ons o
f Non
com
mer
cial
Coc
aine
Partner Removed USCG Removed Landed or Aborted

52
§ 1092(d)(1)(E) DHS Maritime Threat Response Rate
Definition
DHS Maritime Threat Response Rate – The ability of DHS maritime security components to respond to and resolve known maritime threats, whether inside or outside a transit zone, by placing assets on-scene, relative to the total number of known threats.
Methodology and Limitations
Currently, this data only exists associated with cocaine response activity. Further, DHS data is part of a larger set of interagency data and may not be able to be separated from the larger interagency data set, which is currently assessed and reconciled on a cycle and process outside of DHS that does not support submission at this time. DHS, in cooperation with interagency partners, is exploring options to collect response data for non-cocaine response events, as well as options to provide the response rate measures data to meet the intent of the Act. This working group plans to have a metric available for the 2019 version of this report.
§ 1092(d)(1)(F) Intergovernmental Maritime Threat Response Rate
Definition
Intergovernmental Maritime Threat Response Rate – The ability of DHS maritime security components or other U.S. Government entities to respond to and resolve known maritime threats, whether inside or outside a transit zone, by placing assets on-scene, relative to the total number of known threats.
Methodology and Limitations
Currently, this data only exists associated with cocaine response activity. Further, DHS data is part of a larger set of interagency data and may not be able to be separated from the larger interagency data set, which is currently assessed and reconciled on a cycle and process outside of DHS that does not support submission at this time. In cooperation with interagency partners, DHS is exploring options to collect response data for non-cocaine response events, as well as options to provide the response rate measures data to meet the intent of the Act. This working group plans to have a metric available for the 2019 version of this report.

53
§ 1092(e) AIR AND MARINE SECURITY METRICS IN THE LAND DOMAIN
§ 1092(e)(1)(A) Flight Hour Effectiveness Rate
Definition
Flight Hour Effectiveness Rate in the Land Domain – Number of flight hours flown by CBP Air and Marine Operations in the Land Domain as a percentage of AMO’s unconstrained flight hour requirements.
Flight Hour Effectiveness Rate is an output measure.
Methodology and Limitations
This Flight Hour Effectiveness Rate is determined by dividing the total hours flown by the number of flight hour requirements determined during the annual collection process. The flight hour requirements for the subsequent fiscal year are collected by CBP AMO operating locations based on unconstrained requirements collected from USBP, ICE, and other partner agencies, as well as internal CBP AMO requirements. In 2017, CBP AMO’s unconstrained flight hour requirement in the Land Domain totaled 242,185 hours. However, after incorporating the approved funding for FY 2016, the total funded flight hours in the Land Domain was reduced to 77,769 programmed hours. Of note, although CBP AMOs programmed flight hours decreased in FY 2017, CBP AMO supported a higher percentage of unconstrained flight hour requirements this FY.
The AMO unconstrained flight hour requirement is not validated DHS measure.
Available Data and Discussion
Table 28: Flight Hour Effectiveness Rate
F Y 2016 FY 2017
Unconstrained Hours 295,225 242,185
Hours Flown 79,872 78,066
Flight Hour Effectiveness Rate
27% 32%
AMO completed 32 percent of the unconstrained flight hour requirement during FY 2017, with 78,066 hours flown against the unconstrained 242,185 hours. AMO completed 27 percent of the unconstrained flight hour requirement during FY 2016, with 79,872 hours flown against the unconstrained 295,225 hours.
§ 1092(e)(1)(B) Funded Flight Hour Effectiveness Rate
Definition
Funded Flight Hour Effectiveness Rate – Number of flight hours flown by Air and Marine Operations as a percentage of the number of flight hours funded by Congress.
Funded Flight Hour Effectiveness Rate is an output measure.

54
Methodology and Limitations
Flight hour data are obtained from AMO administrative records. This rate is determined by dividing the total hours flown by the number of flight hours funded by Congress.
Available Data and Discussion
Table 29: Funded Flight Hour Effectiveness Rate
FY 2016 FY 2017
Hours funded 79,774 77,769
Hours flown 79,872 78,066
Effectiveness rate
100% 100%
AMO’s Flight Hour Effectiveness Rate was 100 percent in FY 2017, with 78,066 hours flown against 77,769 funded hours. AMO’s Flight Hour Effectiveness Rate was 100 percent in FY 2016, with 79,872 hours flown against 79,774 funded hours.
§ 1092(e)(1)(C) AMO Readiness Rate
Definition
AMO Readiness Rate - The percentage of mission requests that AMO was able to fulfill, excluding those requests that could not be fulfilled due to reasons beyond AMO’s control.
AMO Readiness Rate is an activity measure.
Methodology and Limitations
Missions data are obtained from AMO administrative records. The rate is determined by dividing the missions flown by the total number of mission requests (number of missions flown plus the number of missions cancelled due to causes within AMO control, such as maintenance, personnel, and asset availability).
Table 30: AMO Missions Cancelled and Readiness Rate FY 2017
FY 2016 FY 2017 Total Non-Cancelled Missions 31,365 30,318 Missions cancelled - asset availability 4,978 4,496 Missions cancelled - crew availability 1,738 2812 Total cancelled missions within AMO control 6,716 7308 Readiness rate due to causes within AMO control 82% 81%
AMO’s readiness rate was 80 percent in FY 2017, with 7,308 out of 37,626 planned missions cancelled due to causes within AMO control. AMO’s readiness rate was 82 percent in FY 2016, with 6,716 out of 38,351 planned missions cancelled due to causes within AMO control.

55
§ 1092(e)(1)(D) AMO Weather-Related Cancelation Rate
Definition
AMO Weather-Related Cancelation Rate - The number of missions cancelled by AMO due to weather as a percentage of total planned AMO missions.
AMO Weather-related cancelation rate is an activity measure.
Methodology and Limitations
Mission data are obtained from AMO administrative records. The Weather-Related Cancelation Rate is calculated by dividing the number of missions cancelled due to weather by the total number of missions requested by AMO’s partner agencies.
Available Data and Discussion
Table 31: AMO Weather-Related Cancelation Rate, FY 2016 - FY 2017
FY 2016 FY 2017 Total missions requested by partner agencies 42,761 41,944 Missions cancelled - weather 3,083 3,122 Cancellation rate due to weather 7% 7%
In FY 2017, 3,122 missions were cancelled due to weather out of the 41,944 total missions requested by Partner Agencies, a cancellation rate of 7% due to weather.
§ 1092(e)(1)(E) AMO Individuals Detected
Definition
AMO Individuals Detected – Number of individuals detected by CBP AMO through the use of unmanned aerial systems and manned aircraft.
AMO Individuals Detected is an activity measure.
Methodology and Limitations
Data are obtained from AMO administrative records. The Department’s currently available data on detections by unmanned aircraft are limited to the number of VADER detections, and current data on detections from manned aircraft are limited to detections leading to apprehensions and arrests.
These data exclude certain detections because AMO does not presently track data from all sensors on unmanned and manned aircraft. For this reason, the Department considers the current AMO Individuals Detected measure to be a work in progress, and expects to provide more comprehensive data on AMO detections as part of the FY 2019 Border Security Metrics Report.

56
Available Data and Discussion
Table 32: Individuals Detected by AMO by Aircraft Type, FY 2016 - FY 2017
FY 2016 FY 2017 Manned 54,879 35,374 Unmanned 7,908 10,711
In FY 2016, AMO detected 54,879 individuals via Manned Aircraft and 10,711 individuals via Unmanned Aircraft. In comparing FY 2017 to FY 2016, there was a marked increase in the number of individuals detected by AMO unmanned aircraft, from 7,908 detections to 10,711 detections (26 percent increase), and a decrease in the number of individuals detected by manned aircraft, from 54,879 to 35,374 (36 percent decrease).
§ 1092(e)(1)(F) AMO Apprehensions Assisted
Definition
AMO Apprehensions Assisted – USBP apprehensions assisted by AMO through the use of unmanned aerial systems and manned aircraft.
AMO Apprehensions Assisted is an activity measure.
Methodology and Limitations
Data are obtained from AMO administrative records. The metric consists of apprehensions and arrests that are attributed to manned and unmanned aircraft operations. These data are based on Aircraft Enforcement Hours (non-maritime), therefore excluding DHC-8, P-3, and MEA aircraft operations occurring in the maritime domain
Available Data and Discussion
Table 33: Apprehensions Assisted by AMO by Aircraft Type and Flight Hours, FY 2016 - FY 2017
FY2016 FY2017
Enforcement Flight Hours Apprehensions Enforcement
Flight Hours Apprehensions
Manned 64,639 50,646 55,572 32,872 Unmanned 4,857 1,729 6,771 2,362
In FY 2017, AMO flew 55,572 enforcement manned flight hours that assisted in the apprehension of 32,872 individuals and flew 6,771 enforcement unmanned flight hours that assisted in the apprehension of 2,362 individuals. In comparing FY 2017 to FY 2016, the number of apprehensions assisted by AMO manned aircraft decreased from 50,646 to 32,872, a 35% decrease. At the same time, the number of apprehensions assisted by AMO unmanned aircraft increased from 1,729 to 2,362, a 27% increase. The number of manned enforcement flight hours decreased from 64,639 to 55,572 and the number of unmanned enforcement flight hours increased from 4,857 to 6,771 flight hours, a 14% decrease and 28% increase respectively. These numbers may be partly due to the shifting enforcement postures in manned and unmanned air enforcement in FY 2017.

57
§ 1092(e)(1)(G) Illicit Drug Seizures Assisted by AMO
Definition
Illicit Drug Seizures Assisted by AMO - The number and quantity of illicit drug seizures assisted by AMO through the use of unmanned aerial systems and manned aircraft.
Illegal Drug Seizures Assisted is an activity measure.
Methodology and Limitations
Drug seizure data are obtained from AMO administrative records. The metric consists of the total number of events and quantity in pounds of drug seizures using manned and unmanned systems. A “drug event” is defined as a single law enforcement action resulting in a drug seizure(s). This is based on Aircraft Enforcement Hours (non-maritime), therefore excluding DHC-8, P-3, and MEA aircraft operations occurring in the maritime domain.
Available Data and Discussion
Table 34: Illicit Drug Seizures and Drug Events by AMO by Aircraft Type and Flight Hours, FY 2016 - FY 2017
FY2016 FY2017
Enforcement Flight Hours
Drug Events
Drug Seizures
(lbs)
Enforcement Flight Hours
Drug Events
Drug Seizures
(lbs)
Manned 64,639 3,834 651,759 55,572 1,649 316,885 Unmanned 4,857 78 30,033 6,771 108 41,610
In FY 2017, AMO flew 55,572 enforcement manned flight hours that led to 1,649 drug seizure events resulting in 316,885 pounds of drugs seized. These statistics represent roughly a 50 percent decrease from FY 2016. Utilizing unmanned aircraft numbers increased, however, with AMO having flown 6,771 enforcement hours that led to 108 drug seizure events totaling in 41,610 pounds of drugs seized (increase of 38 percent and 28 percent respectively). These numbers suggest a shift away from manned aircraft hours to unmanned aircraft hours in FY 2017, as unmanned hours increased by 39 percent and manned hours decreased by 14 percent.
§ 1092(e)(1)(H) AMO Actionable Intelligence
Definition
AMO Actionable Intelligence - The number of times that actionable intelligence related to border security was obtained through the use of unmanned aerial systems and manned aircraft.
This measure is still under review and will be provided in future versions of the report.

58
§ 1092(g)(3)(D) Other Appropriate Information
Pursuant to NDAA § 1092(g)(3)(D), this section provides three additional metrics of border security between ports of entry: 1) selected characteristics of USBP apprehensions; 2) the estimated at-the-border deterrence rate; and 3) estimated border crossing costs.
Selected Characteristics of Recent USBP Apprehensions
Definition
Historically, the overwhelming majority of individuals apprehended between POEs along the southwest border have been Mexican adults, and very few of them have sought asylum or other forms of humanitarian relief from removal. The profile of USBP apprehensions has changed in important ways in recent years, as growing shares of individuals apprehended are: a) from countries other than Mexico (primarily the Northern Triangle of Central America countries of El Salvador, Guatemala, and Honduras), b) UACs or children and adults traveling together as FMUAs, and/or c) seeking asylum or other forms of protection by claiming fear of being returned to their countries of citizenship.
These shifting characteristics have an important impact on border security and USBP border enforcement because existing enforcement policies were largely designed with the more traditional alien profile in mind. For example, many consequences under CBP’s Consequence Delivery Program such as the Alien Transfer Exit Program and the Mexican Interior Repatriation Program are only applicable to Mexican nationals. And UACs, FMUAs, and aliens making successful credible fear claims are generally not subject to expedited removal and have been considered “not impactable” by traditional USBP enforcement efforts because upon apprehension they have typically been released into the United States with a Notice to Appear in immigration court on a future date. More generally, the drivers of migration from countries other than Mexico and for aliens who may seek humanitarian relief from removal may be different from those that motivated earlier generations of unlawful border crossers, potentially causing U.S. policymakers to rethink their policy response.
To monitor these changing dynamics, the Department tracks two main sets of characteristics:
Apprehensions by Citizenship – The share of aliens apprehended by USBP from Mexico, El Salvador, Guatemala, Honduras, and all other countries.
Apprehensions by Potential Humanitarian Equities – The share of aliens apprehended by USBP who are unaccompanied children, are apprehended as part of a family unit, are Cuban migrants during the “wet-foot dry-foot” era, and/or who make successful credible or reasonable fear claims.
Apprehensions is an activity measure.
Methodology and Limitations
Apprehensions are recorded in administrative record systems with a unique identifier created for each apprehension. Apprehensions by citizenship, by UAC status, and by family unit status are generally considered reliable, though agents may not always be able to identify UACs or family units.

59
Available Data and Discussion
Table 35: USBP Southwest Border Apprehensions by Citizenship, FY 2009 – FY 2017
FY 2009 FY 2010 FY 2011 FY 2012 FY 2013 FY 2014 FY 2015 FY 2016 FY 2017
Mexico 495,582 396,819 280,580 262,341 265,409 226,771 186,017 190,760 127,938
El Salvador 11,181 13,123 10,368 21,903 36,957 66,419 43,392 71,848 49,760
Guatemala 14,125 16,831 17,582 34,453 54,143 80,473 56,691 74,601 65,871
Honduras 13,344 12,231 11,270 30,349 46,448 90,968 33,445 52,952 47,260
All Other 6,633 8,727 7,777 7,827 11,440 14,740 11,788 18,709 13,087
Total 540,865 447,731 327,577 356,873 414,397 479,371 331,333 408,870 303,916
In recent years, apprehensions have started to shift from consisting overwhelmingly of Mexican nationals to an equal share of Mexican nationals and border crossers from other areas, mostly Northern Triangle countries. In 2014 and 2016, southwest border apprehensions peaked, most noticeably for Northern Triangle countries. In 2016, only 46 percent of southwest border apprehensions were Mexican nationals while 48 percent were from Northern Triangle countries. In FY 2017, this trend continued, with the proportion of Mexican apprehensions to overall apprehensions dropping to 42 percent. The proportion of Northern Triangle apprehensions rose nearly five percent in FY 2017 to over 53 percent of total apprehensions.
Table 36: USBP Southwest Border Apprehensions by Potential Humanitarian Claim, FY 2008 – FY 2017
FY 2012 FY 2013 FY 2014 FY 2015 FY 2016 FY 2017 FMUA 11,116 14,855 68,445 39,838 77,674 75,622 UAC 24,403 38,759 68,541 39,970 59,692 41,435 Cuban 40 73 98 110 83 32 Fear Claims 4,000 9,293 47,979 39,267 79,576 56,067
Total Apprehensions
356,873 414,397 479,371 331,333 408,870 303,916
Note: Table rows are not mutually exclusive categories; individuals may be counted as FMUA/UAC as well as Cuban and/or fear claimants. Fear claims refer only to those apprehended between ports of entry by USBP who claimed fear at any time during the enforcement process.
Consistent with the surge of apprehensions seen in 2016, the number of family unit apprehensions and UAC apprehensions rose in 2016, with family unit numbers roughly doubling from 2015 and UAC apprehensions increasing 49 percent. In 2017 apprehensions dropped from over 400 thousand to just over 300 thousand (a 25 percent drop), however apprehensions of those with humanitarian claims did not decrease at the same rate. Family unit apprehensions dropped by less than three percent in FY 2017, with FMUA apprehensions representing 25 percent of all apprehensions as compared to 19 percent in FY 2016. UAC and fear claim apprehensions declined at a higher rate in FY 2017, both dropping 30 percent. In January of 2017, the “wet-foot dry-foot” policy affecting Cuban aliens was terminated, therefore only Cubans apprehended at the southwest border prior to this date were included in the 2017 count of humanitarian claims.

60
At-the-Border Deterrence
Definition Deterrence - the estimated share of migrants who, following a failed unlawful entry attempt, are deterred from making a subsequent reentry and decide instead to return home or otherwise remain in Mexico.
The deterrence rate is an output measure associated with the difficulty of crossing the border unlawfully because it reflects decisions by people who have already decided to migrate illegally to abandon their effort.
Methodology and Limitations
As with the apprehension or interdiction rate, deterrence cannot be observed directly.
DHS currently estimates deterrence based on migrant surveys; the Department believes surveys or interviews are one of the only ways to directly measure deportees’ intentions to make a further illegal entry attempt. The most important survey data on deterrence comes from the Colegio de la Frontera Norte International Border Survey (EMIF), which interviews deportees immediately at repatriation facilities upon their return to Mexico and asks them about their intentions to return to the United States within the next 7-90 days. In work for DHS, the Institute for Defense Analyses (IDA) Corporation used a combination of EMIF and CBP data to build an econometric model of 90-day deterrence for all USBP apprehensions since 2000.6
In addition to the standard concerns about the validity of survey samples and survey instruments, questions about deterrence are especially hard to measure accurately given the ever-evolving enforcement environment. A further limitation is that the EMIF data is restricted to Mexican northern border deportees, and cannot be assumed to apply to migrants from other regions/countries because they face different trade-offs and geographic barriers when considering a re-entry attempt.
6 John W. Bailey et al., “Assessing Southern Border Security,” Institute for Defense Analyses, IDA Paper NS P-5304, May 2016.

61
Available Data and Discussion
Figure 6: At the Border Deterrence for Mexican Border Deportees, FY 1993 – FY 2017
Note: Figure is based on updated EMIF data resulting in adjustments to historical deterrence estimates relative to previously reported data.
The data describe relatively limited deterrence levels prior to 2007 (20-40 percent in the seven-day survey and 10-30 percent in the 90-day model), and substantial growth in the deterrence rate since that time. Estimated seven-day deterrence rates have exceeded 75 percent every year since 2012, and estimated 90-day deterrence rates hovered around 60 percent in 2014 through 2017. In 2016 and 2017 the EMIF estimates began to diverge from the IDA weight, possible due to changing demographics of southwest border apprehensions or policy shifts that affect repatriated aliens’ ability to return.
Border Crossing Costs
Definition
Percent hiring smuggler – the share of migrants who hire a smuggler.
Border crossing costs - the average fees that smugglers charge.
Smuggling usage and average smuggling fees are output measures associated with the difficulty of crossing the border unlawfully. Migrants will only tolerate higher fees to the extent that smugglers provide an essential and successful service. Smugglers also compete to attract customers by offering their services at the lowest profitable rate, so higher fees indicate rising costs to smugglers. Rising smuggling fees also reflect an increased risk to smugglers of a criminal conviction; smugglers pass this risk along to customers in the form of higher fees.
Methodology and Limitations
The only available data on smuggling fees come from migrant surveys and USBP custodial interviews. These data may be subject to response bias if migrants are reluctant to admit to hiring a smuggler, but such bias should
0
10
20
30
40
50
60
70
80
90
1993
1994
1995
1996
1997
1998
1999
2000
2001
2002
2003
2004
2005
2006
2007
2008
2009
2010
2011
2012
2013
2014
2015
2016
2017
% D
eter
red
Year
7 day EMIF weights 90 day EMIF weights 90 day IDA weights

62
be broadly consistent over time, so changes in survey/interview data should reflect changes in the difficulty of crossing the border.
Available Data and Discussion
One finding across multiple surveys is that smuggler usage rates have increased steadily over the last five decades. Previous research by the Office of Immigration Statistics found that smuggler usage rates climbed from 40-50 percent during the 1970s, to 59 percent in the late 1970s and early 1980s, 70-80 percent in the 1980s to 1990s, 80 to 93 percent in the 1990s to 2000s, and 95 percent for first-time crossers surveyed in 2006. Similarly, according to USBP interviews, relatively few illegal border crossers hired a smuggler prior to 2001, but usage rates climbed to 80-95 percent among apprehended border crossers in recent years.
Figure 7: Border Crossing Cost Estimates, FY 2000 – FY 2017
Source: U.S. Border Patrol apprehension records, El Colegio de la Frontera Norte Encuestas sobre Migracion en las Fronteras Norte y Sur de Mexico (EMIF).
Survey results also indicate steady increases in fees paid to migrant smugglers. Averaging across the available sources depicted in Figure 7, smuggling fees increased by five percent per year during the 1980s, 12 percent per year during the 1990s, and have shown a sharp increase since 2015.
Custodial interviews conducted by USBP have found that smuggling fees are often paid in stages. Initial fees required to approach staging locations along the border were often lower than $100 prior to the late 2000s, and an additional $1,000-$3,000 in fees were charged upon delivery to the final destination. More recently, smuggling fees for Mexicans and Central Americans reportedly have been as high as $1,200 for the initial staging payment and up to $8,000 at the final destination. Custodial interviews also find evidence of an increase in alternative forms of payment in exchange for passage, including migrants being required to participate in smuggling controlled substances or other illicit items across the border or to work off debts upon arrival in the United States, as well as reports of harsh negotiations concerning payment plans with family members.
$-
$1,000
$2,000
$3,000
$4,000
$5,000
$6,000
Aver
age
Smug
glin
g Fe
e (T
Y$, e
xclu
ding
zer
os)
Apprehension Records EMIF Returned Module
EMIF from North Module EMIF from South Module

63
IV. Conclusion
DHS recognizes that its ability to accurately measure its border security outcomes, outputs, activities, and inputs is essential to the effective and efficient management of the Department. The metrics contained in this report are the baseline that DHS uses to measure its progress towards meeting the goals contained in the Executive Order on Border Security and Immigration Enforcement Improvement. As such, the Department will continue to refine these metrics through internal and external engagement and collaboration, including with Congress. DHS looks forward to updating Congress on this progress through periodic briefings and formally with the submission of future Border Security Metrics Reports.

64
Appendix A – Repeated Trials Model Methodology The Department’s current model-based estimates of the Apprehension Rate, of the total number of successful unlawful entries, and of related measures such as undetected unlawful entries build on research conducted for DHS by the Institute for Defense Analyses (IDA) based on long-standing social science research on the Repeated Trials Methodology (RTM).7 The Department views some of IDA’s assumptions as problematic and continues to work to validate and refine the modeling methodology. For this reason, while the FY 2017 and FY 2018 versions of this report include metrics based on IDA’s model-based approach, DHS views the model itself as a work in progress. Both reports include certain refinements to the RTM-based metrics, and this report updates previously-reported historical estimates.
The primary building block for the model-based Apprehension Rate and total estimated successful unlawful entries is an estimated apprehension rate for a particular subset of border crossers that DHS refers to as a partial apprehension rate (PAR). The approach focuses on illegal border crossers who are apprehended and deported to the Mexican border and who make a subsequent re-entry attempt. The logic of the PAR is to use USBP biometric data to assess what share of migrants who make repeated entry attempts is subsequently re-apprehended.
The PAR methodology consists of three main steps (see Figure 2). First, the model identifies a subset of illegal border crossers who are candidates to attempt re-entry, the so-called RTM population. Under IDA’s methodology, this group excludes all non-Mexicans, those deported to the Mexican interior or remotely through the Alien Transfer and Exit Program, aliens who have ever requested asylum, those facing criminal charges, and children under 18 years old.
7 For a full discussion of IDA’s model-based estimate, see John W. Bailey et al., “Assessing Southern Border Security,” Institute for Defense Analyses, IDA Paper NS P-5304, May 2016. Also see Thomas J. Espenshade, “Using INS Border Apprehension Data to Measure the Flow of Undocumented Migrants Crossing the U.S.-Mexico Frontier,” International Migration Review (1995): 545-565; Joseph Chang, “CBP Apprehensions at the Border,” Homeland Security Studies and Analysis Institute, 2006.

65
Figure 1: Partial Apprehension Rate Methodology
Source: DHS Office of Immigration Statistics adaptation of Bailey et al. 2016.
The second step in calculating the PAR is to distinguish between deportees who give up and return home or otherwise remain in Mexico versus those who attempt to re-enter the United States. IDA estimates this share based on an analysis of a survey of recent deportees conducted by the College of the Northern Border, the so-called EMIF survey.
Third, by definition, RTM assumes deportees who are not deterred following an apprehension always make a subsequent reentry attempt. Thus, by observing in DHS administrative records how many migrants from the RTM population are re-apprehended, the model infers the number that successfully re-enters. The ratio of re-apprehensions to successful re-entries is used to estimate the partial apprehension rate.
The PAR model confronts important limitations at each point in the modeling process. The most notable and challenging to overcome is the assumption of the RTM that subjects who are not deterred will always attempt re-entry until successful. One problem with this assumption is the lack of reliable data on who is deterred. IDA relies primarily on the EMIF survey to estimate the deterrence rate. And while the EMIF is widely recognized as one of the best migrant surveys available, its results are still dependent on the characteristics of the sample, the quality of the survey instrument, and the honesty of the respondents. More fundamentally, the EMIF survey asks recent deportees about their intentions to re-enter the United States, and it therefore does not take account of shifting border enforcement efforts, potential changes in behavior by individuals who have been exposed to consequence programs, or other deterrent factors along the border. The structure of the RTM model means that any resulting undercount in the estimate of the deterred population results in a downward bias in the PAR.
Second, the RTM population represents a shrinking share of southwest border apprehensions. Mexican adults quickly deported to the nearest border accounted for about 95 percent of apprehensions when the RTM methodology was developed in the 1990s. But changes in the composition of border flows (i.e., rising numbers of Central Americans and asylum seekers); changes in CBPs enforcement strategy to emphasize criminal charges, lateral repatriation, and other enforcement consequences; and IDA’s restrictive modeling choices mean that as few as 20 percent of U.S. Border Patrol (USBP) apprehensions in recent years are used to estimate the PAR. In addition, because the RTM sample excludes aliens who are more likely to surrender to USBP (i.e., aliens with a higher apprehension rate), the PAR is biased downwards as an indicator of the overall apprehension rate; this bias may be substantial given the number of aliens excluded from the RTM sample.

66
Third, IDA makes somewhat restrictive assumptions about which re-apprehensions to include in the final stage of the PAR calculation. In particular, IDA excludes apprehensions occurring at check points and other remote locations and those occurring more than four days after an illegal entry. Given USBP’s defense-in-depth strategy, which places resources at and behind the border, these assumptions result in a slight further downward bias in the PAR.
Refinements to IDA’s Model-Based Estimate and Impacts on Reported Metrics
Despite these limitations, the Department views the RTM methodology as a promising approach to estimating an apprehension rate that takes great advantage of USBP’s collection of biometric data since 2000. In implementing the RTM methodology to produce reportable metrics, the Department made two refinements to IDA’s approach in its FY 2017 report and an additional refinement in the FY 2018 report. These refinements had modest impacts on certain reported metrics, and certain metrics were further affected by the inclusion in this year’s report of updated historical data.
DHS made two refinements to IDA’s approach to estimating the PAR when preparing metrics for the FY 2017 Border Security Metrics Report. First, the Department included a broader set of Mexican deportees in its definition of the RTM sample included in the calculation of the PAR: IDA’s sample was defined to include Mexicans 18 and older repatriated to the border who had not been detained in the United States, who had never claimed asylum, and who had not been identified as suspected smugglers; the Department expanded the definition of the RTM sample by excluding from their sample only those aliens who claimed asylum with USBP and including Cubans apprehended after January 2017, at which point the wet-foot dry-foot policy was terminated. Second, while IDA only counted apprehensions occurring in the immediate border region within four days of a migrant’s illegal entry in its calculation of the re-apprehension rate, the Department also included apprehensions at CBP checkpoints and elsewhere in the border region occurring within 30 days of an illegal entry. As a result of the changes to the RTM sample, the deterrence rate shifted for most years, leading to adjustments in the PAR for all prior years as well. Depending on the year, these adjustments may have increased or decreased the PAR, largely depending on the change in deterrence.
The Department made one additional change to IDA’s approach when preparing the FY 2018 report, in this case by refining the methodology for using the PAR to estimate total illegal entries. IDA’s model of total illegal entries assumes that non-impactable aliens present themselves to border enforcement agents (and therefore have a 100 percent apprehension rate), and that all impactable aliens are apprehended at the same rate as the RTM population (i.e., at the PAR). Thus, the estimated number of total illegal entries is the product of the number of impactable aliens apprehended times the PAR-derived odds of successful entry. In producing this year’s Border Security Metrics Report the Department discovered that the software code provided by IDA and used to produce the FY 2017 estimates mistakenly calculated the estimated total number of illegal entries as the product of the RTM population and the PAR-derived odds of successful entry. The Department corrected that error for the FY 2018 report, resulting in an upwards-revision of historical estimates of the number of illegal entries.
In addition to this methodological change, the Department also included updated data in the FY 2018 report that resulted in an upwards revision of recent historical PAR estimates. First, the Department included the most current removal and return data from U.S. Customs and Immigration Enforcement (ICE). Because recent ICE data includes certain repatriations occurring in previous fiscal years, this updated information increases the number of USBP apprehensions identified as re-apprehensions, raising the PAR. Second, the Department also identified certain additional aliens as suspected smugglers. Eliminating these frequent border crossers from the RTM population reduces the number of re-apprehensions and has a modest downward effect on the PAR. Third, the Department included updated EMIF data in calculating the estimated deterrence rate; these updates resulted in modest increases in the estimated deterrence rate and therefore an upward adjustment in the PAR.

67
Appendix B – Drugs Seizures – All Ports of Entry
OFO Drug Seizures at Ports of Entry FY 2008 to FY 2017
DRUG FY 2008 FY 2009 FY 2010 FY 2011 FY 2012Grand Total 433,037.02 680,417.93 395,390.47 371,813.83 344,129.80COCA PRODUCTS, TEA BAGS OR LIQUOR 953.62 270.63COCAINE 18,246.01 27,946.47 28,063.88 23,517.88 20,529.67CRYSTAL METHAMPHETAMINES 186.25 360.6 544.2 875.61 1,377.53DIHYDROCODEINONE (HYDROCODONE) 70.92 26.37 8.46 1.79ECSTASY 700.28 500.83 527.71 264.92 49.56EPHEDRINE 7,901.41 8,762.73 7,738.18 4,475.71 2,350.28FENETHYLLINE-(CAPTAGON-AMPHETAMINE)FENTANYLGAMMA HYDROXY BUTYRATE 48.34 26.16 79.86 24.28 218.16HASH,LIQUID (HASH OIL) 0.1 0.08 0.26 0.04 0.18HASHISH 105.3 276.83 143.11 104.83 60.96HEROIN 845.46 827.61 1,316.57 1,594.24 1,714.41KETAMINE 100.77 40.85 66.84 112.47 81.31KHAT (CATHA EDULIS) 54,815.24 116,691.90 95,988.98 70,061.23 47,972.07LSD 0.85 4.58 0.78 10.09 17.82MARIJUANA 261,611.58 312,264.86 246,546.43 253,771.78 237,053.80MARIJUANA PLANTS 13.15 0.03MDPV-(METHYLENEDIOXYPYROVALERONE) 29.22MEPHEDRONE 0.5 12.4METHAMPHETAMINE 1,155.95 1,970.25 2,900.33 3,824.11 5,032.37METHYLONE 1.3 74.63METHYLPHENIDATE (RITALIN) 46.74 38.95 23.79 28.11 36.63MORPHINE 8.15 1.08 22.86 6.2 13.1N-BENZYLPIPERAZINE (BZP TABLETS) 9.36 182.79 15.24 12.9 73.71NEXUS/2 CB 0.16 0 0.11 0.06OPIUM 318.74 662.55 825.52 667.96 1,150.49OTHER DRUGS, PRESCRIPTIONS, CHEMICALS 5,814.91 5,878.10 7,125.77 5,452.89 5,719.66OXYCODONE (OXYCONTIN) 2.8 4.86 5.21 6.07 13.72PARAMETHOXYAMPHETAMINE 0.01 0 0.15PRECURSOR CHEMICALS EXCEPT EPHEDRINE 80,705.40 203,508.22 230.2 4,760.66 18,778.76PSILOCYN OR PSILOCYBIN MUSHROOMS 25.81 4.81 4.71 3.74 17.98ROHYPNOL 0.18 0.05 0.53 0.21 0.23STEROIDS 386.16 389.02 3,117.40 331.81 476.53SYNTHETIC CANNABINOIDS - ALL TYPES 72.1 929.35 1,001.97YABA 1.25 2.67 3.14 0.08

68
Note: Tea bags included in this table are those used to carry coca products.
DRUG FY 2013 FY 2014 FY 2015 FY 2016 FY 2017Grand Total 336,121.66 309,214.45 400,719.44 367,612.58 N/ACOCA PRODUCTS, TEA BAGS OR LIQUOR 112.31 335.66 370.24 210.93 N/ACOCAINE 17,723.96 18,738.75 17,302.28 23,949.98 N/ACRYSTAL METHAMPHETAMINES 1,522.53 1,742.36 1,625.40 2,084.99 N/ADIHYDROCODEINONE (HYDROCODONE) 4.29 11.24 2.98 14.45 N/AECSTASY 104.26 111.04 103.97 704.61 N/AEPHEDRINE 5.1 28.57 42.1 13.5 N/AFENETHYLLINE-(CAPTAGON-AMPHETAMINE) 1.22 N/AFENTANYL 208.25 N/AGAMMA HYDROXY BUTYRATE 33.09 73.31 48.68 483.76 N/AHASH,LIQUID (HASH OIL) 0.13 13.98 0.77 0.45 N/AHASHISH 58.1 117.11 82.43 75.24 N/AHEROIN 1,809.90 1,957.01 2,508.16 1,915.58 N/AKETAMINE 88.58 77.78 43.69 150.59 N/AKHAT (CATHA EDULIS) 84,023.03 67,478.21 66,953.87 70,087.11 N/ALSD 3 7.02 3.57 2.41 N/AMARIJUANA 213,186.12 198,650.99 273,423.14 233,774.29 N/AMARIJUANA PLANTS 7.97 0.66 0.25 1.64 N/AMDPV-(METHYLENEDIOXYPYROVALERONE) 335.14 225.68 234.05 41.75 N/AMEPHEDRONE 11.82 9.11 5.72 2.66 N/AMETHAMPHETAMINE 7,884.50 8,796.53 11,529.10 15,018.32 N/AMETHYLONE 322.27 829.42 315.68 41.98 N/AMETHYLPHENIDATE (RITALIN) 20.03 15.14 13.69 12.3 N/AMORPHINE 31.36 213.71 19.29 520.21 N/AN-BENZYLPIPERAZINE (BZP TABLETS) 87.78 1.61 1.16 0.1 N/ANEXUS/2 CB 0.09 0.11 1.26 0.06 N/AOPIUM 1,289.80 1,637.34 652.98 905.89 N/AOTHER DRUGS, PRESCRIPTIONS, CHEMICALS 4,135.02 5,117.21 22,330.66 12,987.55 N/AOXYCODONE (OXYCONTIN) 13.17 11.14 6.46 20.65 N/APARAMETHOXYAMPHETAMINE N/APRECURSOR CHEMICALS EXCEPT EPHEDRINE 739.27 748.2 1,293.69 3,377.95 N/APSILOCYN OR PSILOCYBIN MUSHROOMS 23.38 24.11 16.18 45.78 N/AROHYPNOL 0.74 0.04 0 0.08 N/ASTEROIDS 470.05 554.53 581.16 613.24 N/ASYNTHETIC CANNABINOIDS - ALL TYPES 2,074.37 1,686.67 1,206.82 550.79 N/AYABA 0.47 0.18 2.53 N/A