Embed Size (px)
Citation preview
DEPARTMENT OF ENVIRONMENTAL AFFAIRS
annual report2014/15
VOTE 30

DEPARTMENT OF ENVIRONMENTAL AFFAIRS
Annual Report 2014/15 Vote 30

First publication in 2013 by the Department of Environmental Affairs (DEA) Copyright © 2015 DEA
Design and layout by Department of Environment Affairs Chief Directorate Communication Private Bag X447, Pretoria 0001 South Africa
Table of Contents
PART A GENERAL INFORMATION 1
FOREwORd by MINIsTER ......................................................................................................................................................................................................................................... 8
sTATEMENT by dEPuTy MINIsTER ...........................................................................................................................................................................................................................10
REPORT OF ThE ACCOuNTING OFFICER .............................................................................................................................................................................................................. 11
ENTITIEs REPORTING TO ThE MINIsTER ................................................................................................................................................................................................................. 23
PART b PERFORMANCE INFORMATION 24
sTRATEGIC ObjECTIVEs, PERFORMANCE INdICATORs, PLANNEd TARGETs ANd ACTuAL AChIEVEMENTs ................................................................................................. 33
LINkING PERFORMANCE wITh budGETs ............................................................................................................................................................................................................. 85
PART C GOVERNANCE 98
RIsk MANAGEMENT .............................................................................................................................................................................................................................................. 99
REPORT OF ThE AudIT ANd RIsk COMMITTEE .....................................................................................................................................................................................................103
PART d huMAN REsOuRCE OVERsIGhT REPORT 106
huMAN REsOuRCEs OVERsIGhT sTATIsTICs .....................................................................................................................................................................................................107
PART E FINANCIAL INFORMATION 136
REPORT OF ThE AudITOR-GENERAL ....................................................................................................................................................................................................................137
ANNuAL FINANCIAL sTATEMENTs .......................................................................................................................................................................................................................140

PART A GENERAL INFORMATION
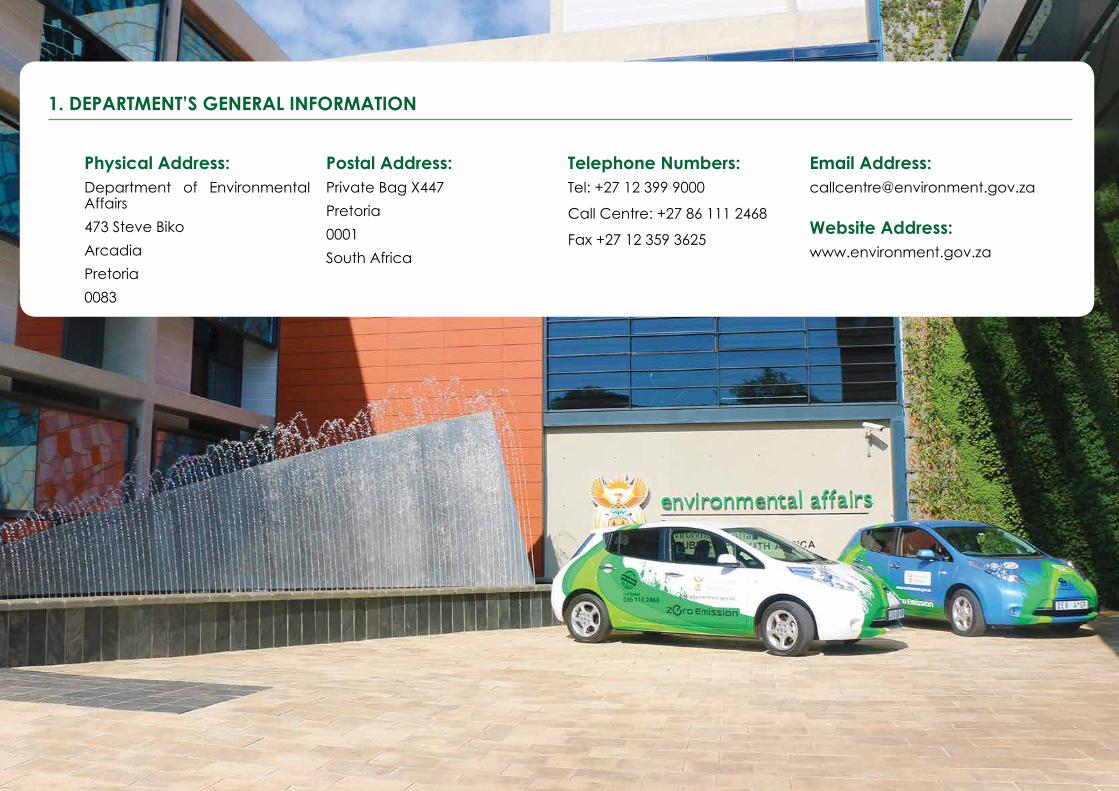
1. dEPARTMENT’s GENERAL INFORMATION
Physical Address:Department of Environmental Affairs473 Steve BikoArcadiaPretoria 0083
Postal Address:Private Bag X447Pretoria0001South Africa
Telephone Numbers:Tel: +27 12 399 9000
Call Centre: +27 86 111 2468
Fax +27 12 359 3625
Email Address:[email protected]
website Address:www.environment.gov.za

2. LIsT OF AbbREVIATIONs/ACRONyMs
LIsT OF ACRONyMsABS Access and Benefit Sharing CC Climate Change AEL Air Emission Licence CEC Committee for Environmental Coordination AG Auditor-General CFO Chief Financial Officer AGSA Auditor-General of South Africa CST Central Standard TimeAIS Alien Invasive Species CITES Convention on International Trade in Endangered Species of Wild
Fauna and Flora.AMCEN African Ministerial Conference on the Environment. CIF Climate Investment Fund AQA Air Quality Act CMP Conference of the Members of Protocol AQM Air Quality Management CoGTA Department of Cooperative Governance and Traditional AffairsAQMP Air Quality and Management Planning CO2 Carbon Dioxide ATC Antarctic Treaty Commission COP Congress of the Parties. ATCM Antarctic Treaty Consultative Meeting CLCC Chief Land Claims Commissioners AU African Union CSIR Council for Scientific and Industrial Research AWG-LCA Ad hoc working group on Long-term Cooperative Action DAFF Department of Agriculture Forestry and Fisheries BABS Bioprospecting, Access and Benefit Sharing DBC Departmental Bargaining Council BASIC Brazil, South Africa, India and China DBSA Development Bank of Southern Africa BCC Benguela Current Commission DEA Department of Environmental Affairs BEE Black Economic Empowerment DLDD Desertification Land Degradation and Drought BBBEE Broad Based Black Economic Empowerment DMR Department of Minerals and Resources BMP Biodiversity Management Plan DPSA Department of Public Service and Administration BTEX Benzine, Teluene, Ethylbenzene and Xylenes DPME Department of Performance Monitoring and Evaluation BRICS Brazil, Russia, India, China and South Africa DST Department of Science & Technology CAHOSCC Committee of African Heads of State and Government on Climate
ChangeDWA Department of Water Affairs
CBD Convention on Biological Diversity ECA Environment Conservation Act CBNRM Community Based Natural Resources Management EDMS Electronic Document Management System
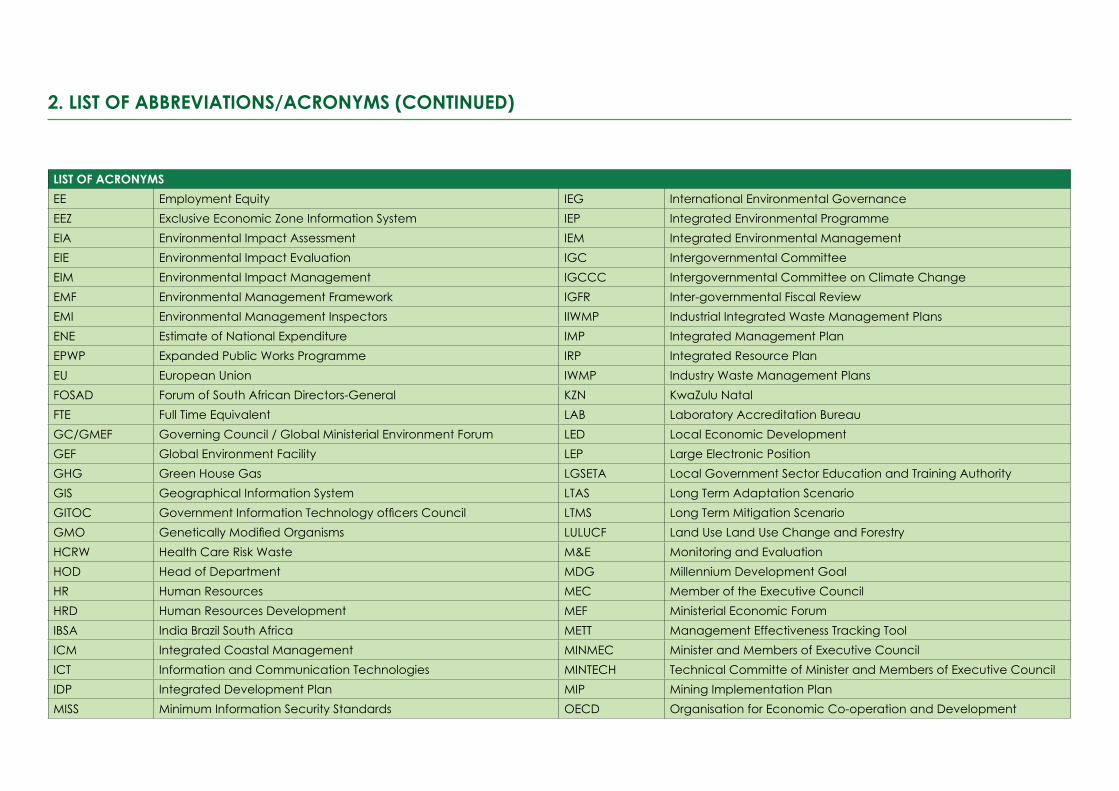
LIsT OF ACRONyMsEE Employment Equity IEG International Environmental Governance EEZ Exclusive Economic Zone Information System IEP Integrated Environmental Programme EIA Environmental Impact Assessment IEM Integrated Environmental Management EIE Environmental Impact Evaluation IGC Intergovernmental Committee EIM Environmental Impact Management IGCCC Intergovernmental Committee on Climate Change EMF Environmental Management Framework IGFR Inter-governmental Fiscal Review EMI Environmental Management Inspectors IIWMP Industrial Integrated Waste Management Plans ENE Estimate of National Expenditure IMP Integrated Management Plan EPWP Expanded Public Works Programme IRP Integrated Resource Plan EU European Union IWMP Industry Waste Management Plans FOSAD Forum of South African Directors-General KZN KwaZulu Natal FTE Full Time Equivalent LAB Laboratory Accreditation Bureau GC/GMEF Governing Council / Global Ministerial Environment Forum LED Local Economic Development GEF Global Environment Facility LEP Large Electronic PositionGHG Green House Gas LGSETA Local Government Sector Education and Training AuthorityGIS Geographical Information System LTAS Long Term Adaptation ScenarioGITOC Government Information Technology officers Council LTMS Long Term Mitigation ScenarioGMO Genetically Modified Organisms LULUCF Land Use Land Use Change and ForestryHCRW Health Care Risk Waste M&E Monitoring and EvaluationHOD Head of Department MDG Millennium Development GoalHR Human Resources MEC Member of the Executive CouncilHRD Human Resources Development MEF Ministerial Economic ForumIBSA India Brazil South Africa METT Management Effectiveness Tracking ToolICM Integrated Coastal Management MINMEC Minister and Members of Executive CouncilICT Information and Communication Technologies MINTECH Technical Committe of Minister and Members of Executive CouncilIDP Integrated Development Plan MIP Mining Implementation PlanMISS Minimum Information Security Standards OECD Organisation for Economic Co-operation and Development
2. LIsT OF AbbREVIATIONs/ACRONyMs (CONTINuEd)

LIsT OF ACRONyMsMLRA Marine Living Resources Act OHS Occupational Health and SafetyMoA Memorandum of Agreement OSDP Office on the Status of the Disabled PersonsMoU Memorandum of Understanding PAIA Promotion of Access to Information ActMP Member of Parliament PEI Prince Edward IslandMPA Marine Protected Area PFMA Public Finance Management ActMPRDA Mineral and Petroleum Resources Development Act PIPS People-Centred, Integrity, Performance and SustainabilityMRV Monitoring, Reporting and Verification PMDS Performance Management Development SystemMSP Master Systems Plan POP Persistent Organic PollutantsMSRG Multi-stakeholders Reference Group PPP Public Private PartnershipMTEF Medium Term Expenditure Framework PSETA Public Service Sector Education and Training AuthorityMTSF Medium Term Strategic Framework PWD People with DisabilitiesNAQI National Air Quality Indicator S24G Section 24 GNBSAP National Biodiversity and Action Plan S30 Section 30NCCC National Committee on Climate Change SA South AfricaNCMP National Coastal Management Programme SAAQIS South African Air Quality Information SystemNDF Non Detriment Finding SADC Southern African Development CommunityNEAS National Environmental Authority System SAEO South Africa Environment OutlookNEM National Environmental Management SALGA South African Local Government AssociationNEMA National Environmental Management Act SANAE South African National Antarctic ExpeditionsNEMBA National Environmental Management: Biodiversity Act, 2004 SANAP South African National Antarctic ProgrammeNEMPAA National Environmental Management: Protected Areas Act, 2003 SANBI South African National Biodiversity InstituteNEPAD New Partnership for Africa’s Development SAWS South African Weather ServicesNPA National Prosecuting Authority SCM Supply Chain ManagementNPOA National Plan of Action SDIP Service Delivery Improvement PlanNSSD National Strategy for Sustainable Development SETA Sector Education and Training AuthorityNYS National Youth Services TOR Terms of Reference
2. LIsT OF AbbREVIATIONs/ACRONyMs (CONTINuEd)
6 DEPARTMENT OF ENVIRONMENTAL AFFAIRS: VOTE 30
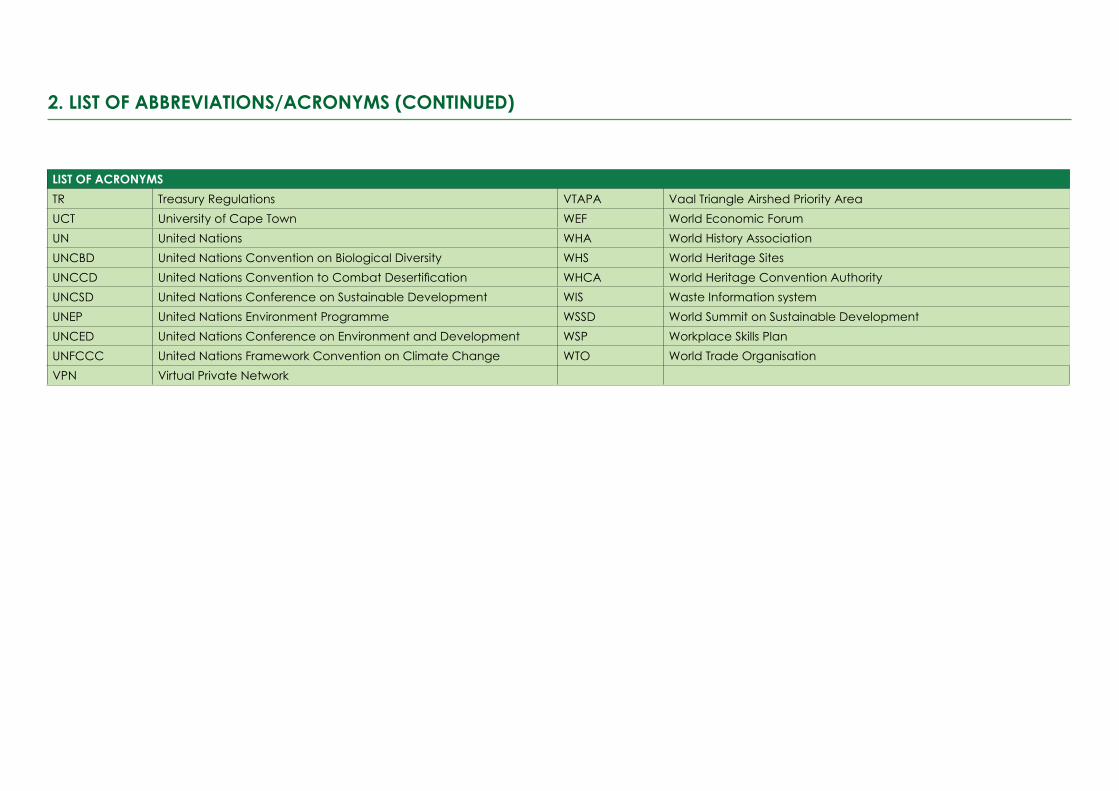
LIsT OF ACRONyMsTR Treasury Regulations VTAPA Vaal Triangle Airshed Priority AreaUCT University of Cape Town WEF World Economic ForumUN United Nations WHA World History AssociationUNCBD United Nations Convention on Biological Diversity WHS World Heritage SitesUNCCD United Nations Convention to Combat Desertification WHCA World Heritage Convention AuthorityUNCSD United Nations Conference on Sustainable Development WIS Waste Information systemUNEP United Nations Environment Programme WSSD World Summit on Sustainable DevelopmentUNCED United Nations Conference on Environment and Development WSP Workplace Skills PlanUNFCCC United Nations Framework Convention on Climate Change WTO World Trade OrganisationVPN Virtual Private Network
2. LIsT OF AbbREVIATIONs/ACRONyMs (CONTINuEd)

8 DEPARTMENT OF ENVIRONMENTAL AFFAIRS: VOTE 30
3. FOREwORd by ThE MINIsTER
It is with pleasure that I present you with the 2014/15 Annual Report of the Department of Environmental Affairs.
As a responsible global citizen, we have set short, medium and long-term goals in our transition towards an environmentally sustainable, climate-change resilient, low-carbon economy and just society.
Although South Africa makes up just 2% of the global land area it is home to almost 10% of the world’s plants and 7% of the planet’s reptiles, birds and mammals. This makes South Africa, the world’s third most mega-biodiverse country, after Indonesia and Brazil, and highlights the
responsibility we have towards conserving our biodiversity.
Our global responsibilities extend to halting damage to our ozone layer, for the benefit of future generations. South Africa’s approach is one of promoting sustainable development by prioritising climate change responses that have significant mitigation benefits, and have significant economic growth, job creation and poverty alleviation benefits. This climate resilient, low carbon sustainable development path is being achieved through a fundamental shift in our current energy supply, away from a predominant reliance on coal, to mixed energy sources that includes coal, nuclear, natural gas and shale-gas.
The Fifth Assessment Report of the Inter-governmental Panel on Climate Change confirms that global emissions have risen to unprecedented levels –with negative effects on agriculture, human health, ecosystems, water supplies and people’s livelihoods worldwide. We are proud of the discussions and levels of commitment shown and displayed by various Departments and partners at the National Climate Change Response Dialogue in November 2014, ahead of the 20th Conference of Parties to the United National Convention on Climate Change in Peru.
As a sector, our work is guided by Section 24 of our country’s Constitution which stipulates that all South Africans have the right to an environment that is not harmful to their health or well-being, and to have the environment protected for the benefit of present and future generations.
Our vision as a country is outlined in the National Development Plan, with sub-plans as National Strategy for Sustainable Development and Action Plan; the Green Economy Strategy; the New Growth Path and the National Climate Change Response Policy.
Over the past 20 years of democracy, the Department of Environmental Affairs in its various iterations has had to transform from the approach of solely leading on environmental issues from a policy perspective, to also encompass the equitable distribution of benefits derived from the environment to our people. As such the Department has remained active in the national efforts to address poverty and unemployment, through the 14 Expanded Public Works Programmes in the environment sector.
During the financial year in review, we continued to align our programmes with the vision of the National Development Plan. These are developments along an internationally competitive, sustainable, climate resilient and low carbon development path which include the creation of green jobs.
In order to facilitate and support accelerated implementation of sustainable development initiatives, we have made amendments to the National Environmental Management Act.
These were aimed at developing an integrated environmental regulatory system that now includes environmental authorisation for mining developments.
During the year in review, we rolled out the One Environmental System. This is a system that streamlines the licensing process for mining, environmental authorisations and water use. The One Environmental System represents our commitment to improve the ease of doing business and further enhances South Africa’s global competitiveness as a mining investment destination.
We are alive to the fact that when we work for the environment, it will continue to work for us. The National Waste Management Act and National Waste Management Strategy have established an economic basis for viable recycling by placing sufficient economic value on waste. Waste is indeed wealth.
We developed our Oceans Policy in 2014. The Oceans Policy identifies economic, commercial, industrial or large-scale livelihood opportunities presented by the sustainable use and management of our oceans.
9Annual Report 2014/15
Led by President Jacob Zuma and guided by the National Development Plan, we launched Oceans Economy Operation Phakisa in July last year as a “big fast results mechanism” to seize these oceans economy opportunities. This will unlock the economic potential of the oceans while increasing our country’s ability to cope with, and adapt to, the impacts of climate change.
Ours are programmes that seek to ensure that democratic dispensation continues to benefit all our people irrespective of their station in life.
It is with this in mind that air pollution is recognised as a very serious health hazard. Every effort is being made to ensure the realisation of every South African’s right to quality air. Industry is being encouraged to reduce emissions and the minimum emission standards are being strictly monitored and enforced.
I am pleased to present the 2014/15 annual report which complies with all statutory reporting requirements, particularly section 40(1) of the Public Finance Management Act (PFMA), 1999, and paragraph 18 of the National Treasury Regulations.
Ms Edna Molewa, MP
Minister of Environmental Affairs

10 DEPARTMENT OF ENVIRONMENTAL AFFAIRS: VOTE 30
4. sTATEMENT by ThE dEPuTy MINIsTER
One of government’s driving goals is to build a healthy South Africa. This noble effort find resonance in the constitution’s promise that all South Africans have a right to an environment that is not harmful to their health or well-being, and to have the environment protected, for the benefit of present and future generations.
The 2014/15 financial year saw a considerable increase in our contribution as the Department of Environmental Affairs towards the achievement of this constitutional imperative.
We continued to implement programmes and projects closely aligned with the restoration of eco-systems so as to conserve the environment for present and future generations.
In the year under review we succeeded in having the False Bay Nature Reserve in the City of Cape Town inscribed as our 22nd Ramsar site demonstrating our commitment towards sustainable development. Our coastal areas were also singled out for targeted intervention to address the threats posed by pollution and litter. In this regard we successfully mobilised communities for a coastal clean up campaign on International Coastal Clean up Day.
The period under review focused on strengthening existing environmental awareness programmes for all sectors of our society to reinforce harmonious links with the environment. We also sought to fortify our partnerships with our public entities and other private sector players to ensure that we take positive environmental messages to new heights through community awareness on important environmental concerns such as waste management including e-waste and wildlife crime leading to important initiatives such as the openining of a light bulb recycling plant in KwaZulu Natal as part of our collective response to e-waste management and the establishment of 12 buyback centres.
The People and Parks Programme is one of the Department’s initiatives aimed at addressing issues at the interface between conservation and communities, particularly with regards to the realisation of tangible economic and social benefits by communities who were previously displaced by the establishment of protected areas.
In the year under review the Department hosted a successfull People and Parks
Conference where 14 title deeds were handed over to claimants whose land forms part of the protected areas. In addition, we also took 10 community members from Limpopo, KwaZulu-Natal, Mpumalanga and the North West to attend the 6th World Parks Congress in Australia where these community members delivered a presentation on community involvement in matters of protected areas management and related work.
During the period under review, the department also made a significant contribution to government’s skills development and job creation targets through the implementation of environmental and culture sector programmes which are aligned to the Expanded Public Works Programme.
In the period under review, the Department created 85 140 work opportunities, 33 318 Full Time Equivalent of work opportunities. 53% of these work opportunities were created for women, 70 % for youth and 1.66% for people with disability. It has impacted on the lives of youth on multiple levels through exposure to work place experience and contributions to the livelihoods of families.
We take pride in the work of the sector and the leadership our Department continues to offer the sector in air quality management. Through the Annual Air Quality Governance Lekgotla, we have continued to highlight the sustained effort by the government to mitigate the consequences of apartheid’s poor environmental planning on historically marginalised communities.
The 2014 State of Air Report showed improvement in air quality at national level. However, the Department remains conscious of the fact that there has not been a significant reduction of pollution in the priority areas. Our programmes should at all times link the environment to the people, for it is when we have done that, that we will be on the path to getting ordinary people to understand the worth and significance of our environment to our lives.
Allow me to join the Minister in presenting the Department of Environmental Affair’s 2014/15 Annual Report.
barbara Thomson, MP
deputy Minister of Environmental Affairs

11Annual Report 2014/15
5. REPORT OF ThE ACCOuNTING OFFICER
Overview of the Operations of the department The mandate and core business of the Department of Environmental Affairs is underpinned by Section 24 of the Constitution of South Africa, which affords all citizens the right to (a) an environment that is not harmful to their health or well-being; and (b) to have the environment protected, for the benefit of present and future generations, through reasonable legislative and other measures. To give effect to this constitutional mandate, the Department has developed a legislative/regulatory framework which consists of environmental laws, regulations, policies and
tools for implementation. Implementation of this regulatory framework is facilitated through various measures including capacity building, environmental compliance and enforcement and continuous review and enhancement. The long term vision of the Department is a “prosperous and equitable society living in harmony with our natural resources”. To support the achievement of this vision, three strategic oriented goals have been identified as follows:
• Environmental assets conserved, valued, sustainably used, protected and continually enhanced
• Enhanced socio-economic benefits and employment creation for the present and future generations from a healthy environment
• A department that is fully capacitated to deliver its services efficiently and effectively
The work of the Department is carried out through a structure which has seven programmes (as outlined in this report), reflecting the different but related key focus areas of environmental management. These focus areas are biodiversity protection and management, managing and mitigating threats to environmental integrity and health of citizens (Climate Change, Pollution, alien invasive etc.) and ensuring that socio-economic benefits are derived from the environment. The specific strategic objectives and performance measures (indicators) and targets (medium term and annual targets) aimed at achieving the relevant goals have been identified in the Strategic and Annual Plans of the department and annual progress reported in detail in this Annual Report.
Overview of the Results, Challenges and significant projects/events for the year• The approved Annual Performance Plan of the Department for the 2014/15 had a
total of 169 planned annual targets across the seven programmes of DEA. As per the detailed audited progress report on predetermined objectives for the period under review, a total of 137 planned annual targets were achieved. This translated into 81% (137/169) overall achievement on predetermined objectives. A total of 32 annual targets were not achieved as planned, however, 27 of these 32 were partially achieved (i.e. even though the actual target was not achieved, significant progress towards the target was made and due for completion in the first quarter of 2015/16 financial year). Progress toward the achievement of the remaining 5 annual targets was significantly delayed due to various challenges as outlined in the detailed report.
• In general, the key challenge which confronted the department was financial constraints. This posed a number of challenges over and above funding the priorities/operations of the department. These included inability to fund the ideal structure of the department to deliver on planned objectives. A decision was made to delay filling of post and funds were reprioritised towards operations. In other instances the department explored other means to resource priorities such as partnerships with international donors. This posed its own fair share of challenges particularly the delays in accessing the funds, resulting in delays on achievement of targets.
• In a number of other instances the work of the department requires consultation, consensus and collaboration with a variety of stakeholders. This at times led to delays which are outside of the control of the department and not always easy to anticipate and incorporate with a high level of accuracy during the planning process

12 DEPARTMENT OF ENVIRONMENTAL AFFAIRS: VOTE 30
The significant project(s) and/or event(s) for the year are as follows:
• Participation in the Oceans Economy “Operation Phakisa” in June 2014, a Government initiative aimed at identifying and exploring the economic potential of our Oceans.
• Hosting of National events for the celebrate/commemorate key environment days:
World Wetlands Day
The 2014/15 celebration of the World Wetlands Day was held at the False Bay Nature Reserve, in Cape Town. This year’s key messages focused on the wise use of the wetlands and hoe to ensure that they can fully deliver their valuable role in supporting human well-being and biological diversity. The day recognized that wetlands are under threat due to human activities, pollution of water and reduction of water resources and that these threats could have dire consequences to the environment.
World Oceans Day
The Department of Environmental Affairs will join the rest of the world in celebrating the annual World Oceans Day (WOD) in Port Elizabeth. The celebration was held under the theme: Together we have the power to protect our ocean which recognises the impact of climate change on our oceans and our people.
World day to Combat Desertification (WDCD)
The Day was celebrated jointly with the Free State Provincial Government and the Mantsopa Municipality in Ladybrand, Free State Province. The event was used to create awareness concerning land desertification and equip the youth with skills which will enable them to actively participate in environmental management whilst contributing to socio-economic development. As part of awareness raising exercise, an exhibition where all stakeholders displayed the services and products of their respective organizations was organized and the politicians were given a brief tour.
Marine Week
The Marine Week was celebrated following the launch by Minister Edna Molewa in Cape Town. National Marine Week is a campaign that aims to educate all South Africans about the role oceans play in their daily lives. It is becoming increasingly evident that the true value of the ocean remains mostly unexplored and mysterious with a range of potential opportunities never considered before.
Hosting of strategic multi stakeholder consultation/engagement platforms:
Annual Air Quality Lekgotla
The Department hosted the 9th Annual Air Quality Governance Lekgotla in KwaZulu-Natal. The Lekgotla is an annual gathering that brings together various Air Quality Practitioners to deliberate on various issues affecting the implementation of the nationsl air quality law. The 2014 Lekgotla marked ten years since the promulgation of the National Environmental Management: Air Quality Act (39) of 2004 “AQA” .Since then, government has been implementing several programmes at the national and local level in an effort to improve the quality of air and protect the right of all in South African to air that is not harmful to their health and wellbeing. The gathering was held under the theme “A Decade of working together to defend the right to clean air”.
13Annual Report 2014/15
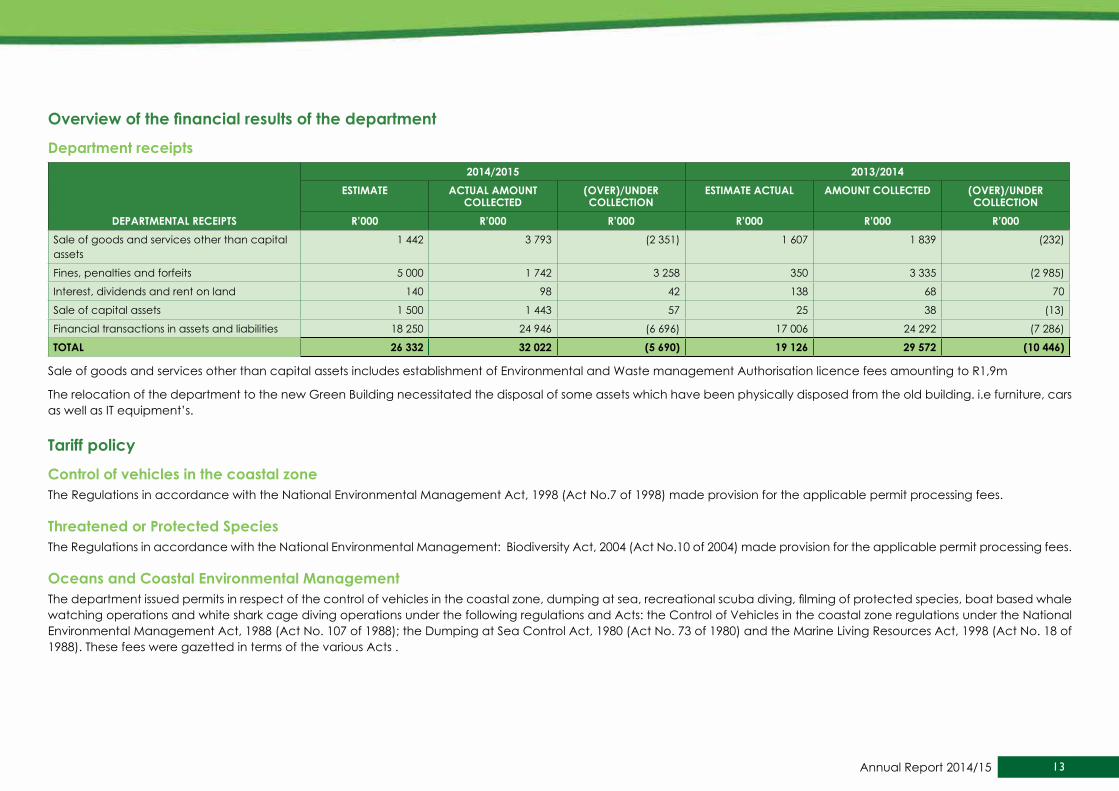
Overview of the financial results of the department
department receipts
dEPARTMENTAL RECEIPTs
2014/2015 2013/2014EsTIMATE ACTuAL AMOuNT
COLLECTEd(OVER)/uNdER COLLECTION
EsTIMATE ACTuAL AMOuNT COLLECTEd (OVER)/uNdER COLLECTION
R’000 R’000 R’000 R’000 R’000 R’000Sale of goods and services other than capital assets
1 442 3 793 (2 351) 1 607 1 839 (232)
Fines, penalties and forfeits 5 000 1 742 3 258 350 3 335 (2 985)
Interest, dividends and rent on land 140 98 42 138 68 70
Sale of capital assets 1 500 1 443 57 25 38 (13)
Financial transactions in assets and liabilities 18 250 24 946 (6 696) 17 006 24 292 (7 286)
TOTAL 26 332 32 022 (5 690) 19 126 29 572 (10 446)
Sale of goods and services other than capital assets includes establishment of Environmental and Waste management Authorisation licence fees amounting to R1,9m
The relocation of the department to the new Green Building necessitated the disposal of some assets which have been physically disposed from the old building. i.e furniture, cars as well as IT equipment’s.
Tariff policy
Control of vehicles in the coastal zoneThe Regulations in accordance with the National Environmental Management Act, 1998 (Act No.7 of 1998) made provision for the applicable permit processing fees.
Threatened or Protected speciesThe Regulations in accordance with the National Environmental Management: Biodiversity Act, 2004 (Act No.10 of 2004) made provision for the applicable permit processing fees.
Oceans and Coastal Environmental Management The department issued permits in respect of the control of vehicles in the coastal zone, dumping at sea, recreational scuba diving, filming of protected species, boat based whale watching operations and white shark cage diving operations under the following regulations and Acts: the Control of Vehicles in the coastal zone regulations under the National Environmental Management Act, 1988 (Act No. 107 of 1988); the Dumping at Sea Control Act, 1980 (Act No. 73 of 1980) and the Marine Living Resources Act, 1998 (Act No. 18 of 1988). These fees were gazetted in terms of the various Acts .
14 DEPARTMENT OF ENVIRONMENTAL AFFAIRS: VOTE 30
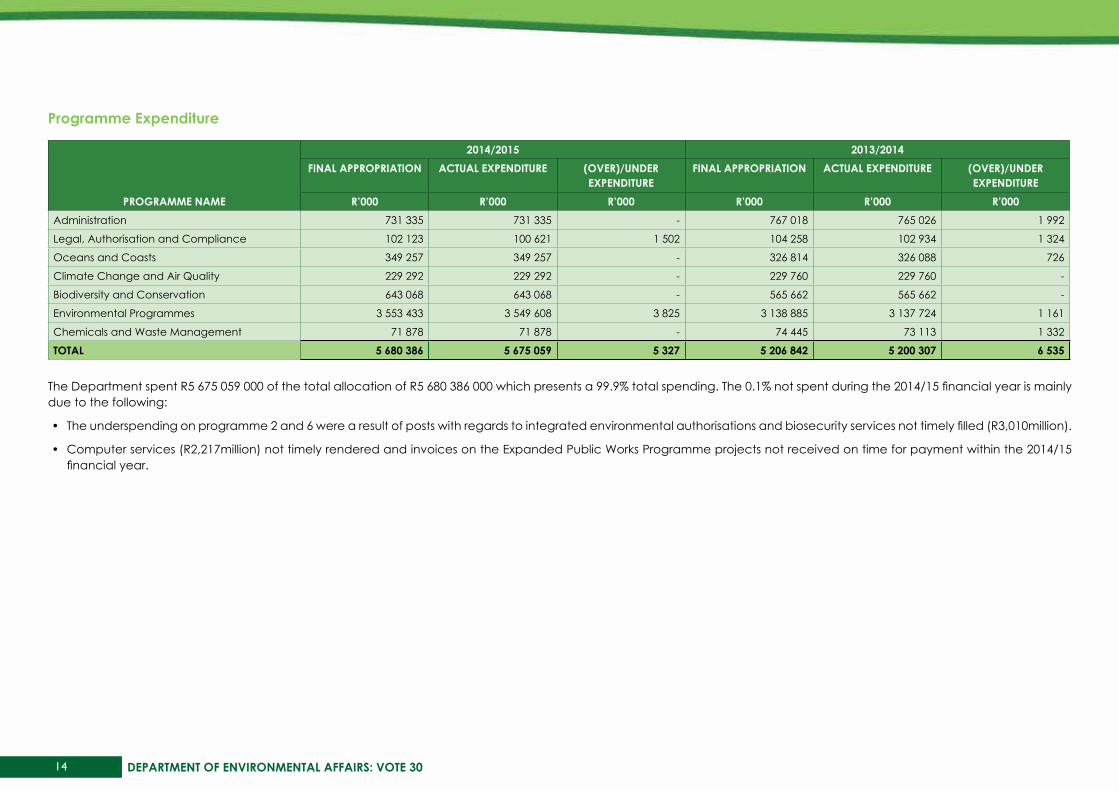
Programme Expenditure
PROGRAMME NAME
2014/2015 2013/2014FINAL APPROPRIATION ACTuAL EXPENdITuRE (OVER)/uNdER
EXPENdITuREFINAL APPROPRIATION ACTuAL EXPENdITuRE (OVER)/uNdER
EXPENdITuRE R’000 R’000 R’000 R’000 R’000 R’000
Administration 731 335 731 335 - 767 018 765 026 1 992
Legal, Authorisation and Compliance 102 123 100 621 1 502 104 258 102 934 1 324
Oceans and Coasts 349 257 349 257 - 326 814 326 088 726
Climate Change and Air Quality 229 292 229 292 - 229 760 229 760 -
Biodiversity and Conservation 643 068 643 068 - 565 662 565 662 -
Environmental Programmes 3 553 433 3 549 608 3 825 3 138 885 3 137 724 1 161
Chemicals and Waste Management 71 878 71 878 - 74 445 73 113 1 332
TOTAL 5 680 386 5 675 059 5 327 5 206 842 5 200 307 6 535
The Department spent R5 675 059 000 of the total allocation of R5 680 386 000 which presents a 99.9% total spending. The 0.1% not spent during the 2014/15 financial year is mainly due to the following:
• The underspending on programme 2 and 6 were a result of posts with regards to integrated environmental authorisations and biosecurity services not timely filled (R3,010million).
• Computer services (R2,217million) not timely rendered and invoices on the Expanded Public Works Programme projects not received on time for payment within the 2014/15 financial year.
15Annual Report 2014/15
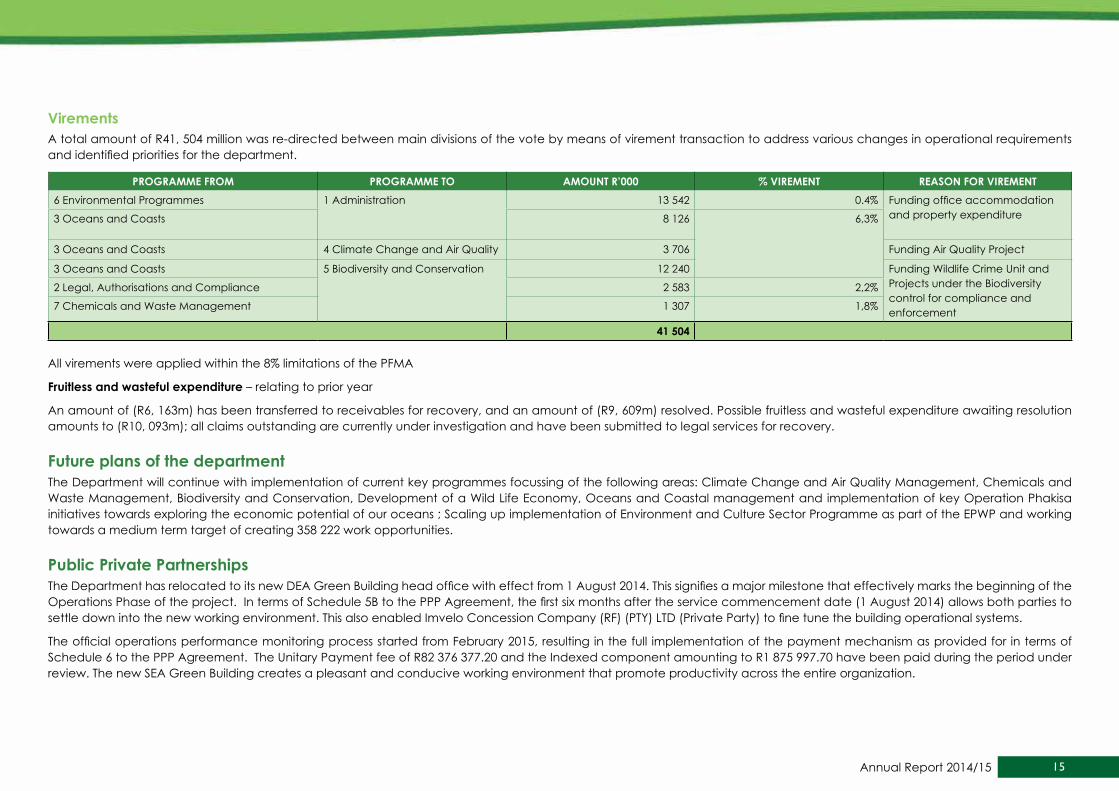
Virements A total amount of R41, 504 million was re-directed between main divisions of the vote by means of virement transaction to address various changes in operational requirements and identified priorities for the department.
PROGRAMME FROM PROGRAMME TO AMOuNT R’000 % VIREMENT REAsON FOR VIREMENT6 Environmental Programmes 1 Administration 13 542 0.4% Funding office accommodation
and property expenditure3 Oceans and Coasts 8 126 6,3%
3 Oceans and Coasts 4 Climate Change and Air Quality 3 706 Funding Air Quality Project
3 Oceans and Coasts 5 Biodiversity and Conservation 12 240 Funding Wildlife Crime Unit and Projects under the Biodiversity control for compliance and enforcement
2 Legal, Authorisations and Compliance 2 583 2,2%
7 Chemicals and Waste Management 1 307 1,8%
41 504
All virements were applied within the 8% limitations of the PFMA
Fruitless and wasteful expenditure – relating to prior year
An amount of (R6, 163m) has been transferred to receivables for recovery, and an amount of (R9, 609m) resolved. Possible fruitless and wasteful expenditure awaiting resolution amounts to (R10, 093m); all claims outstanding are currently under investigation and have been submitted to legal services for recovery.
Future plans of the departmentThe Department will continue with implementation of current key programmes focussing of the following areas: Climate Change and Air Quality Management, Chemicals and Waste Management, Biodiversity and Conservation, Development of a Wild Life Economy, Oceans and Coastal management and implementation of key Operation Phakisa initiatives towards exploring the economic potential of our oceans ; Scaling up implementation of Environment and Culture Sector Programme as part of the EPWP and working towards a medium term target of creating 358 222 work opportunities.
Public Private Partnerships The Department has relocated to its new DEA Green Building head office with effect from 1 August 2014. This signifies a major milestone that effectively marks the beginning of the Operations Phase of the project. In terms of Schedule 5B to the PPP Agreement, the first six months after the service commencement date (1 August 2014) allows both parties to settle down into the new working environment. This also enabled Imvelo Concession Company (RF) (PTY) LTD (Private Party) to fine tune the building operational systems.
The official operations performance monitoring process started from February 2015, resulting in the full implementation of the payment mechanism as provided for in terms of Schedule 6 to the PPP Agreement. The Unitary Payment fee of R82 376 377.20 and the Indexed component amounting to R1 875 997.70 have been paid during the period under review. The new SEA Green Building creates a pleasant and conducive working environment that promote productivity across the entire organization.

16 DEPARTMENT OF ENVIRONMENTAL AFFAIRS: VOTE 30
The Imvelo Concession Company (Pty) Ltd consists of the following concessionaires:
Grinakar/Aveng LTD 30%
Old Mutual PLC 30%
Wiphold LTD; and 20%
Kagiso/Tiso Holdings 20%
discontinued activities / activities to be discontinuedNone
New or proposed activities None
supply chain management No unsolicited bids during the financial year 2014/15
Indicate whether sCM processes and systems are in place to prevent irregular expenditure • SCM Processes and systems are in place such as financial delegations, policies,
practice notes and relevant legislations.
• Bid Committees (Specification, Evaluation and Adjudication) are in place and members are appointed in writing
• When invoices are received, they are verified against the checklist to establish possible irregular expenditure.
• When irregular expenditure is discovered, it is recorded and reported to the relevant authority for formal responses.
• Updated Asset register in place
• Disposal committee in place
Challenges experienced in sCM and how they were resolved • Supplier Database system outdated thus not compatible to the latest technology and
unable the automation of verification and validation of Compliance requirement (e.g. tax clearance certificate, CIPC information, BEE, etc.)
solution: National Treasury has started to develop a central supplier database system that will enable the automation of verification and validation of compliance requirements, increase SCM efficiency and will be ready for implementation on 1 April 2016.
• Market research not done regularly, resulting in deviations from the normal procurement processes, e.g Single Source/Sole Providers/Urgent.
solution: market analysis to be conducted to minimise audit exposure.
• Inaccurate commitment.
solution: Source documents to be verified against the commitment report.
• Failing to report deviations exceeding R1 million to National Treasury and Auditor-General. Solutions: EDMS system was developed to manage the deviations submission and reporting.
• Delays in initiation of projects, Bid Evaluation and Adjudication Committees.
solutions: Monthly follow ups with the relevant project managers and Bid Committee members
• No communication between Branches and Supply Chain Management with regard to progress on the procurement plan.
solutions: to engage monthly with branch administrators.
• Late submission of unplanned projects on the procurement plan without CFO approval.
solutions: unplanned projects are approved by the CFO prior to implementation.
• Project managers not submitting closeout reports and the renewal of contract on time regarding expired contract.
solutions: System to be implemented to manage the total contract administration.
17Annual Report 2014/15
Gifts and donations received in kind from non-related parties None
Exemptions and deviations received from the National TreasuryIn the previous and the current financial year the National Treasury exempted the department from applying the Modified Cash Standard in respect of infrastructure development projects and to allow reporting as per the approved economic structure and appropriation.
Events after the reporting date None
Other None
Acknowledgement/s or Appreciation I wish to express my gratitude to the Minister and the Deputy Minister for their leadership and guidance in advancing the Department specifically and the sector in general. The progress and impact is also as a result of the support and constructive partnership with other key stakeholders within the sector and the broader society for which we are also grateful.
Conclusion I am also thankful to our Management team and all our employees for their hard work and continued commitment in ensuring that we deliver on our obligations and commitments to the people of South Africa. I look forward to another year in which we all continue to build on our achievements and working together in finding innovative ways to overcome our challenges and ensure that the constitutionally enshrined environmentally right remains a reality to all of society.
Ms Nosipho Ngcabadirector-General
date: 31 july 2015

18 DEPARTMENT OF ENVIRONMENTAL AFFAIRS: VOTE 30
6. sTATEMENT OF REsPONsIbILITy ANd CONFIRMATION OF ACCuRACy FOR ThE ANNuAL REPORT
To the best of my knowledge and belief, I confirm the following:
All information and amounts disclosed throughout the Annual Report are consistent.
The Annual Report is complete, accurate and is free from any omissions.
The Annual Report has been prepared in accordance with the guidelines on the Annual Report as issued by the National Treasury.
The Annual Financial Statements (Part E) have been prepared in accordance with the modified cash standard and the relevant frameworks and guidelines issued by the National Treasury.
The Accounting Officer is responsible for the preparation of the Annual Financial Statements and for the judgements made in this information.
The Accounting Officer is responsible for establishing, and implementing a system of internal control that has been designed to provide reasonable assurance as to the integrity and reliability of the performance information, the human resources information and the Annual Financial Statements.
The external auditors are engaged to express an independent opinion on the Annual Financial Statements.
In my opinion, the annual report fairly reflects the operations, the performance information, the human resources information and the financial affairs of the Department for the financial year ended 31 March 2015.
Yours faithfully
Ms Nosipho Ngcabadirector-Generaldate: 31 july 2015

19Annual Report 2014/15
7. sTRATEGIC OVERVIEw
VisionA prosperous and equitable society living in harmony with our natural resources.
MissionProviding leadership in environmental management, conservation and protection towards sustainability for the benefit of South Africans and the global community.
departmental valuesWe are driven by our Passion as custodians and ambassadors of the environment, we have to be Proactive and foster Innovative thinking and solutions to environmental management premised on a People centric approach that recognises the centrality of Batho-Pele, for it is when we put our people first that we will serve with Integrity, an important ingredient for high Performance driven organisation such as ours.
8. LEGIsLATIVE ANd OThER MANdATEsThe mandate and core business of the Department of Environmental Affairs is underpinned by the Constitution of the Republic of South Africa and all other relevant legislation and policies applicable to the government, including the Batho Pele White Paper. In addressing the mandate for sound environmental management, the following policies, legislation and regulations have been enacted to give effect to the constitutional environmental rights of all South Africans in its Section 24, which provides a specific definition of the term sustainable development, namely that: Everyone has the right to an environment that is not harmful to their health or well-being; and to have the environment protected, for the benefit of present and future generations, through reasonable legislative and other measures that
i. Prevent pollution and ecological degradation;
ii. Promote conservation; and
iii. Secure ecologically sustainable development and use of natural resources while promoting justifiable economic and social development.
In the context of this constitutional definition, the policies, legislation and regulations have been enacted in the form of overarching and enabling Integrated Environmental Management legislation which provides for subsidiary issue specific legislation on biodiversity and heritage resources; oceans and coasts; climate change and air quality management; and waste and chemicals management. There have not been any relevant court rulings that had a significant ongoing impact on the mandate of the department and service delivery obligations.

20 DEPARTMENT OF ENVIRONMENTAL AFFAIRS: VOTE 30
INTEGRATEd ENVIRONMENTAL MANAGEMENT
Policies• White Paper on Environmental Management, 1998.
• National Framework Strategy for Sustainable Development, 2009.
• National Strategy for Sustainable Development 1, 2011.
Acts Of ParliamentThe National Environmental Management Act (NEMA), 1998, (Act No. 107 of 1998), which establishes the concepts of participatory, cooperative and developmental governance in environmental management. It establishes principles for environmental management and provides for structures to facilitate these.
The National Environmental Management Amendment Act, 2003 (Act No. 46 of 2003), which deals with compliance and enforcement and provides for Environmental Management Inspectors (EMIs). The National Environmental Management Amendment Act, 2004 (Act No. 8 of 2004), which streamlines the process of regulating and administering the impact assessment process. Chapter 5 of the act lays down procedures with which the Minister or MEC, as the case may be, must comply before listing or delisting an activity.
The National Environment Laws Amendment Act, 2008 (Act No. 44 of 2008), which amends the National Environmental Management Act, 1998, so as to clarify any uncertainty in the act; authorises the Minister of Water Affairs and Forestry to designate persons as environmental management inspectors; provides for environmental management inspectors to be regarded as peace officers as contemplated in the Criminal Procedure Act, 1977; and amends the National Environmental Management: Air Quality Act, 2004, so as to substitute Schedule 1 of that act.
The National Environmental Management Amendment Act, 2008 (Act No. 62 of 2008), which empowers the Minister of Minerals and Energy to implement environmental matters in terms of the National Environmental Management Act, 1998, in so far as it relates to prospecting, mining, exploration or related activities; aligns environmental requirements in the Mineral and Petroleum Resources Development Act (MPRDA), Act 28 2002, with NEMA (1998), by providing for the use of one environmental system and by providing for environmental management programmes; and further regulates environmental authorisations.
The National Environment Laws Amendment Act, 2009 (Act No. 14 of 2009), which amends the Atmospheric Pollution Prevention Act, 1965, so as to adjust the penalties provided for in the said act, the Environment Conservation Act, 1989, so as to adjust the penalties provided for in the said act, the National Environmental Management: Air Quality Act, 2004, so as to provide for a processing fee to review a licence, and to include directors or senior managers in a juristic person for the criteria for a fit and proper person.
bIOdIVERsITy ANd hERITAGE REsOuRCEs
PoliciesWhite paper on conservation and sustainable use of biodiversity, 1997.
Acts Of ParliamentThe world heritage Convention Act, 1999 (Act No. 49 of 1999), which provides for the cultural and environmental protection and sustainable development of, and related activities in a world heritage site.
The National Environmental Management: Protected Areas Amendment Act, 2009 (Act 15 of 2009), which provides for the assignment of national parks, special parks and heritage sites to South African National Parks; makes provision for flight corridors and permission of the management authority to fly over a special national park, national park or heritage site; and provides for the winding up and dissolution of South African National Parks.
The National Environmental Management: biodiversity Act, 2004 (Act No. 10 of 2004), which significantly reforms South Africa’s laws regulating biodiversity. Its sets out the mechanisms for managing and conserving South Africa’s biodiversity and its components; protecting species and ecosystems that warrant national protection; the sustainable use of indigenous biological resources; the fair and equitable sharing of benefits arising from bioprospecting, including indigenous biological resources; and the establishment of the South African National Biodiversity Institute.
National Environmental Management: Protected Areas Act, 2003 (Act No. 57 of 2003) which provides for the protection and conservation of ecologically viable areas. It further provides for the establishment of a national register of protected areas and the proclamation and management of these areas.
The National Environmental Management: Protected Areas Amendment Act, 2004 (Act No. 31 of 2004), which provides for a national system of protected areas in South Africa

21Annual Report 2014/15
as part of a strategy to manage and conserve the country’s biodiversity. A significant part of this act is that the state is appointed as the trustee of protected areas in the country.
OCEANs ANd COAsTAL ENVIRONMENTAL MANAGEMENT
PoliciesWhite Paper for Sustainable Coastal Development in South Africa, 2000
Acts Of ParliamentThe National Environmental Management: Integrated Coastal Management Act, 2008 (Act No. 24 of 2008), which establishes a system of integrated coastal and estuarine management in the Republic; ensures that development and the use of natural resources within the coastal zone is socially and economically justifiable and ecologically sustainable; determines the responsibilities of organs of state in relation to coastal areas; controls dumping at sea and pollution in the coastal zone; and gives effect to South
Africa’s international obligations in relation to coastal matters.
sea shores Act, 1935, (Act No. 21 of 1935), which declares the President to be the owner of the seashore and the sea within South Africa’s territorial water and regulate the granting of rights and alienation thereof.
sea birds and seals Protection Act, 1973 (Act No. 46 of 1973), which provides for control over certain islands and rocks for the protection and conservation of seabirds and seals.
Dumping at Sea Control Act, 1980 (Act No. 73 of 1980), which regulates the control of dumping substances at sea.
sea Fishery Act, 1988 (Act No. 12 of 1988), most of the powers in terms of this Act were transferred to the Minister of Agriculture, Forestry and Fisheries. The Minister only retains powers in terms of section 38 of the Act.
Antartic Treaties Act, 1996 (Act No. 60 of 1996),which provides for the implementation of certain treaties relating to Antarctica. The treaty is primarily concerned with the regulation of activities in Antarctica, including territorial claims, research and strict environmental protection in general and the protection of certain identified species such as seals.
Marine Living Resources Act, 1998 (Act No. 18 of 1998), which deals with the long-term sustainable utilisation of marine living resources. Most of the powers and functions in
terms of this Act were transferred to the Minister of Agriculture Forestry and Fisheries. The Minister of Water and Environmental Affairs only retained functions pertaining to the Marine Protected Areas, regulatory powers that relates to the protection of the marine environment.
Prince Edward Islands Act, 1948 (Act No. 43 of 1948), which provides for the confirmation of the annexation to the Union of South Africa of the Prince Edward Islands, and for the administration, government and control of the said islands.
CLIMATE ChANGE ANd AIR QuALITy MANAGEMENT
PoliciesWhite Paper on National Climate Change Response, 2011.
Acts Of ParliamentThe National Environmental Management: Air Quality Act, 2004 (Act No. 39 of 2004), which reforms the law regulating air quality in order to protect the environment by providing reasonable measures for the prevention of pollution and ecological degradation and for securing ecologically sustainable development; and provides for national norms and standards regulating air quality monitoring.
south African weather service Act, 2001 (Act No. 8 of 2001), which established the South African Weather Service; determined its objects, functions and method of work, the manner in which it is to be managed. It governs and regulates its staff matters and financial affairs.
ChEMICALs ANd wAsTE MANAGEMENT
PoliciesWhite Paper on Integrated Pollution and Waste Management, 2000.
Acts Of ParliamentThe National Environmental Management: waste Act, 2008 (Act No. 59 of 2008), which reforms the law regulating waste management in order to protect health and the environment by providing reasonable measures for the prevention of pollution; provides for national norms and standards for regulating the management of waste by all spheres of government; and provides for the licensing and control of waste management activities.
22 DEPARTMENT OF ENVIRONMENTAL AFFAIRS: VOTE 30
ORGANIsATIONAL sTRuCTuRE
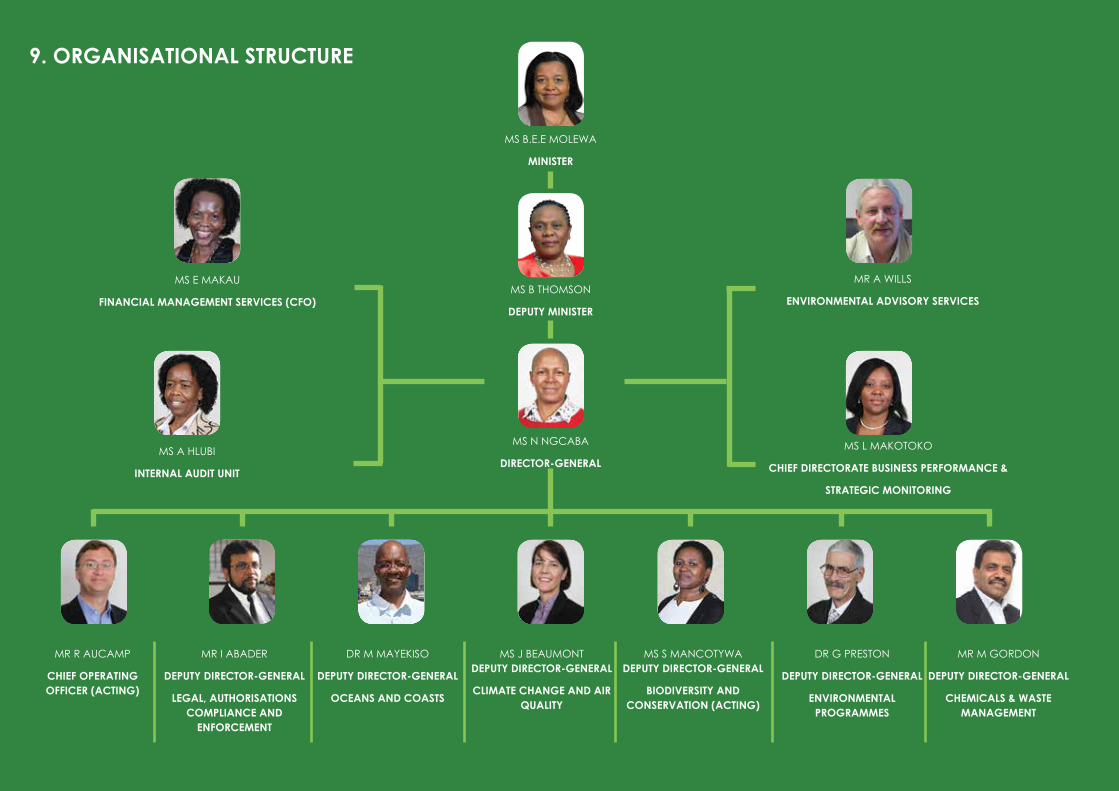
MR R AUCAMP
ChIEF OPERATING OFFICER (ACTING)
MR I ABADER
dEPuTy dIRECTOR-GENERAL
LEGAL, AuThORIsATIONs COMPLIANCE ANd
ENFORCEMENT
DR M MAYEKISO
dEPuTy dIRECTOR-GENERAL
OCEANs ANd COAsTs
MS S MANCOTYWA dEPuTy dIRECTOR-GENERAL
bIOdIVERsITy ANd CONsERVATION (ACTING)
DR G PRESTON
dEPuTy dIRECTOR-GENERAL
ENVIRONMENTAL PROGRAMMEs
MR M GORDON
dEPuTy dIRECTOR-GENERAL
ChEMICALs & wAsTE MANAGEMENT
MS L MAKOTOKO
ChIEF dIRECTORATE busINEss PERFORMANCE &
sTRATEGIC MONITORING
MR A WILLS
ENVIRONMENTAL AdVIsORy sERVICEs
MS E MAKAU
FINANCIAL MANAGEMENT sERVICEs (CFO)
MS A HLUBI
INTERNAL AudIT uNIT
9. ORGANIsATIONAL sTRuCTuRE
MS B.E.E MOLEWA
MINIsTER
MS B THOMSON
dEPuTy MINIsTER
MS J BEAUMONT dEPuTy dIRECTOR-GENERAL
CLIMATE ChANGE ANd AIR QuALITy
MS N NGCABA
dIRECTOR-GENERAL
23Annual Report 2014/15
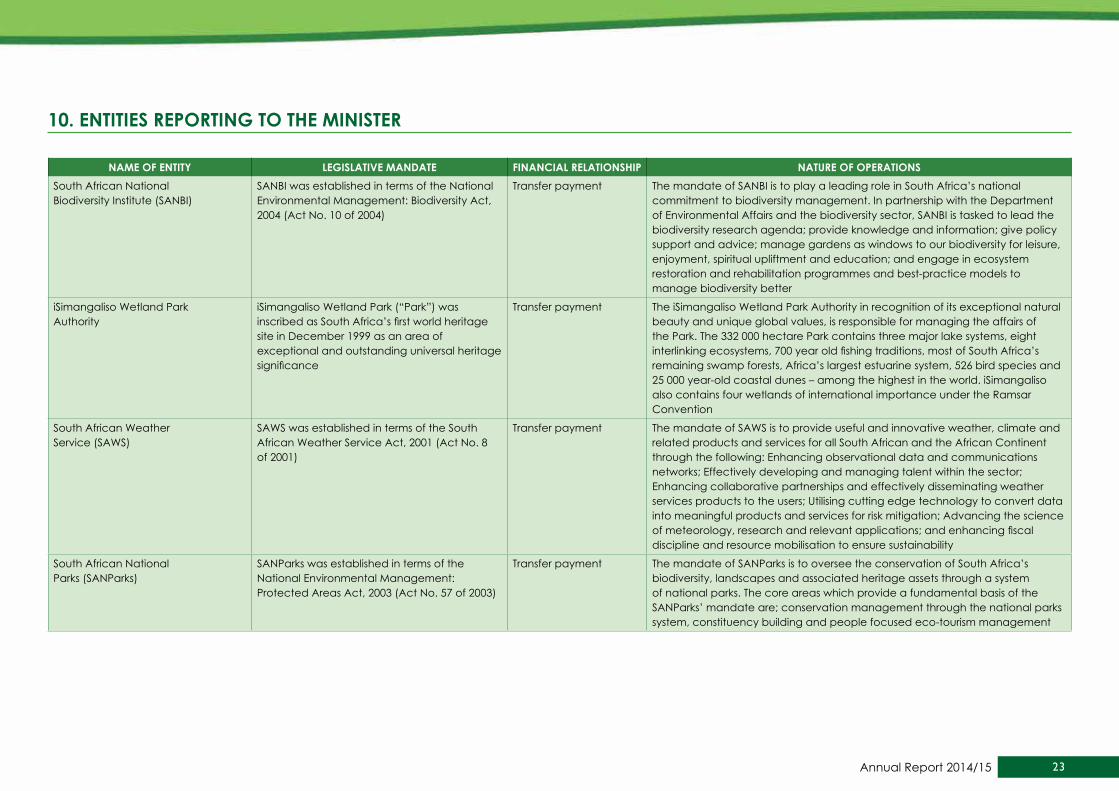
10. ENTITIEs REPORTING TO ThE MINIsTER
NAME OF ENTITy LEGIsLATIVE MANdATE FINANCIAL RELATIONshIP NATuRE OF OPERATIONsSouth African NationalBiodiversity Institute (SANBI)
SANBI was established in terms of the National Environmental Management: Biodiversity Act, 2004 (Act No. 10 of 2004)
Transfer payment The mandate of SANBI is to play a leading role in South Africa’s national commitment to biodiversity management. In partnership with the Department of Environmental Affairs and the biodiversity sector, SANBI is tasked to lead the biodiversity research agenda; provide knowledge and information; give policy support and advice; manage gardens as windows to our biodiversity for leisure, enjoyment, spiritual upliftment and education; and engage in ecosystem restoration and rehabilitation programmes and best-practice models to manage biodiversity better
iSimangaliso Wetland ParkAuthority
iSimangaliso Wetland Park (“Park”) was inscribed as South Africa’s first world heritage site in December 1999 as an area of exceptional and outstanding universal heritage significance
Transfer payment The iSimangaliso Wetland Park Authority in recognition of its exceptional natural beauty and unique global values, is responsible for managing the affairs of the Park. The 332 000 hectare Park contains three major lake systems, eight interlinking ecosystems, 700 year old fishing traditions, most of South Africa’s remaining swamp forests, Africa’s largest estuarine system, 526 bird species and 25 000 year-old coastal dunes – among the highest in the world. iSimangaliso also contains four wetlands of international importance under the Ramsar Convention
South African WeatherService (SAWS)
SAWS was established in terms of the South African Weather Service Act, 2001 (Act No. 8 of 2001)
Transfer payment The mandate of SAWS is to provide useful and innovative weather, climate and related products and services for all South African and the African Continent through the following: Enhancing observational data and communications networks; Effectively developing and managing talent within the sector; Enhancing collaborative partnerships and effectively disseminating weather services products to the users; Utilising cutting edge technology to convert data into meaningful products and services for risk mitigation; Advancing the science of meteorology, research and relevant applications; and enhancing fiscal discipline and resource mobilisation to ensure sustainability
South African NationalParks (SANParks)
SANParks was established in terms of the National Environmental Management: Protected Areas Act, 2003 (Act No. 57 of 2003)
Transfer payment The mandate of SANParks is to oversee the conservation of South Africa’s biodiversity, landscapes and associated heritage assets through a system of national parks. The core areas which provide a fundamental basis of the SANParks’ mandate are; conservation management through the national parks system, constituency building and people focused eco-tourism management

24 DEPARTMENT OF ENVIRONMENTAL AFFAIRS: VOTE 30
PART b: PERFORMANCE INFORMATION

25Annual Report 2014/15
1. AudITOR-GENERAL’s REPORT ON PREdETERMINEd ObjECTIVEs
1.1. I performed procedures to obtain evidence about the usefulness and reliability of the reported performance information for the following selected programmes presented in the annual performance report of the department for the year ended 31 March 2015:Programme 3: Oceans and Coasts on pages 51 to 55
Programme 4: Climate Change and Air Quality on pages 56 to 61
Programme 6: Environmental Programmes on pages 71 to 77
1.2. I evaluated the reported performance information against the overall criteria of usefulness and reliability.
1.3. I evaluated the usefulness of the reported performance information to determine whether it was presented in accordance with the National Treasury’s annual
reporting principles and whether the reported performance was consistent with the planned programmes. I further performed tests to determine whether indicators and targets were well defined, verifiable, specific, measurable, time bound and relevant, as required by the National Treasury’s Framework for managing programme performance information (FMPPI).
1.4. I assessed the reliability of the reported performance information to determine whether it was valid, accurate and complete.
1.5. I did not identify any material findings on the usefulness and reliability of the reported performance information for the following programmes:Programme 3: Oceans and Coasts Programme 4: Climate Change and Air Quality
Programme 6: Environmental Programmes

26 DEPARTMENT OF ENVIRONMENTAL AFFAIRS: VOTE 30
2. OVERVIEw OF dEPARTMENTAL PERFORMANCE
service delivery EnvironmentThe prevailing economic environment has resulted in a situation where Government in general and the Department specifically, is required to deliver more with existing or reduced resources. The Department is not always able to fund the approved structure and this impacts on capacity and speed at which we deliver on priorities. This is especially relevant in relation to processing of an increasing number of applications for environmental authorisations within regulated timeframes. A significant increase in a large number of Government Infrastructure development projects plus and addition of other normal private developments has resulted in much higher number of Environmental Impact Assessment (EIA) applications that the department has to process. The same capacity constraints are also relevant in carrying out activities aimed at ensuring compliance to and enforcement of environmental legislation such as environmental compliance inspections and criminal enforcement interventions. The delivery environment is further, impacted on by emerging environmental threats which were not previously funded such as climate change. In response, the Department continues to build partnerships and look for innovative ways to address these challenges and enhance efficiencies, which include partnerships with donors. The global economic environment has however led to a decrease in funds raised from donors. The other complication with donor funds is on processes followed before the funds are made available. In the climate change programme where most of the activities are funded through donor funds there have been delays in approval of the funding by the GIZ (Deutsche Gesellschaft für Internationale Zusammenarbeit) which resulted in delays in meeting some of the planned annual targets.
service delivery Improvement PlanAs required in terms of Part III.C.1-2 of the Public Service Regulations, the Department has a comprehensive Service Delivery Improvement Programme which is made up of an approved Service Delivery Charter and Service Delivery Improvement Plan (SDIP) supported by a service standard matrix that focuses on improving governance within the department. The Service Charter is placed at the entrance points in the department. The charter seeks to emphasise our commitment to serving the general public with humility, in line with the government principles of “Batho Pele”, which amongst others include exercising courtesy in our dealings with the public, consultation, openness and transparency, access to information and proving value for public resources. A system or mechanism for lodging any complaints relating to the work of the Department is also outlined in the Charter. Compliance with approved service standards is monitored internally on a quarterly basis and reported to Parliament and the general public in the Department’s Annual Report.
Main service standardsMAIN sERVICEs bENEFICIARIEs CuRRENT/ACTuAL sTANdARd OF
sERVICEdEsIREd OF sTANdARd OF sERVICE ACTuAL AChIEVEMENT
Response to fraud and corruption allegation
Internal Client /Members of the Public 100% reported fraud within timeframes
100% reported fraud within timeframes
27% (3/11). There are currently 11 reported fraud and corruption cases under different stages investigation
3 of the cases are within time frame and 11 are outside of time-frame
Finalisation of appeals Internal Clients 95% (38/40) of appeals were finalised within the prescribed timeframe
85% 98% (47/48) appeals received are finalised within the timeframes
27Annual Report 2014/15
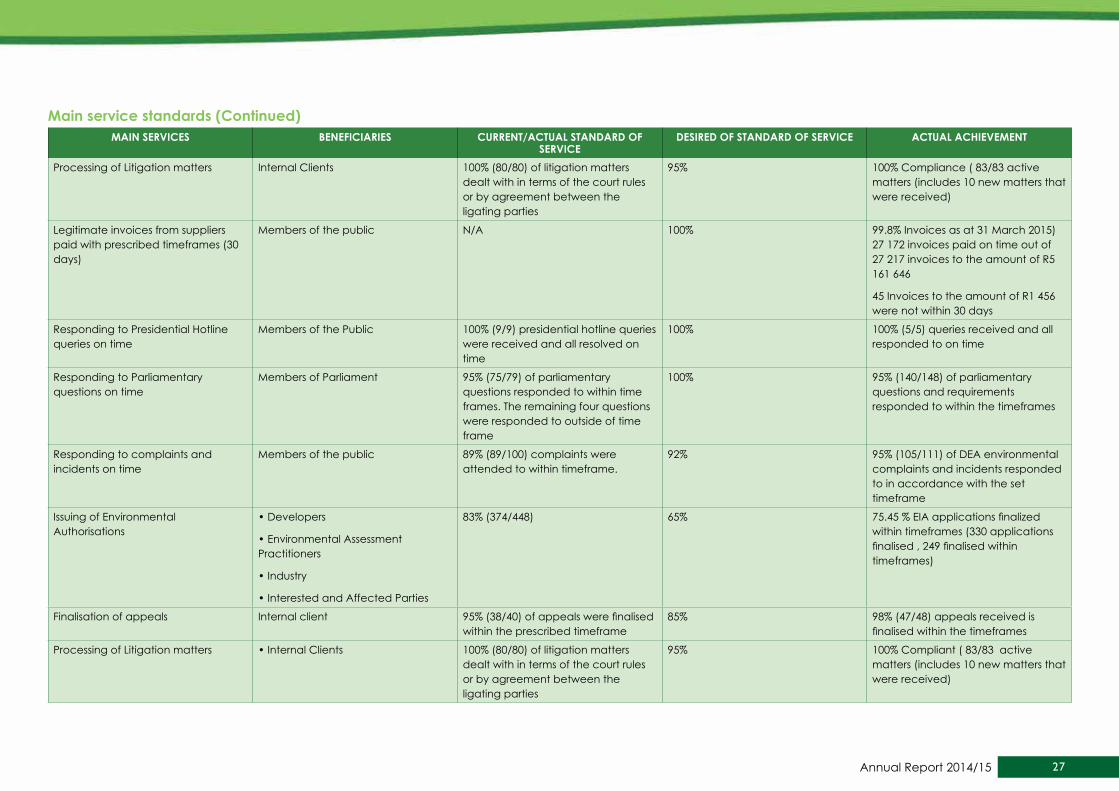
MAIN sERVICEs bENEFICIARIEs CuRRENT/ACTuAL sTANdARd OF sERVICE
dEsIREd OF sTANdARd OF sERVICE ACTuAL AChIEVEMENT
Processing of Litigation matters Internal Clients 100% (80/80) of litigation matters dealt with in terms of the court rules or by agreement between the ligating parties
95% 100% Compliance ( 83/83 active matters (includes 10 new matters that were received)
Legitimate invoices from suppliers paid with prescribed timeframes (30 days)
Members of the public N/A 100% 99.8% Invoices as at 31 March 2015) 27 172 invoices paid on time out of 27 217 invoices to the amount of R5 161 646
45 Invoices to the amount of R1 456 were not within 30 days
Responding to Presidential Hotline queries on time
Members of the Public 100% (9/9) presidential hotline queries were received and all resolved on time
100% 100% (5/5) queries received and all responded to on time
Responding to Parliamentary questions on time
Members of Parliament 95% (75/79) of parliamentary questions responded to within time frames. The remaining four questions were responded to outside of time frame
100% 95% (140/148) of parliamentary questions and requirements responded to within the timeframes
Responding to complaints and incidents on time
Members of the public 89% (89/100) complaints were attended to within timeframe.
92% 95% (105/111) of DEA environmental complaints and incidents responded to in accordance with the set timeframe
Issuing of Environmental Authorisations
• Developers
• Environmental Assessment Practitioners
• Industry
• Interested and Affected Parties
83% (374/448) 65% 75.45 % EIA applications finalized within timeframes (330 applications finalised , 249 finalised within timeframes)
Finalisation of appeals Internal client 95% (38/40) of appeals were finalised within the prescribed timeframe
85% 98% (47/48) appeals received is finalised within the timeframes
Processing of Litigation matters • Internal Clients 100% (80/80) of litigation matters dealt with in terms of the court rules or by agreement between the ligating parties
95% 100% Compliant ( 83/83 active matters (includes 10 new matters that were received)
Main service standards (Continued)

28 DEPARTMENT OF ENVIRONMENTAL AFFAIRS: VOTE 30
MAIN sERVICEs bENEFICIARIEs CuRRENT/ACTuAL sTANdARd OF sERVICE
dEsIREd OF sTANdARd OF sERVICE ACTuAL AChIEVEMENT
Responding to PAIA requests on time Members of the Public 96% (25/26) requests dealt with in terms of the PAIA requirements
95% 100% (30/30) compliance with the implementation of PAIA
Issuing Of Marine Research Permits Industry/ Government Entities 85% (58/68) permits have been issued within timeframes
100% 96% (50/52) issued within timeframe
Issuing of off-road vehicle permits (ORV)
Researchers working on protected species and within Marine Protected Areas (MPA’s)
83% (34/41) permits have been issued within timeframe
100% 79% (38/48) of permits were issued on timeframe
Issuing of dumping permits Applicants 75% (6/8) permits have been issued within timeframe
100% 100% (11/11) of the dumping permits were issued on timeframe
Issuing of permits for activities within marine protected areas
Applicants (film producers/scuba operators/research organisations)
80% (48/60) permits have been issued within timeframe
100% 100% (71/71) issued on timeframe
Issuing of GMO applications Traders
• Exporters or importers of GMO listed species
• Scientific Institutions
• Government Departments and Parastatals
100% (45/45) 100% 100% (46/46) of GMO applications for permits received, reviewed and assessed for Environmental compliance within prescribed timeframe
Issuing of CITES permits • Traders
• Exporters or importers of CITES listed species
• Scientific Institutions
• Government Departments and Parastatals
100% (125/125) 100% 100% (168/168) CITES permit applications received and evaluated
Issuing of TOPS permits • Traders
• Exporters or importers of TOPS listed species
• Scientific Institutions
• Government Departments and Parastatals
100% (66/66) 100% 100% (74/74) TOPS permit applications received and evaluated
Main service standards (Continued)

29Annual Report 2014/15
MAIN sERVICEs bENEFICIARIEs CuRRENT/ACTuAL sTANdARd OF sERVICE
dEsIREd OF sTANdARd OF sERVICE ACTuAL AChIEVEMENT
Issuing of BABS applications Applicants 100% (22/22) 100% 28/28 (100%) BABS permit applications received and assessed for environmental compliance within prescribed timeframe
Issuing Of Waste Management Licences
Applicants 63% (79/125) 95 % 90% (25/28) waste management licenses were finalised within legislated time frames
Review of contaminated land reports Areas (MPA’s) 100% (50/50 reports reviewed within timeframe)
85% 100% (69 out of 69) contaminated land reports processed within timeframes
Response to fraud and corruption allegation
Internal Client /Members of the Public 100% reported fraud within
timeframes
100% reported fraud within
timeframes
27% (3/11). There are currently 11 reported fraud and corruption cases under different stages investigation
3 of the cases are within time frame and 11 are outside of time-frame
Finalisation of appeals Internal Clients 95% (38/40) of appeals were finalised within the prescribed timeframe
85% 98% (47/48) appeals received are finalised within the timeframes
Processing of Litigation matters Internal Clients 100% (80/80) of litigation matters dealt with in terms of the court rules or by agreement between the ligating parties
95% 100% Compliant ( 83/83 active matters (includes 10 new matters that were received)
Batho Pele Arrangements with beneficiaries/stakeholders (consultation access)CuRRENT/ACTuAL ARRANGEMENTs dEsIREd ARRANGEMENTs ACTuAL AChIEVEMENTs
Regular stakeholder consultation events on work of DEA
Public Participation events
Gazetting of draft regulations, policies and legislation for public comments before finalization
Facilitation of regular Environmental Campaigns
Maintain current arrangements 25 Public Participation events were held during the year including Ministerial events
126 media statement/speeches issued
12 environmental awareness campaigns conducted
Main service standards (Continued)

30 DEPARTMENT OF ENVIRONMENTAL AFFAIRS: VOTE 30
service delivery information toolCuRRENT/ACTuAL ARRANGEMENTs dEsIREd ARRANGEMENTs ACTuAL AChIEVEMENTs
DEA Website ( www.environment.gov.za)
DEA Call centre (086 111 2468)
Information centre (walk-in centre )
Use of regional and national Media (print media, radio and television)
Capacity to respond to media queries
Maintain use of current tools Website hits and uptime
126 media statement/speeches issued
9 opinion pieces published on various print media
25 Communication events were held
4 stakeholder publications were produced and published ( Environment Quarterly)
656 media queries received in the 2014/15 financial year, is 655 of which 607 were finalised within 48 hours resulting to 93%
665 622 website hits
21356 members of the public visited the information centre
Complaints mechanismCuRRENT/ACTuAL ARRANGEMENTs dEsIREd ARRANGEMENTs ACTuAL AChIEVEMENTs
Regular stakeholder consultation events on work of DEA
Public Participation events
Gazetting of draft regulations, policies and legislation for public comments before finalization
Facilitation of regular Environmental Campaigns
Maintain current mechanisms 100% (5/5) queries received and all responded to on time.
99.7% of matters received though the call centre resolved set service standard (48 hours)
A total of 5 094 requests/queries received through the call centre (3 197 calls and 1 897 emails)

31Annual Report 2014/15
Organisational EnvironmentThe Department is committed to good corporate governance, accountability and implementation of effective and best management practices. These are important elements in ensuring that we carry out our constitutional mandate in line with good corporate values and principles, and we maintain the confidence and trust of South Africans and all our stakeholders. The Department consistently improves the integrity and reliability of internal systems and processes on the basis of lessons learnt from the outcomes and findings of the Management Performance Assessment Tool (MPAT), an initiative of the Department of Performance Monitoring and Evaluation in the Presidency, as well as internal and external audits.
key Policy developments And Legislative ChangesThere were no major Policy developments and legislative changes finalised for the period under review, however the following regulations were developed and policies drafted:
• Compliance and Enforcement Strategy finalised and approved
• Draft regulations for the registration of Professional Hunters and Trainers Hunting Outfitters developed and published for public participation
• Norms and standards for the management of protected areas finalised and published for public participation
• Amended regulations for Special Nature Reserves, National Parks and World Heritage published for implementation
• EIA regulations and revised listing notices published for implemented
3. sTRATEGIC OuTCOME ORIENTEd GOALs• Environmental assets conserved, valued, sustainably used, protected and continually
enhanced.
• Enhanced socio-economic benefits and employment creation for the present and future generations from a healthy environment
• A department that is fully capacitated to deliver its services efficiently and effectively
The Department is directly responsible for delivering on, and coordinating the work and priorities outlined in Outcome 10 (Environmental Assets and Natural Resources that are Valued, Protected and Continually Enhanced) of the 12 Government Outcomes, and also make a contribution to other outcomes, mainly Outcome 4 (Decent Employment through Inclusive Economic Growth). The two outcome oriented goals of the department (1.Environmental assets conserved, valued, sustainably used, protected and continually enhanced & 2. Enhanced socio-economic benefits and employment creation for the present and future generations from a healthy environment) are aligned to the outcome 10 and 4 priorities. Below is a summary of progress made in relation to the two mentioned Outcomes:
Outcome 10: Environmental Assets and Natural Resources that are Valued, Protected and Continually Enhancedsub output: Reduced greenhouse gas emissions, climate change and improved air/ atmospheric quality:
The Outcome 10 Delivery Agreement addresses the following key sub outcomes from the National Development Plan (NDP) 2030 Vision namely:
1) Ecosystems are sustained and natural resources are used efficiently; On the action to expand the conservation area estate through declaration of state owned protected areas 11.3% land under conservation was achieved (from 10.6%) in the previous financial year. A total of 17 additional biodiversity stewardship sites were established and are at various stages of finalization for declaration this also adds to the conservation estate targets. 86% of area of state managed protected areas assessed had a METT score above 67. With regards to the land under rehabilitation Department of Environmental Affairs (DEA) has cumulatively achieved 825 072ha out of the planned annual target of 790 327. With regards to Operation Phakisa deliverables; the Draft concept note for the Oceans Management Bill has also been developed and the National Pollution Laboratory was identified in the Eastern Cape province.
32 DEPARTMENT OF ENVIRONMENTAL AFFAIRS: VOTE 30
2) An effective climate change mitigation and adaptation response; With regards to reduced total emissions of the greenhouse gases on Setting of first Desired Emissions Reduction Outcomes (DERO’s; the work has been re-focused to emphasize the establishment of a mitigation system that include the following elements: carbon budgets, mandatory Green House Gas (GHG) reporting and pollution prevention planning. The design of the Climate Change Response Monitoring and Evaluation system has been completed.
Outcome 4: decent Employment through Inclusive Economic GrowthOutput 2: More labour absorbing growth sub-output: Green Economy:
The National Green Fund was established with an initial allocation of R800 million for three years from 2012/2013 until 2014/2015. An additional R300 million was allocated to the Fund, bringing the total allocation to R1,1 billion. The Department of Environmental Affairs in partnership with the National Treasury coordinates the implementation of the National Green Fund. As of the end of the financial year 2014/2015, a total of 53 projects were approved for implementation, which included, 29 investment projects, 16 research and policy development and 8 capacity development initiatives. It was projected that a total of 12 937 jobs will be created once the Fund is fully operational, noting that all the initiatives are multi-year projects. To date a total of 8024 jobs have been created.
33Annual Report 2014/15
4. PERFORMANCE INFORMATION by PROGRAMME
sTRATEGIC ObjECTIVEs, PERFORMANCE INdICATORs, PLANNEd TARGETs ANd ACTuAL AChIEVEMENTs
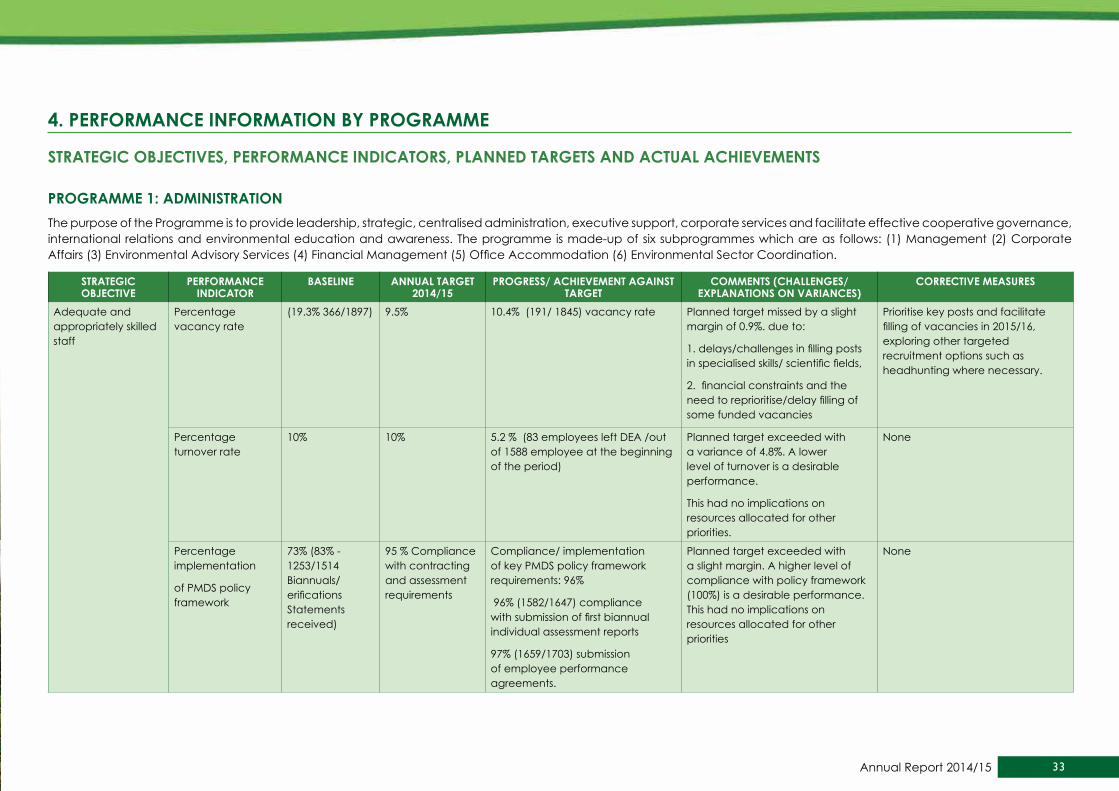
PROGRAMME 1: AdMINIsTRATIONThe purpose of the Programme is to provide leadership, strategic, centralised administration, executive support, corporate services and facilitate effective cooperative governance, international relations and environmental education and awareness. The programme is made-up of six subprogrammes which are as follows: (1) Management (2) Corporate Affairs (3) Environmental Advisory Services (4) Financial Management (5) Office Accommodation (6) Environmental Sector Coordination.
sTRATEGIC ObjECTIVE
PERFORMANCE INdICATOR
bAsELINE ANNuAL TARGET 2014/15
PROGREss/ AChIEVEMENT AGAINsT TARGET
COMMENTs (ChALLENGEs/EXPLANATIONs ON VARIANCEs)
CORRECTIVE MEAsuREs
Adequate and appropriately skilled staff
Percentage vacancy rate
(19.3% 366/1897) 9.5% 10.4% (191/ 1845) vacancy rate Planned target missed by a slight margin of 0.9%. due to:
1. delays/challenges in filling posts in specialised skills/ scientific fields,
2. financial constraints and the need to reprioritise/delay filling of some funded vacancies
Prioritise key posts and facilitate filling of vacancies in 2015/16, exploring other targeted recruitment options such as headhunting where necessary.
Percentage turnover rate
10% 10% 5.2 % (83 employees left DEA /out of 1588 employee at the beginning of the period)
Planned target exceeded with a variance of 4.8%. A lower level of turnover is a desirable performance.
This had no implications on resources allocated for other priorities.
None
Percentage implementation
of PMDS policy framework
73% (83% - 1253/1514 Biannuals/ erifications Statements received)
95 % Compliance with contracting and assessment requirements
Compliance/ implementation of key PMDS policy framework requirements: 96%
96% (1582/1647) compliance with submission of first biannual individual assessment reports
97% (1659/1703) submission of employee performance agreements.
Planned target exceeded with a slight margin. A higher level of compliance with policy framework (100%) is a desirable performance. This had no implications on resources allocated for other priorities
None

34 DEPARTMENT OF ENVIRONMENTAL AFFAIRS: VOTE 30
sTRATEGIC ObjECTIVE
PERFORMANCE INdICATOR
bAsELINE ANNuAL TARGET 2014/15
PROGREss/ AChIEVEMENT AGAINsT TARGET
COMMENTs (ChALLENGEs/EXPLANATIONs ON VARIANCEs)
CORRECTIVE MEAsuREs
Adequate and appropriately skilled staff
Number of HRD strategy initiatives implemented
68% (635/934) of Workplace Skills Plan (WSP) implemented
40 full time bursaries and 55 part time bursaries approved
3 Interventions:
100 Interns recruited
70 bursaries issued (30 full time and 40 part time)
80% of WSP implemented
3 Human Resource Development interventions implemented:
100 Interns appointed
100% of WSP implemented (1002 planned WSP interventions undertaken)
84 bursaries awarded (49 part time and 35 full time bursaries
Planned target exceeded by a small margin. Exceeding of the target did not have any impact on resources earmarked for other priorities
None
Secure, harmonious, transformed and conducive working environment
Percentage of Women,
Blacks and People
with disabilities at DEA
Women 56% (846/1514
50 % 56% (926/ 1654) Planned target exceeded by a small margin. Exceeding of the target did not have any impact on resources earmarked for other priorities
None
Blacks 90% (1360/1514)
90 % 90.5% (1497 /1654) None
2% People with disabilities (32/1514)
2 % 2.8 % (47/1654) None
Average number of days taken to resolve disciplinary cases
99% 90 days for misconduct cases
Average number of 90 working days taken to resolve misconduct cases. (28 of 31 cases due for finalisation were finalised)
None None
30 days for grievance cases
Average number of 53 working days taken to resolve grievance cases (35 of 38 cases due for finalisation were finalised
Grievance cases are delayed due to a variety of factors beyond the control of DEA, including availability of other relevant parties to an investigation
None
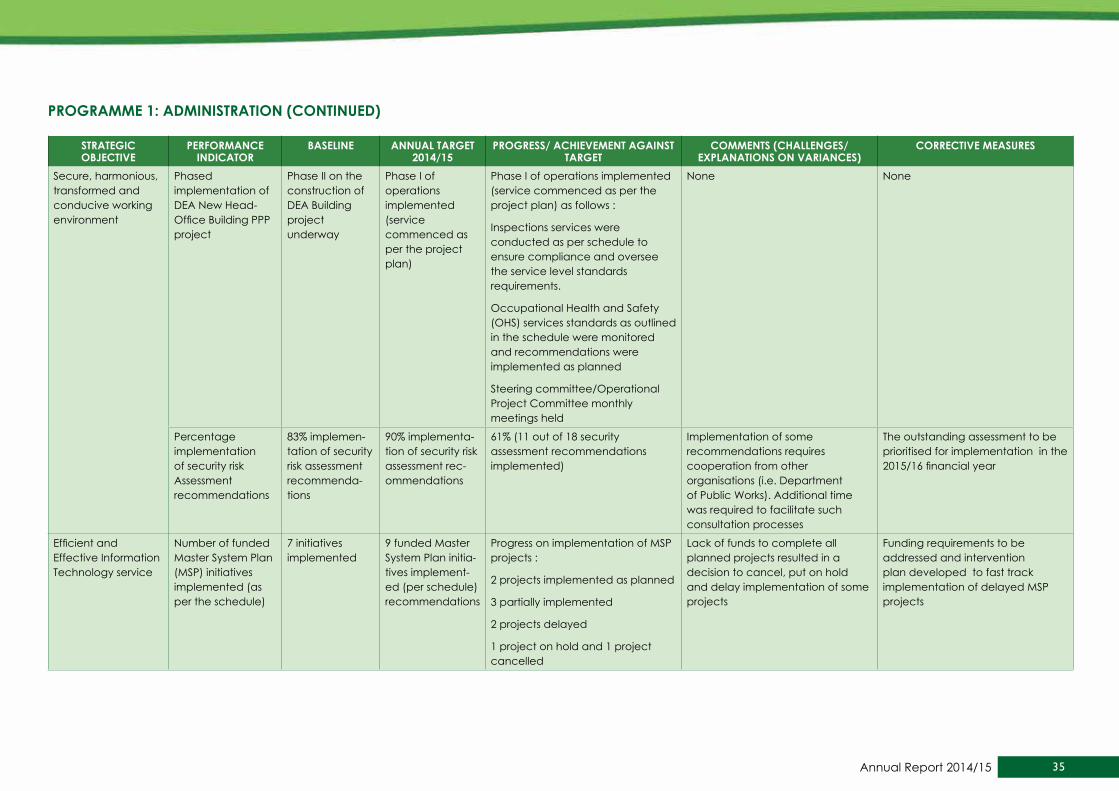
PROGRAMME 1: AdMINIsTRATION (CONTINuEd)
35Annual Report 2014/15
sTRATEGIC ObjECTIVE
PERFORMANCE INdICATOR
bAsELINE ANNuAL TARGET 2014/15
PROGREss/ AChIEVEMENT AGAINsT TARGET
COMMENTs (ChALLENGEs/EXPLANATIONs ON VARIANCEs)
CORRECTIVE MEAsuREs
Secure, harmonious, transformed and conducive working environment
Phased implementation of DEA New Head- Office Building PPP project
Phase II on the construction of DEA Building project underway
Phase I of operations implemented (service commenced as per the project plan)
Phase I of operations implemented (service commenced as per the project plan) as follows :
Inspections services were conducted as per schedule to ensure compliance and oversee the service level standards requirements.
Occupational Health and Safety (OHS) services standards as outlined in the schedule were monitored and recommendations were implemented as planned
Steering committee/Operational Project Committee monthly meetings held
None None
Percentage implementation of security risk Assessment recommendations
83% implemen-tation of security risk assessment recommenda-tions
90% implementa-tion of security risk assessment rec-ommendations
61% (11 out of 18 security assessment recommendations implemented)
Implementation of some recommendations requires cooperation from other organisations (i.e. Department of Public Works). Additional time was required to facilitate such consultation processes
The outstanding assessment to be prioritised for implementation in the 2015/16 financial year
Efficient and Effective Information Technology service
Number of funded Master System Plan (MSP) initiatives implemented (as per the schedule)
7 initiatives implemented
9 funded Master System Plan initia-tives implement-ed (per schedule) recommendations
Progress on implementation of MSP projects :
2 projects implemented as planned
3 partially implemented
2 projects delayed
1 project on hold and 1 project cancelled
Lack of funds to complete all planned projects resulted in a decision to cancel, put on hold and delay implementation of some projects
Funding requirements to be addressed and intervention plan developed to fast track implementation of delayed MSP projects
PROGRAMME 1: AdMINIsTRATION (CONTINuEd)
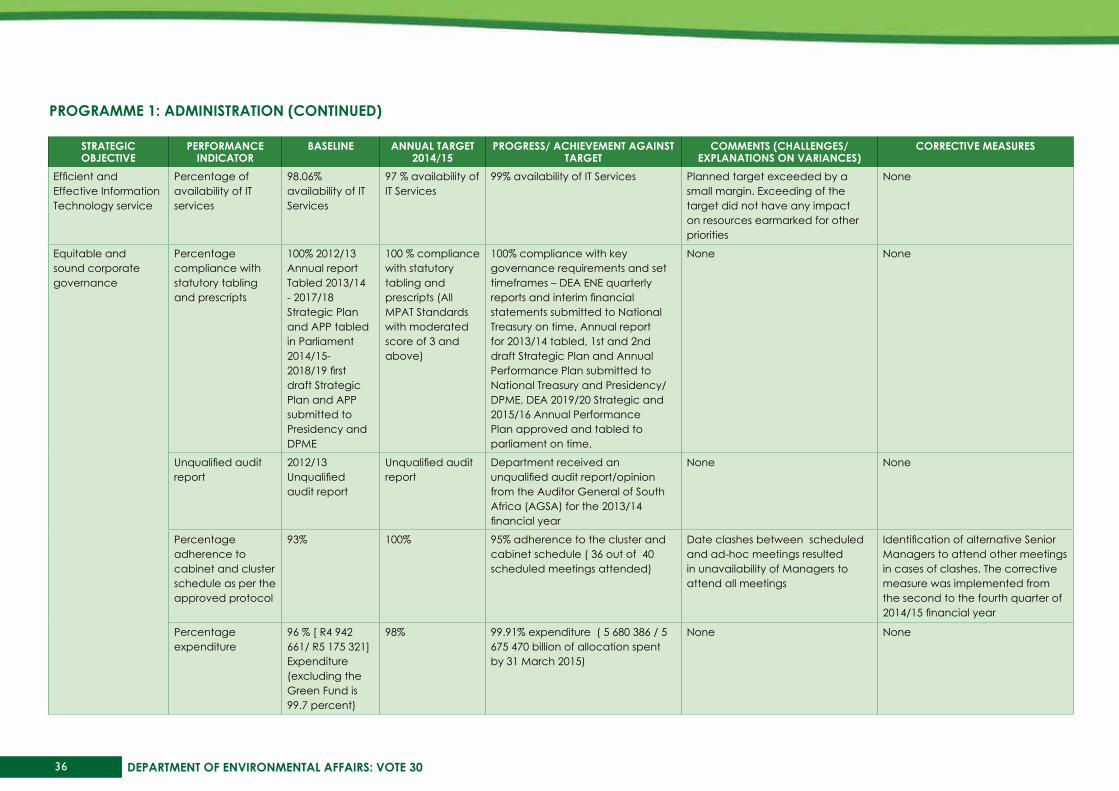
36 DEPARTMENT OF ENVIRONMENTAL AFFAIRS: VOTE 30
sTRATEGIC ObjECTIVE
PERFORMANCE INdICATOR
bAsELINE ANNuAL TARGET 2014/15
PROGREss/ AChIEVEMENT AGAINsT TARGET
COMMENTs (ChALLENGEs/EXPLANATIONs ON VARIANCEs)
CORRECTIVE MEAsuREs
Efficient and Effective Information Technology service
Percentage of availability of IT services
98.06% availability of IT Services
97 % availability of IT Services
99% availability of IT Services Planned target exceeded by a small margin. Exceeding of the target did not have any impact on resources earmarked for other priorities
None
Equitable and sound corporate governance
Percentage compliance with statutory tabling and prescripts
100% 2012/13 Annual report Tabled 2013/14 - 2017/18 Strategic Plan and APP tabled in Parliament 2014/15-2018/19 first draft Strategic Plan and APP submitted to Presidency and DPME
100 % compliance with statutory tabling and prescripts (All MPAT Standards with moderated score of 3 and above)
100% compliance with key governance requirements and set timeframes – DEA ENE quarterly reports and interim financial statements submitted to National Treasury on time, Annual report for 2013/14 tabled, 1st and 2nd draft Strategic Plan and Annual Performance Plan submitted to National Treasury and Presidency/DPME, DEA 2019/20 Strategic and 2015/16 Annual Performance Plan approved and tabled to parliament on time.
None None
Unqualified audit report
2012/13 Unqualified audit report
Unqualified audit report
Department received an unqualified audit report/opinion from the Auditor General of South Africa (AGSA) for the 2013/14 financial year
None None
Percentage adherence to cabinet and cluster schedule as per the approved protocol
93% 100% 95% adherence to the cluster and cabinet schedule ( 36 out of 40 scheduled meetings attended)
Date clashes between scheduled and ad-hoc meetings resulted in unavailability of Managers to attend all meetings
Identification of alternative Senior Managers to attend other meetings in cases of clashes. The corrective measure was implemented from the second to the fourth quarter of 2014/15 financial year
Percentage expenditure
96 % [ R4 942 661/ R5 175 321] Expenditure (excluding the Green Fund is 99.7 percent)
98% 99.91% expenditure ( 5 680 386 / 5 675 470 billion of allocation spent by 31 March 2015)
None None
PROGRAMME 1: AdMINIsTRATION (CONTINuEd)

37Annual Report 2014/15
sTRATEGIC ObjECTIVE
PERFORMANCE INdICATOR
bAsELINE ANNuAL TARGET 2014/15
PROGREss/ AChIEVEMENT AGAINsT TARGET
COMMENTs (ChALLENGEs/EXPLANATIONs ON VARIANCEs)
CORRECTIVE MEAsuREs
Equitable and sound corporate governance
Percentage of expenditure on affirmative procurement
61 % (R879 665 892 spent on BEE out of total expenditure of R1 447 933 826)
65% 83% of expenditure on affirmative procurement (R 893 million of R1 081 billion )
Planned target exceeded with a variance of 14%. A higher expenditure on BBBEE companies than the planned target is ideal and in line with the DEA transformation objective
None
Improved access to information
Number of media statements/speeches issued and opinion pieces published
137 statements/ speeches
120 statements/ speeches
126 media statements/speeches issued
Planned target exceeded with a marginal variance of 5%. Exceeding the target had no impact on resources earmarked for other priorities
None
3 opinion pieces published
6 opinion pieces 9 opinion pieces published in the media
Planned target exceeded with a variance of 50%. Exceeding the target had no impact on resources earmarked for other priorities as opinion
None
Number of communication events including Ministerial Public Participation Programme (PPP) events
10 Public Participation Events hosted
20 Public Participation events
25 Public Participation events conducted
Planned target exceeded with a variance of 25%. Exceeding the target had no impact on resources earmarked for other priorities
None
Number of publications produced and distributed
4 editions of stakeholder publications per annum.
4 editions of stakeholder publications per annum.
4 stakeholder publications produced and distributed
None None
Number of website hits per annum
216 317 website hits
450 000 visit hits per annum
665622 website hits recorded Planned target exceeded with a variance of 48%. Exceeding the target had no impact on resources earmarked for other priorities
None
PROGRAMME 1: AdMINIsTRATION (CONTINuEd)
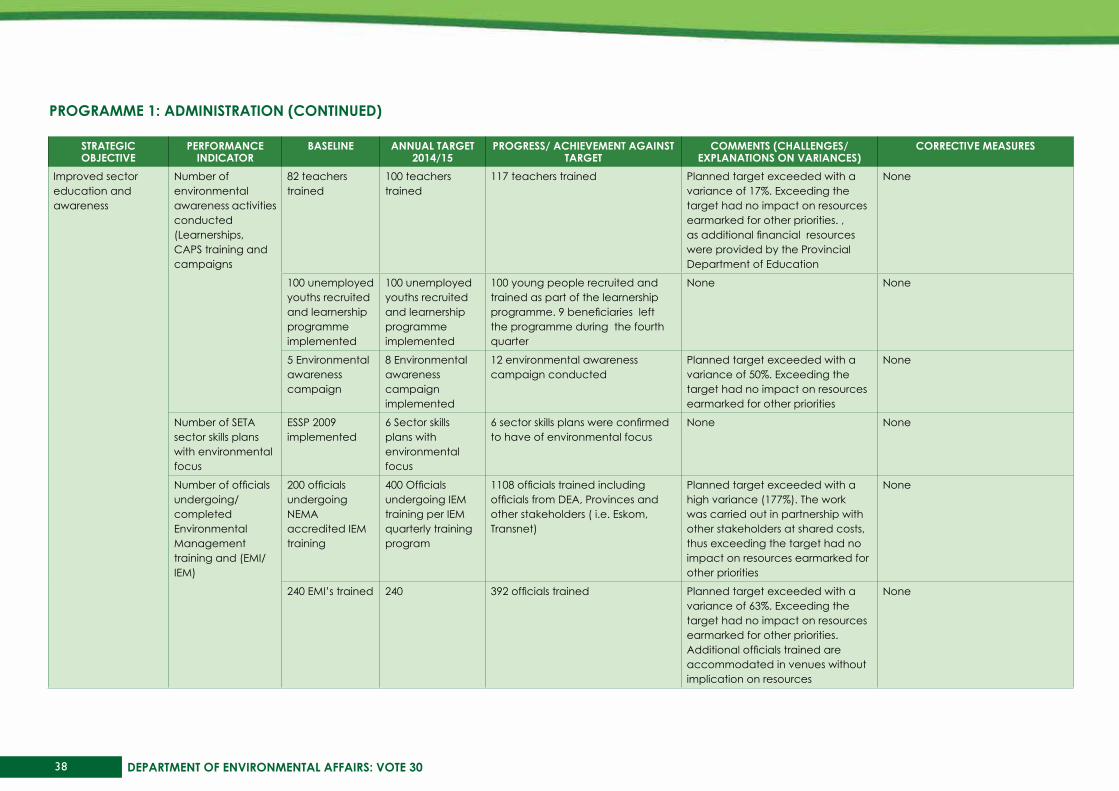
38 DEPARTMENT OF ENVIRONMENTAL AFFAIRS: VOTE 30
sTRATEGIC ObjECTIVE
PERFORMANCE INdICATOR
bAsELINE ANNuAL TARGET 2014/15
PROGREss/ AChIEVEMENT AGAINsT TARGET
COMMENTs (ChALLENGEs/EXPLANATIONs ON VARIANCEs)
CORRECTIVE MEAsuREs
Improved sector education and awareness
Number of environmental awareness activities conducted (Learnerships, CAPS training and campaigns
82 teachers trained
100 teachers trained
117 teachers trained Planned target exceeded with a variance of 17%. Exceeding the target had no impact on resources earmarked for other priorities. , as additional financial resources were provided by the Provincial Department of Education
None
100 unemployed youths recruited and learnership programme implemented
100 unemployed youths recruited and learnership programme implemented
100 young people recruited and trained as part of the learnership programme. 9 beneficiaries left the programme during the fourth quarter
None None
5 Environmental awareness campaign
8 Environmental awareness campaign implemented
12 environmental awareness campaign conducted
Planned target exceeded with a variance of 50%. Exceeding the target had no impact on resources earmarked for other priorities
None
Number of SETA sector skills plans with environmental focus
ESSP 2009 implemented
6 Sector skills plans with environmental focus
6 sector skills plans were confirmed to have of environmental focus
None None
Number of officials undergoing/ completed Environmental Management training and (EMI/ IEM)
200 officials undergoing NEMA accredited IEM training
400 Officials undergoing IEM training per IEM quarterly training program
1108 officials trained including officials from DEA, Provinces and other stakeholders ( i.e. Eskom, Transnet)
Planned target exceeded with a high variance (177%). The work was carried out in partnership with other stakeholders at shared costs, thus exceeding the target had no impact on resources earmarked for other priorities
None
240 EMI’s trained 240 392 officials trained Planned target exceeded with a variance of 63%. Exceeding the target had no impact on resources earmarked for other priorities. Additional officials trained are accommodated in venues without implication on resources
None
PROGRAMME 1: AdMINIsTRATION (CONTINuEd)

39Annual Report 2014/15
sTRATEGIC ObjECTIVE
PERFORMANCE INdICATOR
bAsELINE ANNuAL TARGET 2014/15
PROGREss/ AChIEVEMENT AGAINsT TARGET
COMMENTs (ChALLENGEs/EXPLANATIONs ON VARIANCEs)
CORRECTIVE MEAsuREs
Improved sector education and awareness
Number of accredited training person days created
84 758 139 915 164 746 accredited training person days created
Planned target exceeded with a variance of 18%. Exceeding the target had no impact on resources earmarked for other priorities
None
Effective knowledge and information management for the sector
Outcome 10 Delivery Agreement developed and implementation facilitated
Outcome 10 Delivery Agreement 2014 -2019
Approved Outcome 10 Delivery Agreement for sector on new priorities (2014 -2019)
Outcome 10 Delivery agreement for the 2014-2019 MTSF period approved and published
None None
Number of environmental knowledge and information management systems/tools developed, refined and or operational (EGIS, NEAS, O&C Online system, CC M&E system etc
System specification and design made and project plan determined
Technical development of system initiated
Technical development of the system continued (specifications defined)
Technical development of the system facilitated as follows:
Procurement process completed for the development of the Oceans and Coasts Information Management System. Memorandum of Agreement with service provider developed.
Project Plan and costing completed. Project management/ institutional arrangements for the development of the system finalised (Steering Committee & Technical Working Groups)
Specifications defined for the oil spill identification decision support tool
None None
PROGRAMME 1: AdMINIsTRATION (CONTINuEd)

40 DEPARTMENT OF ENVIRONMENTAL AFFAIRS: VOTE 30
sTRATEGIC ObjECTIVE
PERFORMANCE INdICATOR
bAsELINE ANNuAL TARGET 2014/15
PROGREss/ AChIEVEMENT AGAINsT TARGET
COMMENTs (ChALLENGEs/EXPLANATIONs ON VARIANCEs)
CORRECTIVE MEAsuREs
Effective knowledge and information management for the sector
Number of environmental knowledge and information management systems/tools developed, refined and or operational (EGIS, NEAS, O&C Online system, CC M&E system etc
GIS intranet maintained and supported.
GIS internet developed
8 environmental sector projects / initiatives supported by GIS
GIS internet developed
GIS Protected Area Register(PAR)internet developed
None None
Approval of the establishment of the Bid Specification Committee for the South African National Environmental Information Meta-Database Project
Phase I of the South African National Environmental Information Meta-Database Project finalised
Phase 1 of Meta-database project not finalised. Project inception meeting between DEA Steering Committee and Project Consultants (PDG) facilitated
The project was delayed due to financial constraints and subsequent need for reprioritisation
The project will be prioritised in 2015/16
1 component - EIA application monitoring system operational and providing statistics for 8 competent authorities for Outcome 10 reporting
2 component of the NEMA Chapter 5 Environmental Regulatory Authorization system monitored (EIA amended timeframes module and the appeals module)
2 components of NEAS monitored as follows:
EIA process monitored and Outcome 10 quarterly reports for 10 competent authorities produced
NEAS system for Appeals monitoring available
Facilitated the NEAS quarterly task team meetings
Action plan for populating the NEAS appeals register for two competent authorities developed
None None
PROGRAMME 1: AdMINIsTRATION (CONTINuEd)
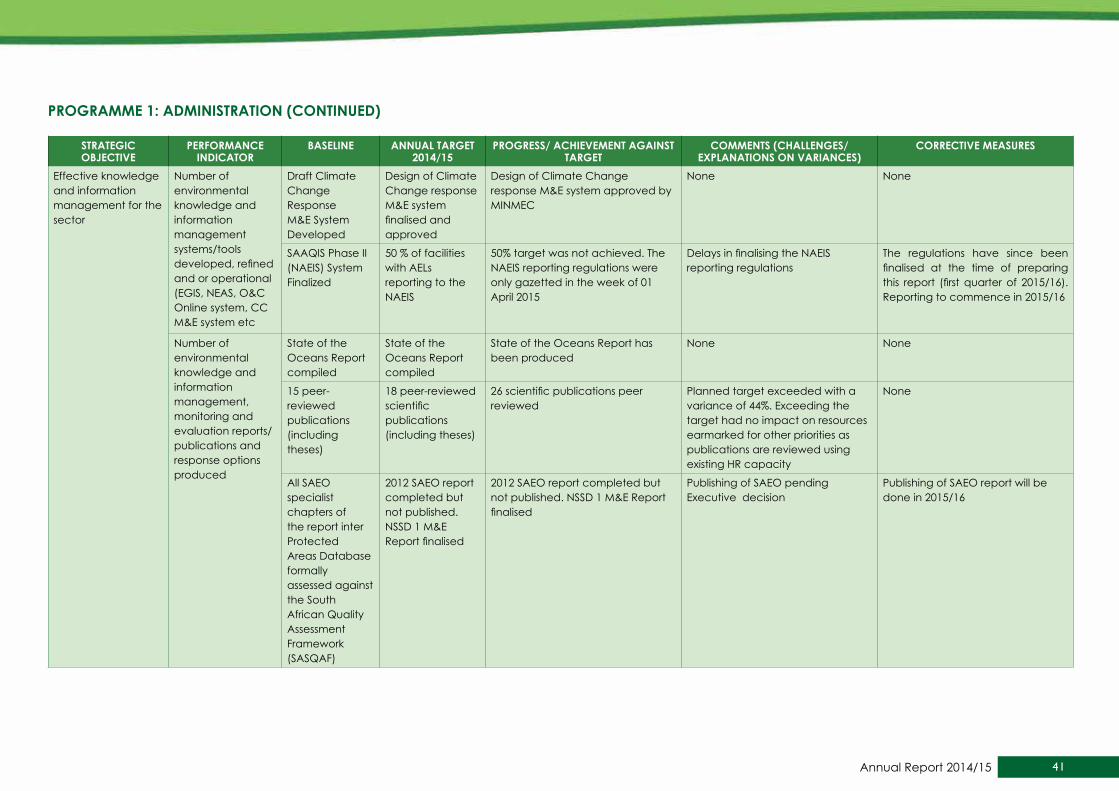
41Annual Report 2014/15
sTRATEGIC ObjECTIVE
PERFORMANCE INdICATOR
bAsELINE ANNuAL TARGET 2014/15
PROGREss/ AChIEVEMENT AGAINsT TARGET
COMMENTs (ChALLENGEs/EXPLANATIONs ON VARIANCEs)
CORRECTIVE MEAsuREs
Effective knowledge and information management for the sector
Number of environmental knowledge and information management systems/tools developed, refined and or operational (EGIS, NEAS, O&C Online system, CC M&E system etc
Draft Climate Change Response M&E System Developed
Design of Climate Change response M&E system finalised and approved
Design of Climate Change response M&E system approved by MINMEC
None None
SAAQIS Phase II (NAEIS) System Finalized
50 % of facilities with AELs reporting to the NAEIS
50% target was not achieved. The NAEIS reporting regulations were only gazetted in the week of 01 April 2015
Delays in finalising the NAEIS reporting regulations
The regulations have since been finalised at the time of preparing this report (first quarter of 2015/16). Reporting to commence in 2015/16
Number of environmental knowledge and information management, monitoring and evaluation reports/ publications and response options produced
State of the Oceans Report compiled
State of the Oceans Report compiled
State of the Oceans Report has been produced
None None
15 peer- reviewed publications (including theses)
18 peer-reviewed scientific publications (including theses)
26 scientific publications peer reviewed
Planned target exceeded with a variance of 44%. Exceeding the target had no impact on resources earmarked for other priorities as publications are reviewed using existing HR capacity
None
All SAEO specialist chapters of the report inter Protected Areas Database formally assessed against the South African Quality Assessment Framework (SASQAF)
2012 SAEO report completed but not published. NSSD 1 M&E Report finalised
2012 SAEO report completed but not published. NSSD 1 M&E Report finalised
Publishing of SAEO pending Executive decision
Publishing of SAEO report will be done in 2015/16
PROGRAMME 1: AdMINIsTRATION (CONTINuEd)

42 DEPARTMENT OF ENVIRONMENTAL AFFAIRS: VOTE 30
sTRATEGIC ObjECTIVE
PERFORMANCE INdICATOR
bAsELINE ANNuAL TARGET 2014/15
PROGREss/ AChIEVEMENT AGAINsT TARGET
COMMENTs (ChALLENGEs/EXPLANATIONs ON VARIANCEs)
CORRECTIVE MEAsuREs
Effective Cooperative Governance and Local Government Support
Local government support strategy implemented
50% implementation of action plan
Annual action plan fully implemented (100 % implementation)
80% implementation of planned actions. (36/45) of the planned actions are on target
Implementation of other planned activities was depended on consensus with relevant stakeholders
Implementation of delayed action will be prioritised in 2015/16 after reaching consensus
Percentage of Sector conflict management tools implemented
Recommended list of individuals to sit on the Panel of Mediators and Arbitrators not yet approved
50 % of received conflict cases dealt with (in line with NEMA Chapter 4 provisions)
All conflict cases referred for consideration in terms of NEMA chapter 4 interventions were withdrawn
None None
Enhanced International governance, instruments and agreements supportive of SA environmental and sustainable development priorities
Number of South African positions on Chemical and Waste, Biodiversity, Sustainable Development (SD), African and bilateral South-South South-North and international environmental governance (IEG) processes prepared, negotiated and reported
100 % (Positions researched and developed for the following meetings: WEF; BASIC; AU summit; UNEP Governing council and COP18)
13 Bilateral/Pleurilateral (Africa, IBSA, S-S, S-N) approved
21 International Environmental Management engagements coordinated and positions prepared (Bilaterals/Pleurilaterals): - Africa ; Brics ; South – South and South- North )
Planned target exceeded with a variance of 62%. Exceeding the target had no impact on resources earmarked for other priorities as work was coordinated by existing HR capacity
None
PROGRAMME 1: AdMINIsTRATION (CONTINuEd)

43Annual Report 2014/15
sTRATEGIC ObjECTIVE
PERFORMANCE INdICATOR
bAsELINE ANNuAL TARGET 2014/15
PROGREss/ AChIEVEMENT AGAINsT TARGET
COMMENTs (ChALLENGEs/EXPLANATIONs ON VARIANCEs)
CORRECTIVE MEAsuREs
Enhanced International governance, instruments and agreements supportive of SA environmental and sustainable development priorities
Number of South African positions on Chemical and Waste, Biodiversity, Sustainable Development (SD), African and bilateral South-South South-North and international environmental governance (IEG) processes prepared, negotiated and reported
100 % (Positions researched and developed for the following meetings: WEF; BASIC; AU summit; UNEP Governing council and COP18)
3 Multilateral position (SD and IEG) approved
5 Multilateral engagement positions approved :
United Nations Environment Assembly (UNEA)
High Level Political Forum (HLPF)
United Nations General Assembly (UNGA)
Technical position (on a number of Post-Rio+20 areas such as SCP, IRP, GoF47, GEO)
African Ministerial Conference on the Environment (AMCEN)
Planned target exceeded with a variance of 67%. Exceeding the target had no impact on resources earmarked for other priorities as work was coordinated by existing HR capacity
None
Chemicals and waste position papers
3 chemicals and waste positions approved
3 position papers developed for the following international chemicals/waste management engagements
Vienna COP 10/MOP26, (17-21 November 2014)
Mercury INC6,
SAICM 2nd OEWG
None None
Reports South Africa is party to: CBD, CPB, Nagoya Protocol on ABS, Ramsar Convention, CMS, UNCCD, AEWA, IPBES, Raptors MoU, IUCN, WHC, MAB Programme
10 Biodiversity positions approved
10 position papers developed and approved for the following International biodiversity related engagements :
Standing committee of the Ramsar Convention
Scientific, Technical and Technological Advice
None None
PROGRAMME 1: AdMINIsTRATION (CONTINuEd)

44 DEPARTMENT OF ENVIRONMENTAL AFFAIRS: VOTE 30
sTRATEGIC ObjECTIVE
PERFORMANCE INdICATOR
bAsELINE ANNuAL TARGET 2014/15
PROGREss/ AChIEVEMENT AGAINsT TARGET
COMMENTs (ChALLENGEs/EXPLANATIONs ON VARIANCEs)
CORRECTIVE MEAsuREs
Enhanced International governance, instruments and agreements supportive of SA environmental and sustainable development priorities
Number of South African positions on Chemical and Waste, Biodiversity, Sustainable Development (SD), African and bilateral South-South South-North and international environmental governance (IEG) processes prepared, negotiated and reported
Reports South Africa is party to: CBD, CPB, Nagoya Protocol on ABS, Ramsar Convention, CMS, UNCCD, AEWA, IPBES, Raptors MoU, IUCN, WHC, MAB Programme
10 Biodiversity positions approved
Working Group on Review of Implementation (WGRI)
CITES: Animals Committee Meeting ( 2 May 2014)
CITES: Standing Committee Meeting (7 - 11 July 2015
CITES: 21st Plants Committee Meeting
COP-MOP1
Conference of the Parties to the Convention on Biological diversity
MAB ICC
Convention on Migratory Species (CMS)
None None
Climate Investment funds; UNFCCC long term finance; Green Climate fund and Adaptation Fund
2 Climate change positions for formal international engagements (UNFCCC) developed and approved
2 Climate change positions for formal international engagements :
UNFCCC - COP 20 CMP10
IPCC
None None
The financial value of resources raised from multilateral and bilateral donors to support the department, SA and Africa’s programmes
Total: US$ 25 million (Multilateral : US$ 15 million and Bilateral: US$ 10 million
US$30 million from all sources (Multilateral: US$20 million; Bilateral: US$10 million
Total resources mobilized for the year: US$ 80,513,812 (US$ 30.616,964 approved and US$ 49,896,848 Endorsed)
None None
PROGRAMME 1: AdMINIsTRATION (CONTINuEd)

45Annual Report 2014/15
sTRATEGIC ObjECTIVE
PERFORMANCE INdICATOR
bAsELINE ANNuAL TARGET 2014/15
PROGREss/ AChIEVEMENT AGAINsT TARGET
COMMENTs (ChALLENGEs/EXPLANATIONs ON VARIANCEs)
CORRECTIVE MEAsuREs
Enhanced International governance, instruments and agreements supportive of SA environmental and sustainable development priorities
Mandatory international and national reports prepared and submitted within timeframe (in terms of relevant legislation and/or international obligations/conventions
2012/13 NEMA S26 report tabled to Parliament within timeframe
2013/14 NEMA S26 report tabled to Parliament within timeframe
2013/14 NEMA S24 report in Parliament tabled within timeframe in May 2014
None None
Draft First Biennial Update Report developed
First Biennial Update Report (BUR) completed and submitted to UNFCCC
BUR submitted to the UNFCCC and BUR Summary for Policy Makers finalised and submitted to GIZ for printing
None None
Scope of information for the Third National Communication completed
Principles and procedures for compilation of TNC finalised
Principles and procedures for compilation of TNC have not been finalised. Terms of reference for the appointment of TNC authors have been finalised and tender advertised. Evaluation of the submitted tender proposals will take place in May 2015
Principles and procedures for compilation of TNC were not finalised due to delays in accessing committed donor funds (GEF
Principles and procedures for compilation of TNC will be finalised in 2015/16 and the work will be carried along simultaneously with the process of appointing TNC authors
GHG Inventory 2000-2010 finalised
Draft GHG Inventory 2000-2012 compiled
Draft of the GHG inventory 2000-2012 compiled
None None
PROGRAMME 1: AdMINIsTRATION (CONTINuEd)

46 DEPARTMENT OF ENVIRONMENTAL AFFAIRS: VOTE 30
bRIEF OVERVIEw ANd suMMARy OF PROGRAMME PERFORMANCE: AdMINIsTRATIONThe Programme focuses on key organisational capacity areas which include Human Resources Management, Information Communication and Technology, Cooperate Governance and other external areas i.e. enhancing cooperative governance and local government support, environmental education and awareness and facilitating international relations engagements. In 2014/15 some of the notable achievements made included the recruitment of 100 young graduates as part the DEA’s annual internship programme and offering full bursaries to 35 deserving young people pursuing studies in different areas of environmental management. DEA also received an unqualified external audit opinion as part of a standing commitment to good governance and accountability.
Summary of Programme Performance: In 2014/15 the Programme had a total of 52 annual targets. 43 (83%) of these targets were achieved. The remaining nine (9) annual targets were not achieved. Six (6) targets were partially achieved (i.e. even though the actual targets were not achieved, significant progress towards the planned targets was made). Progress towards achieving the remaining three (3) targets was significantly delayed. The reasons and factors which resulted in delays and non-achievement of the planned targets have been provided in the detailed performance report, including the planned corrective interventions to address the highlighted challenges.
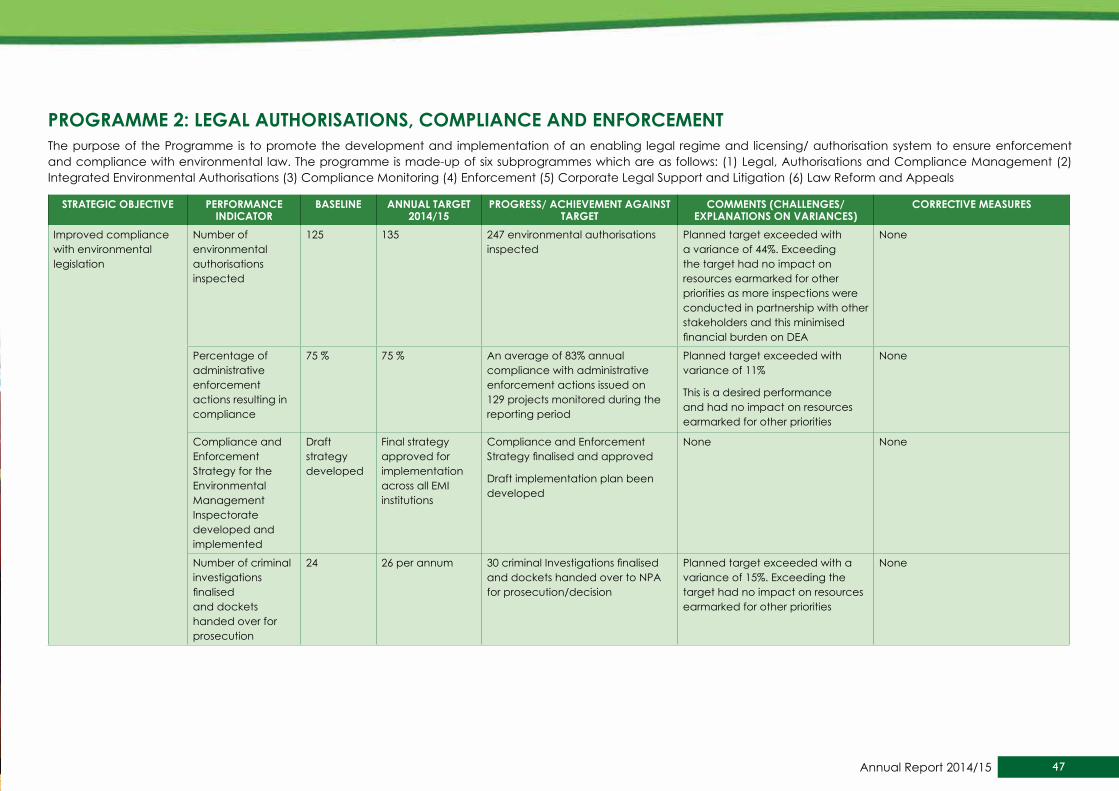
47Annual Report 2014/15
PROGRAMME 2: LEGAL AuThORIsATIONs, COMPLIANCE ANd ENFORCEMENTThe purpose of the Programme is to promote the development and implementation of an enabling legal regime and licensing/ authorisation system to ensure enforcement and compliance with environmental law. The programme is made-up of six subprogrammes which are as follows: (1) Legal, Authorisations and Compliance Management (2) Integrated Environmental Authorisations (3) Compliance Monitoring (4) Enforcement (5) Corporate Legal Support and Litigation (6) Law Reform and Appeals
sTRATEGIC ObjECTIVE PERFORMANCE INdICATOR
bAsELINE ANNuAL TARGET 2014/15
PROGREss/ AChIEVEMENT AGAINsT TARGET
COMMENTs (ChALLENGEs/EXPLANATIONs ON VARIANCEs)
CORRECTIVE MEAsuREs
Improved compliance with environmental legislation
Number of environmental authorisations inspected
125 135 247 environmental authorisations inspected
Planned target exceeded with a variance of 44%. Exceeding the target had no impact on resources earmarked for other priorities as more inspections were conducted in partnership with other stakeholders and this minimised financial burden on DEA
None
Percentage of administrative enforcement actions resulting in compliance
75 % 75 % An average of 83% annual compliance with administrative enforcement actions issued on 129 projects monitored during the reporting period
Planned target exceeded with variance of 11%
This is a desired performance and had no impact on resources earmarked for other priorities
None
Compliance and Enforcement Strategy for the Environmental Management Inspectorate developed and implemented
Draft strategy developed
Final strategy approved for implementation across all EMI institutions
Compliance and Enforcement Strategy finalised and approved
Draft implementation plan been developed
None None
Number of criminal investigations finalised and dockets handed over for prosecution
24 26 per annum 30 criminal Investigations finalised and dockets handed over to NPA for prosecution/decision
Planned target exceeded with a variance of 15%. Exceeding the target had no impact on resources earmarked for other priorities
None

48 DEPARTMENT OF ENVIRONMENTAL AFFAIRS: VOTE 30
sTRATEGIC ObjECTIVE PERFORMANCE INdICATOR
bAsELINE ANNuAL TARGET 2014/15
PROGREss/ AChIEVEMENT AGAINsT TARGET
COMMENTs (ChALLENGEs/EXPLANATIONs ON VARIANCEs)
CORRECTIVE MEAsuREs
Improved compliance with environmental legislation
Number of interventions implemented for Safety and Security of wildlife including rhinoceros populations in South Africa
1 interven-tion imple-mented for the safety and security of wildlife including rhinos
MoU with SSA
Key negoti-ations with strategic government partners
Review of the national strategy for the safety and security of rhinoceros population in South Africa
Stakeholder consultation facilitated and comments/inputs consolidated for the review of the national strategy for the safety and security of rhinoceros population. Analysis of comments conducted as part of the review of the strategy
Slow response from stakeholders delayed the review process
The review will be finalised in the 2015/16 financial year
MoUs with strategic government departments (Justice and Constitutional Development, Home Affairs, Correctional services and police) on safety and security of wildlife including rhino management
4 Memorandums of Understanding developed with the following key Government stakeholders :
Department of Home Affairs
State Security Agency
Department of Transport
Department of Social Development
None None
Implementation of corrective actions relating to TOPS regulations monitored in 2 provinces
Implementation of corrective actions relating to TOPS regulations monitored in 2 provinces:
North West : Department of Rural, Environment and Agricultural Development
Limpopo : Department of Economic Development, Environment and Tourism
None None
PROGRAMME 2: LEGAL AuThORIsATIONs, COMPLIANCE ANd ENFORCEMENT (CONTINuEd)
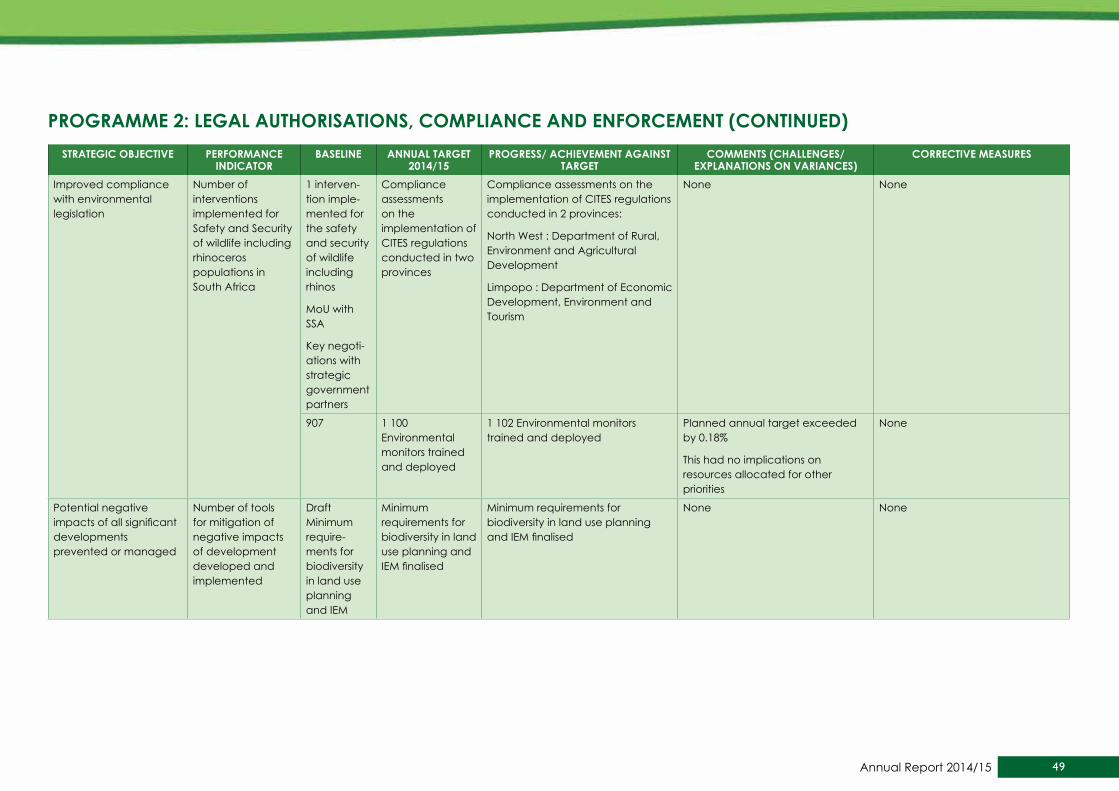
49Annual Report 2014/15
sTRATEGIC ObjECTIVE PERFORMANCE INdICATOR
bAsELINE ANNuAL TARGET 2014/15
PROGREss/ AChIEVEMENT AGAINsT TARGET
COMMENTs (ChALLENGEs/EXPLANATIONs ON VARIANCEs)
CORRECTIVE MEAsuREs
Improved compliance with environmental legislation
Number of interventions implemented for Safety and Security of wildlife including rhinoceros populations in South Africa
1 interven-tion imple-mented for the safety and security of wildlife including rhinos
MoU with SSA
Key negoti-ations with strategic government partners
Compliance assessments on the implementation of CITES regulations conducted in two provinces
Compliance assessments on the implementation of CITES regulations conducted in 2 provinces:
North West : Department of Rural, Environment and Agricultural Development
Limpopo : Department of Economic Development, Environment and Tourism
None None
907 1 100 Environmental monitors trained and deployed
1 102 Environmental monitors trained and deployed
Planned annual target exceeded by 0.18%
This had no implications on resources allocated for other priorities
None
Potential negative impacts of all significant developments prevented or managed
Number of tools for mitigation of negative impacts of development developed and implemented
Draft Minimum require-ments for biodiversity in land use planning and IEM
Minimum requirements for biodiversity in land use planning and IEM finalised
Minimum requirements for biodiversity in land use planning and IEM finalised
None None
PROGRAMME 2: LEGAL AuThORIsATIONs, COMPLIANCE ANd ENFORCEMENT (CONTINuEd)
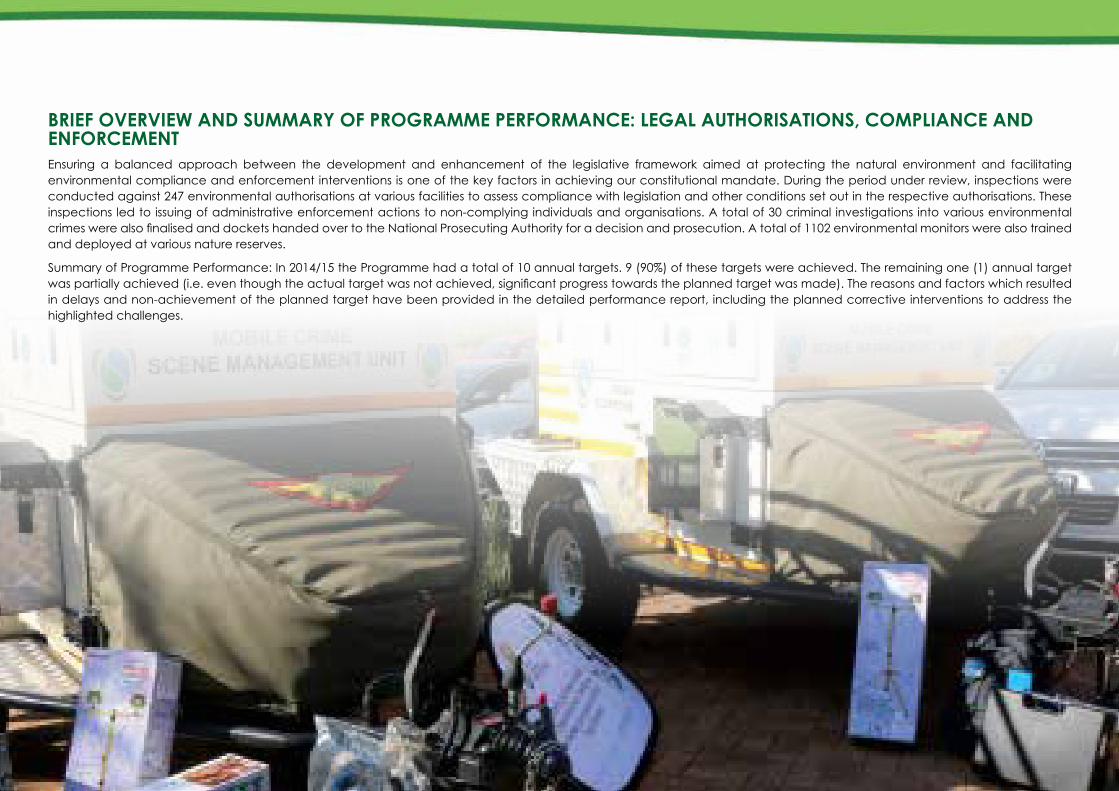
50 DEPARTMENT OF ENVIRONMENTAL AFFAIRS: VOTE 30
bRIEF OVERVIEw ANd suMMARy OF PROGRAMME PERFORMANCE: LEGAL AuThORIsATIONs, COMPLIANCE ANd ENFORCEMENTEnsuring a balanced approach between the development and enhancement of the legislative framework aimed at protecting the natural environment and facilitating environmental compliance and enforcement interventions is one of the key factors in achieving our constitutional mandate. During the period under review, inspections were conducted against 247 environmental authorisations at various facilities to assess compliance with legislation and other conditions set out in the respective authorisations. These inspections led to issuing of administrative enforcement actions to non-complying individuals and organisations. A total of 30 criminal investigations into various environmental crimes were also finalised and dockets handed over to the National Prosecuting Authority for a decision and prosecution. A total of 1102 environmental monitors were also trained and deployed at various nature reserves.
Summary of Programme Performance: In 2014/15 the Programme had a total of 10 annual targets. 9 (90%) of these targets were achieved. The remaining one (1) annual target was partially achieved (i.e. even though the actual target was not achieved, significant progress towards the planned target was made). The reasons and factors which resulted in delays and non-achievement of the planned target have been provided in the detailed performance report, including the planned corrective interventions to address the highlighted challenges.
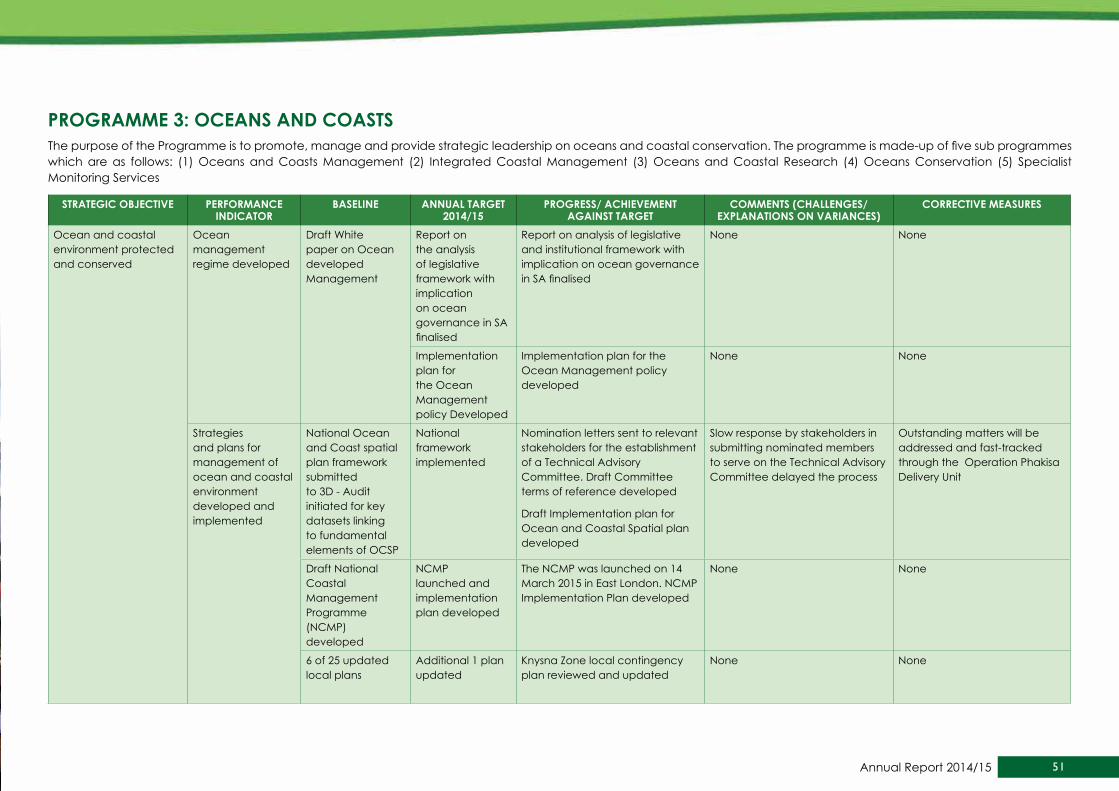
51Annual Report 2014/15
PROGRAMME 3: OCEANs ANd COAsTsThe purpose of the Programme is to promote, manage and provide strategic leadership on oceans and coastal conservation. The programme is made-up of five sub programmes which are as follows: (1) Oceans and Coasts Management (2) Integrated Coastal Management (3) Oceans and Coastal Research (4) Oceans Conservation (5) Specialist Monitoring Services
sTRATEGIC ObjECTIVE PERFORMANCE INdICATOR
bAsELINE ANNuAL TARGET 2014/15
PROGREss/ AChIEVEMENT AGAINsT TARGET
COMMENTs (ChALLENGEs/EXPLANATIONs ON VARIANCEs)
CORRECTIVE MEAsuREs
Ocean and coastal environment protected and conserved
Ocean management regime developed
Draft White paper on Ocean developed Management
Report on the analysis of legislative framework with implication on ocean governance in SA finalised
Report on analysis of legislative and institutional framework with implication on ocean governance in SA finalised
None None
Implementation plan for the Ocean Management policy Developed
Implementation plan for the Ocean Management policy developed
None None
Strategies and plans for management of ocean and coastal environment developed and implemented
National Ocean and Coast spatial plan framework submitted to 3D - Audit initiated for key datasets linking to fundamental elements of OCSP
National framework implemented
Nomination letters sent to relevant stakeholders for the establishment of a Technical Advisory Committee. Draft Committee terms of reference developed
Draft Implementation plan for Ocean and Coastal Spatial plan developed
Slow response by stakeholders in submitting nominated members to serve on the Technical Advisory Committee delayed the process
Outstanding matters will be addressed and fast-tracked through the Operation Phakisa Delivery Unit
Draft National Coastal Management Programme (NCMP) developed
NCMP launched and implementation plan developed
The NCMP was launched on 14 March 2015 in East London. NCMP Implementation Plan developed
None None
6 of 25 updated local plans
Additional 1 plan updated
Knysna Zone local contingency plan reviewed and updated
None None
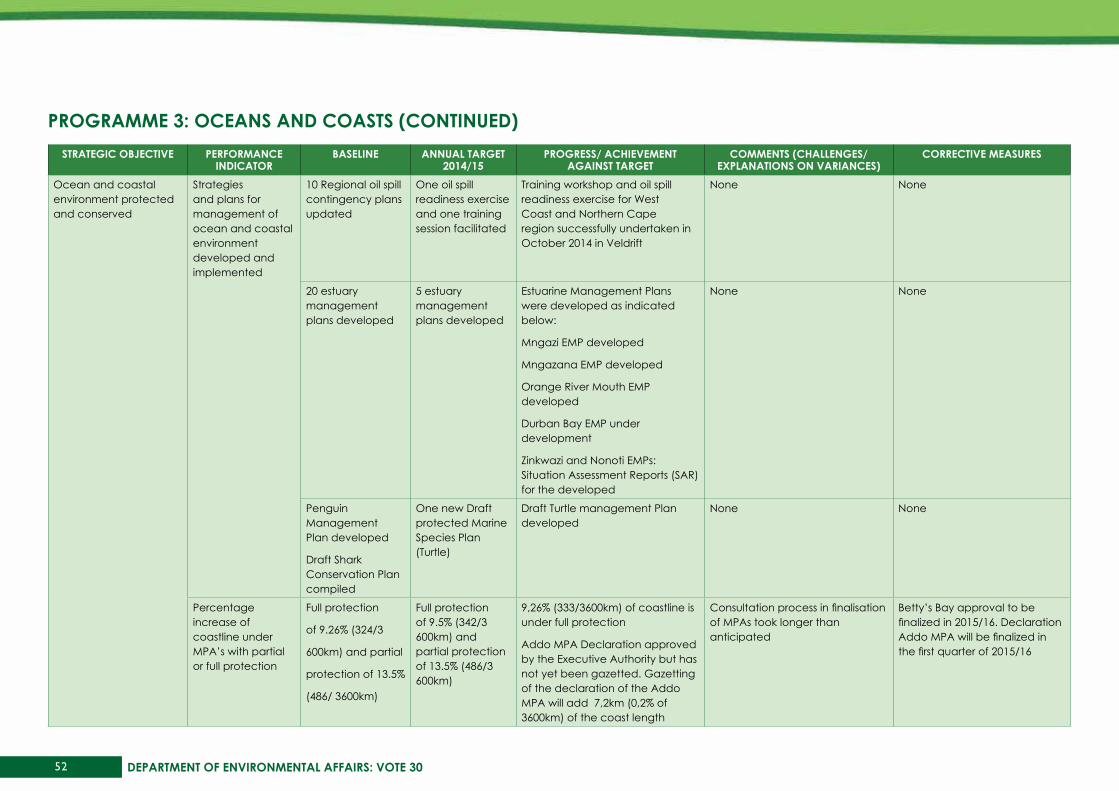
52 DEPARTMENT OF ENVIRONMENTAL AFFAIRS: VOTE 30
sTRATEGIC ObjECTIVE PERFORMANCE INdICATOR
bAsELINE ANNuAL TARGET 2014/15
PROGREss/ AChIEVEMENT AGAINsT TARGET
COMMENTs (ChALLENGEs/EXPLANATIONs ON VARIANCEs)
CORRECTIVE MEAsuREs
Ocean and coastal environment protected and conserved
Strategies and plans for management of ocean and coastal environment developed and implemented
10 Regional oil spill contingency plans updated
One oil spill readiness exercise and one training session facilitated
Training workshop and oil spill readiness exercise for West Coast and Northern Cape region successfully undertaken in October 2014 in Veldrift
None None
20 estuary management plans developed
5 estuary management plans developed
Estuarine Management Plans were developed as indicated below:
Mngazi EMP developed
Mngazana EMP developed
Orange River Mouth EMP developed
Durban Bay EMP under development
Zinkwazi and Nonoti EMPs: Situation Assessment Reports (SAR) for the developed
None None
Penguin Management Plan developed
Draft Shark Conservation Plan compiled
One new Draft protected Marine Species Plan (Turtle)
Draft Turtle management Plan developed
None None
Percentage increase of coastline under MPA’s with partial or full protection
Full protection
of 9.26% (324/3
600km) and partial
protection of 13.5%
(486/ 3600km)
Full protection of 9.5% (342/3 600km) and partial protection of 13.5% (486/3 600km)
9,26% (333/3600km) of coastline is under full protection
Addo MPA Declaration approved by the Executive Authority but has not yet been gazetted. Gazetting of the declaration of the Addo MPA will add 7,2km (0,2% of 3600km) of the coast length
Consultation process in finalisation of MPAs took longer than anticipated
Betty’s Bay approval to be finalized in 2015/16. Declaration Addo MPA will be finalized in the first quarter of 2015/16
PROGRAMME 3: OCEANs ANd COAsTs (CONTINuEd)
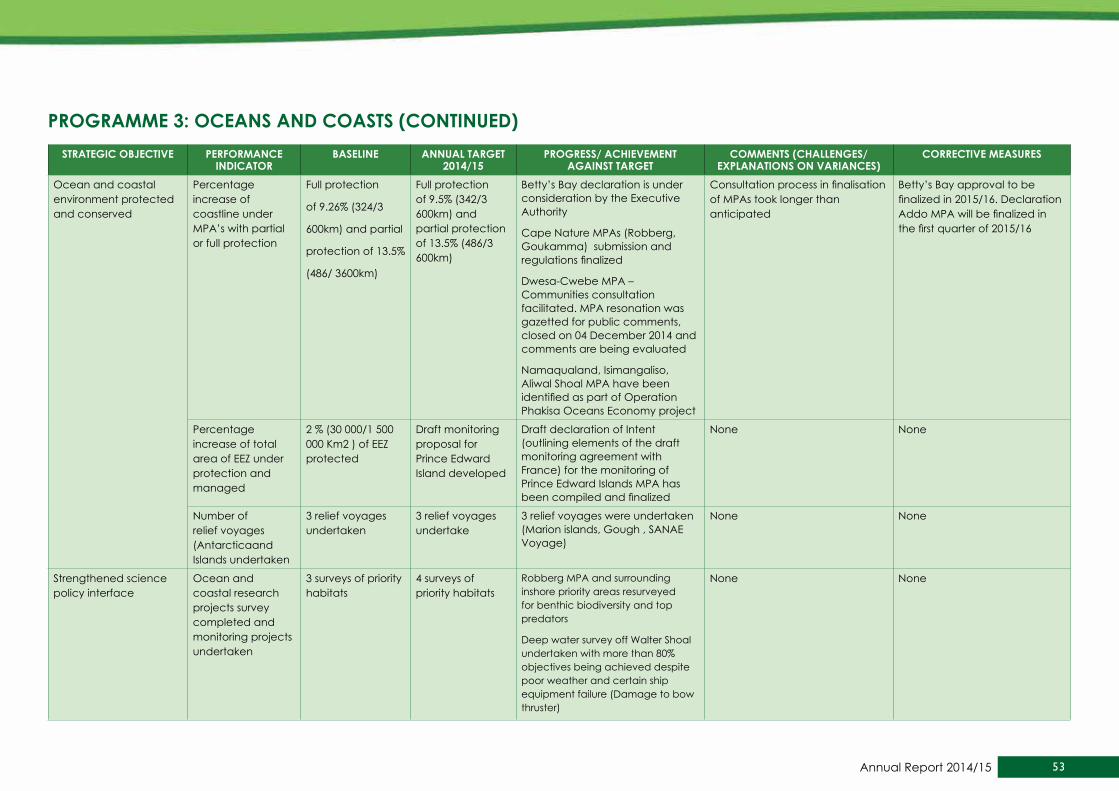
53Annual Report 2014/15
sTRATEGIC ObjECTIVE PERFORMANCE INdICATOR
bAsELINE ANNuAL TARGET 2014/15
PROGREss/ AChIEVEMENT AGAINsT TARGET
COMMENTs (ChALLENGEs/EXPLANATIONs ON VARIANCEs)
CORRECTIVE MEAsuREs
Ocean and coastal environment protected and conserved
Percentage increase of coastline under MPA’s with partial or full protection
Full protection
of 9.26% (324/3
600km) and partial
protection of 13.5%
(486/ 3600km)
Full protection of 9.5% (342/3 600km) and partial protection of 13.5% (486/3 600km)
Betty’s Bay declaration is under consideration by the Executive Authority
Cape Nature MPAs (Robberg, Goukamma) submission and regulations finalized
Dwesa-Cwebe MPA – Communities consultation facilitated. MPA resonation was gazetted for public comments, closed on 04 December 2014 and comments are being evaluated
Namaqualand, Isimangaliso, Aliwal Shoal MPA have been identified as part of Operation Phakisa Oceans Economy project
Consultation process in finalisation of MPAs took longer than anticipated
Betty’s Bay approval to be finalized in 2015/16. Declaration Addo MPA will be finalized in the first quarter of 2015/16
Percentage increase of total area of EEZ under protection and managed
2 % (30 000/1 500 000 Km2 ) of EEZ protected
Draft monitoring proposal for Prince Edward Island developed
Draft declaration of Intent (outlining elements of the draft monitoring agreement with France) for the monitoring of Prince Edward Islands MPA has been compiled and finalized
None None
Number of relief voyages (Antarcticaand Islands undertaken
3 relief voyages undertaken
3 relief voyages undertake
3 relief voyages were undertaken (Marion islands, Gough , SANAE Voyage)
None None
Strengthened science policy interface
Ocean and coastal research projects survey completed and monitoring projects undertaken
3 surveys of priority habitats
4 surveys of priority habitats
Robberg MPA and surrounding inshore priority areas resurveyed for benthic biodiversity and top predators
Deep water survey off Walter Shoal undertaken with more than 80% objectives being achieved despite poor weather and certain ship equipment failure (Damage to bow thruster)
None None
PROGRAMME 3: OCEANs ANd COAsTs (CONTINuEd)

54 DEPARTMENT OF ENVIRONMENTAL AFFAIRS: VOTE 30
sTRATEGIC ObjECTIVE PERFORMANCE INdICATOR
bAsELINE ANNuAL TARGET 2014/15
PROGREss/ AChIEVEMENT AGAINsT TARGET
COMMENTs (ChALLENGEs/EXPLANATIONs ON VARIANCEs)
CORRECTIVE MEAsuREs
Strengthened science policy interface
Ocean and coastal research projects survey completed and monitoring projects undertaken
3 surveys of priority habitats
4 surveys of priority habitats
De Hoop MPA long-term monitoring survey undertaken
Pondoland MPA surveyed
None None
Seabird population estimates for:
12 species around SA (annually)
1 Southern Ocean
species (cumulative)
Seabird population estimates for:
12 species around SA (annually)
2 Southern Ocean species (cumulative)
Population estimates undertaken for all the 12 birds species and;
2 Southern Ocean species (Crozet and African Penguin)
None None
1 Coastal research project completed
2 Coastal research projects completed
National Setback-line methods and recommendations (including estuaries) project plus supporting research studies (CVA Phase 2) undertaken
National Wave height – (DEA – CSIR Coastal Vulnerability) Project
None None
4 Observational platforms deployed
6 Observational platforms deployed
Buoys / moorings deployments:
Nearshore Buoys deployed in Slangkop
4 Deep water Moorings in SAMBA (near Gough) -
Elands Bay Buoy deployed - Elands Bay Buoy Deployment
Underwater Temperature Recorders (UTRs) were serviced in Umkomaas and Amanzimtoti in January 2015. A total of 6 Observational Platforms deployed during the year
PROGRAMME 3: OCEANs ANd COAsTs (CONTINuEd)

55Annual Report 2014/15
sTRATEGIC ObjECTIVE PERFORMANCE INdICATOR
bAsELINE ANNuAL TARGET 2014/15
PROGREss/ AChIEVEMENT AGAINsT TARGET
COMMENTs (ChALLENGEs/EXPLANATIONs ON VARIANCEs)
CORRECTIVE MEAsuREs
Strengthened science policy interface
Number of ecosystem process studies undertaken
1 Integrated Ecosystem Project undertaken
2 Multidisciplinary ocean functioning projects undertaken (in Benguela and Agulhas currents)
The Integrated Ecosystem Programme (IEP) multidisciplinary project undertaken ( Benguela Current)
Unavailability of the adequate ship, RV Algoa and lack of staff who were allocated in a different research cruise delayed the undertaking of the 2nd cruise to the 1st quarter in 2015/16
Multidisciplinary Cruise will be undertaken on the 4 -15 May 2015 in the Benguela Current region to monitor the seasonal variation of the ecosystem
bRIEF OVERVIEw ANd suMMARy OF PROGRAMME PERFORMANCE: OCEANs ANd COAsTsSouth Africa’s ocean and coastal environment is a rich natural asset with a greater potential for socio-economic benefits for our society. The Programme facilitates work which is aimed at ensuring that the vast ocean space to which South has jurisdiction is effectively managed and protected. These interventions includes conducting of extensive on-going research to inform policy direction, development of policies and other legislative frameworks to enable oceans and coastal management. Four surveys of priority habitats where undertaken during the year under review and on-going research work in the Antarctica, the Gough and the Marion Islands was undertaken.
Summary of Programme Performance: In 2014/15 the Programme had a total of 16 annual targets. 13 (81%) of these targets were achieved. The remaining three (3) annual targets were partially achieved (i.e. even though the actual targets were not achieved, significant progress towards the planned targets was made). The reasons and factors which resulted in delays and non-achievement of the planned targets have been provided in the detailed performance report, including the planned corrective interventions to address the highlighted challenges.
PROGRAMME 3: OCEANs ANd COAsTs (CONTINuEd)
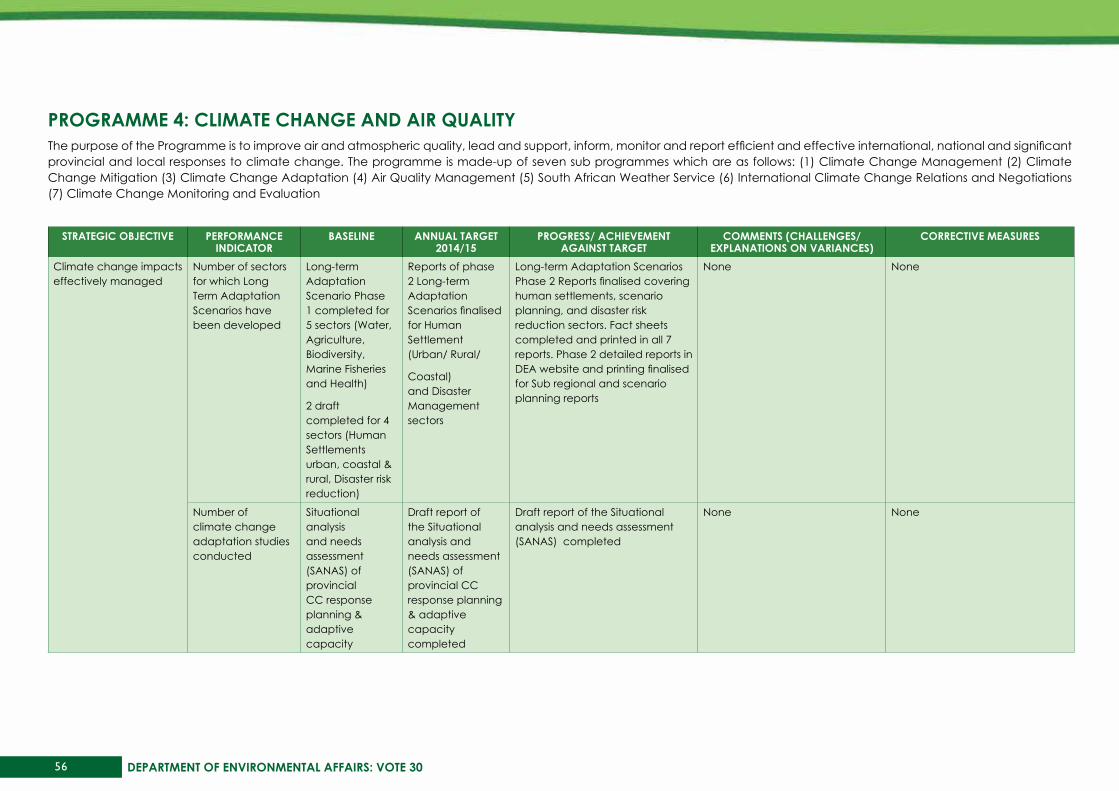
56 DEPARTMENT OF ENVIRONMENTAL AFFAIRS: VOTE 30
PROGRAMME 4: CLIMATE ChANGE ANd AIR QuALITyThe purpose of the Programme is to improve air and atmospheric quality, lead and support, inform, monitor and report efficient and effective international, national and significant provincial and local responses to climate change. The programme is made-up of seven sub programmes which are as follows: (1) Climate Change Management (2) Climate Change Mitigation (3) Climate Change Adaptation (4) Air Quality Management (5) South African Weather Service (6) International Climate Change Relations and Negotiations (7) Climate Change Monitoring and Evaluation
sTRATEGIC ObjECTIVE PERFORMANCE INdICATOR
bAsELINE ANNuAL TARGET 2014/15
PROGREss/ AChIEVEMENT AGAINsT TARGET
COMMENTs (ChALLENGEs/EXPLANATIONs ON VARIANCEs)
CORRECTIVE MEAsuREs
Climate change impacts effectively managed
Number of sectors for which Long Term Adaptation Scenarios have been developed
Long-term Adaptation Scenario Phase 1 completed for 5 sectors (Water, Agriculture, Biodiversity, Marine Fisheries and Health)
2 draft completed for 4 sectors (Human Settlements urban, coastal & rural, Disaster risk reduction)
Reports of phase 2 Long-term Adaptation Scenarios finalised for Human Settlement (Urban/ Rural/
Coastal) and Disaster Management sectors
Long-term Adaptation Scenarios Phase 2 Reports finalised covering human settlements, scenario planning, and disaster risk reduction sectors. Fact sheets completed and printed in all 7 reports. Phase 2 detailed reports in DEA website and printing finalised for Sub regional and scenario planning reports
None None
Number of climate change adaptation studies conducted
Situational analysis and needs assessment (SANAS) of provincial CC response planning & adaptive capacity
Draft report of the Situational analysis and needs assessment (SANAS) of provincial CC response planning & adaptive capacity completed
Draft report of the Situational analysis and needs assessment (SANAS) completed
None None
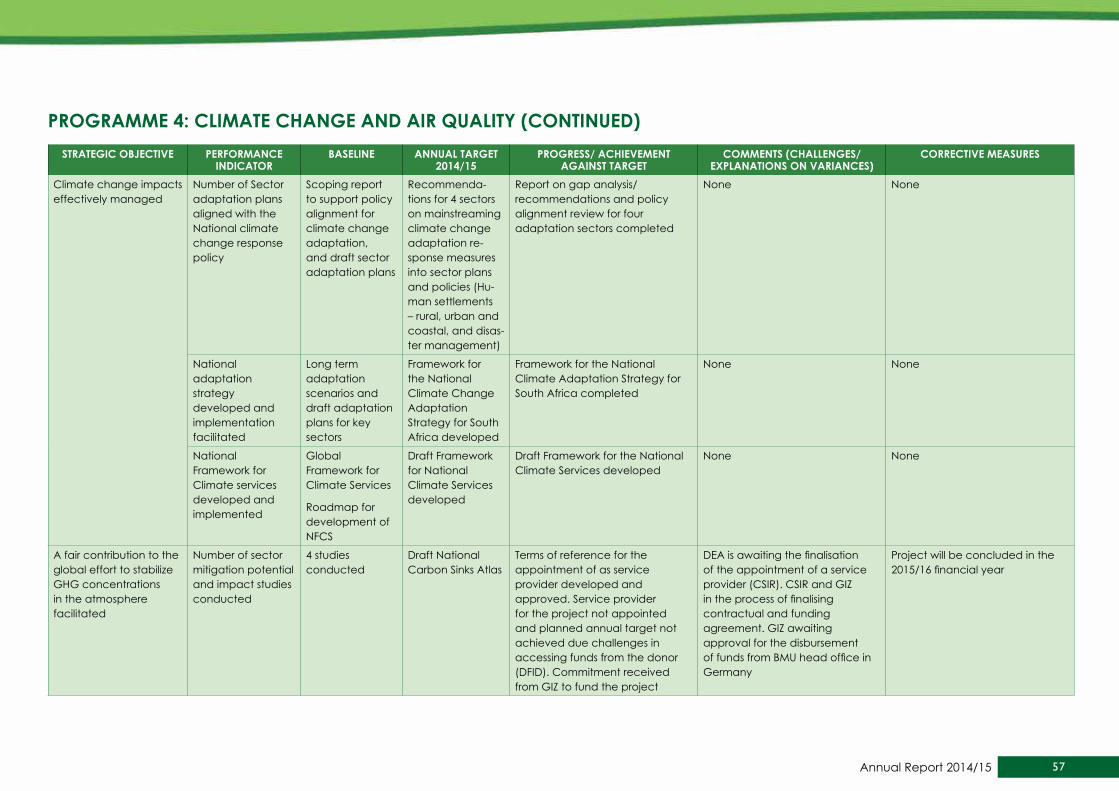
57Annual Report 2014/15
sTRATEGIC ObjECTIVE PERFORMANCE INdICATOR
bAsELINE ANNuAL TARGET 2014/15
PROGREss/ AChIEVEMENT AGAINsT TARGET
COMMENTs (ChALLENGEs/EXPLANATIONs ON VARIANCEs)
CORRECTIVE MEAsuREs
Climate change impacts effectively managed
Number of Sector adaptation plans aligned with the National climate change response policy
Scoping report to support policy alignment for climate change adaptation, and draft sector adaptation plans
Recommenda-tions for 4 sectors on mainstreaming climate change adaptation re-sponse measures into sector plans and policies (Hu-man settlements – rural, urban and coastal, and disas-ter management)
Report on gap analysis/recommendations and policy alignment review for four adaptation sectors completed
None None
National adaptation strategy developed and implementation facilitated
Long term adaptation scenarios and draft adaptation plans for key sectors
Framework for the National Climate Change Adaptation Strategy for South Africa developed
Framework for the National Climate Adaptation Strategy for South Africa completed
None None
National Framework for Climate services developed and implemented
Global Framework for Climate Services
Roadmap for development of NFCS
Draft Framework for National Climate Services developed
Draft Framework for the National Climate Services developed
None None
A fair contribution to the global effort to stabilize GHG concentrations in the atmosphere facilitated
Number of sector mitigation potential and impact studies conducted
4 studies conducted
Draft National Carbon Sinks Atlas
Terms of reference for the appointment of as service provider developed and approved. Service provider for the project not appointed and planned annual target not achieved due challenges in accessing funds from the donor (DFID). Commitment received from GIZ to fund the project
DEA is awaiting the finalisation of the appointment of a service provider (CSIR). CSIR and GIZ in the process of finalising contractual and funding agreement. GIZ awaiting approval for the disbursement of funds from BMU head office in Germany
Project will be concluded in the 2015/16 financial year
PROGRAMME 4: CLIMATE ChANGE ANd AIR QuALITy (CONTINuEd)
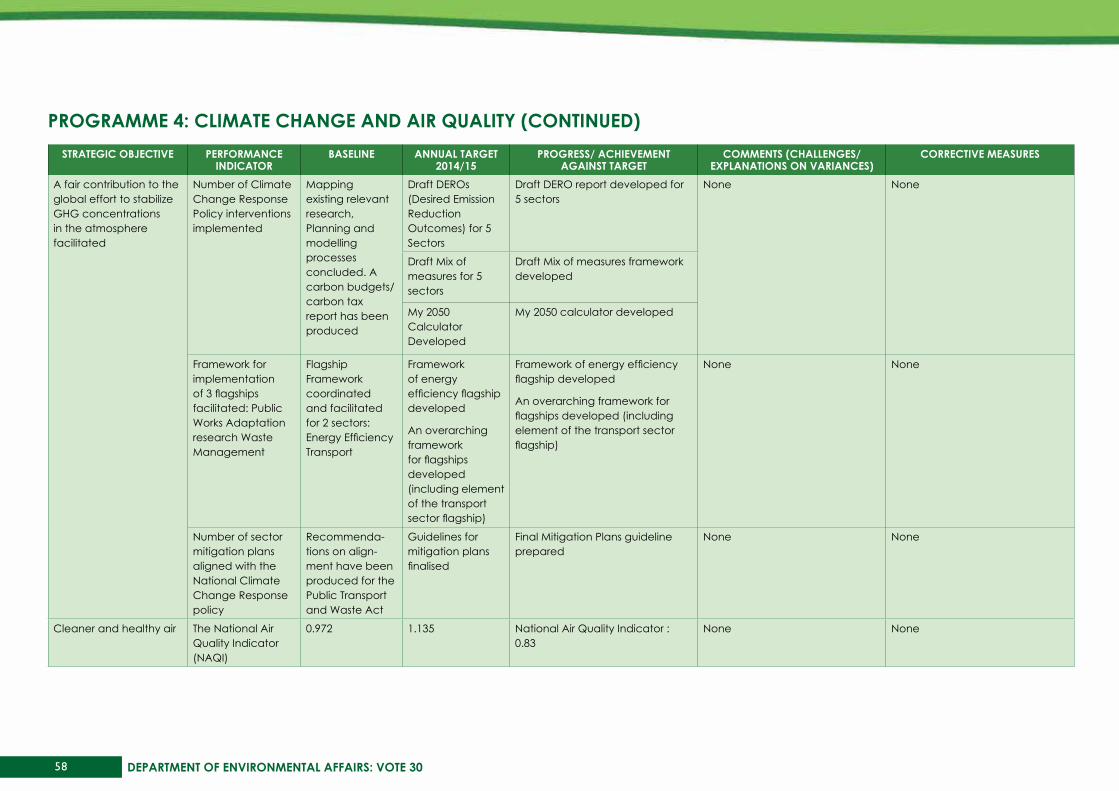
58 DEPARTMENT OF ENVIRONMENTAL AFFAIRS: VOTE 30
sTRATEGIC ObjECTIVE PERFORMANCE INdICATOR
bAsELINE ANNuAL TARGET 2014/15
PROGREss/ AChIEVEMENT AGAINsT TARGET
COMMENTs (ChALLENGEs/EXPLANATIONs ON VARIANCEs)
CORRECTIVE MEAsuREs
A fair contribution to the global effort to stabilize GHG concentrations in the atmosphere facilitated
Number of Climate Change Response Policy interventions implemented
Mapping existing relevant research, Planning and modelling processes concluded. A carbon budgets/ carbon tax report has been produced
Draft DEROs (Desired Emission Reduction Outcomes) for 5 Sectors
Draft DERO report developed for 5 sectors
None None
Draft Mix of measures for 5 sectors
Draft Mix of measures framework developed
My 2050 Calculator Developed
My 2050 calculator developed
Framework for implementation of 3 flagships facilitated: Public Works Adaptation research Waste Management
Flagship Framework coordinated and facilitated for 2 sectors: Energy Efficiency Transport
Framework of energy efficiency flagship developed
An overarching framework for flagships developed (including element of the transport sector flagship)
Framework of energy efficiency flagship developed
An overarching framework for flagships developed (including element of the transport sector flagship)
None None
Number of sector mitigation plans aligned with the National Climate Change Response policy
Recommenda-tions on align-ment have been produced for the Public Transport and Waste Act
Guidelines for mitigation plans finalised
Final Mitigation Plans guideline prepared
None None
Cleaner and healthy air The National Air Quality Indicator (NAQI)
0.972 1.135 National Air Quality Indicator : 0.83
None None
PROGRAMME 4: CLIMATE ChANGE ANd AIR QuALITy (CONTINuEd)

59Annual Report 2014/15
sTRATEGIC ObjECTIVE PERFORMANCE INdICATOR
bAsELINE ANNuAL TARGET 2014/15
PROGREss/ AChIEVEMENT AGAINsT TARGET
COMMENTs (ChALLENGEs/EXPLANATIONs ON VARIANCEs)
CORRECTIVE MEAsuREs
Cleaner and healthy air Number of air quality monitoring stations reporting to SAAQIS
85 (72 Government owned)
90 124 stations (100 Government-Owned + 24 Industry) reporting on SAAQIS
Planned annual target exceeded by 38%. This had no implications on resources allocated for other priorities
None
AQA Regulatory framework developed and implemented
2 Draft offset policy developed
Emissions Offset Policy for AQM published
Emissions Offsets Guidelines finalised
A decision was taken to publish this as a guideline and not a policy – this means that the document produced will not go through cabinet and public consultations
Guidelines have been processed for submission to the Executive Authority for approval and publication
S21 Amended
S23 small boilers promulgated
Dust and modelling regs 2
Draft offset policy developed
Draft S23 – Small Scale Charcoal Plants Declared as Controlled Emitters
Draft S23 – Intention to declare Small Scale Charcoal Plants as Controlled Emitters published for public consultation/comment
None None
2 Priority Area AQMP Water-berg- Bojanala AQMP under
develoment (draft baseline assessment
2014/15 Annual Plans of the National Priority Area AQMPs implemented (Vaal and Highveld
2014/15 Annual Plan plans for 3 AQMPs (Highveld and Vaal Triangle Airshed) implemented and an annual priority area progress report was produced and included in the 2014 NAQO report
Facilitated participation of Municipalities in the two priority areas - a project to develop a database of small industries/ controlled emitters in terms of section 23 of AQA
None None
PROGRAMME 4: CLIMATE ChANGE ANd AIR QuALITy (CONTINuEd)

60 DEPARTMENT OF ENVIRONMENTAL AFFAIRS: VOTE 30
sTRATEGIC ObjECTIVE PERFORMANCE INdICATOR
bAsELINE ANNuAL TARGET 2014/15
PROGREss/ AChIEVEMENT AGAINsT TARGET
COMMENTs (ChALLENGEs/EXPLANATIONs ON VARIANCEs)
CORRECTIVE MEAsuREs
Cleaner and healthy air AQA Regulatory framework developed and implemented
2 Priority Area AQMP
Waterberg- Bo-janala AQMP under develop-ment(draft base-line assessment)
2014/15 Annual Plans of the National Priority Area AQMPs implemented (Vaal and Highveld)
Awareness and education workshop held on domestic fuel burning on the 26 February 2015 at Ermelo for AQM officials and EHPs in GSDM, HPA. The workshop was also expanded to cover biomass and waste burning
Capacity building training workshop on controlled emitters in terms of section 23 of AQA (mobile asphalt and small boilers regulations) was held at De Duer on the 17 march 2015 for AQM officials in VTAPA
Air quality implementation task team meetings coordinated and held in VTAPA
None None
Waterberg-Bojanala AQMP and threat assessment published in the gazette
Waterberg-Bojanala AQMP approved for public comments
None None
PROGRAMME 4: CLIMATE ChANGE ANd AIR QuALITy (CONTINuEd)
61Annual Report 2014/15
bRIEF OVERVIEw ANd suMMARy OF PROGRAMME PERFORMANCE: CLIMATE ANd AIR QuALITyThe Programme has two main focus areas, the first one is to coordinate implementation and monitoring of South Africa’s National Climate Change Response policy which is aimed at effectively managing and mitigating the causes and impacts of climate change. The work entails facilitating implementation of interventions to build South Africa’s resilience and emergency response capacity and to facilitate a fair contribution to the global effort to reduce greenhouse gas emission to acceptable levels. The second area of work relates to implementation of measures to effective management of air pollution and enhance the quality of air in South Africa. In 2014/15 the Department finalised and published the long-term adaptation Scenarios phase 2 reports and also a report on policy alignment review for four sectors on climate change adaptation. The planned annual activities to implement Air Quality Management Plans (AQMPs) for declared national priority areas were facilitated for the Vaal Triangle and Highveld AQMPs. The Waterberg-Bojanala Air Quality Management Plan was published for public comments.
Summary of Programme Performance: In 2014/15 the Programme had a total of 17 annual targets. 13 (76%) of these targets were achieved. The remaining four (4) annual targets were not achieved. Three (3) targets were partially achieved (i.e. even though the actual targets were not achieved, significant progress towards the planned targets was made). Progress towards achieving the remaining one (1) target was significantly delayed. The reasons and factors which resulted in delays and non-achievement of planned targets have been provided in the detailed performance report, including the planned corrective interventions to address the highlighted challenges.
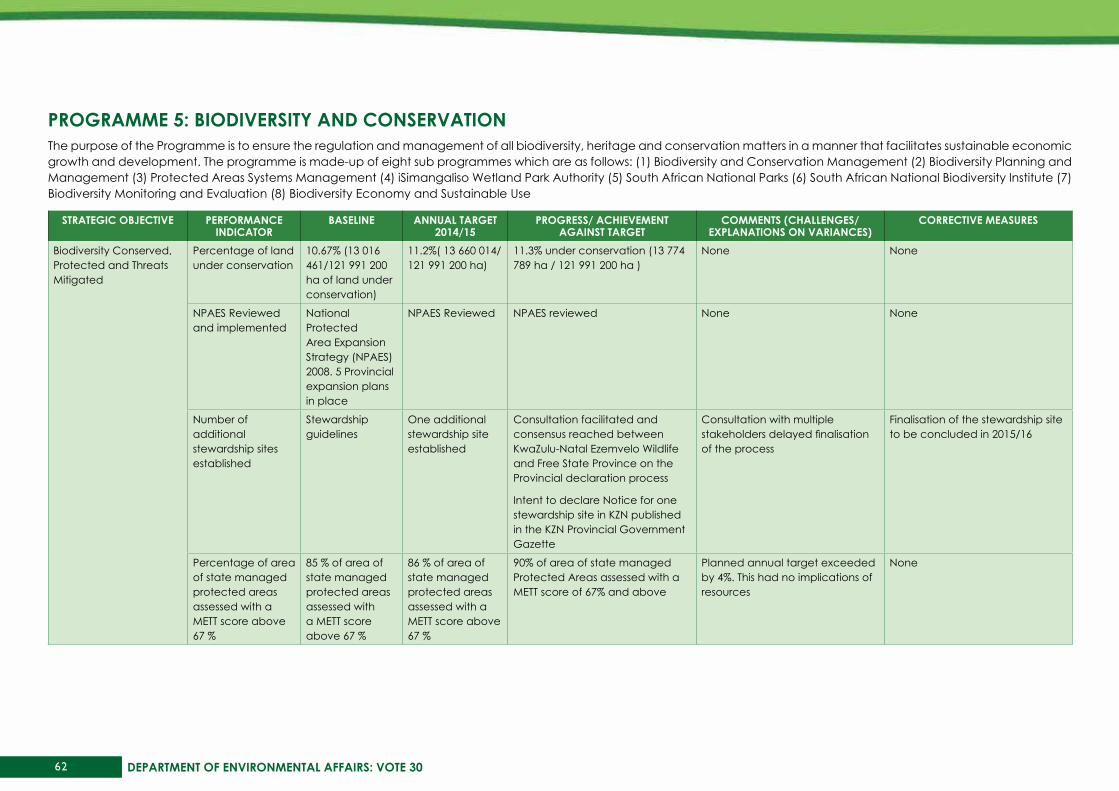
62 DEPARTMENT OF ENVIRONMENTAL AFFAIRS: VOTE 30
PROGRAMME 5: bIOdIVERsITy ANd CONsERVATIONThe purpose of the Programme is to ensure the regulation and management of all biodiversity, heritage and conservation matters in a manner that facilitates sustainable economic growth and development. The programme is made-up of eight sub programmes which are as follows: (1) Biodiversity and Conservation Management (2) Biodiversity Planning and Management (3) Protected Areas Systems Management (4) iSimangaliso Wetland Park Authority (5) South African National Parks (6) South African National Biodiversity Institute (7) Biodiversity Monitoring and Evaluation (8) Biodiversity Economy and Sustainable Use
sTRATEGIC ObjECTIVE PERFORMANCE INdICATOR
bAsELINE ANNuAL TARGET 2014/15
PROGREss/ AChIEVEMENT AGAINsT TARGET
COMMENTs (ChALLENGEs/EXPLANATIONs ON VARIANCEs)
CORRECTIVE MEAsuREs
Biodiversity Conserved, Protected and Threats Mitigated
Percentage of land under conservation
10.67% (13 016 461/121 991 200 ha of land under conservation)
11.2%( 13 660 014/ 121 991 200 ha)
11.3% under conservation (13 774 789 ha / 121 991 200 ha )
None None
NPAES Reviewed and implemented
National Protected Area Expansion Strategy (NPAES) 2008. 5 Provincial expansion plans in place
NPAES Reviewed NPAES reviewed None None
Number of additional stewardship sites established
Stewardship guidelines
One additional stewardship site established
Consultation facilitated and consensus reached between KwaZulu-Natal Ezemvelo Wildlife and Free State Province on the Provincial declaration process
Intent to declare Notice for one stewardship site in KZN published in the KZN Provincial Government Gazette
Consultation with multiple stakeholders delayed finalisation of the process
Finalisation of the stewardship site to be concluded in 2015/16
Percentage of area of state managed protected areas assessed with a METT score above 67 %
85 % of area of state managed protected areas assessed with a METT score above 67 %
86 % of area of state managed protected areas assessed with a METT score above 67 %
90% of area of state managed Protected Areas assessed with a METT score of 67% and above
Planned annual target exceeded by 4%. This had no implications of resources
None
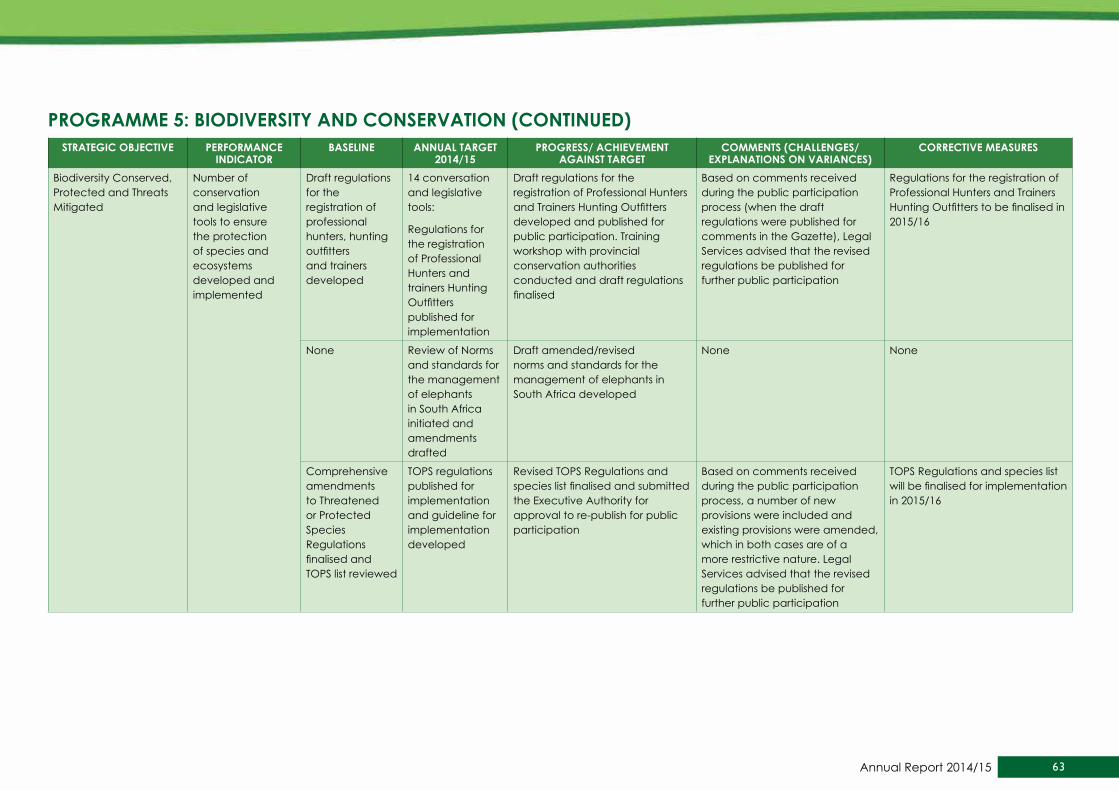
63Annual Report 2014/15
sTRATEGIC ObjECTIVE PERFORMANCE INdICATOR
bAsELINE ANNuAL TARGET 2014/15
PROGREss/ AChIEVEMENT AGAINsT TARGET
COMMENTs (ChALLENGEs/EXPLANATIONs ON VARIANCEs)
CORRECTIVE MEAsuREs
Biodiversity Conserved, Protected and Threats Mitigated
Number of conservation and legislative tools to ensure the protection of species and ecosystems developed and implemented
Draft regulations for the registration of professional hunters, hunting outfitters and trainers developed
14 conversation and legislative tools:
Regulations for the registration of Professional Hunters and trainers Hunting Outfitters published for implementation
Draft regulations for the registration of Professional Hunters and Trainers Hunting Outfitters developed and published for public participation. Training workshop with provincial conservation authorities conducted and draft regulations finalised
Based on comments received during the public participation process (when the draft regulations were published for comments in the Gazette), Legal Services advised that the revised regulations be published for further public participation
Regulations for the registration of Professional Hunters and Trainers Hunting Outfitters to be finalised in 2015/16
None Review of Norms and standards for the management of elephants in South Africa initiated and amendments drafted
Draft amended/revised norms and standards for the management of elephants in South Africa developed
None None
Comprehensive amendments to Threatened or Protected Species Regulations finalised and TOPS list reviewed
TOPS regulations published for implementation and guideline for implementation developed
Revised TOPS Regulations and species list finalised and submitted the Executive Authority for approval to re-publish for public participation
Based on comments received during the public participation process, a number of new provisions were included and existing provisions were amended, which in both cases are of a more restrictive nature. Legal Services advised that the revised regulations be published for further public participation
TOPS Regulations and species list will be finalised for implementation in 2015/16
PROGRAMME 5: bIOdIVERsITy ANd CONsERVATION (CONTINuEd)

64 DEPARTMENT OF ENVIRONMENTAL AFFAIRS: VOTE 30
sTRATEGIC ObjECTIVE PERFORMANCE INdICATOR
bAsELINE ANNuAL TARGET 2014/15
PROGREss/ AChIEVEMENT AGAINsT TARGET
COMMENTs (ChALLENGEs/EXPLANATIONs ON VARIANCEs)
CORRECTIVE MEAsuREs
Biodiversity Conserved, Protected and Threats Mitigated
Number of conservation and legislative tools to ensure the protection of species and ecosystems developed and implemented
Draft Amendment Regulations on Bioprospecting, Access and Benefit Sharing Regulations developed and published for public participation
BABS Amendments Regulations approved by Inter-governmental structures
BABS Amendments Regulations approved by MINMEC.
None None
NEMBA review completed
NEMBA reviewed None None
NEMPAA Amendment Bill (MPAs) published for public comments (Phase 1) Stakeholder engagement on TFCAs and WHS to be incorporated in NEMPAA Amendment Bill (Phase 2)
Amendment Bill to incorporate MPAs into NEMPAA finalised
NCOP process completed and amendment Bill to incorporate MPAs into NEMPAA finalised
None None
A draft Amendment Bill incorporating provisions relating to TFCAs and WHS reserves into NEMPAA developed
Draft Amendment Bill incorporating provisions relating to TFCAs and WHS reserves into NEMPAA developed
None None
Draft norms and standards for the management of protected areas completed
Norms and standards for management of protected areas finalised
Norms and standards for the management of protected areas finalised and published for public participation
Extensive comments/inputs required additional time to consider and to be incorporated in the final norms and standards
Norms and standards for the management of protected areas will be published for implementation in 2015/16
PROGRAMME 5: bIOdIVERsITy ANd CONsERVATION (CONTINuEd)

65Annual Report 2014/15
sTRATEGIC ObjECTIVE PERFORMANCE INdICATOR
bAsELINE ANNuAL TARGET 2014/15
PROGREss/ AChIEVEMENT AGAINsT TARGET
COMMENTs (ChALLENGEs/EXPLANATIONs ON VARIANCEs)
CORRECTIVE MEAsuREs
Biodiversity Conserved, Protected and Threats Mitigated
Number of conservation and legislative tools to ensure the protection of species and ecosystems developed and implemented
Draft norms and standards for the declaration and inclusion of private nature reserves developed
Draft norms and standards for the declaration and inclusion of private nature reserves completed
2nd draft of Norms and standards for declaration and inclusion of private nature reserves completed
None None
Amendment of Regulations for Special Nature Reserves, National Parks and World Heritage sites completed
Amendment of regulations for Special Nature Reserves, National Parks and World Heritage sites published for implementation
Regulations published in the Gazette for implementation
None None
Biodiversity Management Plans for Black Rhino, Albany Cycad and Pelargonium sidoides published in government gazette and implemented.Norms and Standards for Biodiversity Management plans for Ecosystems finalised.
Draft BMP for 1 ecosystem developed
Draft BMP for one ecosystem ( Colbyn Valley Wetland) developed
None None
PROGRAMME 5: bIOdIVERsITy ANd CONsERVATION (CONTINuEd)

66 DEPARTMENT OF ENVIRONMENTAL AFFAIRS: VOTE 30
sTRATEGIC ObjECTIVE PERFORMANCE INdICATOR
bAsELINE ANNuAL TARGET 2014/15
PROGREss/ AChIEVEMENT AGAINsT TARGET
COMMENTs (ChALLENGEs/EXPLANATIONs ON VARIANCEs)
CORRECTIVE MEAsuREs
Biodiversity Conserved, Protected and Threats Mitigated
Number of conservation and legislative tools to ensure the protection of species and ecosystems developed and implemented
Norms and Standards for Biodiversity Management plans for Ecosystems finalised
2 Biodiversity Management Plans for species finalised for public participation (African Lion, White Rhino),and one BMP-S finalised for implementation (Bearded Vulture)
African Lion : Draft BMP for African Lion approved for public participation
White Rhino : Draft BMP for White Rhino approved and published for public participation
Bearded Vulture: BMP for Bearded Vulture target was finalised for implementation
None None
Draft National Cycad Management Strategy
National Cycad Management Strategy and Action Plan approved
National Cycad Management Strategy and Action Plan approved
None None
Draft NBSAP developed
Draft NBSAP developed None None
Number of tools to mitigate threats to biodiversity
NAP to combat land degradation
NAP review and alignment with the UNCCD 10 year Strategy and Framework finalised
NAP review and alignment with the UNCCD 10 year Strategy and Framework finalised. Implementation plan of the revised NAP developed
None None
Biodiversity Climate Change Adaptation Frameworks for 9 biomes developed
Draft Biodiversity Climate Change Adaptation Plans for 9 biomes developed
Draft Biodiversity climate change adaptation plans for 9 biomes developed
None None
Tools for the implementation of the Ramsar Convention developed and implemented
20 management plans for Ramsar sites
One Ramsar site designated
False Bay Nature Reserve designated as Ramsar Site
None None
PROGRAMME 5: bIOdIVERsITy ANd CONsERVATION (CONTINuEd)

67Annual Report 2014/15
sTRATEGIC ObjECTIVE PERFORMANCE INdICATOR
bAsELINE ANNuAL TARGET 2014/15
PROGREss/ AChIEVEMENT AGAINsT TARGET
COMMENTs (ChALLENGEs/EXPLANATIONs ON VARIANCEs)
CORRECTIVE MEAsuREs
Biodiversity Conserved, Protected and Threats Mitigated
Tools for the implementation of the Ramsar Convention developed and implemented
20 management plans for Ramsar sites
Draft strategy to remove sites from the Montreux record developed
Draft strategy has been developed
None None
Fair Access and Equitable Sharing Of Benefits from Biological Resources Promoted
Biodiversity Sector Transformation framework developed and implemented
Draft Biodiversity sector analysis
Biodiversity sector transformation framework finalised
Biodiversity Sector transformation framework has been finalised
None None
Number of sustainable natural resource based interventions and instruments identified, developed and implementation facilitated
First Draft National Biodiversity Economy Development Strategy
National Biodiversity Economy Development Strategy finalised
Consultation finalised and first draft of the National Biodiversity Economy Development Strategy updated
Extensive and substantive comments inputs received during stakeholder consultation required additional time to process and incorporate
Consultation finalised and inputs considered. Strategy will be finalised in 2015/16
2 Biodiversity Economy development projects selected for future support
2 Biodiversity Economy development projects supported for implementation
Communities supported in the development business plans for 2 Biodiversity Economy development projects:
Tyefu Aloe ferox harvesting
Balepye/Selwane Rhino farming projects
None None
2 cross border trails Operationalized
1 cross border trail Operationalized
Desert Kayak cross border trail operationalized
None None
10 projects from the TFCA catalogue Implemented
1 project from the TFCA investment catalogue Implemented
One project implemented (Sehlabathebe Lodge operational)
None None
PROGRAMME 5: bIOdIVERsITy ANd CONsERVATION (CONTINuEd)
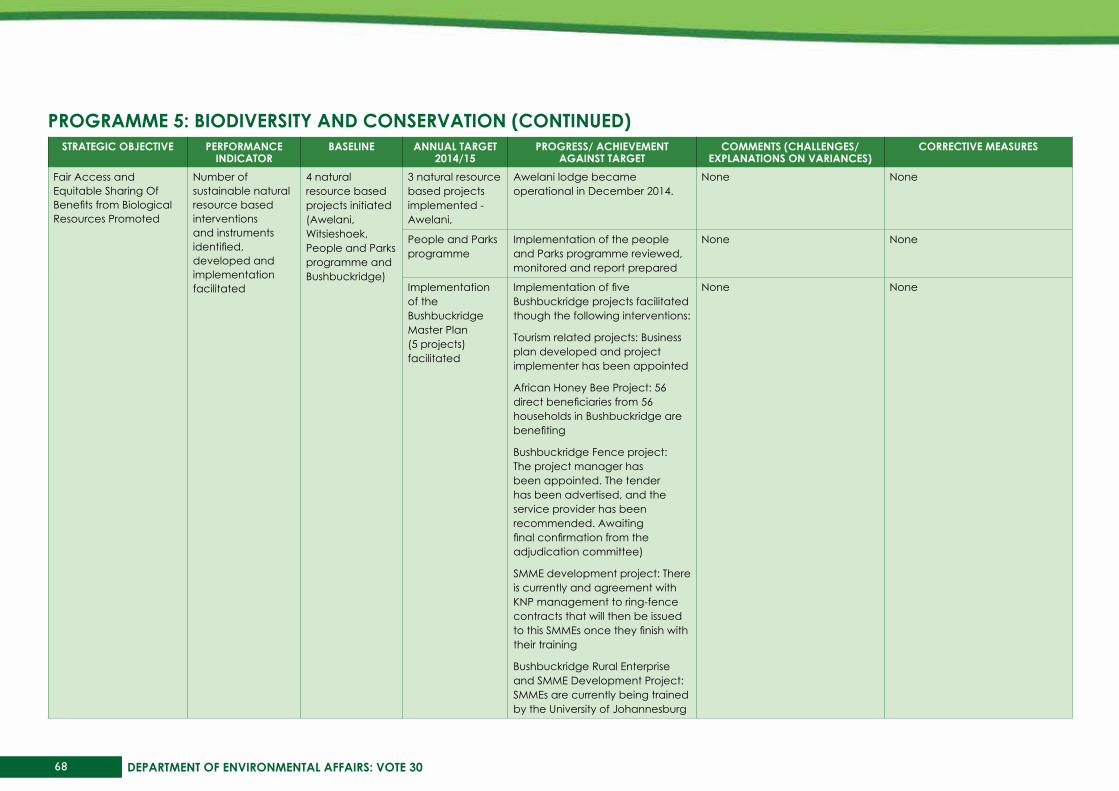
68 DEPARTMENT OF ENVIRONMENTAL AFFAIRS: VOTE 30
sTRATEGIC ObjECTIVE PERFORMANCE INdICATOR
bAsELINE ANNuAL TARGET 2014/15
PROGREss/ AChIEVEMENT AGAINsT TARGET
COMMENTs (ChALLENGEs/EXPLANATIONs ON VARIANCEs)
CORRECTIVE MEAsuREs
Fair Access and Equitable Sharing Of Benefits from Biological Resources Promoted
Number of sustainable natural resource based interventions and instruments identified, developed and implementation facilitated
4 natural resource based projects initiated (Awelani, Witsieshoek, People and Parks programme and Bushbuckridge)
3 natural resource based projects implemented - Awelani,
Awelani lodge became operational in December 2014.
None None
People and Parks programme
Implementation of the people and Parks programme reviewed, monitored and report prepared
None None
Implementation of the Bushbuckridge Master Plan (5 projects) facilitated
Implementation of five Bushbuckridge projects facilitated though the following interventions:
Tourism related projects: Business plan developed and project implementer has been appointed
African Honey Bee Project: 56 direct beneficiaries from 56 households in Bushbuckridge are benefiting
Bushbuckridge Fence project: The project manager has been appointed. The tender has been advertised, and the service provider has been recommended. Awaiting final confirmation from the adjudication committee)
SMME development project: There is currently and agreement with KNP management to ring-fence contracts that will then be issued to this SMMEs once they finish with their training
Bushbuckridge Rural Enterprise and SMME Development Project: SMMEs are currently being trained by the University of Johannesburg
None None
PROGRAMME 5: bIOdIVERsITy ANd CONsERVATION (CONTINuEd)

69Annual Report 2014/15
sTRATEGIC ObjECTIVE PERFORMANCE INdICATOR
bAsELINE ANNuAL TARGET 2014/15
PROGREss/ AChIEVEMENT AGAINsT TARGET
COMMENTs (ChALLENGEs/EXPLANATIONs ON VARIANCEs)
CORRECTIVE MEAsuREs
Strengthened science policy interface
Number of interventions aimed at advancing the biodiversity science policy interface
Draft biodiversity research strategy
Biodiversity Research strategy finalised
Biodiversity Research Strategy has been approved
None None
IPBES Established National IPBES hub established
IPBES hub functional and launched at IPBES stakeholder Engagement Meeting-17 March 2015
None None
Draft elephant research strategy
Elephant research strategy approved
Elephant Research Strategy was approved and published for implementation
None None
Desertification Land Degradation and Drought (DLDD) research strategy
Phase 1: UNCCD DLDD land cover mapping impact indicator research finalised
UNCCD DLDD land cover mapping impact indicator research finalised
None None
N/A Report on the extent of MON810 insect resistance finalised
Report on the extent of insect resistance to MON810 finalised
None None
N/A 2 Science/policy input Reports compiled on Risk Analysis for intensive breeding in the wildlife sector; and State of play report on Predator control and conservation
2 science/policy reports compiled (1) State of Play report (Predator control and conservation) (2) Risk analysis on intensive breeding
None None
PROGRAMME 5: bIOdIVERsITy ANd CONsERVATION (CONTINuEd)

70 DEPARTMENT OF ENVIRONMENTAL AFFAIRS: VOTE 30
bRIEF OVERVIEw ANd suMMARy OF PROGRAMME PERFORMANCE: bIOdIVERsITy ANd CONsERVATIONSouth Africa’s diverse biodiversity requires effective management and on-going protection to ensure sustainability. The Programme implements policy measures to ensure that South Africa’s biodiversity and natural heritage is conserved and protected. There is also a focus on promoting fair access to the country’s biological resources and ensuring equitable sharing of the socio-economic benefits from the natural resource base. South Africa’s area of land under formal protection was increased to 11.3% (13 774 789 /121 991 200 hectares) from 10.67% in the previous financial year. The Department also facilitated implementation of a number of community based projects which are providing socio-economic benefits to communities a part of enhancing access and equitable benefits from our natural resources.
Summary of Programme Performance: In 2014/15 the Programme had a total of 36 annual targets. 31 (86%) of these targets were achieved. The remaining five (5) annual targets were partially achieved (i.e. even though the actual targets were not achieved, significant progress towards the planned targets was made). The reasons and factors which resulted in delays and non-achievement of the planned targets have been provided in the detailed performance report, including the planned corrective interventions to address the highlighted challenges.
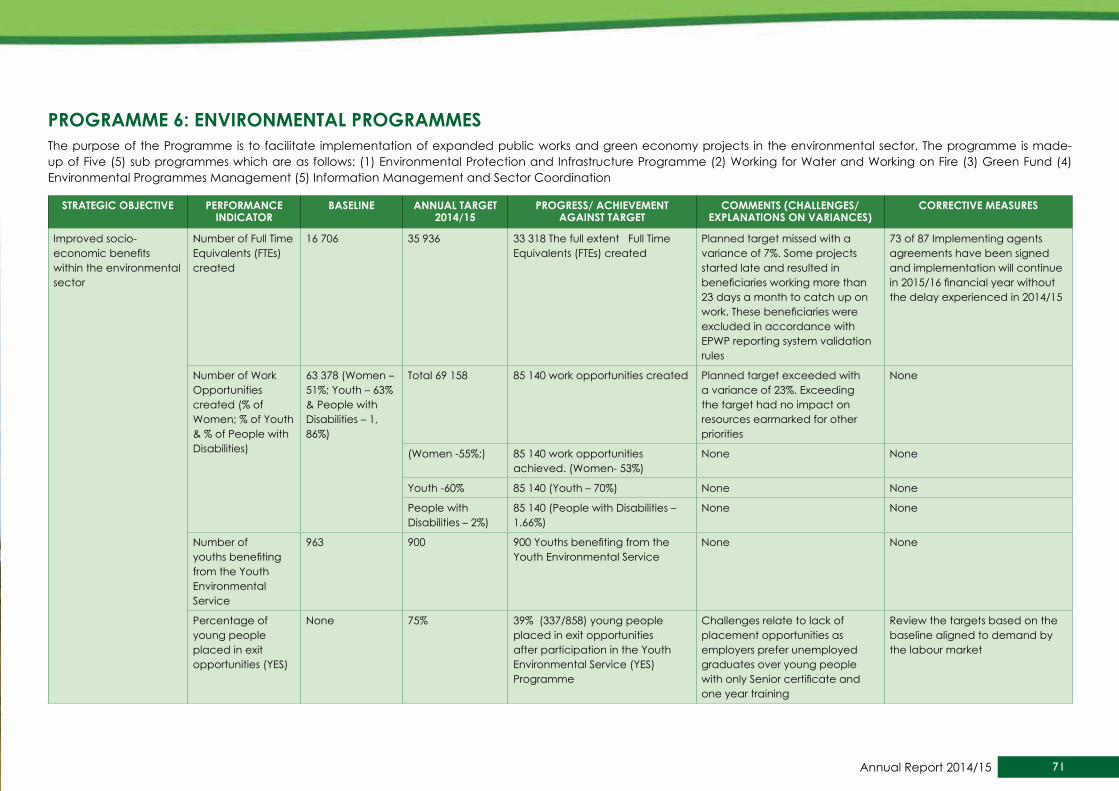
71Annual Report 2014/15
PROGRAMME 6: ENVIRONMENTAL PROGRAMMEsThe purpose of the Programme is to facilitate implementation of expanded public works and green economy projects in the environmental sector. The programme is made-up of Five (5) sub programmes which are as follows: (1) Environmental Protection and Infrastructure Programme (2) Working for Water and Working on Fire (3) Green Fund (4) Environmental Programmes Management (5) Information Management and Sector Coordination
sTRATEGIC ObjECTIVE PERFORMANCE INdICATOR
bAsELINE ANNuAL TARGET 2014/15
PROGREss/ AChIEVEMENT AGAINsT TARGET
COMMENTs (ChALLENGEs/EXPLANATIONs ON VARIANCEs)
CORRECTIVE MEAsuREs
Improved socio-economic benefits within the environmental sector
Number of Full Time Equivalents (FTEs) created
16 706 35 936 33 318 The full extent Full Time Equivalents (FTEs) created
Planned target missed with a variance of 7%. Some projects started late and resulted in beneficiaries working more than 23 days a month to catch up on work. These beneficiaries were excluded in accordance with EPWP reporting system validation rules
73 of 87 Implementing agents agreements have been signed and implementation will continue in 2015/16 financial year without the delay experienced in 2014/15
Number of Work Opportunities created (% of Women; % of Youth & % of People with Disabilities)
63 378 (Women – 51%; Youth – 63% & People with Disabilities – 1, 86%)
Total 69 158 85 140 work opportunities created Planned target exceeded with a variance of 23%. Exceeding the target had no impact on resources earmarked for other priorities
None
(Women -55%;) 85 140 work opportunities achieved. (Women- 53%)
None None
Youth -60% 85 140 (Youth – 70%) None None
People with Disabilities – 2%)
85 140 (People with Disabilities – 1.66%)
None None
Number of youths benefiting from the Youth Environmental Service
963 900 900 Youths benefiting from the Youth Environmental Service
None None
Percentage of young people placed in exit opportunities (YES)
None 75% 39% (337/858) young people placed in exit opportunities after participation in the Youth Environmental Service (YES) Programme
Challenges relate to lack of placement opportunities as employers prefer unemployed graduates over young people with only Senior certificate and one year training
Review the targets based on the baseline aligned to demand by the labour market

72 DEPARTMENT OF ENVIRONMENTAL AFFAIRS: VOTE 30
sTRATEGIC ObjECTIVE PERFORMANCE INdICATOR
bAsELINE ANNuAL TARGET 2014/15
PROGREss/ AChIEVEMENT AGAINsT TARGET
COMMENTs (ChALLENGEs/EXPLANATIONs ON VARIANCEs)
CORRECTIVE MEAsuREs
Improved socio-economic benefits within the environmental sector
Number of overnight visitor and staff accommodation units established
104 22 33 (31 overnight visitor and staff accommodation units established and 2 units renovated)
Planned target exceeded with a variance of 50%. Exceeding the target had no impact on resources earmarked for other priorities
None
Number of school desk equivalent
22 424 120 000 160 090 school desk equivalent produced
Planned target exceeded with a variance of 33%. Exceeding the target had no impact on resources earmarked for other priorities
None
Number of SMMEs utilised (empowerment )
2 611 2 210 2 210 SMMEs used None None
Ecosystem services restored and maintained
Number of wetlands under rehabilitation
96 115 115 wetlands under rehabilitation None None
Number of hectares of land where invasive alien plants treated/cleared (Initial Treatment)
None 169 045 205 500 hectares of land where invasive alien plants treated/cleared
Planned target exceeded with a variance of 22%. Exceeding the target had no impact on resources earmarked for other priorities
None
Number of hectares of land where follow up invasive alien plants treated/cleared (Follow up Treatment)
None 560 339 556 722 hectares of land where follow up invasive alien plants treated/cleared
Planned target missed by marginal variance which is below one percent
None
Number of hectares of degraded land under repair
36 682 31 262 66 542 hectares of degraded land under repair
Planned target exceeded with a variance of 113%. Exceeding the target had no impact on resources earmarked for other priorities
None
PROGRAMME 6: ENVIRONMENTAL PROGRAMMEs (CONTINuEd)
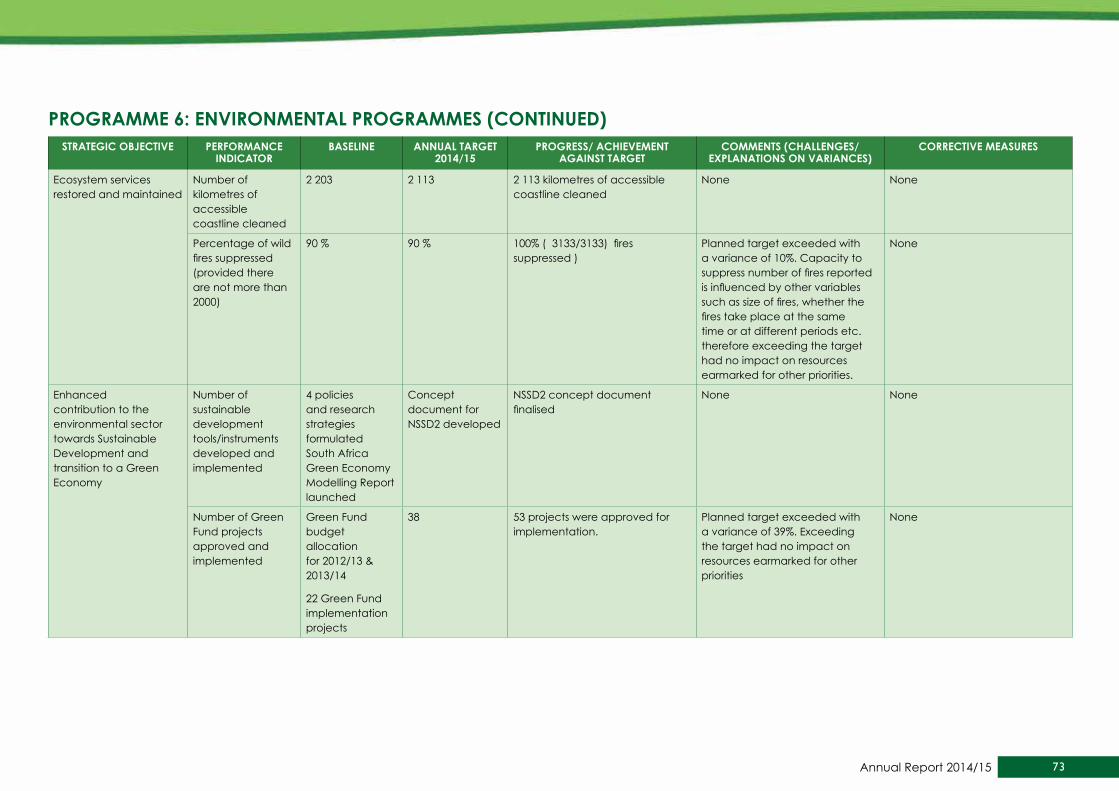
73Annual Report 2014/15
sTRATEGIC ObjECTIVE PERFORMANCE INdICATOR
bAsELINE ANNuAL TARGET 2014/15
PROGREss/ AChIEVEMENT AGAINsT TARGET
COMMENTs (ChALLENGEs/EXPLANATIONs ON VARIANCEs)
CORRECTIVE MEAsuREs
Ecosystem services restored and maintained
Number of kilometres of accessible coastline cleaned
2 203 2 113 2 113 kilometres of accessible coastline cleaned
None None
Percentage of wild fires suppressed (provided there are not more than 2000)
90 % 90 % 100% ( 3133/3133) fires suppressed )
Planned target exceeded with a variance of 10%. Capacity to suppress number of fires reported is influenced by other variables such as size of fires, whether the fires take place at the same time or at different periods etc. therefore exceeding the target had no impact on resources earmarked for other priorities.
None
Enhanced contribution to the environmental sector towards Sustainable Development and transition to a Green Economy
Number of sustainable development tools/instruments developed and implemented
4 policies and research strategies formulated South Africa Green Economy Modelling Report launched
Concept document for NSSD2 developed
NSSD2 concept document finalised
None None
Number of Green Fund projects approved and implemented
Green Fund budget allocation for 2012/13 & 2013/14
22 Green Fund implementation projects
38 53 projects were approved for implementation.
Planned target exceeded with a variance of 39%. Exceeding the target had no impact on resources earmarked for other priorities
None
PROGRAMME 6: ENVIRONMENTAL PROGRAMMEs (CONTINuEd)

74 DEPARTMENT OF ENVIRONMENTAL AFFAIRS: VOTE 30
sTRATEGIC ObjECTIVE PERFORMANCE INdICATOR
bAsELINE ANNuAL TARGET 2014/15
PROGREss/ AChIEVEMENT AGAINsT TARGET
COMMENTs (ChALLENGEs/EXPLANATIONs ON VARIANCEs)
CORRECTIVE MEAsuREs
Enhanced contribution to the environmental sector towards Sustainable Development and transition to a Green Economy
Number of high- level environmental and sustainable development threat, weakness or opportunity early warning and/or response options researched and developed
Quarterly Environmental Threat, Weakness and Opportunity Scan (QETWOS) system established, and tested
6 issues investigated – Shale gas carbon footprint; Peak phosphate; Environmental Offsetting; National Evaluations; MTSF 2014-2019; SIP 19
4 issue response options – Shale gas carbon footprint; National Evaluations; MTSF 2014-2019; and SIP 19
Quarterly early warning and/or issue scanning reports
4 Quarterly Early Warning and/or issue scanning reports prepared and submitted to Management for consideration
None None
4 emerging issue response options formally submitted to top management and approved responses developed (where necessary)
4 emerging issue response options submitted to top management:
SIP 19 Description document
Concerns around the apparent shallowness, narrow focus and the potentially dubious factual basis of the current national discourse on food and nutrition security
South Africa’s Response to Local and Global Change – Time for a new development approach
The Draft Environmental Offsetting Discussion Document
None None
PROGRAMME 6: ENVIRONMENTAL PROGRAMMEs (CONTINuEd)
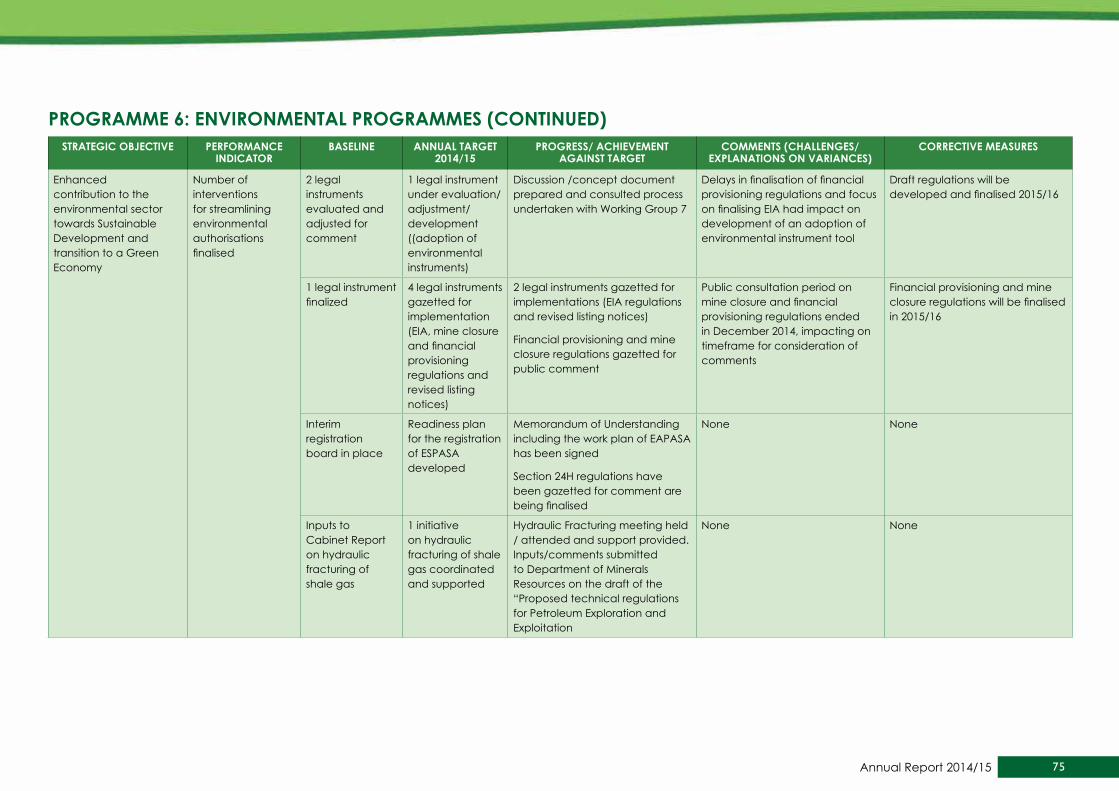
75Annual Report 2014/15
sTRATEGIC ObjECTIVE PERFORMANCE INdICATOR
bAsELINE ANNuAL TARGET 2014/15
PROGREss/ AChIEVEMENT AGAINsT TARGET
COMMENTs (ChALLENGEs/EXPLANATIONs ON VARIANCEs)
CORRECTIVE MEAsuREs
Enhanced contribution to the environmental sector towards Sustainable Development and transition to a Green Economy
Number of interventions for streamlining environmental authorisations finalised
2 legal instruments evaluated and adjusted for comment
1 legal instrument under evaluation/ adjustment/ development ((adoption of environmental instruments)
Discussion /concept document prepared and consulted process undertaken with Working Group 7
Delays in finalisation of financial provisioning regulations and focus on finalising EIA had impact on development of an adoption of environmental instrument tool
Draft regulations will be developed and finalised 2015/16
1 legal instrument finalized
4 legal instruments gazetted for implementation (EIA, mine closure and financial provisioning regulations and revised listing notices)
2 legal instruments gazetted for implementations (EIA regulations and revised listing notices)
Financial provisioning and mine closure regulations gazetted for public comment
Public consultation period on mine closure and financial provisioning regulations ended in December 2014, impacting on timeframe for consideration of comments
Financial provisioning and mine closure regulations will be finalised in 2015/16
Interim registration board in place
Readiness plan for the registration of ESPASA developed
Memorandum of Understanding including the work plan of EAPASA has been signed
Section 24H regulations have been gazetted for comment are being finalised
None None
Inputs to Cabinet Report on hydraulic fracturing of shale gas
1 initiative on hydraulic fracturing of shale gas coordinated and supported
Hydraulic Fracturing meeting held / attended and support provided. Inputs/comments submitted to Department of Minerals Resources on the draft of the “Proposed technical regulations for Petroleum Exploration and Exploitation
None None
PROGRAMME 6: ENVIRONMENTAL PROGRAMMEs (CONTINuEd)

76 DEPARTMENT OF ENVIRONMENTAL AFFAIRS: VOTE 30
sTRATEGIC ObjECTIVE PERFORMANCE INdICATOR
bAsELINE ANNuAL TARGET 2014/15
PROGREss/ AChIEVEMENT AGAINsT TARGET
COMMENTs (ChALLENGEs/EXPLANATIONs ON VARIANCEs)
CORRECTIVE MEAsuREs
Enhanced contribution to the environmental sector towards Sustainable Development and transition to a Green Economy
Number of interventions for streamlining environmental authorisations finalised
3 Interventions for streaming environmental authorisations for SIP and IPAP priorities under development
6 interventions for streamlining environmental authorisations for SIP and IPAP priorities developed
5 Strategic Infrastructure Programmes (SIPs) interventions facilitated as follows:
SIP 8 (2 SEAs – Wind and Solar)
Consultation on the Strategic Environmental Assessment (SEA) facilitated
SIP 10
Draft electricity grid expansion corridors finalised
SIP 16a
Draft sensitivity and electricity corridors map with site protocol finalised
SIP 16b
SKA Development SEA initiated and draft sensitivity map available
One of the 6 planned intervention was finalised and reported in the previous financial year(Matrix of environmental authorisation interventions for 18 SIPs and IPAP priorities finalized)
None
1 sector guideline developed (Ports sector guideline)
1 sector guideline developed (mining review guideline)
Terms of reference for drafting mining guidelines has been finalised and request for proposals advertised
There was a need to delay a project due to financial constraints
Planned work will be prioritised for finalisation in 2015/16
PROGRAMME 6: ENVIRONMENTAL PROGRAMMEs (CONTINuEd)

77Annual Report 2014/15
bRIEF OVERVIEw ANd suMMARy OF PROGRAMME PERFORMANCE: ENVIRONMENTAL PROGRAMMEsThe Department is responsible for implementing the Environment and Culture Sector Programme as part of a Government wide Expanded Public Works Programme (EPWP). The Expanded Public Works Programme of the Environment Sector is made up of the following Programmes: the Environment Programmes and Infrastructure Projects (EPIP), the Working for Water, Working on Land and Working on Fire. These programmes enable the Department to address a number environmental management challenges and related infrastructure development whilst creating the much needed employment opportunities and skills development with a focus on young people, women and people with disabilities. During the period under review a total of 33 318 full time equivalent (FTEs) jobs (employment lasting for a period equivalent to a year) and 85 140 work opportunities were created. A total number of 900 young people were provided with employment and training opportunities as part of the Youth Environmental Service programme. The other focus area of the programme relates to facilitating implementation of the Green Fund and monitoring of funded projects and advancing South Africa’s sustainable development agenda. A total of 53 Green fund project have been approved for implementation to date.
Summary of Programme Performance: In 2014/15 the Programme had a total of 25 annual targets. 19 (76%) of these targets were achieved. The remaining six (6) annual targets were not achieved. Five (5) targets were partially achieved (i.e. even though the actual targets were not achieved, significant progress towards the planned targets was made). Progress towards achieving the remaining one (1) target was significantly delayed. The reasons and factors which resulted in delays and non-achievement of the planned targets have been provided in the detailed performance report, including the planned corrective interventions to address the highlighted challenges.
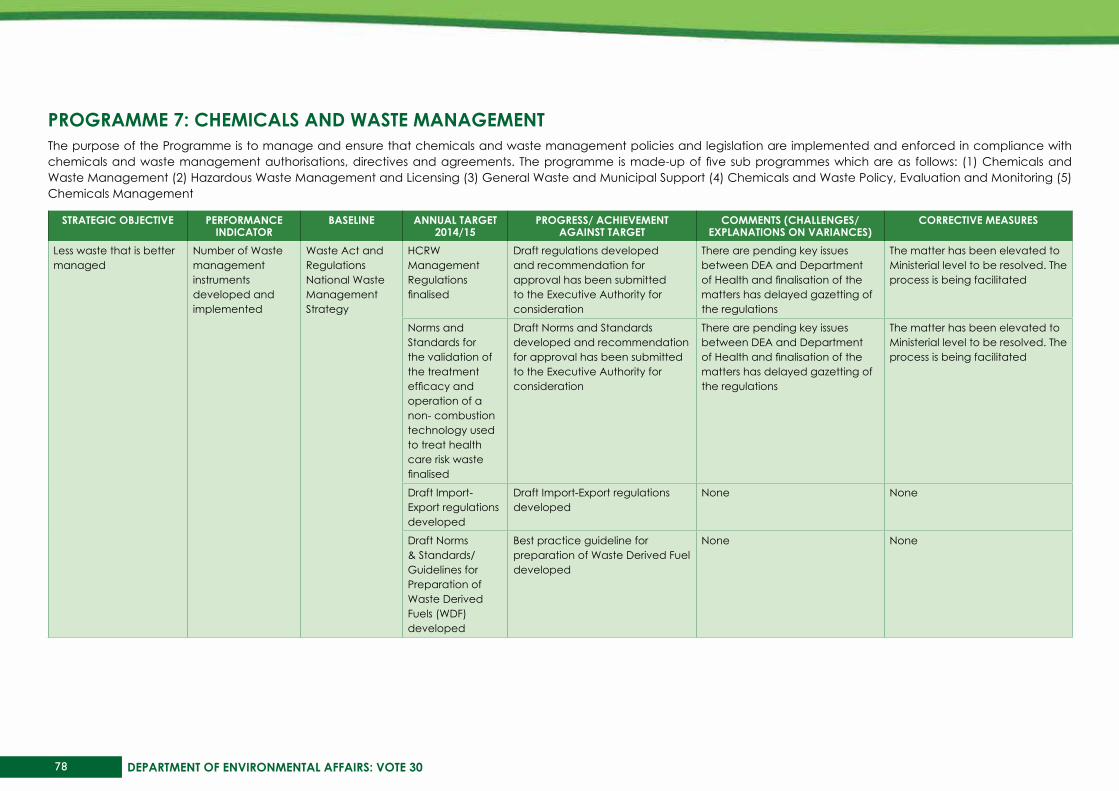
78 DEPARTMENT OF ENVIRONMENTAL AFFAIRS: VOTE 30
PROGRAMME 7: ChEMICALs ANd wAsTE MANAGEMENTThe purpose of the Programme is to manage and ensure that chemicals and waste management policies and legislation are implemented and enforced in compliance with chemicals and waste management authorisations, directives and agreements. The programme is made-up of five sub programmes which are as follows: (1) Chemicals and Waste Management (2) Hazardous Waste Management and Licensing (3) General Waste and Municipal Support (4) Chemicals and Waste Policy, Evaluation and Monitoring (5) Chemicals Management
sTRATEGIC ObjECTIVE PERFORMANCE INdICATOR
bAsELINE ANNuAL TARGET 2014/15
PROGREss/ AChIEVEMENT AGAINsT TARGET
COMMENTs (ChALLENGEs/EXPLANATIONs ON VARIANCEs)
CORRECTIVE MEAsuREs
Less waste that is better managed
Number of Waste management instruments developed and implemented
Waste Act and Regulations National Waste Management Strategy
HCRW Management Regulations finalised
Draft regulations developed and recommendation for approval has been submitted to the Executive Authority for consideration
There are pending key issues between DEA and Department of Health and finalisation of the matters has delayed gazetting of the regulations
The matter has been elevated to Ministerial level to be resolved. The process is being facilitated
Norms and Standards for the validation of the treatment efficacy and operation of a non- combustion technology used to treat health care risk waste finalised
Draft Norms and Standards developed and recommendation for approval has been submitted to the Executive Authority for consideration
There are pending key issues between DEA and Department of Health and finalisation of the matters has delayed gazetting of the regulations
The matter has been elevated to Ministerial level to be resolved. The process is being facilitated
Draft Import-Export regulations developed
Draft Import-Export regulations developed
None None
Draft Norms & Standards/Guidelines for Preparation of Waste Derived Fuels (WDF) developed
Best practice guideline for preparation of Waste Derived Fuel developed
None None
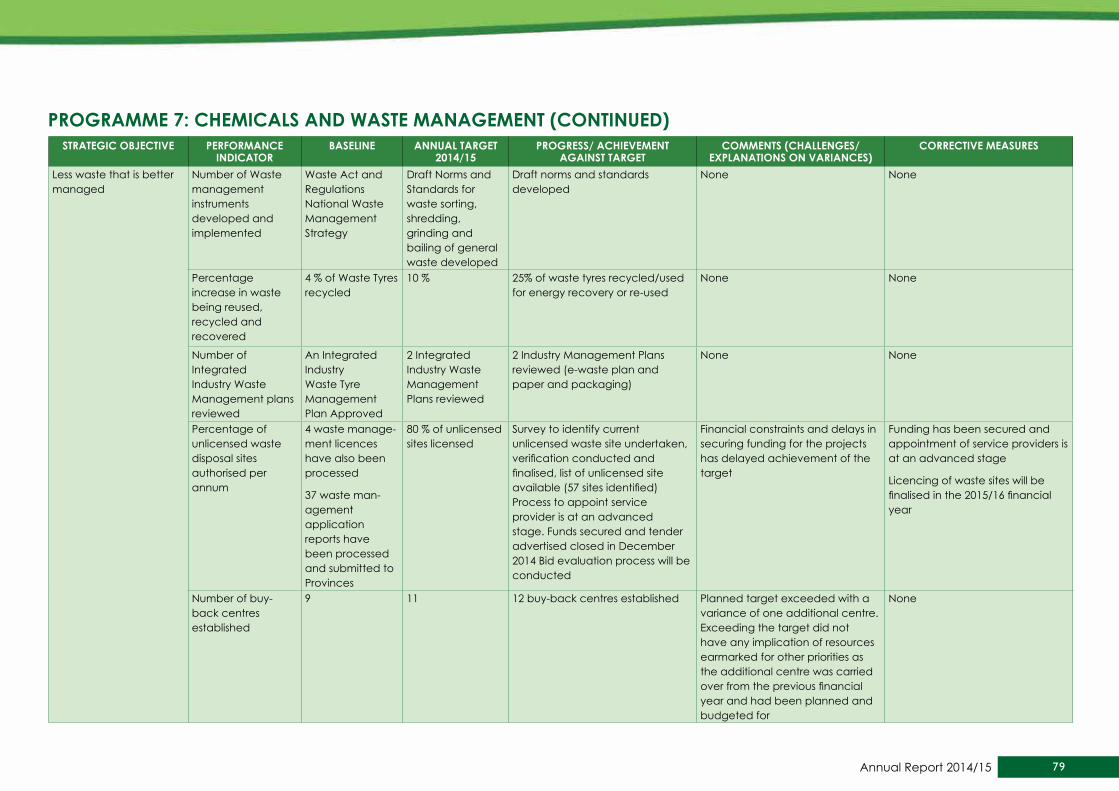
79Annual Report 2014/15
sTRATEGIC ObjECTIVE PERFORMANCE INdICATOR
bAsELINE ANNuAL TARGET 2014/15
PROGREss/ AChIEVEMENT AGAINsT TARGET
COMMENTs (ChALLENGEs/EXPLANATIONs ON VARIANCEs)
CORRECTIVE MEAsuREs
Less waste that is better managed
Number of Waste management instruments developed and implemented
Waste Act and Regulations National Waste Management Strategy
Draft Norms and Standards for waste sorting, shredding, grinding and bailing of general waste developed
Draft norms and standards developed
None None
Percentage increase in waste being reused, recycled and recovered
4 % of Waste Tyres recycled
10 % 25% of waste tyres recycled/used for energy recovery or re-used
None None
Number of Integrated Industry Waste Management plans reviewed
An Integrated Industry Waste Tyre Management Plan Approved
2 Integrated Industry Waste Management Plans reviewed
2 Industry Management Plans reviewed (e-waste plan and paper and packaging)
None None
Percentage of unlicensed waste disposal sites authorised per annum
4 waste manage-ment licences have also been processed
37 waste man-agement application reports have been processed and submitted to Provinces
80 % of unlicensed sites licensed
Survey to identify current unlicensed waste site undertaken, verification conducted and finalised, list of unlicensed site available (57 sites identified) Process to appoint service provider is at an advanced stage. Funds secured and tender advertised closed in December 2014 Bid evaluation process will be conducted
Financial constraints and delays in securing funding for the projects has delayed achievement of the target
Funding has been secured and appointment of service providers is at an advanced stage
Licencing of waste sites will be finalised in the 2015/16 financial year
Number of buy-back centres established
9 11 12 buy-back centres established Planned target exceeded with a variance of one additional centre. Exceeding the target did not have any implication of resources earmarked for other priorities as the additional centre was carried over from the previous financial year and had been planned and budgeted for
None
PROGRAMME 7: ChEMICALs ANd wAsTE MANAGEMENT (CONTINuEd)

80 DEPARTMENT OF ENVIRONMENTAL AFFAIRS: VOTE 30
sTRATEGIC ObjECTIVE PERFORMANCE INdICATOR
bAsELINE ANNuAL TARGET 2014/15
PROGREss/ AChIEVEMENT AGAINsT TARGET
COMMENTs (ChALLENGEs/EXPLANATIONs ON VARIANCEs)
CORRECTIVE MEAsuREs
Less waste that is better managed
Number of chemical management instruments developed and implemented
Multilateral Environmental Agreements (Stockholm, Rotterdam and Montreal) action plans implemented
National Implementation Plan for the Stockholm convention updated
National Implementation Plan for the Stockholm convention updated
None None
Draft PCB phase out plan for municipalities developed
Draft PCB phase out plan developed
None None
Study on impact of Minamata Convention on Mercury conducted
Terms of reference for undertaking the study approved, tender advertised in the Government Gazette and bid adjudication process undertaken
Financial constraints and delays in securing donor funds impacted on progress in the project
Part of the required funding secured ( R3 million) and the remaining funds will be sourced from GEF Project prioritised for finalisation in 2015/16
Draft National Chemicals Profile developed
Draft National chemicals profile developed. Draft policy discussion paper on chemicals management developed
None None
PROGRAMME 7: ChEMICALs ANd wAsTE MANAGEMENT (CONTINuEd)

81Annual Report 2014/15
bRIEF OVERVIEw ANd suMMARy OF PROGRAMME PERFORMANCE: ChEMICALs ANd wAsTE MANAGEMENTEffective and proactive management of waste management and control of hazardous chemicals is an important area of the Department’s work aimed at minimizing, and over a period of time working on totally eliminating where possible, the negative impact which waste and dangerous chemicals have on the human health and the natural environment. The programme facilitates the development of appropriate regulatory frameworks and policies to manage chemicals and waste, and provide support to other spheres of Government on implementation of these policies. In addressing the prevailing waste management challenges, the Department also focus on exploring the socio-economic opportunities which exist in waste collection, recycling and other forms of waste management in general. In 2014/15 25% of waste tyres was recycled and 12 waste buy-back centres were established.
Summary of Programme Performance: In 2014/15 the Programme had a total of 13 annual targets. 9 (69%) of these targets were achieved. The remaining four (4) annual targets were partially achieved (i.e. even though the actual targets were not achieved, significant progress towards the planned targets was made). The reasons and factors which resulted in delays and non-achievement of the planned targets have been provided in the detailed performance report, including the planned corrective interventions to address the highlighted challenges.
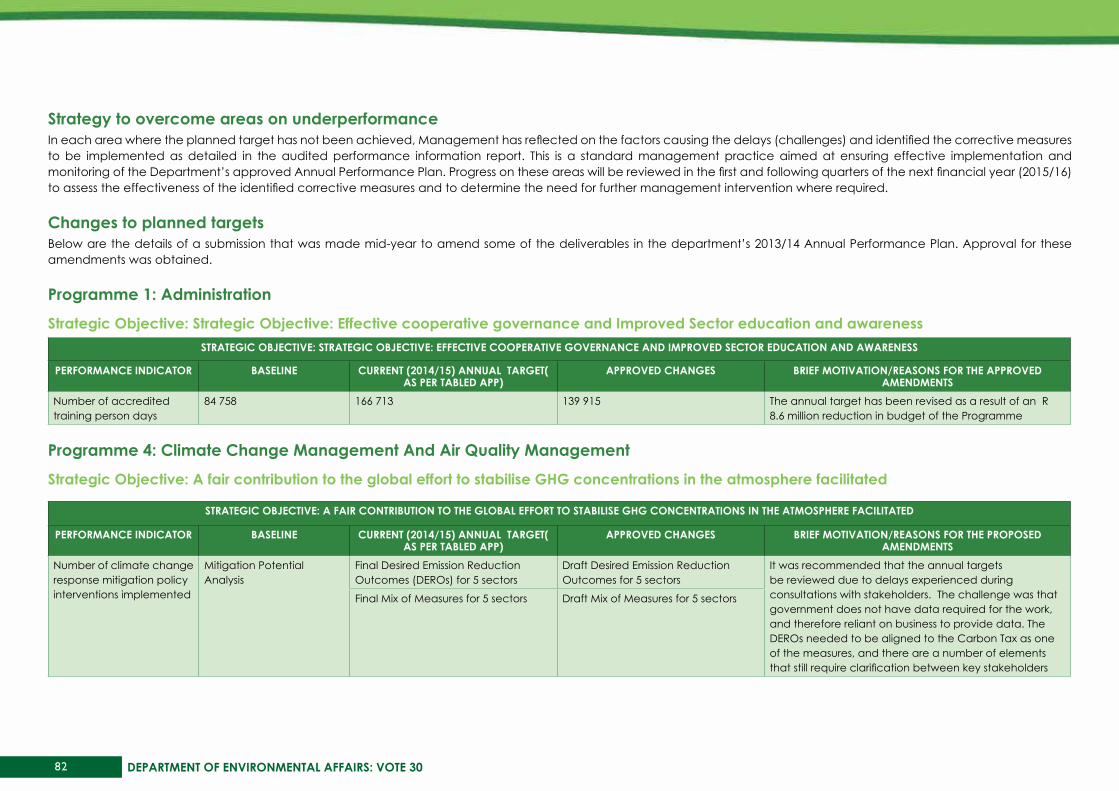
82 DEPARTMENT OF ENVIRONMENTAL AFFAIRS: VOTE 30
strategy to overcome areas on underperformanceIn each area where the planned target has not been achieved, Management has reflected on the factors causing the delays (challenges) and identified the corrective measures to be implemented as detailed in the audited performance information report. This is a standard management practice aimed at ensuring effective implementation and monitoring of the Department’s approved Annual Performance Plan. Progress on these areas will be reviewed in the first and following quarters of the next financial year (2015/16) to assess the effectiveness of the identified corrective measures and to determine the need for further management intervention where required.
Changes to planned targetsBelow are the details of a submission that was made mid-year to amend some of the deliverables in the department’s 2013/14 Annual Performance Plan. Approval for these amendments was obtained.
Programme 1: Administration
Strategic Objective: Strategic Objective: Effective cooperative governance and Improved Sector education and awarenesssTRATEGIC ObjECTIVE: sTRATEGIC ObjECTIVE: EFFECTIVE COOPERATIVE GOVERNANCE ANd IMPROVEd sECTOR EduCATION ANd AwARENEss
PERFORMANCE INdICATOR bAsELINE CuRRENT (2014/15) ANNuAL TARGET( As PER TAbLEd APP)
APPROVEd ChANGEs bRIEF MOTIVATION/REAsONs FOR ThE APPROVEd AMENdMENTs
Number of accredited training person days
84 758 166 713 139 915 The annual target has been revised as a result of an R 8.6 million reduction in budget of the Programme
Programme 4: Climate Change Management And Air Quality Management
Strategic Objective: A fair contribution to the global effort to stabilise GHG concentrations in the atmosphere facilitated
sTRATEGIC ObjECTIVE: A FAIR CONTRIbuTION TO ThE GLObAL EFFORT TO sTAbILIsE GhG CONCENTRATIONs IN ThE ATMOsPhERE FACILITATEd
PERFORMANCE INdICATOR bAsELINE CuRRENT (2014/15) ANNuAL TARGET( As PER TAbLEd APP)
APPROVEd ChANGEs bRIEF MOTIVATION/REAsONs FOR ThE PROPOsEd AMENdMENTs
Number of climate change response mitigation policy interventions implemented
Mitigation Potential Analysis
Final Desired Emission Reduction Outcomes (DEROs) for 5 sectors
Draft Desired Emission Reduction Outcomes for 5 sectors
It was recommended that the annual targets be reviewed due to delays experienced during consultations with stakeholders. The challenge was that government does not have data required for the work, and therefore reliant on business to provide data. The DEROs needed to be aligned to the Carbon Tax as one of the measures, and there are a number of elements that still require clarification between key stakeholders
Final Mix of Measures for 5 sectors Draft Mix of Measures for 5 sectors

83Annual Report 2014/15
Programmme 5: biodiversity And Conservation
Strategic Objective: Biodiversity Conserved, protected and threats mitigated
sTRATEGIC ObjECTIVE: bIOdIVERsITy CONsERVEd ,PROTECTEd ANd ThREATs MITIGATEd
PERFORMANCE INdICATOR bAsELINE CuRRENT (2014/15) ANNuAL TARGET( As PER TAbLEd APP)
APPROVEd ChANGEs bRIEF MOTIVATION/REAsONs FOR ThE APPROVEd AMENdMENTs
Number of sites added to the World Heritage List
8 World Heritage Sites 13 Sites on the Tentative List
Dossier for Nelson Mandela Liberation and Reconciliation Memorials submitted to UNESCO (for inclusion as World Heritage Site)
Remove annual target from the DEA Annual Performance Plan
It was recommended that the annual target be removed from the approved annual performance plan of DEA. The Department will however continue providing strategic support to the process. The work aimed at facilitating the inclusion of the Nelson Mandela Liberation and Reconciliation Memorials as a World Heritage site was coordinated in partnership with the National Heritage Council. The Council, as the Management Authority, is primarily responsible for the actual preparation of dossier/proposal outlining the outstanding universal value of the site and management arrangements. The role of DEA is to provide strategic guidance on how best to put together the proposal, evaluate it upon submission and advise the Minister to transmit to UNESCO. There was therefore a significant dependence on the NHC in order to facilitate work within planned time and the work had been significantly delayed on their part. In light of this and considering that the Department ‘s role on the process is limited to providing strategic guidance to the council and advice to Minister

84 DEPARTMENT OF ENVIRONMENTAL AFFAIRS: VOTE 30
Programme 6: Environmental Programmes
Strategic Objective: Improve socio economic benefits within the environmental sectorsTRATEGIC ObjECTIVE: sTRATEGIC ObjECTIVE: EFFECTIVE COOPERATIVE GOVERNANCE ANd IMPROVEd sECTOR EduCATION ANd AwARENEss
PERFORMANCE INdICATOR bAsELINE CuRRENT (2014/15) ANNuAL TARGET( As PER TAbLEd APP)
APPROVEd ChANGEs bRIEF MOTIVATION/REAsONs FOR ThE PROPOsEd AMENdMENTs
Number of overnight visitor and staff accommodation units established or renovated
104 28 22 Most of the infrastructure projects were implemented in protected areas (which are rather environmentally sensitive). These require EIA processes which are currently underway and require more time. Looking at the timeframes for the processes, it was unlikely for the initial target to be achieved.
Number of Full-Time Equivalents (FTE) created
16 706 37 036 35 936 The annual target was revised as a result of an R 8.6 million reduction in budget of the Programme.
Number of SMMEs utilised (empowerment )
2 611 N/A ( Annual target of 2 210 included only in the Branch: Environmental Programme Annual Performance Plan)
2 210 It was recommended that the annual target be included in the Annual Performance Plan of the Department to ensure alignment with the approved MTSF
Number of school desk equivalent
22 424 150 000 120 000 Delays in securing factory space from local government partners was a challenge and the Branch was able to set a target that was in line with the confirmed plans.
Strategic objective: ecosystem services restored and maintainedsTRATEGIC ObjECTIVE: ECOsysTEM sERVICEs REsTOREd ANd MAINTAINEd
PERFORMANCE INdICATOR bAsELINE CuRRENT (2014/15) ANNuAL TARGET( As PER TAbLEd APP)
APPROVEd ChANGEs bRIEF MOTIVATION/REAsONs FOR ThE APPROVEd AMENdMENTs
Number of hectares of land where follow up invasive alien plants treated/cleared (Initial Treatment)
- 172 516 169 045 The annual target was revised as a result of an R 8.6 million reduction in budget of the Programme
Number of hectares of land where follow up invasive alien plants treated/cleared (Follow up Treatment)
- 583 686 560 339 The annual target was revised as a result of an R 8.6 million reduction in budget of the Programme
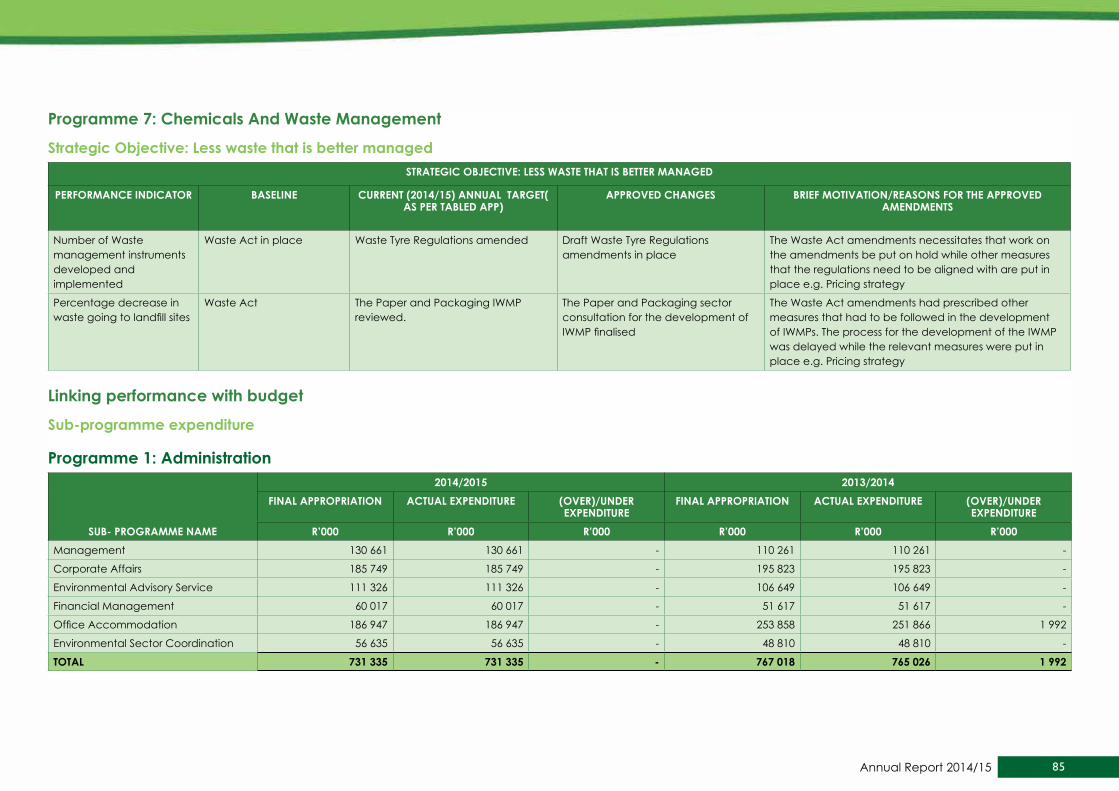
85Annual Report 2014/15
Programme 7: Chemicals And waste Management
Strategic Objective: Less waste that is better managed sTRATEGIC ObjECTIVE: LEss wAsTE ThAT Is bETTER MANAGEd
PERFORMANCE INdICATOR bAsELINE CuRRENT (2014/15) ANNuAL TARGET( As PER TAbLEd APP)
APPROVEd ChANGEs bRIEF MOTIVATION/REAsONs FOR ThE APPROVEd AMENdMENTs
Number of Waste management instruments developed and implemented
Waste Act in place Waste Tyre Regulations amended Draft Waste Tyre Regulations amendments in place
The Waste Act amendments necessitates that work on the amendments be put on hold while other measures that the regulations need to be aligned with are put in place e.g. Pricing strategy
Percentage decrease in waste going to landfill sites
Waste Act The Paper and Packaging IWMP reviewed.
The Paper and Packaging sector consultation for the development of IWMP finalised
The Waste Act amendments had prescribed other measures that had to be followed in the development of IWMPs. The process for the development of the IWMP was delayed while the relevant measures were put in place e.g. Pricing strategy
Linking performance with budget
sub-programme expenditure
Programme 1: Administration
sub- PROGRAMME NAME
2014/2015 2013/2014FINAL APPROPRIATION ACTuAL EXPENdITuRE (OVER)/uNdER
EXPENdITuREFINAL APPROPRIATION ACTuAL EXPENdITuRE (OVER)/uNdER
EXPENdITuRER’000 R’000 R’000 R’000 R’000 R’000
Management 130 661 130 661 - 110 261 110 261 -
Corporate Affairs 185 749 185 749 - 195 823 195 823 -
Environmental Advisory Service 111 326 111 326 - 106 649 106 649 -
Financial Management 60 017 60 017 - 51 617 51 617 -
Office Accommodation 186 947 186 947 - 253 858 251 866 1 992
Environmental Sector Coordination 56 635 56 635 - 48 810 48 810 -
TOTAL 731 335 731 335 - 767 018 765 026 1 992
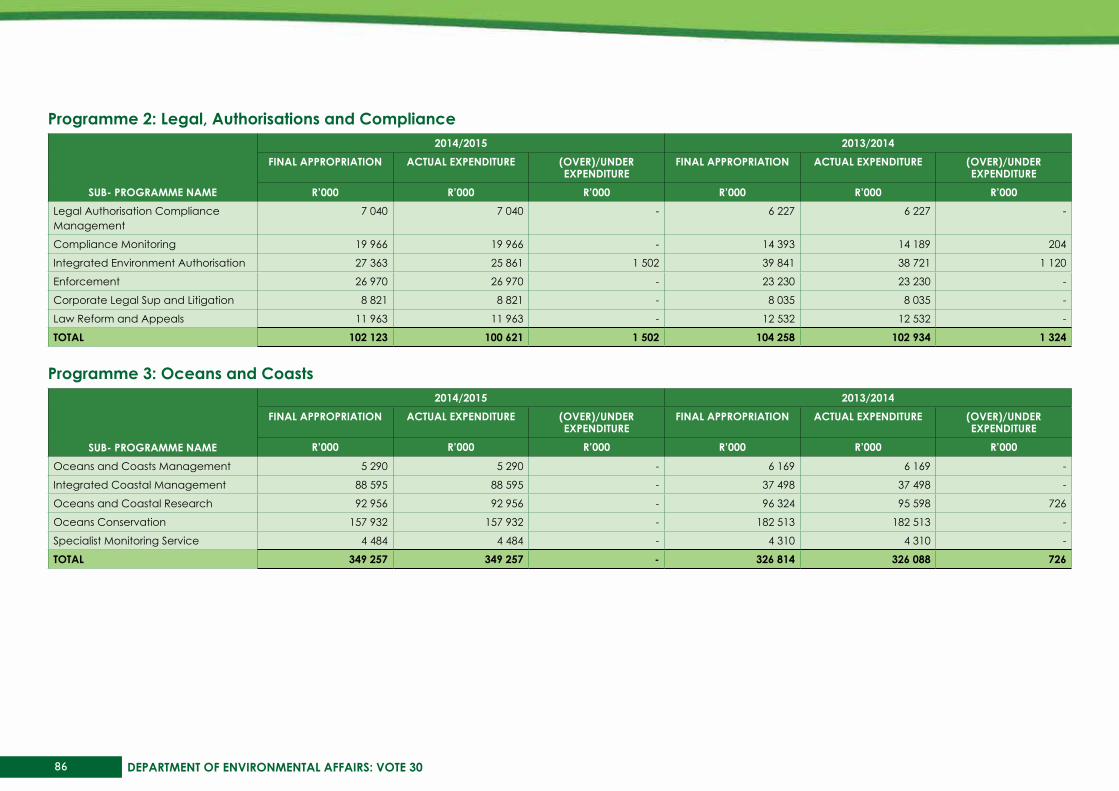
86 DEPARTMENT OF ENVIRONMENTAL AFFAIRS: VOTE 30
Programme 2: Legal, Authorisations and Compliance
sub- PROGRAMME NAME
2014/2015 2013/2014FINAL APPROPRIATION ACTuAL EXPENdITuRE (OVER)/uNdER
EXPENdITuREFINAL APPROPRIATION ACTuAL EXPENdITuRE (OVER)/uNdER
EXPENdITuRER’000 R’000 R’000 R’000 R’000 R’000
Legal Authorisation Compliance Management
7 040 7 040 - 6 227 6 227 -
Compliance Monitoring 19 966 19 966 - 14 393 14 189 204
Integrated Environment Authorisation 27 363 25 861 1 502 39 841 38 721 1 120
Enforcement 26 970 26 970 - 23 230 23 230 -
Corporate Legal Sup and Litigation 8 821 8 821 - 8 035 8 035 -
Law Reform and Appeals 11 963 11 963 - 12 532 12 532 -
TOTAL 102 123 100 621 1 502 104 258 102 934 1 324
Programme 3: Oceans and Coasts
sub- PROGRAMME NAME
2014/2015 2013/2014FINAL APPROPRIATION ACTuAL EXPENdITuRE (OVER)/uNdER
EXPENdITuREFINAL APPROPRIATION ACTuAL EXPENdITuRE (OVER)/uNdER
EXPENdITuRER’000 R’000 R’000 R’000 R’000 R’000
Oceans and Coasts Management 5 290 5 290 - 6 169 6 169 -
Integrated Coastal Management 88 595 88 595 - 37 498 37 498 -
Oceans and Coastal Research 92 956 92 956 - 96 324 95 598 726
Oceans Conservation 157 932 157 932 - 182 513 182 513 -
Specialist Monitoring Service 4 484 4 484 - 4 310 4 310 -
TOTAL 349 257 349 257 - 326 814 326 088 726
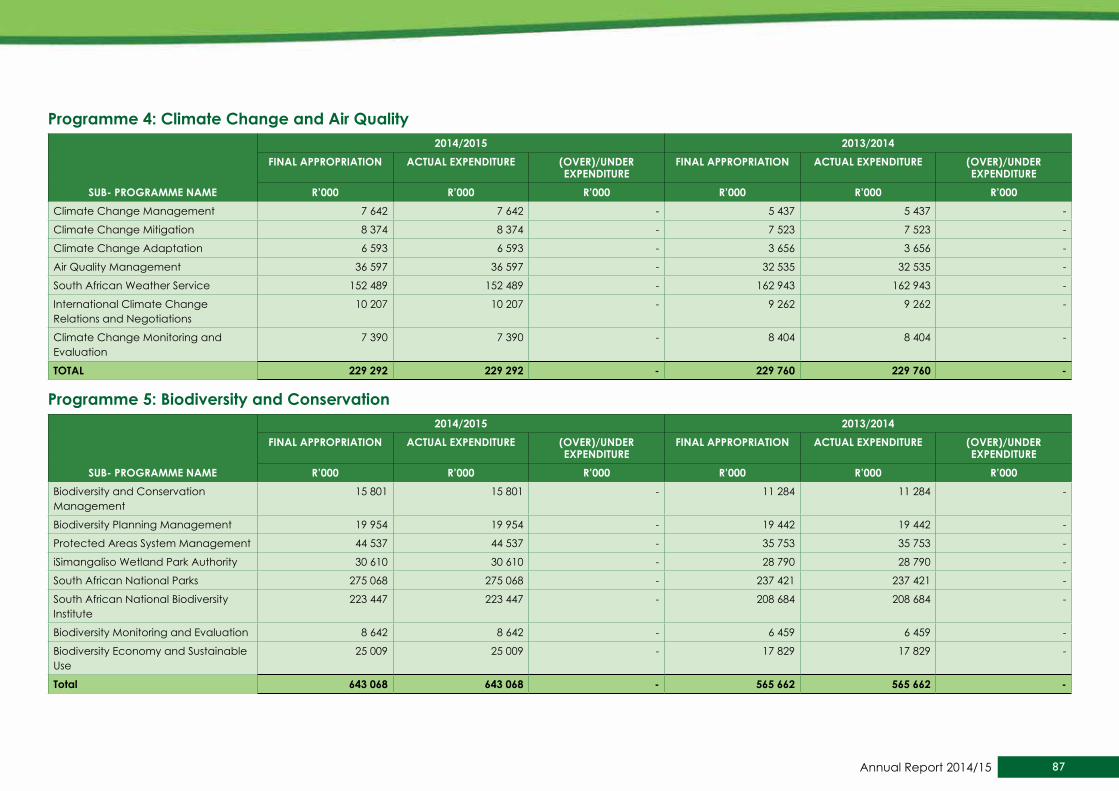
87Annual Report 2014/15
Programme 4: Climate Change and Air Quality
sub- PROGRAMME NAME
2014/2015 2013/2014FINAL APPROPRIATION ACTuAL EXPENdITuRE (OVER)/uNdER
EXPENdITuREFINAL APPROPRIATION ACTuAL EXPENdITuRE (OVER)/uNdER
EXPENdITuRER’000 R’000 R’000 R’000 R’000 R’000
Climate Change Management 7 642 7 642 - 5 437 5 437 -
Climate Change Mitigation 8 374 8 374 - 7 523 7 523 -
Climate Change Adaptation 6 593 6 593 - 3 656 3 656 -
Air Quality Management 36 597 36 597 - 32 535 32 535 -
South African Weather Service 152 489 152 489 - 162 943 162 943 -
International Climate Change Relations and Negotiations
10 207 10 207 - 9 262 9 262 -
Climate Change Monitoring and Evaluation
7 390 7 390 - 8 404 8 404 -
TOTAL 229 292 229 292 - 229 760 229 760 -
Programme 5: biodiversity and Conservation
sub- PROGRAMME NAME
2014/2015 2013/2014FINAL APPROPRIATION ACTuAL EXPENdITuRE (OVER)/uNdER
EXPENdITuREFINAL APPROPRIATION ACTuAL EXPENdITuRE (OVER)/uNdER
EXPENdITuRER’000 R’000 R’000 R’000 R’000 R’000
Biodiversity and Conservation Management
15 801 15 801 - 11 284 11 284 -
Biodiversity Planning Management 19 954 19 954 - 19 442 19 442 -
Protected Areas System Management 44 537 44 537 - 35 753 35 753 -
iSimangaliso Wetland Park Authority 30 610 30 610 - 28 790 28 790 -
South African National Parks 275 068 275 068 - 237 421 237 421 -
South African National Biodiversity Institute
223 447 223 447 - 208 684 208 684 -
Biodiversity Monitoring and Evaluation 8 642 8 642 - 6 459 6 459 -
Biodiversity Economy and Sustainable Use
25 009 25 009 - 17 829 17 829 -
Total 643 068 643 068 - 565 662 565 662 -

88 DEPARTMENT OF ENVIRONMENTAL AFFAIRS: VOTE 30
Programme 6: Environmental Programmes
sub- PROGRAMME NAME
2014/2015 2013/2014FINAL APPROPRIATION ACTuAL EXPENdITuRE (OVER)/uNdER
EXPENdITuREFINAL APPROPRIATION ACTuAL EXPENdITuRE (OVER)/uNdER
EXPENdITuRER’000 R’000 R’000 R’000 R’000 R’000
Environmental Protection and Infrastructure Programme
1 481 104 1 481 104 - 1 297 270 1 297 270 -
Working for Water and Working on Fire 1 775 337 1 771 512 3 825 1 564 204 1 563 043 1 161
Green Fund 250 000 250 000 - 250 000 250 000 -
Environmental Programme management
7 273 7 273 - 5 288 5 288 -
Enforcement Management and Sector Coordination
39 719 39 719 - 22 123 22 123 -
TOTAL 3 553 433 3 549 608 3 825 3 138 885 3 137 724 1 161
Programme 7: Chemicals and waste Management
sub- PROGRAMME NAME
2014/2015 2013/2014FINAL APPROPRIATION ACTuAL EXPENdITuRE (OVER)/uNdER
EXPENdITuREFINAL APPROPRIATION ACTuAL EXPENdITuRE (OVER)/uNdER
EXPENdITuRER’000 R’000 R’000 R’000 R’000 R’000
Chemicals and Waste Management 5 992 5 992 - 4 338 4 338 -
Hazardous Waste Management and Licensing
22 514 22 514 - 26 603 26 603 -
General waste and Municipal Support 25 240 25 240 - 26 490 26 210 280
Chemicals and Waste Policy, Evaluation and Monitoring
6 682 6 682 - 5 484 4 432 1 052
Chemicals Management 11 450 11 450 - 11 530 11 530 -
TOTAL 71 878 71 878 - 74 445 73 113 1 332
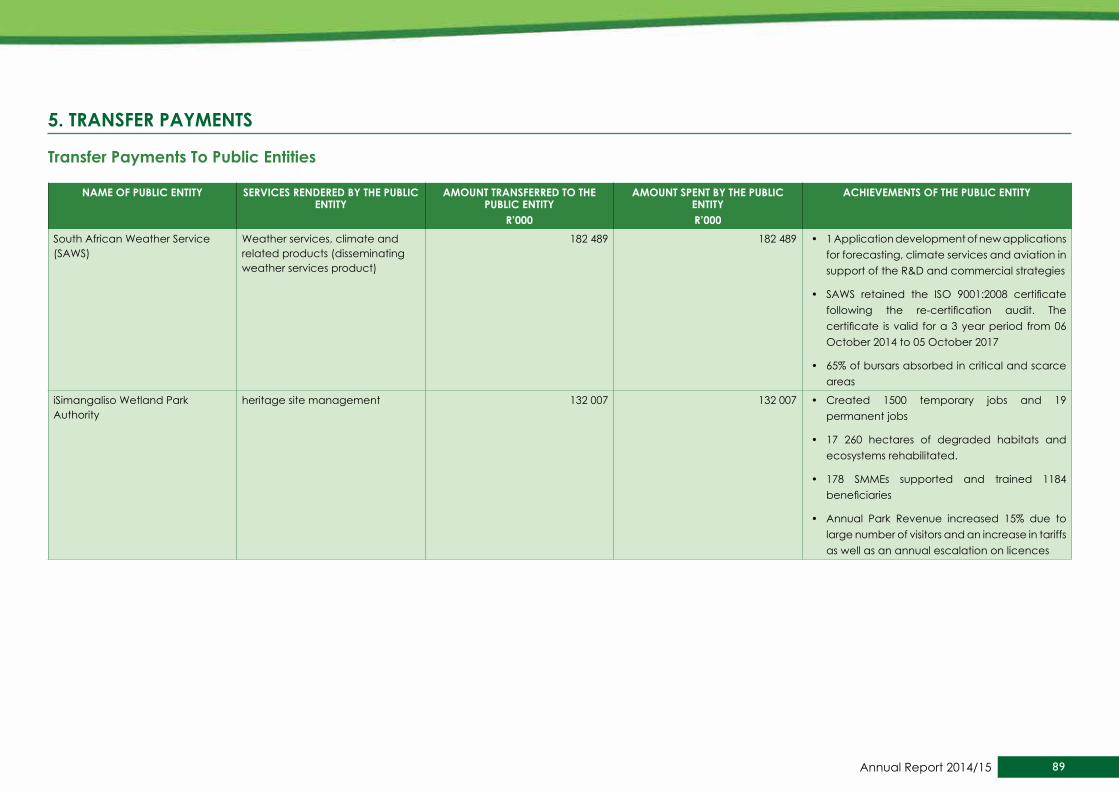
89Annual Report 2014/15
5. TRANsFER PAyMENTs
Transfer Payments To Public Entities
NAME OF PubLIC ENTITy sERVICEs RENdEREd by ThE PubLIC ENTITy
AMOuNT TRANsFERREd TO ThE PubLIC ENTITy
R’000
AMOuNT sPENT by ThE PubLIC ENTITyR’000
AChIEVEMENTs OF ThE PubLIC ENTITy
South African Weather Service (SAWS)
Weather services, climate and related products (disseminating weather services product)
182 489 182 489 • 1 Application development of new applications for forecasting, climate services and aviation in support of the R&D and commercial strategies
• SAWS retained the ISO 9001:2008 certificate following the re-certification audit. The certificate is valid for a 3 year period from 06 October 2014 to 05 October 2017
• 65% of bursars absorbed in critical and scarce areas
iSimangaliso Wetland Park Authority
heritage site management 132 007 132 007 • Created 1500 temporary jobs and 19 permanent jobs
• 17 260 hectares of degraded habitats and ecosystems rehabilitated.
• 178 SMMEs supported and trained 1184 beneficiaries
• Annual Park Revenue increased 15% due to large number of visitors and an increase in tariffs as well as an annual escalation on licences

90 DEPARTMENT OF ENVIRONMENTAL AFFAIRS: VOTE 30
Transfer Payments To Public Entities (CONTINuEd)NAME OF PubLIC ENTITy sERVICEs RENdEREd by ThE PubLIC
ENTITyAMOuNT TRANsFERREd TO ThE
PubLIC ENTITyR’000
AMOuNT sPENT by ThE PubLIC ENTITyR’000
AChIEVEMENTs OF ThE PubLIC ENTITy
South African National Parks (SANParks)
Conservation management through the national parks system
590 922 590 922 • 1 355 207 temporary jobs were created through the Expanded Public Works Programme (EPWP)
• 701 SMMEs were supported, a total amount of R173.9 million was spent toward this initiatives.
• 12 socio-economic initiatives were implemented as part of SANParks Corporate Social Investment (CSI) initiatives
• The Accommodation Occupancy Rate improved by 1.2% compared to the same period in the previous financial year, and 3.1% better than the planned quarterly target of 69.0%
• 7 Innovative Revenue Generating Products were implemented
South African National Biodiversity Institute (SANBI)
Biodiversity Management 289 951 289 951 • New national botanical garden in the Eastern Cape proclaimed and gazetted by the DEA Minister
• 110 wetlands under rehabilitation.
• 1000 unemployed youth skilled and hosted in the biodiversity sector.
• 1.5 per cent (1.5%) annual increase in visitor numbers
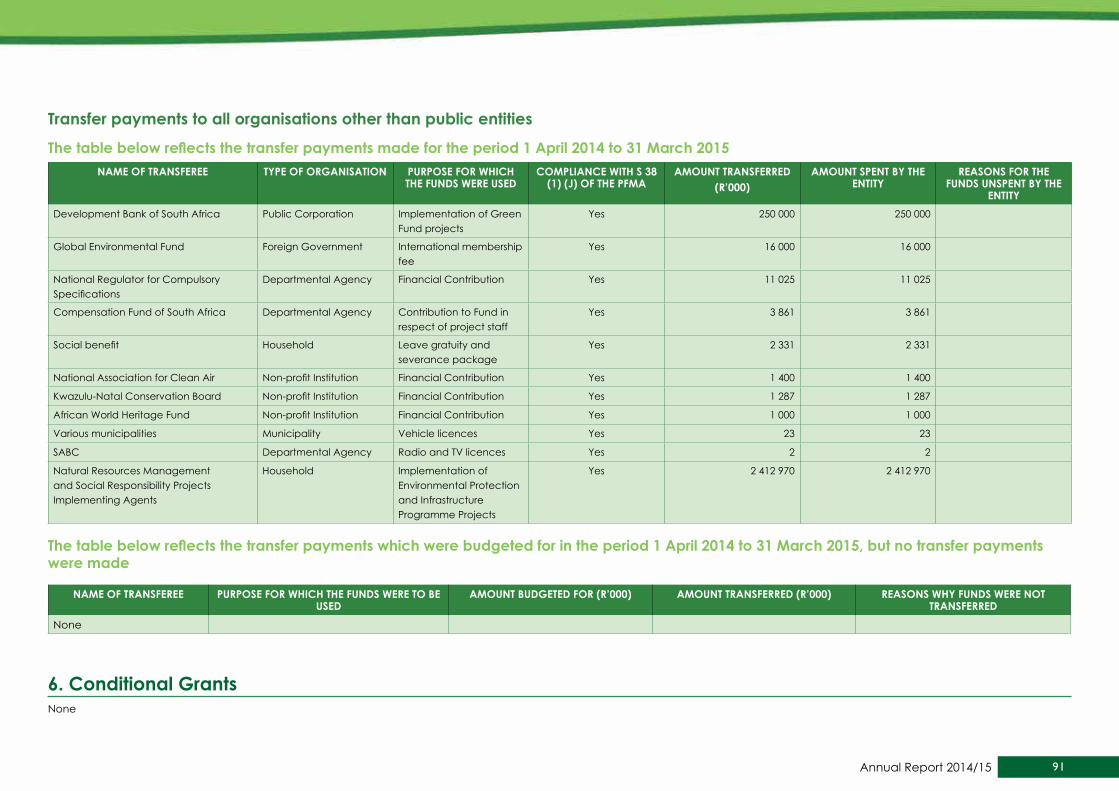
91Annual Report 2014/15
Transfer payments to all organisations other than public entities
The table below reflects the transfer payments made for the period 1 April 2014 to 31 March 2015NAME OF TRANsFEREE TyPE OF ORGANIsATION PuRPOsE FOR whICh
ThE FuNds wERE usEdCOMPLIANCE wITh s 38
(1) (j) OF ThE PFMAAMOuNT TRANsFERREd
(R’000)AMOuNT sPENT by ThE
ENTITyREAsONs FOR ThE
FuNds uNsPENT by ThE ENTITy
Development Bank of South Africa Public Corporation Implementation of Green Fund projects
Yes 250 000 250 000
Global Environmental Fund Foreign Government International membership fee
Yes 16 000 16 000
National Regulator for Compulsory Specifications
Departmental Agency Financial Contribution Yes 11 025 11 025
Compensation Fund of South Africa Departmental Agency Contribution to Fund in respect of project staff
Yes 3 861 3 861
Social benefit Household Leave gratuity and severance package
Yes 2 331 2 331
National Association for Clean Air Non-profit Institution Financial Contribution Yes 1 400 1 400
Kwazulu-Natal Conservation Board Non-profit Institution Financial Contribution Yes 1 287 1 287
African World Heritage Fund Non-profit Institution Financial Contribution Yes 1 000 1 000
Various municipalities Municipality Vehicle licences Yes 23 23
SABC Departmental Agency Radio and TV licences Yes 2 2
Natural Resources Management and Social Responsibility Projects Implementing Agents
Household Implementation of Environmental Protection and Infrastructure Programme Projects
Yes 2 412 970 2 412 970
The table below reflects the transfer payments which were budgeted for in the period 1 April 2014 to 31 March 2015, but no transfer payments were made
NAME OF TRANsFEREE PuRPOsE FOR whICh ThE FuNds wERE TO bE usEd
AMOuNT budGETEd FOR (R’000) AMOuNT TRANsFERREd (R’000) REAsONs why FuNds wERE NOT TRANsFERREd
None
6. Conditional GrantsNone

92 DEPARTMENT OF ENVIRONMENTAL AFFAIRS: VOTE 30
7. donor Fundsdonor Fund: united Nations development Programme: benguela Coastal Current Large Marine Ecosystem Programme
NAME OF dONOR uNITEd NATIONs dEVELOPMENT PROGRAMMEFull amount of the funding R319 283.38
Period of the commitment Ongoing
Purpose of the funding To give effect to the Strategic Action Programme by establishing a Benguela Current Commission in order – To establish a formal institutional structure for co-operation between the Contracting Parties that will facilitate the understanding, protection, conservation and sustainable use of the Benguela Current Large Marine Ecosystem by the Contracting Parties; and To further the objectives recorded in the Strategic Action Programme
Expected outputs Established Benguela Current Commission
Actual outputs achieved Benguela Current Commission established and operational
Amount received in current period (R’000) R1 142 000
Amount spent by the department (R’000) R0.00
Reasons for the funds unspent Awaiting claims for payment
Monitoring mechanism by the donor Reporting on progress
donor Fund: united Nations development Programme: strengthening Law Enforcement Capabilities to Combat wildlife Crime for Conservation and sustainable use of species In south Africa: target: Rhinoceros
NAME OF dONOR uNITEd NATIONs dEVELOPMENT PROGRAMMEFull amount of the funding R32 285 000
Period of the commitment May 2014 – April 2019
Purpose of the funding Improve the effectiveness of efforts to combat wild life crime in South Africa’s protected arrears system, focussed on rhinoceros, through improved forensic technologies and capacity, strengthened data catering, sharing and analysis systems at national level, and enhance corporation structures and mechanisms at international level to support law efforts along the whole trafficking chain
Expected outputs Strengthening Law Enforcement Capabilities to Combat Wildlife Crime for Conservation and Sustainable Use of Species In South Africa: target: Rhinoceros
Actual outputs achieved Strengthening Law Enforcement Capabilities to Combat Wildlife Crime
Amount received in current period (R’000) R0.00
Amount spent by the department (R’000) R2 223 000
Reasons for the funds unspent None
Monitoring mechanism by the donor Reporting to Donor

93Annual Report 2014/15
donor Fund: united Nations development Programme: south Africa: Enabling Activities for the Preparation of Third National Communications (TNC) and biennial update Report (buR)
NAME OF dONOR uNITEd NATIONs dEVELOPMENT PROGRAMMEFull amount of the funding R4 426 000, 00
Period of the commitment August 2014 – June 2019
Purpose of the funding Undertake national stocktaking and stockholder consultations to review work carried out under previous climate change enabling activities and identify gaps and propose relevant activities to be undertaken within the framework of preparing the TNC under the UNFCCC
Expected outputs Preparation of Third National Communications (TNC) and Biennial Update Report (BUR)
Actual outputs achieved Implemented activities for the Preparation of Third National Communications (TNC) and Biennial Update Report (BUR)
Amount received in current period (R’000) R0.00
Amount spent by the department (R’000) R446 000
Reasons for the funds unspent Now project in process for preparation
Monitoring mechanism by the donor Reporting to Donor
donor Fund: united Nations development Programme: synergies workshop among the basel, stockholm and Rotterdam ConventionsNAME OF dONOR uNITEd NATIONs dEVELOPMENT PROGRAMME
Full amount of the funding R789 502, 07
Period of the commitment Ongoing
Purpose of the funding Facilitating a national dialogue involving relevant stakeholders on the Rotterdam Convention for South Africa.
Expected outputs Hosting the Rotterdam Convention
Actual outputs achieved Rotterdam Convention hosted
Amount received in current period (R’000) None
Amount spent by the department (R’000) R789 502, 07
Reasons for the funds unspent Donor funded project completed, await final funds transfer from RDP Funds
Monitoring mechanism by the donor Report on the Rotterdam Convention
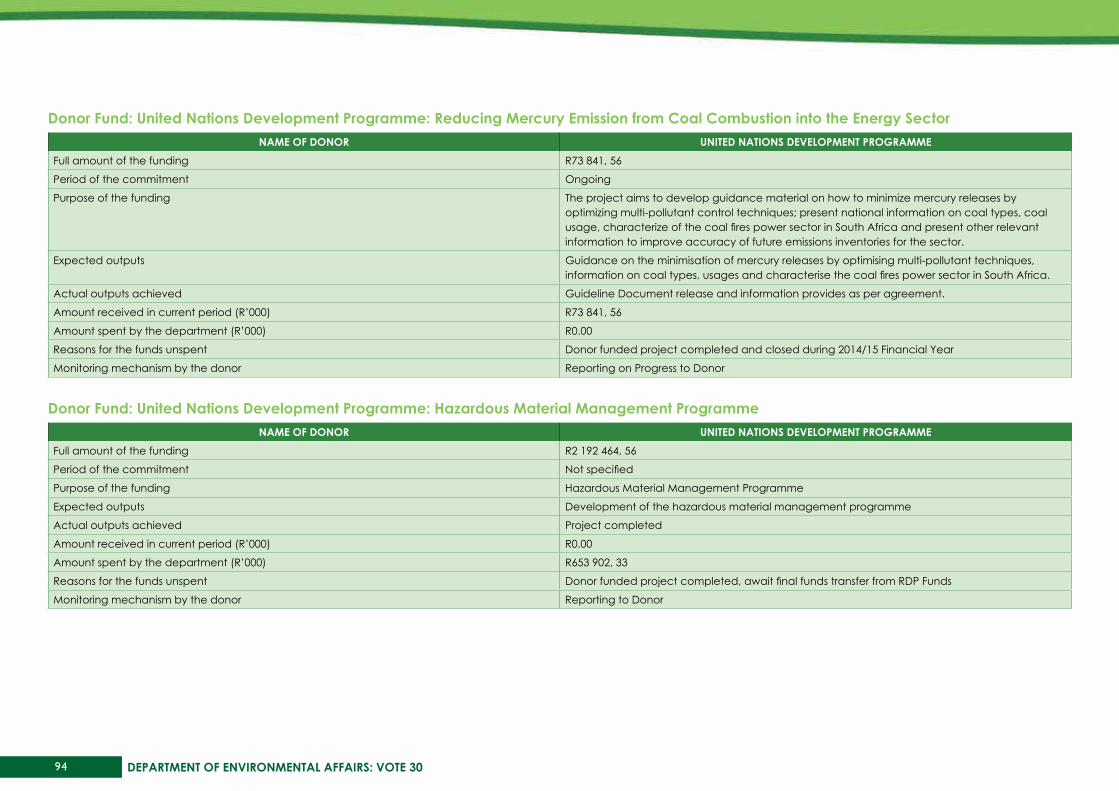
94 DEPARTMENT OF ENVIRONMENTAL AFFAIRS: VOTE 30
donor Fund: united Nations development Programme: Reducing Mercury Emission from Coal Combustion into the Energy sectorNAME OF dONOR uNITEd NATIONs dEVELOPMENT PROGRAMME
Full amount of the funding R73 841, 56
Period of the commitment Ongoing
Purpose of the funding The project aims to develop guidance material on how to minimize mercury releases by optimizing multi-pollutant control techniques; present national information on coal types, coal usage, characterize of the coal fires power sector in South Africa and present other relevant information to improve accuracy of future emissions inventories for the sector.
Expected outputs Guidance on the minimisation of mercury releases by optimising multi-pollutant techniques, information on coal types, usages and characterise the coal fires power sector in South Africa.
Actual outputs achieved Guideline Document release and information provides as per agreement.
Amount received in current period (R’000) R73 841, 56
Amount spent by the department (R’000) R0.00
Reasons for the funds unspent Donor funded project completed and closed during 2014/15 Financial Year
Monitoring mechanism by the donor Reporting on Progress to Donor
donor Fund: united Nations development Programme: hazardous Material Management ProgrammeNAME OF dONOR uNITEd NATIONs dEVELOPMENT PROGRAMME
Full amount of the funding R2 192 464, 56
Period of the commitment Not specified
Purpose of the funding Hazardous Material Management Programme
Expected outputs Development of the hazardous material management programme
Actual outputs achieved Project completed
Amount received in current period (R’000) R0.00
Amount spent by the department (R’000) R653 902, 33
Reasons for the funds unspent Donor funded project completed, await final funds transfer from RDP Funds
Monitoring mechanism by the donor Reporting to Donor
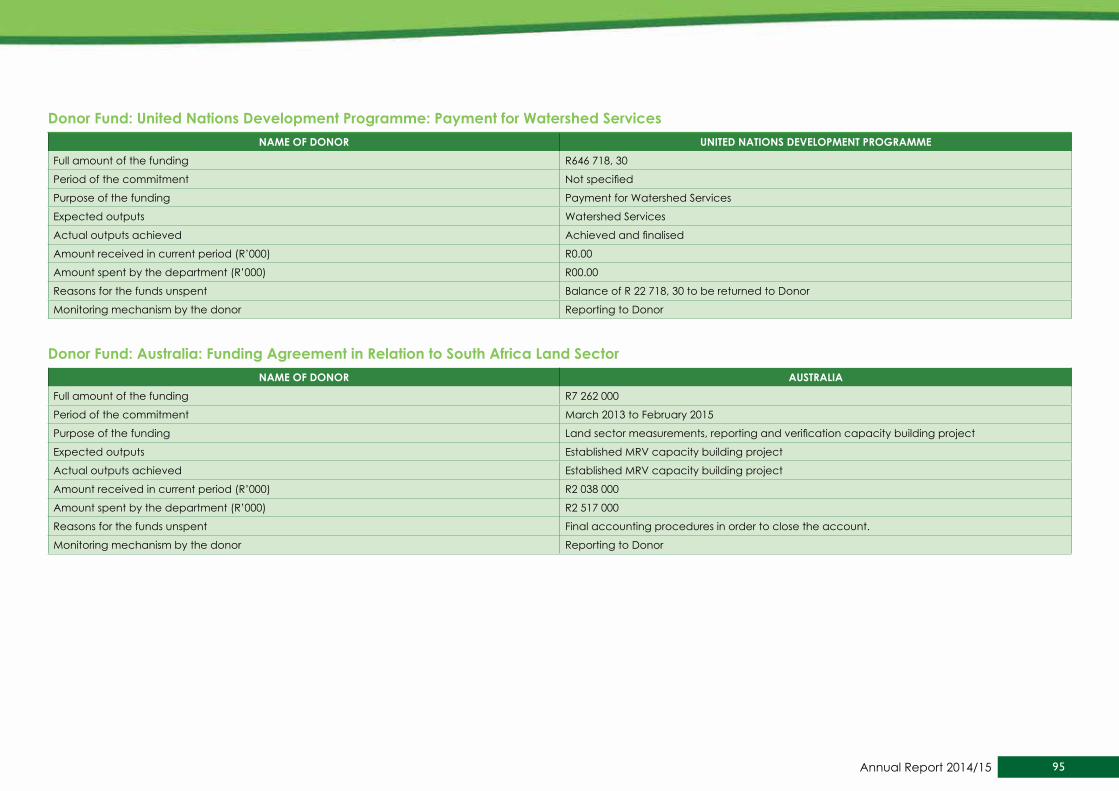
95Annual Report 2014/15
donor Fund: united Nations development Programme: Payment for watershed servicesNAME OF dONOR uNITEd NATIONs dEVELOPMENT PROGRAMME
Full amount of the funding R646 718, 30
Period of the commitment Not specified
Purpose of the funding Payment for Watershed Services
Expected outputs Watershed Services
Actual outputs achieved Achieved and finalised
Amount received in current period (R’000) R0.00
Amount spent by the department (R’000) R00.00
Reasons for the funds unspent Balance of R 22 718, 30 to be returned to Donor
Monitoring mechanism by the donor Reporting to Donor
donor Fund: Australia: Funding Agreement in Relation to south Africa Land sectorNAME OF dONOR AusTRALIA
Full amount of the funding R7 262 000
Period of the commitment March 2013 to February 2015
Purpose of the funding Land sector measurements, reporting and verification capacity building project
Expected outputs Established MRV capacity building project
Actual outputs achieved Established MRV capacity building project
Amount received in current period (R’000) R2 038 000
Amount spent by the department (R’000) R2 517 000
Reasons for the funds unspent Final accounting procedures in order to close the account.
Monitoring mechanism by the donor Reporting to Donor

96 DEPARTMENT OF ENVIRONMENTAL AFFAIRS: VOTE 30
donor Fund: denmark: National waste Management strategy ProgrammeNAME OF dONOR dENMARk
Full amount of the funding R21 554 629.20
Period of the commitment 2003 – 2009
Purpose of the funding National Waste Management Strategy Programme
Expected outputs Development of a National Waste Management Strategy Programme
Actual outputs achieved National Waste Management Strategy developed
Amount received in current period (R’000) R999 805, 00
Amount spent by the department (R’000) R0.00
Reasons for the funds unspent Account finalised and closed
Monitoring mechanism by the donor Reporting was done on regular basis to Donor
donor Fund: Germany: Climate Change ProgrammeNAME OF dONOR GERMANy
Full amount of the funding R5 931 000, 00
Period of the commitment August 2010 to July 2013
Purpose of the funding Climate Change Support Programme
Expected outputs Establish Climate Change Support Programme
Actual outputs achieved Climate Change Support Programme established
Amount received in current period (R’000) R2 302 000
Amount spent by the department (R’000) R2 384 000
Reasons for the funds unspent Account finalised and closed
Monitoring mechanism by the donor Project Progress Reports to Donor
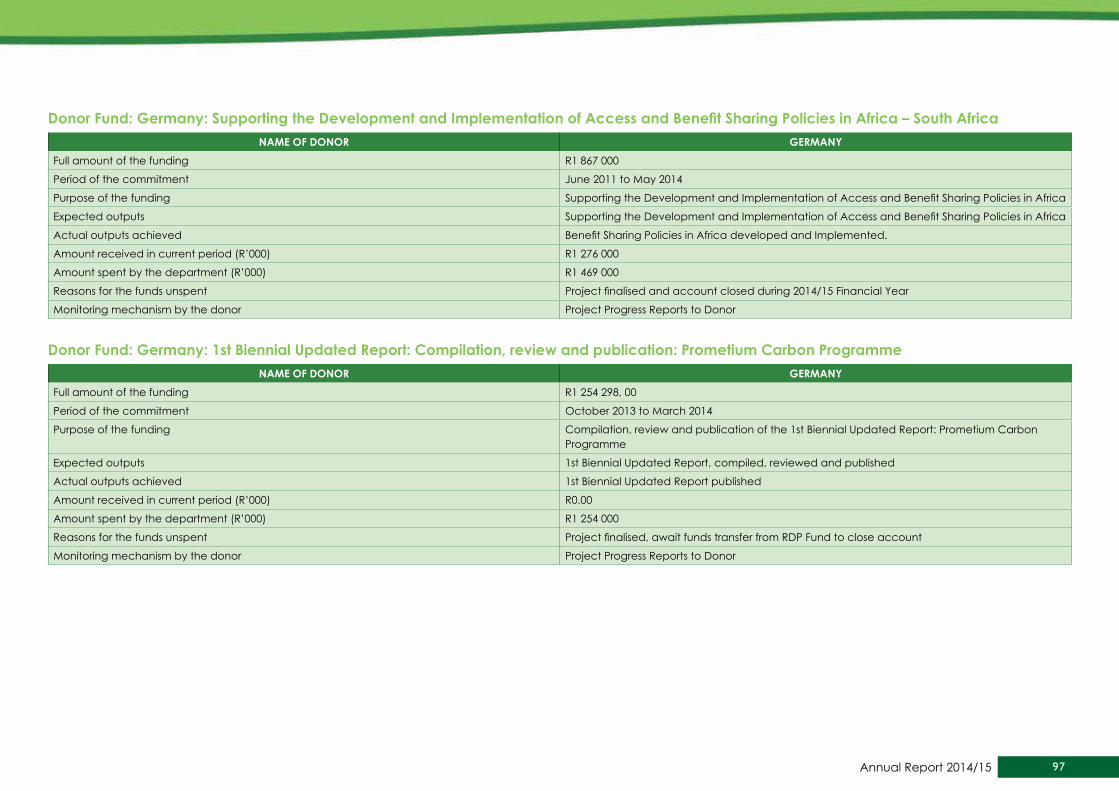
97Annual Report 2014/15
Donor Fund: Germany: Supporting the Development and Implementation of Access and Benefit Sharing Policies in Africa – South AfricaNAME OF dONOR GERMANy
Full amount of the funding R1 867 000
Period of the commitment June 2011 to May 2014
Purpose of the funding Supporting the Development and Implementation of Access and Benefit Sharing Policies in Africa
Expected outputs Supporting the Development and Implementation of Access and Benefit Sharing Policies in Africa
Actual outputs achieved Benefit Sharing Policies in Africa developed and Implemented.
Amount received in current period (R’000) R1 276 000
Amount spent by the department (R’000) R1 469 000
Reasons for the funds unspent Project finalised and account closed during 2014/15 Financial Year
Monitoring mechanism by the donor Project Progress Reports to Donor
donor Fund: Germany: 1st biennial updated Report: Compilation, review and publication: Prometium Carbon Programme NAME OF dONOR GERMANy
Full amount of the funding R1 254 298, 00
Period of the commitment October 2013 to March 2014
Purpose of the funding Compilation, review and publication of the 1st Biennial Updated Report: Prometium Carbon Programme
Expected outputs 1st Biennial Updated Report, compiled, reviewed and published
Actual outputs achieved 1st Biennial Updated Report published
Amount received in current period (R’000) R0.00
Amount spent by the department (R’000) R1 254 000
Reasons for the funds unspent Project finalised, await funds transfer from RDP Fund to close account
Monitoring mechanism by the donor Project Progress Reports to Donor
98 DEPARTMENT OF ENVIRONMENTAL AFFAIRS: VOTE 30
PART C GOVERNANCE

99Annual Report 2014/15
1. INTROduCTIONThe Department is committed to maintaining the highest standards of governance as this is fundamental to the management of public finances and resources. As required in terms of the provisions of the Public Finance Management Act, the department has developed and implemented effective, efficient and transparent systems of financial and risk management and internal control and maintains a system of internal audit under the control and direction of an audit committee complying with and operating in accordance with relevant regulations and instructions.
2. RIsk MANAGEMENTThe department follows an integrated approach towards risk management, during the planning process strategic and operational risks are identified. The department has adopted the treasury regulation framework in developing strategies and has an approved risk management strategy. Risks are monitored continuously to determine amongst other things the emerging risks for the department. Risk management surveys are conducted bi-annually to determine the progress/understanding of risk management in the organisation. Risk progress is monitored quarterly by the Risk Management Unit. The analysis and status of the risks are presented to the Risk Management Committee, Audit Committee and Senior Managers of the department. The Risk Management Committee provides assurance to the Accounting Officer and Audit Committee that risks are managed effectively.

100 DEPARTMENT OF ENVIRONMENTAL AFFAIRS: VOTE 30
The table below provide details on the 2014/15 strategic risks, mitigation plans and progress.
RIsk RIsk MITIGATION PROGREss AGAINsT PLANNEd MITIGATIONInadequate And Ineffectiveness Of Interventions Identification of priority non-regulatory interventions aims at
protecting the environment (protected areas, waste services, OC)
Advocacy and awareness in respect of interventions
Assessment of interventions
Assist Competent Authorities in the implementation of Environmental Legislation.
Adequate assurance was provided by Management that the risk mitigations plans have been implemented, it must be noted that this an inherent risk for the organisation and as such some of the mitigation actions are long term.
Ineffective Regulatory Compliance Monitoring And Enforcement System
Assist Competent Authorities in the implementation of Environmental Legislation (EMI training, etc.). Enforcement strategy approved.
Training was provided to Competent Authorities throughout the year. The enforcement strategy was approved, monitoring of the implementation of the strategy will be done going forward.
Inadequate Prevention And Detection Of Fraud, Corruption And Misconduct
Create 14 awareness sessions on fraud & Corruption
Investigate, finalize and report on (publication of outcomes) all fraud and corruption allegations received through all available channels
Follow up on recommendations and decisively act upon cases of misconduct and fraud
14 Awareness sessions held.
Forensic investigators appointed to investigate allegations of fraud & corruption.
Follow ups were made on the implementation of recommendations and where practical the recommendations’ were implemented.
Compromised health, and safety of Employees (Voyages to the Islands, Facilities, Operational, etc.)
Conduct audits in respect of applicable OHSA compliance
Implement recommendations of audits
Implement corrective measures and audit recommendations
Audits conducted by the SHE Reps at regional offices and recommendations implemented.
Training conducted at various offices of DEA.
Poor planning, control and implementation of projects Conduct Audits on projects
Develop & review project planning and management framework
Implement corrective measures and audit recommendations
Adequate monitoring and verification of Environmental Programs projects are in place, audit recommendations are being implemented and funds were recovered from project implementers.
Inability to achieve DEA ‘s goals/priorities due to the reduction of budget by National Treasury
Implementation of cost cutting measures (Operational Costs)
Re-prioritization of resources across the DEA
Scale down
Explore partnerships
Sourcing of additional funds
The planned mitigations have been adequately implemented however in the current economic climate the mitigation plans have had little impact in reducing the risk to an acceptable level.
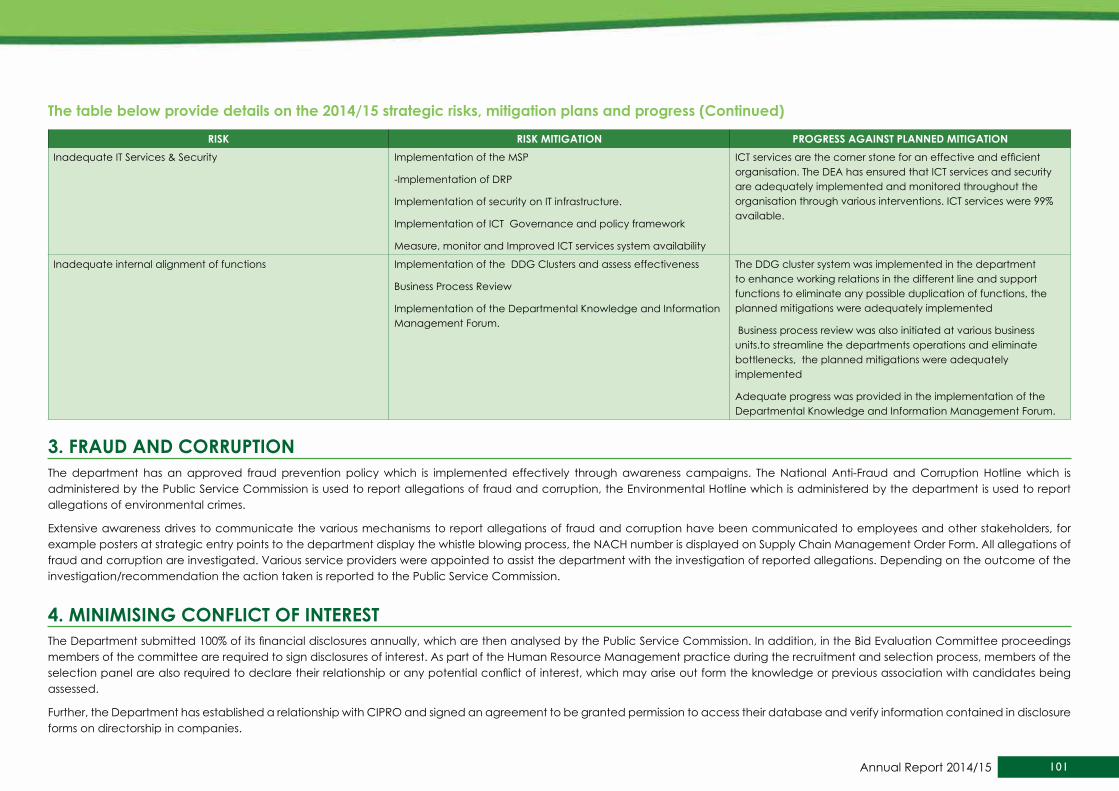
101Annual Report 2014/15
RIsk RIsk MITIGATION PROGREss AGAINsT PLANNEd MITIGATIONInadequate IT Services & Security Implementation of the MSP
-Implementation of DRP
Implementation of security on IT infrastructure.
Implementation of ICT Governance and policy framework
Measure, monitor and Improved ICT services system availability
ICT services are the corner stone for an effective and efficient organisation. The DEA has ensured that ICT services and security are adequately implemented and monitored throughout the organisation through various interventions. ICT services were 99% available.
Inadequate internal alignment of functions Implementation of the DDG Clusters and assess effectiveness
Business Process Review
Implementation of the Departmental Knowledge and Information Management Forum.
The DDG cluster system was implemented in the department to enhance working relations in the different line and support functions to eliminate any possible duplication of functions, the planned mitigations were adequately implemented
Business process review was also initiated at various business units.to streamline the departments operations and eliminate bottlenecks, the planned mitigations were adequately implemented
Adequate progress was provided in the implementation of the Departmental Knowledge and Information Management Forum.
3. FRAud ANd CORRuPTIONThe department has an approved fraud prevention policy which is implemented effectively through awareness campaigns. The National Anti-Fraud and Corruption Hotline which is administered by the Public Service Commission is used to report allegations of fraud and corruption, the Environmental Hotline which is administered by the department is used to report allegations of environmental crimes.
Extensive awareness drives to communicate the various mechanisms to report allegations of fraud and corruption have been communicated to employees and other stakeholders, for example posters at strategic entry points to the department display the whistle blowing process, the NACH number is displayed on Supply Chain Management Order Form. All allegations of fraud and corruption are investigated. Various service providers were appointed to assist the department with the investigation of reported allegations. Depending on the outcome of the investigation/recommendation the action taken is reported to the Public Service Commission.
4. MINIMIsING CONFLICT OF INTEREsTThe Department submitted 100% of its financial disclosures annually, which are then analysed by the Public Service Commission. In addition, in the Bid Evaluation Committee proceedings members of the committee are required to sign disclosures of interest. As part of the Human Resource Management practice during the recruitment and selection process, members of the selection panel are also required to declare their relationship or any potential conflict of interest, which may arise out form the knowledge or previous association with candidates being assessed.
Further, the Department has established a relationship with CIPRO and signed an agreement to be granted permission to access their database and verify information contained in disclosure forms on directorship in companies.
The table below provide details on the 2014/15 strategic risks, mitigation plans and progress (Continued)
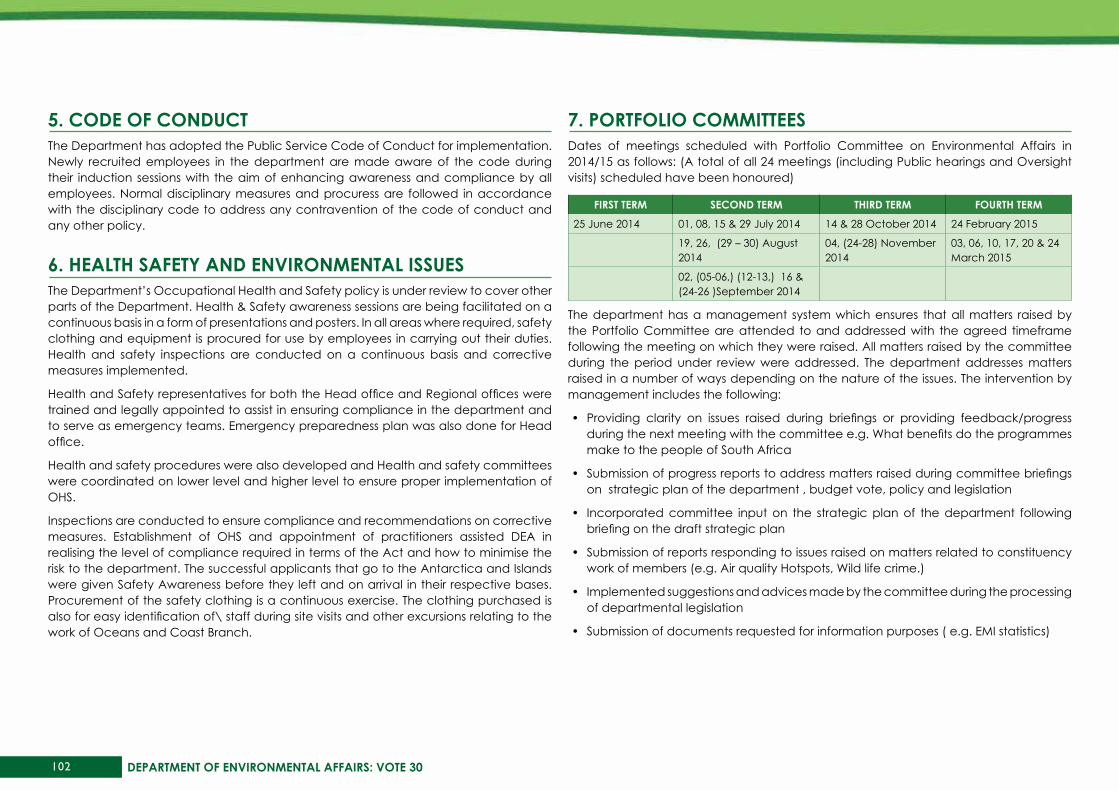
102 DEPARTMENT OF ENVIRONMENTAL AFFAIRS: VOTE 30
5. COdE OF CONduCTThe Department has adopted the Public Service Code of Conduct for implementation. Newly recruited employees in the department are made aware of the code during their induction sessions with the aim of enhancing awareness and compliance by all employees. Normal disciplinary measures and procuress are followed in accordance with the disciplinary code to address any contravention of the code of conduct and any other policy.
6. hEALTh sAFETy ANd ENVIRONMENTAL IssuEsThe Department’s Occupational Health and Safety policy is under review to cover other parts of the Department. Health & Safety awareness sessions are being facilitated on a continuous basis in a form of presentations and posters. In all areas where required, safety clothing and equipment is procured for use by employees in carrying out their duties. Health and safety inspections are conducted on a continuous basis and corrective measures implemented.
Health and Safety representatives for both the Head office and Regional offices were trained and legally appointed to assist in ensuring compliance in the department and to serve as emergency teams. Emergency preparedness plan was also done for Head office.
Health and safety procedures were also developed and Health and safety committees were coordinated on lower level and higher level to ensure proper implementation of OHS.
Inspections are conducted to ensure compliance and recommendations on corrective measures. Establishment of OHS and appointment of practitioners assisted DEA in realising the level of compliance required in terms of the Act and how to minimise the risk to the department. The successful applicants that go to the Antarctica and Islands were given Safety Awareness before they left and on arrival in their respective bases. Procurement of the safety clothing is a continuous exercise. The clothing purchased is also for easy identification of\ staff during site visits and other excursions relating to the work of Oceans and Coast Branch.
7. PORTFOLIO COMMITTEEsDates of meetings scheduled with Portfolio Committee on Environmental Affairs in 2014/15 as follows: (A total of all 24 meetings (including Public hearings and Oversight visits) scheduled have been honoured)
FIRsT TERM sECONd TERM ThIRd TERM FOuRTh TERM
25 June 2014 01, 08, 15 & 29 July 2014 14 & 28 October 2014 24 February 2015
19, 26, (29 – 30) August 2014
04, (24-28) November 2014
03, 06, 10, 17, 20 & 24 March 2015
02, (05-06,) (12-13,) 16 & (24-26 )September 2014
The department has a management system which ensures that all matters raised by the Portfolio Committee are attended to and addressed with the agreed timeframe following the meeting on which they were raised. All matters raised by the committee during the period under review were addressed. The department addresses matters raised in a number of ways depending on the nature of the issues. The intervention by management includes the following:
• Providing clarity on issues raised during briefings or providing feedback/progress during the next meeting with the committee e.g. What benefits do the programmes make to the people of South Africa
• Submission of progress reports to address matters raised during committee briefings on strategic plan of the department , budget vote, policy and legislation
• Incorporated committee input on the strategic plan of the department following briefing on the draft strategic plan
• Submission of reports responding to issues raised on matters related to constituency work of members (e.g. Air quality Hotspots, Wild life crime.)
• Implemented suggestions and advices made by the committee during the processing of departmental legislation
• Submission of documents requested for information purposes ( e.g. EMI statistics)
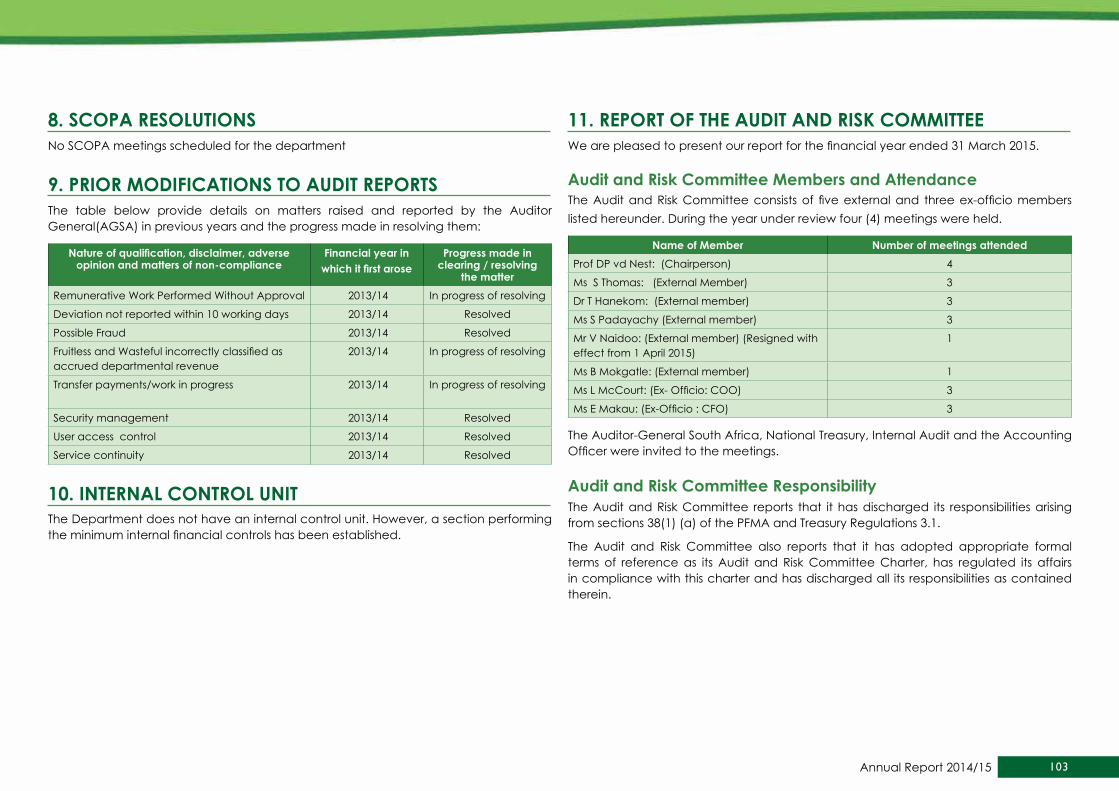
103Annual Report 2014/15
8. sCOPA REsOLuTIONsNo SCOPA meetings scheduled for the department
9. PRIOR MOdIFICATIONs TO AudIT REPORTs The table below provide details on matters raised and reported by the Auditor General(AGSA) in previous years and the progress made in resolving them:
Nature of qualification, disclaimer, adverse opinion and matters of non-compliance
Financial year inwhich it first arose
Progress made in clearing / resolving
the matterRemunerative Work Performed Without Approval 2013/14 In progress of resolving
Deviation not reported within 10 working days 2013/14 Resolved
Possible Fraud 2013/14 Resolved
Fruitless and Wasteful incorrectly classified as accrued departmental revenue
2013/14 In progress of resolving
Transfer payments/work in progress 2013/14 In progress of resolving
Security management 2013/14 Resolved
User access control 2013/14 Resolved
Service continuity 2013/14 Resolved
10. INTERNAL CONTROL uNIT The Department does not have an internal control unit. However, a section performing the minimum internal financial controls has been established.
11. REPORT OF ThE AudIT ANd RIsk COMMITTEEWe are pleased to present our report for the financial year ended 31 March 2015.
Audit and Risk Committee Members and AttendanceThe Audit and Risk Committee consists of five external and three ex-officio members listed hereunder. During the year under review four (4) meetings were held.
Name of Member Number of meetings attendedProf DP vd Nest: (Chairperson) 4
Ms S Thomas: (External Member) 3
Dr T Hanekom: (External member) 3
Ms S Padayachy (External member) 3
Mr V Naidoo: (External member) (Resigned with effect from 1 April 2015)
1
Ms B Mokgatle: (External member) 1
Ms L McCourt: (Ex- Officio: COO) 3
Ms E Makau: (Ex-Officio : CFO) 3
The Auditor-General South Africa, National Treasury, Internal Audit and the Accounting Officer were invited to the meetings.
Audit and Risk Committee ResponsibilityThe Audit and Risk Committee reports that it has discharged its responsibilities arising from sections 38(1) (a) of the PFMA and Treasury Regulations 3.1.
The Audit and Risk Committee also reports that it has adopted appropriate formal terms of reference as its Audit and Risk Committee Charter, has regulated its affairs in compliance with this charter and has discharged all its responsibilities as contained therein.

104 DEPARTMENT OF ENVIRONMENTAL AFFAIRS: VOTE 30
12. AudIT ANd RIsk COMMITTEE REPORT
The effectiveness of internal controlThe Department’s system of internal control is designed to provide reasonable assurance that inter-alia: assets are safeguarded and that liabilities and working capital are efficiently managed.
Internal Audit has submitted various internal audit reports based on the work performed in terms of the approved strategic risk-based operational plan, which sets out the scope, period covered and the audit objectives for the testing of controls around the key risks identified.
The Audit and Management report of the Auditor-General South Africa on the Annual Financial Statements were also submitted to the Audit Committee.
The results of the internal and external audits indicated that controls have been operating as intended in the majority of the areas in the department. Minor areas exist that requires attention to be given to strengthen and improve the control environment. The Audit Committee has considered and evaluated the audit report and is satisfied with management responses and action plans to address the minor internal control matters identified through internal and external audit. The audit report of the Auditor-General was unqualified without any other emphasis matters. This is a good indication of the quality of the control environment in the department.
The quality of in-year management and monthly/quarterly reports submitted in terms of the PFMAThe Audit and Risk Committee is satisfied with the content and quality of monthly and quarterly reports prepared and issued by the Department during the year under review. The performance information of the Department was of a good quality and received an unqualified opinion from the Auditor-General.
Evaluation of Annual Financial statementsThe Audit and Risk Committee has:
• Reviewed and discussed the audited annual financial statements to be included in the annual report, with the Auditor-General South Africa and the Accounting Officer.
• Reviewed the Auditor-General South Africa’s management report and management’s response thereto;
• Reviewed the Department’s compliance with legal and regulatory provisions;
• Noted that there were no significant adjustments resulting from the audit;
• Reviewed the information on pre-determined objectives to be included in the annual report; and
• Reviewed the quality and timeliness of the financial information availed to the Audit Committee for oversight purposes during the year.
The Audit and Risk Committee concurs and accepts the Auditor-General’s conclusion on the annual financial statements, and is of the opinion that the audited annual financial statements read together with the report of the Auditor-General be accepted.
Internal Audit The Internal Audit Function conducts its affairs in terms of an approved Internal Audit Charter. The function also follows a risk-based audit approach, whereby the Department’s risk strategy and the Function’s assessment of the risks drives the internal audit approach and approved internal audit operational plan. The internal audit risk based operational plan was formally adopted and approved by the Audit & Risk Committee. Progress on the execution of the plan was monitored and reported at each Audit Committee meeting.
The Audit & Risk Committee is therefore satisfied that the Internal Audit Function is operating effectively and that it has provided reasonable assurance on controls around the risks pertinent to the Department in its final audit reports.
105Annual Report 2014/15
Risk strategyThe Audit Committee serves as the risk committee for the Department. The Department has a risk management strategy and fraud prevention plan that is implemented. Risk assessments in the Department are conducted annually and strategies are formulated to mitigate risks, these are reported to the Audit & Risk Committee. The Department has also developed a combined assurance plan to assist in the monitoring of the mitigation of key strategic and operational risks.
Auditor-General south AfricaThe Audit & Risk Committee has met with the Auditor-General South Africa to ensure that there are no unresolved issues. The Auditor-General has made a very positive contribution to the department and has contributed to the control environment and assurance that lead to the “clean” audit report for the year.
ConclusionThe Department has received an unqualified audit opinion on the Annual Financial Statements and there were no material findings on the performance information reported by the Department. The Audit & Risk Committee wishes to congratulate the Director-General, the Chief Operating Officer, Chief Financial Officer, Finance staff, management and all officials who have contributed to the success of the Department and the excellent control environment prevalent. The Committee also wishes to thank the Auditor-General staff for their positive contribution to the Department.
Prof. d.P. van der NestChAIRPERsON OF ThE AudIT & RIsk COMMITTEE
dATE: 31 july 2015

106 DEPARTMENT OF ENVIRONMENTAL AFFAIRS: VOTE 30
PART d huMAN REsOuRCE MANAGEMENT
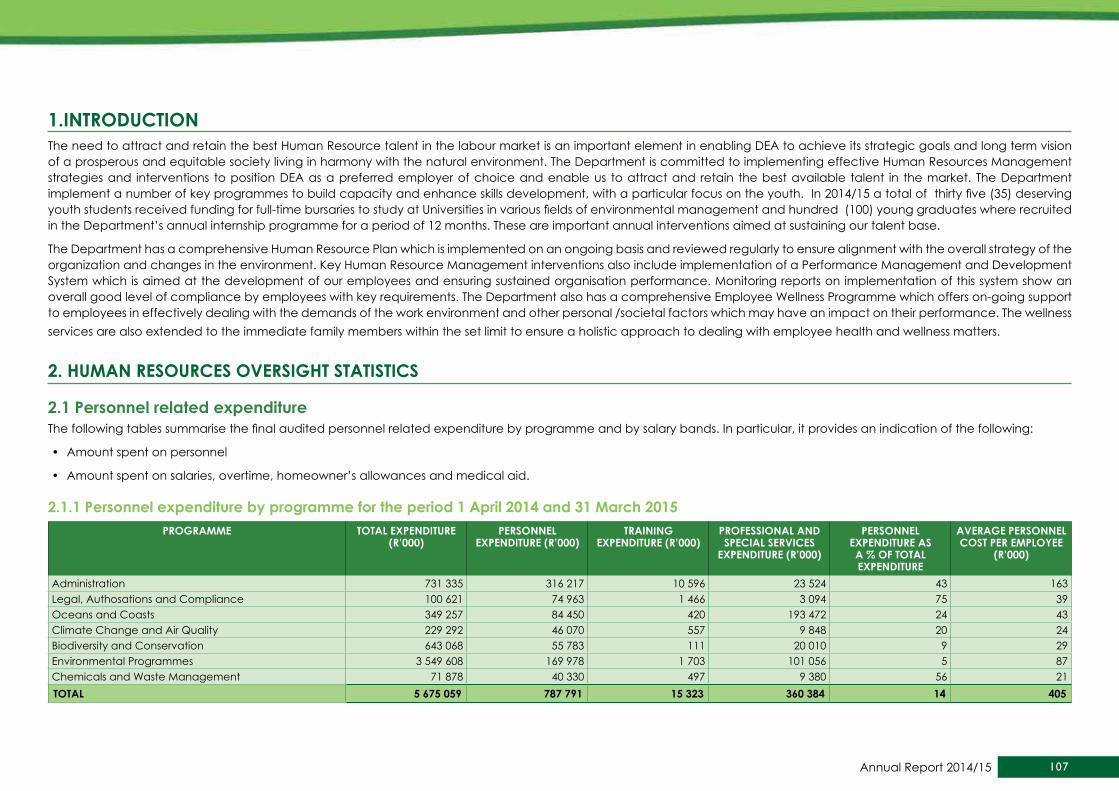
107Annual Report 2014/15
1.INTROduCTIONThe need to attract and retain the best Human Resource talent in the labour market is an important element in enabling DEA to achieve its strategic goals and long term vision of a prosperous and equitable society living in harmony with the natural environment. The Department is committed to implementing effective Human Resources Management strategies and interventions to position DEA as a preferred employer of choice and enable us to attract and retain the best available talent in the market. The Department implement a number of key programmes to build capacity and enhance skills development, with a particular focus on the youth. In 2014/15 a total of thirty five (35) deserving youth students received funding for full-time bursaries to study at Universities in various fields of environmental management and hundred (100) young graduates where recruited in the Department’s annual internship programme for a period of 12 months. These are important annual interventions aimed at sustaining our talent base.
The Department has a comprehensive Human Resource Plan which is implemented on an ongoing basis and reviewed regularly to ensure alignment with the overall strategy of the organization and changes in the environment. Key Human Resource Management interventions also include implementation of a Performance Management and Development System which is aimed at the development of our employees and ensuring sustained organisation performance. Monitoring reports on implementation of this system show an overall good level of compliance by employees with key requirements. The Department also has a comprehensive Employee Wellness Programme which offers on-going support to employees in effectively dealing with the demands of the work environment and other personal /societal factors which may have an impact on their performance. The wellness services are also extended to the immediate family members within the set limit to ensure a holistic approach to dealing with employee health and wellness matters.
2. huMAN REsOuRCEs OVERsIGhT sTATIsTICs
2.1 Personnel related expenditureThe following tables summarise the final audited personnel related expenditure by programme and by salary bands. In particular, it provides an indication of the following:
• Amount spent on personnel
• Amount spent on salaries, overtime, homeowner’s allowances and medical aid.
2.1.1 Personnel expenditure by programme for the period 1 April 2014 and 31 March 2015PROGRAMME TOTAL EXPENdITuRE
(R’000) PERsONNEL
EXPENdITuRE (R’000) TRAINING
EXPENdITuRE (R’000)PROFEssIONAL ANd sPECIAL sERVICEs
EXPENdITuRE (R’000)
PERsONNEL EXPENdITuRE As A % OF TOTAL EXPENdITuRE
AVERAGE PERsONNEL COsT PER EMPLOyEE
(R’000)
Administration 731 335 316 217 10 596 23 524 43 163Legal, Authosations and Compliance 100 621 74 963 1 466 3 094 75 39Oceans and Coasts 349 257 84 450 420 193 472 24 43Climate Change and Air Quality 229 292 46 070 557 9 848 20 24Biodiversity and Conservation 643 068 55 783 111 20 010 9 29Environmental Programmes 3 549 608 169 978 1 703 101 056 5 87Chemicals and Waste Management 71 878 40 330 497 9 380 56 21TOTAL 5 675 059 787 791 15 323 360 384 14 405

108 DEPARTMENT OF ENVIRONMENTAL AFFAIRS: VOTE 30
2.1.2 Personnel costs by salary band for the period 1 April 2014 and 31 March 2015sALARy bANds PERsONNEL EXPENdITuRE
(R’000)% OF TOTAL PERsONNEL COsT NO. OF EMPLOyEEs AVERAGE PERsONNEL COsT
PER EMPLOyEE (R’000)Lower skilled (Levels 1-2) 52 - - -
Skilled (Levels 3-5) 9 886 1.2 79 125 139
Highly skilled production (Levels 6-8) 196 697 23.7 651 302 146
Highly skilled supervision (Levels 9-12) 268 303 32.4 710 377 892
Senior management (Levels 13-16) 224 208 27.1 177 1 266 712
Contract (Levels 1-2) 7 460 0.9 173 43 121
Contract (Levels 3-5) 3 049 0.4 16 190 563
Contract (Levels 6-8) 26 563 3.2 74 358 959
Contract (Levels 9-12) 28 222 3.4 42 671 952
Contract (Levels 13-16) 23 351 2.8 21 1 111 952
TOTAL 787 791 95.1 1 943 405 451
2.1.3 salaries, Overtime, home Owners Allowance and Medical Aid by Programme for the period 1 April 2014 and 31 March 2015PROGRAMME sALARIEs OVERTIME hOME OwNERs ALLOwANCE MEdICAL AId
AMOuNT (R’000 sALARIEs As A % OF PERsONNEL
COsTs
AMOuNT (R’000) OVERTIME As A % OF PERsONNEL
COsTs
AMOuNT (R’000) hOA As A % OF PERsONNEL
COsTs
AMOuNT (R’000) MEdICAL AId As A % OF PERsONNEL
COsTs Prog1/admin 296 610 93.8 3 524 1.1 6 727 2.1 9 355 3
Prog2/lace 71 357 95.2 55 0.1 1 275 1.7 2 276 3
Prog3/oc 78 268 92.7 2 852 3.4 1 238 1.5 2 093 2.5
Prog4/cc&aq 44 010 95.5 18 - 948 2.1 1 094 2.4
Prog5/b&c 53 262 95.5 - - 1 303 2.3 1 218 2.2
Prog6/envprog 162 940 95.9 72 - 3 043 1.8 3 924 2.3
Prog7/chem&waste mng 38 193 94.7 - - 1 166 2.9 970 2.4
TOTAL 744 640 94.5 6 521 0.8 15 700 2 20 930 2.7
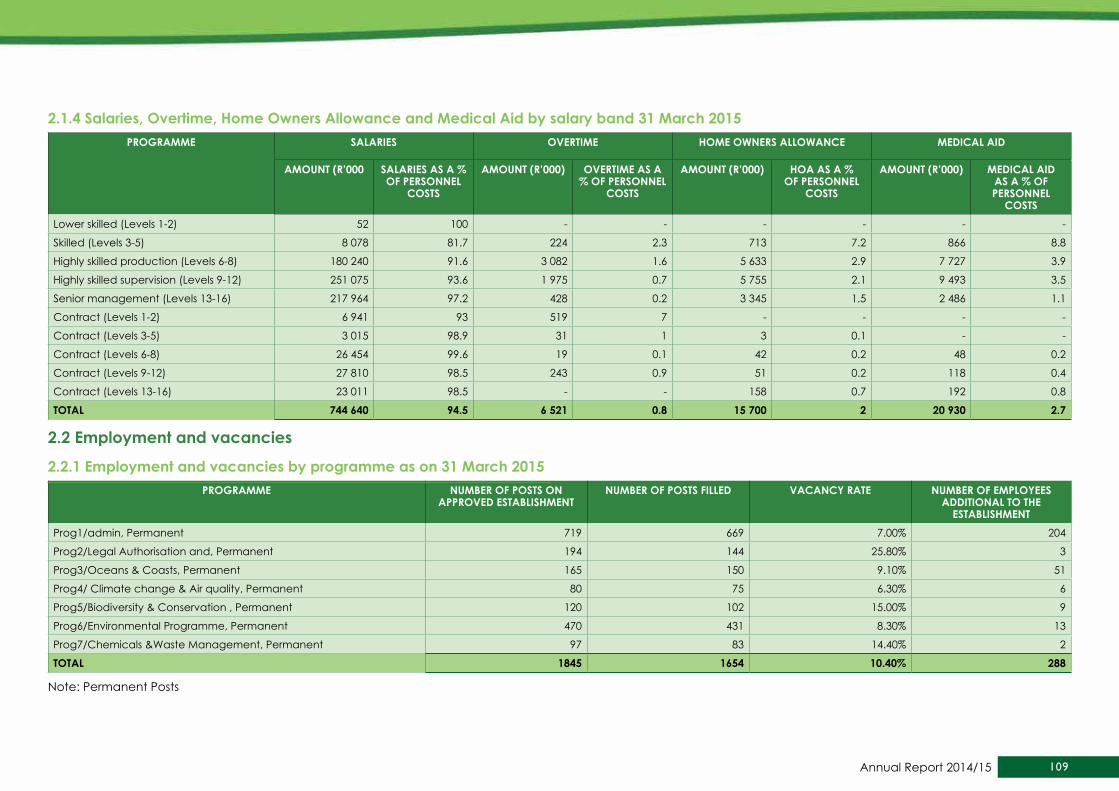
109Annual Report 2014/15
2.1.4 salaries, Overtime, home Owners Allowance and Medical Aid by salary band 31 March 2015PROGRAMME sALARIEs OVERTIME hOME OwNERs ALLOwANCE MEdICAL AId
AMOuNT (R’000 sALARIEs As A % OF PERsONNEL
COsTs
AMOuNT (R’000) OVERTIME As A % OF PERsONNEL
COsTs
AMOuNT (R’000) hOA As A % OF PERsONNEL
COsTs
AMOuNT (R’000) MEdICAL AId As A % OF PERsONNEL
COsTs Lower skilled (Levels 1-2) 52 100 - - - - - -
Skilled (Levels 3-5) 8 078 81.7 224 2.3 713 7.2 866 8.8
Highly skilled production (Levels 6-8) 180 240 91.6 3 082 1.6 5 633 2.9 7 727 3.9
Highly skilled supervision (Levels 9-12) 251 075 93.6 1 975 0.7 5 755 2.1 9 493 3.5
Senior management (Levels 13-16) 217 964 97.2 428 0.2 3 345 1.5 2 486 1.1
Contract (Levels 1-2) 6 941 93 519 7 - - - -
Contract (Levels 3-5) 3 015 98.9 31 1 3 0.1 - -
Contract (Levels 6-8) 26 454 99.6 19 0.1 42 0.2 48 0.2
Contract (Levels 9-12) 27 810 98.5 243 0.9 51 0.2 118 0.4
Contract (Levels 13-16) 23 011 98.5 - - 158 0.7 192 0.8
TOTAL 744 640 94.5 6 521 0.8 15 700 2 20 930 2.7
2.2 Employment and vacancies
2.2.1 Employment and vacancies by programme as on 31 March 2015PROGRAMME NuMbER OF POsTs ON
APPROVEd EsTAbLIshMENTNuMbER OF POsTs FILLEd VACANCy RATE NuMbER OF EMPLOyEEs
AddITIONAL TO ThE EsTAbLIshMENT
Prog1/admin, Permanent 719 669 7.00% 204
Prog2/Legal Authorisation and, Permanent 194 144 25.80% 3
Prog3/Oceans & Coasts, Permanent 165 150 9.10% 51
Prog4/ Climate change & Air quality, Permanent 80 75 6.30% 6
Prog5/Biodiversity & Conservation , Permanent 120 102 15.00% 9
Prog6/Environmental Programme, Permanent 470 431 8.30% 13
Prog7/Chemicals &Waste Management, Permanent 97 83 14.40% 2
TOTAL 1845 1654 10.40% 288
Note: Permanent Posts

110 DEPARTMENT OF ENVIRONMENTAL AFFAIRS: VOTE 30
2.2.2 Employment and vacancies by salary band as on 31 March 2015sALARy bANd NuMbER OF POsTs ON
APPROVEd EsTAbLIshMENT NuMbER OF POsTs FILLEd VACANCy RATE NuMbER OF EMPLOyEEs
AddITIONAL TO ThE EsTAbLIshMENT
Skilled (Levels 1-2), Permanent - - - 173
Skilled (Levels 3-5), Permanent 81 78 3.7 16
Highly skilled production (Levels 6-8), Permanent 728 669 8 52
Highly skilled supervision (Levels 9-12), Permanent 852 738 13.4 33
Senior management (Levels 13-16), Permanent 184 169 8 14
TOTAL 1845 1654 10.4 288
Note: Permanent Posts
2.2.3 Employment and vacancies by critical occupations as on 31 March 2015CRITICAL OCCuPATION NuMbER OF POsTs ON
APPROVEd EsTAbLIshMENTNuMbER OF POsTs FILLEd VACANCy RATE NuMbER OF EMPLOyEEs
AddITIONAL TO ThE EsTAbLIshMENT
Administrative related, permanent 364 328 9.9 11
Agriculture Animal Oceanography Forestry & Other Science, Permanent
484 411 15.1 1
Head of Department/Chief Executive Officer, Permanent 1 1 - -
Natural Sciences Related, Permanent 14 13 7.1 -
Senior Managers, permanent 183 176 8.3 14
TOTAL 1046 929 11.9 26
2.3 Filling of sMs Posts
2.3.1 sMs post information as on 31 March 2015sMs LEVEL TOTAL NuMbER OF
FuNdEd sMs POsTsTOTAL NuMbER OF sMs POsTs FILLEd
% OF sMs POsTs FILLEd
TOTAL NuMbER OF sMs POsTs VACANT
% OF sMs POsTs VACANT
Salary Level 16 (Director-General) 1 1 - - -
Salary Level 15 9 8 89 1 11
Salary Level 14 41 38 93 3 7
Salary Level 13 133 124 95 7 5
TOTAL 184 169 94 11 6

111Annual Report 2014/15
2.3.2 sMs post information as on 30 september 2014sMs LEVEL TOTAL NuMbER OF
FuNdEd sMs POsTsTOTAL NuMbER OF sMs POsTs FILLEd
% OF sMs POsTs FILLEd
TOTAL NuMbER OF sMs POsTs VACANT
% OF sMs POsTs VACANT
Salary Level 16 (Director-General) 1 1 - -
Salary Level 15 9 9 - -
Salary Level 14 40 37 93 3 8
Salary Level 13 127 120 94 7 6
TOTAL 177 167 94 10 6
2.3.3 Advertising and filling of SMS posts for the period 1 April 2014 and 31 March 2015sMs LEVEL AdVERTIsING FILLING OF POsTs
NuMbER OF VACANCIEs PER LEVEL AdVERTIsEd IN 6 MONThs OF bECOMING
VACANT
NuMbER OF VACANCIEs PER LEVEL FILLEd IN 6 MONThs OF
bECOMING VACANT
NuMbER OF VACANCIEs PER LEVEL NOT FILLEd IN 6 MONThs
buT FILLEd IN 12 MONThs
Salary Level 16 (Director-General) - - -
Salary Level 15 1 - -
Salary Level 14 1 - -
Salary Level 13 4 1 3
TOTAL 6 1 3
2.3.4 Reasons for not having complied with the filling of funded vacant SMS - Advertised within 6 months and filled within 12 months after becoming vacant for the period 1 April 2014 and 31 March 2015
REAsONs FOR VACANCIEs NOT AdVERTIsEd wIThIN sIX MONThsNot applicable
REAsONs FOR VACANCIEs NOT FILLEd wIThIN TwELVE MONThsThere was a moratorium on the filling of posts
Difficulties in attracting suitable candidates due to shortage of skills required
Prolonged and repeated selection process
Budget constraints resulting from salary negotiations for higher offers

112 DEPARTMENT OF ENVIRONMENTAL AFFAIRS: VOTE 30
2.3.5 Disciplinary steps taken for not complying with the prescribed timeframes for filling SMS posts within 12 months for the period 1 April 2014 and 31 March 2015
REAsONs FOR VACANCIEs NOT AdVERTIsEd wIThIN sIX MONThs
None
REAsONs FOR VACANCIEs NOT FILLEd wIThIN TwELVE MONThs
None
2.4 job Evaluation
2.4.1 job Evaluation by salary band for the period 1 April 2014 and 31 March 2015sALARy bANd NuMbER OF POsTs
ON APPROVEd EsTAbLIshMENT
NuMbER OF jObs EVALuATEd
% OF POsTs EVALuATEd by sALARy bANds
POsTs uPGRAdEd POsTs dOwNGRAdEd NuMbER % OF POsTs
EVALuATEdNuMbER % OF POsTs
EVALuATEd Contract (Levels 1-2) 173 - -
Contract (Levels 3-5) 16 - - - - - -
Contract (Levels 6-8) 74 - - - - - -
Contract (Levels 9-12) 42 - - - - - -
Contract (Band A) 8 - - - - - -
Contract (Band B) 4 - - - - - -
Contract (Band C) 8 - - - - - -
Contract (band d) 1 - - - - - -
skilled (Levels 3-5) 82 34 41.5 - - 34 100highly skilled production (Levels 6-8) 711 165 23.2 14 8.5 - -
highly skilled supervision (Levels 9-12) 825 249 30.2 45 18.1 - -
senior Management service band A 133 32 22.1 - - - -
senior Management service band b 41 7 18.4 - - - -
senior Management service band C 9 1 11.1 - - - -
senior Management service band d 1 - - - - - -
TOTAL 2128 488 22.8 59 12.1 34 7

113Annual Report 2014/15
2.4.2 Profile of employees whose positions were upgraded due to their posts being upgraded for the period 1 April 2014 and 31 March 2015GENdER AFRICAN AsIAN COLOuREd whITE TOTAL
Female 24 - 5 1 30
Male 18 - 2 2 22
TOTAL 42 - 7 3 52Employees with a Disability -
2.4.3 Employees with salary levels higher than those determined by job evaluation by occupation for the period 1 April 2014 and 31 March 2015OCCuPATION NuMbER OF EMPLOyEEs jOb EVALuATION LEVEL REMuNERATION LEVEL REAsON FOR dEVIATION
ADMINISTRATION: DEPUTY DIRECTOR L12 4 12 13 Retention
PROVISIONING ADMINISTRATION CLERK III: SENIOR L6 1 6 7 Retention
ACCOUNTING CLERK III: SENIOR L6 1 6 7 Retention
HEAD: SPECIALIST ADVISOR L15 1 15 16 Retention
POLICY ADVISOR:CHIEF L14 1 14 15 Retention
CHIEF DIRECTOR L14 4 14 15 Retention
ADMINISTRATIVE OFFICER L7 3 7 8 Retention
TELECOM OPERATOR: PRINCIPAL L7 1 7 8 Retention
SECURITY OFFICER: CHIEF L7 1 7 8 Retention
ADMINISTRATION CLERK III: SENIOR L6 1 6 7 Retention
IT SERVER SUPPORT SPECIALIST SNR L11 1 11 12 Retention
EDMS CONTENT MANAGER: DEPUTY DIRECTOR L11 1 11 12 Retention
EDMS ADMINISTRATOR L11 1 11 12 Retention
HUMAN RESOURCE OFFICER: SENIOR L6 1 6 7 Retention
HRM: ASSISTANT DIRECTOR L10 1 10 11 Retention
DIRECTOR L13 1 13 14 Retention
ADMINISTRATION: ASSISTANT DIRECTOR L9 1 9 10 Retention
OFFICE ADMINISTRATOR I L6 2 6 7 Retention
ASD:REGIONAL PLANNING & OPERATIONS SUPPORT L10 1 10 11 Retention
ACCOUNTING CLERK: CHIEF L7 1 7 8 Retention
DD: BUDGET FINANCE PLANNING & CONTROL MNGT. L11 1 11 12 Retention
DEPUTY DIRECTOR: STRATEGIC PARTNERS L12 1 12 13 Retention
SECRETARY / RECEPTIONIST L6 1 6 9 Retention

114 DEPARTMENT OF ENVIRONMENTAL AFFAIRS: VOTE 30
OCCuPATION NuMbER OF EMPLOyEEs jOb EVALuATION LEVEL REMuNERATION LEVEL REAsON FOR dEVIATIONTotal number of employees whose salaries exceeded the level determined by job evaluation
32 - - -
Percentage of total employed 1.9 - - -
2.4.4 Profile of employees who have salary levels higher than those determined by job evaluation for the period 1 April 2014 and 31 March 2015GENdER AFRICAN AsIAN COLOuREd whITE TOTAL
Female 5 1 1 8 15
Male 6 2 3 6 17
TOTAL 11 3 4 14 32Employees with a Disability - - - - -
2.5 Employment Changes
2.5.1 Annual turnover rates by salary band for the period 1 April 2014 and 31 March 2015sALARy bANd NuMbER OF EMPLOyEEs AT
bEGINNING OF PERIOd-1 APRIL 2014
APPOINTMENTsANd TRANsFERs INTO ThE
dEPARTMENT
TERMINATIONs ANd TRANsFERs OuT OF ThE
dEPARTMENT
TuRNOVER RATE
(Levels 1-2), Permanent 1 0 1 100
Skilled (Levels 3-5), Permanent 76 7 3 3.9
Highly skilled production (Levels 6-8), Permanent 666 26 48 7.2
Highly skilled supervision (Levels 9-12), Permanent 679 33 25 3.7
Senior Management Service Band A, Permanent 122 5 4 3.3
Senior Management Service Band B, Permanent 34 1 1 2.9
Senior Management Service Band C, Permanent 9 0 1 11.1
Senior Management Service (Band D), Permanent 1 0 0 0
TOTAL 1588 72 83 5.2
Note: Permanent Posts
2.4.3 Employees with salary levels higher than those determined by job evaluation by occupation for the period 1 April 2014 and 31 March 2015 (Continued)
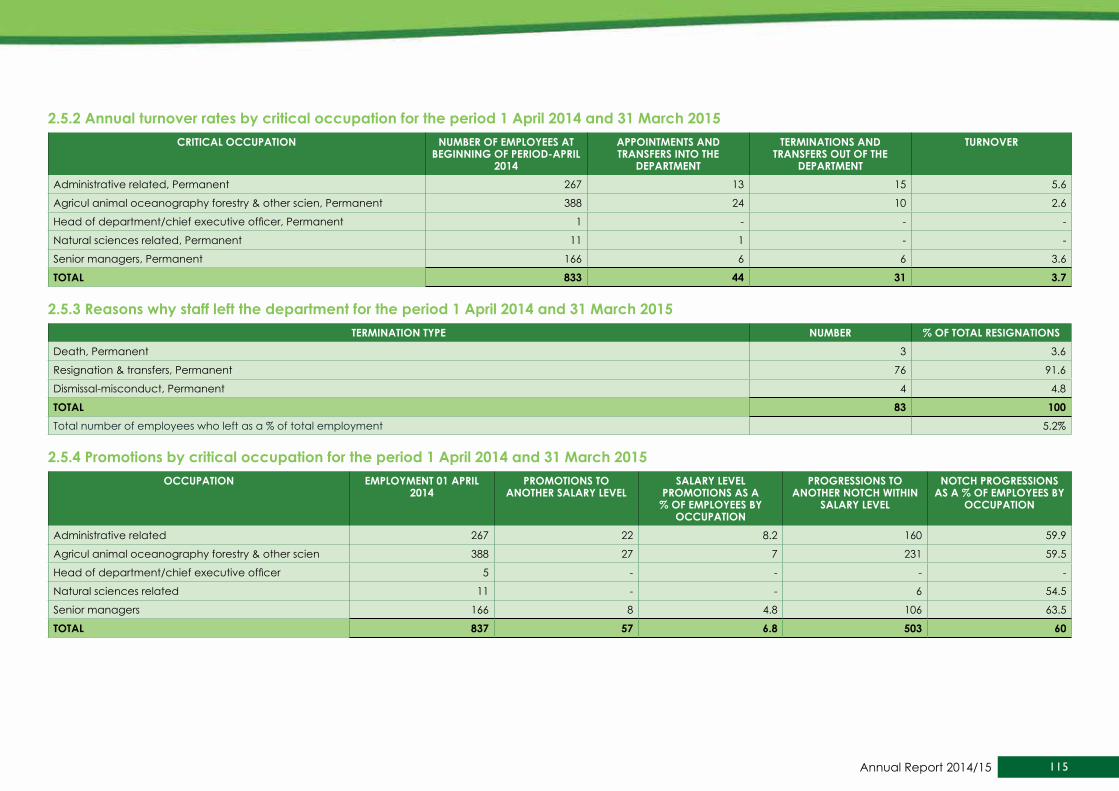
115Annual Report 2014/15
2.5.2 Annual turnover rates by critical occupation for the period 1 April 2014 and 31 March 2015CRITICAL OCCuPATION NuMbER OF EMPLOyEEs AT
bEGINNING OF PERIOd-APRIL 2014
APPOINTMENTs ANd TRANsFERs INTO ThE
dEPARTMENT
TERMINATIONs ANd TRANsFERs OuT OF ThE
dEPARTMENT
TuRNOVER
Administrative related, Permanent 267 13 15 5.6
Agricul animal oceanography forestry & other scien, Permanent 388 24 10 2.6
Head of department/chief executive officer, Permanent 1 - - -
Natural sciences related, Permanent 11 1 - -
Senior managers, Permanent 166 6 6 3.6
TOTAL 833 44 31 3.7
2.5.3 Reasons why staff left the department for the period 1 April 2014 and 31 March 2015TERMINATION TyPE NuMbER % OF TOTAL REsIGNATIONs
Death, Permanent 3 3.6
Resignation & transfers, Permanent 76 91.6
Dismissal-misconduct, Permanent 4 4.8
TOTAL 83 100Total number of employees who left as a % of total employment 5.2%
2.5.4 Promotions by critical occupation for the period 1 April 2014 and 31 March 2015OCCuPATION EMPLOyMENT 01 APRIL
2014PROMOTIONs TO
ANOThER sALARy LEVELsALARy LEVEL
PROMOTIONs As A % OF EMPLOyEEs by
OCCuPATION
PROGREssIONs TO ANOThER NOTCh wIThIN
sALARy LEVEL
NOTCh PROGREssIONs As A % OF EMPLOyEEs by
OCCuPATION
Administrative related 267 22 8.2 160 59.9
Agricul animal oceanography forestry & other scien 388 27 7 231 59.5
Head of department/chief executive officer 5 - - - -
Natural sciences related 11 - - 6 54.5
Senior managers 166 8 4.8 106 63.5
TOTAL 837 57 6.8 503 60
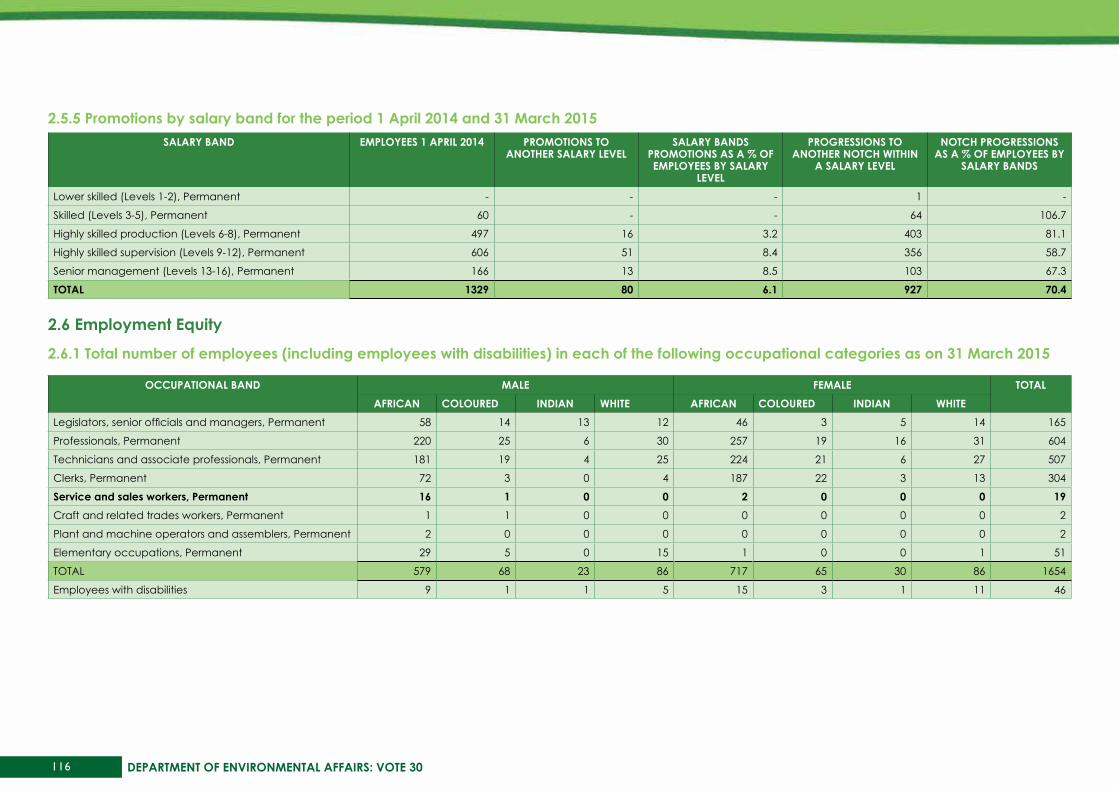
116 DEPARTMENT OF ENVIRONMENTAL AFFAIRS: VOTE 30
2.5.5 Promotions by salary band for the period 1 April 2014 and 31 March 2015sALARy bANd EMPLOyEEs 1 APRIL 2014 PROMOTIONs TO
ANOThER sALARy LEVELsALARy bANds
PROMOTIONs As A % OF EMPLOyEEs by sALARy
LEVEL
PROGREssIONs TO ANOThER NOTCh wIThIN
A sALARy LEVEL
NOTCh PROGREssIONs As A % OF EMPLOyEEs by
sALARy bANds
Lower skilled (Levels 1-2), Permanent - - - 1 -
Skilled (Levels 3-5), Permanent 60 - - 64 106.7
Highly skilled production (Levels 6-8), Permanent 497 16 3.2 403 81.1
Highly skilled supervision (Levels 9-12), Permanent 606 51 8.4 356 58.7
Senior management (Levels 13-16), Permanent 166 13 8.5 103 67.3
TOTAL 1329 80 6.1 927 70.4
2.6 Employment Equity
2.6.1 Total number of employees (including employees with disabilities) in each of the following occupational categories as on 31 March 2015
OCCuPATIONAL bANd MALE FEMALE TOTALAFRICAN COLOuREd INdIAN whITE AFRICAN COLOuREd INdIAN whITE
Legislators, senior officials and managers, Permanent 58 14 13 12 46 3 5 14 165
Professionals, Permanent 220 25 6 30 257 19 16 31 604
Technicians and associate professionals, Permanent 181 19 4 25 224 21 6 27 507
Clerks, Permanent 72 3 0 4 187 22 3 13 304
service and sales workers, Permanent 16 1 0 0 2 0 0 0 19Craft and related trades workers, Permanent 1 1 0 0 0 0 0 0 2
Plant and machine operators and assemblers, Permanent 2 0 0 0 0 0 0 0 2
Elementary occupations, Permanent 29 5 0 15 1 0 0 1 51
TOTAL 579 68 23 86 717 65 30 86 1654
Employees with disabilities 9 1 1 5 15 3 1 11 46

117Annual Report 2014/15
2.6.2 Total number of employees (including employees with disabilities) in each of the following occupational bands as on 31 March 2015
OCCuPATIONAL bANd MALE FEMALE TOTALAFRICAN COLOuREd INdIAN whITE AFRICAN COLOuREd INdIAN whITE
Top Management, Permanent 1 0 2 2 2 - - 2 9
Senior Management, Permanent 61 12 11 9 45 3 6 13 160
Professionally qualified and experienced specialists and mid-management, Permanent
239 21 17 36 209 22 7 44 595
Skilled technical and academically qualified workers, junior management, supervisors, foremen, Permanent
423 40 7 34 261 26 3 14 808
Semi-skilled and discretionary decision making, Permanent
34 2 - - 36 6 - 1 79
Unskilled, Permanent - - - - - - - - -
TOTAL 758 75 37 82 555 57 16 74 1654
2.6.3 Recruitment for the period 1 April 2014 to 31 March 2015OCCuPATIONAL bANd MALE FEMALE TOTAL
AFRICAN COLOuREd INdIAN whITE AFRICAN COLOuREd INdIAN whITESenior Management, Permanent 1 - 1 1 - - - 2 5
Professionally qualified and experienced specialists and mid-management, Permanent
12 1 - 1 7 1 1 2 25
Skilled technical and academically qualified workers, junior management, supervisors, foremen, Permanent
9 1 - - 3 2 - - 15
Semi-skilled and discretionary decision making, Permanent
- 1 - - - - - - 1
TOTAL 22 3 1 2 10 3 1 4 46Employees with disabilities - - - - - 1 - - 1
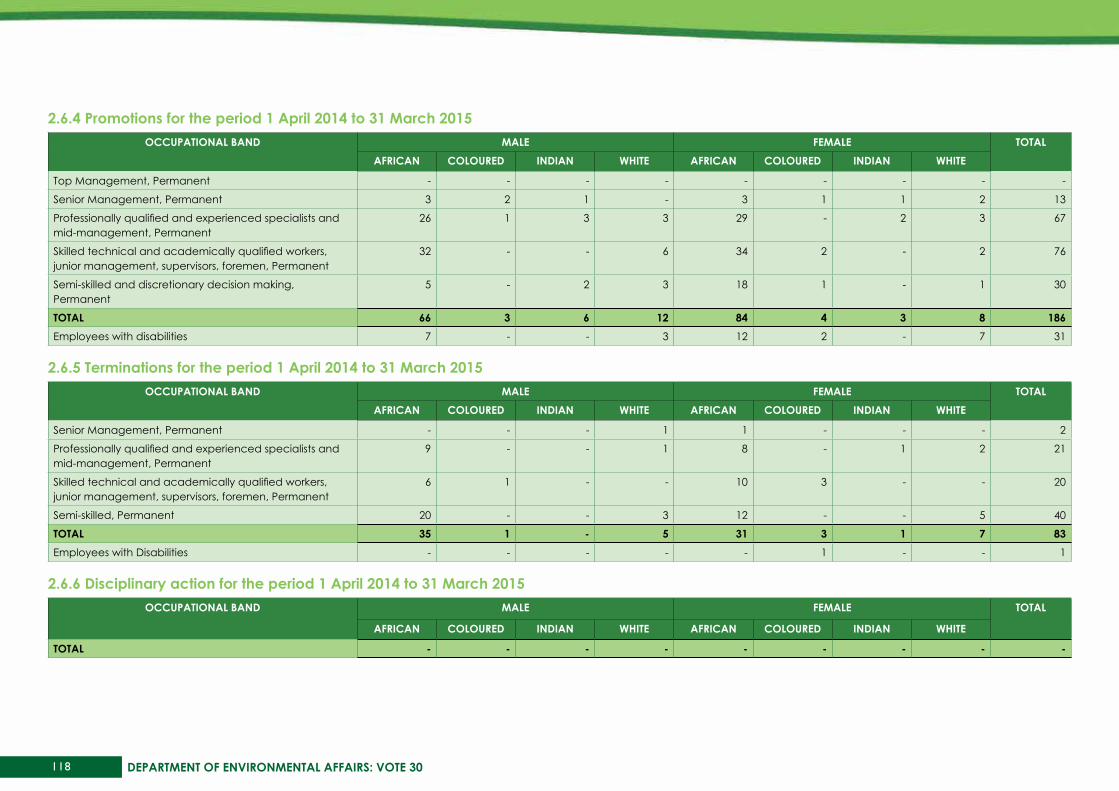
118 DEPARTMENT OF ENVIRONMENTAL AFFAIRS: VOTE 30
2.6.4 Promotions for the period 1 April 2014 to 31 March 2015OCCuPATIONAL bANd MALE FEMALE TOTAL
AFRICAN COLOuREd INdIAN whITE AFRICAN COLOuREd INdIAN whITE
Top Management, Permanent - - - - - - - - -
Senior Management, Permanent 3 2 1 - 3 1 1 2 13
Professionally qualified and experienced specialists and mid-management, Permanent
26 1 3 3 29 - 2 3 67
Skilled technical and academically qualified workers, junior management, supervisors, foremen, Permanent
32 - - 6 34 2 - 2 76
Semi-skilled and discretionary decision making, Permanent
5 - 2 3 18 1 - 1 30
TOTAL 66 3 6 12 84 4 3 8 186Employees with disabilities 7 - - 3 12 2 - 7 31
2.6.5 Terminations for the period 1 April 2014 to 31 March 2015OCCuPATIONAL bANd MALE FEMALE TOTAL
AFRICAN COLOuREd INdIAN whITE AFRICAN COLOuREd INdIAN whITE
Senior Management, Permanent - - - 1 1 - - - 2
Professionally qualified and experienced specialists and mid-management, Permanent
9 - - 1 8 - 1 2 21
Skilled technical and academically qualified workers, junior management, supervisors, foremen, Permanent
6 1 - - 10 3 - - 20
Semi-skilled, Permanent 20 - - 3 12 - - 5 40
TOTAL 35 1 - 5 31 3 1 7 83Employees with Disabilities - - - - - 1 - - 1
2.6.6 disciplinary action for the period 1 April 2014 to 31 March 2015OCCuPATIONAL bANd MALE FEMALE TOTAL
AFRICAN COLOuREd INdIAN whITE AFRICAN COLOuREd INdIAN whITE
TOTAL - - - - - - - - -

119Annual Report 2014/15
2.6.7 skills development for the period 1 April 2014 to 31 March 2015OCCuPATIONAL bANd MALE FEMALE TOTAL
AFRICAN COLOuREd INdIAN whITE AFRICAN COLOuREd INdIAN whITE
Legislators, Senior Officials and Managers 54 12 10 13 41 1 5 13 149
Professionals 117 8 3 8 129 12 5 16 298
Technicians and Associate Professionals 91 12 3 11 106 12 2 13 250
Clerks 47 1 - 1 112 10 2 6 179
Service and Sales Workers 4 - - 3 1 - - - 8
Skilled Agriculture and Fishery Workers - - - - - - - - -
Craft and related Trades Workers - - - - - - - - -
Plant and Machine Operators and Assemblers 1 - - - - - - - 1
Elementary Occupations 14 - - - 25 1 - - 40
TOTAL 328 33 16 36 414 36 14 48 925Employees with disabilities 9 1 1 3 9 2 - 11 36
2.7 signing of Performance Agreements by sMs members
2.7.1 signing of Performance Agreements by sMs members as on 31 May 2015sMs LEVEL TOTAL NuMbER OF FuNdEd
sMs POsTsTOTAL NuMbER OF sMs
MEMbERsTOTAL NuMbER OF sIGNEd
PERFORMANCE AGREEMENTssIGNEd PERFORMANCE
AGREEMENTs As % OF TOTAL NuMbER OF sMs MEMbERs
Salary Level 16 (Director-General) 1 1 1 100
Salary Level 15 9 9 9 100
Salary Level 14 39 35 35 100
Salary Level 13 123 110 110 100
TOTAL 172 155 155 100
2.7.2 Reasons for not having concluded Performance agreements for all sMs members as on 31 March 2014REAsONs
Delays as a result of failure to agree on the contents of the performance agreement between supervisors and officials
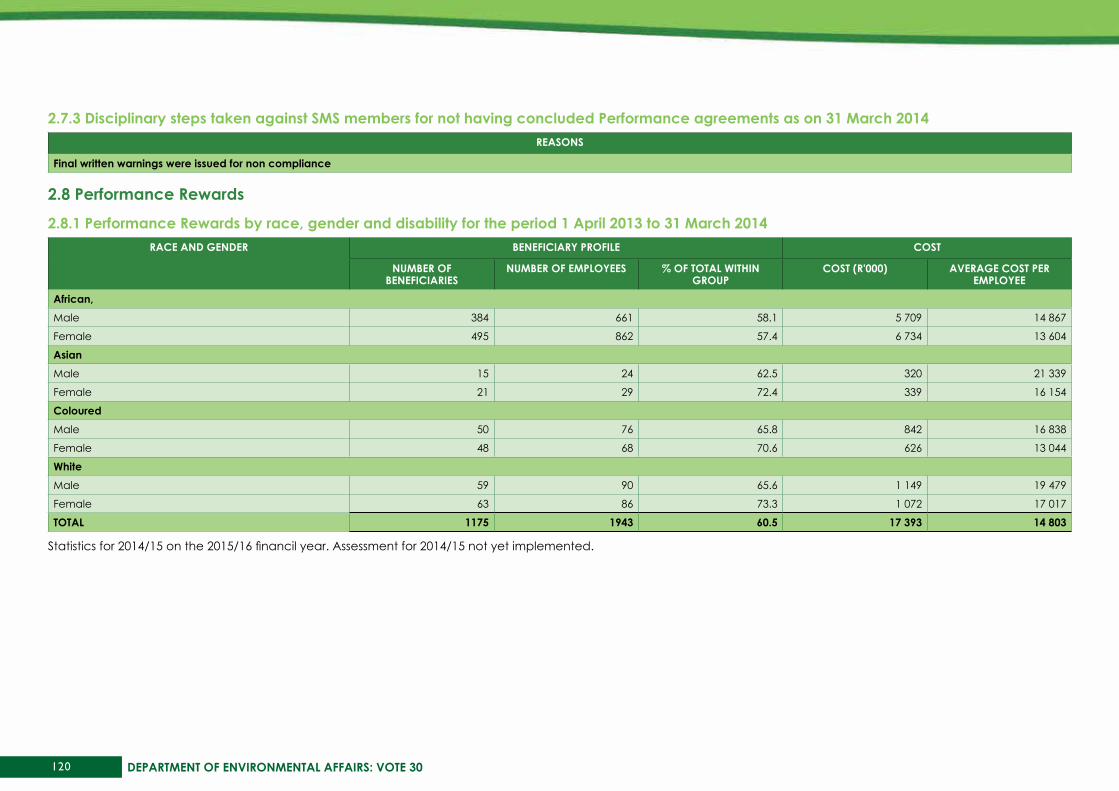
120 DEPARTMENT OF ENVIRONMENTAL AFFAIRS: VOTE 30
2.7.3 disciplinary steps taken against sMs members for not having concluded Performance agreements as on 31 March 2014REAsONs
Final written warnings were issued for non compliance
2.8 Performance Rewards
2.8.1 Performance Rewards by race, gender and disability for the period 1 April 2013 to 31 March 2014RACE ANd GENdER bENEFICIARy PROFILE COsT
NuMbER OF bENEFICIARIEs
NuMbER OF EMPLOyEEs % OF TOTAL wIThIN GROuP
COsT (R'000) AVERAGE COsT PER EMPLOyEE
African, Male 384 661 58.1 5 709 14 867
Female 495 862 57.4 6 734 13 604
AsianMale 15 24 62.5 320 21 339
Female 21 29 72.4 339 16 154
ColouredMale 50 76 65.8 842 16 838
Female 48 68 70.6 626 13 044
whiteMale 59 90 65.6 1 149 19 479
Female 63 86 73.3 1 072 17 017
TOTAL 1175 1943 60.5 17 393 14 803
Statistics for 2014/15 on the 2015/16 financil year. Assessment for 2014/15 not yet implemented.
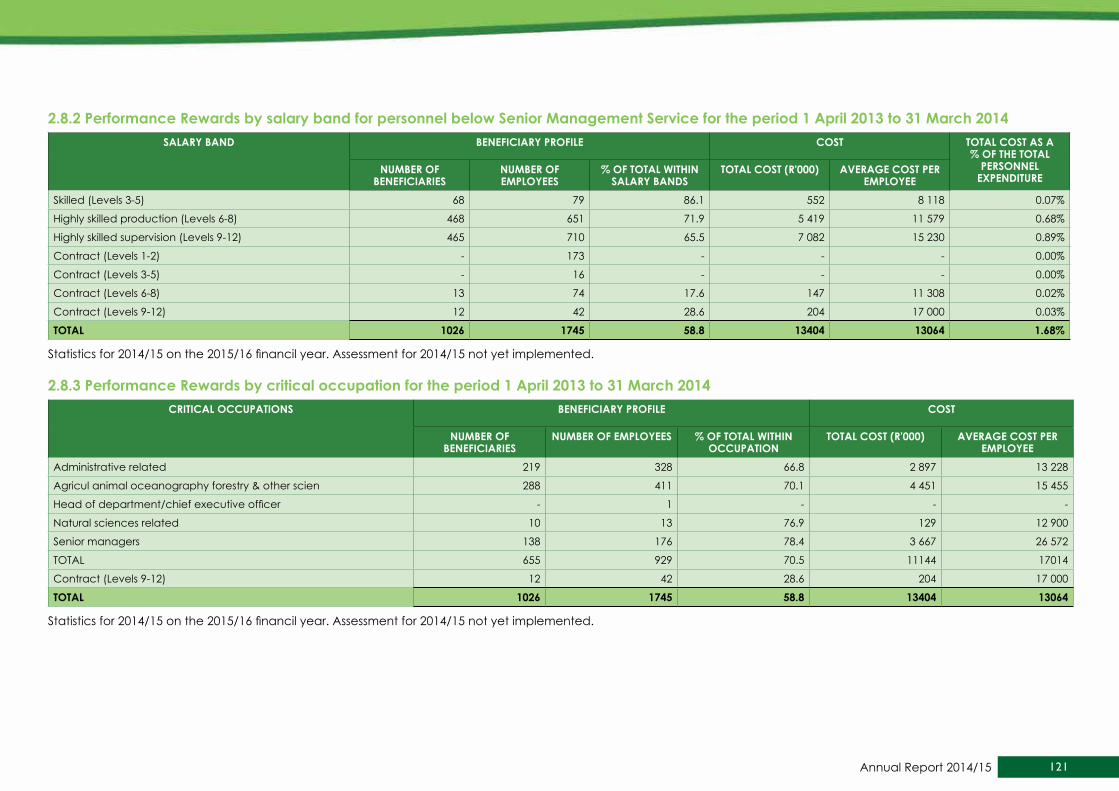
121Annual Report 2014/15
2.8.2 Performance Rewards by salary band for personnel below senior Management service for the period 1 April 2013 to 31 March 2014sALARy bANd bENEFICIARy PROFILE COsT TOTAL COsT As A
% OF ThE TOTAL PERsONNEL
EXPENdITuRENuMbER OF
bENEFICIARIEsNuMbER OF EMPLOyEEs
% OF TOTAL wIThIN sALARy bANds
TOTAL COsT (R'000) AVERAGE COsT PER EMPLOyEE
Skilled (Levels 3-5) 68 79 86.1 552 8 118 0.07%
Highly skilled production (Levels 6-8) 468 651 71.9 5 419 11 579 0.68%
Highly skilled supervision (Levels 9-12) 465 710 65.5 7 082 15 230 0.89%
Contract (Levels 1-2) - 173 - - - 0.00%
Contract (Levels 3-5) - 16 - - - 0.00%
Contract (Levels 6-8) 13 74 17.6 147 11 308 0.02%
Contract (Levels 9-12) 12 42 28.6 204 17 000 0.03%
TOTAL 1026 1745 58.8 13404 13064 1.68%
Statistics for 2014/15 on the 2015/16 financil year. Assessment for 2014/15 not yet implemented.
2.8.3 Performance Rewards by critical occupation for the period 1 April 2013 to 31 March 2014CRITICAL OCCuPATIONs bENEFICIARy PROFILE COsT
NuMbER OF bENEFICIARIEs
NuMbER OF EMPLOyEEs % OF TOTAL wIThIN OCCuPATION
TOTAL COsT (R'000) AVERAGE COsT PER EMPLOyEE
Administrative related 219 328 66.8 2 897 13 228
Agricul animal oceanography forestry & other scien 288 411 70.1 4 451 15 455
Head of department/chief executive officer - 1 - - -
Natural sciences related 10 13 76.9 129 12 900
Senior managers 138 176 78.4 3 667 26 572
TOTAL 655 929 70.5 11144 17014
Contract (Levels 9-12) 12 42 28.6 204 17 000
TOTAL 1026 1745 58.8 13404 13064
Statistics for 2014/15 on the 2015/16 financil year. Assessment for 2014/15 not yet implemented.
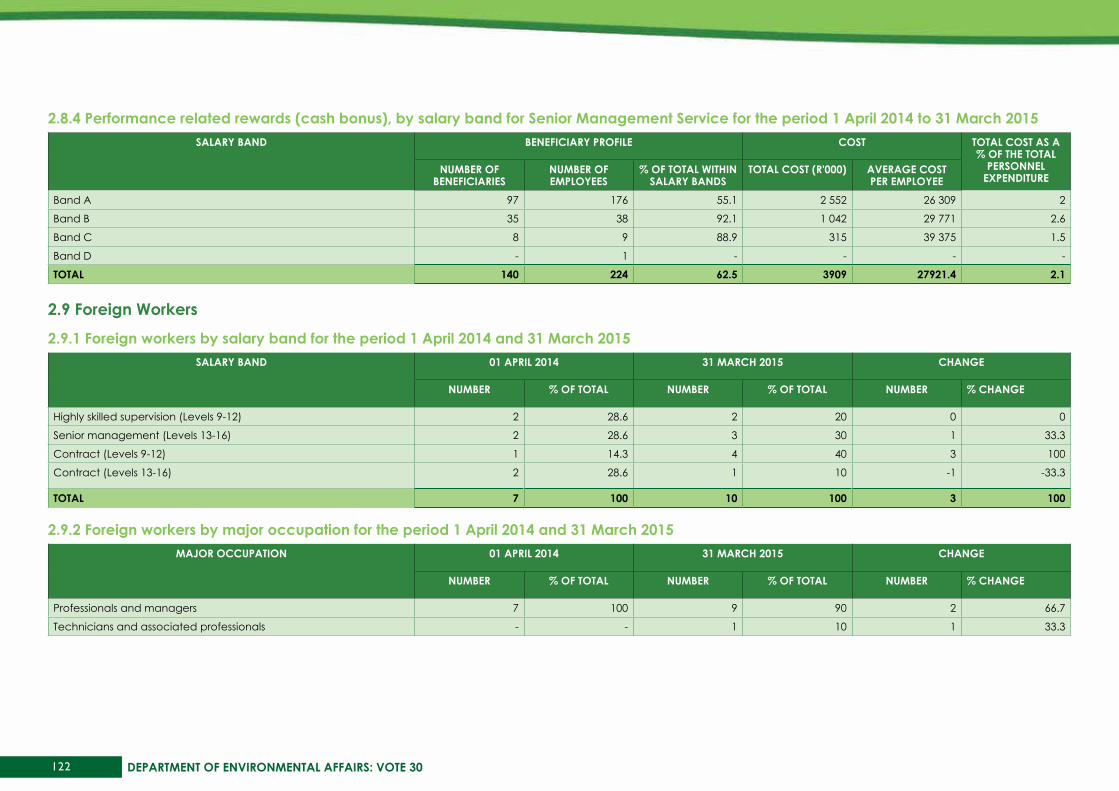
122 DEPARTMENT OF ENVIRONMENTAL AFFAIRS: VOTE 30
2.8.4 Performance related rewards (cash bonus), by salary band for senior Management service for the period 1 April 2014 to 31 March 2015sALARy bANd bENEFICIARy PROFILE COsT TOTAL COsT As A
% OF ThE TOTAL PERsONNEL
EXPENdITuRENuMbER OF
bENEFICIARIEsNuMbER OF EMPLOyEEs
% OF TOTAL wIThIN sALARy bANds
TOTAL COsT (R'000) AVERAGE COsT PER EMPLOyEE
Band A 97 176 55.1 2 552 26 309 2
Band B 35 38 92.1 1 042 29 771 2.6
Band C 8 9 88.9 315 39 375 1.5
Band D - 1 - - - -
TOTAL 140 224 62.5 3909 27921.4 2.1
2.9 Foreign workers
2.9.1 Foreign workers by salary band for the period 1 April 2014 and 31 March 2015sALARy bANd 01 APRIL 2014 31 MARCh 2015 ChANGE
NuMbER % OF TOTAL NuMbER % OF TOTAL NuMbER % ChANGE
Highly skilled supervision (Levels 9-12) 2 28.6 2 20 0 0
Senior management (Levels 13-16) 2 28.6 3 30 1 33.3
Contract (Levels 9-12) 1 14.3 4 40 3 100
Contract (Levels 13-16) 2 28.6 1 10 -1 -33.3
TOTAL 7 100 10 100 3 100
2.9.2 Foreign workers by major occupation for the period 1 April 2014 and 31 March 2015MAjOR OCCuPATION 01 APRIL 2014 31 MARCh 2015 ChANGE
NuMbER % OF TOTAL NuMbER % OF TOTAL NuMbER % ChANGE
Professionals and managers 7 100 9 90 2 66.7
Technicians and associated professionals - - 1 10 1 33.3

123Annual Report 2014/15
2.10 Leave utilisation
2.10.1 sick leave for the period 1 january 2014 to 31 december 2014sALARy bANd TOTAL dAys % dAys wITh
MEdICAL CERTIFICATION
NuMbER OF EMPLOyEEs usING
sICk LEAVE
% OF TOTAL EMPLOyEEs usING
sICk LEAVE
AVERAGE dAys PER EMPLOyEE
EsTIMATEd COsT (R'000)
Skilled (Levels 3-5) 538 67.1 65 5.2 8 305
Highly skilled production (Levels 6-8) 3342 70.9 487 39.1 7 3 154
Highly skilled supervision (Levels 9-12) 3060 72.8 490 39.3 6 5 825
Senior management (Levels 13-16) 424 70.5 95 7.6 4 1 457
Contract (Levels 1-2) 114 61.4 49 3.9 2 31
Contract (Levels 3-5) 7 - 4 0.3 2 4
Contract (Levels 6-8) 130 82.3 21 1.7 6 119
Contract (Levels 9-12) 104 74 21 1.7 5 202
Contract (Levels 13-16) 61 70.5 14 1.1 4 256
TOTAL 7780 71.4 1246 100 6 11353
2.10.2 disability leave (temporary and permanent) for the period 1 january 2014 to 31 december 2014sALARy bANd TOTAL dAys % dAys wITh
MEdICAL CERTIFICATION
NuMbER OF EMPLOyEEs usING
sICk LEAVE
% OF TOTAL EMPLOyEEs usING
sICk LEAVE
AVERAGE dAys PER EMPLOyEE
EsTIMATEd COsT (R'000)
Skilled (Levels 3-5) 203 100 2 14.3 102 119
Highly skilled production (Levels 6-8) 168 100 5 35.7 34 199
Highly skilled supervision (Levels 9-12) 199 100 5 35.7 40 386
Senior management (Levels 13-16) 40 100 2 14.3 20 130
TOTAL 610 100 14 100 44 834
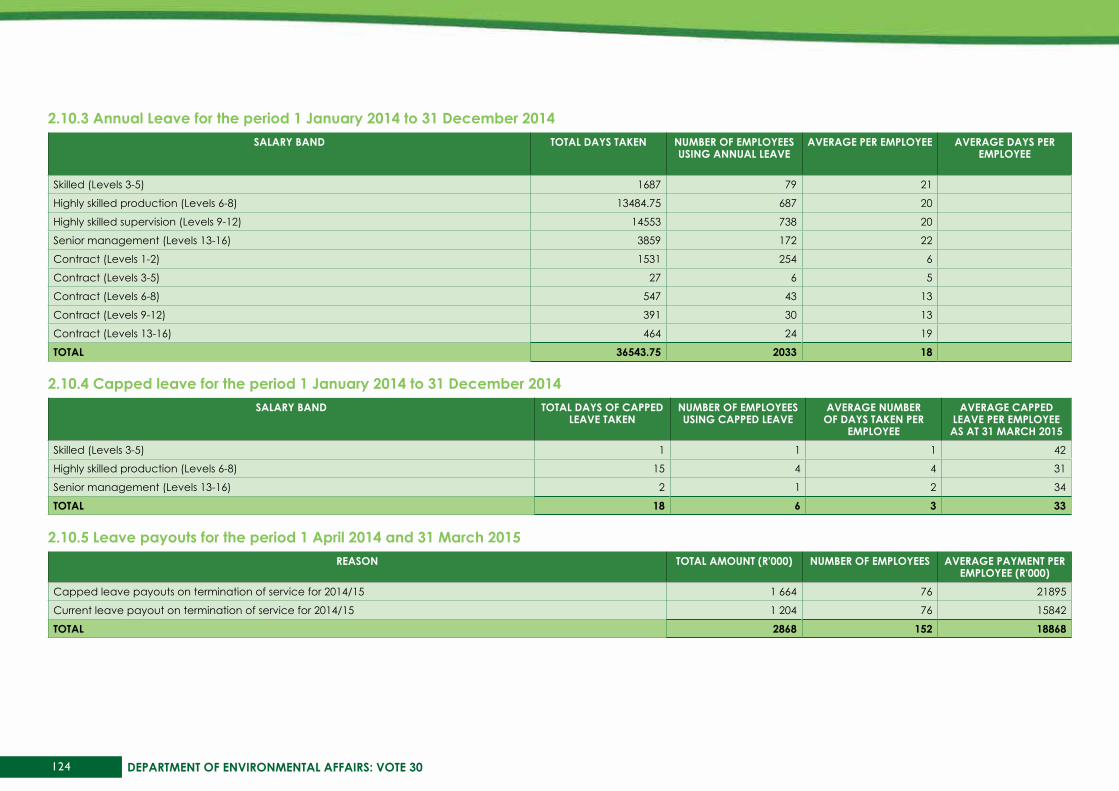
124 DEPARTMENT OF ENVIRONMENTAL AFFAIRS: VOTE 30
2.10.3 Annual Leave for the period 1 january 2014 to 31 december 2014sALARy bANd TOTAL dAys TAkEN NuMbER OF EMPLOyEEs
usING ANNuAL LEAVEAVERAGE PER EMPLOyEE AVERAGE dAys PER
EMPLOyEE
Skilled (Levels 3-5) 1687 79 21
Highly skilled production (Levels 6-8) 13484.75 687 20
Highly skilled supervision (Levels 9-12) 14553 738 20
Senior management (Levels 13-16) 3859 172 22
Contract (Levels 1-2) 1531 254 6
Contract (Levels 3-5) 27 6 5
Contract (Levels 6-8) 547 43 13
Contract (Levels 9-12) 391 30 13
Contract (Levels 13-16) 464 24 19
TOTAL 36543.75 2033 18
2.10.4 Capped leave for the period 1 january 2014 to 31 december 2014sALARy bANd TOTAL dAys OF CAPPEd
LEAVE TAkENNuMbER OF EMPLOyEEs usING CAPPEd LEAVE
AVERAGE NuMbER OF dAys TAkEN PER
EMPLOyEE
AVERAGE CAPPEd LEAVE PER EMPLOyEE As AT 31 MARCh 2015
Skilled (Levels 3-5) 1 1 1 42
Highly skilled production (Levels 6-8) 15 4 4 31
Senior management (Levels 13-16) 2 1 2 34
TOTAL 18 6 3 33
2.10.5 Leave payouts for the period 1 April 2014 and 31 March 2015REAsON TOTAL AMOuNT (R'000) NuMbER OF EMPLOyEEs AVERAGE PAyMENT PER
EMPLOyEE (R'000)Capped leave payouts on termination of service for 2014/15 1 664 76 21895
Current leave payout on termination of service for 2014/15 1 204 76 15842
TOTAL 2868 152 18868

125Annual Report 2014/15
2.11 hIV/AIds & health Promotion Programmes
2.11.1 steps taken to reduce the risk of occupational exposureuNITs/CATEGORIEs OF EMPLOyEEs IdENTIFIEd TO bE AT hIGh RIsk OF CONTRACTING hIV &
RELATEd dIsEAsEs (IF ANy) kEy sTEPs TAkEN TO REduCE ThE RIsk
None Conduct HTC quarterly distribution of condoms and information pamphlets.
Conduct gender dialogues on HIV issues.
Observe HIV awareness and provide counselling
2.11.2 details of health Promotion and hIV/AIds Programmes (tick the applicable boxes and provide the required information)QuEsTION yEs NO dETAILs, IF yEs
1. Has the department designated a member of the SMS to implement the provisions contained in Part VI E of Chapter 1 of the Public Service Regulations, 2001? If so, provide her/his name and position.
yes Mr Sandy Nyathi -Dir: Transformation Employee Health and Wellness
2. Does the department have a dedicated unit or has it designated specific staff members to promote the health and well-being of your employees? If so, indicate the number of employees who are involved in this task and the annual budget that is available for this purpose.
yes There are five (5) dedicated staff members to promote Health and Wellbeing of Employees. The annual budget available is R1124 000
3. Has the department introduced an Employee Assistance or Health Promotion Programme for your employees? If so, indicate the key elements/services of this Programme.
yes Wellness management, Healt &Productivity management, HIV & TB management, and Occupational Health & Saftey management.
4. Has the department established (a) committee(s) as contemplated in Part VI E.5 (e) of Chapter 1 of the Public Service Regulations, 2001? If so, please provide the names of the members of the committee and the stakeholder(s) that they represent.
yes OHS Committee consisting of 17 officials
5. Has the department reviewed its employment policies and practices to ensure that these do not unfairly discriminate against employees on the basis of their HIV status? If so, list the employment policies/practices so reviewed.
yes HIV & TB Policy reviwed. Counselling services in places
6. Has the department introduced measures to protect HIV-positive employees or those perceived to be HIV-positive from discrimination? If so, list the key elements of these measures.
yes Care & support services available
7. Does the department encourage its employees to undergo Voluntary Counselling and Testing? If so, list the results that you have you achieved.
yes 389 employees tested for HIV . HCT done on quarterly basis.
8. Has the department developed measures/indicators to monitor & evaluate the impact of its health promotion programme? If so, list these measures/indicators.
yes Operational plans on 4 Pillars of EHW Programmes submitted to DPSA annually. Monthly & quartely reports provided to management on EHW implementation progress. Quartely implementation reports on HCT & EHW submitted to DPSA.

126 DEPARTMENT OF ENVIRONMENTAL AFFAIRS: VOTE 30
2.12 Labour Relations
2.12.1 Collective agreements for the period 1 April 2014 and 31 March 2015TOTAL NuMbER OF COLLECTIVE AGREEMENTs NONE
2.12.2 Misconduct and disciplinary hearings finalised for the period 1 April 2014 and 31 March 2015OuTCOMEs OF dIsCIPLINARy hEARINGs NuMbER % OF TOTAL
Acquainted 5 12.2%.
One month suspension without pay 5 12.2%
Final written warning 12 29.3%
Written warning 5 12.2%
Dismissal 3 7.3%
Training recommended (Counselling) 2 4.9%
TOTAL 32 78.1%
2.12.3 Types of misconduct addressed at disciplinary hearings for the period 1 April 2014 and 31 March 2015TyPE OF MIsCONduCT NuMbER % OF TOTAL
Sexual harrasement - 100%
Niglegance 6 100%
Contravention of Procurement Procedures 5 83%
Dishonest misrepresentation 6 100%
Possession of alcohol 7 100%
Alcohol abuse - 0%
Absenteism 1 100%
Incapacity - 0%
Insolency - 0%
RWOP (Renumerative Work Outside Public Service) - 0%
Theft 1 100%
Assault - 0%
Corruption 6 100%
TOTAL 32 80.5
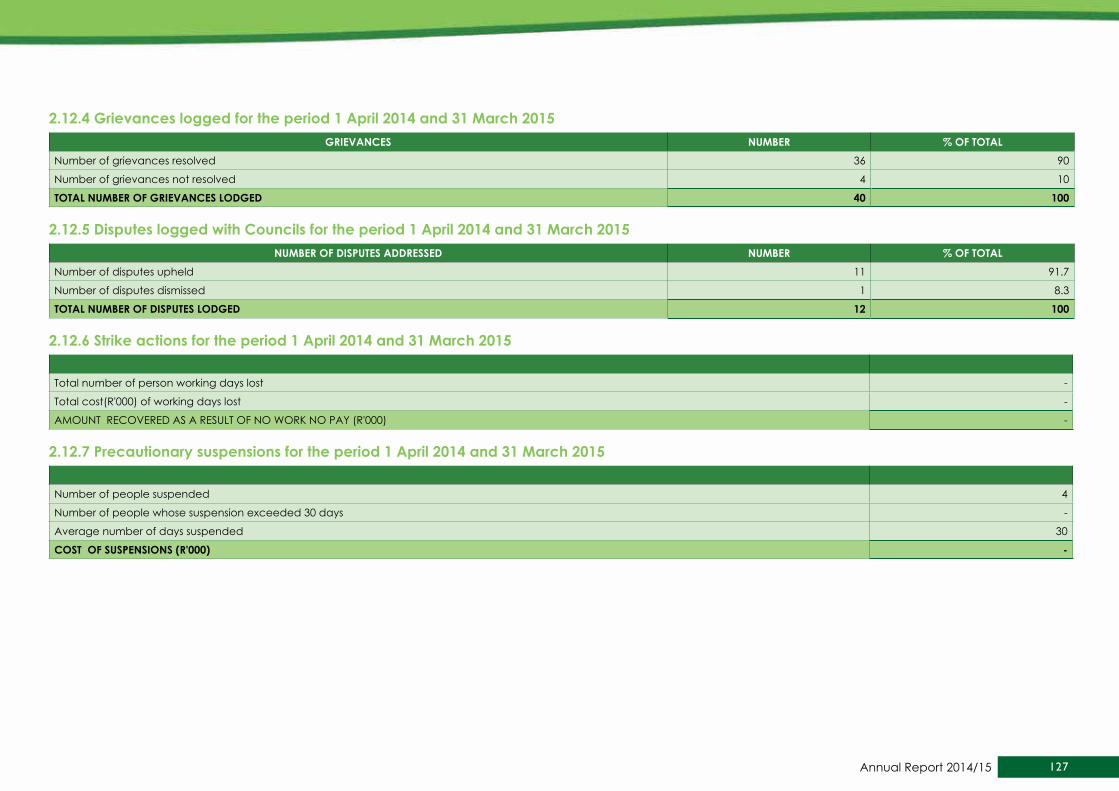
127Annual Report 2014/15
2.12.4 Grievances logged for the period 1 April 2014 and 31 March 2015GRIEVANCEs NuMbER % OF TOTAL
Number of grievances resolved 36 90
Number of grievances not resolved 4 10
TOTAL NuMbER OF GRIEVANCEs LOdGEd 40 100
2.12.5 disputes logged with Councils for the period 1 April 2014 and 31 March 2015NuMbER OF dIsPuTEs AddREssEd NuMbER % OF TOTAL
Number of disputes upheld 11 91.7
Number of disputes dismissed 1 8.3
TOTAL NuMbER OF dIsPuTEs LOdGEd 12 100
2.12.6 strike actions for the period 1 April 2014 and 31 March 2015
Total number of person working days lost -
Total cost(R'000) of working days lost -
AMOUNT RECOVERED AS A RESULT OF NO WORK NO PAY (R'000) -
2.12.7 Precautionary suspensions for the period 1 April 2014 and 31 March 2015
Number of people suspended 4
Number of people whose suspension exceeded 30 days -
Average number of days suspended 30
COsT OF susPENsIONs (R'000) -

128 DEPARTMENT OF ENVIRONMENTAL AFFAIRS: VOTE 30
2.13 skills development
2.13.1 Training needs identified for the period 1 April 2014 and 31 March 2015OCCuPATIONAL CATEGORIEs GENdER NuMbER OF
EMPLOyEEs As AT 1 APRIL 2014
TRAINING NEEds IdENTIFIEd AT sTART OF ThE REPORTING PERIOd
LEARNERshIPs skILLs PROGRAMMEs & OThER shORT
COuRsEs
OThER FORMs OF TRAINING
TOTAL
Legislators, senior officials and managers Female 64 - 60 - 60
Male 92 - 89 - 89
Professionals Female 315 - 162 - 162
Male 262 - 136 - 136
Technicians and associate professionals Female 256 - 133 - 133
Male 225 - 117 - 117
Clerks Female 227 - 130 - 130
Male 72 - 49 - 49
Service and sales workers Female 3 - 1 - 1
Male 17 - 7 - 7
Skilled agriculture and fishery workers Female - - - - -
Male - - - - -
Craft and related trades workers Female - - - - -
Male 2 - - - -
Plant and machine operators and assemblers Female - - - - -
Male 2 - 1 - 1
Elementary occupations Female 31 - 26 - 26
Male 20 - 14 - 14
Gender sub totals Female 896 - 512 - 512
Male 692 - 413 - 413
TOTAL 1588 - 925 - 925
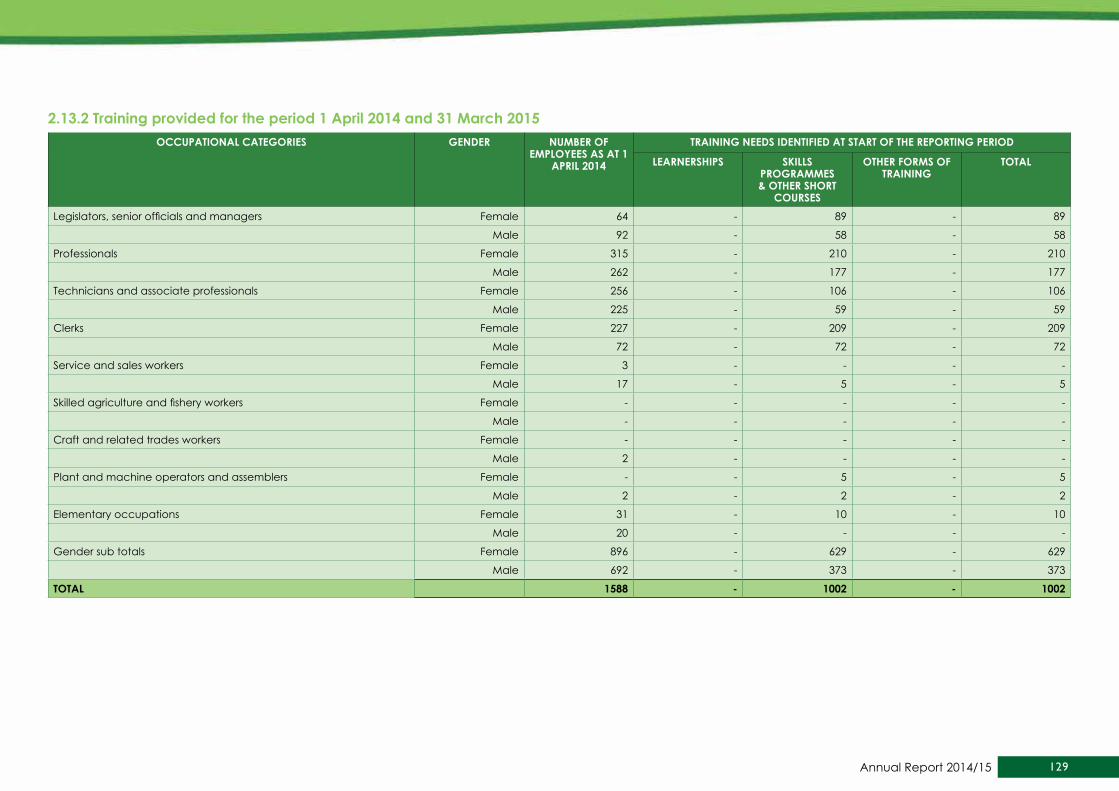
129Annual Report 2014/15
2.13.2 Training provided for the period 1 April 2014 and 31 March 2015OCCuPATIONAL CATEGORIEs GENdER NuMbER OF
EMPLOyEEs As AT 1 APRIL 2014
TRAINING NEEds IdENTIFIEd AT sTART OF ThE REPORTING PERIOd
LEARNERshIPs skILLs PROGRAMMEs & OThER shORT
COuRsEs
OThER FORMs OF TRAINING
TOTAL
Legislators, senior officials and managers Female 64 - 89 - 89
Male 92 - 58 - 58
Professionals Female 315 - 210 - 210
Male 262 - 177 - 177
Technicians and associate professionals Female 256 - 106 - 106
Male 225 - 59 - 59
Clerks Female 227 - 209 - 209
Male 72 - 72 - 72
Service and sales workers Female 3 - - - -
Male 17 - 5 - 5
Skilled agriculture and fishery workers Female - - - - -
Male - - - - -
Craft and related trades workers Female - - - - -
Male 2 - - - -
Plant and machine operators and assemblers Female - - 5 - 5
Male 2 - 2 - 2
Elementary occupations Female 31 - 10 - 10
Male 20 - - - -
Gender sub totals Female 896 - 629 - 629
Male 692 - 373 - 373
TOTAL 1588 - 1002 - 1002

130 DEPARTMENT OF ENVIRONMENTAL AFFAIRS: VOTE 30
2.14 Injury on duty
2.14.1 Injury on duty for the period 1 April 2014 and 31 March 2015NATURE OF INJURY ON DUTY NUMBER % OF TOTAL
Required basic medical attention only 14 100
Temporary Total Disablement - -
Permanent Disablement - -
Fatal - -
TOTAL 14 100
2.15 utilisation of Consultants 2.15.1 Report on consultant appointments using appropriated funds for the period 1 April 2014 and 31 March 2015
TITLE PROjECTs TOTAL INdIVIduAL CONsuLTANTs ThAT wORkEd
ON PROjECT
duRATION (wORk dAys) CONTRACT VALuE IN RANd
Apr-14
Jayshree Moodley And Associates
Appointment of a single source service provider to represent the Department of Environmental Affairs and Mr J Lawrence as 1st and 2nd respondent, respectively in the dispute lodged by Mr Hartley against the Department.
3 10 100 000.00
May-14
Tiisang Risk & Assurance Consultanting
Appointment of Tiisang Risk and Assurance consulting(PTY)LTD to conduct analysis and documentation of user requirements of DEA employees relocating to the DEA new building and to facilitate asset disposal process
Not indicated 5 1 113 483.00
Change Partners
Appointment of service providers/Individual coaches to provide coaching services to the department of Environmental Affairs senior managers ( Mr Ziyaad Hassam)
2 12 98 178.00
2Connect (Pty) Ltd
Appointment of a single source service provider to facilitate Environmental Programme Branch session
2 6 182 000.00

131Annual Report 2014/15
TITLE PROjECTs TOTAL INdIVIduAL CONsuLTANTs ThAT wORkEd
ON PROjECT
duRATION (wORk dAys) CONTRACT VALuE IN RANd
MM Chartered Accountant
Appointment of a service provider to render quality Assurance in the areas of Supply Chain Management
4 4 490 000.00
jun-14
CSIR
Appointment of a service provider (CSIR) as a consultant to developthe strategic environmental assessment to facilitate the effient rollout of wind and solar energy in SA
4 8 388 227.00
jul-14
21 st Century Pay Solutions Group
Appointment of a single source service provider for the development of a remuneration and human resources framework system for public entities
2 8 1 941 420.00
University Of The Witwatersrand
Appointment of a single service provider to conduct a short-term study on the extent of resistance development to MON 810
1 4 350 000.00
Aug-14
Indlela Growth Strategies (Pty) Ltd
Appointment of a service provider to facilitate the 6th people and parks national conference 2 1 133 100.00
2Connect (Pty) Ltd
Appointment of a preffered service provider to conduct work for support of strategy Cascade process for DEA team
2 1 334 305.00
Investigative Software Solution
Appointment of a preffered service provider for the supply, setup and training on software for the collation, analysis and representation of environmental compliance and enforcement information.
3 1 46 957.35
sep-14
Resource Africa
2.15.1 Report on consultant appointments using appropriated funds for the period 1 April 2014 and 31 March 2015 (Continued)

132 DEPARTMENT OF ENVIRONMENTAL AFFAIRS: VOTE 30
TITLE PROjECTs TOTAL INdIVIduAL CONsuLTANTs ThAT wORkEd
ON PROjECT
duRATION (wORk dAys) CONTRACT VALuE IN RANd
Agreement with resource Africa for collaboration on implementation of the people and parks programme toolkit
Not indicated 3 999 500.00
Linked Environmental Services
Appointment of the service provider to facilitate the development of protected areas sustainable financing strategies models for state managed protected areas management authorities
Not Indicated 3 485 402.00
Oct-14
Accord (African Centre for the Construction Resolution of disputes Education)
Appointment of the service provider on the mentorship programme for Mr Moeketsi 1 12 264 000.00
Nov-14
Ekhaya Coaching
The service provider shall provide developmental team coaching to the Directorate: Governance & Special Projects
1 4 319 485.00
Indlela Growth Strategies
Appoitment of service providers to facilitate proceedings, content management and report writing for the 6th people and parks national conference
Not indicated 3 499 529.00
Change Partners Coaching
Appointment of the service provider to provide an Executive Coaching services-Ms Noluthando Moledi
1 12 98 178.00
Zenande Leadership Consulting
Appointment of the service provider to provide an Executive Coaching services-Ms Judy Beaumont 1 12 91 999.99
jan-15
Games Rangers Association of Africa
Appointment of service provider as a single source service provider for undertaking the full review of management effectiveness of South Africa's state managed protected areas
Not indicated 4 6 000 000.00
2.15.1 Report on consultant appointments using appropriated funds for the period 1 April 2014 and 31 March 2015 (Continued)

133Annual Report 2014/15
TITLE PROjECTs TOTAL INdIVIduAL CONsuLTANTs ThAT wORkEd
ON PROjECT
duRATION (wORk dAys) CONTRACT VALuE IN RANd
Landelahni Leadership Development
Appointment of service providers/Individual coaches to provide coaching services to the Deparment of Environmental Affairs, Senior Managers - L Nesane
Not indicated 10 102 600.00
Landelahni Leadership Development
Appointment of service providers/Individual coaches to provide Executive Coaching services to the Deparment of Environmental Affairs, Senior Managers - S.M Rakhoho
Not indicated 10 102 600.00
Landelahni Leadership Development
Appointment of service providers/Individual coaches to provide Executive Coaching services to the Deparment of Environmental Affairs, Senior Managers - E.S Makau
Not indicated 10 102 600.00
Breath Consulting
Appointment of service provider as a single source service provider to develop a business case for Vredefort Dome World Heritage Site
Not indicated 3 499 582.20
Zenande Leadership Consulting
Appointment of service provider to provide an Executive Coaching Services - Mr Jongikhaya Witi 1 1 12 000.00
Feb-15
ASG Performance solutions
Appointment of service provider to assist the Department with the implementation of the final implementation of individual balanced scorecard changes and enhancements
Not indicated 1 342 000.00
KPMG
Appointment of service provider to assist the Asset Management team to assess the entire Assets disposal process in preparation of the interim audit for a period of atleast three (3) months in the Department of Environmental affairs
1 3 969 000.00
Mathews & Associates
2.15.1 Report on consultant appointments using appropriated funds for the period 1 April 2014 and 31 March 2015 (Continued)
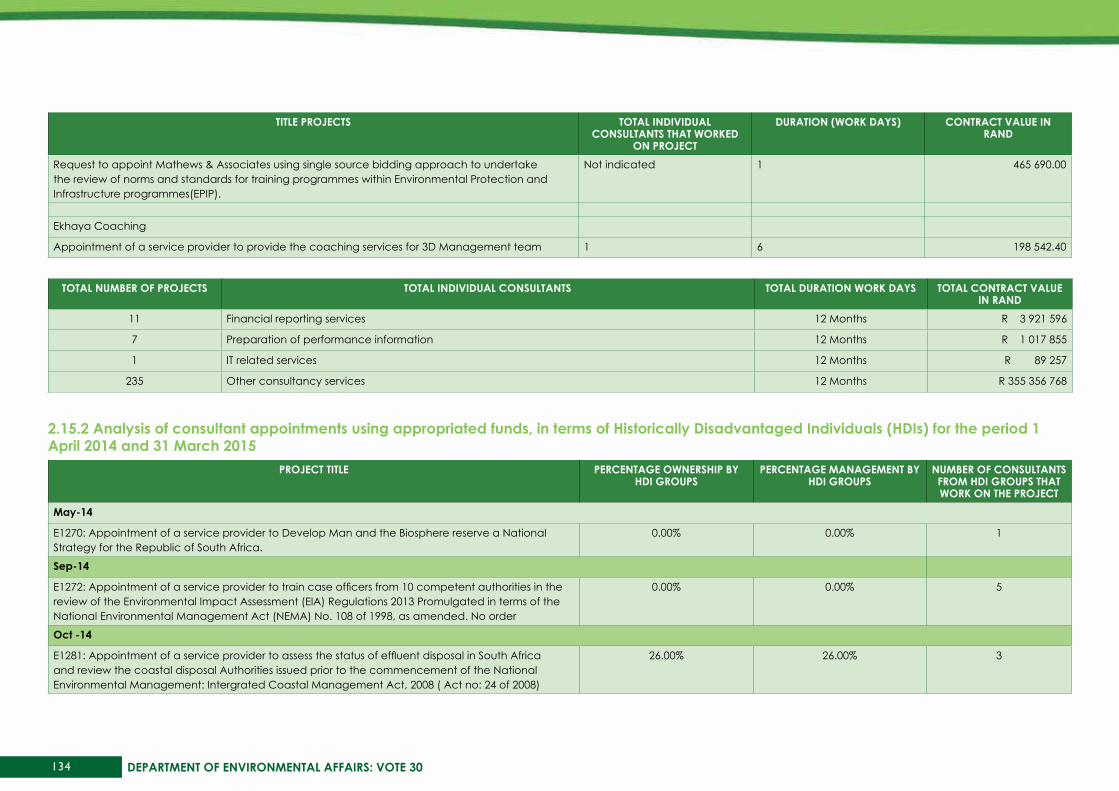
134 DEPARTMENT OF ENVIRONMENTAL AFFAIRS: VOTE 30
TITLE PROjECTs TOTAL INdIVIduAL CONsuLTANTs ThAT wORkEd
ON PROjECT
duRATION (wORk dAys) CONTRACT VALuE IN RANd
Request to appoint Mathews & Associates using single source bidding approach to undertake the review of norms and standards for training programmes within Environmental Protection and Infrastructure programmes(EPIP).
Not indicated 1 465 690.00
Ekhaya Coaching
Appointment of a service provider to provide the coaching services for 3D Management team 1 6 198 542.40
TOTAL NuMbER OF PROjECTs TOTAL INdIVIduAL CONsuLTANTs TOTAL duRATION wORk dAys TOTAL CONTRACT VALuE IN RANd
11 Financial reporting services 12 Months R 3 921 596
7 Preparation of performance information 12 Months R 1 017 855
1 IT related services 12 Months R 89 257
235 Other consultancy services 12 Months R 355 356 768
2.15.2 Analysis of consultant appointments using appropriated funds, in terms of historically disadvantaged Individuals (hdIs) for the period 1 April 2014 and 31 March 2015
PROjECT TITLE PERCENTAGE OwNERshIP by hdI GROuPs
PERCENTAGE MANAGEMENT by hdI GROuPs
NuMbER OF CONsuLTANTs FROM hdI GROuPs ThAT wORk ON ThE PROjECT
May-14
E1270: Appointment of a service provider to Develop Man and the Biosphere reserve a National Strategy for the Republic of South Africa.
0.00% 0.00% 1
sep-14
E1272: Appointment of a service provider to train case officers from 10 competent authorities in the review of the Environmental Impact Assessment (EIA) Regulations 2013 Promulgated in terms of the National Environmental Management Act (NEMA) No. 108 of 1998, as amended. No order
0.00% 0.00% 5
Oct -14
E1281: Appointment of a service provider to assess the status of effluent disposal in South Africa and review the coastal disposal Authorities issued prior to the commencement of the National Environmental Management: Intergrated Coastal Management Act, 2008 ( Act no: 24 of 2008)
26.00% 26.00% 3

135Annual Report 2014/15
PROjECT TITLE PERCENTAGE OwNERshIP by hdI GROuPs
PERCENTAGE MANAGEMENT by hdI GROuPs
NuMbER OF CONsuLTANTs FROM hdI GROuPs ThAT wORk ON ThE PROjECT
Nov-14
E1273: Appointment of a service provider for the mass rear, supply and deliver specified biological control agents for identified invasive alien plants for the Natural Resource management Programmes for a period of three years and five months.
0.00% 0.00% 1
dec-14
E1287: Appointment of a suitable service provider to render services to the Department of Environmental Affairs by conducting research in phase 1 of desertification, land degrading and drought (DLDD) land cover mapping impact indicator of the United Nations convention combat desertification (UNCCD) in order to determine the current status of land degradation and the rate of change from 2009 to 2013 as part of the drylands research programme in South Africa.
0.00% 15.00% 3
FEb-15
E1290: The appointment of a suitable independent service provider to assist the Department of Environmental Affairs (DEA) in implementing Phase I of a project to develop, populate and maintain a complete, current and accurate catalogue of metadata on all of the significant information and knowledge management systems relating to the environmental management system, natural resources and natural resource quality, pollution release and transfer, land use and land use change, etc.
50.00% 50.00% 3

136 DEPARTMENT OF ENVIRONMENTAL AFFAIRS: VOTE 30
PART E FINANCIAL INFORMATION

137Annual Report 2014/15
REPORT OF ThE AudITOR-GENERAL TO PARLIAMENT ON VOTE NO. 30: dEPARTMENT OF ENVIRONMENTAL AFFAIRs REPORT ON ThE FINANCIAL sTATEMENTs
REPORT ON ThE FINANCIAL sTATEMENT
Introduction
1. I have audited the financial statements of the Department of Environmental Affairs set out on pages 141 to 247, which comprise the appropriation statement, the statement of financial position as at 31 March 2015, the statement of financial performance, statement of changes in net assets, and cash flow statement and for the year then ended, as well as the notes, comprising a summary of significant accounting policies and other explanatory information.
Accounting officer’s responsibility for the financial statements
2. The accounting officer is responsible for the preparation and fair presentation of these financial statements in accordance with Modified Cash Standard and the requirements of the Public Finance Management Act of South Africa, 1999 (Act No. 1 of 1999) (PFMA), and for such internal control as the accounting officer determines is necessary to enable the preparation of financial statements that are free from material misstatement, whether due to fraud or error.
Auditor-general’s responsibility
3. My responsibility is to express an opinion on these financial statements based on my audit. I conducted my audit in accordance with International Standards on Auditing. Those standards require that I comply with ethical requirements, and plan and perform the audit to obtain reasonable assurance about whether the financial statements are free from material misstatement.
4. An audit involves performing procedures to obtain audit evidence about the amounts and disclosures in the financial statements. The procedures selected depend on the auditor’s judgement, including the assessment of the risks of material misstatement of the financial statements, whether due to fraud or error. In making those risk assessments, the auditor considers internal control relevant to the entity’s preparation and fair presentation of the financial statements in order to design audit procedures that are appropriate in the circumstances, but not for the purpose of expressing an opinion on the effectiveness of the entity’s internal control. An audit also includes evaluating the appropriateness of accounting policies used and the reasonableness of accounting estimates made by management, as well as evaluating the overall presentation of the financial statements.
5. I believe that the audit evidence I have obtained is sufficient and appropriate to provide a basis for my audit opinion.
Opinion
6. In my opinion, the financial statements present fairly, in all material respects, the financial position of the Department of Environmental Affairs as at 31 March 2015 and its financial performance and cash flows for the year then ended, in accordance with the Modified Cash Standard and the requirements of the PFMA.
Emphasis of matter
7. I draw attention to the matter below. My opinion is not modified in respect of this matter.
Financial reporting framework
8. As disclosed in the accounting policy note 16.1 to the financial statements, the National Treasury has exempted the department from applying the Modified Cash Standard in respect of infrastructure development projects for the reasons indicated.

138 DEPARTMENT OF ENVIRONMENTAL AFFAIRS: VOTE 30
Additional matter
9. I draw attention to the matters below. My opinion is not modified in respect of these matters.
Financial reporting framework
10. In accordance with the International Standards on Auditing, the wording of my opinion should not include the phrase “fairly present” when a departure to the applicable financial reporting framework has been granted in terms of the PFMA and where the aim of such a departure was not to achieve fair presentation. However, section 20(2)(a) of the PAA, requires me to reflect whether the financial statements “fairly present”, in all material respects, the financial position and results of its operations and cash flows for the period in accordance with the applicable financial reporting framework. The wording of my opinion is therefore worded as such.
unaudited supplementary schedules
11. The supplementary information set out on pages 235 to 247 does not form part of the financial statements and is presented as additional information. I have not audited these schedules and, accordingly, I do not report thereon.
Report on other legal and regulatory requirements
12. In accordance with the Public Audit Act of South Africa, 2004 (Act No. 25 of 2004) and the general notice issued in terms thereof, I have a responsibility to report findings on the reported performance information against predetermined objectives for selected programmes presented in the annual performance report, non-compliance with legislation and internal control. The objective of my tests was to identify reportable findings as described under each subheading but not to gather evidence to express assurance on these matters. Accordingly, I do not express an opinion or conclusion on these matters.
Predetermined objectives
13. I performed procedures to obtain evidence about the usefulness and reliability of the reported performance information for the following selected programmes presented in the annual performance report of the department for the year ended 31 March 2015:
• Programme 3: Oceans and Coasts on pages 51 to 55
• Programme 4: Climate Change and Air Quality on pages 56 to 61
• Programme 6: Environmental Programmes on pages 71 to 77
14. I evaluated the reported performance information against the overall criteria of usefulness and reliability.
15. I evaluated the usefulness of the reported performance information to determine whether it was presented in accordance with the National Treasury’s annual reporting principles and whether the reported performance was consistent with the planned programmes. I further performed tests to determine whether indicators and targets were well defined, verifiable, specific, measurable, time bound and relevant, as required by the National Treasury’s Framework for managing programme performance information (FMPPI).
16. I assessed the reliability of the reported performance information to determine whether it was valid, accurate and complete.
17. I did not identify any material findings on the usefulness and reliability of the reported performance information for the following programmes:
• Oceans and Coasts
• Climate Change and Air Quality
• Environmental Programmes
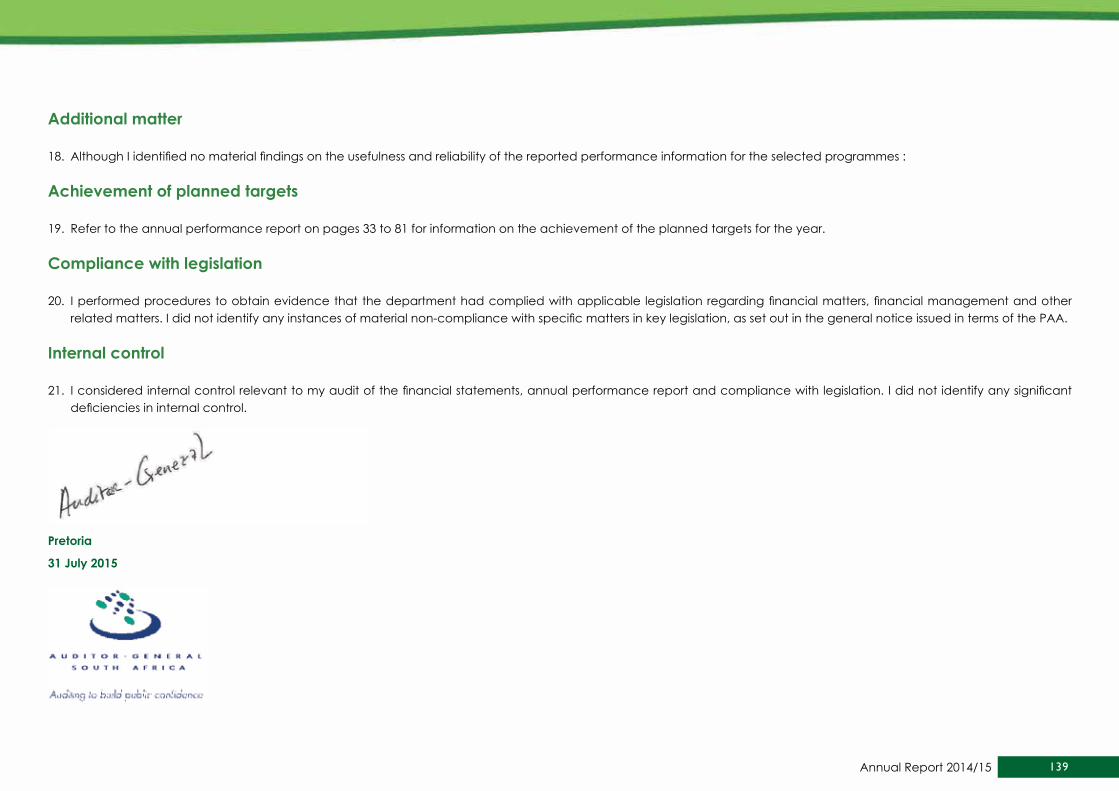
139Annual Report 2014/15
Additional matter
18. Although I identified no material findings on the usefulness and reliability of the reported performance information for the selected programmes :
Achievement of planned targets
19. Refer to the annual performance report on pages 33 to 81 for information on the achievement of the planned targets for the year.
Compliance with legislation
20. I performed procedures to obtain evidence that the department had complied with applicable legislation regarding financial matters, financial management and other related matters. I did not identify any instances of material non-compliance with specific matters in key legislation, as set out in the general notice issued in terms of the PAA.
Internal control
21. I considered internal control relevant to my audit of the financial statements, annual performance report and compliance with legislation. I did not identify any significant deficiencies in internal control.
Pretoria
31 july 2015
140 DEPARTMENT OF ENVIRONMENTAL AFFAIRS: VOTE 30
2014/15 ANNuAL FINANCIAL sTATEMENTsdEPARTMENT OF ENVIRONMENTAL AFFAIRs
VOTE 30
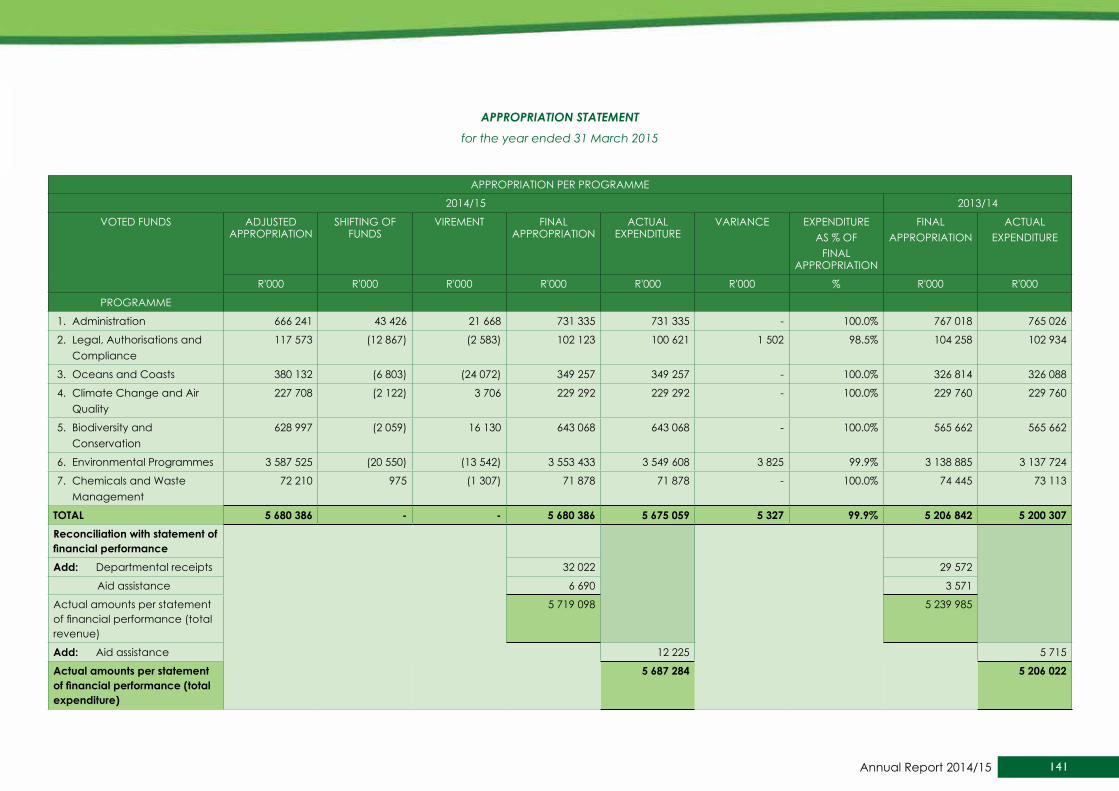
141Annual Report 2014/15
APPROPRIATION STATEMENTfor the year ended 31 March 2015
APPROPRIATION PER PROGRAMME
2014/15 2013/14
VOTED FUNDS ADJUSTED APPROPRIATION
SHIFTING OF FUNDS
VIREMENT FINAL APPROPRIATION
ACTUAL EXPENDITURE
VARIANCE EXPENDITUREAS % OF
FINAL APPROPRIATION
FINALAPPROPRIATION
ACTUALEXPENDITURE
R'000 R'000 R'000 R'000 R'000 R'000 % R'000 R'000
PROGRAMME
1. Administration 666 241 43 426 21 668 731 335 731 335 - 100.0% 767 018 765 026
2. Legal, Authorisations and Compliance
117 573 (12 867) (2 583) 102 123 100 621 1 502 98.5% 104 258 102 934
3. Oceans and Coasts 380 132 (6 803) (24 072) 349 257 349 257 - 100.0% 326 814 326 088
4. Climate Change and Air Quality
227 708 (2 122) 3 706 229 292 229 292 - 100.0% 229 760 229 760
5. Biodiversity and Conservation
628 997 (2 059) 16 130 643 068 643 068 - 100.0% 565 662 565 662
6. Environmental Programmes 3 587 525 (20 550) (13 542) 3 553 433 3 549 608 3 825 99.9% 3 138 885 3 137 724
7. Chemicals and Waste Management
72 210 975 (1 307) 71 878 71 878 - 100.0% 74 445 73 113
TOTAL 5 680 386 - - 5 680 386 5 675 059 5 327 99.9% 5 206 842 5 200 307Reconciliation with statement of financial performanceAdd: Departmental receipts 32 022 29 572
Aid assistance 6 690 3 571
Actual amounts per statement of financial performance (total revenue)
5 719 098 5 239 985
Add: Aid assistance 12 225 5 715
Actual amounts per statement of financial performance (total expenditure)
5 687 284 5 206 022

142 DEPARTMENT OF ENVIRONMENTAL AFFAIRS: VOTE 30
APPROPRIATION STATEMENTfor the year ended 31 March 2015
Appropriation per economic classification2014/15 2013/14
ECONOMIC CLAssIFICATION
AdjusTEd APPROPRIATION
shIFTING OF FuNds
VIREMENT FINAL APPROPRIATION
ACTuAL EXPENdITuRE
VARIANCE EXPENdITuREAs % OF
FINAL APPROPRIATION
FINALAPPROPRIATION
ACTuALEXPENdITuRE
R'000 R'000 R'000 R'000 R'000 R'000 % R'000 R'000Current payments 1 869 439 (10 308) (211 596) 1 647 535 1 642 307 5 228 99.7% 1 537 116 1 532 226Compensation of employees 798 801 (8 000) - 790 801 787 791 3 010 99.6% 662 120 659 222
Salaries and wages 748 048 (44 667) - 703 381 700 371 3 010 99.6% 595 357 592 459
Social contributions 50 753 36 667 - 87 420 87 420 - 100.0% 66 763 66 763
Goods and services 1 070 638 (2 308) (211 596) 856 734 854 516 2 218 99.7% 874 996 873 004
Administrative fees 3 835 (2 406) - 1 429 1 429 - 100.0% 1 607 1 607
Advertising 34 723 (19 773) (536) 14 414 14 414 - 100.0% 27 264 27 264
Minor assets 9 931 (8 315) - 1 616 1 616 - 100.0% 2 518 2 518
Audit costs: External 7 375 (1 514) - 5 861 5 861 - 100.0% 8 077 8 077
Bursaries: Employees 2 069 (757) - 1 312 1 312 - 100.0% 1 739 1 739
Catering: Departmental activities
5 472 (392) - 5 080 5 080 - 100.0% 4 021 4 021
Communication (G&S) 27 004 (9 676) - 17 328 17 328 - 100.0% 17 388 17 388
Computer services 31 945 5 738 468 38 151 35 933 2 218 94.2% 52 691 52 691
Consultants: Business and advisory services
93 933 (2 357) (9 281) 82 295 82 295 - 100.0% 112 570 112 570
Infrastructure and planning services
72 125 (13 671) (58 454) - - - - - -
Laboratory services 1 094 (1 049) - 45 45 - 100.0% 13 13
Legal services 2 109 1 419 - 3 528 3 528 - 100.0% 6 490 6 490
Contractors 55 509 41 998 - 97 507 97 507 - 100.0% 101 672 101 672
Agency and support / outsourced services
320 325 (6 658) (136 654) 177 013 177 013 - 100.0% 137 143 137 143

143Annual Report 2014/15
Appropriation per economic classification2014/15 2013/14
ECONOMIC CLAssIFICATION
AdjusTEd APPROPRIATION
shIFTING OF FuNds
VIREMENT FINAL APPROPRIATION
ACTuAL EXPENdITuRE
VARIANCE EXPENdITuREAs % OF
FINAL APPROPRIATION
FINALAPPROPRIATION
ACTuALEXPENdITuRE
R'000 R'000 R'000 R'000 R'000 R'000 % R'000 R'000Entertainment 647 (562) - 85 85 - 100.0% 307 307
Fleet services (Including Government motor transport)
- 9 199 - 9 199 9 199 - 100.0% 17 399 17 399
Inventory: Food and food supplies
3 950 (3 923) - 27 27 - 100.0% 407 407
Inventory: Fuel, oil and gas 38 001 (22 407) - 15 594 15 594 - 100.0% 17 381 17 381
Inventory: Learner and teacher support material
680 (680) - - - - - - -
Inventory: Materials and supplies
1 596 (1 588) - 8 8 - 100.0% 20 20
Inventory: Medical supplies 3 660 (3 659) - 1 1 - 100.0% 79 79
Inventory: Medicine 390 (390) - - - - - - -
Inventory: Other supplies 5 372 (5 370) - 2 2 - 100.0% 2 2
Consumable supplies 9 700 6 329 (3 044) 12 985 12 985 - 100.0% 20 681 20 681
Consumable: Stationery, printing and office supplies
11 973 (3 660) - 8 313 8 313 - 100.0% 6 789 6 789
Operating leases 67 277 (1 943) 11 329 76 663 76 663 - 100.0% 69 787 67 795
Property payments 9 000 10 135 (3 203) 15 932 15 932 - 100.0% 14 927 14 927
Transport provided: Departmental activity
46 306 - 352 352 - 100.0% 946 946
Travel and subsistence 144 539 21 046 4 299 169 884 169 884 - 100.0% 140 387 140 387
Training and development 25 847 3 927 (14 473) 15 301 15 301 - 100.0% 12 465 12 465
Operating payments 49 165 2 647 (1 746) 50 066 50 066 - 100.0% 58 199 58 199
APPROPRIATION STATEMENTfor the year ended 31 March 2015
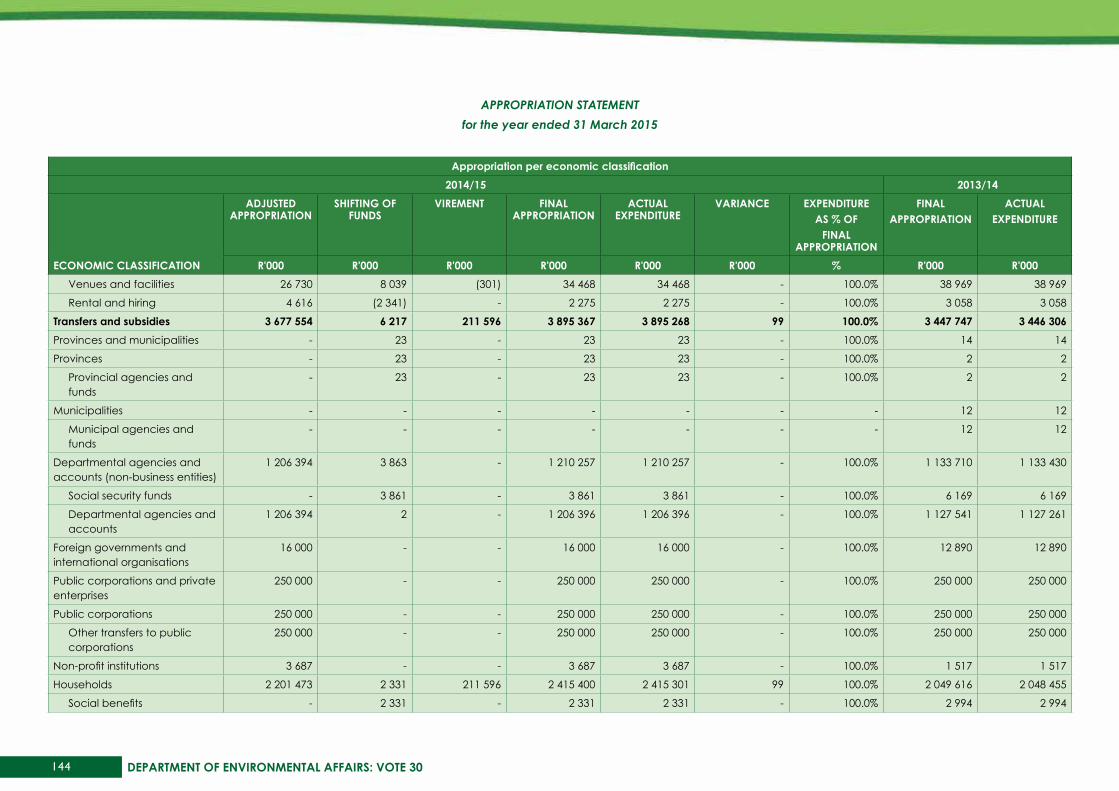
144 DEPARTMENT OF ENVIRONMENTAL AFFAIRS: VOTE 30
Appropriation per economic classification2014/15 2013/14
ECONOMIC CLAssIFICATION
AdjusTEd APPROPRIATION
shIFTING OF FuNds
VIREMENT FINAL APPROPRIATION
ACTuAL EXPENdITuRE
VARIANCE EXPENdITuREAs % OF
FINAL APPROPRIATION
FINALAPPROPRIATION
ACTuALEXPENdITuRE
R'000 R'000 R'000 R'000 R'000 R'000 % R'000 R'000Venues and facilities 26 730 8 039 (301) 34 468 34 468 - 100.0% 38 969 38 969
Rental and hiring 4 616 (2 341) - 2 275 2 275 - 100.0% 3 058 3 058
Transfers and subsidies 3 677 554 6 217 211 596 3 895 367 3 895 268 99 100.0% 3 447 747 3 446 306Provinces and municipalities - 23 - 23 23 - 100.0% 14 14
Provinces - 23 - 23 23 - 100.0% 2 2
Provincial agencies and funds
- 23 - 23 23 - 100.0% 2 2
Municipalities - - - - - - - 12 12
Municipal agencies and funds
- - - - - - - 12 12
Departmental agencies and accounts (non-business entities)
1 206 394 3 863 - 1 210 257 1 210 257 - 100.0% 1 133 710 1 133 430
Social security funds - 3 861 - 3 861 3 861 - 100.0% 6 169 6 169
Departmental agencies and accounts
1 206 394 2 - 1 206 396 1 206 396 - 100.0% 1 127 541 1 127 261
Foreign governments and international organisations
16 000 - - 16 000 16 000 - 100.0% 12 890 12 890
Public corporations and private enterprises
250 000 - - 250 000 250 000 - 100.0% 250 000 250 000
Public corporations 250 000 - - 250 000 250 000 - 100.0% 250 000 250 000
Other transfers to public corporations
250 000 - - 250 000 250 000 - 100.0% 250 000 250 000
Non-profit institutions 3 687 - - 3 687 3 687 - 100.0% 1 517 1 517
Households 2 201 473 2 331 211 596 2 415 400 2 415 301 99 100.0% 2 049 616 2 048 455
Social benefits - 2 331 - 2 331 2 331 - 100.0% 2 994 2 994
APPROPRIATION STATEMENTfor the year ended 31 March 2015

145Annual Report 2014/15
Appropriation per economic classification2014/15 2013/14
ECONOMIC CLAssIFICATION
AdjusTEd APPROPRIATION
shIFTING OF FuNds
VIREMENT FINAL APPROPRIATION
ACTuAL EXPENdITuRE
VARIANCE EXPENdITuREAs % OF
FINAL APPROPRIATION
FINALAPPROPRIATION
ACTuALEXPENdITuRE
R'000 R'000 R'000 R'000 R'000 R'000 % R'000 R'000Other transfers to households 2 201 473 - 211 596 2 413 069 2 412 970 99 100.0% 2 046 622 2 045 461
Payments for capital assets 133 393 3 690 - 137 083 137 083 - 100.0% 221 823 221 619Buildings and other fixed structures
90 000 13 191 - 103 191 103 191 - 100.0% 174 708 174 708
Buildings 72 000 31 191 - 103 191 103 191 - 100.0% 174 397 174 397
Other fixed structures 18 000 (18 000) - - - - - 311 311
Machinery and equipment 43 393 (19 820) - 23 573 23 573 - 100.0% 45 843 45 639
Transport equipment 1 125 4 732 - 5 857 5 857 - 100.0% 24 910 24 910
Other machinery and equipment
42 268 (24 552) - 17 716 17 716 - 100.0% 20 933 20 729
Software and other intangible assets
- 10 319 - 10 319 10 319 - 100.0% 1 272 1 272
Payments for financial assets - 401 - 401 401 - 100.0% 156 156TOTAL 5 680 386 - - 5 680 386 5 675 059 5 327 99.9% 5 206 842 5 200 307
APPROPRIATION STATEMENTfor the year ended 31 March 2015
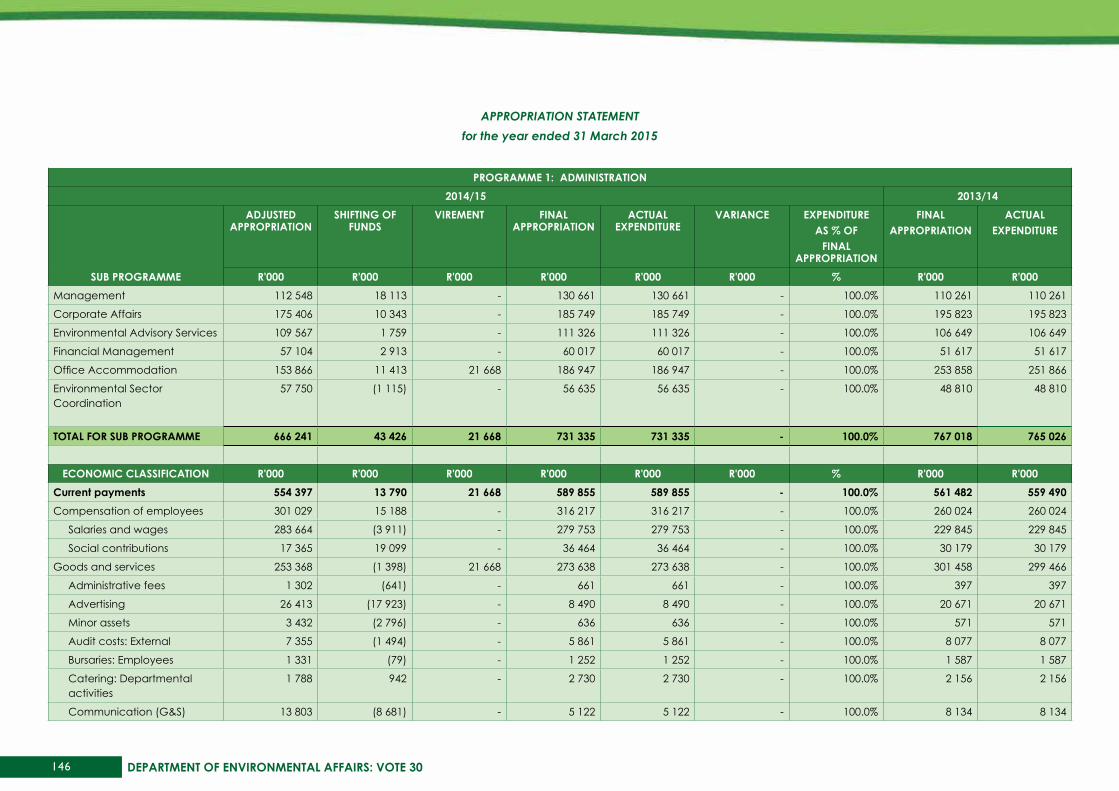
146 DEPARTMENT OF ENVIRONMENTAL AFFAIRS: VOTE 30
PROGRAMME 1: AdMINIsTRATION2014/15 2013/14
sub PROGRAMME
AdjusTEd APPROPRIATION
shIFTING OF FuNds
VIREMENT FINAL APPROPRIATION
ACTuAL EXPENdITuRE
VARIANCE EXPENdITuREAs % OF
FINAL APPROPRIATION
FINALAPPROPRIATION
ACTuALEXPENdITuRE
R'000 R'000 R'000 R'000 R'000 R'000 % R'000 R'000Management 112 548 18 113 - 130 661 130 661 - 100.0% 110 261 110 261
Corporate Affairs 175 406 10 343 - 185 749 185 749 - 100.0% 195 823 195 823
Environmental Advisory Services 109 567 1 759 - 111 326 111 326 - 100.0% 106 649 106 649
Financial Management 57 104 2 913 - 60 017 60 017 - 100.0% 51 617 51 617
Office Accommodation 153 866 11 413 21 668 186 947 186 947 - 100.0% 253 858 251 866
Environmental Sector Coordination
57 750 (1 115) - 56 635 56 635 - 100.0% 48 810 48 810
TOTAL FOR sub PROGRAMME 666 241 43 426 21 668 731 335 731 335 - 100.0% 767 018 765 026
ECONOMIC CLAssIFICATION R'000 R'000 R'000 R'000 R'000 R'000 % R'000 R'000Current payments 554 397 13 790 21 668 589 855 589 855 - 100.0% 561 482 559 490Compensation of employees 301 029 15 188 - 316 217 316 217 - 100.0% 260 024 260 024
Salaries and wages 283 664 (3 911) - 279 753 279 753 - 100.0% 229 845 229 845
Social contributions 17 365 19 099 - 36 464 36 464 - 100.0% 30 179 30 179
Goods and services 253 368 (1 398) 21 668 273 638 273 638 - 100.0% 301 458 299 466
Administrative fees 1 302 (641) - 661 661 - 100.0% 397 397
Advertising 26 413 (17 923) - 8 490 8 490 - 100.0% 20 671 20 671
Minor assets 3 432 (2 796) - 636 636 - 100.0% 571 571
Audit costs: External 7 355 (1 494) - 5 861 5 861 - 100.0% 8 077 8 077
Bursaries: Employees 1 331 (79) - 1 252 1 252 - 100.0% 1 587 1 587
Catering: Departmental activities
1 788 942 - 2 730 2 730 - 100.0% 2 156 2 156
Communication (G&S) 13 803 (8 681) - 5 122 5 122 - 100.0% 8 134 8 134
APPROPRIATION STATEMENTfor the year ended 31 March 2015
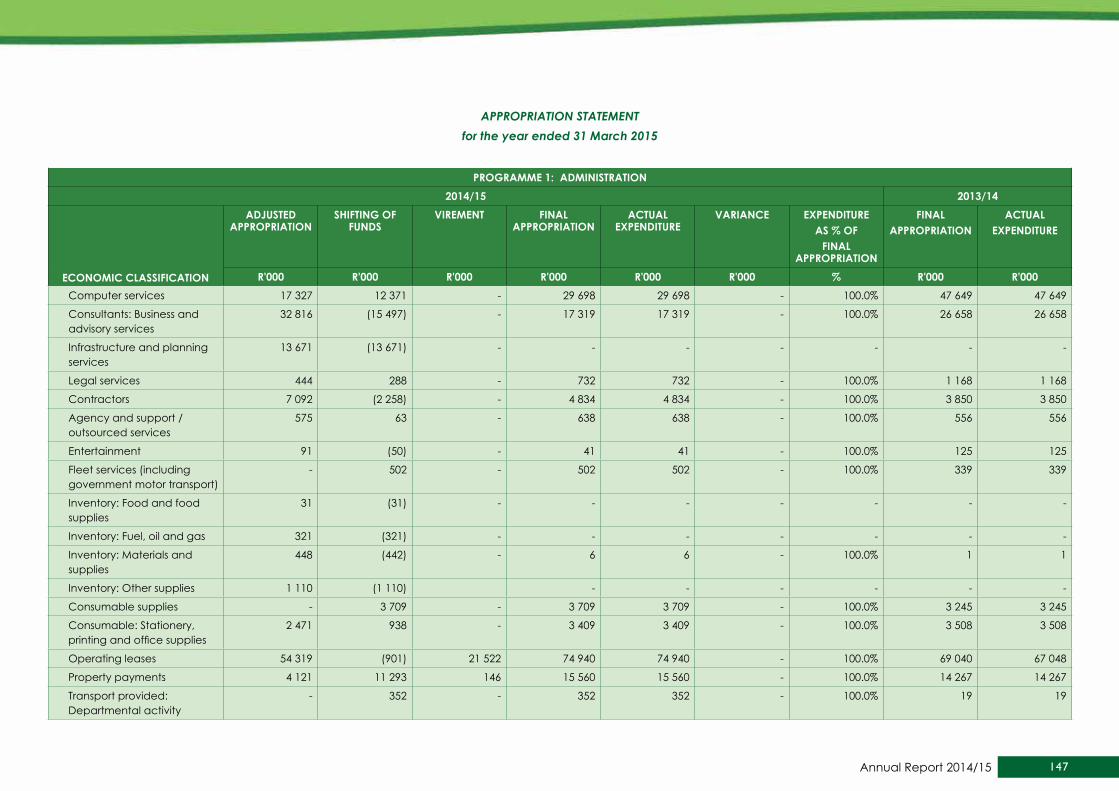
147Annual Report 2014/15
PROGRAMME 1: AdMINIsTRATION2014/15 2013/14
sub PROGRAMME
AdjusTEd APPROPRIATION
shIFTING OF FuNds
VIREMENT FINAL APPROPRIATION
ACTuAL EXPENdITuRE
VARIANCE EXPENdITuREAs % OF
FINAL APPROPRIATION
FINALAPPROPRIATION
ACTuALEXPENdITuRE
R'000 R'000 R'000 R'000 R'000 R'000 % R'000 R'000Computer services 17 327 12 371 - 29 698 29 698 - 100.0% 47 649 47 649
Consultants: Business and advisory services
32 816 (15 497) - 17 319 17 319 - 100.0% 26 658 26 658
Infrastructure and planning services
13 671 (13 671) - - - - - - -
Legal services 444 288 - 732 732 - 100.0% 1 168 1 168
Contractors 7 092 (2 258) - 4 834 4 834 - 100.0% 3 850 3 850
Agency and support / outsourced services
575 63 - 638 638 - 100.0% 556 556
Entertainment 91 (50) - 41 41 - 100.0% 125 125
Fleet services (including government motor transport)
- 502 - 502 502 - 100.0% 339 339
Inventory: Food and food supplies
31 (31) - - - - - - -
Inventory: Fuel, oil and gas 321 (321) - - - - - - -
Inventory: Materials and supplies
448 (442) - 6 6 - 100.0% 1 1
Inventory: Other supplies 1 110 (1 110) - - - - - -
Consumable supplies - 3 709 - 3 709 3 709 - 100.0% 3 245 3 245
Consumable: Stationery, printing and office supplies
2 471 938 - 3 409 3 409 - 100.0% 3 508 3 508
Operating leases 54 319 (901) 21 522 74 940 74 940 - 100.0% 69 040 67 048
Property payments 4 121 11 293 146 15 560 15 560 - 100.0% 14 267 14 267
Transport provided: Departmental activity
- 352 - 352 352 - 100.0% 19 19
APPROPRIATION STATEMENTfor the year ended 31 March 2015
ECONOMIC CLAssIFICATION

148 DEPARTMENT OF ENVIRONMENTAL AFFAIRS: VOTE 30
PROGRAMME 1: AdMINIsTRATION2014/15 2013/14
sub PROGRAMME
AdjusTEd APPROPRIATION
shIFTING OF FuNds
VIREMENT FINAL APPROPRIATION
ACTuAL EXPENdITuRE
VARIANCE EXPENdITuREAs % OF
FINAL APPROPRIATION
FINALAPPROPRIATION
ACTuALEXPENdITuRE
R'000 R'000 R'000 R'000 R'000 R'000 % R'000 R'000Travel and subsistence 35 421 17 966 - 53 387 53 387 - 100.0% 38 219 38 219
Training and development 3 365 7 181 - 10 546 10 546 - 100.0% 8 318 8 318
Operating payments 11 848 6 878 - 18 726 `18 726 - 100.0% 22 890 22 890
Venues and facilities 7 978 5 628 - 13 606 13 606 - 100.0% 18 136 18 136
Rental and hiring 4 495 (3 614) - 881 881 - 100.0% 1 877 1 877
Transfers and subsidies 16 000 1 225 - 17 225 17 225 - 100.0% 14 311 14 311Provinces and municipalities - 16 - 16 16 - 100.0% 13 13
Provinces - 16 - 16 16 - 100.0% 1 1
Provincial agencies and funds
- 16 - 16 16 - 100.0% 1 1
Municipalities - - - - - - - 12 12
Municipal agencies and funds
- - - - - - - 12 12
Departmental agencies and accounts
- 22 - 22 22 - 100.0% - -
Social security funds - 20 - 20 20 - 100.0% - -
Departmental agencies (non-business entities)
- 2 - 2 2 - 100.0% - -
Foreign governments and international organisations
16 000 - - 16 000 16 000 - 100.0% 12 890 12 890
Households - 1 187 - 1 187 1 187 - 100.0% 1 408 1 408
Social benefits - 1 187 - 1 187 1 187 - 100.0% 1 408 1 408
Payments for capital assets 95 844 28 249 - 124 093 124 093 - 100.0% 191 161 191 161
APPROPRIATION STATEMENTfor the year ended 31 March 2015
ECONOMIC CLAssIFICATION

149Annual Report 2014/15
PROGRAMME 1: AdMINIsTRATION2014/15 2013/14
sub PROGRAMME
AdjusTEd APPROPRIATION
shIFTING OF FuNds
VIREMENT FINAL APPROPRIATION
ACTuAL EXPENdITuRE
VARIANCE EXPENdITuREAs % OF
FINAL APPROPRIATION
FINALAPPROPRIATION
ACTuALEXPENdITuRE
R'000 R'000 R'000 R'000 R'000 R'000 % R'000 R'000Buildings and other fixed structures
90 000 13 191 - 103 191 103 191 - 100.0% 174 397 174 397
Buildings 72 000 31 191 - 103 191 103 191 - 100.0% 174 397 174 397
Other fixed structures 18 000 (18 000) - - - - - - -
Machinery and equipment 5 844 5 075 - 10 919 10 919 - 100.0% 15 506 15 506
Transport equipment 1 125 2 914 - 4 039 4 039 - 100.0% 5 838 5 838
Other machinery and equipment
4 719 2 161 - 6 880 6 880 - 100.0% 9 668 9 668
Software and other intangible assets
- 9 983 - 9 983 9 983 - 100.0% 1 258 1 258
Payments for financial assets - 162 - 162 162 - 100.0% 64 64TOTAL 666 241 43 426 21 668 731 335 731 335 - 100.0% 767 018 765 026
APPROPRIATION STATEMENTfor the year ended 31 March 2015
ECONOMIC CLAssIFICATION

150 DEPARTMENT OF ENVIRONMENTAL AFFAIRS: VOTE 30
1.1 MANAGEMENT2014/15 2013/14
ECONOMIC CLAssIFICATION
AdjusTEd APPROPRIATION
shIFTING OF FuNds
VIREMENT FINAL APPROPRIATION
ACTuAL EXPENdITuRE
VARIANCE EXPENdITuREAs % OF
FINAL APPROPRIATION
FINALAPPROPRIATION
ACTuALEXPENdITuRE
R'000 R'000 R'000 R'000 R'000 R'000 % R'000 R'000Current payments 109 802 19 332 - 129 134 129 134 - 100.0% 108 867 108 867
Compensation of employees 55 824 18 555 - 74 679 74 679 - 100.0% 51 317 51 317
Goods and services 53 978 477 - 54 455 54 455 - 100.0% 57 550 57 550
Transfers and subsidies - 121 - 121 121 - 100.0% 212 212
Provinces and municipalities - 1 - 1 1 - 100.0% - -
Households - 120 - 120 120 - 100.0% 212 212
Payments for capital assets 2 746 (1 406) - 1 340 1 340 - 100.0% 1 172 1 172
Machinery and equipment 2 746 (1 406) - 1 340 1 340 - 100.0% 1 172 1 172
Payments for financial assets 66 66 66 100.0% 10 10
TOTAL 112 548 18 113 - 130 661 130 661 - 100.0% 110 261 110 261
1.2 CORPORATE AFFAIRsECONOMIC CLAssIFICATION R'000 R'000 R'000 R'000 R'000 R'000 % R'000 R'000
Current payments 173 200 3 041 - 176 241 176 241 - 100.0% 183 277 183 277
Compensation of employees 111 862 (5 213) - 106 649 106 649 - 100.0% 87 863 87 863
Goods and services 61 338 8 254 - 69 592 69 592 - 100.0% 95 414 95 414
Transfers and subsidies - 879 - 879 879 - 100.0% 911 911
Provinces and municipalities - 15 - 15 15 - 100.0% 12 12
Departmental agencies and accounts
- 22 - 22 22 - 100.0% - -
Households - 842 - 842 842 - 100.0% 899 899
Payments for capital assets 2 206 6 341 - 8 547 8 547 - 100.0% 11 635 11 635
Machinery and equipment 2 206 5 597 - 7 803 7 803 - 100.0% 11 369 11 369
Software and other intangible assets
- 744 - 744 744 - 100.0% 266 266
Payments for financial assets - 82 82 82 - 100.0% - -
TOTAL 175 406 10 343 - 185 749 185 749 - 100.0% 195 823 195 823
APPROPRIATION STATEMENTfor the year ended 31 March 2015

151Annual Report 2014/15
1.3 ENVIRONMENTAL AdVIsORy sERVICEs2014/15 2013/14
ECONOMIC CLAssIFICATION
AdjusTEd APPROPRIATION
shIFTING OF FuNds
VIREMENT FINAL APPROPRIATION
ACTuAL EXPENdITuRE
VARIANCE EXPENdITuREAs % OF
FINAL APPROPRIATION
FINALAPPROPRIATION
ACTuALEXPENdITuRE
R'000 R'000 R'000 R'000 R'000 R'000 % R'000 R'000Current payments 93 346 (7 809) - 85 537 85 537 - 100.0% 91 972 91 972
Compensation of employees 52 755 (4 234) - 48 521 48 521 - 100.0% 47 964 47 964
Goods and services 40 591 (3 575 - 37 016 37 016 - 100.0% 44 008 44 008
Transfers and subsidies 16 000 19 - 16 019 16 019 - 100.0% 13 092 13 092Foreign governments and international organisations
16 000 - - 16 000 16 000 - 100.0% 12 890 12 890
Households - 19 - 19 19 - 100.0% 202 202
Payments for capital assets 221 9 547 - 9 768 9 768 - 100.0% 1 562 1 562Machinery and equipment 221 308 - 529 529 - 100.0% 570 570
Software and other intangible assets
- 9 239 - 9 239 9 239 - 100.0% 992 992
Payments for financial assets - 2 - 2 2 - 100.0% 23 23
TOTAL 109 567 1 759 - 111 326 111 326 - 100.0% 106 649 106 649
1.4 FINANCIAL MANAGEMEMTECONOMIC CLAssIFICATION R'000 R'000 R'000 R'000 R'000 R'000 % R'000 R'000
Current payments 56 709 2 006 - 58 715 58 715 - 100.0% 51 112 51 112
Compensation of employees 44 653 1 455 - 46 108 46 108 - 100.0% 38 763 38 763
Goods and services 12 056 551 - 12 607 12 607 - 100.0% 12 349 12 349
Transfers and subsidies - 164 - 164 164 - 100.0% 96 96
Provinces and municipalities - - - - - - - 1 1
Households - 164 - 164 164 - 100.0% 95 95
Payments for capital assets 395 739 - 1 134 1 134 - 100.0% 382 382
Machinery and equipment 395 739 - 1 134 1 134 - 100.0% 382 382
Payments for financial assets - 4 - 4 4 - 100.0% 27 27
TOTAL 57 104 2 913 - 60 017 60 017 - 100.0% 51 617 51 617
APPROPRIATION STATEMENTfor the year ended 31 March 2015
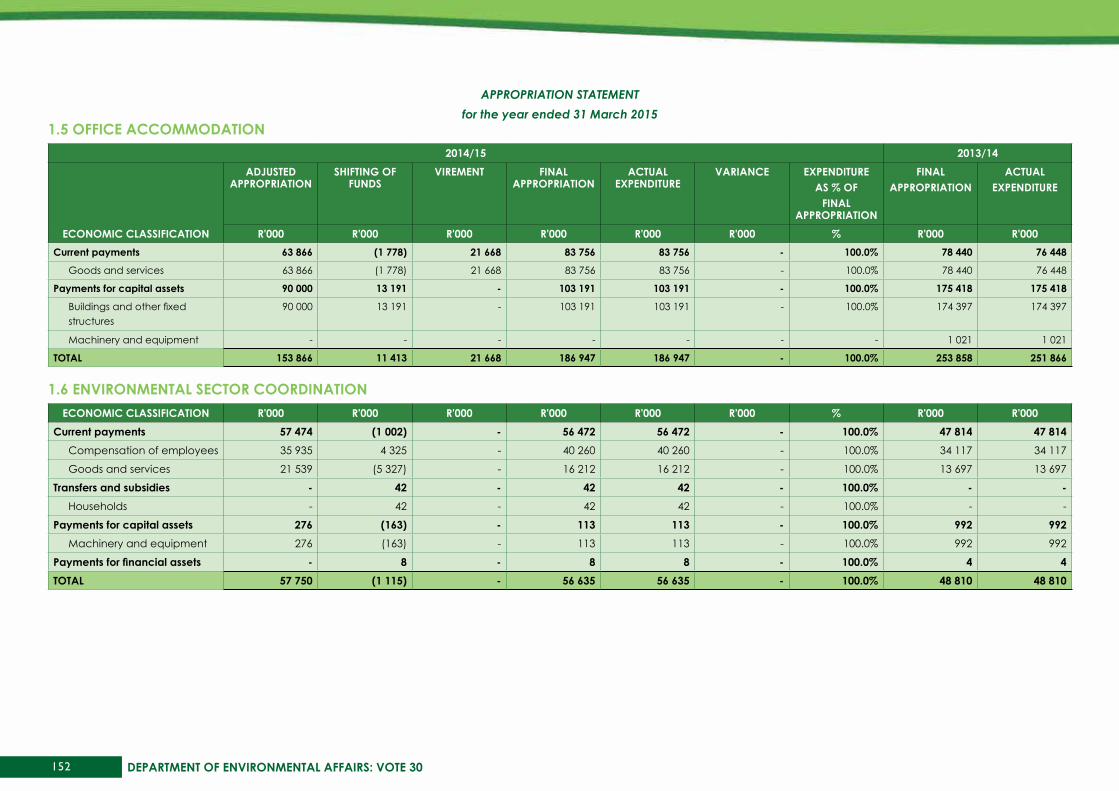
152 DEPARTMENT OF ENVIRONMENTAL AFFAIRS: VOTE 30
1.5 OFFICE ACCOMMOdATION2014/15 2013/14
ECONOMIC CLAssIFICATION
AdjusTEd APPROPRIATION
shIFTING OF FuNds
VIREMENT FINAL APPROPRIATION
ACTuAL EXPENdITuRE
VARIANCE EXPENdITuREAs % OF
FINAL APPROPRIATION
FINALAPPROPRIATION
ACTuALEXPENdITuRE
R'000 R'000 R'000 R'000 R'000 R'000 % R'000 R'000Current payments 63 866 (1 778) 21 668 83 756 83 756 - 100.0% 78 440 76 448
Goods and services 63 866 (1 778) 21 668 83 756 83 756 - 100.0% 78 440 76 448
Payments for capital assets 90 000 13 191 - 103 191 103 191 - 100.0% 175 418 175 418
Buildings and other fixed structures
90 000 13 191 - 103 191 103 191 - 100.0% 174 397 174 397
Machinery and equipment - - - - - - - 1 021 1 021
TOTAL 153 866 11 413 21 668 186 947 186 947 - 100.0% 253 858 251 866
1.6 ENVIRONMENTAL sECTOR COORdINATIONECONOMIC CLAssIFICATION R'000 R'000 R'000 R'000 R'000 R'000 % R'000 R'000
Current payments 57 474 (1 002) - 56 472 56 472 - 100.0% 47 814 47 814Compensation of employees 35 935 4 325 - 40 260 40 260 - 100.0% 34 117 34 117
Goods and services 21 539 (5 327) - 16 212 16 212 - 100.0% 13 697 13 697
Transfers and subsidies - 42 - 42 42 - 100.0% - -Households - 42 - 42 42 - 100.0% - -
Payments for capital assets 276 (163) - 113 113 - 100.0% 992 992Machinery and equipment 276 (163) - 113 113 - 100.0% 992 992
Payments for financial assets - 8 - 8 8 - 100.0% 4 4TOTAL 57 750 (1 115) - 56 635 56 635 - 100.0% 48 810 48 810
APPROPRIATION STATEMENTfor the year ended 31 March 2015
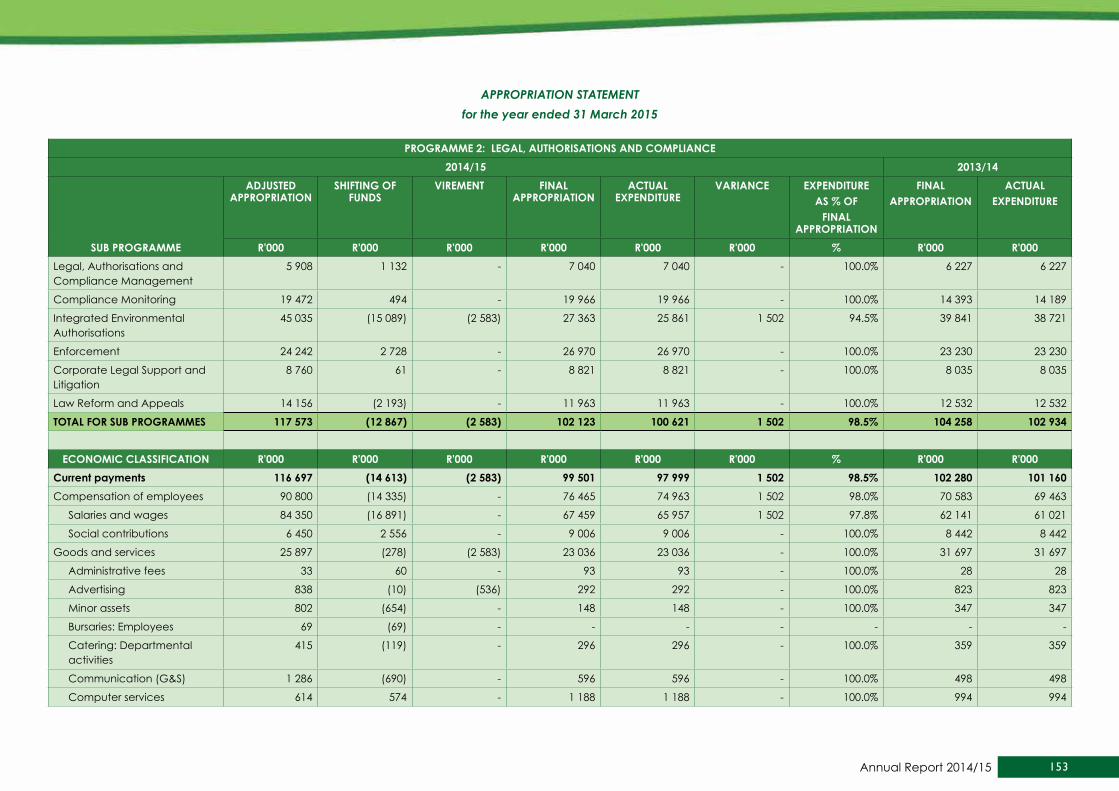
153Annual Report 2014/15
PROGRAMME 2: LEGAL, AuThORIsATIONs ANd COMPLIANCE2014/15 2013/14
sub PROGRAMME
AdjusTEd APPROPRIATION
shIFTING OF FuNds
VIREMENT FINAL APPROPRIATION
ACTuAL EXPENdITuRE
VARIANCE EXPENdITuREAs % OF
FINAL APPROPRIATION
FINALAPPROPRIATION
ACTuALEXPENdITuRE
R'000 R'000 R'000 R'000 R'000 R'000 % R'000 R'000Legal, Authorisations and Compliance Management
5 908 1 132 - 7 040 7 040 - 100.0% 6 227 6 227
Compliance Monitoring 19 472 494 - 19 966 19 966 - 100.0% 14 393 14 189
Integrated Environmental Authorisations
45 035 (15 089) (2 583) 27 363 25 861 1 502 94.5% 39 841 38 721
Enforcement 24 242 2 728 - 26 970 26 970 - 100.0% 23 230 23 230
Corporate Legal Support and Litigation
8 760 61 - 8 821 8 821 - 100.0% 8 035 8 035
Law Reform and Appeals 14 156 (2 193) - 11 963 11 963 - 100.0% 12 532 12 532
TOTAL FOR sub PROGRAMMEs 117 573 (12 867) (2 583) 102 123 100 621 1 502 98.5% 104 258 102 934
ECONOMIC CLAssIFICATION R'000 R'000 R'000 R'000 R'000 R'000 % R'000 R'000Current payments 116 697 (14 613) (2 583) 99 501 97 999 1 502 98.5% 102 280 101 160Compensation of employees 90 800 (14 335) - 76 465 74 963 1 502 98.0% 70 583 69 463
Salaries and wages 84 350 (16 891) - 67 459 65 957 1 502 97.8% 62 141 61 021
Social contributions 6 450 2 556 - 9 006 9 006 - 100.0% 8 442 8 442
Goods and services 25 897 (278) (2 583) 23 036 23 036 - 100.0% 31 697 31 697
Administrative fees 33 60 - 93 93 - 100.0% 28 28
Advertising 838 (10) (536) 292 292 - 100.0% 823 823
Minor assets 802 (654) - 148 148 - 100.0% 347 347
Bursaries: Employees 69 (69) - - - - - - -
Catering: Departmental activities
415 (119) - 296 296 - 100.0% 359 359
Communication (G&S) 1 286 (690) - 596 596 - 100.0% 498 498
Computer services 614 574 - 1 188 1 188 - 100.0% 994 994
APPROPRIATION STATEMENTfor the year ended 31 March 2015

154 DEPARTMENT OF ENVIRONMENTAL AFFAIRS: VOTE 30
PROGRAMME 2: LEGAL, AuThORIsATIONs ANd COMPLIANCE2014/15 2013/14
sub PROGRAMME
AdjusTEd APPROPRIATION
shIFTING OF FuNds
VIREMENT FINAL APPROPRIATION
ACTuAL EXPENdITuRE
VARIANCE EXPENdITuREAs % OF
FINAL APPROPRIATION
FINALAPPROPRIATION
ACTuALEXPENdITuRE
R'000 R'000 R'000 R'000 R'000 R'000 % R'000 R'000Consultants: Business and advisory services
2 698 (804) (740) 1 154 1 154 - 100.0% 13 092 13 092
Laboratory services - 45 - 45 45 - 100.0% 13 13
Legal services 1 115 562 - 1 677 1 677 - 100.0% 1 557 1 557
Contractors 597 (379) - 218 218 - 100.0% 177 177
Agency and support / outsourced services
- - - - - - - 5 5
Entertainment 39 (35) - 4 4 - 100.0% 5 5
Fleet services - 2 - 2 2 - 100.0% - -
Inventory: Food and food supplies
5 (5) - - - - - - -
Inventory: Other supplies 675 (675) - - - - - 1 1
Consumable supplies - 397 - 397 397 - 100.0% 256 256
Consumable: Stationery, printing and office supplies
1 112 (27) - 1 085 1 085 - 100.0% 264 264
Operating leases 213 (115) - 98 98 - 100.0% 76 76
Travel and subsistence 9 979 1 646 (567) 11 058 11 058 - 100.0% 9 707 9 707
Training and development 1 198 269 - 1 467 1 467 - 100.0% 609 609
Operating payments 2 241 (511) (439) 1 291 1 291 - 100.0% 902 902
Venues and facilities 1 968 259 (301) 1 926 1 926 - 100.0% 1 983 1 983
Rental and hiring - 1 - 1 1 - 100.0% 1 1
Transfers and subsidies - 204 - 204 204 - 100.0% 197 197Households - 204 - 204 204 - 100.0% 197 197
Social Benefits - 204 - 204 204 - 100.0% 197 197
Payments for capital assets 876 1 469 - 2 345 2 345 - 100.0% 1 762 1 558
ECONOMIC CLAssIFICATION
APPROPRIATION STATEMENTfor the year ended 31 March 2015

155Annual Report 2014/15
PROGRAMME 2: LEGAL, AuThORIsATIONs ANd COMPLIANCE2014/15 2013/14
sub PROGRAMME
AdjusTEd APPROPRIATION
shIFTING OF FuNds
VIREMENT FINAL APPROPRIATION
ACTuAL EXPENdITuRE
VARIANCE EXPENdITuREAs % OF
FINAL APPROPRIATION
FINALAPPROPRIATION
ACTuALEXPENdITuRE
R'000 R'000 R'000 R'000 R'000 R'000 % R'000 R'000Buildings and other fixed structures
- - - - - - - 311 311
Other fixed structures - - 311 311
Machinery and equipment 876 1 133 - 2 009 2 009 - 100.0% 1 451 1 247
Transport equipment - 333 - 333 333 - 100.0% - -
Other machinery and equipment
876 800 - 1 676 1 676 - 100.0% 1 451 1 247
Software and other intangible assets
- 336 - 336 336 - 100.0% - -
Payments for financial assets - 73 - 73 73 - 100.0% 19 19
TOTAL 117 573 (12 867) (2 583) 102 123 100 621 1 502 98.5% 104 258 102 934
ECONOMIC CLAssIFICATION
APPROPRIATION STATEMENTfor the year ended 31 March 2015

156 DEPARTMENT OF ENVIRONMENTAL AFFAIRS: VOTE 30
2.1 LEGAL, AuThORIsATIONs ANd COMPLIANCE MANAGEMENT2014/15 2013/14
ECONOMIC CLAssIFICATION
AdjusTEd APPROPRIATION
shIFTING OF FuNds
VIREMENT FINAL APPROPRIATION
ACTuAL EXPENdITuRE
VARIANCE EXPENdITuREAs % OF
FINAL APPROPRIATION
FINALAPPROPRIATION
ACTuALEXPENdITuRE
R'000 R'000 R'000 R'000 R'000 R'000 % R'000 R'000Current payments 5 862 751 - 6 613 6 613 - 100.0% 6 152 6 152
Compensation of employees 3 891 (75) - 3 816 3 816 - 100.0% 3 459 3 459
Goods and services 1 971 826 - 2 797 2 797 - 100.0% 2 693 2 693
Transfers and subsidies - - - - - - - 15 15
Households - - - - - - - 15 15
Payments for capital assets 46 381 - 427 427 - 100.0% 60 60
Machinery and equipment 46 381 - 427 427 - 100.0% 60 60
TOTAL 5 908 1 132 - 7 040 7 040 - 100.0% 6 227 6 227
2.2 COMPLIANCE MONITORINGECONOMIC CLAssIFICATION R'000 R'000 R'000 R'000 R'000 R'000 % R'000 R'000
Current payments 19 132 (179) - 18 953 18 953 - 100.0% 14 003 14 003
Compensation of employees 13 058 1 399 - 14 457 14 457 - 100.0% 10 927 10 927
Goods and services 6 074 (1 578) - 4 496 4 496 - 100.0% 3 076 3 076
Transfers and subsidies - 48 - 48 48 - 100.0% 57 57
Households - 48 - 48 48 - 100.0% 57 57
Payments for capital assets 340 617 - 957 957 - 100.0% 320 116
Machinery and equipment 340 617 - 957 957 - 100.0% 320 116
Payments for financial assets - 8 - 8 8 - 100.0% 13 13
TOTAL 19 472 494 - 19 966 19 966 - 100.0% 14 393 14 189
APPROPRIATION STATEMENTfor the year ended 31 March 2015
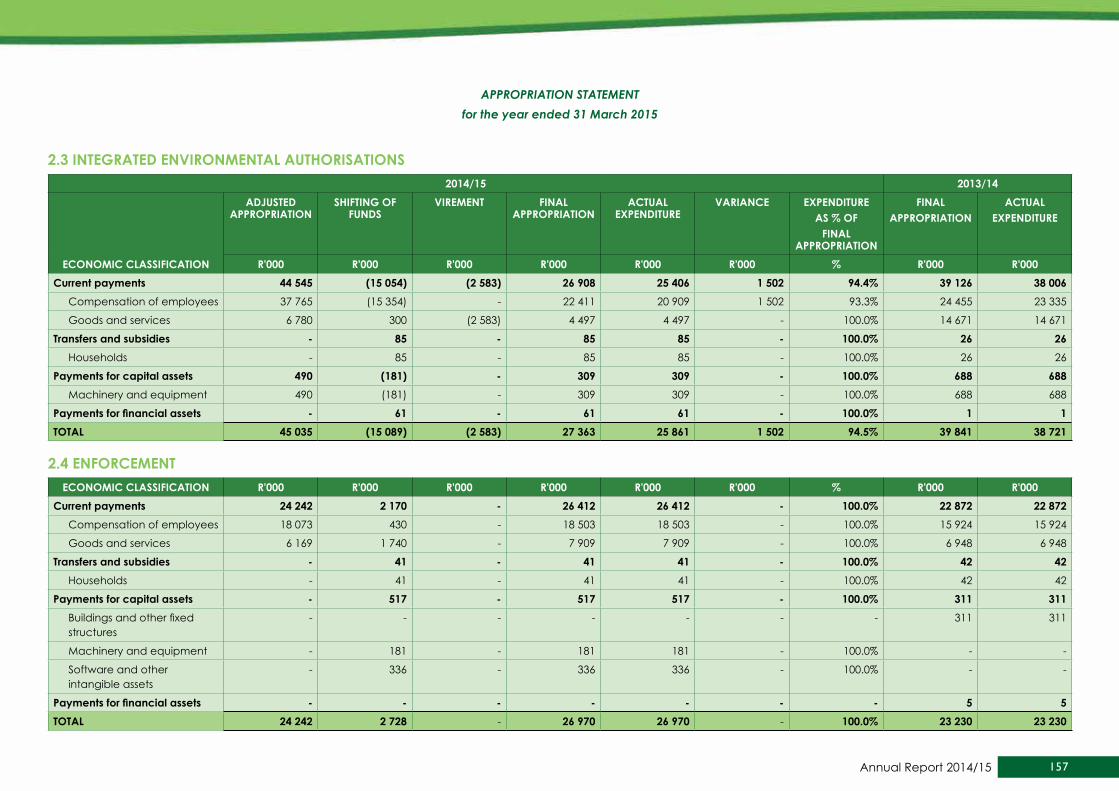
157Annual Report 2014/15
2.3 INTEGRATEd ENVIRONMENTAL AuThORIsATIONs2014/15 2013/14
ECONOMIC CLAssIFICATION
AdjusTEd APPROPRIATION
shIFTING OF FuNds
VIREMENT FINAL APPROPRIATION
ACTuAL EXPENdITuRE
VARIANCE EXPENdITuREAs % OF
FINAL APPROPRIATION
FINALAPPROPRIATION
ACTuALEXPENdITuRE
R'000 R'000 R'000 R'000 R'000 R'000 % R'000 R'000Current payments 44 545 (15 054) (2 583) 26 908 25 406 1 502 94.4% 39 126 38 006
Compensation of employees 37 765 (15 354) - 22 411 20 909 1 502 93.3% 24 455 23 335
Goods and services 6 780 300 (2 583) 4 497 4 497 - 100.0% 14 671 14 671
Transfers and subsidies - 85 - 85 85 - 100.0% 26 26Households - 85 - 85 85 - 100.0% 26 26
Payments for capital assets 490 (181) - 309 309 - 100.0% 688 688Machinery and equipment 490 (181) - 309 309 - 100.0% 688 688
Payments for financial assets - 61 - 61 61 - 100.0% 1 1TOTAL 45 035 (15 089) (2 583) 27 363 25 861 1 502 94.5% 39 841 38 721
2.4 ENFORCEMENTECONOMIC CLAssIFICATION R'000 R'000 R'000 R'000 R'000 R'000 % R'000 R'000
Current payments 24 242 2 170 - 26 412 26 412 - 100.0% 22 872 22 872Compensation of employees 18 073 430 - 18 503 18 503 - 100.0% 15 924 15 924
Goods and services 6 169 1 740 - 7 909 7 909 - 100.0% 6 948 6 948
Transfers and subsidies - 41 - 41 41 - 100.0% 42 42Households - 41 - 41 41 - 100.0% 42 42
Payments for capital assets - 517 - 517 517 - 100.0% 311 311Buildings and other fixed structures
- - - - - - - 311 311
Machinery and equipment - 181 - 181 181 - 100.0% - -
Software and other intangible assets
- 336 - 336 336 - 100.0% - -
Payments for financial assets - - - - - - - 5 5TOTAL 24 242 2 728 - 26 970 26 970 - 100.0% 23 230 23 230
APPROPRIATION STATEMENTfor the year ended 31 March 2015
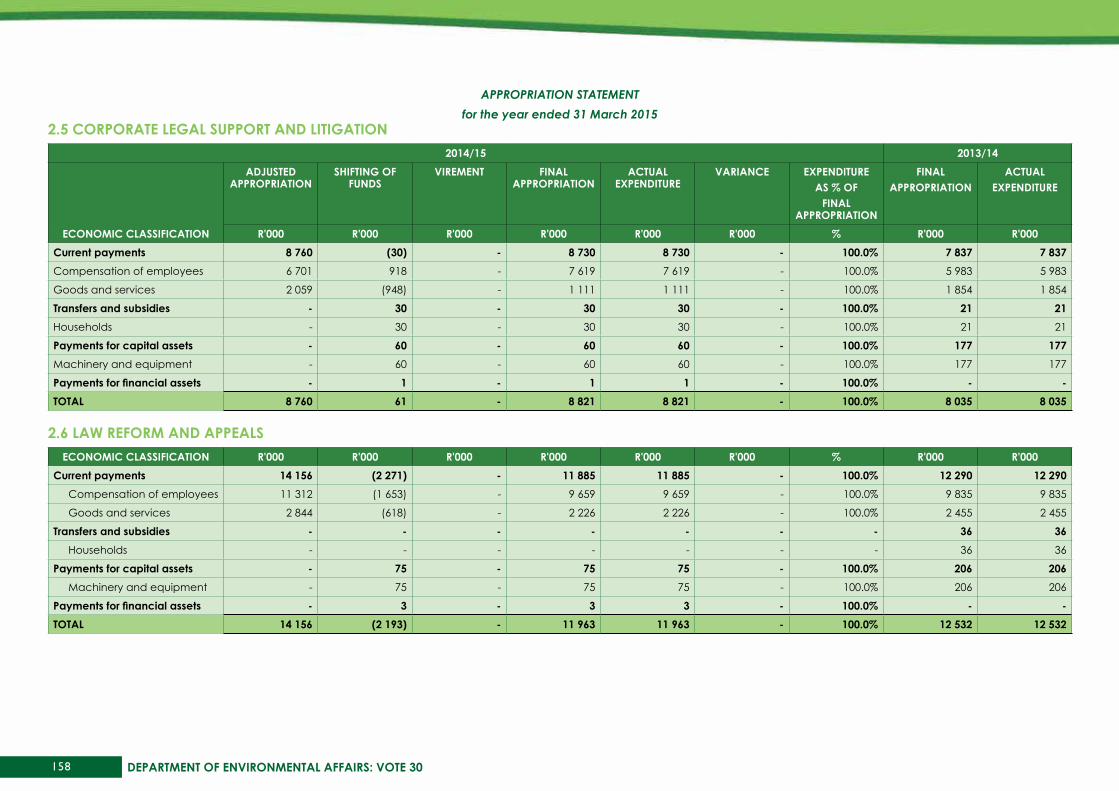
158 DEPARTMENT OF ENVIRONMENTAL AFFAIRS: VOTE 30
2.5 CORPORATE LEGAL suPPORT ANd LITIGATION2014/15 2013/14
ECONOMIC CLAssIFICATION
AdjusTEd APPROPRIATION
shIFTING OF FuNds
VIREMENT FINAL APPROPRIATION
ACTuAL EXPENdITuRE
VARIANCE EXPENdITuREAs % OF
FINAL APPROPRIATION
FINALAPPROPRIATION
ACTuALEXPENdITuRE
R'000 R'000 R'000 R'000 R'000 R'000 % R'000 R'000Current payments 8 760 (30) - 8 730 8 730 - 100.0% 7 837 7 837Compensation of employees 6 701 918 - 7 619 7 619 - 100.0% 5 983 5 983
Goods and services 2 059 (948) - 1 111 1 111 - 100.0% 1 854 1 854
Transfers and subsidies - 30 - 30 30 - 100.0% 21 21Households - 30 - 30 30 - 100.0% 21 21
Payments for capital assets - 60 - 60 60 - 100.0% 177 177Machinery and equipment - 60 - 60 60 - 100.0% 177 177
Payments for financial assets - 1 - 1 1 - 100.0% - -TOTAL 8 760 61 - 8 821 8 821 - 100.0% 8 035 8 035
2.6 LAw REFORM ANd APPEALsECONOMIC CLAssIFICATION R'000 R'000 R'000 R'000 R'000 R'000 % R'000 R'000
Current payments 14 156 (2 271) - 11 885 11 885 - 100.0% 12 290 12 290Compensation of employees 11 312 (1 653) - 9 659 9 659 - 100.0% 9 835 9 835
Goods and services 2 844 (618) - 2 226 2 226 - 100.0% 2 455 2 455
Transfers and subsidies - - - - - - - 36 36Households - - - - - - - 36 36
Payments for capital assets - 75 - 75 75 - 100.0% 206 206Machinery and equipment - 75 - 75 75 - 100.0% 206 206
Payments for financial assets - 3 - 3 3 - 100.0% - -TOTAL 14 156 (2 193) - 11 963 11 963 - 100.0% 12 532 12 532
APPROPRIATION STATEMENTfor the year ended 31 March 2015

159Annual Report 2014/15
PROGRAMME 3: OCEANs ANd COAsTs2014/15 2013/14
sub PROGRAMME
AdjusTEd APPROPRIATION
shIFTING OF FuNds
VIREMENT FINAL APPROPRIATION
ACTuAL EXPENdITuRE
VARIANCE EXPENdITuREAs % OF
FINAL APPROPRIATION
FINALAPPROPRIATION
ACTuALEXPENdITuRE
R'000 R'000 R'000 R'000 R'000 R'000 % R'000 R'000Oceans and Coasts Management
7 481 (2 191) - 5 290 5 290 - 100.0% 6 169 6 169
Integrated Coastal Management
71 554 17 041 - 88 595 88 595 - 100.0% 37 498 37 498
Oceans and Coastal Research 87 985 4 971 - 92 956 92 956 - 100.0% 96 324 95 598
Oceans Conservation 207 811 (25 807) (24 072) 157 932 157 932 - 100.0% 182 513 182 513
Specialist Monitoring Services 5 301 (817) - 4 484 4 484 - 100.0% 4 310 4 310
TOTAL FOR sub PROGRAMME 380 132 (6 803) (24 072) 349 257 349 257 - 100.0% 326 814 326 088
ECONOMIC CLAssIFICATION R'000 R'000 R'000 R'000 R'000 R'000 % R'000 R'000Current payments 366 917 1 705 (24 072) 344 550 344 550 - 100.0% 316 334 315 608Compensation of employees 82 059 2 391 - 84 450 84 450 - 100.0% 76 106 75 380
Salaries and wages 77 537 (1 631) - 75 906 75 906 - 100.0% 68 963 68 237
Social contributions 4 522 4 022 - 8 544 8 544 - 100.0% 7 143 7 143
Goods and services 284 858 (686) (24 072) 260 100 260 100 - 100.0% 240 228 240 228
Administrative fees 598 (307) - 291 291 - 100.0% 1 062 1 062
Advertising 2 100 (450) - 1 650 1 650 - 100.0% 673 673
Minor assets 1 278 (999) - 279 279 - 100.0% 464 464
Bursaries: Employees 245 (245) - - - - - 25 25
Catering: Departmental activities
220 (15) - 205 205 - 100.0% 312 312
Communication (G&S) 3 101 (53) - 3 048 3 048 - 100.0% 4 287 4 287
Computer services 1 564 (831) - 733 733 - 100.0% 744 744
Consultants: Business and advisory services
680 13 626 - 14 306 14 306 - 100.0% 7 987 7 987
APPROPRIATION STATEMENTfor the year ended 31 March 2015
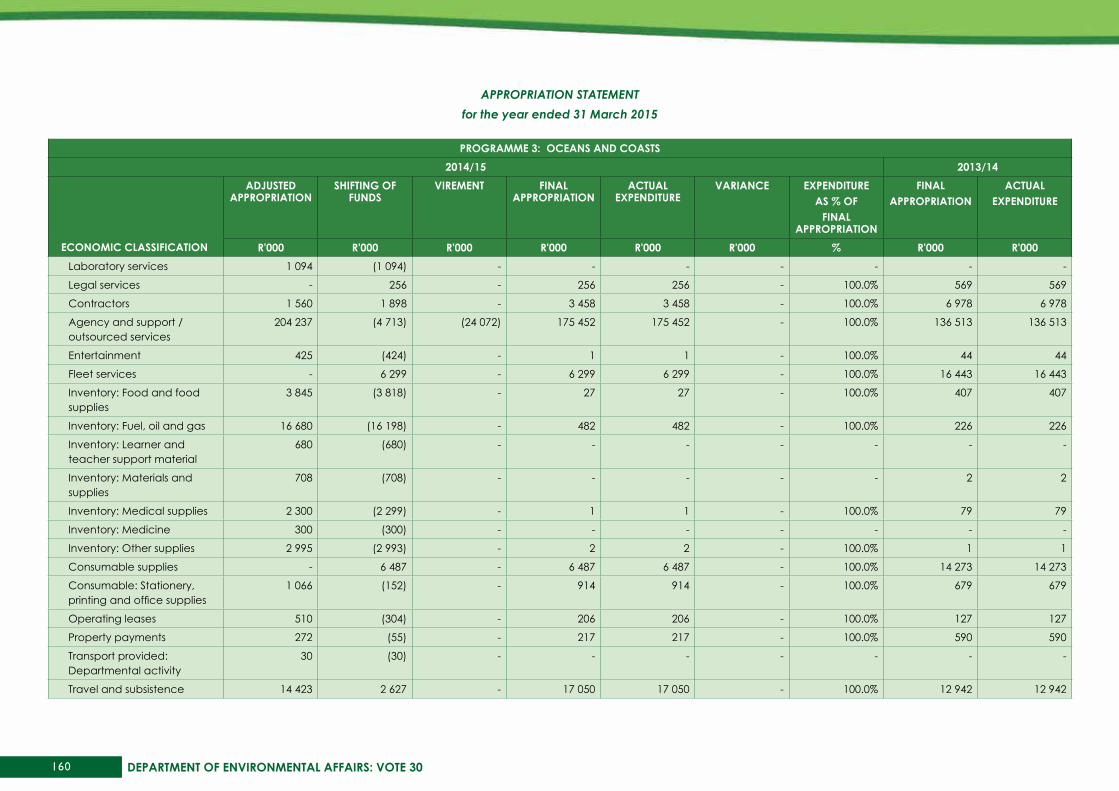
160 DEPARTMENT OF ENVIRONMENTAL AFFAIRS: VOTE 30
PROGRAMME 3: OCEANs ANd COAsTs2014/15 2013/14
sub PROGRAMME
AdjusTEd APPROPRIATION
shIFTING OF FuNds
VIREMENT FINAL APPROPRIATION
ACTuAL EXPENdITuRE
VARIANCE EXPENdITuREAs % OF
FINAL APPROPRIATION
FINALAPPROPRIATION
ACTuALEXPENdITuRE
R'000 R'000 R'000 R'000 R'000 R'000 % R'000 R'000Laboratory services 1 094 (1 094) - - - - - - -
Legal services - 256 - 256 256 - 100.0% 569 569
Contractors 1 560 1 898 - 3 458 3 458 - 100.0% 6 978 6 978
Agency and support / outsourced services
204 237 (4 713) (24 072) 175 452 175 452 - 100.0% 136 513 136 513
Entertainment 425 (424) - 1 1 - 100.0% 44 44
Fleet services - 6 299 - 6 299 6 299 - 100.0% 16 443 16 443
Inventory: Food and food supplies
3 845 (3 818) - 27 27 - 100.0% 407 407
Inventory: Fuel, oil and gas 16 680 (16 198) - 482 482 - 100.0% 226 226
Inventory: Learner and teacher support material
680 (680) - - - - - - -
Inventory: Materials and supplies
708 (708) - - - - - 2 2
Inventory: Medical supplies 2 300 (2 299) - 1 1 - 100.0% 79 79
Inventory: Medicine 300 (300) - - - - - - -
Inventory: Other supplies 2 995 (2 993) - 2 2 - 100.0% 1 1
Consumable supplies - 6 487 - 6 487 6 487 - 100.0% 14 273 14 273
Consumable: Stationery, printing and office supplies
1 066 (152) - 914 914 - 100.0% 679 679
Operating leases 510 (304) - 206 206 - 100.0% 127 127
Property payments 272 (55) - 217 217 - 100.0% 590 590
Transport provided: Departmental activity
30 (30) - - - - - - -
Travel and subsistence 14 423 2 627 - 17 050 17 050 - 100.0% 12 942 12 942
APPROPRIATION STATEMENTfor the year ended 31 March 2015
ECONOMIC CLAssIFICATION
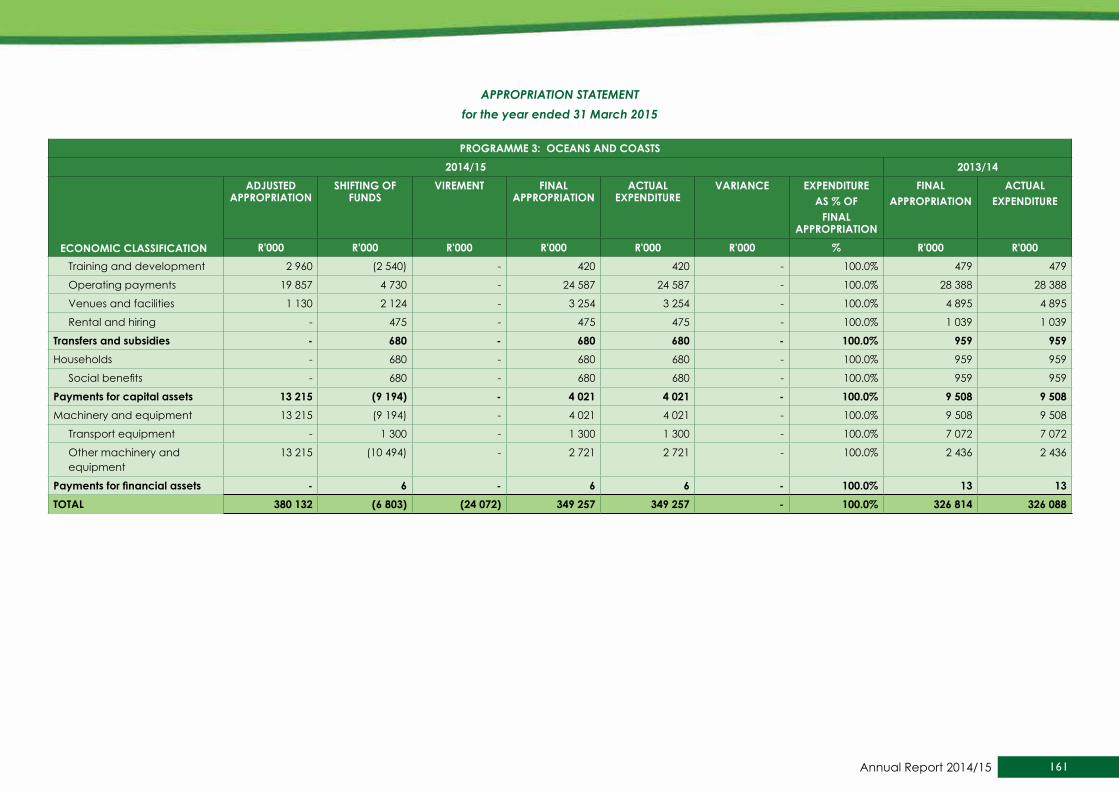
161Annual Report 2014/15
PROGRAMME 3: OCEANs ANd COAsTs2014/15 2013/14
sub PROGRAMME
AdjusTEd APPROPRIATION
shIFTING OF FuNds
VIREMENT FINAL APPROPRIATION
ACTuAL EXPENdITuRE
VARIANCE EXPENdITuREAs % OF
FINAL APPROPRIATION
FINALAPPROPRIATION
ACTuALEXPENdITuRE
R'000 R'000 R'000 R'000 R'000 R'000 % R'000 R'000Training and development 2 960 (2 540) - 420 420 - 100.0% 479 479
Operating payments 19 857 4 730 - 24 587 24 587 - 100.0% 28 388 28 388
Venues and facilities 1 130 2 124 - 3 254 3 254 - 100.0% 4 895 4 895
Rental and hiring - 475 - 475 475 - 100.0% 1 039 1 039
Transfers and subsidies - 680 - 680 680 - 100.0% 959 959Households - 680 - 680 680 - 100.0% 959 959
Social benefits - 680 - 680 680 - 100.0% 959 959
Payments for capital assets 13 215 (9 194) - 4 021 4 021 - 100.0% 9 508 9 508Machinery and equipment 13 215 (9 194) - 4 021 4 021 - 100.0% 9 508 9 508
Transport equipment - 1 300 - 1 300 1 300 - 100.0% 7 072 7 072
Other machinery and equipment
13 215 (10 494) - 2 721 2 721 - 100.0% 2 436 2 436
Payments for financial assets - 6 - 6 6 - 100.0% 13 13TOTAL 380 132 (6 803) (24 072) 349 257 349 257 - 100.0% 326 814 326 088
APPROPRIATION STATEMENTfor the year ended 31 March 2015
ECONOMIC CLAssIFICATION
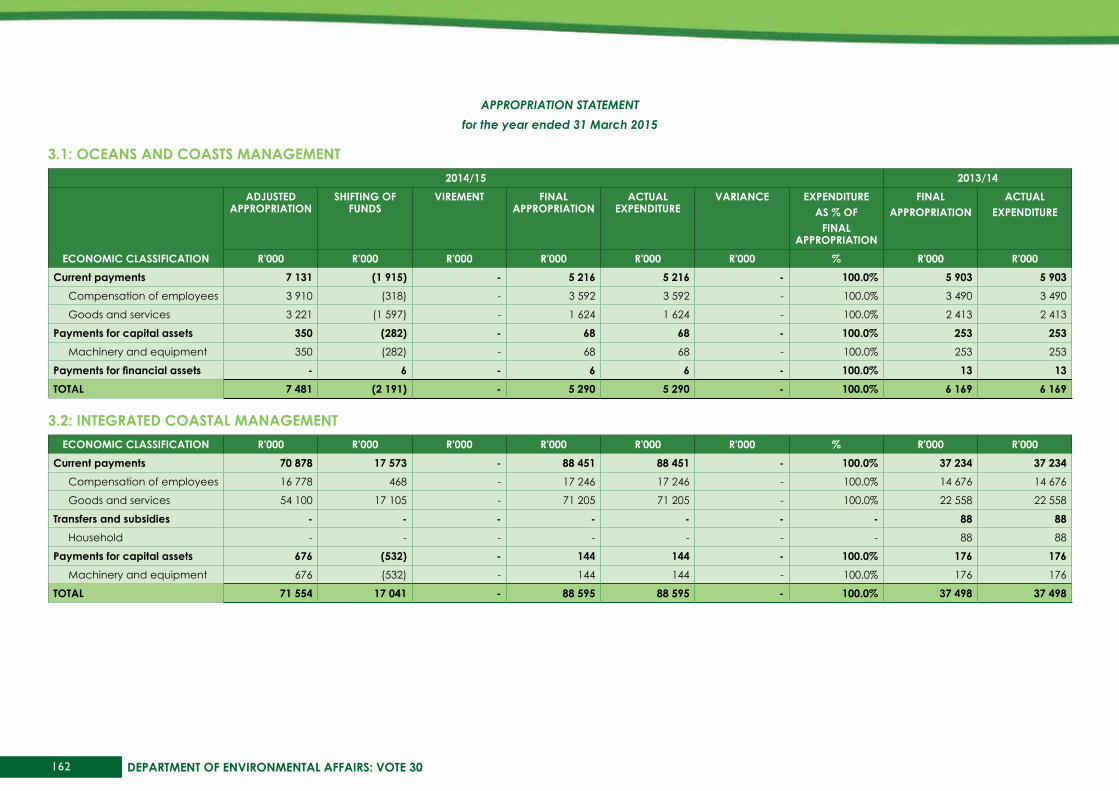
162 DEPARTMENT OF ENVIRONMENTAL AFFAIRS: VOTE 30
3.1: OCEANs ANd COAsTs MANAGEMENT2014/15 2013/14
ECONOMIC CLAssIFICATION
AdjusTEd APPROPRIATION
shIFTING OF FuNds
VIREMENT FINAL APPROPRIATION
ACTuAL EXPENdITuRE
VARIANCE EXPENdITuREAs % OF
FINAL APPROPRIATION
FINALAPPROPRIATION
ACTuALEXPENdITuRE
R'000 R'000 R'000 R'000 R'000 R'000 % R'000 R'000Current payments 7 131 (1 915) - 5 216 5 216 - 100.0% 5 903 5 903
Compensation of employees 3 910 (318) - 3 592 3 592 - 100.0% 3 490 3 490
Goods and services 3 221 (1 597) - 1 624 1 624 - 100.0% 2 413 2 413
Payments for capital assets 350 (282) - 68 68 - 100.0% 253 253Machinery and equipment 350 (282) - 68 68 - 100.0% 253 253
Payments for financial assets - 6 - 6 6 - 100.0% 13 13TOTAL 7 481 (2 191) - 5 290 5 290 - 100.0% 6 169 6 169
3.2: INTEGRATEd COAsTAL MANAGEMENTECONOMIC CLAssIFICATION R'000 R'000 R'000 R'000 R'000 R'000 % R'000 R'000
Current payments 70 878 17 573 - 88 451 88 451 - 100.0% 37 234 37 234Compensation of employees 16 778 468 - 17 246 17 246 - 100.0% 14 676 14 676
Goods and services 54 100 17 105 - 71 205 71 205 - 100.0% 22 558 22 558
Transfers and subsidies - - - - - - - 88 88Household - - - - - - - 88 88
Payments for capital assets 676 (532) - 144 144 - 100.0% 176 176Machinery and equipment 676 (532) - 144 144 - 100.0% 176 176
TOTAL 71 554 17 041 - 88 595 88 595 - 100.0% 37 498 37 498
APPROPRIATION STATEMENTfor the year ended 31 March 2015

163Annual Report 2014/15
3.3: OCEANs ANd COAsTAL REsEARCh2014/15 2013/14
ECONOMIC CLAssIFICATION
AdjusTEd APPROPRIATION
shIFTING OF FuNds
VIREMENT FINAL APPROPRIATION
ACTuAL EXPENdITuRE
VARIANCE EXPENdITuREAs % OF
FINAL APPROPRIATION
FINALAPPROPRIATION
ACTuALEXPENdITuRE
R'000 R'000 R'000 R'000 R'000 R'000 % R'000 R'000Current payments 84 085 6 931 - 91 016 91 016 - 100.0% 95 161 94 435
Compensation of employees 34 701 (359) - 34 342 34 342 - 100.0% 29 047 28 321
Goods and services 49 384 7 290 - 56 674 56 674 - 100.0% 66 114 66 114
Transfers and subsidies - - - - - - - 22 22Households - - - - - - - 22 22
Payments for capital assets 3 900 (1 960) - 1 940 1 940 - 100.0% 1 141 1 141Machinery and equipment 3 900 (1 960) - 1 940 1 940 - 100.0% 1 141 1 141
TOTAL 87 985 4 971 - 92 956 92 956 - 100.0% 96 324 95 598
3.4: OCEANs CONsERVATIONECONOMIC CLAssIFICATION R'000 R'000 R'000 R'000 R'000 R'000 % R'000 R'000
Current payments 199 562 (19 996) (24 072) 155 494 155 494 - 100.0% 173 760 173 760Compensation of employees 22 255 3 313 - 25 568 25 568 - 100.0% 26 083 26 083
Goods and services 177 307 (23 309) (24 072) 129 926 129 926 - 100.0% 147 677 147 677
Transfers and subsidies - 680 - 680 680 - 100.0% 849 849Households - 680 - 680 680 - 100.0% 849 849
Payments for capital assets 8 249 (6 491) - 1 758 1 758 - 100.0% 7 904 7 904Machinery and equipment 8 249 (6 491) - 1 758 1 758 - 100.0% 7 904 7 904
TOTAL 207 811 (25 807) (24 072) 157 932 157 932 - 100.0% 182 513 182 513
APPROPRIATION STATEMENTfor the year ended 31 March 2015
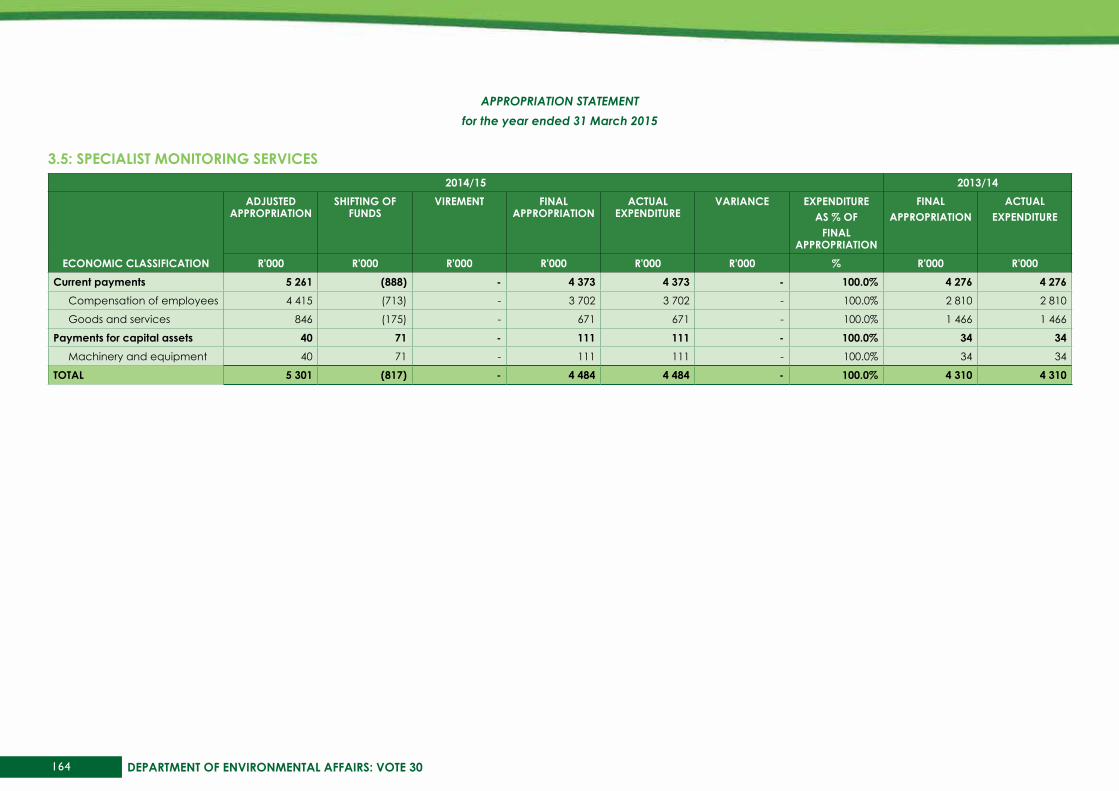
164 DEPARTMENT OF ENVIRONMENTAL AFFAIRS: VOTE 30
3.5: sPECIALIsT MONITORING sERVICEs2014/15 2013/14
ECONOMIC CLAssIFICATION
AdjusTEd APPROPRIATION
shIFTING OF FuNds
VIREMENT FINAL APPROPRIATION
ACTuAL EXPENdITuRE
VARIANCE EXPENdITuREAs % OF
FINAL APPROPRIATION
FINALAPPROPRIATION
ACTuALEXPENdITuRE
R'000 R'000 R'000 R'000 R'000 R'000 % R'000 R'000Current payments 5 261 (888) - 4 373 4 373 - 100.0% 4 276 4 276
Compensation of employees 4 415 (713) - 3 702 3 702 - 100.0% 2 810 2 810
Goods and services 846 (175) - 671 671 - 100.0% 1 466 1 466
Payments for capital assets 40 71 - 111 111 - 100.0% 34 34Machinery and equipment 40 71 - 111 111 - 100.0% 34 34
TOTAL 5 301 (817) - 4 484 4 484 - 100.0% 4 310 4 310
APPROPRIATION STATEMENTfor the year ended 31 March 2015

165Annual Report 2014/15
PROGRAMME 4: CLIMATE ChANGE ANd AIR QuALITy2014/15 2013/14
sub PROGRAMME
AdjusTEd APPROPRIATION
shIFTING OF FuNds
VIREMENT FINAL APPROPRIATION
ACTuAL EXPENdITuRE
VARIANCE EXPENdITuREAs % OF
FINAL APPROPRIATION
FINALAPPROPRIATION
ACTuALEXPENdITuRE
R'000 R'000 R'000 R'000 R'000 R'000 % R'000 R'000Climate Change Management 6 830 812 - 7 642 7 642 - 100.0% 5 437 5 437
Climate Change Mitigation 7 766 608 - 8 374 8 374 - 100.0% 7 523 7 523
Climate Change Adaptation 4 267 2 326 - 6 593 6 593 - 100.0% 3 656 3 656
Air Quality Management 37 592 (4 701) 3 706 36 597 36 597 - 100.0% 32 535 32 535
South African Weather Service 152 489 - - 152 489 152 489 - 100.0% 162 943 162 943
International Climate Change Relations and Negotiations
9 481 726 - 10 207 10 207 - 100.0% 9 262 9 262
Climate Change Monitoring and Evaluation
9 283 (1 893) - 7 390 7 390 - 100.0% 8 404 8 404
TOTAL FOR sub PROGRAMME 227 708 (2 122) 3 706 229 292 229 292 - 100.0% 229 760 229 760
ECONOMIC CLAssIFICATION R'000 R'000 R'000 R'000 R'000 R'000 % R'000 R'000Current payments 72 817 (2 050) 3 706 74 473 74 473 - 100.0% 64 498 64 498Compensation of employees 48 100 (2 030) - 46 070 46 070 - 100.0% 38 626 38 626
Salaries and wages 45 758 (4 721) - 41 037 41 037 - 100.0% 34 447 34 447
Social contributions 2 342 2 691 - 5 033 5 033 - 100.0% 4 179 4 179
Goods and services 24 717 (20) 3 706 28 403 28 403 - 100.0% 25 872 25 872
Administrative fees 240 (195) - 45 45 - 100.0% 3 3
Advertising 745 (171) - 574 574 - 100.0% 1 088 1 088
Minor assets 477 (413) - 64 64 - 100.0% 55 55
Audit costs: External 20 (20) - - - - - - -
Bursaries: Employees 147 (147) - - - - - 97 97
Catering: Departmental activities
338 (75) - 263 263 - 100.0% 92 92
Communication (G&S) 2 064 (1 582) - 482 482 - 100.0% 432 432
Computer services 6 913 (6 912) - 1 1 - 100.0% 221 221
APPROPRIATION STATEMENTfor the year ended 31 March 2015

166 DEPARTMENT OF ENVIRONMENTAL AFFAIRS: VOTE 30
PROGRAMME 4: CLIMATE ChANGE ANd AIR QuALITy2014/15 2013/14
sub PROGRAMME
AdjusTEd APPROPRIATION
shIFTING OF FuNds
VIREMENT FINAL APPROPRIATION
ACTuAL EXPENdITuRE
VARIANCE EXPENdITuREAs % OF
FINAL APPROPRIATION
FINALAPPROPRIATION
ACTuALEXPENdITuRE
R'000 R'000 R'000 R'000 R'000 R'000 % R'000 R'000Consultants: Business and advisory services
1 015 4 944 3 706 9 665 9 665 - 100.0% 8 633 8 633
Legal services 280 (125) - 155 155 - 100.0% - -
Contractors 28 2 - 30 30 - 100.0% - -
Agency and support / outsourced services
398 (398) - - - - - - -
Entertainment 19 (8) - 11 11 - 100.0% 33 33
Inventory: Food and food supplies
16 (16) - - - - - - -
Inventory: Other supplies 145 (145) - - - - - - -
Consumable supplies - 67 - 67 67 - 100.0% 105 105
Consumable: Stationery, printing and office supplies
616 (304) - 312 312 - 100.0% 192 192
Operating leases 145 (80) - 65 65 - 100.0% 58 58
Transport provided: Departmental activity
- - - - - - - 912 912
Travel and subsistence 6 957 3 856 - 10 813 10 813 - 100.0% 8 837 8 837
Training and development 708 (151) - 557 557 - 100.0% 730 730
Operating payments 1 366 (786) - 580 580 - 100.0% 459 459
Venues and facilities 1 980 2 723 - 4 703 4 703 - 100.0% 3 888 3 888
Rental and hiring 100 (84) - 16 16 - 100.0% 37 37
Transfers and subsidies 153 889 21 - 153 910 153 910 - 100.0% 164 423 164 423Departmental agencies and accounts
152 489 - - 152 489 152 489 - 100.0% 162 943 162 943
APPROPRIATION STATEMENTfor the year ended 31 March 2015
ECONOMIC CLAssIFICATION

167Annual Report 2014/15
PROGRAMME 4: CLIMATE ChANGE ANd AIR QuALITy2014/15 2013/14
sub PROGRAMME
AdjusTEd APPROPRIATION
shIFTING OF FuNds
VIREMENT FINAL APPROPRIATION
ACTuAL EXPENdITuRE
VARIANCE EXPENdITuREAs % OF
FINAL APPROPRIATION
FINALAPPROPRIATION
ACTuALEXPENdITuRE
R'000 R'000 R'000 R'000 R'000 R'000 % R'000 R'000Departmental agencies (non-business entities)
152 489 - - 152 489 152 489 - 100.0% 162 943 162 943
Non-profit institutions 1 400 - - 1 400 1 400 - 100.0% 1 400 1 400
Households - 21 - 21 21 - 100.0% 80 80
Social benefits - 21 - 21 21 - 100.0% 80 80
Payments for capital assets 1 002 (93) - 909 909 - 100.0% 839 839Machinery and equipment 1 002 (93) - 909 909 - 100.0% 839 839
Other machinery and equipment
1 002 (93) - 909 909 - 100.0% 839 839
TOTAL 227 708 (2 122) 3 706 229 292 229 292 - 100.0% 229 760 229 760
APPROPRIATION STATEMENTfor the year ended 31 March 2015
ECONOMIC CLAssIFICATION

168 DEPARTMENT OF ENVIRONMENTAL AFFAIRS: VOTE 30
4.1: CLIMATE ChANGE MANAGEMENT2014/15 2013/14
ECONOMIC CLAssIFICATION
AdjusTEd APPROPRIATION
shIFTING OF FuNds
VIREMENT FINAL APPROPRIATION
ACTuAL EXPENdITuRE
VARIANCE EXPENdITuREAs % OF
FINAL APPROPRIATION
FINALAPPROPRIATION
ACTuALEXPENdITuRE
R'000 R'000 R'000 R'000 R'000 R'000 % R'000 R'000Current payments 6 830 679 - 7 509 7 509 - 100.0% 5 437 5 437
Compensation of employees 3 834 (194) - 3 640 3 640 - 100.0% 3 464 3 464
Goods and services 2 996 873 - 3 869 3 869 - 100.0% 1 973 1 973
Payments for capital assets - 133 - 133 133 - 100.0% - -Machinery and equipment - 133 - 133 133 - 100.0% - -
TOTAL 6 830 812 - 7 642 7 642 - 100.0% 5 437 5 437
4.2: CLIMATE ChANGE MITIGATIONECONOMIC CLAssIFICATION R'000 R'000 R'000 R'000 R'000 R'000 % R'000 R'000
Current payments 7 766 575 - 8 341 8 341 - 100.0% 7 464 7 464Compensation of employees 6 151 749 - 6 900 6 900 - 100.0% 5 518 5 518
Goods and services 1 615 (174) - 1 441 1 441 - 100.0% 1 946 1 946
Payments for capital assets - 33 - 33 33 - 100.0% 59 59Machinery and equipment - 33 - 33 33 - 100.0% 59 59
TOTAL 7 766 608 - 8 374 8 374 - 100.0% 7 523 7 523
APPROPRIATION STATEMENTfor the year ended 31 March 2015

169Annual Report 2014/15
4.3: CLIMATE ChANGE AdAPTATION2014/15 2013/14
ECONOMIC CLAssIFICATION
AdjusTEd APPROPRIATION
shIFTING OF FuNds
VIREMENT FINAL APPROPRIATION
ACTuAL EXPENdITuRE
VARIANCE EXPENdITuREAs % OF
FINAL APPROPRIATION
FINALAPPROPRIATION
ACTuALEXPENdITuRE
R'000 R'000 R'000 R'000 R'000 R'000 % R'000 R'000Current payments 4 267 2 222 - 6 489 6 489 - 100.0% 3 610 3 610
Compensation of employees 2 722 2 079 - 4 801 4 801 - 100.0% 2 161 2 161
Goods and services 1 545 143 - 1 688 1 688 - 100.0% 1 449 1 449
Payments for capital assets - 104 - 104 104 - 100.0% 46 46Machinery and equipment - 104 - 104 104 - 100.0% 46 46
TOTAL 4 267 2 326 - 6 593 6 593 - 100.0% 3 656 3 656
4.4: AIR QuALITy MANAGEMENTECONOMIC CLAssIFICATION R'000 R'000 R'000 R'000 R'000 R'000 % R'000 R'000
Current payments 35 272 (4 259) 3 706 34 719 34 719 - 100.0% 30 567 30 567Compensation of employees 23 106 (1 948) - 21 158 21 158 - 100.0% 19 371 19 371
Goods and services 12 166 (2 311) 3 706 13 561 13 561 - 100.0% 11 196 11 196
Transfers and subsidies 1 400 20 - 1 420 1 420 - 100.0% 1 417 1 417Households - 20 - 20 20 - 100.0% 17 17
Non –profit institutions 1 400 - - 1 400 1 400 - 100.0% 1 400 1 400
Payments for capital assets 920 (462) - 458 458 - 100.0% 551 551Machinery and equipment 920 (462) - 458 458 - 100.0% 551 551
TOTAL 37 592 (4 701) 3 706 36 597 36 597 - 100.0% 32 535 32 535
APPROPRIATION STATEMENTfor the year ended 31 March 2015
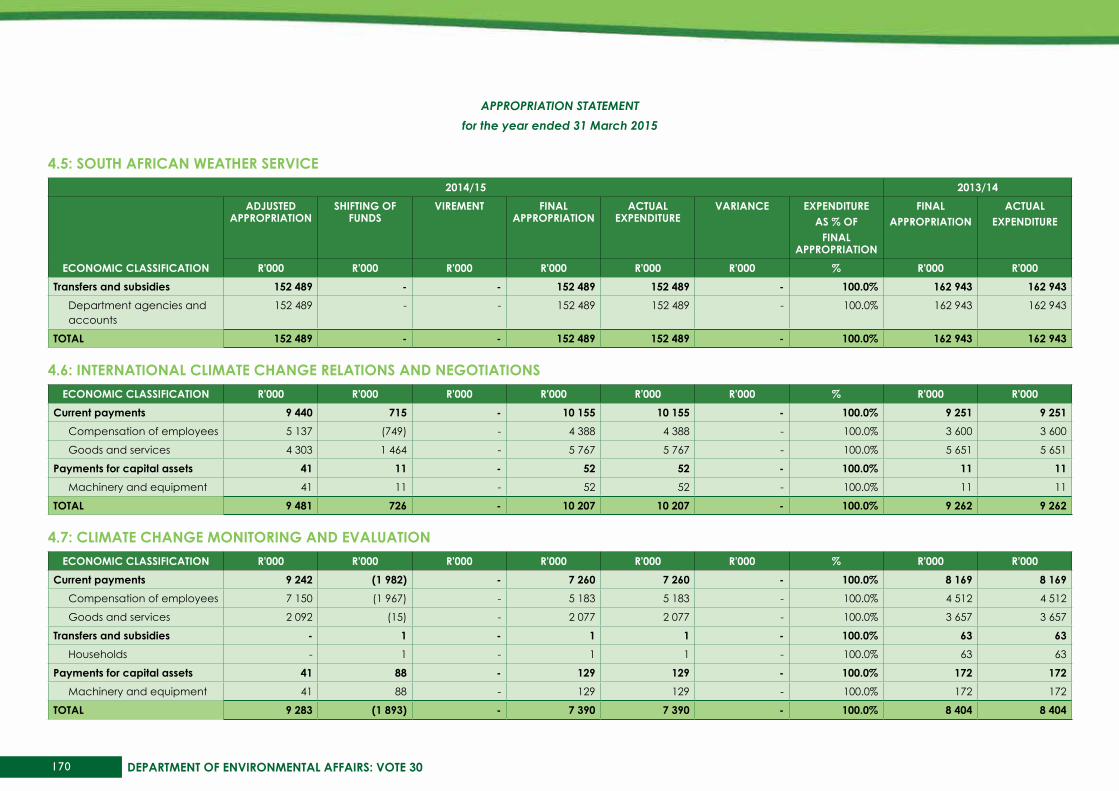
170 DEPARTMENT OF ENVIRONMENTAL AFFAIRS: VOTE 30
4.5: sOuTh AFRICAN wEAThER sERVICE2014/15 2013/14
ECONOMIC CLAssIFICATION
AdjusTEd APPROPRIATION
shIFTING OF FuNds
VIREMENT FINAL APPROPRIATION
ACTuAL EXPENdITuRE
VARIANCE EXPENdITuREAs % OF
FINAL APPROPRIATION
FINALAPPROPRIATION
ACTuALEXPENdITuRE
R'000 R'000 R'000 R'000 R'000 R'000 % R'000 R'000Transfers and subsidies 152 489 - - 152 489 152 489 - 100.0% 162 943 162 943
Department agencies and accounts
152 489 - - 152 489 152 489 - 100.0% 162 943 162 943
TOTAL 152 489 - - 152 489 152 489 - 100.0% 162 943 162 943
4.6: INTERNATIONAL CLIMATE ChANGE RELATIONs ANd NEGOTIATIONsECONOMIC CLAssIFICATION R'000 R'000 R'000 R'000 R'000 R'000 % R'000 R'000
Current payments 9 440 715 - 10 155 10 155 - 100.0% 9 251 9 251Compensation of employees 5 137 (749) - 4 388 4 388 - 100.0% 3 600 3 600
Goods and services 4 303 1 464 - 5 767 5 767 - 100.0% 5 651 5 651
Payments for capital assets 41 11 - 52 52 - 100.0% 11 11Machinery and equipment 41 11 - 52 52 - 100.0% 11 11
TOTAL 9 481 726 - 10 207 10 207 - 100.0% 9 262 9 262
4.7: CLIMATE ChANGE MONITORING ANd EVALuATIONECONOMIC CLAssIFICATION R'000 R'000 R'000 R'000 R'000 R'000 % R'000 R'000
Current payments 9 242 (1 982) - 7 260 7 260 - 100.0% 8 169 8 169Compensation of employees 7 150 (1 967) - 5 183 5 183 - 100.0% 4 512 4 512
Goods and services 2 092 (15) - 2 077 2 077 - 100.0% 3 657 3 657
Transfers and subsidies - 1 - 1 1 - 100.0% 63 63Households - 1 - 1 1 - 100.0% 63 63
Payments for capital assets 41 88 - 129 129 - 100.0% 172 172Machinery and equipment 41 88 - 129 129 - 100.0% 172 172
TOTAL 9 283 (1 893) - 7 390 7 390 - 100.0% 8 404 8 404
APPROPRIATION STATEMENTfor the year ended 31 March 2015
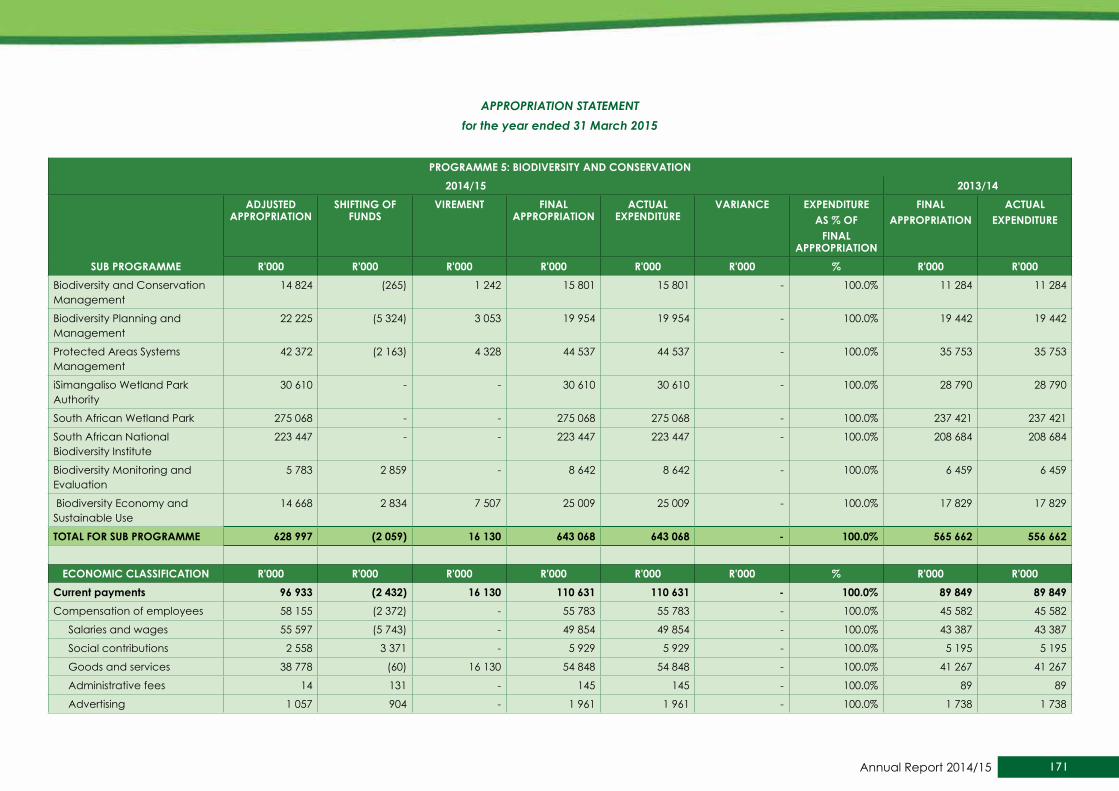
171Annual Report 2014/15
PROGRAMME 5: bIOdIVERsITy ANd CONsERVATION2014/15 2013/14
sub PROGRAMME
AdjusTEd APPROPRIATION
shIFTING OF FuNds
VIREMENT FINAL APPROPRIATION
ACTuAL EXPENdITuRE
VARIANCE EXPENdITuREAs % OF
FINAL APPROPRIATION
FINALAPPROPRIATION
ACTuALEXPENdITuRE
R'000 R'000 R'000 R'000 R'000 R'000 % R'000 R'000Biodiversity and Conservation Management
14 824 (265) 1 242 15 801 15 801 - 100.0% 11 284 11 284
Biodiversity Planning and Management
22 225 (5 324) 3 053 19 954 19 954 - 100.0% 19 442 19 442
Protected Areas Systems Management
42 372 (2 163) 4 328 44 537 44 537 - 100.0% 35 753 35 753
iSimangaliso Wetland Park Authority
30 610 - - 30 610 30 610 - 100.0% 28 790 28 790
South African Wetland Park 275 068 - - 275 068 275 068 - 100.0% 237 421 237 421
South African National Biodiversity Institute
223 447 - - 223 447 223 447 - 100.0% 208 684 208 684
Biodiversity Monitoring and Evaluation
5 783 2 859 - 8 642 8 642 - 100.0% 6 459 6 459
Biodiversity Economy and Sustainable Use
14 668 2 834 7 507 25 009 25 009 - 100.0% 17 829 17 829
TOTAL FOR sub PROGRAMME 628 997 (2 059) 16 130 643 068 643 068 - 100.0% 565 662 556 662
ECONOMIC CLAssIFICATION R'000 R'000 R'000 R'000 R'000 R'000 % R'000 R'000Current payments 96 933 (2 432) 16 130 110 631 110 631 - 100.0% 89 849 89 849Compensation of employees 58 155 (2 372) - 55 783 55 783 - 100.0% 45 582 45 582
Salaries and wages 55 597 (5 743) - 49 854 49 854 - 100.0% 43 387 43 387
Social contributions 2 558 3 371 - 5 929 5 929 - 100.0% 5 195 5 195
Goods and services 38 778 (60) 16 130 54 848 54 848 - 100.0% 41 267 41 267
Administrative fees 14 131 - 145 145 - 100.0% 89 89
Advertising 1 057 904 - 1 961 1 961 - 100.0% 1 738 1 738
APPROPRIATION STATEMENTfor the year ended 31 March 2015
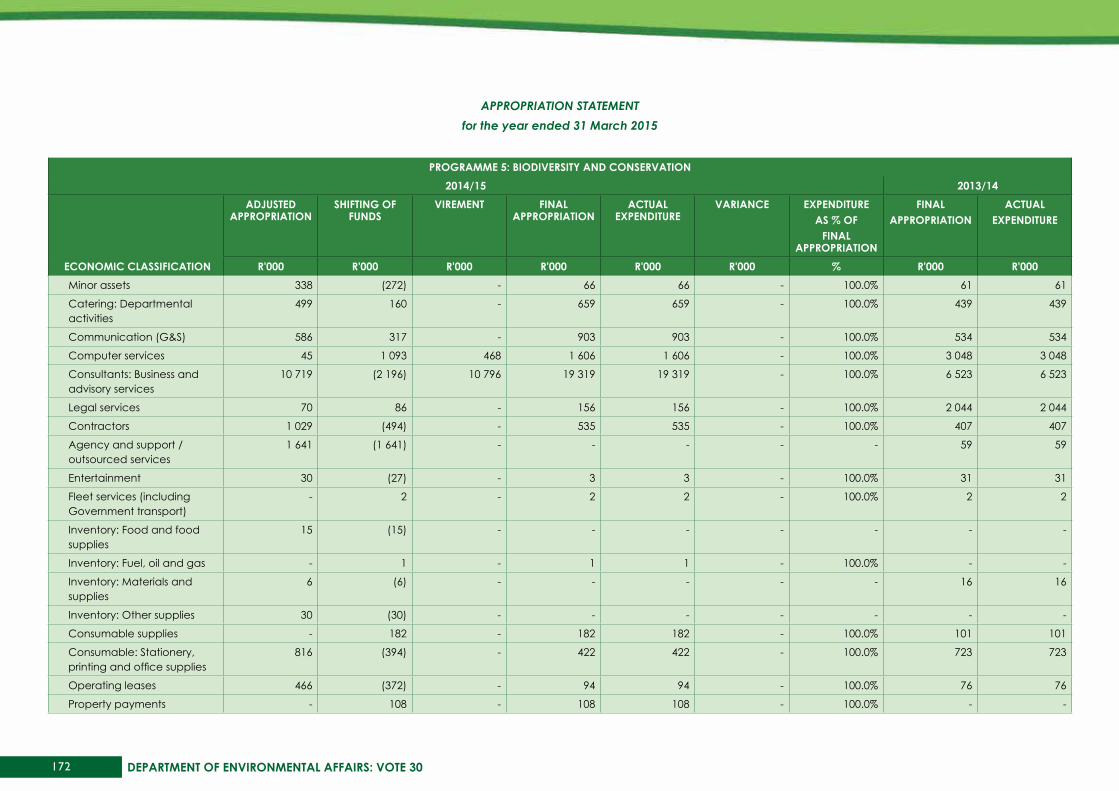
172 DEPARTMENT OF ENVIRONMENTAL AFFAIRS: VOTE 30
PROGRAMME 5: bIOdIVERsITy ANd CONsERVATION2014/15 2013/14
sub PROGRAMME
AdjusTEd APPROPRIATION
shIFTING OF FuNds
VIREMENT FINAL APPROPRIATION
ACTuAL EXPENdITuRE
VARIANCE EXPENdITuREAs % OF
FINAL APPROPRIATION
FINALAPPROPRIATION
ACTuALEXPENdITuRE
R'000 R'000 R'000 R'000 R'000 R'000 % R'000 R'000Minor assets 338 (272) - 66 66 - 100.0% 61 61
Catering: Departmental activities
499 160 - 659 659 - 100.0% 439 439
Communication (G&S) 586 317 - 903 903 - 100.0% 534 534
Computer services 45 1 093 468 1 606 1 606 - 100.0% 3 048 3 048
Consultants: Business and advisory services
10 719 (2 196) 10 796 19 319 19 319 - 100.0% 6 523 6 523
Legal services 70 86 - 156 156 - 100.0% 2 044 2 044
Contractors 1 029 (494) - 535 535 - 100.0% 407 407
Agency and support / outsourced services
1 641 (1 641) - - - - - 59 59
Entertainment 30 (27) - 3 3 - 100.0% 31 31
Fleet services (including Government transport)
- 2 - 2 2 - 100.0% 2 2
Inventory: Food and food supplies
15 (15) - - - - - - -
Inventory: Fuel, oil and gas - 1 - 1 1 - 100.0% - -
Inventory: Materials and supplies
6 (6) - - - - - 16 16
Inventory: Other supplies 30 (30) - - - - - - -
Consumable supplies - 182 - 182 182 - 100.0% 101 101
Consumable: Stationery, printing and office supplies
816 (394) - 422 422 - 100.0% 723 723
Operating leases 466 (372) - 94 94 - 100.0% 76 76
Property payments - 108 - 108 108 - 100.0% - -
APPROPRIATION STATEMENTfor the year ended 31 March 2015
ECONOMIC CLAssIFICATION
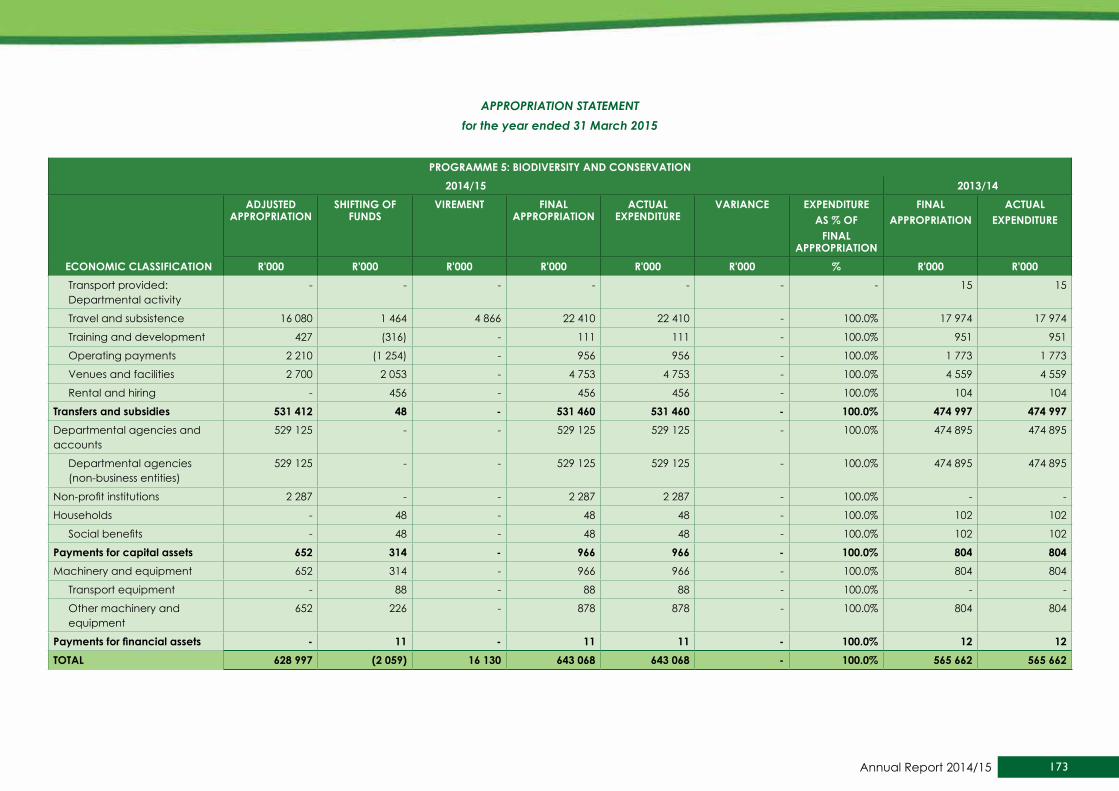
173Annual Report 2014/15
PROGRAMME 5: bIOdIVERsITy ANd CONsERVATION2014/15 2013/14
sub PROGRAMME
AdjusTEd APPROPRIATION
shIFTING OF FuNds
VIREMENT FINAL APPROPRIATION
ACTuAL EXPENdITuRE
VARIANCE EXPENdITuREAs % OF
FINAL APPROPRIATION
FINALAPPROPRIATION
ACTuALEXPENdITuRE
R'000 R'000 R'000 R'000 R'000 R'000 % R'000 R'000Transport provided: Departmental activity
- - - - - - - 15 15
Travel and subsistence 16 080 1 464 4 866 22 410 22 410 - 100.0% 17 974 17 974
Training and development 427 (316) - 111 111 - 100.0% 951 951
Operating payments 2 210 (1 254) - 956 956 - 100.0% 1 773 1 773
Venues and facilities 2 700 2 053 - 4 753 4 753 - 100.0% 4 559 4 559
Rental and hiring - 456 - 456 456 - 100.0% 104 104
Transfers and subsidies 531 412 48 - 531 460 531 460 - 100.0% 474 997 474 997Departmental agencies and accounts
529 125 - - 529 125 529 125 - 100.0% 474 895 474 895
Departmental agencies (non-business entities)
529 125 - - 529 125 529 125 - 100.0% 474 895 474 895
Non-profit institutions 2 287 - - 2 287 2 287 - 100.0% - -
Households - 48 - 48 48 - 100.0% 102 102
Social benefits - 48 - 48 48 - 100.0% 102 102
Payments for capital assets 652 314 - 966 966 - 100.0% 804 804Machinery and equipment 652 314 - 966 966 - 100.0% 804 804
Transport equipment - 88 - 88 88 - 100.0% - -
Other machinery and equipment
652 226 - 878 878 - 100.0% 804 804
Payments for financial assets - 11 - 11 11 - 100.0% 12 12TOTAL 628 997 (2 059) 16 130 643 068 643 068 - 100.0% 565 662 565 662
APPROPRIATION STATEMENTfor the year ended 31 March 2015
ECONOMIC CLAssIFICATION

174 DEPARTMENT OF ENVIRONMENTAL AFFAIRS: VOTE 30
5.1: bIOdIVERsITy ANd CONsERVATION MANAGEMENT2014/15 2013/14
ECONOMIC CLAssIFICATION
AdjusTEd APPROPRIATION
shIFTING OF FuNds
VIREMENT FINAL APPROPRIATION
ACTuAL EXPENdITuRE
VARIANCE EXPENdITuREAs % OF
FINAL APPROPRIATION
FINALAPPROPRIATION
ACTuALEXPENdITuRE
R'000 R'000 R'000 R'000 R'000 R'000 % R'000 R'000Current payments 14 764 (389) 1 242 15 617 15 617 - 100.0% 11 015 11 015
Compensation of employees 9 666 (809) - 8 857 8 857 - 100.0% 6 779 6 779
Goods and services 5 098 420 1 242 6 760 6 760 - 100.0% 4 236 4 236
Transfers and subsidies - 48 - 48 48 - 100.0% - -Households - 48 - 48 48 - 100.0% - -
Payments for capital assets 60 76 - 136 136 - 100.0% 269 269Machinery and equipment 60 76 - 136 136 - 100.0% 269 269
TOTAL 14 824 (265) 1 242 15 801 15 801 - 100.0% 11 284 11 284
5.2: bIOdIVERsITy PLANNING ANd MANAGEMENTECONOMIC CLAssIFICATION R'000 R'000 R'000 R'000 R'000 R'000 % R'000 R'000
Current payments 21 965 (5 164) 3 053 19 854 19 854 - 100.0% 19 293 19 293
Compensation of employees 13 742 (2 687) - 11 055 11 055 - 100.0% 11 729 11 729
Goods and services 8 223 (2 477) 3 053 8 799 8 799 - 100.0% 7 564 7 564
Payments for capital assets 260 (165) - 95 95 - 100.0% 149 149
Machinery and equipment 260 (165) - 95 95 - 100.0% 149 149
Payments for financial assets - 5 - 5 5 - 100.0% - -
TOTAL 22 225 (5 324) 3 053 19 954 19 954 - 100.0% 19 442 19 442
APPROPRIATION STATEMENTfor the year ended 31 March 2015

175Annual Report 2014/15
5.3: PROTECTEd AREAs sysTEMs MANAGEMENT2014/15 2013/14
ECONOMIC CLAssIFICATION
AdjusTEd APPROPRIATION
shIFTING OF FuNds
VIREMENT FINAL APPROPRIATION
ACTuAL EXPENdITuRE
VARIANCE EXPENdITuREAs % OF
FINAL APPROPRIATION
FINALAPPROPRIATION
ACTuALEXPENdITuRE
R'000 R'000 R'000 R'000 R'000 R'000 % R'000 R'000Current payments 39 835 (2 347) 4 328 41 816 41 816 - 100.0% 35 415 35 415
Compensation of employees 22 313 (2 086) - 20 227 20 227 - 100.0% 18 679 18 679
Goods and services 17 522 (261) 4 328 21 589 21 589 - 100.0% 16 736 16 736
Transfers and subsidies 2 287 - - 2 287 2 287 - 100.0% 102 102
Non –profit institutions 2 287 - - 2 287 2 287 - 100.0% - -
Households - - - - - - - 102 102
Payments for capital assets 250 178 - 428 428 - 100.0% 224 224
Machinery and equipment 250 178 - 428 428 - 100.0% 224 224
Payments for financial assets - 6 - 6 6 - 100.0% 12 12
TOTAL 42 372 (2 163) 4 328 44 537 44 537 - 100.0% 35 753 35 753
5.4: IsIMANGALIsO wETLANd PARk AuThORITyECONOMIC CLAssIFICATION R'000 R'000 R'000 R'000 R'000 R'000 % R'000 R'000
Transfers and subsidies 30 610 - - 30 610 30 610 - 100.0% 28 790 28 790Department agencies and accounts
30 610 - - 30 610 30 610 - 100.0% 28 790 28 790
TOTAL 30 610 - - 30 610 30 610 - 100.0% 28 790 28 790
APPROPRIATION STATEMENTfor the year ended 31 March 2015

176 DEPARTMENT OF ENVIRONMENTAL AFFAIRS: VOTE 30
5.5: sOuTh AFRICAN NATIONAL PARks2014/15 2013/14
ECONOMIC CLAssIFICATION
AdjusTEd APPROPRIATION
shIFTING OF FuNds
VIREMENT FINAL APPROPRIATION
ACTuAL EXPENdITuRE
VARIANCE EXPENdITuREAs % OF FINAL APPROPRIATION
FINALAPPROPRIATION
ACTuALEXPENdITuRE
R'000 R'000 R'000 R'000 R'000 R'000 % R'000 R'000Transfers and subsidies 275 068 - - 275 068 275 068 - 100.0% 237 421 237 421
Department agencies and accounts
275 068 - - 275 068 275 068 - 100.0% 237 421 237 421
TOTAL 275 068 - - 275 068 275 068 - 100.0% 237 421 237 421
5.6: sOuTh AFRICAN NATIONAL bIOdIVERsITy INsTITuTEECONOMIC CLAssIFICATION R'000 R'000 R'000 R'000 R'000 R'000 % R'000 R'000
Current paymentsTransfers and subsidies 223 447 - - 223 447 223 447 - 100.0% 208 684 208 684
Department agencies and accounts
223 447 - - 223 447 223 447 - 100.0% 208 684 208 684
TOTAL 223 447 - - 223 447 223 447 - 100.0% 208 684 208 684
APPROPRIATION STATEMENTfor the year ended 31 March 2015

177Annual Report 2014/15
5.7: bIOdIVERsITy MONITORING ANd EVALuATION2014/15 2013/14
ECONOMIC CLAssIFICATION
AdjusTEd APPROPRIATION
shIFTING OF FuNds
VIREMENT FINAL APPROPRIATION
ACTuAL EXPENdITuRE
VARIANCE EXPENdITuREAs % OF FINAL
APPROPRIATION
FINALAPPROPRIATION
ACTuALEXPENdITuRE
R'000 R'000 R'000 R'000 R'000 R'000 % R'000 R'000Current payments 5 742 2 843 - 8 585 8 585 - 100.0% 6 402 6 402
Compensation of employees 3 243 1 678 - 4 921 4 921 - 100.0% 3 126 3 126
Goods and services 2 499 1 165 - 3 664 3 664 - 100.0% 3 276 3 276
Payments for capital assets 41 16 - 57 57 - 100.0% 57 57Machinery and equipment 41 16 - 57 57 - 100.0% 57 57
TOTAL 5 783 2 859 - 8 642 8 642 - 100.0% 6 459 6 459
5.8: bIOdIVERsITy ECONOMy ANd susTAINAbLE usEECONOMIC CLAssIFICATION R'000 R'000 R'000 R'000 R'000 R'000 % R'000 R'000
Current payments 14 627 2 625 7 507 24 759 24 759 - 100.0% 17 724 17 724Compensation of employees 9 191 1 532 - 10 723 10 723 - 100.0% 8 269 8 269
Goods and services 5 436 1 093 7 507 14 036 14 036 - 100.0% 9 455 9 455
Payments for capital assets. 41 209 - 250 250 - 100.0% 105 105Machinery and equipment 41 209 - 250 250 - 100.0% 105 105
TOTAL 14 668 2 834 7 507 25 009 25 009 - 100.0% 17 829 17 829
APPROPRIATION STATEMENTfor the year ended 31 March 2015

178 DEPARTMENT OF ENVIRONMENTAL AFFAIRS: VOTE 30
PROGRAMME 6: ENVIRONMENTAL PROGRAMMEs2014/15 2013/14
sub PROGRAMME
AdjusTEd APPROPRIATION
shIFTING OF FuNds
VIREMENT FINAL APPROPRIATION
ACTuAL EXPENdITuRE
VARIANCE EXPENdITuREAs % OF FINAL
APPROPRIATION
FINALAPPROPRIATION
ACTuALEXPENdITuRE
R'000 R'000 R'000 R'000 R'000 R'000 % R'000 R'000Environmental Protection and Infrastructure Programme
1 331 138 (8 588) 158 554 1 481 104 1 481 104 - 100.0% 1 297 270 1 297 270
Working for Water and Working on Fire
1 955 074 (7 641) (172 096) 1 775 337 1 771 512 3 825 99.8% 1 564 204 1 563 043
Green fund 250 000 - - 250 000 250 000 - 100.0% 250 000 250 000
Environmental Programmes Management
6 154 1 119 - 7 273 7 273 - 100.0% 5 288 5 288
Information Management and Sector Coordination
45 159 (5 440) - 39 719 39 719 - 100.0% 22 123 22 123
TOTAL FOR sub PROGRAMME 3 587 525 (20 550) (13 542) 3 553 433 3 549 608 3 825 99.9% 3 138 885 3 137 724
ECONOMIC CLAssIFICATION R'000 R'000 R'000 R'000 R'000 R'000 % R'000 R'000Current payments 601 041 (7 204) (225 138) 368 699 364 973 3 726 99.0% 339 347 339 347Compensation of employees 178 829 (7 343) - 171 486 169 978 1 508 99.1% 138 341 138 341
Salaries and wages 164 792 (11 232) - 153 560 152 052 1 508 99.0% 129 909 129 909
Social contributions 14 037 3 889 - 17 926 17 926 - 100.0% 8 432 8 432
Goods and services 422 212 139 (225 138) 197 213 194 995 2 218 98.9% 201 006 201 006
Administrative fees 1 400 (1 326) - 74 74 - 100.0% 15 15
Advertising 3 282 (2 135) - 1 147 1 147 - 100.0% 1 662 1 662
Minor assets 2 868 (2 541) - 327 327 - 100.0% 850 850
Bursaries: Employees 140 (80) - 60 60 - 100.0% 29 29
Catering: Departmental activities
2 127 (1 487) - 640 640 - 100.0% 633 633
Communication (G&S) 5 690 1 150 - 6 840 6 840 - 100.0% 3 237 3 237
APPROPRIATION STATEMENTfor the year ended 31 March 2015
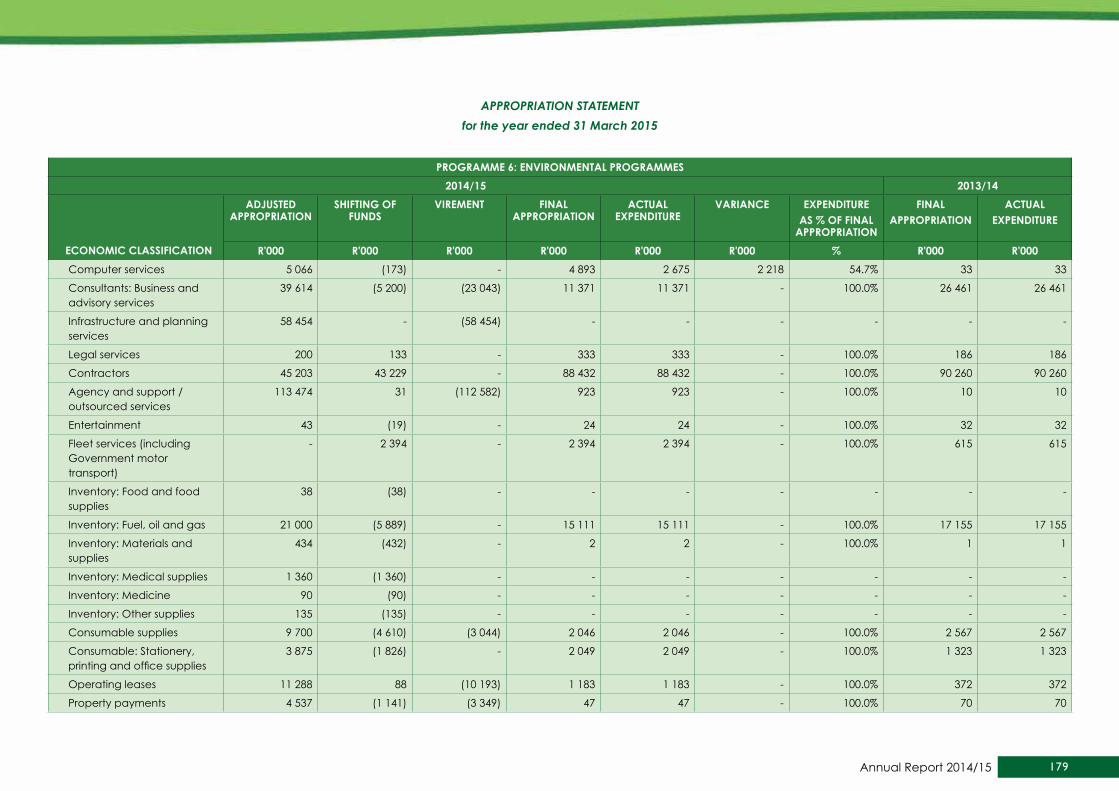
179Annual Report 2014/15
PROGRAMME 6: ENVIRONMENTAL PROGRAMMEs2014/15 2013/14
sub PROGRAMME
AdjusTEd APPROPRIATION
shIFTING OF FuNds
VIREMENT FINAL APPROPRIATION
ACTuAL EXPENdITuRE
VARIANCE EXPENdITuREAs % OF FINAL
APPROPRIATION
FINALAPPROPRIATION
ACTuALEXPENdITuRE
R'000 R'000 R'000 R'000 R'000 R'000 % R'000 R'000Computer services 5 066 (173) - 4 893 2 675 2 218 54.7% 33 33
Consultants: Business and advisory services
39 614 (5 200) (23 043) 11 371 11 371 - 100.0% 26 461 26 461
Infrastructure and planning services
58 454 - (58 454) - - - - - -
Legal services 200 133 - 333 333 - 100.0% 186 186
Contractors 45 203 43 229 - 88 432 88 432 - 100.0% 90 260 90 260
Agency and support / outsourced services
113 474 31 (112 582) 923 923 - 100.0% 10 10
Entertainment 43 (19) - 24 24 - 100.0% 32 32
Fleet services (including Government motor transport)
- 2 394 - 2 394 2 394 - 100.0% 615 615
Inventory: Food and food supplies
38 (38) - - - - - - -
Inventory: Fuel, oil and gas 21 000 (5 889) - 15 111 15 111 - 100.0% 17 155 17 155
Inventory: Materials and supplies
434 (432) - 2 2 - 100.0% 1 1
Inventory: Medical supplies 1 360 (1 360) - - - - - - -
Inventory: Medicine 90 (90) - - - - - - -
Inventory: Other supplies 135 (135) - - - - - - -
Consumable supplies 9 700 (4 610) (3 044) 2 046 2 046 - 100.0% 2 567 2 567
Consumable: Stationery, printing and office supplies
3 875 (1 826) - 2 049 2 049 - 100.0% 1 323 1 323
Operating leases 11 288 88 (10 193) 1 183 1 183 - 100.0% 372 372
Property payments 4 537 (1 141) (3 349) 47 47 - 100.0% 70 70
APPROPRIATION STATEMENTfor the year ended 31 March 2015
ECONOMIC CLAssIFICATION
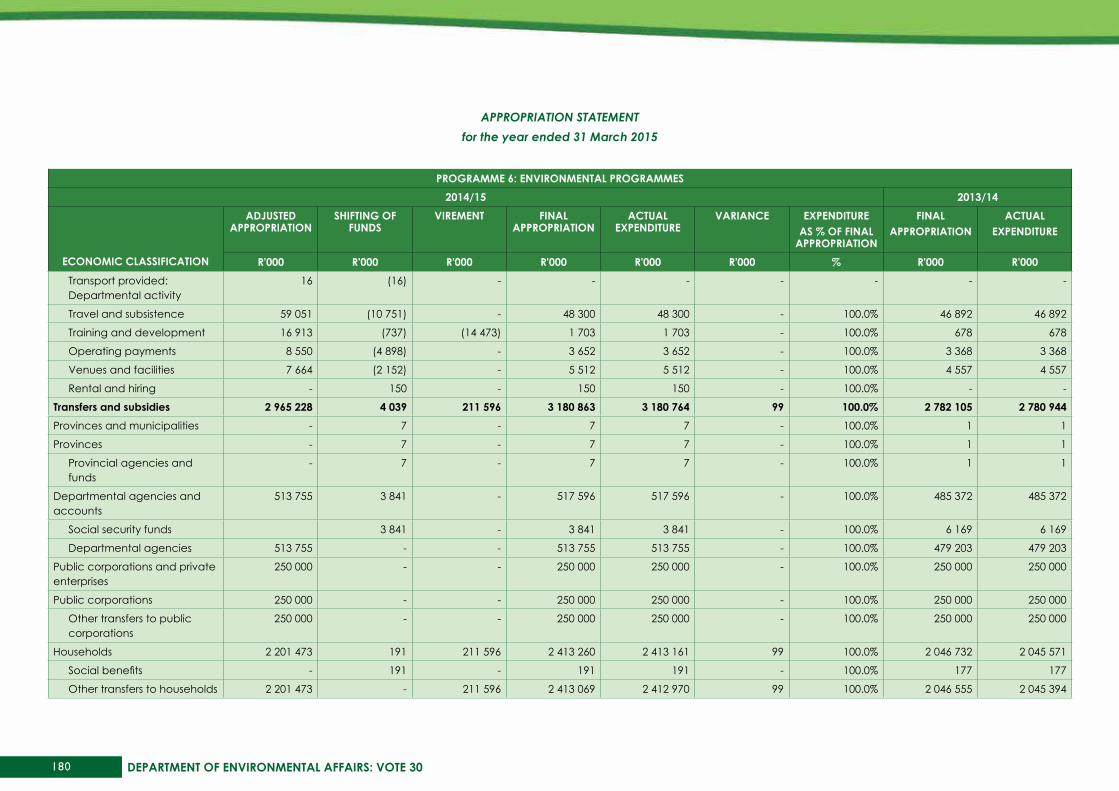
180 DEPARTMENT OF ENVIRONMENTAL AFFAIRS: VOTE 30
PROGRAMME 6: ENVIRONMENTAL PROGRAMMEs2014/15 2013/14
sub PROGRAMME
AdjusTEd APPROPRIATION
shIFTING OF FuNds
VIREMENT FINAL APPROPRIATION
ACTuAL EXPENdITuRE
VARIANCE EXPENdITuREAs % OF FINAL
APPROPRIATION
FINALAPPROPRIATION
ACTuALEXPENdITuRE
R'000 R'000 R'000 R'000 R'000 R'000 % R'000 R'000Transport provided: Departmental activity
16 (16) - - - - - - -
Travel and subsistence 59 051 (10 751) - 48 300 48 300 - 100.0% 46 892 46 892
Training and development 16 913 (737) (14 473) 1 703 1 703 - 100.0% 678 678
Operating payments 8 550 (4 898) - 3 652 3 652 - 100.0% 3 368 3 368
Venues and facilities 7 664 (2 152) - 5 512 5 512 - 100.0% 4 557 4 557
Rental and hiring - 150 - 150 150 - 100.0% - -
Transfers and subsidies 2 965 228 4 039 211 596 3 180 863 3 180 764 99 100.0% 2 782 105 2 780 944Provinces and municipalities - 7 - 7 7 - 100.0% 1 1
Provinces - 7 - 7 7 - 100.0% 1 1
Provincial agencies and funds
- 7 - 7 7 - 100.0% 1 1
Departmental agencies and accounts
513 755 3 841 - 517 596 517 596 - 100.0% 485 372 485 372
Social security funds 3 841 - 3 841 3 841 - 100.0% 6 169 6 169
Departmental agencies 513 755 - - 513 755 513 755 - 100.0% 479 203 479 203
Public corporations and private enterprises
250 000 - - 250 000 250 000 - 100.0% 250 000 250 000
Public corporations 250 000 - - 250 000 250 000 - 100.0% 250 000 250 000
Other transfers to public corporations
250 000 - - 250 000 250 000 - 100.0% 250 000 250 000
Households 2 201 473 191 211 596 2 413 260 2 413 161 99 100.0% 2 046 732 2 045 571
Social benefits - 191 - 191 191 - 100.0% 177 177
Other transfers to households 2 201 473 - 211 596 2 413 069 2 412 970 99 100.0% 2 046 555 2 045 394
APPROPRIATION STATEMENTfor the year ended 31 March 2015
ECONOMIC CLAssIFICATION
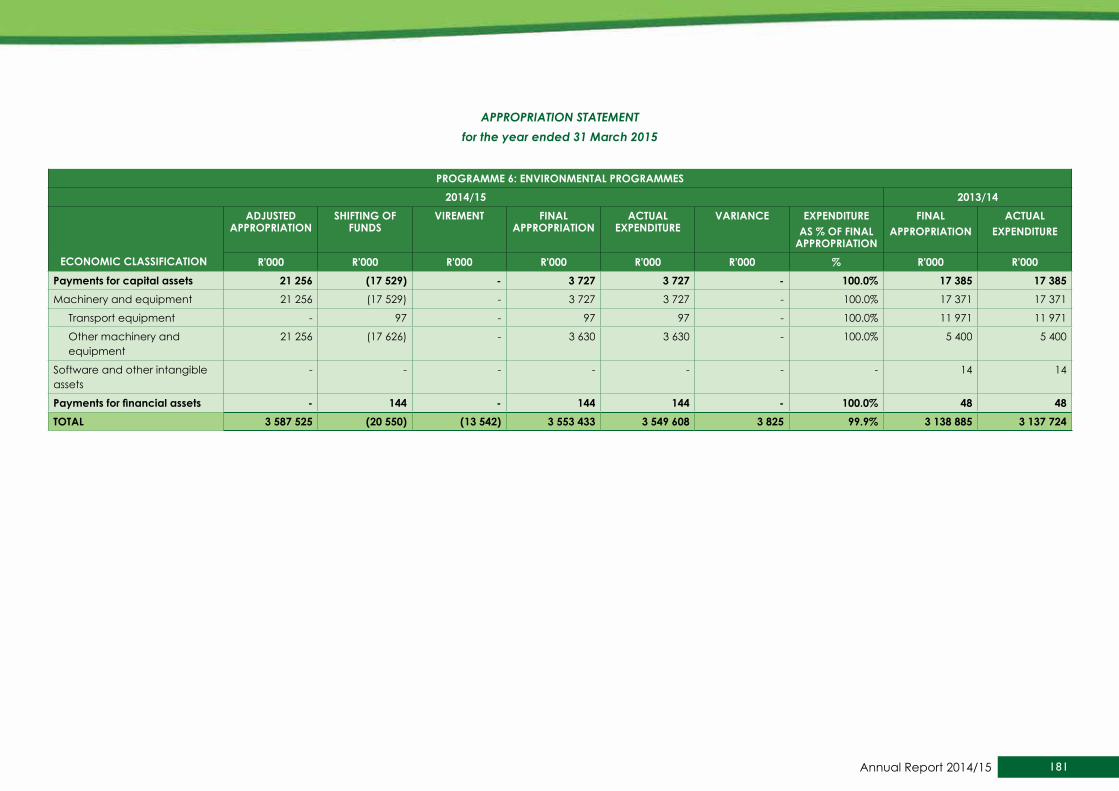
181Annual Report 2014/15
PROGRAMME 6: ENVIRONMENTAL PROGRAMMEs2014/15 2013/14
sub PROGRAMME
AdjusTEd APPROPRIATION
shIFTING OF FuNds
VIREMENT FINAL APPROPRIATION
ACTuAL EXPENdITuRE
VARIANCE EXPENdITuREAs % OF FINAL
APPROPRIATION
FINALAPPROPRIATION
ACTuALEXPENdITuRE
R'000 R'000 R'000 R'000 R'000 R'000 % R'000 R'000Payments for capital assets 21 256 (17 529) - 3 727 3 727 - 100.0% 17 385 17 385Machinery and equipment 21 256 (17 529) - 3 727 3 727 - 100.0% 17 371 17 371
Transport equipment - 97 - 97 97 - 100.0% 11 971 11 971
Other machinery and equipment
21 256 (17 626) - 3 630 3 630 - 100.0% 5 400 5 400
Software and other intangible assets
- - - - - - - 14 14
Payments for financial assets - 144 - 144 144 - 100.0% 48 48TOTAL 3 587 525 (20 550) (13 542) 3 553 433 3 549 608 3 825 99.9% 3 138 885 3 137 724
APPROPRIATION STATEMENTfor the year ended 31 March 2015
ECONOMIC CLAssIFICATION
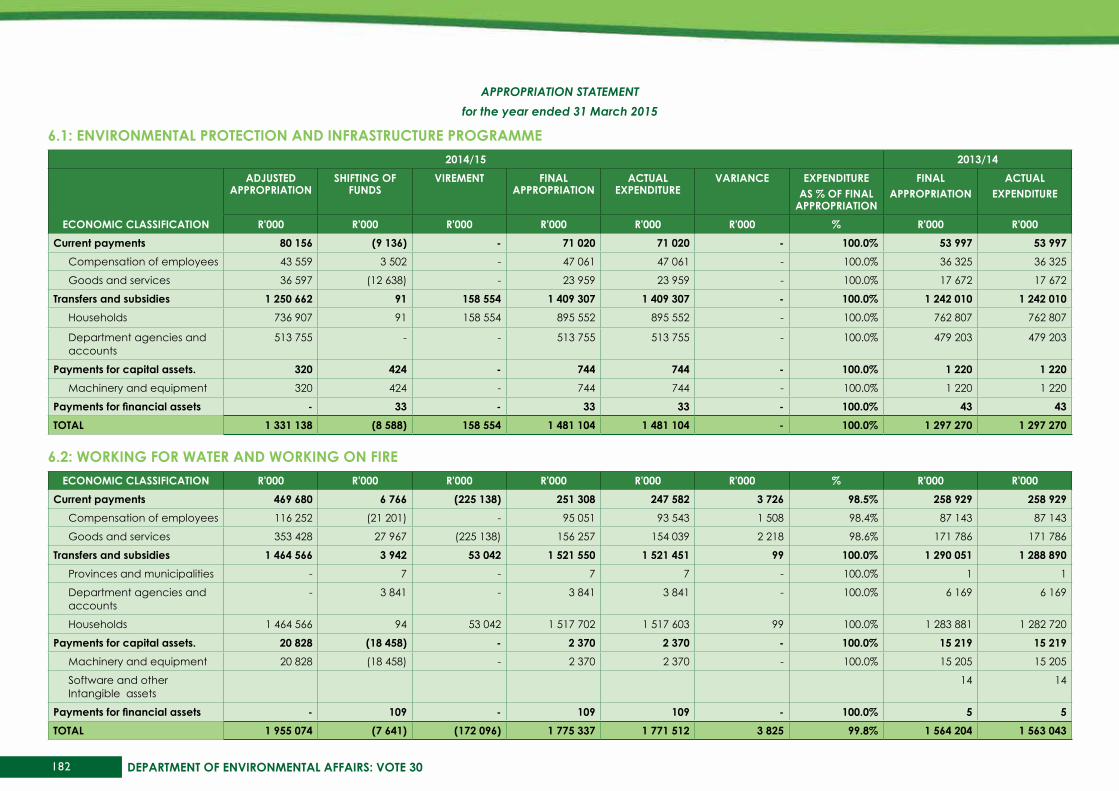
182 DEPARTMENT OF ENVIRONMENTAL AFFAIRS: VOTE 30
6.1: ENVIRONMENTAL PROTECTION ANd INFRAsTRuCTuRE PROGRAMME2014/15 2013/14
ECONOMIC CLAssIFICATION
AdjusTEd APPROPRIATION
shIFTING OF FuNds
VIREMENT FINAL APPROPRIATION
ACTuAL EXPENdITuRE
VARIANCE EXPENdITuREAs % OF FINAL
APPROPRIATION
FINALAPPROPRIATION
ACTuALEXPENdITuRE
R'000 R'000 R'000 R'000 R'000 R'000 % R'000 R'000Current payments 80 156 (9 136) - 71 020 71 020 - 100.0% 53 997 53 997
Compensation of employees 43 559 3 502 - 47 061 47 061 - 100.0% 36 325 36 325
Goods and services 36 597 (12 638) - 23 959 23 959 - 100.0% 17 672 17 672
Transfers and subsidies 1 250 662 91 158 554 1 409 307 1 409 307 - 100.0% 1 242 010 1 242 010Households 736 907 91 158 554 895 552 895 552 - 100.0% 762 807 762 807
Department agencies and accounts
513 755 - - 513 755 513 755 - 100.0% 479 203 479 203
Payments for capital assets. 320 424 - 744 744 - 100.0% 1 220 1 220Machinery and equipment 320 424 - 744 744 - 100.0% 1 220 1 220
Payments for financial assets - 33 - 33 33 - 100.0% 43 43TOTAL 1 331 138 (8 588) 158 554 1 481 104 1 481 104 - 100.0% 1 297 270 1 297 270
6.2: wORkING FOR wATER ANd wORkING ON FIREECONOMIC CLAssIFICATION R'000 R'000 R'000 R'000 R'000 R'000 % R'000 R'000
Current payments 469 680 6 766 (225 138) 251 308 247 582 3 726 98.5% 258 929 258 929Compensation of employees 116 252 (21 201) - 95 051 93 543 1 508 98.4% 87 143 87 143
Goods and services 353 428 27 967 (225 138) 156 257 154 039 2 218 98.6% 171 786 171 786
Transfers and subsidies 1 464 566 3 942 53 042 1 521 550 1 521 451 99 100.0% 1 290 051 1 288 890Provinces and municipalities - 7 - 7 7 - 100.0% 1 1
Department agencies and accounts
- 3 841 - 3 841 3 841 - 100.0% 6 169 6 169
Households 1 464 566 94 53 042 1 517 702 1 517 603 99 100.0% 1 283 881 1 282 720
Payments for capital assets. 20 828 (18 458) - 2 370 2 370 - 100.0% 15 219 15 219Machinery and equipment 20 828 (18 458) - 2 370 2 370 - 100.0% 15 205 15 205
Software and other Intangible assets
14 14
Payments for financial assets - 109 - 109 109 - 100.0% 5 5TOTAL 1 955 074 (7 641) (172 096) 1 775 337 1 771 512 3 825 99.8% 1 564 204 1 563 043
APPROPRIATION STATEMENTfor the year ended 31 March 2015
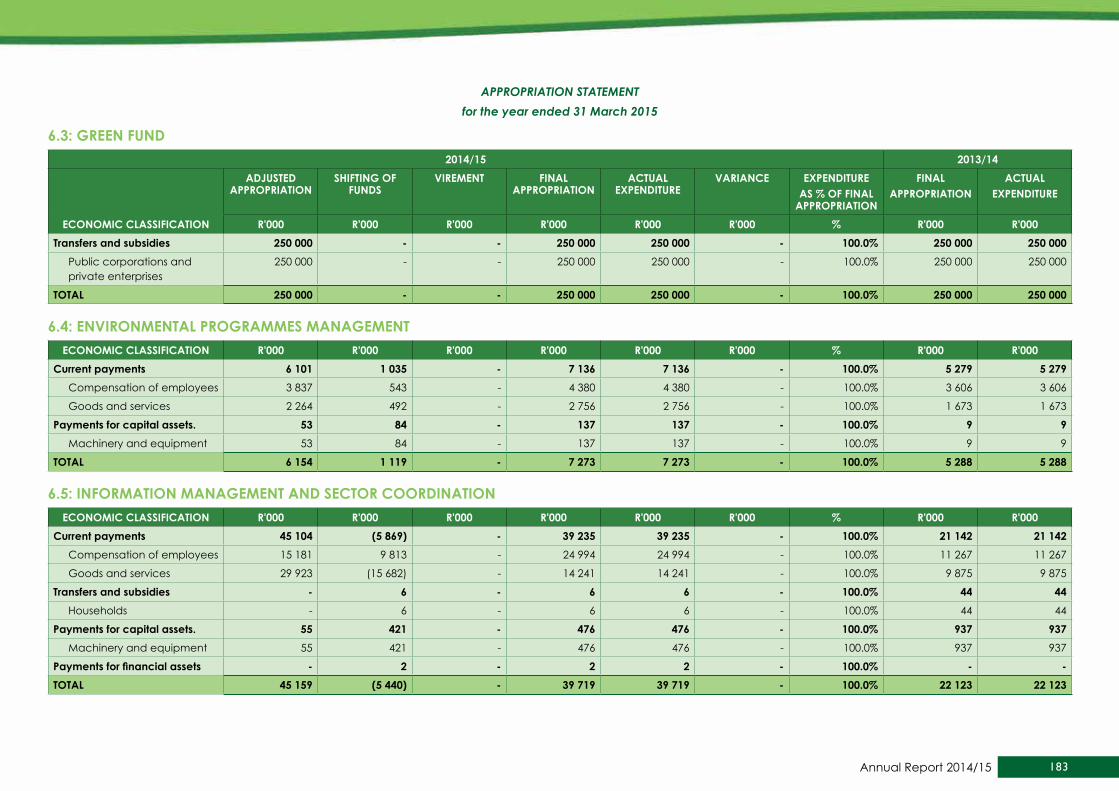
183Annual Report 2014/15
6.3: GREEN FuNd2014/15 2013/14
ECONOMIC CLAssIFICATION
AdjusTEd APPROPRIATION
shIFTING OF FuNds
VIREMENT FINAL APPROPRIATION
ACTuAL EXPENdITuRE
VARIANCE EXPENdITuREAs % OF FINAL
APPROPRIATION
FINALAPPROPRIATION
ACTuALEXPENdITuRE
R'000 R'000 R'000 R'000 R'000 R'000 % R'000 R'000Transfers and subsidies 250 000 - - 250 000 250 000 - 100.0% 250 000 250 000
Public corporations and private enterprises
250 000 - - 250 000 250 000 - 100.0% 250 000 250 000
TOTAL 250 000 - - 250 000 250 000 - 100.0% 250 000 250 000
6.4: ENVIRONMENTAL PROGRAMMEs MANAGEMENTECONOMIC CLAssIFICATION R'000 R'000 R'000 R'000 R'000 R'000 % R'000 R'000
Current payments 6 101 1 035 - 7 136 7 136 - 100.0% 5 279 5 279Compensation of employees 3 837 543 - 4 380 4 380 - 100.0% 3 606 3 606
Goods and services 2 264 492 - 2 756 2 756 - 100.0% 1 673 1 673
Payments for capital assets. 53 84 - 137 137 - 100.0% 9 9Machinery and equipment 53 84 - 137 137 - 100.0% 9 9
TOTAL 6 154 1 119 - 7 273 7 273 - 100.0% 5 288 5 288
6.5: INFORMATION MANAGEMENT ANd sECTOR COORdINATIONECONOMIC CLAssIFICATION R'000 R'000 R'000 R'000 R'000 R'000 % R'000 R'000
Current payments 45 104 (5 869) - 39 235 39 235 - 100.0% 21 142 21 142Compensation of employees 15 181 9 813 - 24 994 24 994 - 100.0% 11 267 11 267
Goods and services 29 923 (15 682) - 14 241 14 241 - 100.0% 9 875 9 875
Transfers and subsidies - 6 - 6 6 - 100.0% 44 44Households - 6 - 6 6 - 100.0% 44 44
Payments for capital assets. 55 421 - 476 476 - 100.0% 937 937Machinery and equipment 55 421 - 476 476 - 100.0% 937 937
Payments for financial assets - 2 - 2 2 - 100.0% - -TOTAL 45 159 (5 440) - 39 719 39 719 - 100.0% 22 123 22 123
APPROPRIATION STATEMENTfor the year ended 31 March 2015
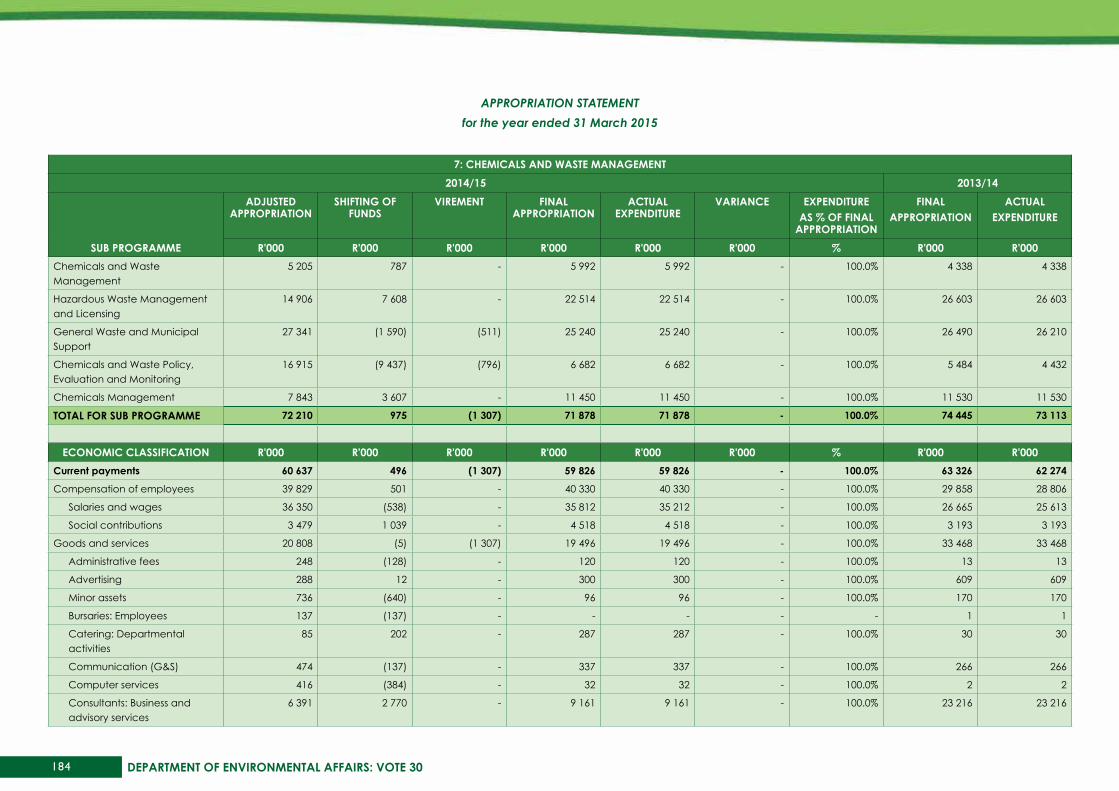
184 DEPARTMENT OF ENVIRONMENTAL AFFAIRS: VOTE 30
7: ChEMICALs ANd wAsTE MANAGEMENT2014/15 2013/14
sub PROGRAMME
AdjusTEd APPROPRIATION
shIFTING OF FuNds
VIREMENT FINAL APPROPRIATION
ACTuAL EXPENdITuRE
VARIANCE EXPENdITuREAs % OF FINAL
APPROPRIATION
FINALAPPROPRIATION
ACTuALEXPENdITuRE
R'000 R'000 R'000 R'000 R'000 R'000 % R'000 R'000Chemicals and Waste Management
5 205 787 - 5 992 5 992 - 100.0% 4 338 4 338
Hazardous Waste Management and Licensing
14 906 7 608 - 22 514 22 514 - 100.0% 26 603 26 603
General Waste and Municipal Support
27 341 (1 590) (511) 25 240 25 240 - 100.0% 26 490 26 210
Chemicals and Waste Policy, Evaluation and Monitoring
16 915 (9 437) (796) 6 682 6 682 - 100.0% 5 484 4 432
Chemicals Management 7 843 3 607 - 11 450 11 450 - 100.0% 11 530 11 530
TOTAL FOR sub PROGRAMME 72 210 975 (1 307) 71 878 71 878 - 100.0% 74 445 73 113
ECONOMIC CLAssIFICATION R'000 R'000 R'000 R'000 R'000 R'000 % R'000 R'000Current payments 60 637 496 (1 307) 59 826 59 826 - 100.0% 63 326 62 274
Compensation of employees 39 829 501 - 40 330 40 330 - 100.0% 29 858 28 806
Salaries and wages 36 350 (538) - 35 812 35 212 - 100.0% 26 665 25 613
Social contributions 3 479 1 039 - 4 518 4 518 - 100.0% 3 193 3 193
Goods and services 20 808 (5) (1 307) 19 496 19 496 - 100.0% 33 468 33 468
Administrative fees 248 (128) - 120 120 - 100.0% 13 13
Advertising 288 12 - 300 300 - 100.0% 609 609
Minor assets 736 (640) - 96 96 - 100.0% 170 170
Bursaries: Employees 137 (137) - - - - - 1 1
Catering: Departmental activities
85 202 - 287 287 - 100.0% 30 30
Communication (G&S) 474 (137) - 337 337 - 100.0% 266 266
Computer services 416 (384) - 32 32 - 100.0% 2 2
Consultants: Business and advisory services
6 391 2 770 - 9 161 9 161 - 100.0% 23 216 23 216
APPROPRIATION STATEMENTfor the year ended 31 March 2015

185Annual Report 2014/15
APPROPRIATION STATEMENTfor the year ended 31 March 2015
7: ChEMICALs ANd wAsTE MANAGEMENT2014/15 2013/14
sub PROGRAMME
AdjusTEd APPROPRIATION
shIFTING OF FuNds
VIREMENT FINAL APPROPRIATION
ACTuAL EXPENdITuRE
VARIANCE EXPENdITuREAs % OF FINAL
APPROPRIATION
FINALAPPROPRIATION
ACTuALEXPENdITuRE
R'000 R'000 R'000 R'000 R'000 R'000 % R'000 R'000Legal services - 219 - 219 219 - 100.0% 966 966
Entertainment - 1 - 1 1 - 100.0% 37 37
Inventory: Other supplies 282 (282) - - - - - - -
Consumable supplies - 97 - 97 97 - 100.0% 134 134
Consumable: Stationery, printing and office supplies
2 017 (1 895) - 122 122 - 100.0% 100 100
Operating leases 336 (259) - 77 77 - 100.0% 38 38
Property payments 70 (70) - - - - - - -
Travel and subsistence 2 628 4 238 - 6 866 6 866 - 100.0% 5 816 5 816
Training and development 276 221 - 497 497 - 100.0% 700 700
Operating payments 3 093 (1 512) (1 307) 274 274 - 100.0% 419 419
Venues and facilities 3 310 (2 596) - 714 714 - 100.0% 951 951
Rental and hiring 21 275 - 296 296 - 100.0% - -
Transfers and subsidies 11 025 - - 11 025 11 025 - 100.0% 10 755 10 475
Departmental agencies and accounts
11 025 - - 11 025 11 025 - 100.0% 10 500 10 220
Departmental agencies 11 025 - - 11 025 11 025 - 100.0% 10 500 10 220
Payments for capital assets 548 474 - 1 022 1 022 - 100.0% 364 364
Machinery and equipment 548 474 - 1 022 1 022 - 100.0% 364 364
Transport equipment - - - - - - - 29 29
Other machinery and equipment
548 474 - 1 022 1 022 - 100.0% 335 335
Payments for financial assets - 5 - 5 5 - 100.0% - -
TOTAL 72 210 975 (1 307) 71 878 71 878 - 100.0% 74 445 73 113
ECONOMIC CLAssIFICATION

186 DEPARTMENT OF ENVIRONMENTAL AFFAIRS: VOTE 30
7.1: ChEMICALs ANd wAsTE MANAGEMENT2014/15 2013/14
ECONOMIC CLAssIFICATION
AdjusTEd APPROPRIATION
shIFTING OF FuNds
VIREMENT FINAL APPROPRIATION
ACTuAL EXPENdITuRE
VARIANCE EXPENdITuREAs % OF FINAL
APPROPRIATION
FINALAPPROPRIATION
ACTuALEXPENdITuRE
R'000 R'000 R'000 R'000 R'000 R'000 % R'000 R'000Current payments 5 083 (53) - 5 030 5 030 - 100.0% 4 070 4 070
Compensation of employees 1 948 941 - 2 889 2 889 - 100.0% 1 815 1 815
Goods and services 3 135 (994) - 2 141 2 141 - 100.0% 2 255 2 255
Transfers and subsidies - - - - - - - 17 17Households - - - - - - - 17 17
Payments for capital assets. 122 840 - 962 962 - 100.0% 251 251Machinery and equipment 122 840 - 962 962 - 100.0% 251 251
TOTAL 5 205 787 - 5 992 5 992 - 100.0% 4 338 4 338
7.2: hAZARdOus wAsTE MANAGEMENT ANd LICENsINGECONOMIC CLAssIFICATION R'000 R'000 R'000 R'000 R'000 R'000 % R'000 R'000
Current payments 14 763 7 738 - 22 501 22 501 - 100.0% 26 502 26 502Compensation of employees 11 908 1 372 - 13 280 13 280 - 100.0% 8 256 8 256
Goods and services 2 855 6 366 - 9 221 9 221 - 100.0% 18 246 18 246
Transfers and subsidies - - - - - - - 24 24Households - - - - - - - 24 24
Payments for capital assets. 143 (130) - 13 13 - 100.0% 77 77Machinery and equipment 143 (130) - 13 13 - 100.0% 77 77
TOTAL 14 906 7 608 - 22 514 22 514 - 100.0% 26 603 26 603
APPROPRIATION STATEMENTfor the year ended 31 March 2015

187Annual Report 2014/15
7.3: GENERAL wAsTE ANd MuNICIPAL suPPORT2014/15 2013/14
ECONOMIC CLAssIFICATION
AdjusTEd APPROPRIATION
shIFTING OF FuNds
VIREMENT FINAL APPROPRIATION
ACTuAL EXPENdITuRE
VARIANCE EXPENdITuREAs % OF FINAL
APPROPRIATION
FINALAPPROPRIATION
ACTuALEXPENdITuRE
R'000 R'000 R'000 R'000 R'000 R'000 % R'000 R'000Current payments 16 227 (1 533) (511) 14 183 14 183 - 100.0% 15 782 15 782
Compensation of employees 10 285 274 - 10 559 10 559 - 100.0% 8 870 8 870
Goods and services 5 942 (1 807) (511) 3 624 3 624 - 100.0% 6 912 6 912
Transfers and subsidies 11 025 - - 11 025 11 025 - 100.0% 10 708 10 428Department agencies and accounts
11 025 - - 11 025 11 025 - 100.0% 10 500 10 220
Non –profit institutions - - - - - - - 117 117
Households - - - - - - - 91 91
Payments for capital assets. 89 (59) - 30 30 - 100.0% - -Machinery and equipment 89 (59) - 30 30 - 100.0% - -
Payments for financial assets - 2 - 2 2 - 100.0% - -TOTAL 27 341 (1 590) (511) 25 240 25 240 - 100.0% 26 490 26 210
7.4: ChEMICALs ANd wAsTE POLICy, EVALuATION ANd MONITORINGECONOMIC CLAssIFICATION R'000 R'000 R'000 R'000 R'000 R'000 % R'000 R'000
Current payments 16 775 (9 297) (796) 6 682 6 682 - 100.0% 5 484 40 32Compensation of employees 8 800 (3 045) - 5 755 5 755 - 100.0% 4 493 3 891
Goods and services 7 975 (6 252) (796) 927 927 - 100.0% 541 541
Payments for capital assets. 140 (140) - - - - - - -Machinery and equipment 140 (140) - - - - - - -
TOTAL 16 915 (9 437) (796) 6 682 6 682 - 100.0% 5 484 4 432
APPROPRIATION STATEMENTfor the year ended 31 March 2015

188 DEPARTMENT OF ENVIRONMENTAL AFFAIRS: VOTE 30
7.5: ChEMICALs MANAGEMENT2014/15 2013/14
ECONOMIC CLAssIFICATION
AdjusTEd APPROPRIATION
shIFTING OF FuNds
VIREMENT FINAL APPROPRIATION
ACTuAL EXPENdITuRE
VARIANCE EXPENdITuREAs % OF FINAL
APPROPRIATION
FINALAPPROPRIATION
ACTuALEXPENdITuRE
R'000 R'000 R'000 R'000 R'000 R'000 % R'000 R'000Current Payments 7 789 3 641 - 11 430 11 430 - 100.0% 11 488 11 488
Compensation of employees 6 888 959 - 7 847 7 847 - 100.0% 5 974 5 974
Goods and services 901 2 682 - 3 583 3 583 - 100.0% 5 514 5 514
Transfers and subsidies - - - - - - - 6 6Households - - - - - - - 6 6
Payments for capital assets. 54 (37) - 17 17 - 100.0% 36 36Machinery and equipment 54 (37) - 17 17 - 100.0% 36 36
Payments for financial assets - 3 - 3 3 - 100.0% - -TOTAL 7 843 3 607 - 11 450 11 450 - 100.0% 11 530 11 530
APPROPRIATION STATEMENTfor the year ended 31 March 2015

189Annual Report 2014/15
1. Detail of transfers and subsidies as per Appropriation Act (after Virement):
Detail of these transactions can be viewed in the note on Transfers and subsidies, notes and Annexure 1 (A-E) to the Annual Financial Statements.
2. Detail of specifically and exclusively appropriated amounts voted (after Virement):
Detail of these transactions can be viewed in note 1 (Annual Appropriation) to the Annual Financial Statements.
3. Detail on payments for financial assets
Detail of these transactions per programme can be viewed in the note on Payments for financial assets to the Annual Financial Statements.
4. Explanations of material variances from Amounts Voted (after Virement):
4.1 PER PROGRAMME FINAL APPROPRIATIONR’000
ACTuAL EXPENdITuRE R’000
VARIANCE R’000
VARIANCE As A % OF FINAL APPROPRIATION
1. Administration 731 335 731 335 - -
2. Legal, Authorisations and Compliance 102 123 100 621 1 502 1.5%
3. Oceans and Coasts 349 257 349 257 - -
4. Climate Change and Air Quality 229 292 229 292 - -
5. Biodiversity and Conservation 643 068 643 068 - -
6. Environmental Programmes 3 553 433 3 549 608 3 825 0.1%
7. Chemicals and Waste Management 71 878 71 878 - -
TOTAL 5 680 386 5 675 059 5 327 99.9%
NOTES TO THE APPROPRIATION STATEMENTfor the year ended 31 March 2015
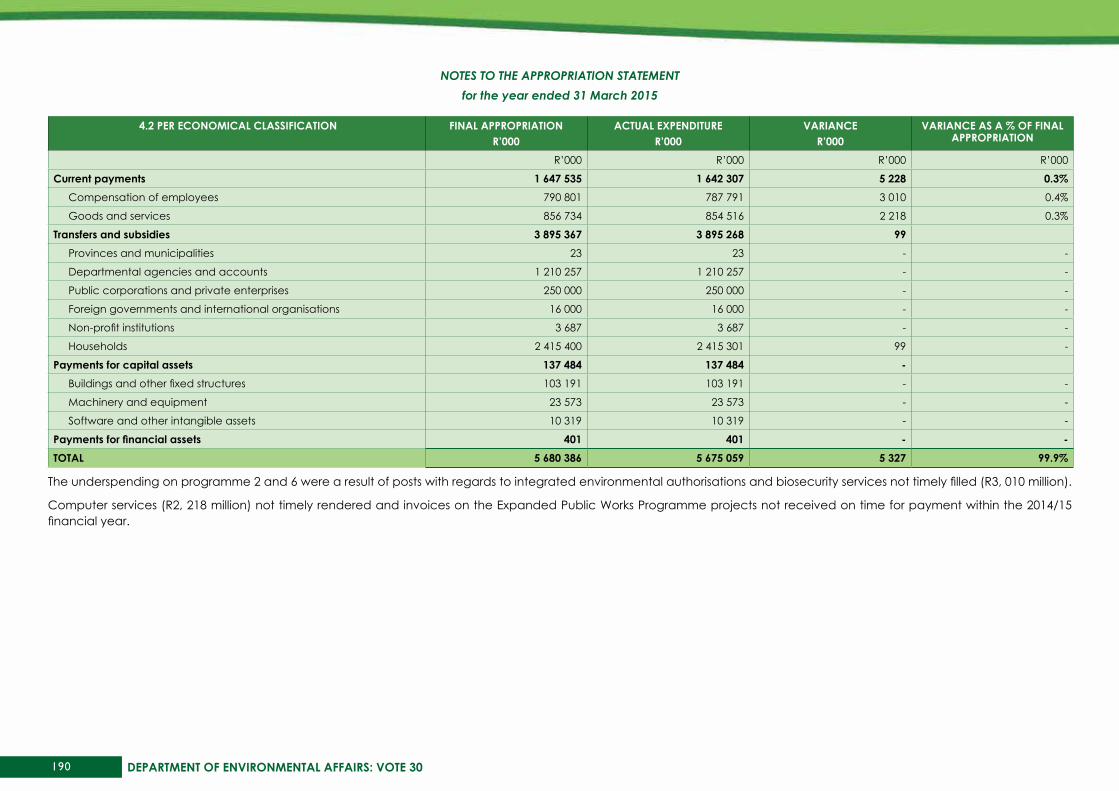
190 DEPARTMENT OF ENVIRONMENTAL AFFAIRS: VOTE 30
4.2 PER ECONOMICAL CLAssIFICATION FINAL APPROPRIATIONR’000
ACTuAL EXPENdITuRE R’000
VARIANCE R’000
VARIANCE As A % OF FINAL APPROPRIATION
R’000 R’000 R’000 R’000
Current payments 1 647 535 1 642 307 5 228 0.3%Compensation of employees 790 801 787 791 3 010 0.4%
Goods and services 856 734 854 516 2 218 0.3%
Transfers and subsidies 3 895 367 3 895 268 99Provinces and municipalities 23 23 - -
Departmental agencies and accounts 1 210 257 1 210 257 - -
Public corporations and private enterprises 250 000 250 000 - -
Foreign governments and international organisations 16 000 16 000 - -
Non-profit institutions 3 687 3 687 - -
Households 2 415 400 2 415 301 99 -
Payments for capital assets 137 484 137 484 -Buildings and other fixed structures 103 191 103 191 - -
Machinery and equipment 23 573 23 573 - -
Software and other intangible assets 10 319 10 319 - -
Payments for financial assets 401 401 - -TOTAL 5 680 386 5 675 059 5 327 99.9%
The underspending on programme 2 and 6 were a result of posts with regards to integrated environmental authorisations and biosecurity services not timely filled (R3, 010 million).
Computer services (R2, 218 million) not timely rendered and invoices on the Expanded Public Works Programme projects not received on time for payment within the 2014/15 financial year.
NOTES TO THE APPROPRIATION STATEMENTfor the year ended 31 March 2015

191Annual Report 2014/15
Note 2014/15 2013/14
R'000 R'000
REVENuE
Annual appropriation 1 5 680 386 5 206 842
Departmental revenue 2 32 022 29 572
Aid assistance 3 6 690 3 571
TOTAL REVENuE 5 719 098 5 239 985
EXPENdITuRE
Current expenditure
Compensation of employees 4 787 791 659 222
Goods and services 5 854 516 873 004
Aid assistance 3 11 861 5 715
Total current expenditure 1 654 168 1 537 941
Transfers and subsidies
Transfers and subsidies 7 3 895 268 3 446 306
Total transfers and subsidies 3 895 268 3 446 306
Expenditure for capital assets
Tangible assets 8 127 128 220 347
Intangible assets 8 10 319 1 272
Total expenditure for capital assets 137 447 221 619
Payments for financial assets 6 401 156
TOTAL EXPENdITuRE 5 687 284 5 206 022
suRPLus FOR ThE yEAR 31 814 33 963
Reconciliation of Net surplus for the year
Voted funds 5 327 6 535
Annual appropriation 5 327 6 535
Departmental revenue and NRF Receipts 13 32 022 29 572
Aid assistance 3 (5 535) (2 144)
suRPLus FOR ThE yEAR 31 814 33 963
STATEMENT OF FINANCIAL PERFORMANCEfor the year ended 31 March 2015

192 DEPARTMENT OF ENVIRONMENTAL AFFAIRS: VOTE 30
Note 2014/15 2013/14R'000 R'000
AssETs
Current assets 65 355 37 385Cash and cash equivalents 9 31 164 20 059
Prepayments and advances 10 577 319
Receivables 11 25 883 14 536
Aid assistance receivable 3 7 731 2 471
Non-current assets 8 027 -Receivables 11 8 027 -
TOTAL AssETs 73 382 37 385
LIAbILITIEs
Current liabilities 66 251 36 747Voted funds to be surrendered to the Revenue Fund 12 5 327 6 535
Departmental revenue and NRF Receipts to be surrendered to the Revenue Fund 13 6 217 3 877
Payables 14 54 707 26 060
Aid assistance Repayable 3 - 275
TOTAL LIAbILITIEs 66 251 36 747
NET AssETs 7 131 638
Represented by:
Recoverable revenue 7 131 638
TOTAL 7 131 638
STATEMENT OF FINANCIAL POSITIONas at 31 March 2015

193Annual Report 2014/15
NET AssETsNote 2014/15 2013/14
R'000 R'000
Recoverable revenueOpening balance 638 752
Transfers: 6 493 (114)Irrecoverable amounts written off 6.2 (58) (49)
Debts recovered (included in departmental receipts) (164) (340)
Debts raised 6 715 275
Closing balance 7 131 638
TOTAL 7 131 638
STATEMENT OF CHANGES IN NET ASSESTfor the year ended 31 March 2015
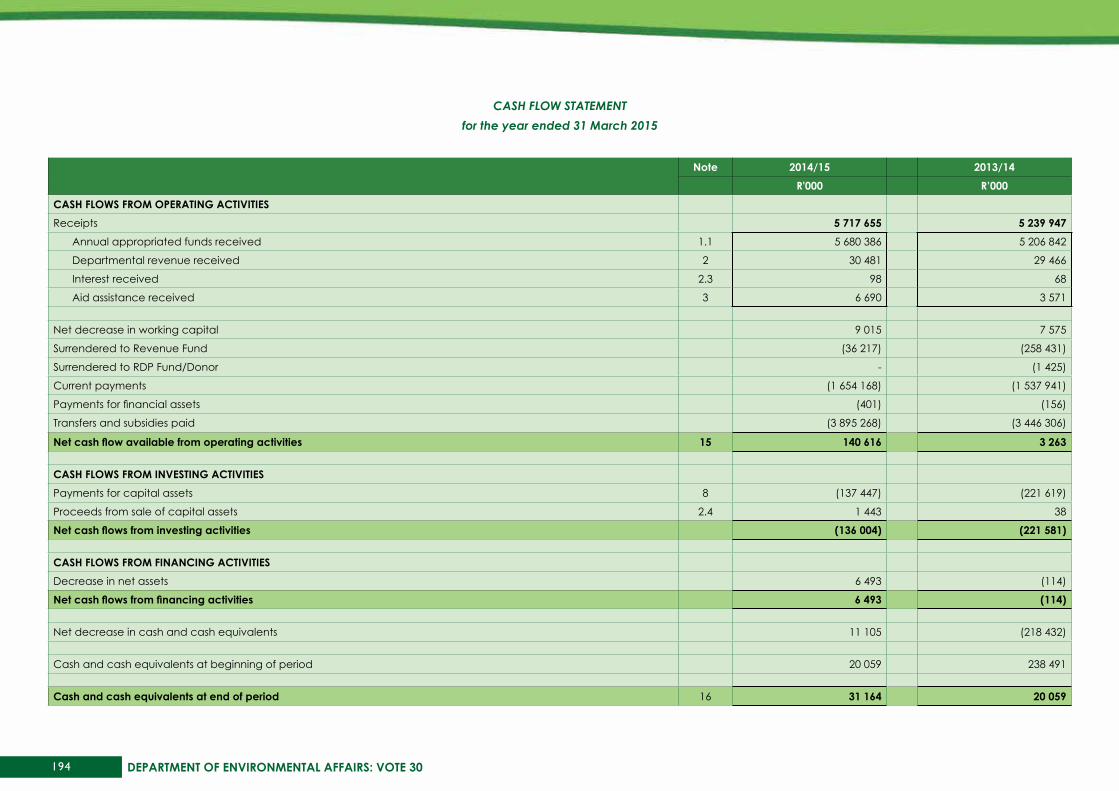
194 DEPARTMENT OF ENVIRONMENTAL AFFAIRS: VOTE 30
Note 2014/15 2013/14R'000 R’000
CAsh FLOws FROM OPERATING ACTIVITIEsReceipts 5 717 655 5 239 947
Annual appropriated funds received 1.1 5 680 386 5 206 842
Departmental revenue received 2 30 481 29 466
Interest received 2.3 98 68
Aid assistance received 3 6 690 3 571
Net decrease in working capital 9 015 7 575
Surrendered to Revenue Fund (36 217) (258 431)
Surrendered to RDP Fund/Donor - (1 425)
Current payments (1 654 168) (1 537 941)
Payments for financial assets (401) (156)
Transfers and subsidies paid (3 895 268) (3 446 306)
Net cash flow available from operating activities 15 140 616 3 263
CAsh FLOws FROM INVEsTING ACTIVITIEsPayments for capital assets 8 (137 447) (221 619)
Proceeds from sale of capital assets 2.4 1 443 38
Net cash flows from investing activities (136 004) (221 581)
CAsh FLOws FROM FINANCING ACTIVITIEsDecrease in net assets 6 493 (114)
Net cash flows from financing activities 6 493 (114)
Net decrease in cash and cash equivalents 11 105 (218 432)
Cash and cash equivalents at beginning of period 20 059 238 491
Cash and cash equivalents at end of period 16 31 164 20 059
CASH FLOW STATEMENTfor the year ended 31 March 2015

195Annual Report 2014/15
Summary of significant accounting policies The financial statements have been prepared in accordance with the following policies, which have been applied consistently in all material aspects, unless otherwise indicated. The historical cost convention has been used, except where otherwise indicated. Management has used assessments and estimates in preparing the annual financial statements. These are based on the best information available at the time of preparation.Where appropriate and meaningful, additional information has been disclosed to enhance the usefulness of the financial statements and to comply with the statutory requirements of the Public Finance Management Act (PFMA), Act 1 of 1999 (as amended by Act 29 of 1999), and the Treasury Regulations issued in terms of the PFMA and the annual Division of Revenue Act.
1 basis of preparationThe financial statements have been prepared in accordance with the Modified Cash Standard.
2 Going concernThe financial statements have been prepared on a going concern basis.
3 Presentation currencyAmounts have been presented in the currency of the South African Rand (R) which is also the functional currency of the department.
4 RoundingUnless otherwise stated financial figures have been rounded to the nearest one thousand Rand (R’000).
5 Foreign currency translationCash flows arising from foreign currency transactions are translated into South African Rand using the exchange rates prevailing at the date of payment / receipt.
6 Comparative information6.1 Prior period comparative information
Prior period comparative information has been presented in the current year’s financial statements.
Where necessary figures included in the prior period financial statements have been reclassified to ensure that the format in which the information is presented is consistent with the format of the current year’s financial statements.
6.2 Current year comparison with budget
A comparison between the approved, final budget and actual amounts for each programme and economic classification is included in the appropriation statement.
7 Revenue7.1 Appropriated funds
Appropriated funds comprises of departmental allocations.
Appropriated funds are recognised in the statement of financial performance on the date the appropriation becomes effective.
Adjustments made in terms of the adjustments budget process are recognised in the statement of financial performance on the date the adjustments become effective.
The net amount of any appropriated funds due to / from the relevant revenue fund at the reporting date is recognised as a payable / receivable in the statement of financial position.
ACCOUNTING POLICIESfor the year ended 31 March 2015

196 DEPARTMENT OF ENVIRONMENTAL AFFAIRS: VOTE 30
7.2 Departmental revenue
Departmental revenue is recognised in the statement of financial performance when received and is subsequently paid into the relevant revenue fund, unless stated otherwise.Any amount owing to the relevant revenue fund at the reporting date is recognised as a payable in the statement of financial position.
7.3 Accrued departmental revenue
Accruals in respect of departmental revenue (excluding tax revenue) are recorded in the notes to the financial statements when:
• it is probable that the economic benefits or service potential associated with the transaction will flow to the department; and • the amount of revenue can be measured reliably.
The accrued revenue is measured at the fair value of the consideration receivable.
Accrued tax revenue (and related interest and / penalties) is measured at amounts receivable from collecting agents.
8 Expenditure8.1 Compensation of employees
8.1.1 Salaries and wages
Salaries and wages are recognised in the statement of financial performance on the date of payment.
8.1.2 Social contributions
Social contributions made by the department in respect of current employees are recognised in the statement of financial performance on the date of payment.
Social contributions made by the department in respect of ex-employees are classified as transfers to households in the statement of financial performance on the date of payment.
8.2 Other expenditure
Other expenditure (such as goods and services, transfers and subsidies and payments for capital assets) is recognised in the statement of financial performance on the date of payment.
The expense is classified as a capital expense if the total consideration paid is more than the capitalisation threshold.
8.3 Accrued expenditure payable
Accrued expenditure payable is recorded in the notes to the financial statements when the goods are received or, in the case of services, when they are rendered to the department.
Accrued expenditure payable is measured at cost.
8.4 Leases8.4.1 Operating leases
Operating lease payments made during the reporting period are recognised as current expenditure in the statement of financial performance on the date of payment.
The operating lease commitments are recorded in the notes to the financial statements.
ACCOUNTING POLICIESfor the year ended 31 March 2015

197Annual Report 2014/15
8.4.2 Finance leases
Finance lease payments made during the reporting period are recognised as capital expenditure in the statement of financial performance on the date of payment.
The finance lease commitments are recorded in the notes to the financial statements and are not apportioned between the capital and interest portions.
Finance lease assets acquired at the end of the lease term are recorded and measured at the lower of:
• cost, being the fair value of the asset; or • the sum of the minimum lease payments made, including any payments made to acquire ownership at the end of the lease term, excluding interest.
9 Aid Assistance9.1 Aid assistance received
Aid assistance received in cash is recognised in the statement of financial performance when received. In-kind aid assistance is recorded in the notes to the financial statements on the date of receipt and is measured at fair value.
Aid assistance not spent for the intended purpose and any unutilised funds from aid assistance that are required to be refunded to the donor are recognised as a payable in the statement of financial position.
9.2 Aid assistance paid
Aid assistance paid is recognised in the statement of financial performance on the date of payment. Aid assistance payments made prior to the receipt of funds are recognised as a receivable in the statement of financial position.
10 Cash and cash equivalentsCash and cash equivalents are stated at cost in the statement of financial position.
Bank overdrafts are shown separately on the face of the statement of financial position.
For the purposes of the cash flow statement, cash and cash equivalents comprise cash on hand, deposits held, other short-term highly liquid investments and bank overdrafts.
11 Prepayments and advancesPrepayments and advances are recognised in the statement of financial position when the department receives or disburses the cash.
Prepayments and advances are initially and subsequently measured at cost.
12 Loans and receivablesLoans and receivables are recognised in the statement of financial position at cost plus accrued interest, where interest is charged, less amounts already settled or written-off.
13 InvestmentsInvestments are recognised in the statement of financial position at cost.
ACCOUNTING POLICIESfor the year ended 31 March 2015
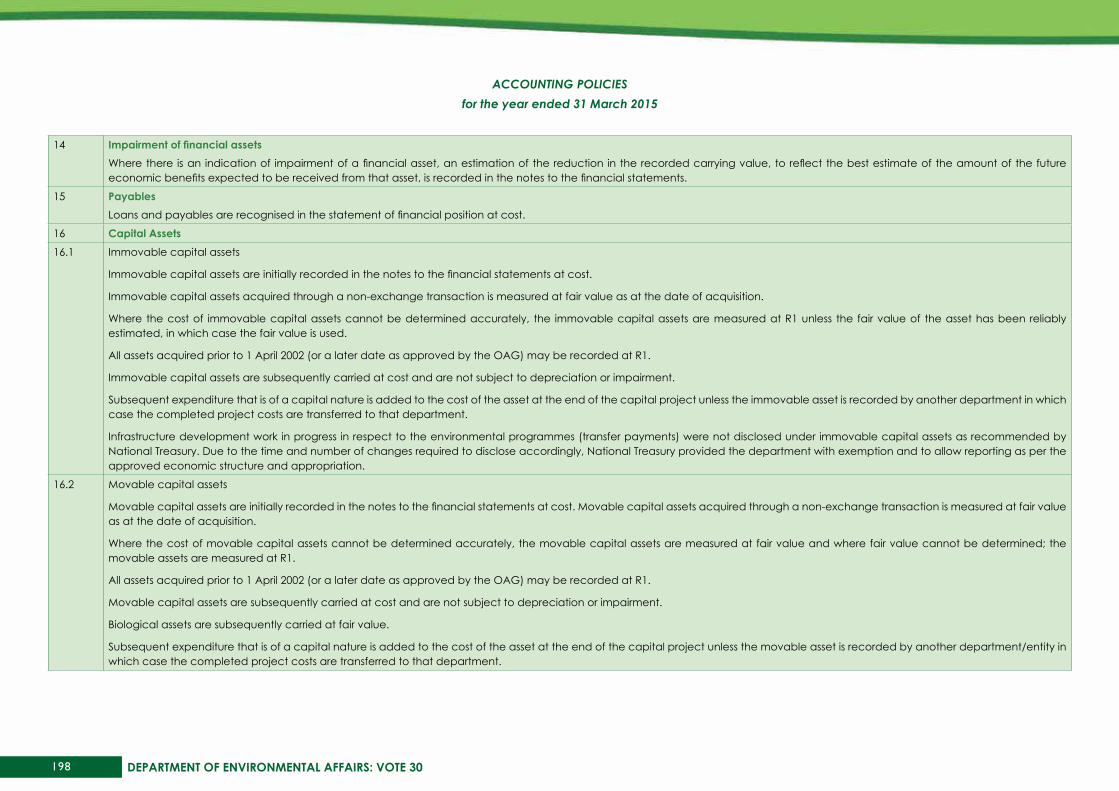
198 DEPARTMENT OF ENVIRONMENTAL AFFAIRS: VOTE 30
14 Impairment of financial assetsWhere there is an indication of impairment of a financial asset, an estimation of the reduction in the recorded carrying value, to reflect the best estimate of the amount of the future economic benefits expected to be received from that asset, is recorded in the notes to the financial statements.
15 PayablesLoans and payables are recognised in the statement of financial position at cost.
16 Capital Assets16.1 Immovable capital assets
Immovable capital assets are initially recorded in the notes to the financial statements at cost.
Immovable capital assets acquired through a non-exchange transaction is measured at fair value as at the date of acquisition.
Where the cost of immovable capital assets cannot be determined accurately, the immovable capital assets are measured at R1 unless the fair value of the asset has been reliably estimated, in which case the fair value is used.
All assets acquired prior to 1 April 2002 (or a later date as approved by the OAG) may be recorded at R1.
Immovable capital assets are subsequently carried at cost and are not subject to depreciation or impairment.
Subsequent expenditure that is of a capital nature is added to the cost of the asset at the end of the capital project unless the immovable asset is recorded by another department in which case the completed project costs are transferred to that department.
Infrastructure development work in progress in respect to the environmental programmes (transfer payments) were not disclosed under immovable capital assets as recommended by National Treasury. Due to the time and number of changes required to disclose accordingly, National Treasury provided the department with exemption and to allow reporting as per the approved economic structure and appropriation.
16.2 Movable capital assets
Movable capital assets are initially recorded in the notes to the financial statements at cost. Movable capital assets acquired through a non-exchange transaction is measured at fair value as at the date of acquisition.
Where the cost of movable capital assets cannot be determined accurately, the movable capital assets are measured at fair value and where fair value cannot be determined; the movable assets are measured at R1.
All assets acquired prior to 1 April 2002 (or a later date as approved by the OAG) may be recorded at R1.
Movable capital assets are subsequently carried at cost and are not subject to depreciation or impairment.
Biological assets are subsequently carried at fair value.
Subsequent expenditure that is of a capital nature is added to the cost of the asset at the end of the capital project unless the movable asset is recorded by another department/entity in which case the completed project costs are transferred to that department.
ACCOUNTING POLICIESfor the year ended 31 March 2015
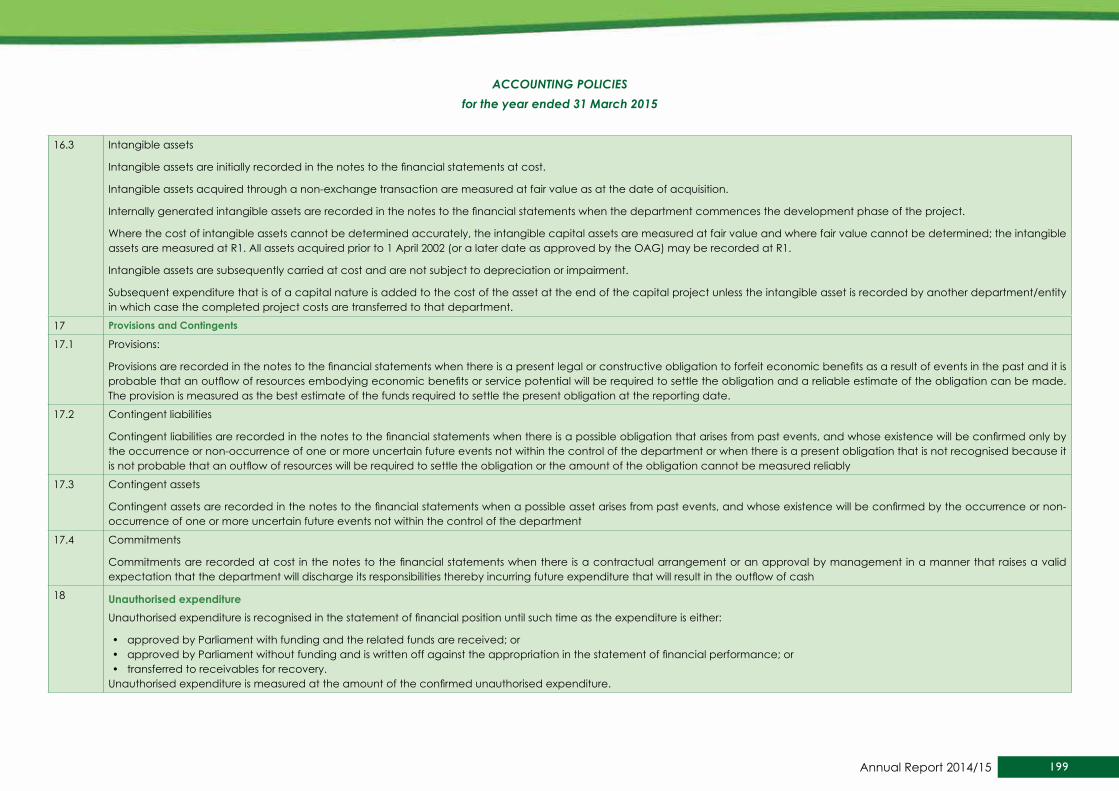
199Annual Report 2014/15
16.3 Intangible assets
Intangible assets are initially recorded in the notes to the financial statements at cost.
Intangible assets acquired through a non-exchange transaction are measured at fair value as at the date of acquisition.
Internally generated intangible assets are recorded in the notes to the financial statements when the department commences the development phase of the project.
Where the cost of intangible assets cannot be determined accurately, the intangible capital assets are measured at fair value and where fair value cannot be determined; the intangible assets are measured at R1. All assets acquired prior to 1 April 2002 (or a later date as approved by the OAG) may be recorded at R1.
Intangible assets are subsequently carried at cost and are not subject to depreciation or impairment.
Subsequent expenditure that is of a capital nature is added to the cost of the asset at the end of the capital project unless the intangible asset is recorded by another department/entity in which case the completed project costs are transferred to that department.
17 Provisions and Contingents
17.1 Provisions:
Provisions are recorded in the notes to the financial statements when there is a present legal or constructive obligation to forfeit economic benefits as a result of events in the past and it is probable that an outflow of resources embodying economic benefits or service potential will be required to settle the obligation and a reliable estimate of the obligation can be made. The provision is measured as the best estimate of the funds required to settle the present obligation at the reporting date.
17.2 Contingent liabilities
Contingent liabilities are recorded in the notes to the financial statements when there is a possible obligation that arises from past events, and whose existence will be confirmed only by the occurrence or non-occurrence of one or more uncertain future events not within the control of the department or when there is a present obligation that is not recognised because it is not probable that an outflow of resources will be required to settle the obligation or the amount of the obligation cannot be measured reliably
17.3 Contingent assets
Contingent assets are recorded in the notes to the financial statements when a possible asset arises from past events, and whose existence will be confirmed by the occurrence or non-occurrence of one or more uncertain future events not within the control of the department
17.4 Commitments
Commitments are recorded at cost in the notes to the financial statements when there is a contractual arrangement or an approval by management in a manner that raises a valid expectation that the department will discharge its responsibilities thereby incurring future expenditure that will result in the outflow of cash
18 unauthorised expenditure Unauthorised expenditure is recognised in the statement of financial position until such time as the expenditure is either:
• approved by Parliament with funding and the related funds are received; or • approved by Parliament without funding and is written off against the appropriation in the statement of financial performance; or • transferred to receivables for recovery.
Unauthorised expenditure is measured at the amount of the confirmed unauthorised expenditure.
ACCOUNTING POLICIESfor the year ended 31 March 2015

200 DEPARTMENT OF ENVIRONMENTAL AFFAIRS: VOTE 30
19 Fruitless and wasteful expenditure Fruitless and wasteful expenditure is recorded in the notes to the financial statements when confirmed. The amount recorded is equal to the total value of the fruitless and or wasteful expenditure incurred.
Fruitless and wasteful expenditure is removed from the notes to the financial statements when it is resolved or transferred to receivables for recovery.
Fruitless and wasteful expenditure receivables are measured at the amount that is expected to be recoverable and are de-recognised when settled or subsequently written-off as irrecoverable.
20 Irregular expenditure
Irregular expenditure is recorded in the notes to the financial statements when confirmed. The amount recorded is equal to the value of the irregular expenditure incurred unless it is impracticable to determine, in which case reasons therefor are provided in the note.
Irregular expenditure is removed from the note when it is either condoned by the relevant authority, transferred to receivables for recovery or not condoned and is not recoverable.
Irregular expenditure receivables are measured at the amount that is expected to be recoverable and are de-recognised when settled or subsequently written-off as irrecoverable.21 Changes in accounting policies, accounting estimates and errors
Changes in accounting policies that are effected by management have been applied retrospectively in accordance with MCS requirements, except to the extent that it is impracticable to determine the period-specific effects or the cumulative effect of the change in policy. In such instances the department shall restate the opening balances of assets, liabilities and net assets for the earliest period for which retrospective restatement is practicable. Changes in accounting estimates are applied prospectively in accordance with MCS requirements.
Correction of errors is applied retrospectively in the period in which the error has occurred in accordance with MCS requirements, except to the extent that it is impracticable to determine the period-specific effects or the cumulative effect of the error. In such cases the department shall restate the opening balances of assets, liabilities and net assets for the earliest period for which retrospective restatement is practicable.
22 Events after the reporting date Events after the reporting date that are classified as adjusting events have been accounted for in the financial statements. The events after the reporting date that are classified as non-adjusting events after the reporting date have been disclosed in the notes to the financial statements.
23 Capitalisation reserve The capitalisation reserve comprises of financial assets and/or liabilities originating in a prior reporting period but which are recognised in the statement of financial position for the first time in the current reporting period. Amounts are recognised in the capitalisation reserves when identified in the current period and are transferred to the National Fund when the underlying asset is disposed and the related funds are received
24 Recoverable revenue Amounts are recognised as recoverable revenue when a payment made in a previous financial year becomes recoverable from a debtor in the current financial year. Amounts are either transferred to the National Revenue Fund when recovered or are transferred to the statement of financial performance when written-off.
25 Related party transactions A related party transaction is a transfer of resources, services or obligations between the reporting entity and a related party. Related party transactions are recorded in the notes to the financial statements when the transaction is not at arm’s length.
26 Inventories (Effective from 1 April 2016): At the date of acquisition, inventories are recorded at cost price in the notes to the financial statements. Where inventories are acquired as part of a non-exchange transaction, the cost of inventory is its fair value at the date of acquisition. Inventories are subsequently measured at the lower of cost and net realisable value or the lower of cost and replacement value.
ACCOUNTING POLICIESfor the year ended 31 March 2015

201Annual Report 2014/15
1. Annual Appropriation
1.1 Annual AppropriationIncluded are funds appropriated in terms of the Appropriation Act (and the Adjustments Appropriation Act) for National Departments (Voted funds):
PROGRAMMEs
2014/15 2013/14Final Appropriation Actual Funds Received Funds not requested/ not
receivedAppropriation received
R’000 R’000 R’000 R’000Administration 731 335 731 335 - 767 018
Legal, Authorisations and Compliance 102 123 102 123 - 104 258
Oceans and Coasts 349 257 349 257 - 326 814
Climate Change and Air Quality 229 292 229 292 - 229 760
Biodiversity and Conservation 643 068 643 068 - 565 662
Environmental Programmes 3 553 433 3 553 433 - 3 138 885
Chemicals and Waste Management 71 878 71 878 - 74 445
TOTAL 5 680 386 5 680 386 - 5 206 842
2. departmental revenueNote 2014/15 2013/14
R’000 R’000Sales of goods and services other than capital assets 2.1 3 793 1 839
Fines, penalties and forfeits 2.2 1 742 3 335
Interest, dividends and rent on land 2.3 98 68
Sales of capital assets 2.4 1 443 38
Transactions in financial assets and liabilities 2.5 24 946 24 292
dEPARTMENTAL REVENuE COLLECTEd 32 022 29 572
NOTES TO THE ANNUAL FINANCIAL STATEMENTSfor the year ended 31 March 2015
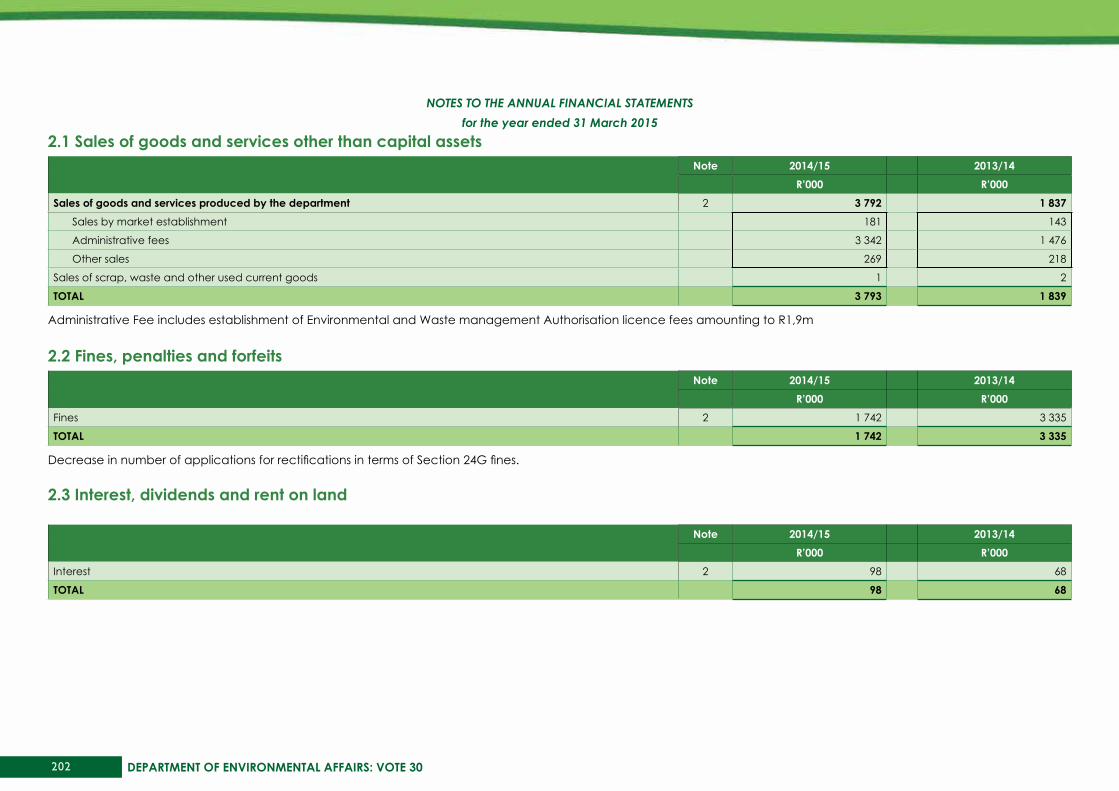
202 DEPARTMENT OF ENVIRONMENTAL AFFAIRS: VOTE 30
2.1 sales of goods and services other than capital assetsNote 2014/15 2013/14
R’000 R’000sales of goods and services produced by the department 2 3 792 1 837
Sales by market establishment 181 143
Administrative fees 3 342 1 476
Other sales 269 218
Sales of scrap, waste and other used current goods 1 2
TOTAL 3 793 1 839
Administrative Fee includes establishment of Environmental and Waste management Authorisation licence fees amounting to R1,9m
2.2 Fines, penalties and forfeitsNote 2014/15 2013/14
R’000 R’000Fines 2 1 742 3 335
TOTAL 1 742 3 335
Decrease in number of applications for rectifications in terms of Section 24G fines.
2.3 Interest, dividends and rent on land
Note 2014/15 2013/14R’000 R’000
Interest 2 98 68
TOTAL 98 68
NOTES TO THE ANNUAL FINANCIAL STATEMENTSfor the year ended 31 March 2015

203Annual Report 2014/15
2.4 sale of capital assetsNote 2014/15 2013/14
R’000 R’000Tangible assets 2 1 443 38Machinery and equipment 28 1 443 38
TOTAL 1 443 38
The relocation of the department to the new Green Building necessitated the disposal of some assets which have been physically disposed from the old building. i.e furniture, cars as well as IT equipment’s.
2.5 Transactions in financial assets and liabilitiesNote 2014/15 2013/14
R’000 R’000Receivables 2 302 481
Other Receipts including Recoverable Revenue 24 644 23 811
TOTAL 24 946 24 292
Included in “Other Receipts including Recoverable Revenue” are previous year expenditure refunds from Implementation Agencies (R13,414m), suitcase cruise grant and voyage for the Algoa joint research cost reimbursement as well as refunds from foreign government/international organisations (GIZ and UNEP) (R10 566m) and other (telephone, salary deductions and petty cash) to the amount of R663 thousand.
3. Aid assistanceNote 2014/15 2013/14
R’000 R’000Opening Balance (2 196) 1 373
Transferred from statement of financial performances (5 535) (2 144)
Paid during the year - (1 425)
CLOsING bALANCE (7 731) (2 196)
Transferred from statement of financial performances includes revenue of R6,690m and expenditure of R12,225m (Current R11 861 plus Capital R364). Net amount disclosed to the amount of R5,535 million.
NOTES TO THE ANNUAL FINANCIAL STATEMENTSfor the year ended 31 March 2015
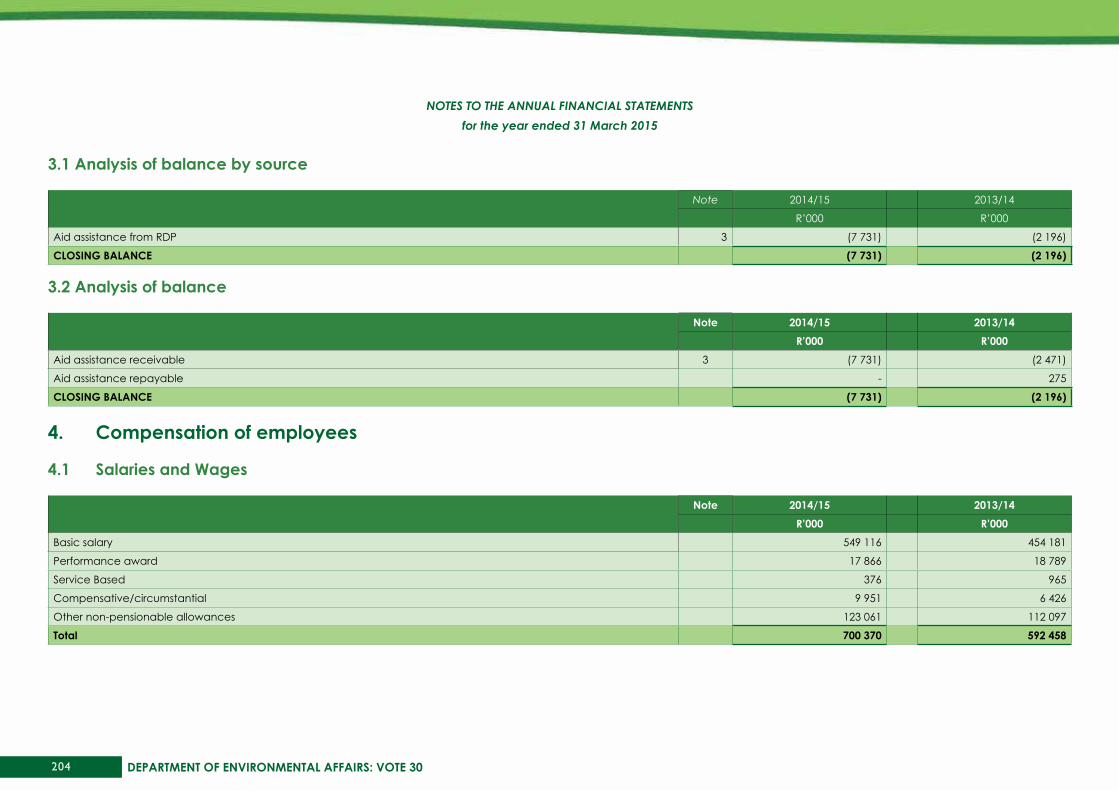
204 DEPARTMENT OF ENVIRONMENTAL AFFAIRS: VOTE 30
3.1 Analysis of balance by source
Note 2014/15 2013/14
R’000 R’000
Aid assistance from RDP 3 (7 731) (2 196)
CLOsING bALANCE (7 731) (2 196)
3.2 Analysis of balance
Note 2014/15 2013/14R’000 R’000
Aid assistance receivable 3 (7 731) (2 471)
Aid assistance repayable - 275
CLOsING bALANCE (7 731) (2 196)
4. Compensation of employees
4.1 salaries and wages
Note 2014/15 2013/14R’000 R’000
Basic salary 549 116 454 181
Performance award 17 866 18 789
Service Based 376 965
Compensative/circumstantial 9 951 6 426
Other non-pensionable allowances 123 061 112 097
Total 700 370 592 458
NOTES TO THE ANNUAL FINANCIAL STATEMENTSfor the year ended 31 March 2015
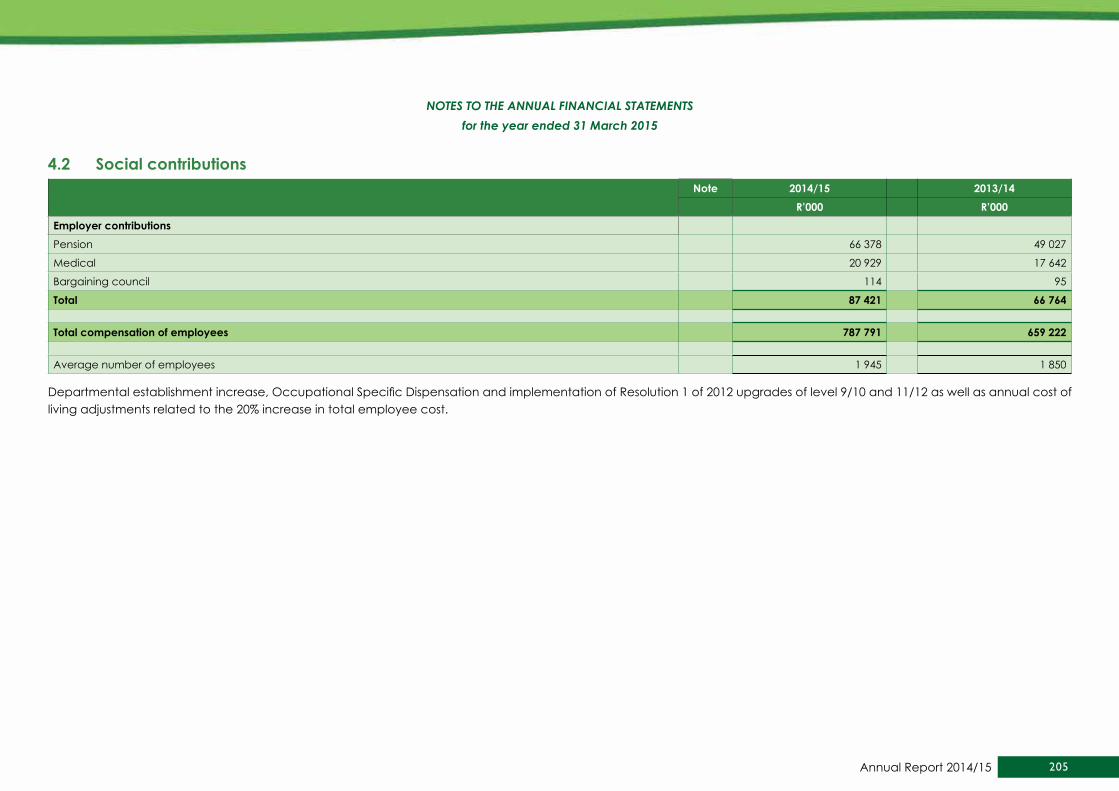
205Annual Report 2014/15
4.2 social contributionsNote 2014/15 2013/14
R’000 R’000Employer contributionsPension 66 378 49 027
Medical 20 929 17 642
Bargaining council 114 95
Total 87 421 66 764
Total compensation of employees 787 791 659 222
Average number of employees 1 945 1 850
Departmental establishment increase, Occupational Specific Dispensation and implementation of Resolution 1 of 2012 upgrades of level 9/10 and 11/12 as well as annual cost of living adjustments related to the 20% increase in total employee cost.
NOTES TO THE ANNUAL FINANCIAL STATEMENTSfor the year ended 31 March 2015

206 DEPARTMENT OF ENVIRONMENTAL AFFAIRS: VOTE 30
5. Goods and services Note 2014/15 2013/14
R’000 R’000Administrative fees 1 431 1 608
Advertising 14 415 27 264
Minor assets 5.1 1 616 2 518
Bursaries (employees) 1 312 1 740
Catering 5 081 4 022
Communication 17 330 17 385
Computer services 5.2 35 933 52 693
Consultants: Business and advisory services 82 295 112 572
Laboratory services 45 13
Legal services 3 528 6 490
Contractors 97 503 101 670
Agency and support / outsourced services 177 013 137 137
Entertainment 85 311
Audit cost – external 5.3 5 862 8 077
Fleet services 9 198 17 398
Inventory 5.4 15 632 17 889
Consumables 5.5 21 294 27 524
Operating leases 76 663 66 678
Property payments 5.6 15 932 15 991
Rental and hiring 2 275 3 058
Transport provided as part of the departmental activities 352 34
Travel and subsistence 5.7 169 884 141 279
Venues and facilities 34 470 38 969
Training and development 15 300 12 483
Other operating expenditure 5.8 50 067 58 201
TOTAL 854 516 873 004
Advertising during the 2013/14 financial year consisted mainly of R10m for marketing i.r.o 20 years Democracy Campaign.
NOTES TO THE ANNUAL FINANCIAL STATEMENTSfor the year ended 31 March 2015
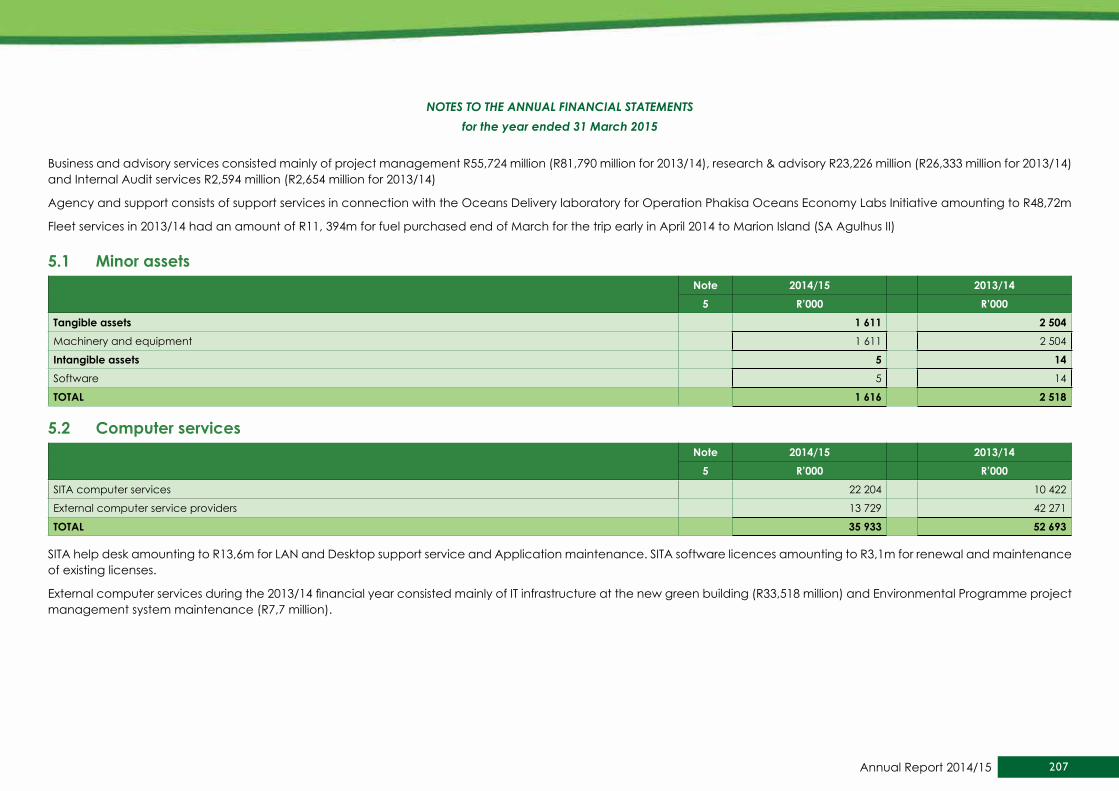
207Annual Report 2014/15
Business and advisory services consisted mainly of project management R55,724 million (R81,790 million for 2013/14), research & advisory R23,226 million (R26,333 million for 2013/14) and Internal Audit services R2,594 million (R2,654 million for 2013/14)
Agency and support consists of support services in connection with the Oceans Delivery laboratory for Operation Phakisa Oceans Economy Labs Initiative amounting to R48,72m
Fleet services in 2013/14 had an amount of R11, 394m for fuel purchased end of March for the trip early in April 2014 to Marion Island (SA Agulhus II)
5.1 Minor assetsNote 2014/15 2013/14
5 R’000 R’000Tangible assets 1 611 2 504Machinery and equipment 1 611 2 504
Intangible assets 5 14Software 5 14
TOTAL 1 616 2 518
5.2 Computer servicesNote 2014/15 2013/14
5 R’000 R’000SITA computer services 22 204 10 422
External computer service providers 13 729 42 271
TOTAL 35 933 52 693
SITA help desk amounting to R13,6m for LAN and Desktop support service and Application maintenance. SITA software licences amounting to R3,1m for renewal and maintenance of existing licenses.
External computer services during the 2013/14 financial year consisted mainly of IT infrastructure at the new green building (R33,518 million) and Environmental Programme project management system maintenance (R7,7 million).
NOTES TO THE ANNUAL FINANCIAL STATEMENTSfor the year ended 31 March 2015
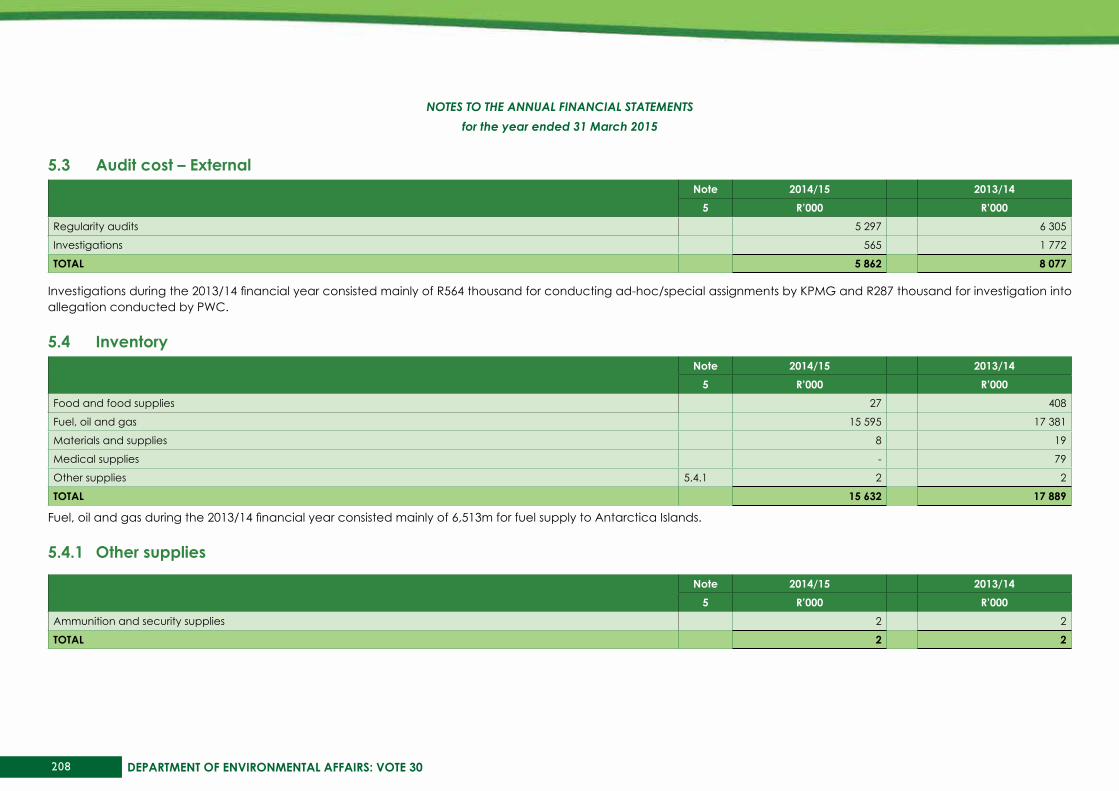
208 DEPARTMENT OF ENVIRONMENTAL AFFAIRS: VOTE 30
5.3 Audit cost – External Note 2014/15 2013/14
5 R’000 R’000Regularity audits 5 297 6 305
Investigations 565 1 772
TOTAL 5 862 8 077
Investigations during the 2013/14 financial year consisted mainly of R564 thousand for conducting ad-hoc/special assignments by KPMG and R287 thousand for investigation into allegation conducted by PWC.
5.4 InventoryNote 2014/15 2013/14
5 R’000 R’000Food and food supplies 27 408
Fuel, oil and gas 15 595 17 381
Materials and supplies 8 19
Medical supplies - 79
Other supplies 5.4.1 2 2
TOTAL 15 632 17 889
Fuel, oil and gas during the 2013/14 financial year consisted mainly of 6,513m for fuel supply to Antarctica Islands.
5.4.1 Other supplies
Note 2014/15 2013/145 R’000 R’000
Ammunition and security supplies 2 2
TOTAL 2 2
NOTES TO THE ANNUAL FINANCIAL STATEMENTSfor the year ended 31 March 2015
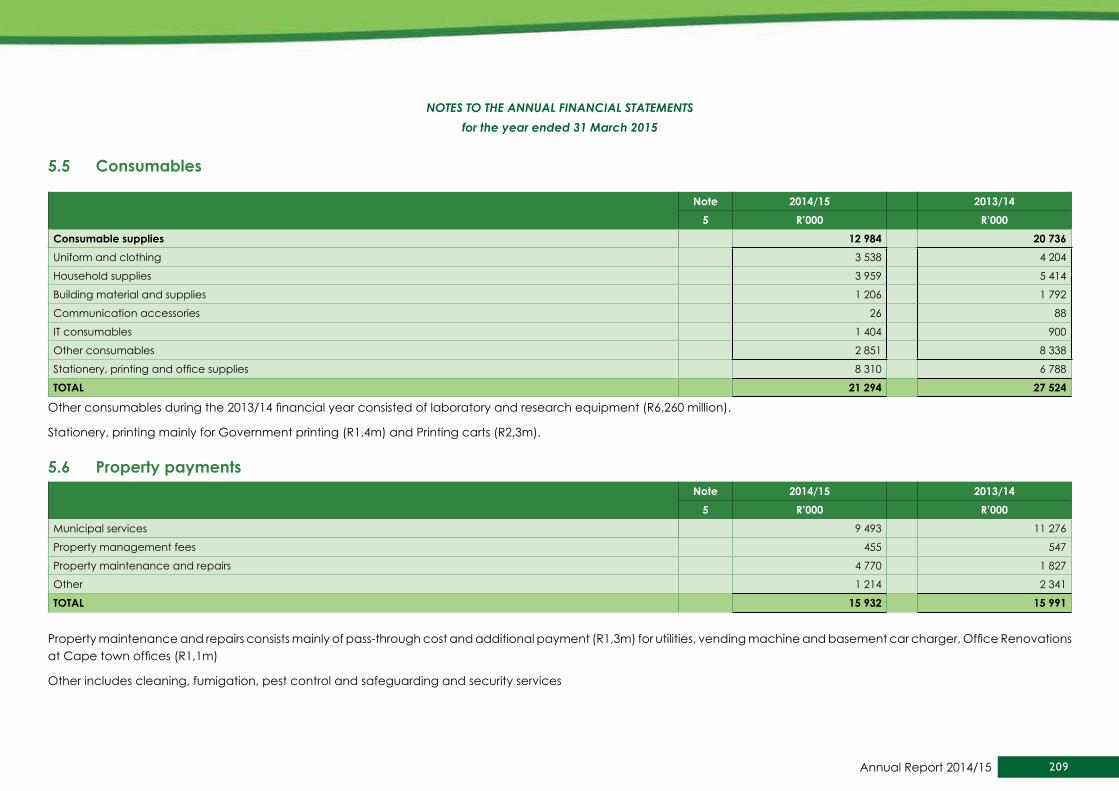
209Annual Report 2014/15
5.5 Consumables
Note 2014/15 2013/145 R’000 R’000
Consumable supplies 12 984 20 736Uniform and clothing 3 538 4 204
Household supplies 3 959 5 414
Building material and supplies 1 206 1 792
Communication accessories 26 88
IT consumables 1 404 900
Other consumables 2 851 8 338
Stationery, printing and office supplies 8 310 6 788
TOTAL 21 294 27 524
Other consumables during the 2013/14 financial year consisted of laboratory and research equipment (R6,260 million).
Stationery, printing mainly for Government printing (R1,4m) and Printing carts (R2,3m).
5.6 Property paymentsNote 2014/15 2013/14
5 R’000 R’000Municipal services 9 493 11 276
Property management fees 455 547
Property maintenance and repairs 4 770 1 827
Other 1 214 2 341
TOTAL 15 932 15 991
Property maintenance and repairs consists mainly of pass-through cost and additional payment (R1,3m) for utilities, vending machine and basement car charger, Office Renovations at Cape town offices (R1,1m)
Other includes cleaning, fumigation, pest control and safeguarding and security services
NOTES TO THE ANNUAL FINANCIAL STATEMENTSfor the year ended 31 March 2015
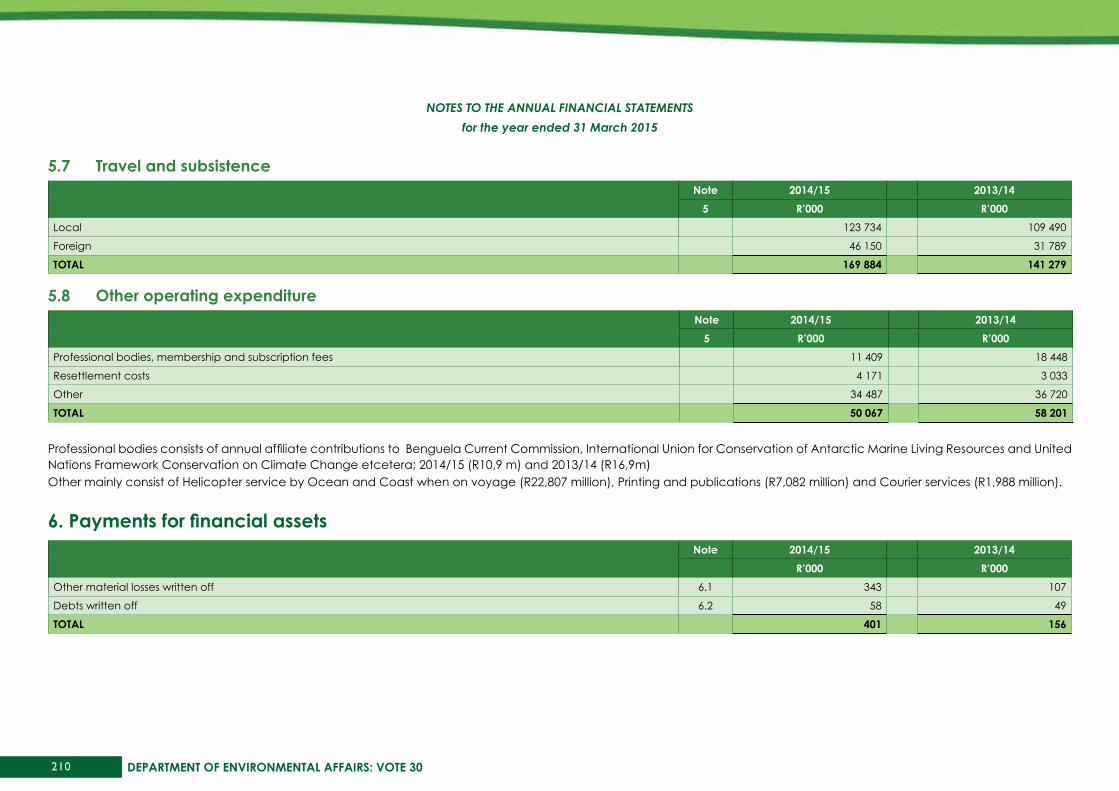
210 DEPARTMENT OF ENVIRONMENTAL AFFAIRS: VOTE 30
5.7 Travel and subsistenceNote 2014/15 2013/14
5 R’000 R’000Local 123 734 109 490
Foreign 46 150 31 789
TOTAL 169 884 141 279
5.8 Other operating expenditureNote 2014/15 2013/14
5 R’000 R’000Professional bodies, membership and subscription fees 11 409 18 448
Resettlement costs 4 171 3 033
Other 34 487 36 720
TOTAL 50 067 58 201
Professional bodies consists of annual affiliate contributions to Benguela Current Commission, International Union for Conservation of Antarctic Marine Living Resources and United Nations Framework Conservation on Climate Change etcetera; 2014/15 (R10,9 m) and 2013/14 (R16,9m)Other mainly consist of Helicopter service by Ocean and Coast when on voyage (R22,807 million), Printing and publications (R7,082 million) and Courier services (R1,988 million).
6. Payments for financial assetsNote 2014/15 2013/14
R’000 R’000Other material losses written off 6.1 343 107
Debts written off 6.2 58 49
TOTAL 401 156
NOTES TO THE ANNUAL FINANCIAL STATEMENTSfor the year ended 31 March 2015
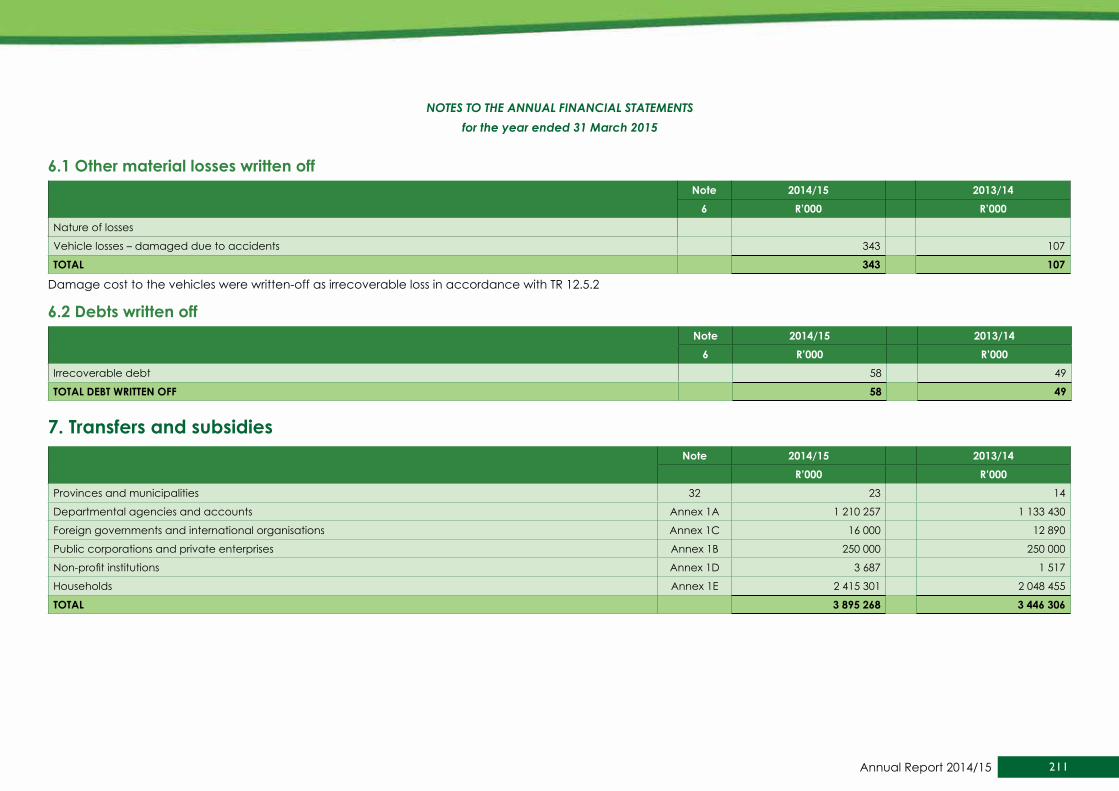
211Annual Report 2014/15
6.1 Other material losses written offNote 2014/15 2013/14
6 R’000 R’000Nature of losses
Vehicle losses – damaged due to accidents 343 107
TOTAL 343 107
Damage cost to the vehicles were written-off as irrecoverable loss in accordance with TR 12.5.2
6.2 debts written offNote 2014/15 2013/14
6 R’000 R’000Irrecoverable debt 58 49
TOTAL dEbT wRITTEN OFF 58 49
7. Transfers and subsidiesNote 2014/15 2013/14
R’000 R’000Provinces and municipalities 32 23 14
Departmental agencies and accounts Annex 1A 1 210 257 1 133 430
Foreign governments and international organisations Annex 1C 16 000 12 890
Public corporations and private enterprises Annex 1B 250 000 250 000
Non-profit institutions Annex 1D 3 687 1 517
Households Annex 1E 2 415 301 2 048 455
TOTAL 3 895 268 3 446 306
NOTES TO THE ANNUAL FINANCIAL STATEMENTSfor the year ended 31 March 2015

212 DEPARTMENT OF ENVIRONMENTAL AFFAIRS: VOTE 30
8. Expenditure for capital Note 2014/15 2013/14
R’000 R’000Tangible assets 127 128 220 347Buildings and other fixed structures 30 103 191 174 397
Machinery and equipment 28 23 937 45 950
Intangible assets 10 319 1 272Software 29 10 319 1 272
TOTAL 137 447 221 619
8.1 Analysis of funds utilised to acquire capital assets – 2014/15Voted funds Aid assistance Total
R’000 R’000 R’000Tangible assets 126 764 364 127 128Buildings and other fixed structures 103 191 - 103 191
Machinery and equipment 23 573 364 23 937
Intangible assets 10 319 - 10 319Software 10 319 - 10 319
TOTAL 137 083 364 137 447
NOTES TO THE ANNUAL FINANCIAL STATEMENTSfor the year ended 31 March 2015

213Annual Report 2014/15
8.2 Analysis of funds utilised to acquire capital assets – 2014/15
Voted funds Aid assistance TotalR’000 R’000 R’000
Tangible assets 220 347 - 220 347Buildings and other fixed structures 174 397 - 174 397
Machinery and equipment 45 950 - 45 950
Intangible assets 1 272 - 1 272Software 1 272 - 1 272
TOTAL 221 619 - 221 619
8.3 Finance lease expenditure included in Expenditure for capital assetsNote 2014/15 2013/14
R’000 R’000Tangible assetsBuildings and other fixed structures 82 376 -
Machinery and equipment 2 008 2 912
TOTAL 84 384 2 912
9. Cash and cash equivalentsNote 2014/15 2013/14
R’000 R’000Consolidated Paymaster General Account 31 022 17 448
Cash on hand 142 142
Cash with commercial bank (local) - 2 469
TOTAL 31 164 20 059
NOTES TO THE ANNUAL FINANCIAL STATEMENTSfor the year ended 31 March 2015
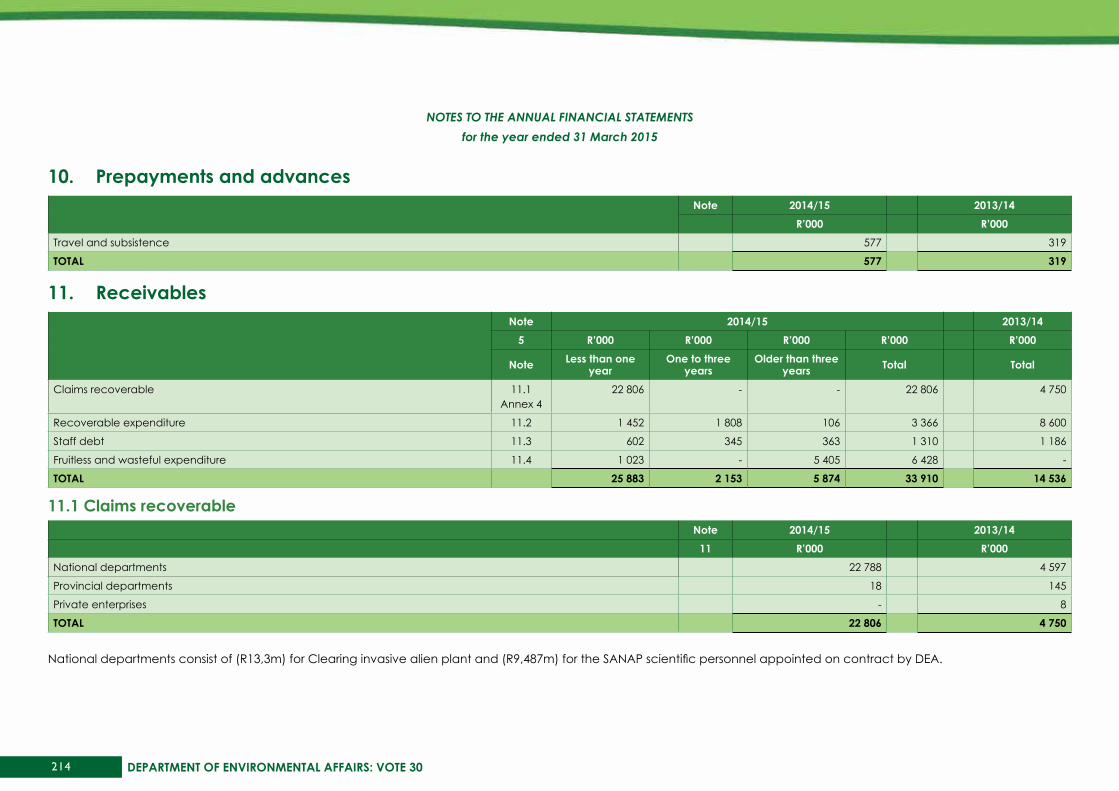
214 DEPARTMENT OF ENVIRONMENTAL AFFAIRS: VOTE 30
10. Prepayments and advancesNote 2014/15 2013/14
R’000 R’000Travel and subsistence 577 319
TOTAL 577 319
11. ReceivablesNote 2014/15 2013/14
5 R’000 R’000 R’000 R’000 R’000
Note Less than one year
One to three years
Older than three years Total Total
Claims recoverable 11.1 Annex 4
22 806 - - 22 806 4 750
Recoverable expenditure 11.2 1 452 1 808 106 3 366 8 600
Staff debt 11.3 602 345 363 1 310 1 186
Fruitless and wasteful expenditure 11.4 1 023 - 5 405 6 428 -
TOTAL 25 883 2 153 5 874 33 910 14 536
11.1 Claims recoverableNote 2014/15 2013/14
11 R’000 R’000National departments 22 788 4 597
Provincial departments 18 145
Private enterprises - 8
TOTAL 22 806 4 750
National departments consist of (R13,3m) for Clearing invasive alien plant and (R9,487m) for the SANAP scientific personnel appointed on contract by DEA.
NOTES TO THE ANNUAL FINANCIAL STATEMENTSfor the year ended 31 March 2015
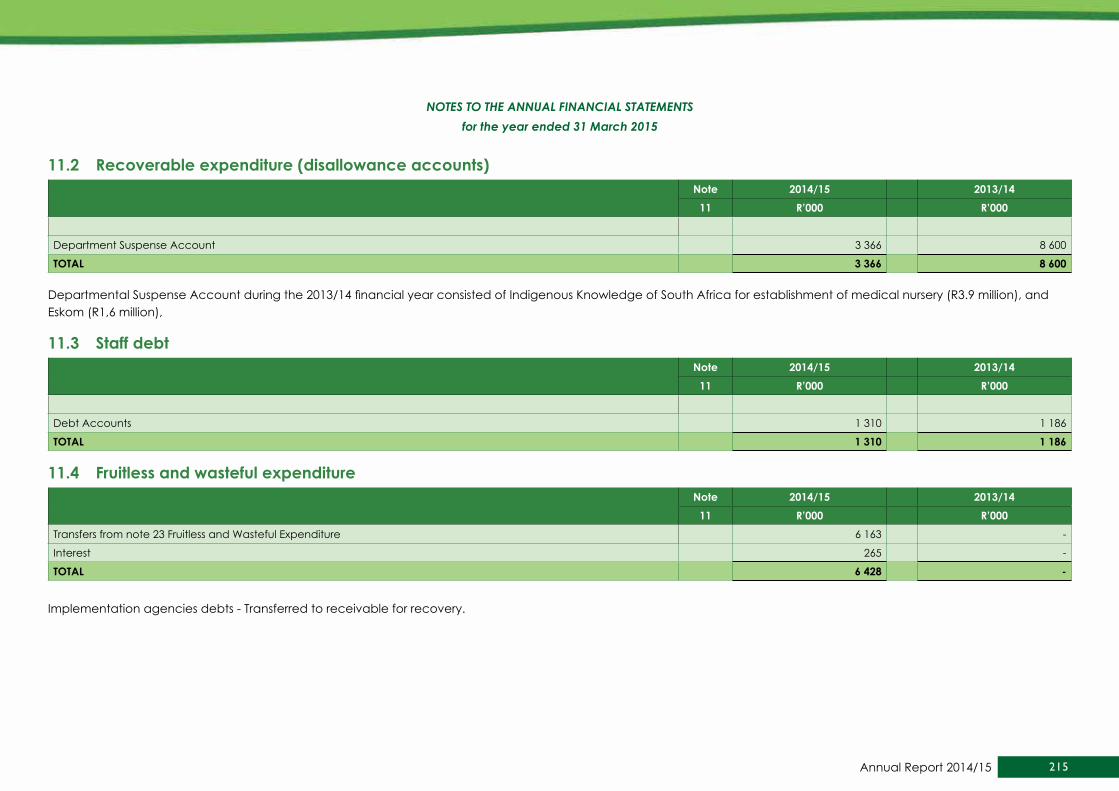
215Annual Report 2014/15
11.2 Recoverable expenditure (disallowance accounts)Note 2014/15 2013/14
11 R’000 R’000
Department Suspense Account 3 366 8 600
TOTAL 3 366 8 600
Departmental Suspense Account during the 2013/14 financial year consisted of Indigenous Knowledge of South Africa for establishment of medical nursery (R3.9 million), and Eskom (R1,6 million),
11.3 staff debtNote 2014/15 2013/14
11 R’000 R’000
Debt Accounts 1 310 1 186
TOTAL 1 310 1 186
11.4 Fruitless and wasteful expenditureNote 2014/15 2013/14
11 R’000 R’000Transfers from note 23 Fruitless and Wasteful Expenditure 6 163 -
Interest 265 -
TOTAL 6 428 -
Implementation agencies debts - Transferred to receivable for recovery.
NOTES TO THE ANNUAL FINANCIAL STATEMENTSfor the year ended 31 March 2015
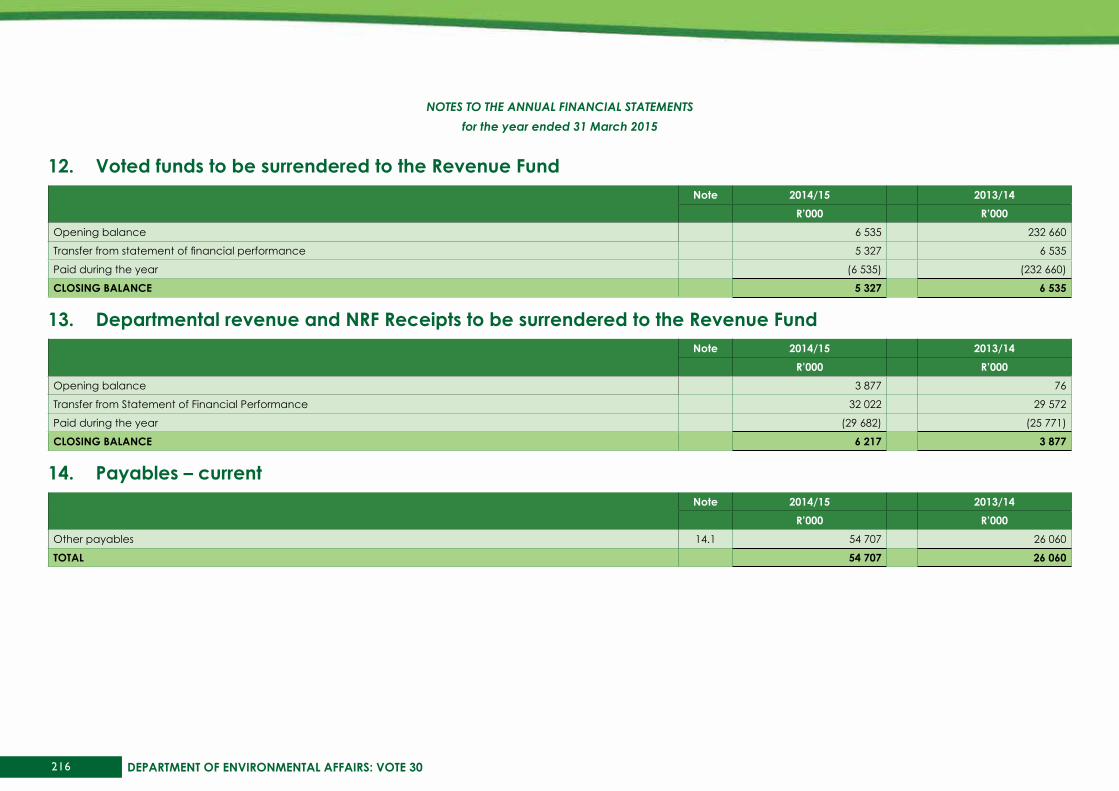
216 DEPARTMENT OF ENVIRONMENTAL AFFAIRS: VOTE 30
12. Voted funds to be surrendered to the Revenue FundNote 2014/15 2013/14
R’000 R’000Opening balance 6 535 232 660
Transfer from statement of financial performance 5 327 6 535
Paid during the year (6 535) (232 660)
CLOsING bALANCE 5 327 6 535
13. departmental revenue and NRF Receipts to be surrendered to the Revenue FundNote 2014/15 2013/14
R’000 R’000Opening balance 3 877 76
Transfer from Statement of Financial Performance 32 022 29 572
Paid during the year (29 682) (25 771)
CLOsING bALANCE 6 217 3 877
14. Payables – currentNote 2014/15 2013/14
R’000 R’000Other payables 14.1 54 707 26 060
TOTAL 54 707 26 060
NOTES TO THE ANNUAL FINANCIAL STATEMENTSfor the year ended 31 March 2015

217Annual Report 2014/15
14.1 Other payablesNote 2014/15 2013/14
14 R’000 R’000Salary related payables 205 582
Department suspense accounts 54 453 22 926
Control account 49 83
Cash with commercial bank (local) - 2 469
TOTAL 54 707 26 060
Departmental suspense accounts consist mainly of Jobs Fund allocation received for Eco-Furniture programme amounting to R43,9m.
15. Net cash flow available from operating activitiesNote 2014/15 2013/14
R’000 R’000Net surplus/(deficit) as per Statement of Financial Performance 31 814 33 963
Add back non cash/cash movements not deemed operating activities 108 802 (30 700)(Increase)/decrease in receivables – current (19 374) (12 408)
(Increase)/decrease in prepayments and advances (258) (65)
Increase/(decrease) in payables – current 28 647 20 048
Proceeds from sale of capital assets (1 443) (38)
Expenditure on capital assets 137 447 221 619
Surrenders to Revenue Fund (36 217) (258 431)
Surrenders to RDP Fund/Donor - (1 425)
NET CAsh FLOw GENERATEd by OPERATING ACTIVITIEs 140 616 3 263
NOTES TO THE ANNUAL FINANCIAL STATEMENTSfor the year ended 31 March 2015

218 DEPARTMENT OF ENVIRONMENTAL AFFAIRS: VOTE 30
16. Reconciliation of cash and cash equivalents for cash flow purposesNote 2014/15 2013/14
R’000 R’000Consolidated Paymaster General account 31 022 17 448
Cash on hand 142 142
Cash with commercial banks (Local) - 2 469
TOTAL 31 164 20 059
17. Contingent liabilities and contingent assets
17.1 Contingent liabilitiesNote 2014/15 2013/14
R’000 R’000Liable to Nature
Housing loan guarantees Employees Annex 3A
463 487
Claims against the department Annex 3B
7 908 7 769
Intergovernmental payables (unconfirmed balances) Annex 5 674 22
TOTAL 9 045 8 278
Housing loan guarantees settlement is reliant on staff’s ability to pay-off the guarantee amount and confirmation from the bank via the staff member. Claims against the department are discussed in the annexure and until a legal decision is reached the liability remains uncertain. Claims received from other departments are paid as soon as acceptable documents of proof has been received and verified, normally within 30 days. No indication on any reimbursement on any of the above mentioned amounts yet.
NOTES TO THE ANNUAL FINANCIAL STATEMENTSfor the year ended 31 March 2015

219Annual Report 2014/15
17.2 Contingent assetsNote 2014/15 2013/14
R’000 R’000Nature of contingent assetSection 24G Administration fines 3 340 1 025
Claims against a service provider 72 35
TOTAL 3 412 1 060
Section 24G Administration fines mainly consists of Dube Tradeport fine (R2,3m)
18. CommitmentsNote 2014/15 2013/14
R’000 R’000Current expenditureApproved and contracted 7 457 357 4 524 652
Approved but not yet contracted 14 662 32 763
7 472 019 4 557 415Capital expenditureApproved and contracted 1 717 766 2 833
1 717 766 2 833TOTAL COMMITMENTs 9 189 785 4 560 248
Approved and contracted includes (3,437Billion) for Forest Fire Association for the aerial fire fighting and dispatch and coordination components for Working on Fire Programme Commitment amounts are based on the outstanding value of the full remaining contract period which may be more than 12 months.
NOTES TO THE ANNUAL FINANCIAL STATEMENTSfor the year ended 31 March 2015

220 DEPARTMENT OF ENVIRONMENTAL AFFAIRS: VOTE 30
19. Accruals and payables not recognised2014/15 2013/14
R’000 R’000Listed by economic classification 30 days 30+ days Total TotalGoods and services 52 268 16 044 68 312 39 260
Capital assets 2 295 23 2 318 1 471
TOTAL 54 563 16 067 70 630 40 731
Note 2014/15 2013/14R’000 R’000
Administration 14 715 26 679
Legal, Authorisations and Compliance 1 566 619
Oceans and Coasts 11 513 5 485
Climate Change and Air Quality 1 004 1 164
Biodiversity and Conservation 2 374 2 002
Environmental Programmes 35 742 4 386
Chemicals and Waste Management 2 499 352
Other (Assets & Liabilities) 1 217 44
Total 70 630 40 731
Note 2014/15 2013/14R’000 R’000
Confirmed balances with other departments Annex 5 2 416 1 472
TOTAL 2 416 1 472
Oceans and Coasts include invoices to Engen petroleum (R2,987m) for fuel to the islands
Environmental programmes includes invoices to Western Cape Nature amounting to R10,639m, CSIR (R3,452m) and Agricultural Research Council (R4,602m) as well as Expanded Public Works project payments.
NOTES TO THE ANNUAL FINANCIAL STATEMENTSfor the year ended 31 March 2015

221Annual Report 2014/15
20. Employee benefitsNote 2014/15 2013/14
R’000 R’000Leave entitlement 9 230 9 775
Service bonus (Thirteenth cheque) 21 942 16 689
Performance awards 11 283 9 818
Capped leave commitments 11 130 9 650
Long Service awards 240 170
TOTAL 53 825 46 102
A negative amount of R 1 860 956.92 was offset against leave entitlement. The amount was as a result of pro-rata calculation of leave taken by employees as at 31 March 2015.
If an employee takes more leave this result in a negative leave balance this situation is automatically rectified during the leave period.
Long service recognition is as follow:
1. 21 employees qualified for 20 years continued service cash award of R8 882 (R186 522)
2. 3 employees qualified for 30 years continued service cash award of R17 764.50 (53 293.50)
3. Nil employees qualified for 40 years continued service cash award of R23 686
21. Lease commitments
21.1 Operating leases expenditure
2014/15sPECIALIsEd MILITARy
EQuIPMENT LANd buILdINGs ANd OThER FIXEd sTRuCTuREs
MAChINERy ANd EQuIPMENT TOTAL
R’000 R’000 R’000 R’000 R’000Not later than 1 year - - 43 876 2 111 45 987
Later than 1 year and not later than 5 years - - 39 329 2 700 42 029
Later than five years - - - 86 86
TOTAL LEAsE COMMITMENTs - - 83 205 4 897 88 102
NOTES TO THE ANNUAL FINANCIAL STATEMENTSfor the year ended 31 March 2015

222 DEPARTMENT OF ENVIRONMENTAL AFFAIRS: VOTE 30
2013/14sPECIALIsEd MILITARy
EQuIPMENT LANd buILdINGs ANd OThER FIXEd sTRuCTuREs
MAChINERy ANd EQuIPMENT TOTAL
R’000 R’000 R’000 R’000 R’000Not later than 1 year - - 48 796 2 224 51 020
Later than 1 year and not later than 5 years - - 73 452 3 488 76 940
Later than five years - - - 684 684
TOTAL LEAsE COMMITMENTs - - 122 248 6 396 128 644
The escalation clauses of the 24 buildings leased by the department range from 5.5% to 10%. The department is occupying 3 buildings where leases has expired & the process of renewing the leases has not begun. The potential commitment amounts to R1 434 million per year.
21.2 Finance leases expenditure**
2014/15sPECIALIsEd MILITARy
EQuIPMENT LANd buILdINGs ANd OThER FIXEd sTRuCTuREs
MAChINERy ANd EQuIPMENT TOTAL
R’000 R’000 R’000 R’000 R’000Not later than 1 year - - - 950 950
Later than 1 year and not later than 5 years - - - 8 8
TOTAL LEAsE COMMITMENTs - - - 958 958
2013/14sPECIALIsEd MILITARy
EQuIPMENT LANd buILdINGs ANd OThER FIXEd sTRuCTuREs
MAChINERy ANd EQuIPMENT TOTAL
R’000 R’000 R’000 R’000 R’000Not later than 1 year - - - 1 475 1 475
Later than 1 year and not later than 5 years - - - 958 958
TOTAL LEAsE COMMITMENTs - - - 2 433 2 433
**This note excludes leases relating to public private partnership as they are separately disclosed to note no.35.The department is leasing 4 green cars from Nissan SA and photo copies per the transversal contract qualifying as finance leases.
NOTES TO THE ANNUAL FINANCIAL STATEMENTSfor the year ended 31 March 2015
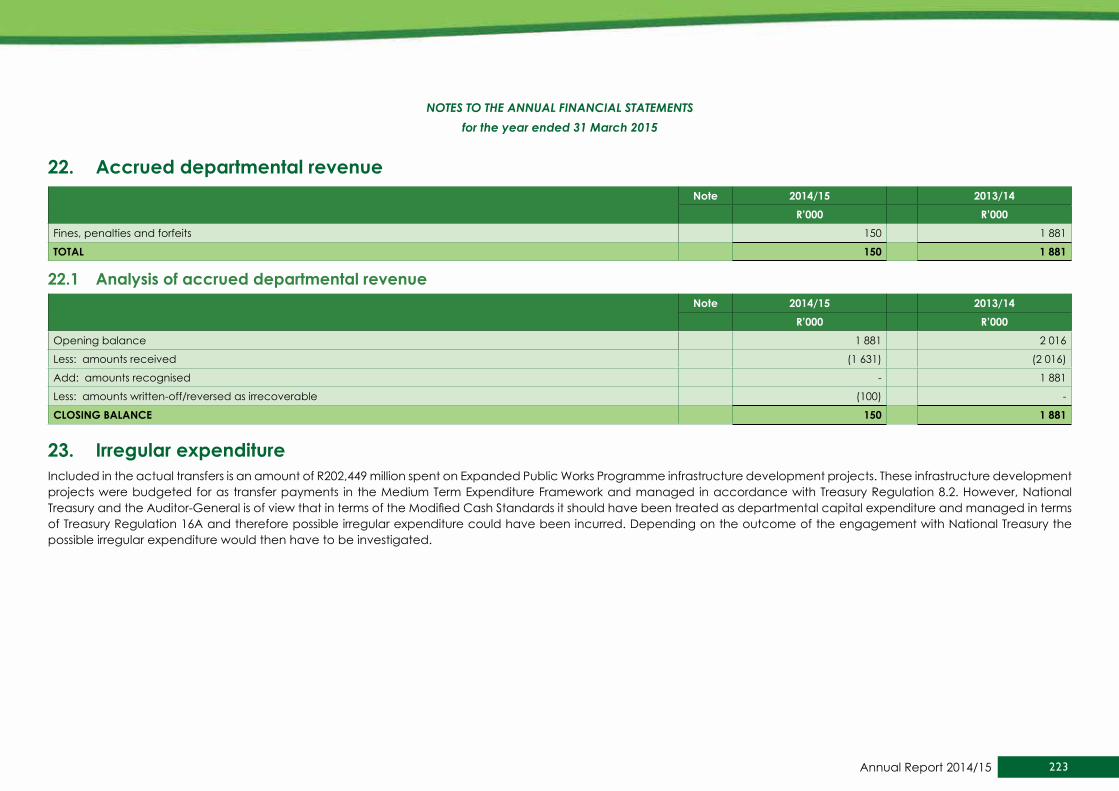
223Annual Report 2014/15
22. Accrued departmental revenueNote 2014/15 2013/14
R’000 R’000Fines, penalties and forfeits 150 1 881
TOTAL 150 1 881
22.1 Analysis of accrued departmental revenueNote 2014/15 2013/14
R’000 R’000Opening balance 1 881 2 016
Less: amounts received (1 631) (2 016)
Add: amounts recognised - 1 881
Less: amounts written-off/reversed as irrecoverable (100) -
CLOsING bALANCE 150 1 881
23. Irregular expenditureIncluded in the actual transfers is an amount of R202,449 million spent on Expanded Public Works Programme infrastructure development projects. These infrastructure development projects were budgeted for as transfer payments in the Medium Term Expenditure Framework and managed in accordance with Treasury Regulation 8.2. However, National Treasury and the Auditor-General is of view that in terms of the Modified Cash Standards it should have been treated as departmental capital expenditure and managed in terms of Treasury Regulation 16A and therefore possible irregular expenditure could have been incurred. Depending on the outcome of the engagement with National Treasury the possible irregular expenditure would then have to be investigated.
NOTES TO THE ANNUAL FINANCIAL STATEMENTSfor the year ended 31 March 2015
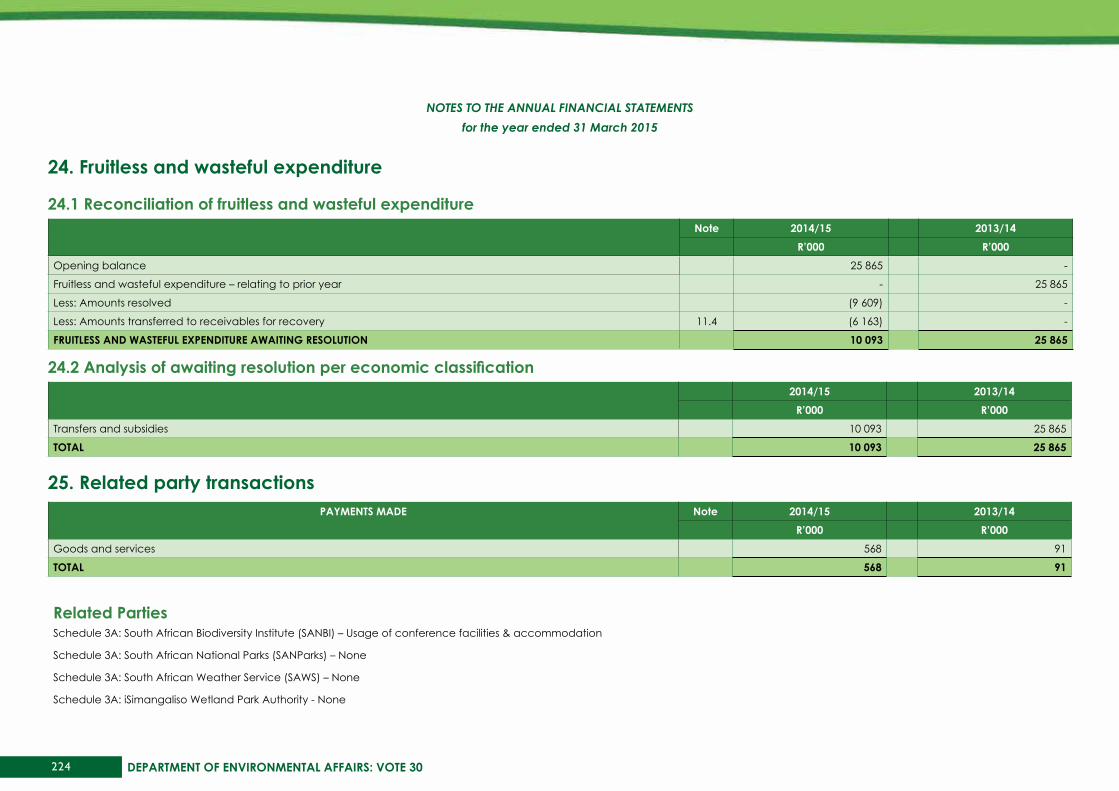
224 DEPARTMENT OF ENVIRONMENTAL AFFAIRS: VOTE 30
24. Fruitless and wasteful expenditure
24.1 Reconciliation of fruitless and wasteful expenditureNote 2014/15 2013/14
R’000 R’000Opening balance 25 865 -
Fruitless and wasteful expenditure – relating to prior year - 25 865
Less: Amounts resolved (9 609) -
Less: Amounts transferred to receivables for recovery 11.4 (6 163) -
FRuITLEss ANd wAsTEFuL EXPENdITuRE AwAITING REsOLuTION 10 093 25 865
24.2 Analysis of awaiting resolution per economic classification2014/15 2013/14
R’000 R’000Transfers and subsidies 10 093 25 865
TOTAL 10 093 25 865
25. Related party transactionsPAyMENTs MAdE Note 2014/15 2013/14
R’000 R’000Goods and services 568 91
TOTAL 568 91
Related PartiesSchedule 3A: South African Biodiversity Institute (SANBI) – Usage of conference facilities & accommodation
Schedule 3A: South African National Parks (SANParks) – None
Schedule 3A: South African Weather Service (SAWS) – None
Schedule 3A: iSimangaliso Wetland Park Authority - None
NOTES TO THE ANNUAL FINANCIAL STATEMENTSfor the year ended 31 March 2015

225Annual Report 2014/15
26. key management personnelNo. of Individuals 2014/15 2013/14
R’000 R’000Political office bearers (provide detail below) 2 3 391 -
Officials:
Level 15 to 16 13 14 894 13 578
Level 14 (incl. CFO if at a lower level) 41 46 203 38 888
TOTAL 64 488 52 466
27. Public Private PartnershipNote 2014/15 2013/14
R’000 R’000
Contract fee paid 84 252 146 815Fixed component 82 376 146 000
Indexed component 1 876 815
Analysis of indexed component 1 876 815Goods and services (excluding lease payments) 1 876 815
Other - 2 197Other obligations - 2 197
The Department entered into a Public Private Partnership with Imvelo Concession Company (Pty) Ltd (RF) (the company) to erect a DEA Green Building Campus over a two year period, ending June 2014, where after the company will manage the operations, maintenance and financing of the facility for a period of 25 years.
In terms of the PPP agreement, DEA had to contribute R366 million to reduce the unitary payment for the 2012/12 and 2013/14 financial year. Over the remaining 24 years the unitary payment of approximately R124 million per year is payable by DEA, increasing with CPI on an annual basis. The commencement of the PPP accounting term was the 1 August 2014, the date from which DEA is entitled to exercise its right to use the asset.
NOTES TO THE ANNUAL FINANCIAL STATEMENTSfor the year ended 31 March 2015

226 DEPARTMENT OF ENVIRONMENTAL AFFAIRS: VOTE 30
Gross unitary monthly instalment per clause 2.3 has been paid amounting to R82,376m, Pass-through costs and additional payment amounting to R1,343m as per Clause 6.24 of Schedule 6 and Clause 1 of Schedule 5 and R533 thousand to the independent certifier’s as per Clause 20.7 of the PPP Agreement as at 31 March’15.
The Imvelo Concession Company (Pty) Ltd consists of the following concessionaires:
Grinakar/Aveng LTD 30%
Old Mutual PLC 30%
Wiphold LTD; and 20%
Kagiso/Tiso Holdings 20%
28. Impairment: otherNote 2014/15 2013/14
R’000 R’000Debtors 122 111
TOTAL 122 111
29. Movable Tangible Capital AssetsMOVEMENT IN MOVAbLE TANGIbLE CAPITAL AssETs PER AssET REGIsTER FOR ThE yEAR ENdEd 31 MARCh 2015
OPENING bALANCE AddITIONs dIsPOsALs CLOsING bALANCER’000 R’000 R’000 R’000
MAChINERy ANd EQuIPMENT 1 651 458 28 641 58 576 1 621 523Transport assets 1 456 672 8 289 899 1 464 062
Computer equipment 65 891 16 780 30 500 52 171
Furniture and office equipment 31 447 439 18 765 13 121
Other machinery and equipment 97 448 3 133 8 412 92 169
TOTAL MOVAbLE TANGIbLE CAPITAL AssETs 1 651 458 28 641 58 576 1 621 523
NOTES TO THE ANNUAL FINANCIAL STATEMENTSfor the year ended 31 March 2015
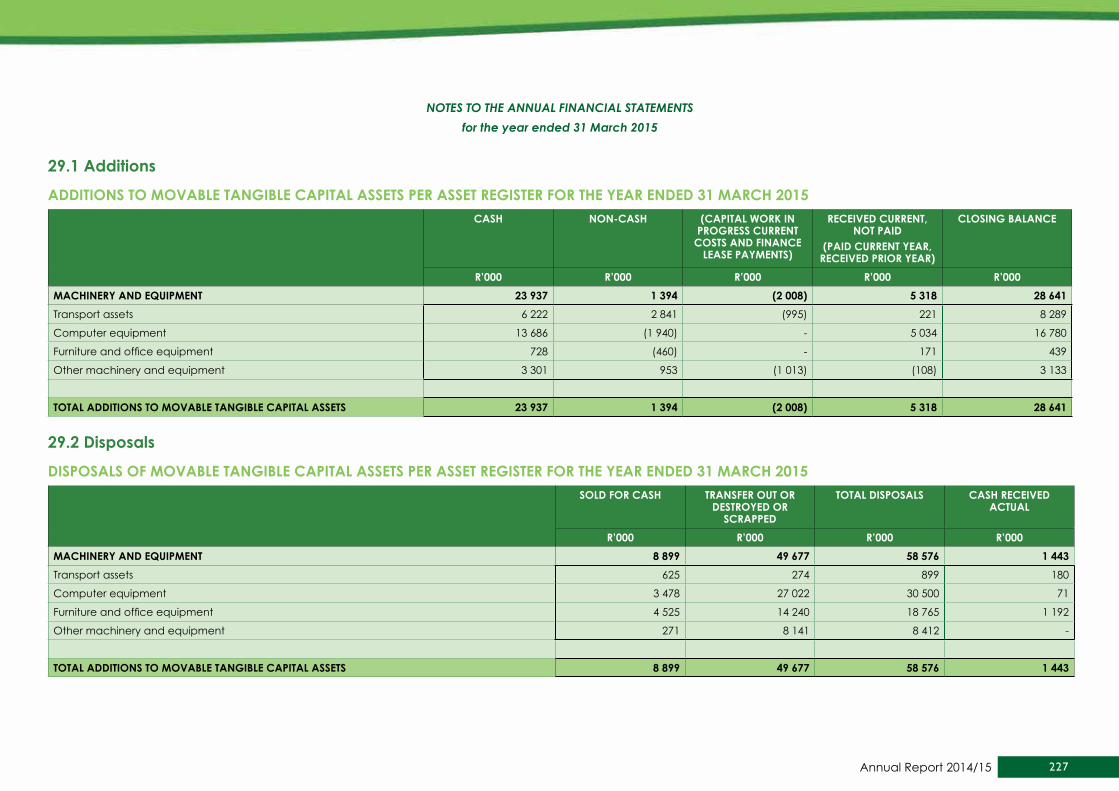
227Annual Report 2014/15
29.1 Additions
AddITIONs TO MOVAbLE TANGIbLE CAPITAL AssETs PER AssET REGIsTER FOR ThE yEAR ENdEd 31 MARCh 2015CAsh NON-CAsh (CAPITAL wORk IN
PROGREss CuRRENT COsTs ANd FINANCE
LEAsE PAyMENTs)
RECEIVEd CuRRENT, NOT PAId
(PAId CuRRENT yEAR, RECEIVEd PRIOR yEAR)
CLOsING bALANCE
R’000 R’000 R’000 R’000 R’000MAChINERy ANd EQuIPMENT 23 937 1 394 (2 008) 5 318 28 641Transport assets 6 222 2 841 (995) 221 8 289
Computer equipment 13 686 (1 940) - 5 034 16 780
Furniture and office equipment 728 (460) - 171 439
Other machinery and equipment 3 301 953 (1 013) (108) 3 133
TOTAL AddITIONs TO MOVAbLE TANGIbLE CAPITAL AssETs 23 937 1 394 (2 008) 5 318 28 641
29.2 disposals
dIsPOsALs OF MOVAbLE TANGIbLE CAPITAL AssETs PER AssET REGIsTER FOR ThE yEAR ENdEd 31 MARCh 2015sOLd FOR CAsh TRANsFER OuT OR
dEsTROyEd OR sCRAPPEd
TOTAL dIsPOsALs CAsh RECEIVEd ACTuAL
R’000 R’000 R’000 R’000MAChINERy ANd EQuIPMENT 8 899 49 677 58 576 1 443Transport assets 625 274 899 180
Computer equipment 3 478 27 022 30 500 71
Furniture and office equipment 4 525 14 240 18 765 1 192
Other machinery and equipment 271 8 141 8 412 -
TOTAL AddITIONs TO MOVAbLE TANGIbLE CAPITAL AssETs 8 899 49 677 58 576 1 443
NOTES TO THE ANNUAL FINANCIAL STATEMENTSfor the year ended 31 March 2015

228 DEPARTMENT OF ENVIRONMENTAL AFFAIRS: VOTE 30
29.3 Movement for 2014/15
MOVEMENT IN TANGIbLE CAPITAL AssETs PER AssET REGIsTER FOR ThE yEAR ENdEd 31 MARCh 2014OPENING bALANCE PRIOR PERIOd ERROR AddITIONs dIsPOsALs CLOsING bALANCE
R’000 R’000 R’000 R’000 R’000MAChINERy ANd EQuIPMENT 1 553 038 54 409 46 281 2 270 1 651 458Transport assets 1 429 067 2 669 24 956 20 1 456 672
Computer equipment 47 385 (43) 20 699 2 150 65 891
Furniture and office equipment 29 411 1 029 1 007 - 31 447
Other machinery and equipment 47 175 50 754 (381) 100 97 448
TOTAL MOVAbLE TANGIbLE CAPITAL AssETs 1 553 038 54 409 46 281 2 270 1 651 458
29.3.1 Prior period error
Note 2013/1428.3 R’000
Nature of prior period error 63 225Total Adjustments to Prior year 2014/15 FY on LOGIS 1 534
Total Adjustment to Prior year 2014/15 FY as per LOGIS Report: Cash Sundry 61 691
Relating to 2013/14 (8 816)2013/14/FY AFS adjustment to prior year balances 52 922
Less manual adjustments reversal in the 2014/15 AFS (61 738)
TOTAL 54 409
NOTES TO THE ANNUAL FINANCIAL STATEMENTSfor the year ended 31 March 2015
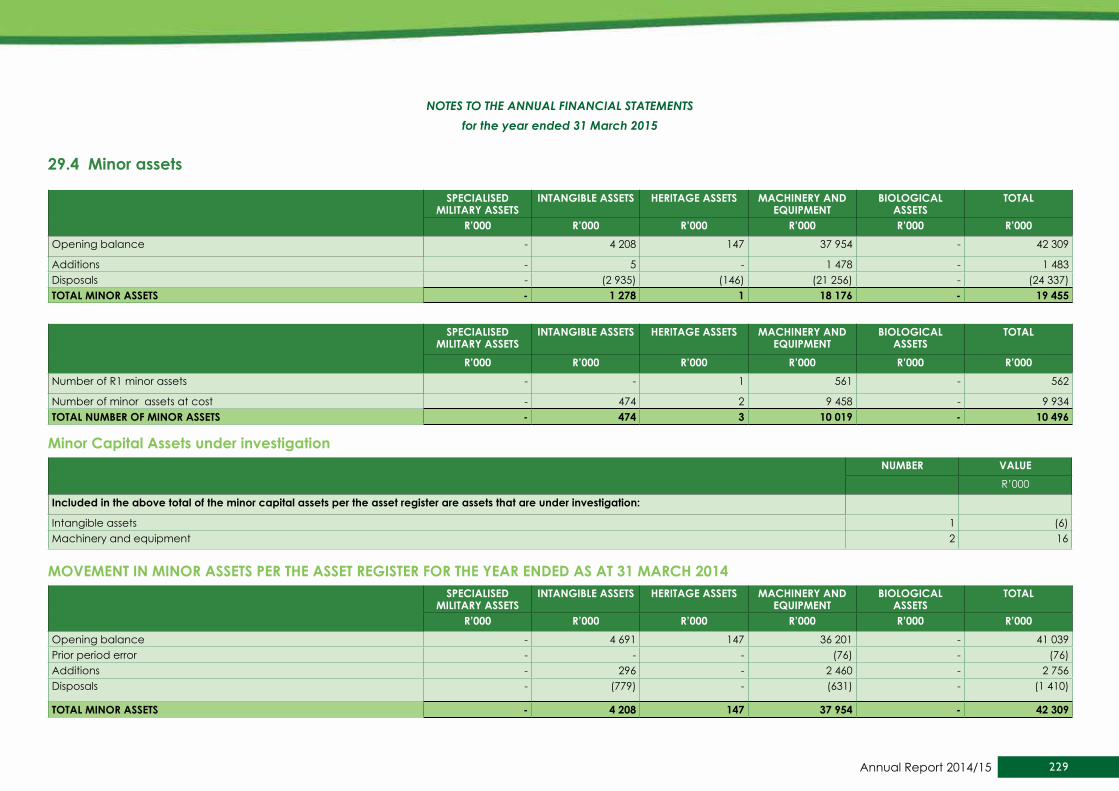
229Annual Report 2014/15
29.4 Minor assets
sPECIALIsEd MILITARy AssETs
INTANGIbLE AssETs hERITAGE AssETs MAChINERy ANd EQuIPMENT
bIOLOGICAL AssETs
TOTAL
R’000 R’000 R’000 R’000 R’000 R’000Opening balance - 4 208 147 37 954 - 42 309
Additions - 5 - 1 478 - 1 483Disposals - (2 935) (146) (21 256) - (24 337)TOTAL MINOR AssETs - 1 278 1 18 176 - 19 455
sPECIALIsEd MILITARy AssETs
INTANGIbLE AssETs hERITAGE AssETs MAChINERy ANd EQuIPMENT
bIOLOGICAL AssETs
TOTAL
R’000 R’000 R’000 R’000 R’000 R’000Number of R1 minor assets - - 1 561 - 562
Number of minor assets at cost - 474 2 9 458 - 9 934TOTAL NuMbER OF MINOR AssETs - 474 3 10 019 - 10 496
Minor Capital Assets under investigationNuMbER VALuE
R’000
Included in the above total of the minor capital assets per the asset register are assets that are under investigation:
Intangible assets 1 (6)Machinery and equipment 2 16
MOVEMENT IN MINOR AssETs PER ThE AssET REGIsTER FOR ThE yEAR ENdEd As AT 31 MARCh 2014sPECIALIsEd
MILITARy AssETsINTANGIbLE AssETs hERITAGE AssETs MAChINERy ANd
EQuIPMENTbIOLOGICAL
AssETsTOTAL
R’000 R’000 R’000 R’000 R’000 R’000Opening balance - 4 691 147 36 201 - 41 039Prior period error - - - (76) - (76)Additions - 296 - 2 460 - 2 756Disposals - (779) - (631) - (1 410)
TOTAL MINOR AssETs - 4 208 147 37 954 - 42 309
NOTES TO THE ANNUAL FINANCIAL STATEMENTSfor the year ended 31 March 2015
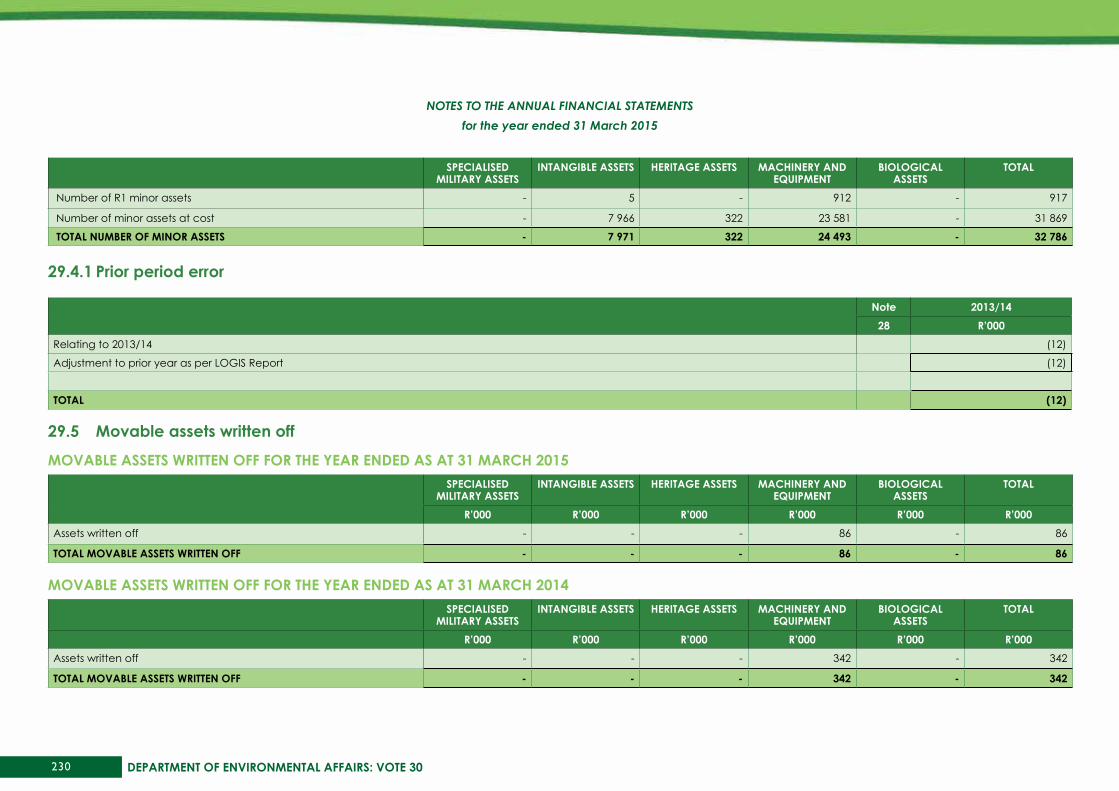
230 DEPARTMENT OF ENVIRONMENTAL AFFAIRS: VOTE 30
sPECIALIsEd MILITARy AssETs
INTANGIbLE AssETs hERITAGE AssETs MAChINERy ANd EQuIPMENT
bIOLOGICAL AssETs
TOTAL
Number of R1 minor assets - 5 - 912 - 917
Number of minor assets at cost - 7 966 322 23 581 - 31 869
TOTAL NuMbER OF MINOR AssETs - 7 971 322 24 493 - 32 786
29.4.1 Prior period error
Note 2013/1428 R’000
Relating to 2013/14 (12)
Adjustment to prior year as per LOGIS Report (12)
TOTAL (12)
29.5 Movable assets written off
MOVAbLE AssETs wRITTEN OFF FOR ThE yEAR ENdEd As AT 31 MARCh 2015sPECIALIsEd
MILITARy AssETsINTANGIbLE AssETs hERITAGE AssETs MAChINERy ANd
EQuIPMENTbIOLOGICAL
AssETsTOTAL
R’000 R’000 R’000 R’000 R’000 R’000Assets written off - - - 86 - 86
TOTAL MOVAbLE AssETs wRITTEN OFF - - - 86 - 86
MOVAbLE AssETs wRITTEN OFF FOR ThE yEAR ENdEd As AT 31 MARCh 2014sPECIALIsEd
MILITARy AssETsINTANGIbLE AssETs hERITAGE AssETs MAChINERy ANd
EQuIPMENTbIOLOGICAL
AssETsTOTAL
R’000 R’000 R’000 R’000 R’000 R’000Assets written off - - - 342 - 342
TOTAL MOVAbLE AssETs wRITTEN OFF - - - 342 - 342
NOTES TO THE ANNUAL FINANCIAL STATEMENTSfor the year ended 31 March 2015
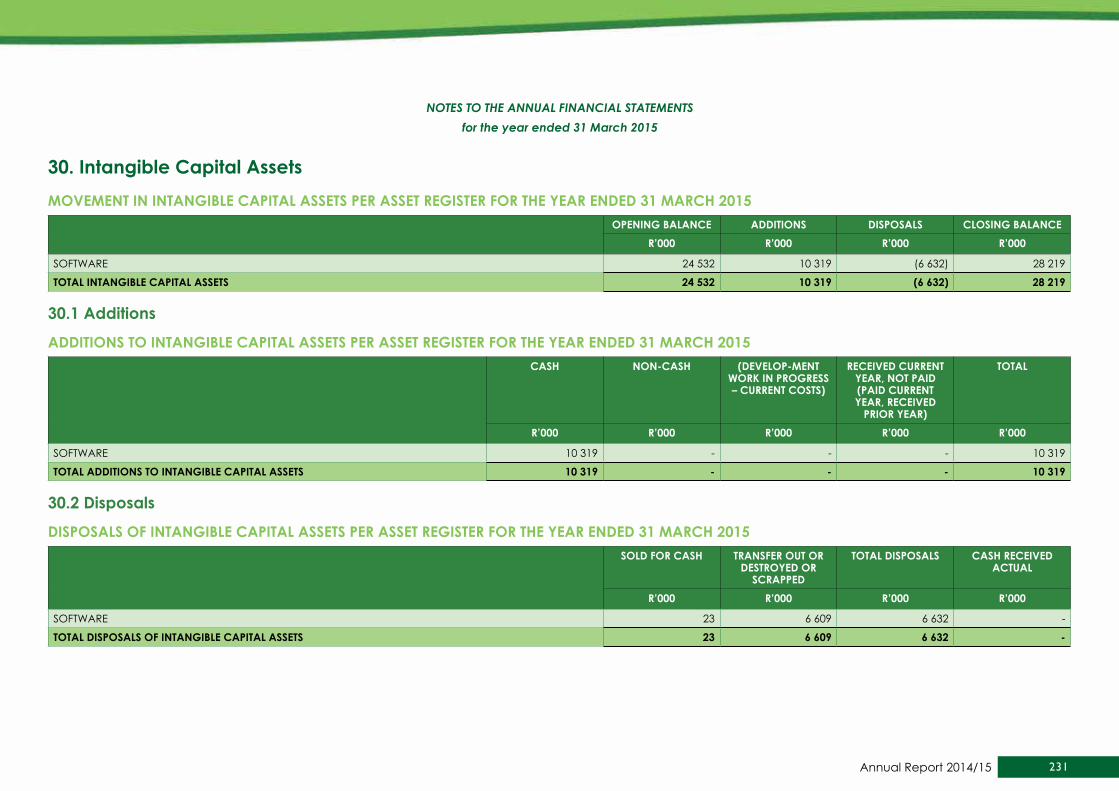
231Annual Report 2014/15
30. Intangible Capital AssetsMOVEMENT IN INTANGIbLE CAPITAL AssETs PER AssET REGIsTER FOR ThE yEAR ENdEd 31 MARCh 2015
OPENING bALANCE AddITIONs dIsPOsALs CLOsING bALANCER’000 R’000 R’000 R’000
SOFTWARE 24 532 10 319 (6 632) 28 219
TOTAL INTANGIbLE CAPITAL AssETs 24 532 10 319 (6 632) 28 219
30.1 Additions
AddITIONs TO INTANGIbLE CAPITAL AssETs PER AssET REGIsTER FOR ThE yEAR ENdEd 31 MARCh 2015CAsh NON-CAsh (dEVELOP-MENT
wORk IN PROGREss – CURRENT COSTS)
RECEIVEd CuRRENT yEAR, NOT PAId (PAId CuRRENT yEAR, RECEIVEd
PRIOR yEAR)
TOTAL
R’000 R’000 R’000 R’000 R’000
SOFTWARE 10 319 - - - 10 319
TOTAL AddITIONs TO INTANGIbLE CAPITAL AssETs 10 319 - - - 10 319
30.2 disposals
dIsPOsALs OF INTANGIbLE CAPITAL AssETs PER AssET REGIsTER FOR ThE yEAR ENdEd 31 MARCh 2015sOLd FOR CAsh TRANsFER OuT OR
dEsTROyEd OR sCRAPPEd
TOTAL dIsPOsALs CAsh RECEIVEd ACTuAL
R’000 R’000 R’000 R’000
SOFTWARE 23 6 609 6 632 -
TOTAL dIsPOsALs OF INTANGIbLE CAPITAL AssETs 23 6 609 6 632 -
NOTES TO THE ANNUAL FINANCIAL STATEMENTSfor the year ended 31 March 2015
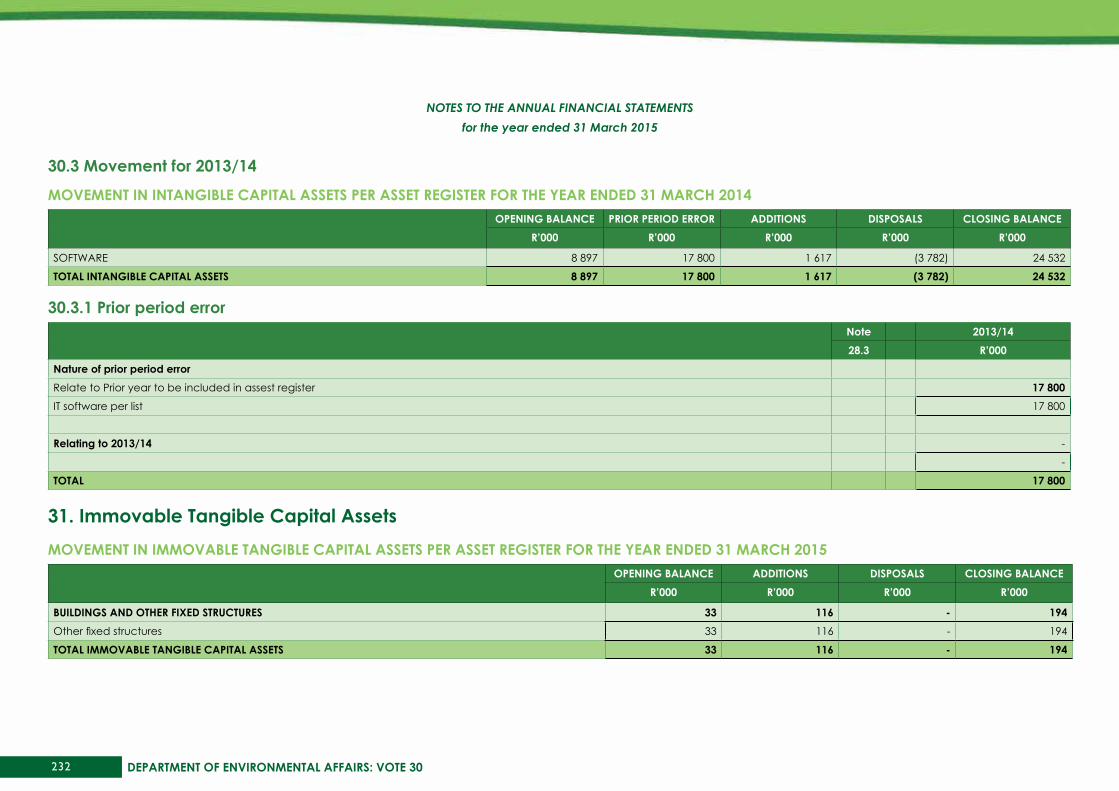
232 DEPARTMENT OF ENVIRONMENTAL AFFAIRS: VOTE 30
30.3 Movement for 2013/14
MOVEMENT IN INTANGIbLE CAPITAL AssETs PER AssET REGIsTER FOR ThE yEAR ENdEd 31 MARCh 2014OPENING bALANCE PRIOR PERIOd ERROR AddITIONs dIsPOsALs CLOsING bALANCE
R’000 R’000 R’000 R’000 R’000
SOFTWARE 8 897 17 800 1 617 (3 782) 24 532
TOTAL INTANGIbLE CAPITAL AssETs 8 897 17 800 1 617 (3 782) 24 532
30.3.1 Prior period errorNote 2013/1428.3 R’000
Nature of prior period errorRelate to Prior year to be included in assest register 17 800IT software per list 17 800
Relating to 2013/14 -
-
TOTAL 17 800
31. Immovable Tangible Capital AssetsMOVEMENT IN IMMOVAbLE TANGIbLE CAPITAL AssETs PER AssET REGIsTER FOR ThE yEAR ENdEd 31 MARCh 2015
OPENING bALANCE AddITIONs dIsPOsALs CLOsING bALANCER’000 R’000 R’000 R’000
buILdINGs ANd OThER FIXEd sTRuCTuREs 33 116 - 194Other fixed structures 33 116 - 194
TOTAL IMMOVAbLE TANGIbLE CAPITAL AssETs 33 116 - 194
NOTES TO THE ANNUAL FINANCIAL STATEMENTSfor the year ended 31 March 2015
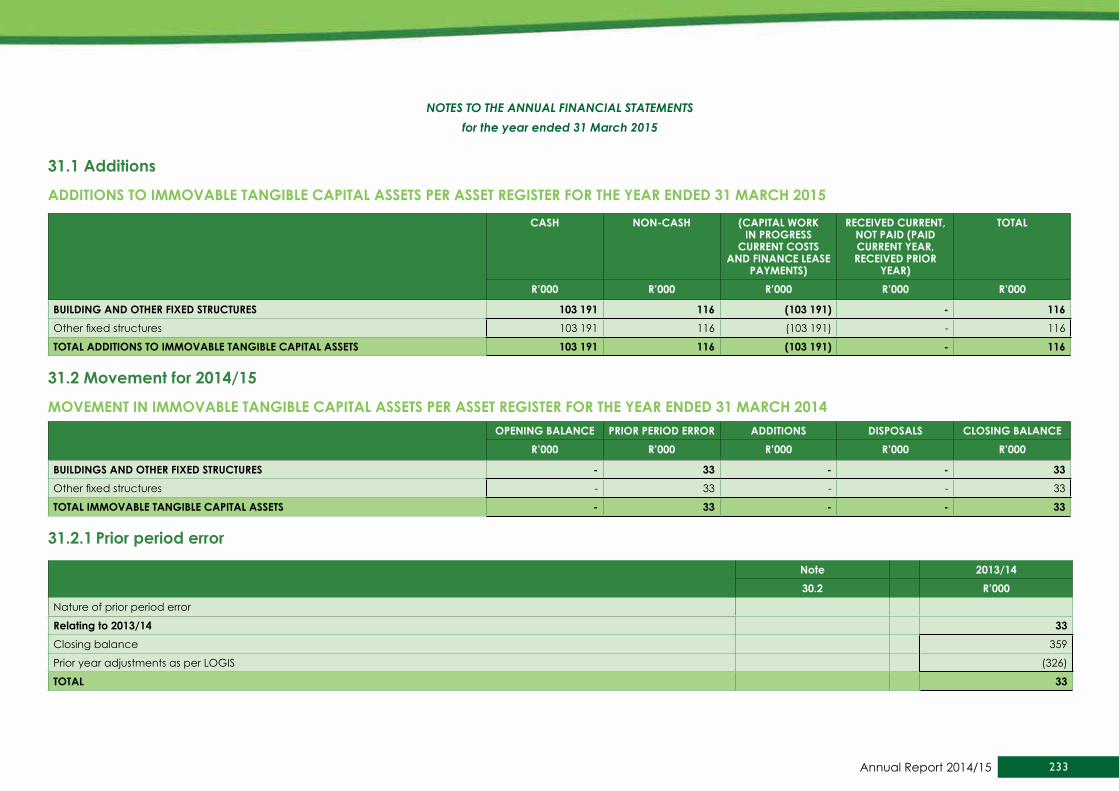
233Annual Report 2014/15
31.1 Additions
AddITIONs TO IMMOVAbLE TANGIbLE CAPITAL AssETs PER AssET REGIsTER FOR ThE yEAR ENdEd 31 MARCh 2015
CAsh NON-CAsh (CAPITAL wORk IN PROGREss
CuRRENT COsTs ANd FINANCE LEAsE
PAyMENTs)
RECEIVEd CuRRENT, NOT PAId (PAId CuRRENT yEAR, RECEIVEd PRIOR
yEAR)
TOTAL
R’000 R’000 R’000 R’000 R’000
buILdING ANd OThER FIXEd sTRuCTuREs 103 191 116 (103 191) - 116Other fixed structures 103 191 116 (103 191) - 116
TOTAL AddITIONs TO IMMOVAbLE TANGIbLE CAPITAL AssETs 103 191 116 (103 191) - 116
31.2 Movement for 2014/15
MOVEMENT IN IMMOVAbLE TANGIbLE CAPITAL AssETs PER AssET REGIsTER FOR ThE yEAR ENdEd 31 MARCh 2014OPENING bALANCE PRIOR PERIOd ERROR AddITIONs dIsPOsALs CLOsING bALANCE
R’000 R’000 R’000 R’000 R’000
buILdINGs ANd OThER FIXEd sTRuCTuREs - 33 - - 33Other fixed structures - 33 - - 33
TOTAL IMMOVAbLE TANGIbLE CAPITAL AssETs - 33 - - 33
31.2.1 Prior period error
Note 2013/1430.2 R’000
Nature of prior period error
Relating to 2013/14 33Closing balance 359
Prior year adjustments as per LOGIS (326)
TOTAL 33
NOTES TO THE ANNUAL FINANCIAL STATEMENTSfor the year ended 31 March 2015
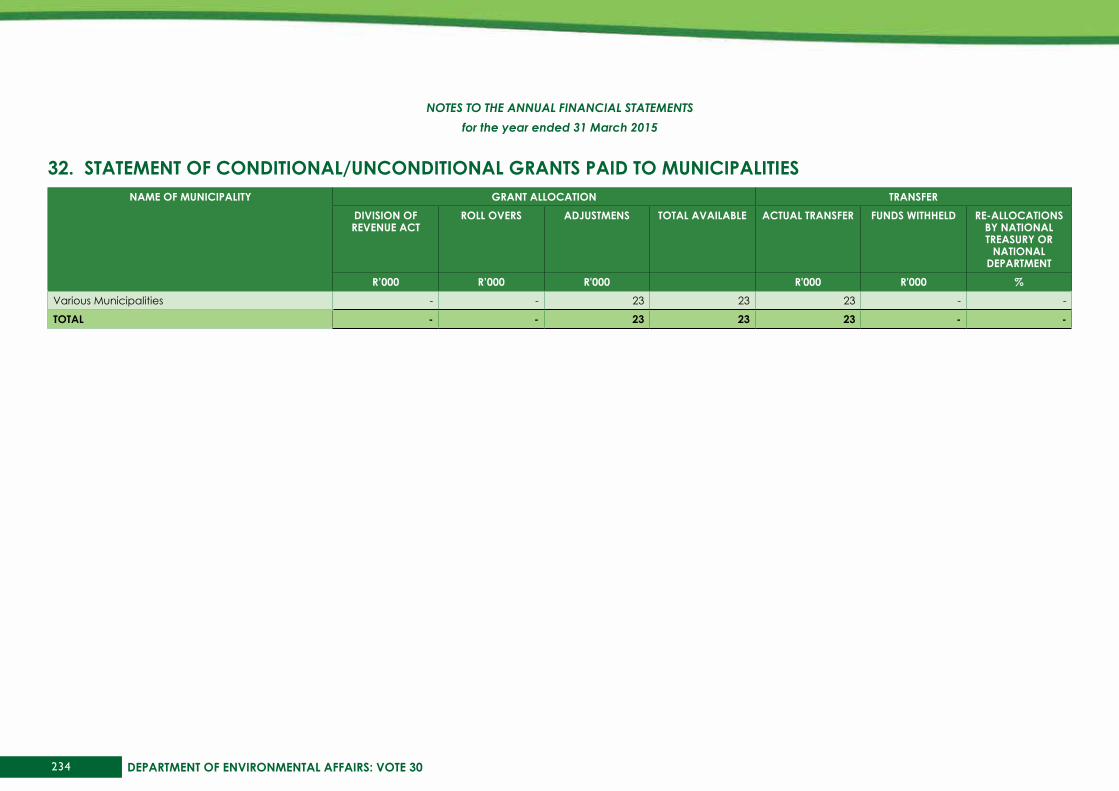
234 DEPARTMENT OF ENVIRONMENTAL AFFAIRS: VOTE 30
32. sTATEMENT OF CONdITIONAL/uNCONdITIONAL GRANTs PAId TO MuNICIPALITIEsNAME OF MuNICIPALITy GRANT ALLOCATION TRANsFER
dIVIsION OF REVENuE ACT
ROLL OVERs AdjusTMENs TOTAL AVAILAbLE ACTuAL TRANsFER FuNds wIThhELd RE-ALLOCATIONs by NATIONAL TREAsuRy OR
NATIONAL dEPARTMENT
R’000 R’000 R'000 R'000 R'000 %Various Municipalities - - 23 23 23 - -
TOTAL - - 23 23 23 - -
NOTES TO THE ANNUAL FINANCIAL STATEMENTSfor the year ended 31 March 2015

235Annual Report 2014/15
ANNEXuRE 1A
sTATEMENT OF TRANsFERs TO dEPARTMENTAL AGENCIEs ANd ACCOuNTsdEPARTMENT/ AGENCy/ ACCOuNT TRANsFER ALLOCATION TRANsFER 20XX/yy
AdjusTEd APPROPRIATION
ROLL OVERs AdjusTMENs TOTAL AVAILAbLE ACTuAL TRANsFER % OF AVAILAbLE FuNds
TRANsFERRd
APPROPRIATION ACT
R’000 R’000 R'000 R'000 R'000 %
South African Weather Service 182 489 - - 182 489 182 489 100% 182 943
iSimangaliso Wetland Park Authority 132 007 - - 132 007 132 007 100% 125 580
South African National Parks 590 922 - - 590 922 590 922 100% 544 264
South African National Biodiversity Institute 289 951 - - 289 951 289 951 100% 264 254
National Regulator for Compulsory Specifications 11 025 - - 11 025 11 025 100% 10 500
South African Broadcasting Corporation: Radio and TV Licences
- - 2 2 2 100% -
Compensation fund - - 3 861 3 861 3 861 100% 6 169
TOTAL 1 206 394 - 3 863 1 210 257 1 210 257 1 133 710
ANNEXuRE 1b
sTATEMENT OF TRANsFERs/subsIdIEs TO PubLIC CORPORATIONs ANd PRIVATE ENTERPRIsEsNAME OF PubLIC CORPORATION/PRIVATE
ENTERPRIsETRANsFER ALLOCATION EXPENdITuRE 2013/14
AdjusTEd APPROPRIATION
ACT
ROLL OVERs AdjusTMENTs TOTAL AVAILAbLE
ACTuAL TRANsFER
% OF AVAILAbLE
FuNdsTRANsFERRd
CAPITAL CuRRENT APPRO-PRIATION
ACT
R’000 R’000 R'000 R'000 R'000 % R’000 R’000Public Corporations
Green Fund: Development Bank of South Africa 250 000 - - 250 000 250 000 100% - 250 000 250 000
TOTAL 250 000 - - 250 000 250 000 100% - 250 000 250 000
ANNEXURES TO THE FINANCIAL STATEMENTSfor the year ended 31 March 2015
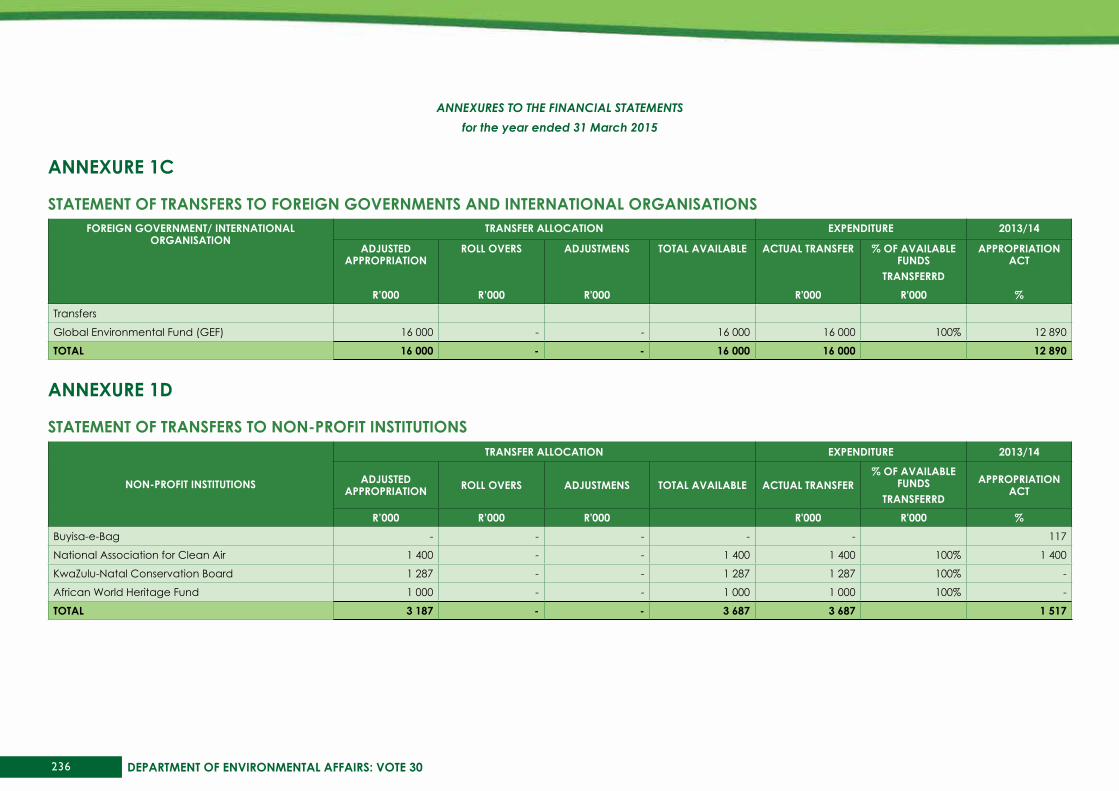
236 DEPARTMENT OF ENVIRONMENTAL AFFAIRS: VOTE 30
ANNEXuRE 1C
sTATEMENT OF TRANsFERs TO FOREIGN GOVERNMENTs ANd INTERNATIONAL ORGANIsATIONsFOREIGN GOVERNMENT/ INTERNATIONAL
ORGANIsATIONTRANsFER ALLOCATION EXPENdITuRE 2013/14
AdjusTEd APPROPRIATION
ROLL OVERs AdjusTMENs TOTAL AVAILAbLE ACTuAL TRANsFER % OF AVAILAbLE FuNds
TRANsFERRd
APPROPRIATION ACT
R’000 R’000 R'000 R'000 R'000 %Transfers
Global Environmental Fund (GEF) 16 000 - - 16 000 16 000 100% 12 890
TOTAL 16 000 - - 16 000 16 000 12 890
ANNEXuRE 1d
sTATEMENT OF TRANsFERs TO NON-PROFIT INsTITuTIONs
NON-PROFIT INsTITuTIONs
TRANsFER ALLOCATION EXPENdITuRE 2013/14
AdjusTEd APPROPRIATION ROLL OVERs AdjusTMENs TOTAL AVAILAbLE ACTuAL TRANsFER
% OF AVAILAbLE FuNds
TRANsFERRd
APPROPRIATION ACT
R’000 R’000 R'000 R'000 R'000 %Buyisa-e-Bag - - - - - 117
National Association for Clean Air 1 400 - - 1 400 1 400 100% 1 400
KwaZulu-Natal Conservation Board 1 287 - - 1 287 1 287 100% -
African World Heritage Fund 1 000 - - 1 000 1 000 100% -
TOTAL 3 187 - - 3 687 3 687 1 517
ANNEXURES TO THE FINANCIAL STATEMENTSfor the year ended 31 March 2015
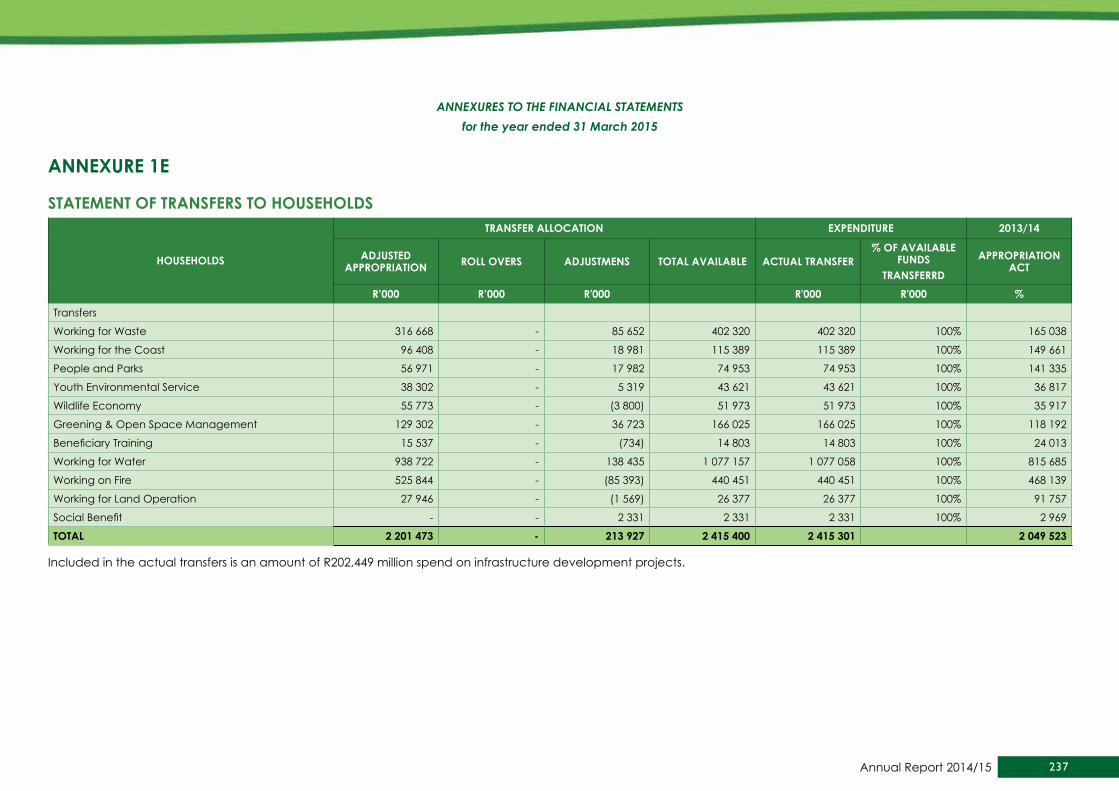
237Annual Report 2014/15
ANNEXuRE 1E
sTATEMENT OF TRANsFERs TO hOusEhOLds
hOusEhOLds
TRANsFER ALLOCATION EXPENdITuRE 2013/14
AdjusTEd APPROPRIATION ROLL OVERs AdjusTMENs TOTAL AVAILAbLE ACTuAL TRANsFER
% OF AVAILAbLE FuNds
TRANsFERRd
APPROPRIATION ACT
R’000 R’000 R'000 R'000 R'000 %Transfers
Working for Waste 316 668 - 85 652 402 320 402 320 100% 165 038
Working for the Coast 96 408 - 18 981 115 389 115 389 100% 149 661
People and Parks 56 971 - 17 982 74 953 74 953 100% 141 335
Youth Environmental Service 38 302 - 5 319 43 621 43 621 100% 36 817
Wildlife Economy 55 773 - (3 800) 51 973 51 973 100% 35 917
Greening & Open Space Management 129 302 - 36 723 166 025 166 025 100% 118 192
Beneficiary Training 15 537 - (734) 14 803 14 803 100% 24 013
Working for Water 938 722 - 138 435 1 077 157 1 077 058 100% 815 685
Working on Fire 525 844 - (85 393) 440 451 440 451 100% 468 139
Working for Land Operation 27 946 - (1 569) 26 377 26 377 100% 91 757
Social Benefit - - 2 331 2 331 2 331 100% 2 969
TOTAL 2 201 473 - 213 927 2 415 400 2 415 301 2 049 523
Included in the actual transfers is an amount of R202,449 million spend on infrastructure development projects.
ANNEXURES TO THE FINANCIAL STATEMENTSfor the year ended 31 March 2015

238 DEPARTMENT OF ENVIRONMENTAL AFFAIRS: VOTE 30
ANNEXuRE 1F
sTATEMENT OF AId AssIsTANCE RECEIVEd
NAME OF dONOR PuRPOsEOPENING bALANCE
R'000 REVENuE
R'000 EXPENdITuRE
R'000CLOsING bALANCE
R'000Received in cash United Nations (UNEP) Reducing Mercury Emission from Coal Combustion into the Energy
Sector (74) 74 - -
Denmark National Waste Management Strategy Programme (1 000) 1 000 - -
Germany Climate Change Programme 82 2 302 2 384 -
Germany Supporting the Development and Implementation of Access and Benefit Sharing Policies in Africa – South Africa
193 1 276 1 469 -
Germany 1st Biennial Update Report: Prometium Carbon Programme - - 1 254 (1 254)
Australia Funding Agreement in Relation to South Africa Land Sector Measurement
(766) 2 038 2 517 (1 245)
United Nations (UNEP) Hazardous Material Management Programme (654) - - (654)
United Nations (UNEP) Strengthening Law Enforcement Capabilities to Combat Wildlife Crime for Conservation and Sustainable Use of Species In South Africa: target: Rhinoceros
- - 2 223 (2 223)
United Nations (UNEP) Benguela Current Large Marine Ecosystem Programme - - 1 142 (1 142)
United Nations (UNEP) Payment for Watershed Services 23 - - 23
United Nations (UNEP) Synergies Workshop among the Basel, Stockholm and Rotterdam Conventions
- - 790 (790)
United Nations (UNEP) South Africa: Enabling Activities for the Preparation of Third National Communications (TNC) and Biennial Update Report (BUR)
- - 446 (446)
TOTAL (2 196) 6 690 12 225 (7 731)
ANNEXURES TO THE FINANCIAL STATEMENTSfor the year ended 31 March 2015

239Annual Report 2014/15
ANNEXuRE 1G
sTATEMENT OF GIFTs, dONATIONs ANd sPONsORshIPs MAdE NATuRE OF GIFT, dONATION OR sPONsORshIP(Group major categories but list material items including name of organisation
2014/15 2013/14R’000 R’000
Made in kind
Mount Pleasunt Primary School (Waste Management Competition) - 7
Gelvandale High School (Waste Management Competition) - 26
Marilliers Learning Academy (Waste Management Competition) - 3
Fumisukoma Primary School (Waste Management Competition) - 3
St James High School (Waste Management Competition) - 2
Ebenezer Majombozi High School (Waste Management Competition) - 11
Mqikela Secondary School (Waste Management Competition) - 15
EX-GRATIA Chief Director Ms. NZ Cobinnah acting DDG - 15
EX-GRATIA Chief Director Ms. NZ Cobinnah acting DDG - 10
TOTAL - 92
ANNEXURES TO THE FINANCIAL STATEMENTSfor the year ended 31 March 2015

240 DEPARTMENT OF ENVIRONMENTAL AFFAIRS: VOTE 30
ANNEXuRE 3A
STATEMENT OF FINANCIAL GUARANTEES ISSUED AS AT 31 MARCH 2015 – LOCAL
GuARANTOR INsTITuTION GuARANTEE IN REsPECT OF
ORIGINAL GuARANTEEd
CAPITAL AMOuNT
OPENING bALANCE
1 APRIL 20yy
GuARANTEEsdRAw
dOwNsduRING ThE
yEAR
GuARANTEEsREPAyMENTs/ CANCELLEd/
REduCEd/ RELEAsEd
duRING ThE yEAR
REVALuA-TIONs
CLOsING bALANCE31 MARCh
20ZZ
GuARANTEEd INTEREsT FOR yEAR ENdEd 31 MARCh
20ZZ
REALIsEdLOssEs NOT
RECOVERAbLE I.E. CLAIMs PAId OuT
R’000 R'000 R’000 R'000 R'000 % R’000 R’000Standard Bank - 131 - - - 131 - -
FirstRand Bank: FNB - 81 - 24 - 57 - -
ABSA Bank - 207 - - - 207 - -
Nedbank/Perm - 33 - - - 33 - -
Green Start H/loans - 35 - - - 35 - -
TOTAL - 487 - 24 - 463 - -
ANNEXURES TO THE FINANCIAL STATEMENTSfor the year ended 31 March 2015
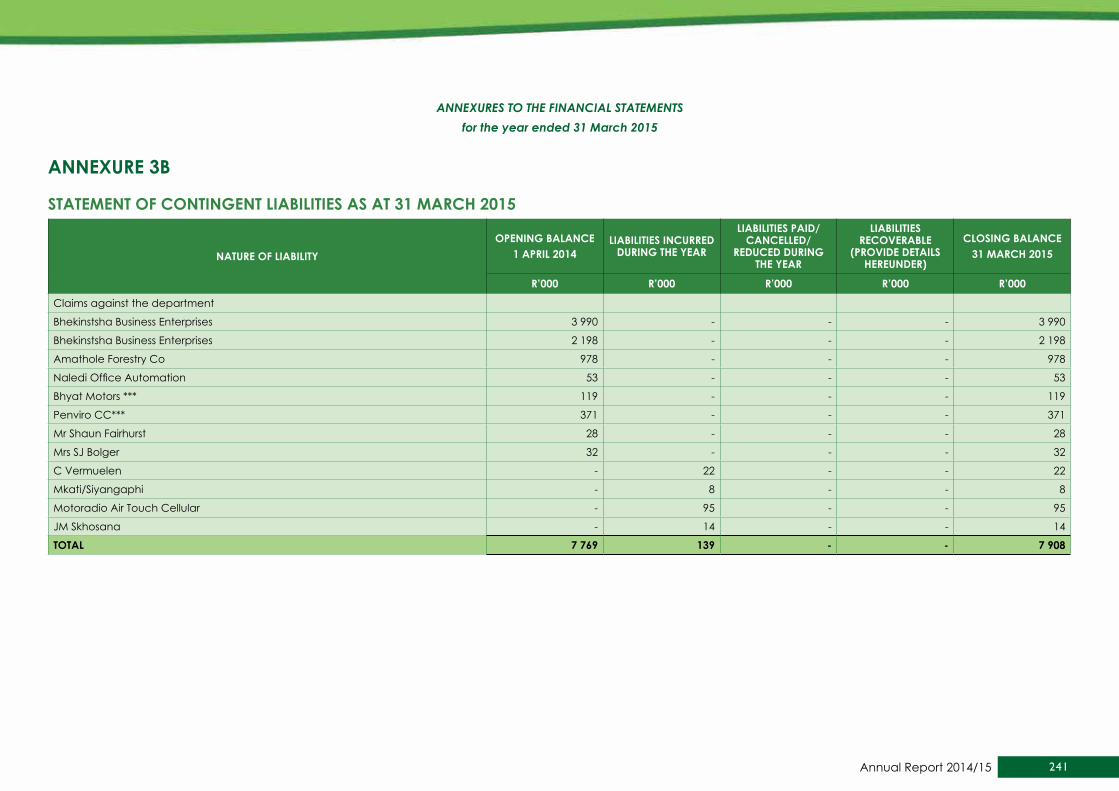
241Annual Report 2014/15
ANNEXuRE 3b
sTATEMENT OF CONTINGENT LIAbILITIEs As AT 31 MARCh 2015
NATuRE OF LIAbILITyOPENING bALANCE
1 APRIL 2014LIAbILITIEs INCuRREd
duRING ThE yEAR
LIAbILITIEs PAId/CANCELLEd/
REduCEd duRING ThE yEAR
LIAbILITIEs RECOVERAbLE
(PROVIdE dETAILs hEREuNdER)
CLOsING bALANCE 31 MARCh 2015
R’000 R’000 R’000 R’000 R’000
Claims against the department
Bhekinstsha Business Enterprises 3 990 - - - 3 990
Bhekinstsha Business Enterprises 2 198 - - - 2 198
Amathole Forestry Co 978 - - - 978
Naledi Office Automation 53 - - - 53
Bhyat Motors *** 119 - - - 119
Penviro CC*** 371 - - - 371
Mr Shaun Fairhurst 28 - - - 28
Mrs SJ Bolger 32 - - - 32
C Vermuelen - 22 - - 22
Mkati/Siyangaphi - 8 - - 8
Motoradio Air Touch Cellular - 95 - - 95
JM Skhosana - 14 - - 14
TOTAL 7 769 139 - - 7 908
ANNEXURES TO THE FINANCIAL STATEMENTSfor the year ended 31 March 2015
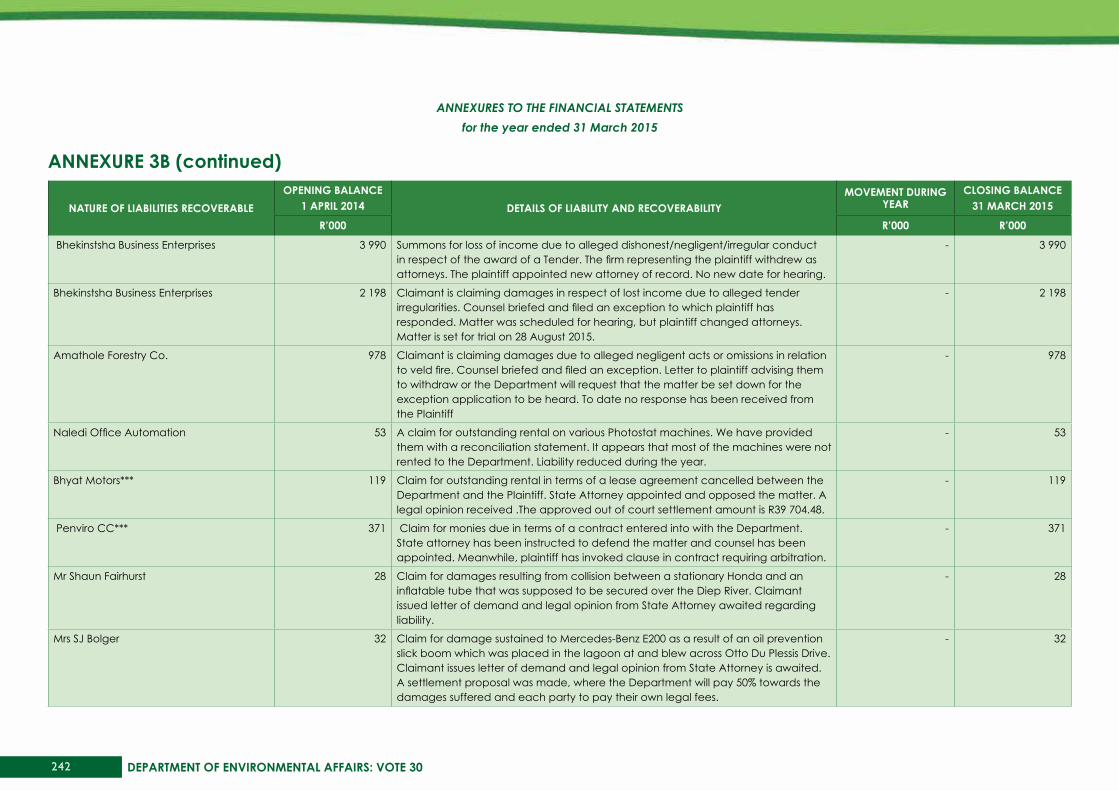
242 DEPARTMENT OF ENVIRONMENTAL AFFAIRS: VOTE 30
ANNEXuRE 3b (continued)
NATuRE OF LIAbILITIEs RECOVERAbLEOPENING bALANCE
1 APRIL 2014 dETAILs OF LIAbILITy ANd RECOVERAbILITyMOVEMENT duRING
yEARCLOsING bALANCE
31 MARCh 2015
R’000 R’000 R’000
Bhekinstsha Business Enterprises 3 990 Summons for loss of income due to alleged dishonest/negligent/irregular conduct in respect of the award of a Tender. The firm representing the plaintiff withdrew as attorneys. The plaintiff appointed new attorney of record. No new date for hearing.
- 3 990
Bhekinstsha Business Enterprises 2 198 Claimant is claiming damages in respect of lost income due to alleged tender irregularities. Counsel briefed and filed an exception to which plaintiff has responded. Matter was scheduled for hearing, but plaintiff changed attorneys. Matter is set for trial on 28 August 2015.
- 2 198
Amathole Forestry Co. 978 Claimant is claiming damages due to alleged negligent acts or omissions in relation to veld fire. Counsel briefed and filed an exception. Letter to plaintiff advising them to withdraw or the Department will request that the matter be set down for the exception application to be heard. To date no response has been received from the Plaintiff
- 978
Naledi Office Automation 53 A claim for outstanding rental on various Photostat machines. We have provided them with a reconciliation statement. It appears that most of the machines were not rented to the Department. Liability reduced during the year.
- 53
Bhyat Motors*** 119 Claim for outstanding rental in terms of a lease agreement cancelled between the Department and the Plaintiff. State Attorney appointed and opposed the matter. A legal opinion received .The approved out of court settlement amount is R39 704.48.
- 119
Penviro CC*** 371 Claim for monies due in terms of a contract entered into with the Department. State attorney has been instructed to defend the matter and counsel has been appointed. Meanwhile, plaintiff has invoked clause in contract requiring arbitration.
- 371
Mr Shaun Fairhurst 28 Claim for damages resulting from collision between a stationary Honda and an inflatable tube that was supposed to be secured over the Diep River. Claimant issued letter of demand and legal opinion from State Attorney awaited regarding liability.
- 28
Mrs SJ Bolger 32 Claim for damage sustained to Mercedes-Benz E200 as a result of an oil prevention slick boom which was placed in the lagoon at and blew across Otto Du Plessis Drive. Claimant issues letter of demand and legal opinion from State Attorney is awaited. A settlement proposal was made, where the Department will pay 50% towards the damages suffered and each party to pay their own legal fees.
- 32
ANNEXURES TO THE FINANCIAL STATEMENTSfor the year ended 31 March 2015
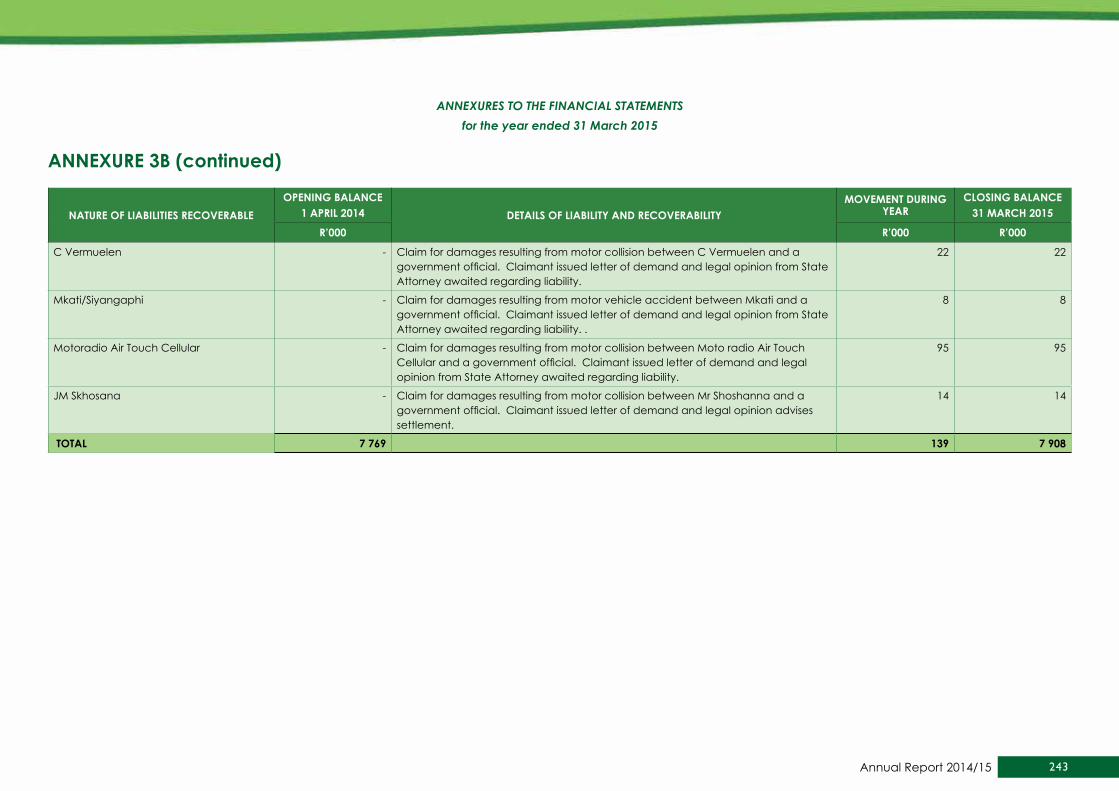
243Annual Report 2014/15
NATuRE OF LIAbILITIEs RECOVERAbLEOPENING bALANCE
1 APRIL 2014 dETAILs OF LIAbILITy ANd RECOVERAbILITyMOVEMENT duRING
yEARCLOsING bALANCE
31 MARCh 2015
R’000 R’000 R’000
C Vermuelen - Claim for damages resulting from motor collision between C Vermuelen and a government official. Claimant issued letter of demand and legal opinion from State Attorney awaited regarding liability.
22 22
Mkati/Siyangaphi - Claim for damages resulting from motor vehicle accident between Mkati and a government official. Claimant issued letter of demand and legal opinion from State Attorney awaited regarding liability. .
8 8
Motoradio Air Touch Cellular - Claim for damages resulting from motor collision between Moto radio Air Touch Cellular and a government official. Claimant issued letter of demand and legal opinion from State Attorney awaited regarding liability.
95 95
JM Skhosana - Claim for damages resulting from motor collision between Mr Shoshanna and a government official. Claimant issued letter of demand and legal opinion advises settlement.
14 14
TOTAL 7 769 139 7 908
ANNEXURES TO THE FINANCIAL STATEMENTSfor the year ended 31 March 2015
ANNEXuRE 3b (continued)

244 DEPARTMENT OF ENVIRONMENTAL AFFAIRS: VOTE 30
ANNEXuRE 4
CLAIMs RECOVERAbLE
GOVERNMENT ENTITy
CONFIRMEd bALANCE OuTsTANdING uNCONFIRMEd bALANCE OuTsTANdING TOTAL31/03/2015 31/03/2014 31/03/2015 31/03/2014 31/03/2015 31/03/2014
R’000 R’000 R’000 R’000 R’000 R’000
dEPARTMENTKwa Zulu Natal: Agriculture Environmental Affairs and Rural Development
- 34 - - - 34
Limpopo; Department of Economic Development - 23 - - - 23
Department of Energy - - - 24 - 24
Department ;of Finance - - - 88 - 88
Department of Water Affairs - 4 437 13 300 - 13 300 4 437
Department of Labour - 73 - - - 73
Department of Public Works - - - 21 - 21
Department of Rural Development and Land Reformed - 42 - - - 42
Department of Science and Technology - - 9 488 9 488 -
Gauteng: Provincial Treasury - - 18 - 18 -
sub total - 4 609 22 806 133 22 806 4 742OThER GOVERNMENTs ENTITIEsCJA-F Business enterprise CC - - - 8 - 8
TOTAL - 4 609 22 806 141 22 806 4 750
ANNEXURES TO THE FINANCIAL STATEMENTSfor the year ended 31 March 2015

245Annual Report 2014/15
ANNEXuRE 5
INTER-GOVERNMENT PAyAbLEs
GOVERNMENT ENTITy
CONFIRMEd bALANCE OuTsTANdING
uNCONFIRMEd bALANCE OuTsTANdING TOTAL CAsh IN TRANsIT AT yEAR ENd
2014/15*
31/03/2015 31/03/2014 31/03/2015 31/03/2014 31/03/2015 31/03/2014
PAyMENT dATE uP
TO sIX (6) wORkING
dAys bEFORE yEAR ENd.
AMOuNT
R’000 R’000 R’000 R’000 R’000 R’000 R’000dEPARTMENTsCurrentDepartment of Water Affairs & Santitation - 30 232 - 232 30 02/04/2015 232
Department of Justice and Constitutional Development 1 980 1 200 - - 1 980 1 200
Department: Government Printing Works 62 218 10 - 10 218
Western Cape Government (Human Settlement - - - 22 - 22
Western Cape Government (Social Development) - 24 - - - 24
SAPS - - 18 - 18 -
National Prosecuting Authority (NPA) - - 10 - 10 -
Department: Performance Monitoring & Evaluation 266 - - - 266 -
Gauteng Government (Agriculture & Rural Development 26 - - - - - 07/04/2015 266
Western Cape Government(Transport& Public Works) 82 - - - 82 -
Department of International Relations and Cooperation - - 414 - 414 -
TOTAL 2 416 1 472 674 22 3 090 1 494 498
ANNEXURES TO THE FINANCIAL STATEMENTSfor the year ended 31 March 2015

246 DEPARTMENT OF ENVIRONMENTAL AFFAIRS: VOTE 30
ANNEXuRE 6
INVENTORIEs
INVENTORyQuANTITy 2014/15 QuANTITy 2013/14
Note R’000 R’000
Opening balance 1 025 162 15 463 3 398
Add/(Less): Adjustments to prior year balance 8 256 3 788 50 2 803
Add: Additions/Purchases - Cash 33 878 10 234 1 364 841 183 226
(Less): Disposals - - (10) (1 989)
(Less): Issues (12 497) (5 287) (1 367 498) (183 109)
Add/(Less): Adjustments (50) (2 803) (11 821) (4 167)
CLOsING bALANCE 30 612 6 094 1 025 162
ANNEXURES TO THE FINANCIAL STATEMENTSfor the year ended 31 March 2015

247Annual Report 2014/15
ANNEXuRE 7
MOVEMENT IN CAPITAL wORk IN PROGREss
MOVEMENT IN CAPITAL wORk IN PROGREss FOR ThE yEAR ENdEd 31 MARCh 2015
OPENING bALANCE CuRRENT yEAR CAPITAL wIP COMPLETEd AssETs CLOsING bALANCE
R’000 R’000 R’000 R’000
buILdINGs ANd OThER FIXEd sTRuCTuREs 942 547 305 640 (53 899) 1 194 288Non-residential buildings 394 816 103 191 - 498 007
Other fixed structures 547 731 202 449 (53 899) 696 281
TOTAL 942 547 305 640 (53 899) 1 194 288
MOVEMENT IN CAPITAL wORk IN PROGREss FOR ThE yEAR ENdEd 31 MARCh 2014
OPENING bALANCE PRIOR PERIOd ERROR
CuRRENT yEAR CAPITAL wIP COMPLETEd AssETs CLOsING bALANCE
R’000 R’000 R’000 R’000 R’000
buILdINGs ANd OThER FIXEd sTRuCTuREs 647 578 (128 672) 423 641 - 942 547Non-residential buildings 220 419 - 174 397 - 394 816
Other fixed structures 427 159 (128 672) 249 244 - 547 731
TOTAL 647 578 (128 672) 423 641 - 942 547
The amount disclosed under Other Fixed Structures refers to Infrastructure Development projects paid under Economical Classification Transfers.
ANNEXURES TO THE FINANCIAL STATEMENTSfor the year ended 31 March 2015

248 DEPARTMENT OF ENVIRONMENTAL AFFAIRS: VOTE 30
NOTES.............................................................................................................................................................................................................................................................................................................
.............................................................................................................................................................................................................................................................................................................
.............................................................................................................................................................................................................................................................................................................
.............................................................................................................................................................................................................................................................................................................
.............................................................................................................................................................................................................................................................................................................
.............................................................................................................................................................................................................................................................................................................
.............................................................................................................................................................................................................................................................................................................
.............................................................................................................................................................................................................................................................................................................
.............................................................................................................................................................................................................................................................................................................
.............................................................................................................................................................................................................................................................................................................
.............................................................................................................................................................................................................................................................................................................
.............................................................................................................................................................................................................................................................................................................
.............................................................................................................................................................................................................................................................................................................
.............................................................................................................................................................................................................................................................................................................
.............................................................................................................................................................................................................................................................................................................
.............................................................................................................................................................................................................................................................................................................
.............................................................................................................................................................................................................................................................................................................
.............................................................................................................................................................................................................................................................................................................
.............................................................................................................................................................................................................................................................................................................
.............................................................................................................................................................................................................................................................................................................
.............................................................................................................................................................................................................................................................................................................
.............................................................................................................................................................................................................................................................................................................
.............................................................................................................................................................................................................................................................................................................
.............................................................................................................................................................................................................................................................................................................
.............................................................................................................................................................................................................................................................................................................
.............................................................................................................................................................................................................................................................................................................
.............................................................................................................................................................................................................................................................................................................
.............................................................................................................................................................................................................................................................................................................
.............................................................................................................................................................................................................................................................................................................


Physical Address
Environment House,
473 Steve Biko,
Arcadia,
Pretoria, 0083
South Africa
Postal Address
Private Bag X447
Pretoria
0001
South Africa
Call centre: 086 111 2468
E-mail: [email protected]
website: www.environment.gov.za
department of Environmental Affairs


![Food and Environmental Hygiene Department … · Food and Environmental Hygiene Department Controlling Officer's Environmental Report 2012 14/3/2014 10:35:35]](https://img.dokumen.tips/doc/110x75/5b5b91fd7f8b9aa30c8e6aff/food-and-environmental-hygiene-department-food-and-environmental-hygiene-department.jpg)