Embed Size (px)
Citation preview

THE PENNSYLVANIA STATE UNIVERSITY
DEPARTMENT OF ENGINEERING SCIENCE AND MECHANICS
ACTIVE SUSPENSION FOR V2V AND V2I LEARNING OF ROAD COMFORT
XIAOMING LIANG
Spring 2013
A thesis submitted in partial fulfillment
of the requirements for a baccalaureate degree
in Engineering Science
Reviewed and approved* by the following:
Sean N. Brennan Associate Professor of Electrical Engineering Thesis Supervisor Charles E. Bakis Professor of Engineering Science and Mechanics Honors Adviser Judith A. Todd P. B. Breneman Deparment Head Chair Professor, Department of Engineering Science and Mechanics
* Signatures are on file in the Engineering Science and Mechanics office.

We approve the thesis of Xiaoming Liang:
Date of Signature
Sean N. Brennan Associate Professor of Mechanical Engineering Thesis Supervisor
Charles E. Bakis Distinguished Professor of Engineering Science
Academic Adviser
Judith A. Todd P. B. Breneman Department Head Chair
Professor, Department of Engineering Science and Mechanics
Student ID# 921994864

ABSTRACT
Traditionally, vehicles have used passive suspension systems with fixed stiffness and
damping characteristics. Because they can only react to the road surface after contact with a
bump or pothole, this makes the performance of passive suspension systems difficult to change,
regardless of what type of terrain the vehicle is travelling on or how the suspension is activated.
However, for improved passenger comfort, a suspension system should be able to adjust its
spring and damping characteristics based on the road surface. Active suspension systems can
adjust the suspension characteristics to allow input force to the system as necessary to help
improve the comfort of the vehicle. This thesis describes the setup and operation of an active
suspension test rig as well as the analysis of PID controlled active suspension behaviors.

Contents
ABSTRACT ...................................................................................................................................................... 1
Acknowledgements ....................................................................................................................................... 5
Chapter 1 Introduction ................................................................................................................................. 6
1.1 Motivation ........................................................................................................................................... 7
1.2 Outline of Remaining Chapters ........................................................................................................... 7
Chapter 2 Theory .......................................................................................................................................... 8
2.1 Passive Suspension Model ................................................................................................................ 12
2.2 Full Active Suspension Model ........................................................................................................... 15
2.3 Skyhook Active Suspension Model ................................................................................................... 17
Chapter 3 Test Rig Preparation ................................................................................................................... 19
3.1 Transportation and Restoration........................................................................................................ 19
3.2 Temporary Power Installation .......................................................................................................... 21
3.3 Hydraulic Fluid Spill Control .............................................................................................................. 22
3.4 Pump Testing Schedule ..................................................................................................................... 23
Chapter 4 Simulation Predictions ............................................................................................................... 27
4.1 Passive Suspension Simulation Results ............................................................................................. 27
4.2 Full Active Suspension simulation results ......................................................................................... 31
4.3 Skyhook Active Suspension simulation results .................................... Error! Bookmark not defined.
Chapter 5 Experimental Testing and Model Validation .............................................................................. 39
Chapter 6 Conclusion and Future Work ...................................................................................................... 40

Acknowledgements
I would never have been able to finish my thesis without the help from my research group
members and guidance from the faculty members. I would like to express my deepest gratitude
to my thesis advisor, Dr. Sean Brennan. Without his guidance, patience, and kindness, I would
not be able to progress in my study. I would like to thank the staff at Larson Transportation
Institute, especially David Klinikowski, Allen Homan, and Robin Tallon. They provided me with
great help in setting up the suspension test rig and purchasing components. I would like to thank
Edward and Thomas from ASAP hydraulics for their advices on hydraulic systems. Finally, I
would like to thank people from my research group for their guidance and help in constructing
the simulation models and setting up the suspension test rig.

Chapter 1 Introduction
Traditional suspension systems utilize a spring and a damper to provide stiffness and
damping for a vehicle‟s body [1]. Because traditional suspensions only provide passive reactions
to road surfaces, traditional suspension systems are also called passive suspension systems.
Passive suspension systems have been used on motor vehicles for centuries [2]. One of the
biggest limitations of passive suspension systems is that the suspension can only react to the road
irregularities after the wheels of the vehicle roll over the irregularities. This means the reaction
from the suspension system only happens after some road disturbance is already transferred to
the sprung mass of the vehicle, causing discomfort. Therefore, a passive suspension can never
perfectly react to road irregularities to prevent all disturbances from being transferred into the
sprung mass.
In the 20th century, a new type of suspension system emerged and showed promise in
improving vehicle comfort and handling. Such system can be divided into two categories: semi-
active suspension and active suspension. A semi-active suspension system has the ability to
change the damping characteristic of the suspension system, but is unable to insert energy into
the system. An active suspension system has the ability to insert energy to the system. In this
way, the sprung mass control could be improved, providing more comfort for the passengers [1].
However, despite the ability to vary the damping characteristics and to insert energy into the
system, semi-active suspension and active suspension systems still reacts to road disturbances in
a “passive” manner [3]. Therefore, road disturbance still could not be completely eliminated.
In order to completely eliminate road disturbance, terrain information has to be known to
the suspension system. The ability to “foresee” the incoming road irregularities enables the

active suspension to act before making contact with the irregularities, thus giving the possibility
to completely eliminate the disturbance transferred to the sprung mass.
This thesis describes the study of active suspensions using a hydraulic active suspension
test rig and simulation tools, for the novel purpose of using suspension forces to read the road
disturbance that have been mapped. This thesis will specify the setup, operation, and testing of
the test rig. The suspension system will be modeled using MATLAB Simulink. A PID control
system will be used as the controller of the active suspension. The objective of this thesis is to
analyze PID controlled active suspension behaviors and compare it to passive suspensions.
1.1 Motivation
The main motivation for this thesis is to start a study on active suspension for Vehicle to
Vehicle (V2V) and Vehicle to Infrastructure (V2I) learning of road comfort using a hydraulic
active suspension test rig. This thesis is merely the first step of the study. V2V and V2I
communication utilizes vehicle and infrastructure supplied information to adjust an active
suspension performance for improved road comfort. Eventually, the technology will also be used
for controlling vehicle emergency maneuver to enhance vehicle safety. As this study is
conducted, the active suspension test rig will be prepared for future studies. Using the knowledge
on the active suspension test rig from this study, future students can conduct experiments with
the test rig.
1.2 Outline of Remaining Chapters
This thesis consists of 5 other chapters. Chapter 2 provides the theoretical backgrounds of
the study. The simulation modeling of the 2 degree of freedom quarter car physical model is

detailed in chapter 2. Chapter 3 specifies the preparation of the hydraulic active suspension test
rig that will be used in future studies. Chapter 4 shows the simulation results and analysis using
the Simulink model created in chapter 2. Chapter 5 describes the physical testing of the test rig
and the result. Finally, the conclusions are drawn in Chapter 6.
1. Savaresi, Sergio M., et al., et al. Semi-Active Suspension Control Design for Vehicles. MA, USA :
Elsevier Ltd., 2011.
2. Dixon, John C. Tires, Suspension, and Handling. Warrendale, PA : Society of Automotive Engineers,
Inc., 1996.
3. Survey on Some Automotive Semi-Active Suspension Control Methods: a Comparative Study on a
Single-Corner Model. Poussot-Vassal, C., et al., et al. Milano, Italy : s.n., 2011.

Chapter 2 Theory
To model the suspension system, a 2 degree-of-freedom quarter car suspension model
was used, as seen in Error! Reference source not found.. The suspension system was modeled as a
spring and a damper. The tire was also modeled as a spring and a damper, but with extremely
small damping (representative of an actual tire). The simulation of the active suspension system
was done using MATLAB and Simulink. State-space equations and block diagrams were used to
create the simulation. Feedback controllers were created in the active suspension systems. To
help evaluate the performance of the active suspension system, a passive suspension system
simulation was also conducted to compare the performances.
2.1 Modeling the Suspension System
Figure 2-1 Suspension system diagram
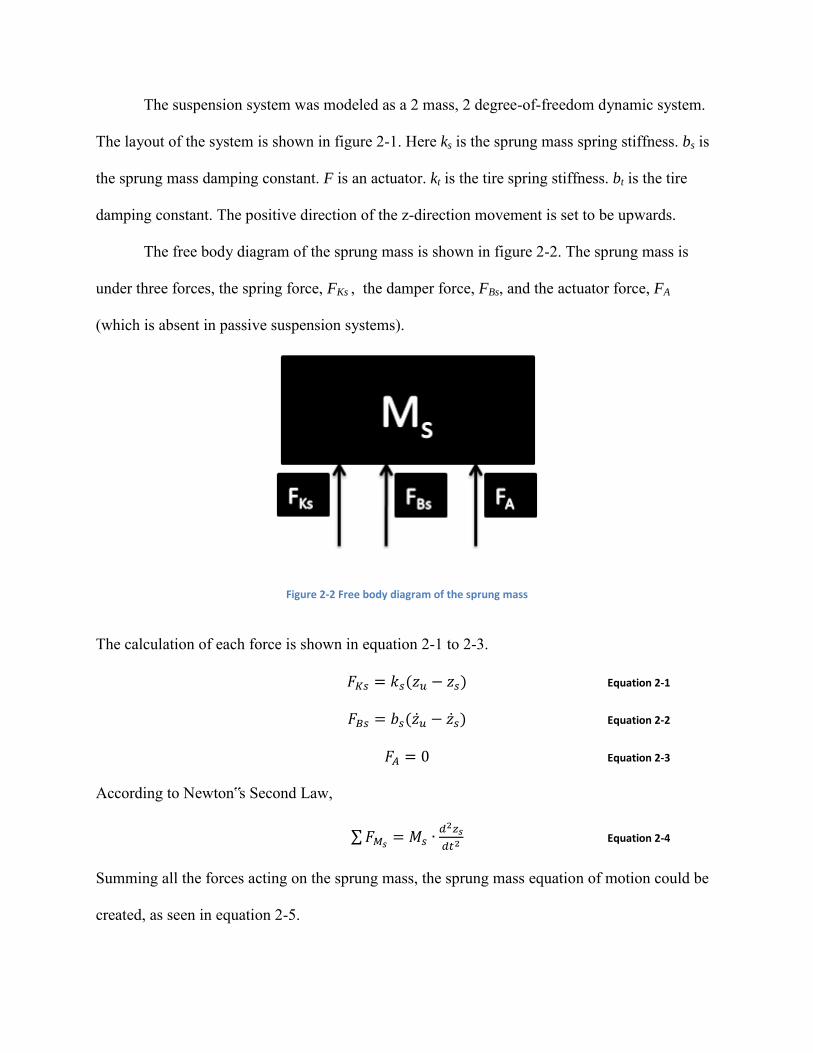
The suspension system was modeled as a 2 mass, 2 degree-of-freedom dynamic system.
The layout of the system is shown in figure 2-1. Here ks is the sprung mass spring stiffness. bs is
the sprung mass damping constant. F is an actuator. kt is the tire spring stiffness. bt is the tire
damping constant. The positive direction of the z-direction movement is set to be upwards.
The free body diagram of the sprung mass is shown in figure 2-2. The sprung mass is
under three forces, the spring force, FKs , the damper force, FBs, and the actuator force, FA
(which is absent in passive suspension systems).
Figure 2-2 Free body diagram of the sprung mass
The calculation of each force is shown in equation 2-1 to 2-3.
Equation 2-1
Equation 2-2
Equation 2-3
According to Newton‟s Second Law,
∑
Equation 2-4
Summing all the forces acting on the sprung mass, the sprung mass equation of motion could be
created, as seen in equation 2-5.

Equation 2-5
The unsprung mass is under five forces, as seen in figure 2-3, the tire damping force, FBt,
the tire spring force, FKt, the spring force, FKs, the damper force, FBs, and the actuator force FA
(which is absent in passive suspension systems).
Figure 2-3 Free body diagram of the unsprung mass
The calculation of each force is shown in equation 2-6 to 2-9.
Equation 2-6
Equation 2-7
Equation 2-8
Equation 2-9
The total force applied to the unsprung mass was calculated using equation 2-4. Summing all the
forces acting on the unsprung mass, the unsprung mass equation of motion could be created, as
seen in equation 2-10.
Equation 2-10

2.2 Passive Suspension Linear Model
For simplicity, the suspension systems were modeled as linear systems first, whereas in
real life, suspension systems are not perfectly linear. When modeling the system, the following
variables were used: sprung mass displacement, zs; sprung mass velocity, ; sprung mass
acceleration, ; unsprung mass displacement, ; unsprung mass velocity, ; unsprung mass
acceleration, ; and road displacement, . Among all the variables, the most important variable
was the sprung mass acceleration, , which indicates the amount of force the passenger
experiences. This is due to the equation 2-4, which states the acceleration of the sprung mass is
directly proportional to the force the passenger experiences. From the equations of motion of the
system, the state equations of the system could be derived, as seen in equation 2-11 and 2-12.
Equation 2-11
Equation 2-12
The Simulink block diagram of the system was then obtained from the state equations, as seen in
figure 2-4.

Figure 2-4 Simulink block diagram of Passive Suspension linear model
The output of the system was plotted onto three figures. The sprung mass displacement,
the unsprung mass displacement, and the road displacement were displayed on the first plot of
one figure. The sprung mass acceleration and the unsprung mass acceleration were displayed on
the second plot of the same figure. The tire vertical force was displayed on one figure, and the
suspension spring force was displayed on one figure.

2.3 Passive Suspension Nonlinear Model
The Passive Suspension linear model was modified to become a nonlinear model by
taking potential tire lift and suspension spring lift into consideration. Because in real life
situation, the tire and the suspension spring of a vehicle only provides upwards force to the
sprung mass. The tire lift and suspension spring lift were detected by introducing the “Tire Lift
Detection” block and the “Spring Lift Detection” block. The two blocks are MATLAB Function
blocks. The equations used in the “Tire Lift Detection” block and the “Spring Lift Detection”
block are shown in equation 15 and equation 16 respectively, where ds is the maximum tire
spring extension and dk is the maximum suspension spring extension.
otherwise
FFFF
dxx
Fbtktbtkt
sr
g
,00)(),(
)(,0 2
Equation 2-13
otherwise
dxxFF
kks
s ,0)(, 21 Equation 2-14
The Passive Suspension Nonlinear model is shown in figure 2-5.

Figure 2-5 Simulink block diagram of Passive Suspension nonlinear model
2.4 Full Active Suspension Model
The active suspension simulation was based on the passive suspension model. The equations of
motion were slightly modified by adding in a force term F:
Equation 2-15
Equation 2-16
To determine F at any moment, the relative displacement between the sprung mass and
the unsprung mass, the sprung mass acceleration, the relative displacement between the unsprung

mass and the road, and the unsprung mass acceleration were used as feedback signals. The
following equation was used:
Equation 2-17
A block called Full Active Suspension Controller was created in Simulink in addition to Passive
Suspension model. The Full Active Suspension nonlinear model is shown in figure 2-6.
Figure 2-6 Simulink block diagram of Full Active Suspension
The simulation result of Full Active Suspension model is outputted in the same way as Passive
Suspension model.

For comparison of results, a linear Full Active Suspension model was also constructed. The
linear system omits the “Tire Lift Detection” block and the “Spring Lift Detection” block. The
results of Full Active Suspension linear model and nonlinear model will be compared in Chapter
4.
2.5 Skyhook Active Suspension Model
Most of the effects of Full Active Suspension Model could be achieved using a simplified
model as following:
Equation 2-18
Figure 2-7 Simulink block diagram of Skyhook Active Suspension

This type of control method is called Skyhook damping because it only uses the sprung mass
velocity as a feedback signal. The simulation result of Skyhook Active Suspension model is
outputted in the same way as Passive Suspension model.

Chapter 3 Test Rig Preparation
The intent of this chapter is to document the preparation of the test rig including the
transportation, spill control, power installation, test rig fixture, components check, and pump
testing.
3.1 Transportation and Restoration
The suspension test rig was received from the Ford Motor Company in 2012, and its
shipping condition can be seen in Error! Reference source not found. and Error! Reference source
not found.. The test rig was initially transported to the Pennsylvania Transportation Institute‟s
test track. The actual testing of the study was planned to be conducted in room 109 in Research
Building B. Therefore, a plan to transport the system to Building B was made. This preparation
included measuring the physical size of the system to determine whether the system would fit
through the entrance of the building and the room.
Figure 3-1 Suspension test rig condition when received

Due to the fact that the test rig had been in storage for years, the condition of each
component on the test rig needed to be checked. Most importantly, the condition of the main
motor powering the hydraulic pump needed to be determined. To accomplish this, a visual
inspection of each component was conducted to ensure there was no obvious leak in hydraulic
lines, missing connectors, etc. While the visual inspection is conducted, a CAD model of the test
rig was created to help identify each component on the system and to help relocating and
repackaging the system, as seen in Figure 3-2 and Figure 3-3.
Figure 3-2 Pump unit CAD assembly view 1
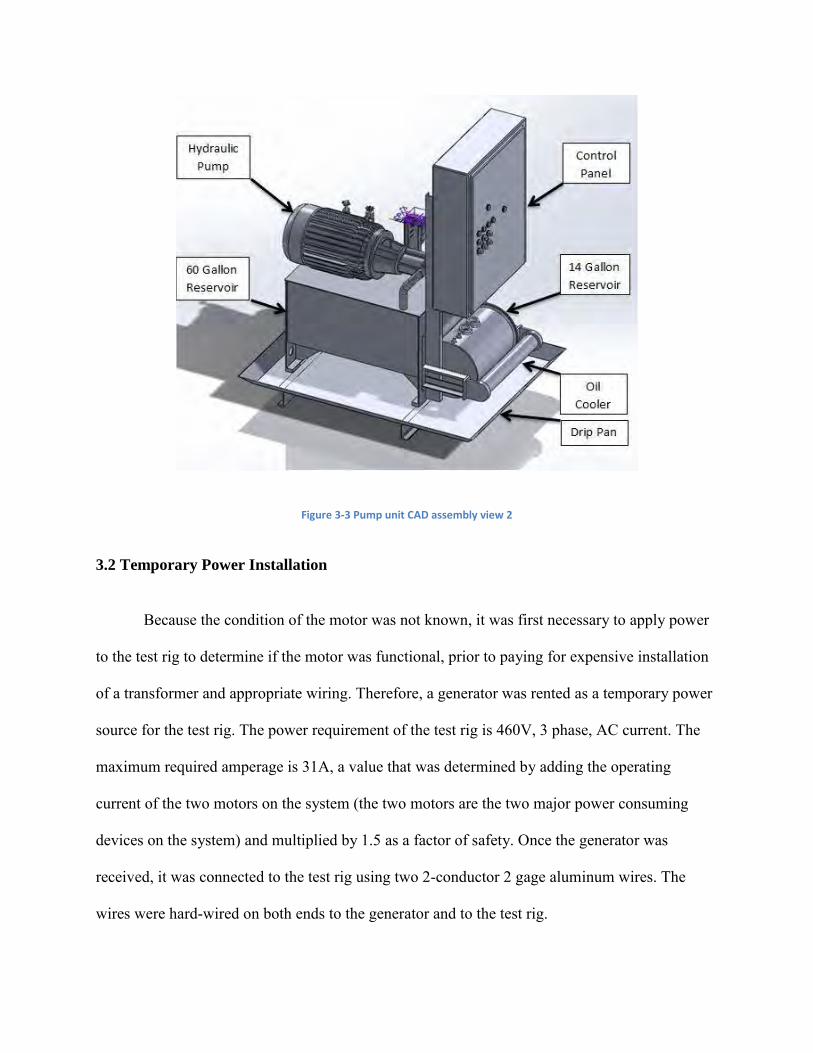
Figure 3-3 Pump unit CAD assembly view 2
3.2 Temporary Power Installation
Because the condition of the motor was not known, it was first necessary to apply power
to the test rig to determine if the motor was functional, prior to paying for expensive installation
of a transformer and appropriate wiring. Therefore, a generator was rented as a temporary power
source for the test rig. The power requirement of the test rig is 460V, 3 phase, AC current. The
maximum required amperage is 31A, a value that was determined by adding the operating
current of the two motors on the system (the two motors are the two major power consuming
devices on the system) and multiplied by 1.5 as a factor of safety. Once the generator was
received, it was connected to the test rig using two 2-conductor 2 gage aluminum wires. The
wires were hard-wired on both ends to the generator and to the test rig.

Figure 3-4 Rental generator
3.3 Hydraulic Fluid Spill Control
Hydraulic fluid is very damaging to the environment and water treatment facilities.
Therefore, when working with hydraulic systems such as this pump, extreme caution was used to
ensure there is no leakage of hydraulic fluid into the sewage system. Precaution was taken by
purchasing spill control devices from New Pig Corporation to control the hydraulic fluid in case
of a leak. . The items purchased include a 4” drain plug to prevent hydraulic fluid from entering
the sewage system, 40 PIG ORIGINAL Absorbent Socks capable of absorbing 64oz. of fluid
each to surround the test rig and the drain, and a box of PIG Extra-Duty Universal Mat Rolls
capable of absorbing up to 14gallons of hydraulic fluid. The total absorbing capacity from all the
spill control devices adds up to 34gallons. Despite the total amount of hydraulic oil (60gallon)
used in this study exceeds the total absorbing capacity from the spill control devices, by using a
combination of containment devices (absorbent socks) and absorbent devices (absorbent mats),

the fluid can be contained within the designated parameter. During the unlikely event in which
all the hydraulic fluid leaks out, the fluid will first be contained, then absorbed and transported to
containers by reusing cotton rags.
Figure 3-5 Spill control around an indoor drain
3.4 Pump Testing Schedule
The basic structure of the pump unit is illustrated in Figure 3-6. All of the hydraulic fluid
is stored in the 60gallon reservoir in the beginning. Once the system is turned on, the hydraulic
pump starts pumping fluid and pressurizes the hydraulic lines. The fluid passes through a filter,
then goes through the pressure relief valve, which automatically bleeds hydraulic fluid back into
the 60gallon reservoir if the fluid pressure rises above the preset pressure threshold. The
pressurized fluid then goes through the pressure reducing valve, which adjusts the fluid pressure
to the required testing pressure. The fluid then is sent to the test rig to power both the hydraulic
cylinders. The returning fluid is temporarily stored in a 14gallon reservoir. The fluid level in the
14gallon reservoir is controlled by two fluid level switches (one high level switch and one low

level switch). Once the fluid level exceeds the maximum allowed level, the high-level switch
engages the transfer pump to transport the fluid to the 60gallon reservoir until the fluid level falls
below the low level switch, which stops the transfer pump.
Figure 3-6 Pump unit component layout
The pump unit testing was conducted to ensure the proper functioning of all the
components on the pump unit. To test the pump unit, two steps were taken. Step 1 was to create
an open hydraulic circuit without any resistance in the loop. This was done by connecting the
pump unit‟s output directly to the return, as seen in Figure 3-7. Because there was no resistance
in the loop, no pressure was built up. Step 1 was used to determine the conditions of all the
switches, relays, and wiring of the pump, as well as that the pump works as expected. In step 2, a
plug was inserted into the outlet of the pump unit, stopping the flow of the hydraulic fluid, as
seen in Figure 3-8. This allows the hydraulic circuit to build up pressure. Once the pressure
exceeds the preset pressure threshold on the pressure relief valve, the pressure relief valve would

open, bleeding the hydraulic fluid back into the 60 gallon reservoir. Step 2 was used to test the
pumps capability to build up pressure in the hydraulic line and the performance of the pressure
relief valve. After step 2, it was certain that the pump was capable of pressurizing all the hoses
for the test rig.
Figure 3-7 Pump unit component layout for test step 1
During step 1 of the testing, the hydraulic pump did not start after the unit was turned on.
Minor wiring issues had to be solved before the pump turned on properly. Once the pump turned
on, it immediately started pumping fluid, filling up the 14 gallon reservoir in 5 seconds. After
step 1 was successfully completed, step 2 was conducted. Once the pump was turned on, the
reading on the pressure gage slowly rose to 2,000psi. Varying the pressure threshold of the
pressure relief valve by adjusting the pressure-set knob, different pressure readings were
received indicating a functioning hydraulic pump and a functioning pressure relief valve.

Figure 3-8 Pump unit component layout for test step 2

Chapter 4 Simulation Predictions
Using the Simulink block diagrams created in chapter 2, the simulations of the
suspension systems were conducted. A step force input was used as road disturbance to all
systems. The results of the Passive Suspension linear model and Passive Suspension nonlinear
model are shown and compared first. They are then compared to the results of the Full Active
Suspension model and Skyhook Active Suspension model.
The vehicle parameters used in the simulations were extracted from appendix C of John
Dixon‟s Tires, Suspension, and Handling [1], and are representative of a typical sedan. The
parameters used include vehicle‟s sprung and unsprung mass and spring and damping constants
of the suspension and the tire. Different feedback gain values of the Full Active Suspension
Model and the Skyhook Active Suspension Model were used to study their impact to the vehicle
behavior. The results were output in terms of road, sprung, and unsprung mass displacements,
sprung and unsprung mass accelerations, tire vertical force, and spring force.
To compare the impact to vehicle behavior from different suspension models and
different suspension parameters, all simulations were run in a standardized fashion so that
variables can be easily controlled. The inputs to all simulations include 2 step inputs to simulate
road irregularities. Step 1 happens at 1 second in the upward direction and step 2 happens at 25
seconds in the downward direction. The simulations were run for 50 seconds. The step sizes
were varied in different runs to simulate differently sized road irregularities.
4.1 Passive Suspension Linear Model vs. Nonlinear Model
The Passive Suspension linear model and nonlinear model were compared to determine
the necessity of the nonlinear model. This was done by comparing the tire vertical force with the
ground and the suspension spring force of the two models at maximum road input, which is at
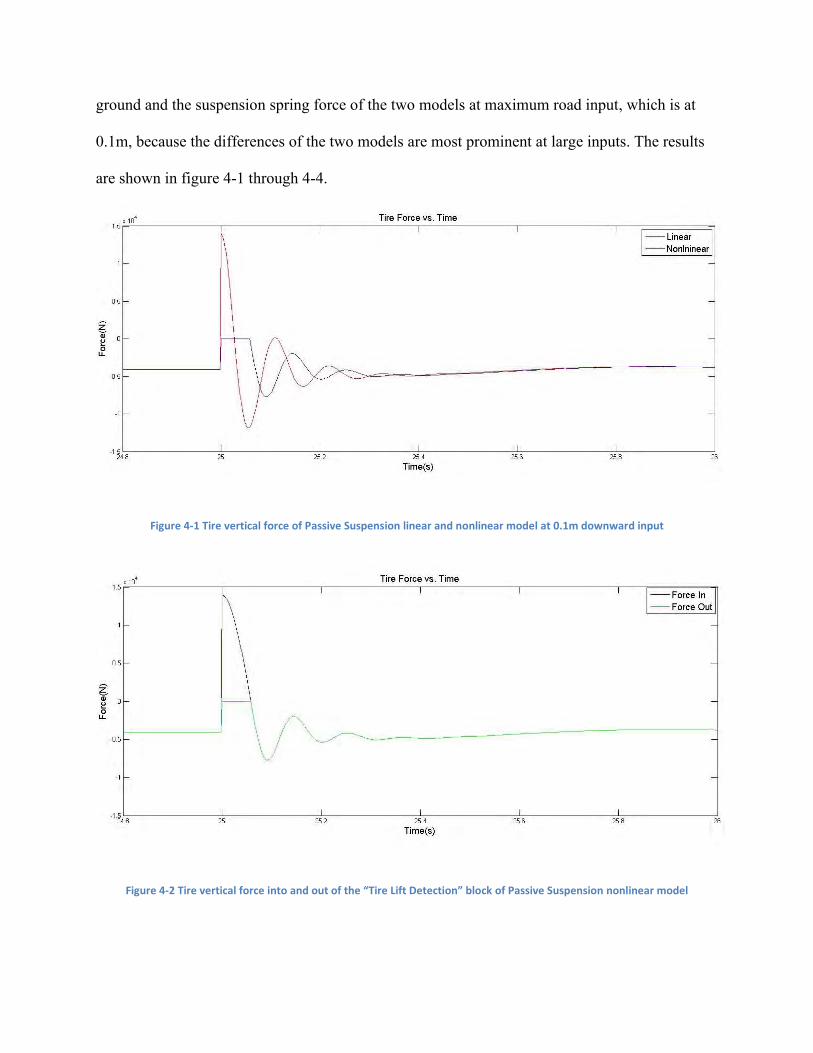
0.1m, because the differences of the two models are most prominent at large inputs. The results
are shown in figure 4-1 through 4-4.
Figure 4-1 Tire vertical force of Passive Suspension linear and nonlinear model at 0.1m downward input
Figure 4-2 Tire vertical force into and out of the “Tire Lift Detection” block of Passive Suspension nonlinear model

From figure 4-1, it is observed that as the road descends rapidly, the tire vertical force of
the Passive Suspension linear model crosses over to the positive value (which means the force
from the tire to the ground is upwards instead of pushing downwards towards the ground), which
defies the physical model as the ground cannot “pull” the tire toward it. In figure 4-2 however,
the problem was solved by the “Tire Lift Detection” block by setting the tire vertical force to 0 as
soon as tire lift was detected. As a result, the outcome of the two simulations was different. The
maximum tire vertical force seen in the nonlinear case of figure 2 was smaller than the linear
case shown in figure 1.
Figure 4-3 Spring force of Passive Suspension linear and nonlinear model at 0.1m downward input

Figure 4-4 Tire vertical force into and out of the “Spring Lift Detection” block of Passive Suspension nonlinear model
From figure 4-3 it was observed that the spring force of Passive Suspension linear model
and nonlinear model are affected by the differences in the tire vertical force (with vs. without
“Tire Lift Detection”). However, the “Spring Lift Detection” did not act during the simulation, as
can be observed from the identical Spring Input and Spring Output lines in figure 4-4, because
the road input for the study was not large enough to cause the spring to lift.
Furthermore, observing the sprung mass acceleration curves (see figure 4-5), there is a
significant difference in the acceleration of the sprung mass between Passive Suspension linear
and nonlinear models. Since the main interest of this study is passenger comfort, the inaccuracy
in the linear model cannot be overlooked.

Figure 4-5 Sprung mass acceleration of Passive Suspension linear and nonlinear model at 0.1m downward input
4.2 Full Active Linear Model vs. Full Active Nonlinear Model
Similar to section 4.1, the Full Active linear model was compared to the Full Active
nonlinear model. The tire vertical force, spring force, and sprung mass acceleration were
compared. In figure 4-6, it is observed that the Full Active linear model also suffers the same
shortcoming as the Passive Suspension linear model: the tire vertical force crosses 0 to a positive
value, which defies the physical model, hence affecting the accuracy of the model. The problem
does not exist in figure 4-7 because of the “Tire Lift Detection” block. The „opposite‟ force was
eliminated therefore producing a more accurate result.

Figure 4-6 Tire vertical force of Full Active Suspension linear and nonlinear model at 0.1m downward input
Figure 4-7 Tire vertical force into and out of the “Tire Lift Detection” block of Passive Suspension nonlinear model
Comparing the spring force in figures 4-8 and 4-9, a similar conclusion can be drawn as
in section 4.1. The spring forces were affected by the difference in tire vertical forces, as seen in
figure 4-8. In figure 4-9, the spring force into the “Spring Lift Detection” block perfectly traces

the force out of the block, which means the “Spring Lift Detection” was never activated during
the simulation.
Figure 4-8 Spring force of Full Active Suspension linear and nonlinear model at 0.1m downward input
Figure 4-9 Spring force into and out of the “Spring Lift Detection” block of Passive Suspension nonlinear model
Finally, comparing the sprung mass acceleration, as seen in figure 4-10, it was clear that
the linear model behaves differently compared to the nonlinear model. Therefore, it is necessary

to use the nonlinear model for Full Active suspension model simulation in order to receive
accurate results.
Figure 4-10 Sprung mass acceleration of Full Active Suspension linear and nonlinear model at 0.1m downward input
4.3 Full Active Model at Varying Road Input
The Full Active model was simulated with varying road input to evaluate the
effectiveness of active suspension on changing the suspension behavior. The simulation was run
with 0.1m, 0.07m, 0.04m, and 0.01m downward inputs. The effectiveness was evaluated by
comparing the sprung mass accelerations, as these accelerations directly correlate to the forces
felt by the passenger.
As seen in figure 4-11, as the road input decreases, the Full Active model experiences
smaller sprung mass acceleration, as expected. The Full Active model works similarly well for
both large and small inputs. The model also has similar settling time for large and small inputs,
but this is primarily because the tire dynamics govern the suspension damping over long
intervals, and these dynamics are not affected by the suspension setup.

Figure 4-11 Sprung mass acceleration of Full Active Suspension model at 0.1m, 0.07m, 0.04m, and 0.01m downward input
4.4 Passive Nonlinear Model vs. Skyhook Active Model
Passive nonlinear model was compared to Skyhook Active model to find out the benefits
of active suspensions in terms of passenger comfort. The vehicle‟s sprung mass displacement
and acceleration were used to evaluate the benefits. As seen in figure 4-12, Skyhook Active
model effectively reduced sprung mass acceleration. The Passive nonlinear model had a
maximum sprung mass acceleration of 9.721m/s2. Skyhook Active model had a maximum
sprung mass acceleration of 6.86m/s2. Therefore, the Skyhook Active model provides better
passenger comfort.

Figure 4-12 Sprung mass acceleration of Passive Suspension and Skyhook Active Suspension model at 0.1m downward input
Comparing the sprung mass displacement between the two models, as seen in figure 4-15
and 4-16, the two models have roughly the same settling time. However, the Skyhook Active
model has a smooth path as the system settles, whereas the Passive nonlinear model oscillates as
it settles.
Figure 4-13 Sprung mass displacement of Passive Suspension and Skyhook Active Suspension model at 0.1m downward input

4.5 Trade-off between Handling and Comfort
In active suspension design, there has always been a trade-off between handling and
comfort [1]. This can be shown in a comparison between Skyhook Active models with different
feedback gain values. The effect on handling can be interpreted through tire vertical force
consistency, because tire vertical force determines the tire‟s maximum lateral and longitudinal
grip.
As seen in figure 4-14, the sprung mass acceleration decreases and the Skyhook Active
feedback gain, kb, increased in the negative direction, which indicates the vehicle was more and
more comfortable with increased usage of active suspension.
Figure 4-14 Sprung mass acceleration of Skyhook Active Suspension model at kb=-15000, kb=-7000, kb=-4000, and kb=-1000
As seen in figure 4-15, as the feedback gain value kb was increased, the Skyhook Active
suspension controller interferes more and more with the consistency in the tire/ground contact
forces. The result is increasingly comfortable rides, but with decreasing tire-road contact on
severe bumps, which of course will lead to poorer handling.

Figure 4-15 Tire Vertical Force of Skyhook Active Suspension model at kb=-15000, kb=-7000, kb=-4000, and kb=-1000
1. Savaresi, Sergio M., et al., et al. Semi-Active Suspension Control Design for Vehicles. MA, USA :
Elsevier Ltd., 2011.

Chapter 5 Experimental Testing
This chapter provides details of the pump unit testing for the physical suspension test rig.
Because the test rig has been modified for previous use, much wiring was different from the
original wiring diagram. Therefore several wiring issues had to be solved prior to the testing.
Using the wiring diagram of the test rig, the issues were corrected fairly easily. Using method 1
explained in previous chapters, the pump turned on as expected and immediately started
pumping hydraulic fluid. Because the transfer pump was not turned on during the testing, a small
amount of overflow of hydraulic fluid out of the 14 gallon reservoir was experienced. The
problem was solved by temporarily hardwiring the transfer pump to move the fluid from the 14
gallon reservoir to the 60 gallon reservoir, to drain the catch reservoir into the main reservoir.
Method 1 proved the wiring and control mechanism of the pump unit were functional.
After successfully conducted testing using method 1, method 2 was conducted. A plug
was purchased and installed to the system to block off the output side of the pump unit. The
system successfully built up pressure up to 2,000 psi. This means the pump is fully functional in
generating pressure for the test rig. The pressure limit of the pressure relief valve was varied and
different pressure readings were received, which indicated that the pressure relief valve was also
fully functional.
Once the functionality of the pump was confirmed, the test stand was confirmed to be
usable – at least from the hydraulic inputs. The remainder of the suspension setup – to test the
output of the active suspension – requires a permanent equipment install. At the time of this
writing, this install into a permanent location with permanent wiring is still ongoing.
Coordination with the Office of the Physical Plant at Penn State has been quite slow.

Chapter 6 Conclusion and Future Work
The simulation of the passive and active suspension systems was conducted to compare
different aspects of linear versus nonlinear suspensions. The simulation proved that nonlinear
models with “Tire Lift Detection” function are essential for both passive and active suspensions
in order to generate accurate results, therefore, should be used for future simulations. The
effectiveness of an active suspension was tested by conducting simulations using Full Active
suspension model for varying road inputs. The model behaved consistently in reducing sprung
mass acceleration for different inputs. The improvement in comfort of an active suspension was
evaluated by comparing the sprung mass acceleration of Passive model to Skyhook Active model
at the same input. The result showed that active suspensions do effectively reduce sprung mass
acceleration. However, the simulations also showed that a trade-off between handling and
comfort is present. This was shown in simulation by analyzing the tire vertical force to the
ground at different feedback gain values. It was clear that the larger the gain, the more
comfortable the ride, but with less consistency in tire vertical force and thus worse handling.
The pump unit testing was successfully completed, allowing full install of the suspension
rig to proceed. All the major components on the pump unit proved to be functional, with minor
wiring and leakage issues needing to be resolved for this thesis. All the test rig operational items
including spill control devices and hydraulic fluid disposal procedures were securely stored and
clearly documented. The next step to proceed in the study is to prepare the testing section of the
test rig by gathering all missing items on the section including signal processing devices,
accelerometers, etc. This of course requires permanent install of the equipment, a process which
is still ongoing.

The ultimate goal of the study is to study how active suspension systems using V2V and
V2I communication improve ride comfort. More advanced models of active suspension systems
will be built to integrate this information, and the active suspension test rig will be used for
validating these simulation results.


![Power Distribution Control Coordinating Ultracapacitors ...mne.psu.edu/ToBoldlyGo/Publications/Conferences/... · in electric vehicle applications [5] ... Power Distribution Control](https://img.dokumen.tips/doc/110x75/5b3fc9897f8b9a51528c71a6/power-distribution-control-coordinating-ultracapacitors-mnepsuedutoboldlygopublicationsconferences.jpg)