Embed Size (px)
Citation preview

About this report
Welcome to the Department of Education, Training and Employment (DETE) Annual Report 2012–13. The annual report is an integral part of the department's corporate governance framework, describing our achievements, outlook and financial position for the year. The annual report also plays an important role in fulfilling the department's commitment to accountability and transparency.
The annual report is based on the Department of Education, Training and Employment Strategic Plan 2012–16, which outlines the department's key objectives and key performance indicators. The strategies for achieving our objectives, as outlined in the strategic plan, are highlighted throughout the document. The strategic plan's key performance indicators are identified throughout the annual report with this symbol KPI . The department’s strategic plan is available online at www.dete.qld.gov.au/publications/strategic.
The annual report provides comprehensive information about the department's financial position for the 2012–13 financial year. It also provides information about our:
performance against objectives organisation, people management and corporate governance processes future direction.
The annual report contains compliance information as stipulated in the Annual report requirements for Queensland Government agencies — Requirements for the 2012–13 reporting period. In accordance with these reporting requirements, the following additional information is available on the department’s annual report website and the Queensland Government Open Data website at www.qld.gov.au/data:
consultancies overseas travel Queensland multicultural policy — Queensland Multicultural Action Plan 2011–14.
In accordance with the requirement for agencies to contain production costs, the print run of the Department of Education, Training and Employment Annual Report 2012–13 as tabled in the Queensland Legislative Assembly, has been limited to 12 copies. This report can be downloaded and printed in full from www.dete.qld.gov.au/publications/annual-reports/12-13/index.html.
Providing feedback – our contact details
We continually strive to meet best-practice reporting standards and value the views of our readers. We invite you to provide feedback on this report by email to [email protected], by contacting Governance, Strategy and Planning, PO Box 15033, City East Qld 4002 or online at www.qld.gov.au/annualreportfeedback.
Interpreter services
The Queensland Government is committed to providing accessible services to Queenslanders from all culturally and linguistically diverse backgrounds. If you require assistance to understand the annual report, you can contact the Australian Government’s Translating and Interpreting Service on telephone 131 450 to arrange an interpreter to effectively communicate the report to you. Further information about interpreter services can be found at www.datsima.qld.gov.au/multicultural/resources/translating-and-interpreting-services/interpreter-services.
Department of Education, Training and Employment | Annual Report 2012–13 1

Strategic Plan 2012–16
Our visionEducation Training Employment – Brighter Futures
Our purposeTo provide Queenslanders with the knowledge, skills and confidence to maximise their potential and contribute productively to the economy.
Our values
Trust and respect
We trust and respect each other and value our diversity.
Productive relationships
We foster productive partnerships with families, community and industry and collaborative relationships in our schools, TAFEs and workplaces.
Excellence and equity
We provide positive client experiences and have high expectations of our people, and for all children and students.
Leadership and accountability
We promote innovation and leadership, efficiency and effectiveness and are focussed on achieving our objectives.
Health, safety and sustainability
We promote health and wellbeing by creating safe and sustainable work and learning environments.
Department of Education, Training and Employment | Annual Report 2012–13 2

Office of the Director-GeneralFloor 22 Education House30 Mary Street Brisbane 4000PO Box 15033 City EastQueensland 4002 AustraliaTelephone +61 3237 0900Facsimile +61 3237 1369Website www.dete.qld.gov.auABN 76 337 613 647
Letter to the Minister
4 September 2013
The Honourable John-Paul Langbroek MP Minister for Education, Training and Employment PO Box 15033 CITY EAST QLD 4002
Dear Minister
I am pleased to present the Annual Report 2012–13 for the Department of Education, Training and Employment. This report reflects the structure, operations and performance of the department as at 30 June 2013.
I certify that this annual report complies with:
the prescribed requirements of the Financial Accountability Act 2009 and the Financial and Performance Management Standard 2009
the detailed requirements set out in the Annual report requirements for Queensland Government agencies — Requirements for the 2012–13 reporting period.
A checklist outlining the annual reporting requirements can be accessed at www.dete.qld.gov.au/publications/annual-reports/12-13/index.html.
Yours sincerely
Dr Jim WatterstonDirector-General
Department of Education, Training and Employment | Annual Report 2012–13 3

Table of contents
Director-General’s overview________________________________________________8About DETE____________________________________________________________10
Agency role and main functions________________________________________________________10Early childhood education and care_____________________________________________________10School education___________________________________________________________________10Training, tertiary education and employment______________________________________________10
Supporting government objectives_____________________________________________________10Whole-of-government projects_________________________________________________________10Our priorities________________________________________________________________________11Our legislation_______________________________________________________________________11Our locations________________________________________________________________________11Organisational structure______________________________________________________________12Governance_________________________________________________________________________13
Corporate governance_______________________________________________________________13Governance committees_____________________________________________________________13
Statutory bodies and entities__________________________________________________________14Our stakeholders____________________________________________________________________14Our critical issues____________________________________________________________________15Future directions____________________________________________________________________15
Great teachers = Great results_________________________________________________________15Great skills. Real opportunities.________________________________________________________16
Chief Finance Officer’s report_____________________________________________17Our income – where the funds come from________________________________________________18Our expenses – how the funds are spent_________________________________________________19Our assets – what we own_____________________________________________________________20Our liabilities – what we owe___________________________________________________________20Comparison of actual financial results with budget________________________________________21
Early childhood education and care________________________________________23Key performance indicators___________________________________________________________23Service standards____________________________________________________________________23Early childhood education and care_____________________________________________________23Integration of early years services______________________________________________________24Children and family centres____________________________________________________________24Universal access to kindergarten programs______________________________________________24
Bilateral agreement targets___________________________________________________________25Responding to diverse needs__________________________________________________________25Pre-Prep – Aboriginal and Torres Strait Islander communities________________________________26
School readiness and transitions_______________________________________________________26Queensland Kindergarten Learning Guideline_____________________________________________26
Quality standards____________________________________________________________________26Early childhood workforce____________________________________________________________26
Sector, parent and community partnerships______________________________________________27School education________________________________________________________28
Key performance indicators___________________________________________________________28Service standards____________________________________________________________________28School curriculum___________________________________________________________________30
Australian Curriculum________________________________________________________________30Queensland curriculum______________________________________________________________30P–12 curriculum, assessment and reporting framework_____________________________________30
Core learning priorities_______________________________________________________________31NAPLAN__________________________________________________________________________31NAPLAN outcomes_________________________________________________________________31Upper two bands___________________________________________________________________31National Minimum Standard___________________________________________________________31Mean scale scores__________________________________________________________________31Aboriginal and Torres Strait Islander student performance___________________________________34International assessment_____________________________________________________________38Student attendance_________________________________________________________________38
Department of Education, Training and Employment | Annual Report 2012–13 4

Indigenous student school attendance___________________________________________________39State school education_______________________________________________________________39Senior schooling_____________________________________________________________________39
Youth transitions and attainment_______________________________________________________39School education: Years 10–12________________________________________________________39Indigenous participation at school______________________________________________________40School-based apprenticeships and traineeships___________________________________________41Indigenous school-based apprenticeships and traineeships__________________________________43Queensland Certificate of Education____________________________________________________44Queensland Certificate of Individual Achievement__________________________________________44Year 12 outcomes__________________________________________________________________44Queensland Year 12 destinations______________________________________________________45Indigenous student destinations________________________________________________________45
Teaching practice____________________________________________________________________46Year 7 to secondary_________________________________________________________________46Teaching and Learning Audits_________________________________________________________46Science Spark_____________________________________________________________________46
Student support_____________________________________________________________________46Inclusive education__________________________________________________________________46Students with disability_______________________________________________________________47Low SES communities_______________________________________________________________47Youth Support Coordinator Initiative____________________________________________________48Young carers______________________________________________________________________48Students in out-of-home care__________________________________________________________48Support for students from EAL/D backgrounds____________________________________________48Isolated students (distance education)___________________________________________________49Youth in detention centres____________________________________________________________49Home education____________________________________________________________________49
Positive schools and students_________________________________________________________49Improving the educational environment and student wellbeing________________________________51
Principal leadership and school capability_______________________________________________52Principals’ Capability and Leadership Framework__________________________________________52
Strong futures for Aboriginal and Torres Strait Islander students____________________________52Aboriginal and Torres Strait Islander Education Action Plan__________________________________52Closing the Gap Education Grants______________________________________________________53Embedding Aboriginal and Torres Strait Islander Perspectives________________________________53Cape York Aboriginal Australian Academy_______________________________________________53Transition Support Service____________________________________________________________53Deadly Ears Action Plan 2012–13______________________________________________________53
School, parent and community partnerships_____________________________________________54Parent and community engagement____________________________________________________54Working with the non-state education sector______________________________________________54Non-state education students__________________________________________________________54
Training, tertiary education and employment_________________________________55Key performance indicators___________________________________________________________55Service standards____________________________________________________________________55Training and tertiary reform____________________________________________________________56Improved outcomes__________________________________________________________________57
VET graduate results________________________________________________________________58User Choice program________________________________________________________________59Recognition of prior learning__________________________________________________________59VET professional learning____________________________________________________________60Apprentice retention and completion____________________________________________________60
Indigenous training and skilling________________________________________________________60Indigenous participation in vocational education and training_________________________________60Indigenous participation in apprenticeships and traineeships_________________________________61
Indigenous training support initiatives__________________________________________________62Cape York Employment and Training Strategy____________________________________________63Indigenous Funding Pool_____________________________________________________________63Regional and Remote Indigenous training initiatives________________________________________63
Public provider______________________________________________________________________63TAFE Queensland__________________________________________________________________63Maintaining a quality VET system______________________________________________________63
Department of Education, Training and Employment | Annual Report 2012–13 5

Satisfaction with VET services_________________________________________________________64Employer, business and industry partnerships___________________________________________64
Skills Queensland___________________________________________________________________64Higher education____________________________________________________________________64
Quality accessible higher education_____________________________________________________64Employment transitions_______________________________________________________________65
Skills Recognition___________________________________________________________________65Skilled and Business Migration________________________________________________________65Black Business Finder_______________________________________________________________65Training and employment research_____________________________________________________65
Coordinated responses_______________________________________________________________66Government and Industry Skilling Response to ex-Tropical Cyclone Oswald_____________________66
Industry and community partnerships___________________________________________________66Influencing Australian Government employment services____________________________________66
Corporate services______________________________________________________67Key performance indicators___________________________________________________________67Corporate Services Renewal program___________________________________________________67Workforce__________________________________________________________________________67
Workforce Strategic Plan 2011–14______________________________________________________67Workforce strategies________________________________________________________________67Our people________________________________________________________________________67
Human resource management_________________________________________________________69Attracting new employees____________________________________________________________69Employee induction_________________________________________________________________70Developing our leaders______________________________________________________________70Improving teacher quality_____________________________________________________________70Restart Teaching___________________________________________________________________71Workforce diversity__________________________________________________________________71Recognising our staff and students_____________________________________________________71Organisational health________________________________________________________________71Reducing unscheduled leave__________________________________________________________72Code of Conduct and public sector ethics________________________________________________72Better workplace relations____________________________________________________________73Early retirement, redundancy, retrenchment and voluntary separation__________________________73
Information and communication technologies____________________________________________73Information and Knowledge Strategic Plan 2012–16________________________________________73The Learning Place_________________________________________________________________74Computers for Teachers______________________________________________________________74OneSchool________________________________________________________________________74Websites for Schools________________________________________________________________74Cyber-safety_______________________________________________________________________75Service Centre Online_______________________________________________________________75eLearning for special needs___________________________________________________________75Rapid Response Unit________________________________________________________________75Upgrading TAFE ICT capabilities_______________________________________________________75Stakeholder satisfaction with ICT resources______________________________________________75
Performance enhancement____________________________________________________________76Risk management and business continuity_______________________________________________76Research and evaluation_____________________________________________________________76Internal Audit______________________________________________________________________76External scrutiny____________________________________________________________________77Public interest disclosure_____________________________________________________________77Information systems and recordkeeping_________________________________________________77Recordkeeping training and awareness__________________________________________________77
Infrastructure_______________________________________________________________________78Our infrastructure___________________________________________________________________78Queensland Schools Public Private Partnership Project_____________________________________78South East Queensland Schools Public Private Partnership Project____________________________78Asset maintenance__________________________________________________________________79Early childhood education centres and school facilities______________________________________79TAFE facilities______________________________________________________________________79Managing asbestos-containing material in DETE facilities____________________________________79Staff accommodation________________________________________________________________79
Department of Education, Training and Employment | Annual Report 2012–13 6

Partnerships________________________________________________________________________80International engagement_____________________________________________________________80Professional visit programs___________________________________________________________80Overseas travel____________________________________________________________________80
Executive Management Group members____________________________________81Governance committees__________________________________________________84Statutory bodies and other entities_________________________________________88External scrutiny________________________________________________________94
Queensland Audit Office reports to Parliament____________________________________________94External reviews_____________________________________________________________________95
Evaluation of Skilling Queenslanders for Work____________________________________________95Queensland Commission of Audit______________________________________________________95
Glossary_______________________________________________________________96Acronyms and abbreviations_____________________________________________100Financial statements 2012–13____________________________________________103
Department of Education, Training and Employment | Annual Report 2012–13 7
Director-General’s overview
I am pleased to present the 2012–13 annual report for the Department of Education, Training and Employment. This is my first annual report, having commenced as Director-General in April 2013.
Having been with the department for less than a quarter of the year, I must first acknowledge the dedication and leadership of my predecessor, Ms Julie Grantham. Under Julie’s stewardship of the department, many great things were achieved, as outlined in this and previous annual reports. Strong foundations are clearly in place. I would also like to thank Ms Annette Whitehead for acting in the role of Director-General prior to my appointment, and ensuring my smooth transition into the role.
Since taking up the position of Director-General, I have travelled widely across Queensland, listening and learning as I visited workplaces across the state. I have seen firsthand the resilience of local communities that were affected by the severe weather events resulting from ex-tropical cyclone Oswald, and I am impressed by the dedication and energy of our
people. I’ve seen strong evidence of our people enacting our organisational values.
In this report, you will read about our many achievements during 2012–13. Some highlights include: eKindy. Queensland children are the first in Australia to enjoy the benefits of a Government-
approved kindergarten program taught online through distance education. More than 150 children are enrolled in eKindy in 2013 after the pilot program received positive feedback from families in 2012.
Great teachers = Great results. This action plan for Queensland schools aims to improve teacher quality and give young Queenslanders the best possible start in life. Great teachers = Great results outlines 15 actions to deliver a quality education for all Queensland children, and to support literacy and numeracy in the early years and strengthen discipline powers for schools.
School autonomy. The first 26 Independent Public Schools commenced from the beginning of the 2013 school year. From 2014, a further 34 schools will join this popular initiative, with up to 120 schools becoming Independent Public Schools over the next four years.
School infrastructure. The Schools Planning Commission commenced in 2012, and the Advancing our School Maintenance Fund was launched, in addition to the Fixing our Schools Fund established for 2014–15.
Solid partners Solid futures. This four-year plan will support young Aboriginal and Torres Strait Islander people to have the confidence, skills and knowledge to make a valuable contribution to the wellbeing of their families, communities and to all Queensland.
Great skills. Real opportunities. This five-year action plan for Queensland’s Vocational Education and Training (VET) sector outlines reforms that will establish a genuine partnership with industry, open a contestable training market, reform the apprenticeship system and create a stronger TAFE Queensland. New legislation was also introduced into Parliament in 2012–13 to establish TAFE Queensland as an independent statutory body on 1 July 2013.
Initiatives like these will ensure that the early childhood, education and training sectors in Queensland continue to meet the needs of Queensland families and employers now and into the future. This is reflected in our new vision: Engaging minds. Empowering futures. Engaging the minds and empowering the futures of our students are a critical focus of our work as we support Queenslanders’ education and training needs and help people achieve their life aspirations.
It is equally as important for us as an organisation. We must demonstrate our values of customer focus, innovation, accountability, high performance, and our people, every day by continually questioning and seeking to improve our service delivery.
The Public Sector Renewal Program, launched in 2012 has provided the scaffolding for us to review our work to identify initiatives that will transform our services. Many of the highlights that I listed earlier are part of our significant renewal agenda.
While we have achieved a great deal during 2012–13, there is much work ahead of us. Moving forward, our focus will be on delivering better, more cost-effective services for Queensland, with a focus on:
Department of Education, Training and Employment | Annual Report 2012–13 8

autonomy to make sure that decisions are made by the right people, in the right place, at the right time; that we are accountable for those decisions; and that we deliver great education and training through great teachers and high-quality leadership across the department.
I look forward to the challenge of leading the department as we continue to develop and deliver world-class education and training that match the needs of Queenslanders, the labour market, and the state's economic priorities.
Dr Jim WatterstonDirector-General
Department of Education, Training and Employment | Annual Report 2012–13 9

Chapter 1
About DETEAgency role and main functions The department engages Queenslanders in lifelong learning across the entire continuum, from early childhood education and care, through school education, and into training, tertiary education, and employment.
DETE is one of the largest and most diverse organisations in Australia. DETE provides services through three broad service delivery areas:
early childhood education and care (ECEC) school education training, tertiary education and employment.
Early childhood education and care
Providing children with access to quality early childhood education and care through establishing and funding kindergarten and integrated early years services as well as a range of parent and family support programs, and regulating, approving and quality assessing education and care services.
School education
Delivering Prep to Year 12 in Queensland state schools to prepare young people for successful transitions into further education, training and/or work, and administering funding for Queensland non-state schools.
Training, tertiary education and employment
Supporting the skilling needs of Queensland through the funding, delivery and quality assurance of VET, and providing information, advice and support to higher education providers, employers, apprentices and trainees to improve workforce participation.
Supporting government objectivesThe department’s Strategic Plan 2012–16 reflects the department's contribution to the Government’s five policy objectives to:
grow a four-pillar economy based on tourism, agriculture, resources and construction by investing in Queenslanders’ skills and employment initiatives in these areas
lower the cost of living for families by cutting waste and reducing red tape deliver better infrastructure and better planning for kindies, schools and TAFEs revitalise frontline services for education, training and employment restore accountability in government.
These objectives are underpinned by the Government’s target to reduce unemployment in Queensland to four per cent within six years.
Whole-of-government projectsThe department is contributing to various whole-of-government projects to achieve the Government’s goal of transforming the Queensland Public Sector into the most responsive and respected public sector in the nation. These include implementation of the recommendations of the independent Commission of Audit, Corporate Services Renewal, the Open Data Revolution, and the Red Tape Reduction Program. During 2012–13, DETE critically examined its services and service delivery to ensure that future delivery models will deliver the best possible outcomes for clients as efficiently as possible. This work will continue in 2013–14.
Department of Education, Training and Employment | Annual Report 2012–13 10

Our priorities This annual report is based on the Strategic Plan 2012–16, which focused on the following priority areas:
strong educational foundations skills for the economy a capable, agile and sustainable organisation.
During 2012–13, the department released the following major policy initiatives: Great teachers = Great results five-year action plan to lift standards of teaching so our next
generation can learn from our best and brightest, and provide more schools with greater autonomy so they can get on with the job and make decisions that best suit their local communities.
Great skills. Real opportunities. action plan to reform Queensland’s further education and training sector to support Queenslanders to access and complete the skills training they need to get a job.
Solid partners Solid futures. four-year plan to provide Aboriginal and Torres Strait Islander children and young people with the support they need to enjoy and achieve success throughout their educational journey, from early childhood through to employment.
Our legislationDETE’s functions and powers are derived from administering the Acts of Parliament in accordance with Administrative Arrangements Order (No. 1) 2013.
Table 1: Administrative Arrangements Order (No. 1) 2013Principle ministerial responsibilities Acts administered
Minister for Education, Training and Employment
Early Childhood Education and Care including— Kindergarten Programs
Education including— Aboriginal and Torres Strait Islander Education Distance Education Education of Students in Youth Detention
Centres International Education Primary Education Secondary Education Special Education
Employment Policies and Programs Higher Education including—
State Government Policy and Planning International Vocational Education and Training Non-State School Funding Registration of Teachers Smart State Education Initiatives Vocational Education and Training including
Technical and Further Education
Australian Catholic University (Queensland) Act 2007Bond University Act 1987Central Queensland University Act 1998Child Care Act 2002Community Services Act 2007 (jointly administered with the Minister for Communities, Child Safety and Disability Services and the Minister for Aboriginal and Torres Strait Islander and Multicultural Affairs and Minister Assisting the Premier)Education (Accreditation of Non-State Schools) Act 2001Education and Care Services National Law (Queensland) Act 2011Education (Capital Assistance) Act 1993Education (General Provisions) Act 2006Education (Overseas Students) Act 1996Education (Queensland College of Teachers) Act 2005Education (Queensland Studies Authority) Act 2002Education (Work Experience) Act 1996Grammar Schools Act 1975Griffith University Act 1998Higher Education (General Provisions) Act 2008James Cook University Act 1997Queensland University of Technology Act 1998TAFE Queensland Act 2013University of Queensland Act 1998University of Southern Queensland Act 1998University of the Sunshine Coast Act 1998Vocational Education and Training (Commonwealth Powers) Act 2012Vocational Education, Training and Employment Act 2000
Skills and Workforce Development (Administrative Unit — Skills Queensland)Source: Department of the Premier and Cabinet
Our locationsOur early childhood education, school education and training services are integrated at a regional level. This integration enables cohesive service delivery, strengthens links between sectors and ensures decisions are made closer to our clients. Information regarding the location of Queensland state schools, regional offices and TAFE campuses in the seven regional boundaries can be found online at www.education.qld.gov.au/schools/maps/.
Department of Education, Training and Employment | Annual Report 2012–13 11

Organisational structureFigure 1: Department of Education, Training and Employment organisational structure (as at 30 June 2013)
Source: Department of Education, Training and Employment
Notes:* Indicates Executive Management Group Member.** Deputy Director-General, Education Queensland supervises regional service delivery, with Regional Directors also having functional
reporting responsibility to the other Executive Management Group Members.
Department of Education, Training and Employment | Annual Report 2012–13 12

Governance
Strategy: Promote accountability through good governance and robust business practices
Corporate governance
The department’s corporate governance framework sets out the standards of accountability and transparency expected of government by our many stakeholders and the people of Queensland. The overall aim of the framework is to drive performance improvement while meeting our obligations and legislative requirements. It outlines the principles, elements and mechanisms to drive and support effective governance through strong leadership, responsible and ethical decision-making, management and accountability, and performance improvement. The DETE Corporate Governance Framework 2013–17 is available online at www.dete.qld.gov.au/corporate/governance.
Governance committees
The department has established a number of governance committees to advise and support the Director-General in discharging responsibilities. The Executive Management Group (EMG) provides executive leadership to support the Director-General to meet departmental legislative, policy and management accountabilities. EMG members’ profiles as at 30 June 2013 are provided in Appendix 1.
The EMG is supported by corporate governance committees that provide forums for senior executives to engage with the range of strategic agendas. A number of other committees and consultation mechanisms, both internal and external, also help to support decision-making by the EMG and its subcommittees. The department's governance committees are reviewed annually to ensure alignment with DETE’s direction and objectives. The structure of the committees, that were operational during the 2012–13 financial year, and the reporting arrangements are outlined in Figure 2.
Figure 2: Department of Education, Training and Employment governance committee structure, 2012–13
Minister for Education,
Training and Employment
Director-General
2. Executive Management Group (EMG)
Cabinet Budget Review
Committee (CBRC)
13. Special Purpose Taskforces
12. Integrated Service Delivery Board (ISDB)
6. Investment Committee
5. Budget Committee
1. Portfolio Budget Review Committee (PBRC)
7. Strategic Assets Planning Committee (SAPC)
8. Information Steering Committee
9. Data Analytics Committee (DAC)
10. DETE Health, Safety and Wellbeing Committee
11. DETE Evaluation Committee (DEC)
3. Audit and Risk Management Committee (ARMC)
4. Fraud and Corruption Control Committee (FCCC)
Source: Department of Education, Training and Employment
Department of Education, Training and Employment | Annual Report 2012–13 13

The department’s governance committees meet annually at a minimum. Further information regarding the committees is provided in Appendix 2.
Statutory bodies and entitiesThe following statutory bodies and entities produce their own annual reports to be tabled in Parliament, or have reporting requirements independent from the department:
Gold Coast Institute of TAFE Boards of Trustees of Grammar Schools Non-State Schools Accreditation Board (including Non-State Schools Eligibility for Government
Funding Committee) Queensland College of Teachers Queensland Education Leadership Institute Queensland Studies Authority (QSA) Skills Queensland Southbank Institute of Technology Building and Construction Industry Training Fund (Qld), trading as Construction Skills Queensland Training Ombudsman Queensland universities.
Further information about these statutory bodies is provided in Appendix 3.
Our stakeholdersTo assist in our planning and policy making, the department engages with a wide range of stakeholders including:
parents and carers members of school councils early childhood services and organisations parents and citizens associations parents and friends associations non-government schooling sectors students volunteers unions employees business and industry universities and the broader higher education sector private training providers statutory bodies peak bodies and interest groups related government organisations interested groups the Queensland community not-for-profit community-based organisations.
Our work with the Australian GovernmentThe department’s key strategies support the Council of Australian Governments’ (COAG) agenda through National Agreements, National Partnerships and other initiatives, including:
universal access to early childhood education Indigenous early childhood development early childhood education and care improving student outcomes in low socio-economic school communities providing more support for students with disability closing the gap for Indigenous children and Indigenous economic participation Australian Curriculum improving literacy and numeracy empowering local schools trade training centres in schools investing in Focus Schools
Department of Education, Training and Employment | Annual Report 2012–13 14

helping our kids understand finances digital education revolution improving teacher quality youth attainment and transitions National solar schools plan skills reform training places for single and teenage parents TAFE fee waivers for child care qualifications Industry and Indigenous Skill Centres Program Commonwealth, State and Territory Group Training Program.
Information regarding the outcomes, objectives, targets and performance indicators in National Agreements and National Partnership Agreements under the Intergovernmental Agreement on Federal Financial Relations can be found online at www.federalfinancialrelations.gov.au/content/intergovernmental_agreements.aspx.
Our critical issuesKey challenges that face the department as we plan for the future include:
operational efficiency and the reduction of red tape in our operations regulation of early childhood education and care services access to quality kindergarten programs across Queensland readiness of all Queensland children to start school educational outcomes including literacy, numeracy and science for every child in every classroom senior schooling retention and attainment rates responsiveness and efficiency of the postsecondary education and training sector Queenslanders with trade, training and tertiary qualifications that meet the needs of Queensland
industries contribution to the Government’s target to reduce unemployment in Queensland to four per cent
within six years systems and infrastructure that support effective and contemporary service delivery now and into the
future attraction, retention and development of high-quality teachers, staff and leaders within a
geographically diverse state delivery of services to a diverse and growing population that includes increasing numbers of
vulnerable and disadvantaged Queenslanders the gap between Indigenous and non-Indigenous attendance and outcomes seamless transitions for students and workers through early years, education, training and into
employment developing future global citizens who recognise and value diversity.
Future directions
Great teachers = Great results
Research clearly demonstrates that student outcomes are closely linked to the quality of the instruction they receive in the classroom. As such, our teachers are the most important resource we have to give young Queenslanders the best possible start in life.
Great teachers = Great results is a direct action plan for Queensland schools that builds on the strength of Queensland’s existing school funding model and extends the government’s reform agenda to focus on the most important piece of the education system – our teachers. The plan focuses the next wave of education reform on two critical areas:
professional excellence in teaching – elevating teaching standards across the board, rewarding high performance and positioning the highest performing teachers where they are needed most
boosting school autonomy – empowering and enabling school leaders and teachers to drive outcomes for students, including stronger discipline.
The plan recognises that Queensland is a diverse state and that a one-size-fits-all approach will not unlock Queensland’s full potential. It supports new teachers entering the profession by pairing them with experienced mentors; recognises high performing teachers with accelerated career pathways and bonuses;
Department of Education, Training and Employment | Annual Report 2012–13 15

boosts the qualifications of teachers, principals and deputy principals; and deploys high performing teachers to where they are most needed. Great teachers = Great results will improve the academic standing of Queensland schools when compared to other states and territories, and internationally.
Great skills. Real opportunities.
On 1 July 2013, landmark changes will be made to the way Government invests in training with the introduction of more contestable funding arrangements. Contestable funding will allow the Government to purchase training from a range of quality training providers to give students greater choice. By July 2014, all training funding in Queensland will be fully contestable.
The new approach to investment in training will be applied to the new Certificate III Guarantee, which will provide eligible Queenslanders with access to a government subsidised training place in priority skill areas, up to and including their first Certificate III level qualification. A new $42 million contestable funding pool will be made available for the Certificate III Guarantee in 2013–14 as part of approximately $300 million in contestable funding.
A new investment framework for training will also be introduced to provide clear information on priority skills and funding arrangements. Tailored programs to support skills development for particular industries, locations or student cohorts will enable government to respond to emergent skilling needs while also encouraging co-investment by employers.
As part of the reform program underway, the Government will also work to improve the state’s TAFE system. Legislation to establish TAFE Queensland as an independent statutory body was passed in May 2013. From July 2013, TAFE Queensland will be established as a statutory body. A machinery-of-government process will be undertaken in 2013–14 to transition all TAFE functions to the new TAFE Queensland statutory body.
Department of Education, Training and Employment | Annual Report 2012–13 16

Chapter 2
Chief Finance Officer’s reportStrategy: Deliver cost-effective services, maximise value and plan for future resource allocation and investment
Reform was a major theme for the year, with the release in April of A Plan: Better services for Queenslanders, in response to the final Commission of Audit report into the state of Queensland's finances. A number of significant strategies commenced, or were announced during 2012–13, including Great teachers = Great results, Advancing our Schools Maintenance Fund, Fixing Our Schools Fund and Great skills. Real opportunities. In addition, major reforms commenced in the TAFE sector with the establishment of TAFE Queensland as a separate statutory body. The department achieved an operating surplus of $0.5 million in 2012–13, with school financials consolidated as at the end of June for the first time.
During 2012–13 the department approved an updated Long Term Financial Strategic Plan (2013–17). This plan outlines the department’s commitment to the delivery of cost effective services, maximising value and planning for future resource allocation and investment. The planning cycle is aligned with the department’s overall strategic planning process.
The department continued the development of the new SAP Enterprise Resource Planning and Business Intelligence solution during 2012–13. The system will be implemented in 2013–14. In addition to the realisation of significant financial savings over its lifecycle, the system will deliver a number of efficiency improvements through automated controls. More importantly, the system will deliver enhanced business information and forecasting capability to the department and government.
The department initiated a number of enhancements to the internal control environment during 2012–13, including the introduction of a Fraud and Corruption and Control Committee, a review of the Internal Audit function, and a health check of the financial internal control framework against best practice.
In accordance with the requirements of section 77(2)(b) of the Financial Accountability Act 2009, I have provided the Director-General with a statement that the financial internal controls of the department are operating efficiently, effectively and economically in conformance with section 57 of the Financial and Performance Management Standard 2009. As Chief Finance Officer, I have therefore fulfilled the minimum responsibilities as required by section 77(1)(b) of the Act.
Adam Black FCPA CAAssistant Director-General, FinanceChief Finance Officer
Department of Education, Training and Employment | Annual Report 2012–13 17

Table 2: Financial snapshot
Financial snapshot 2008–09$(000)
2009–10$(000)
2010–11$(000)
2011–12$(000)
2012–13$(000)
Controlled Revenue
Departmental services revenue 5 434 806 6 361 623 6 827 758 7 425 300 7 394 773Other revenues 1 154 354 688 447 726 701 788 180 814 899
Controlled Expenses 6 588 438 7 048 818 7 553 279 8 212 044 8 209 130Operating surplus/(deficit) 722 1 252 1 180 1 436 542Administered grants (state) 751 606 614 699 664 728 675 895 710 923Capital outlays 680 344 2 063 375 1 437 739 532 842 423 868Total assets 17 470 605 17 835 198 18 662 635 18 719 423 18 481 943Total liabilities 957 913 1 241 759 1 017 233 993 342 950 005Net assets/(liabilities) 16 512 692 16 593 439 17 645 402 17 726 081 17 531 938
2008–09 2009–10 2010–11 2011–12 2012–13Employee expenses ($000) 4 718 681 4 981 683 5 325 565 5 685 185 5 756 319Number of employees at 30 June (FTE) 63 732 65 829 66 716 67 435 66 629
Source: Department of Education, Training and Employment
For a comprehensive set of financial statements covering all aspects of the department’s activities, see financial statements of this Annual Report. No totals have been adjusted for commercial-in-confidence requirements.
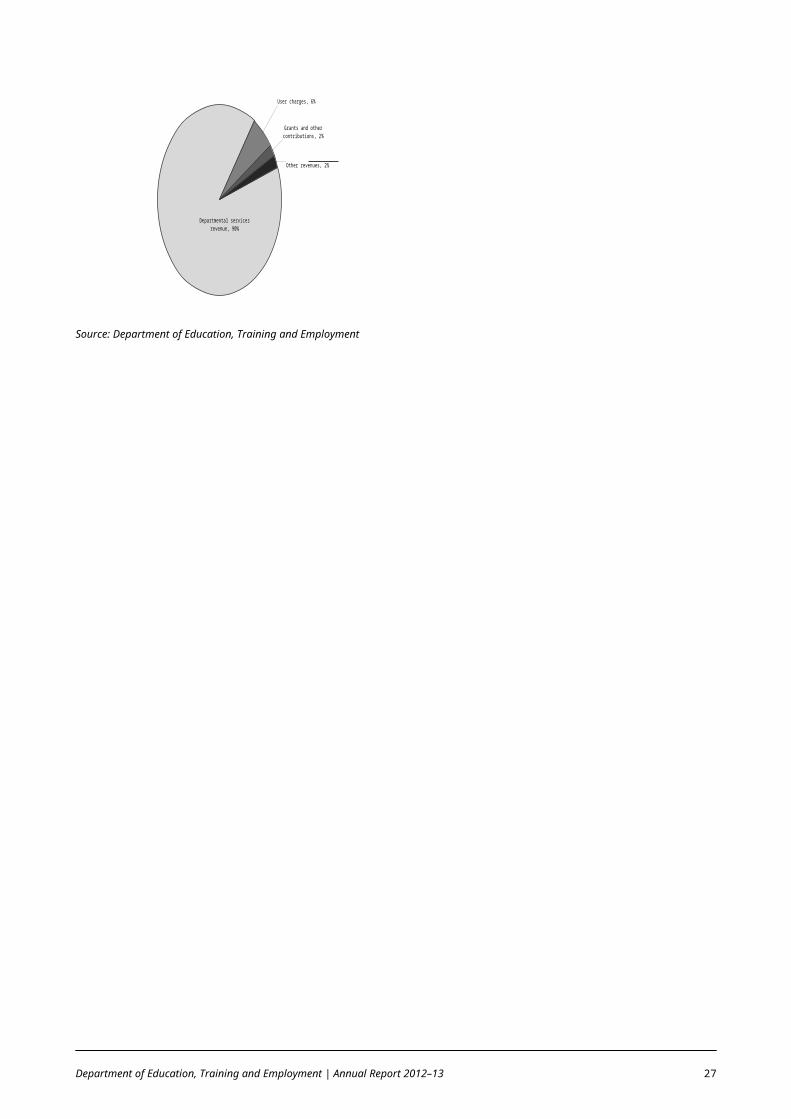
Our income – where the funds come fromWe received $8.209 billion for our operations, a decrease of $4 million from the previous year. Departmental services revenue decreased by $31 million. This was largely due to changes in Australian Government National Partnership funding including cessation of the Productivity Places Program (PPP), funding deferrals and savings delivered as part of the Government’s fiscal repair program. These decreases have been offset by increased Australian Government Specific Purpose funding and other National Partnerships particularly in Early Childhood, and Teacher Quality areas.
The department also received $2.532 billion in administered funding, an increase of $123 million from 2011–12. Administered funding includes Commonwealth funding transfers to non-government schools, as well as state grants to statutory authorities, peak bodies for non-state schools and other entities, enabling them to deliver agreed services to Queenslanders.
Figure 3: Income, 2012–13
Departmental services revenue, 90%
User charges, 6%
Grants and other contributions, 2%
Other revenues, 2%
Source: Department of Education, Training and Employment
Department of Education, Training and Employment | Annual Report 2012–13 18

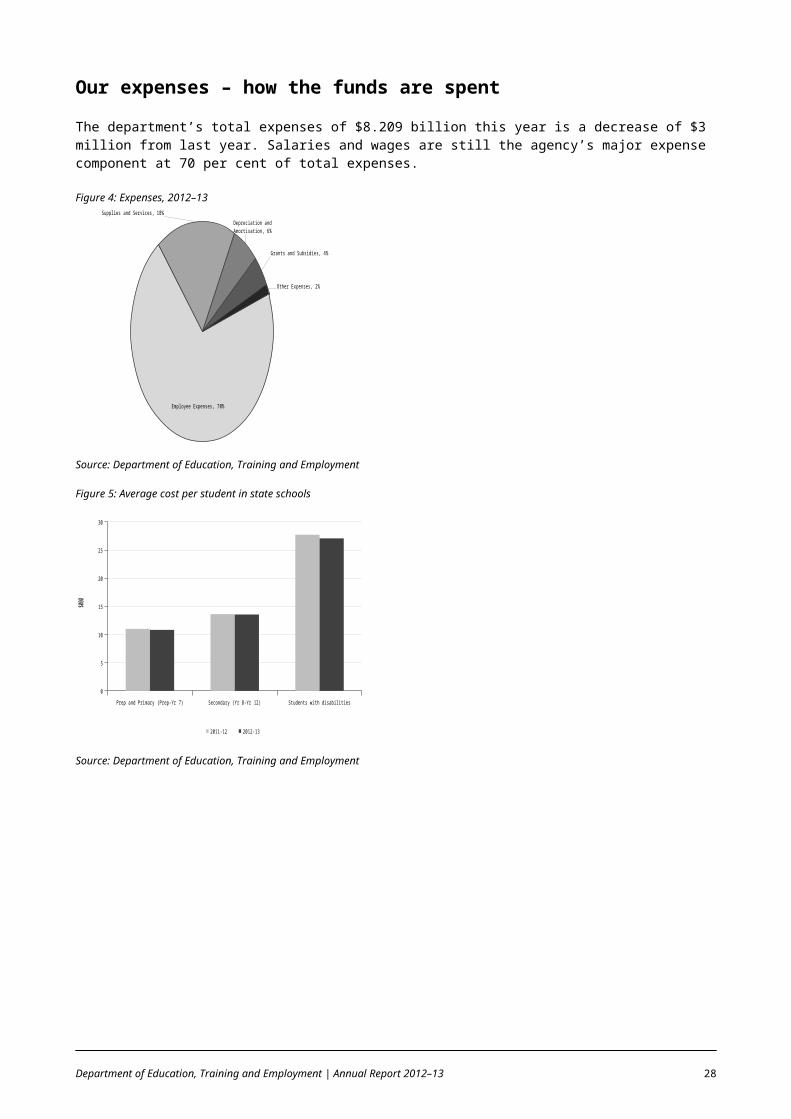
Our expenses – how the funds are spentThe department’s total expenses of $8.209 billion this year is a decrease of $3 million from last year. Salaries and wages are still the agency’s major expense component at 70 per cent of total expenses.
Figure 4: Expenses, 2012–13
Employee Expenses, 70%
Supplies and Services, 18%
Depreciation and Amortisation, 6%
Grants and Subsidies, 4%
Other Expenses, 2%
Source: Department of Education, Training and Employment
Figure 5: Average cost per student in state schools
Prep and Primary (Prep-Yr 7) Secondary (Yr 8-Yr 12) Students with disabilities
0
5
10
15
20
25
30
2011-12 2012-13
$000
Source: Department of Education, Training and Employment
Department of Education, Training and Employment | Annual Report 2012–13 19

Our assets – what we ownThe department held assets totalling $18.482 billion at 30 June 2013, a slight decrease of $237 million on 2011–12. The majority of our assets are in land and buildings associated with schools, TAFE institutes and early childhood facilities.
Figure 6: Value of property, plant and equipment and intangible assets
2008-09 2009-10 2010-11 2011-12 2012-13
0
2,000
4,000
6,000
8,000
10,000
12,000
14,000
16,000
18,000
20,000
$ milli
on
Source: Department of Education, Training and Employment
Our liabilities – what we oweThe department held liabilities totalling $950 million at 30 June 2013, a decrease of $43 million from 2011–12. Lease assets and corresponding finance lease liabilities for the Southbank Education and Training Precinct and the Aspire South East Queensland Schools program are held by the department and form the majority of our financial liabilities.
Department of Education, Training and Employment | Annual Report 2012–13 20

Comparison of actual financial results with budget Provision of these statements allows comparison of the actual financial results of the controlled operations of the department with the department estimates published in the State Budget papers 2012–13 Service Delivery Statements – Book 3.
Table 3: Operating statement for the year ended 30 June 2013
Notes 2012–13 Actual$'000
2012–13 Adjusted budget
$'000Variation
Income from Continuing OperationsDepartmental services revenue 1 7 394 773 7 662 502 -3%User charges 2 486 131 434 088 12%Grants and other contributions 3 156 645 181 089 -13%
Other revenues 172 123 169 072 2%
Total Income from Continuing Operations 8 209 672 8 446 751 -3%
Expenses from Continuing OperationsEmployee expenses 5 756 319 5 809 301 -1%Supplies and services 1 473 468 1 537 851 -4%Grants and subsidies 4 359 991 488 529 -26%Depreciation and amortisation 492 804 505 728 -3%Impairment losses and other expenses 5 83 424 63 786 31%
Finance/borrowing costs 43 124 41 556 4%
Total Expenses from Continuing Operations 8 209 130 8 446 751 -3%
Operating Result from Continuing Operations
Operating Result from Continuing Operations 542 -Source: Department of Education, Training and Employment
Notes:1. The decrease is mainly due to changes in provisions for and actual enterprise bargaining outcomes, program deferrals for Early
Childhood and National Partnership programs, partly offset by higher funding for maintenance.2. The increase is mainly due to higher school revenues due largely to the inclusion of 13 months of school transactions as a result of
consolidation of school financials at the end of June (previously consolidated at end of May).3. The decrease is mainly due to lower levels of school-based revenues in this category.4. The decrease is mainly due to lower levels (including deferrals) of Commonwealth funded programs (including Universal Access to
Early Education and Skills Reform) and the deferral of State Kindergarten grant funding.5. The increase is mainly due to loss on disposal of property, plant and equipment not provided for in budgets.
Department of Education, Training and Employment | Annual Report 2012–13 21

Table 4: Balance sheet as at 30 June 2013
Notes 2012–13 Actual$'000
2012–13 Adjusted budget$'000
Variation(a)
Current Assets
Cash and cash equivalents 250 392 251 140 0%
Receivables 177 169 180 493 -2%
Inventories 4 222 4 024 5%
Other current assets 1 51 447 100 147 -49%
483 230 535 804 -10%
Non-current assets classified as held for sale 2 18 905 48 768 -61%
Total Current Assets 502 135 584 572 -14%
Non-Current Assets
Other financial assets 5 629 -
Property, plant and equipment 3 17 891 272 18 317 995 -2%
Intangible assets 82 907 83 878 -1%
Total Non-Current Assets 17 979 808 18 401 873
TOTAL ASSETS 18 481 943 18 986 445
Current LiabilitiesPayables 4 323 919 388 594 -17%Other financial liabilities 5 9 906 16 082 -38%Accrued employee benefits 6 91 379 27 190 236%Other current liabilities 7 38 517 57 363 -33%
Total Current Liabilities 463 721 489 229
Non-Current Liabilities
Other financial liabilities 486 284 486 665 0%
Total Non-Current Liabilities 486 284 486 665
TOTAL LIABILITIES 950 005 975 894
NET ASSETS 17 531 938 18 010 551
Equity
Contributed equity 4 942 040 4 897 554 1%
Accumulated surplus 44 883 42 905 5%
Asset revaluation surplus 8 12 545 015 13 070 092 -4%
TOTAL EQUITY 17 531 938 18 010 551Source: Department of Education, Training and Employment
Notes:The variances for these controlled items can be explained as follows: 1. The variance is mainly due to reduction in land acquisition prepayments.2. The decrease is due to changes in current asset disposal program.3. The decrease is mainly due to changes from land and buildings revaluations in 2012–13.4. The decrease is due to reduction in capital works payables and contract retentions.5. The decrease reflects lower level of financial liabilities than initially forecast.6. The increase is mainly due to higher level of accrued employee benefits than originally forecast including for annual leave and long
service levies.7. The decrease is lower due to unearned grant and fee revenue than originally forecast.8. The decrease is mainly due to changes from land and buildings revaluations in 2012–13.
Department of Education, Training and Employment | Annual Report 2012–13 22

Chapter 3
Early childhood education and careObjective: Queensland families will have access to quality early years services that lay the foundations for learning
Key performance indicators Proportion of Queensland children enrolled in an early childhood education program Proportion of Indigenous children enrolled in an early childhood education program Proportion of disadvantaged children enrolled in an early childhood education program
Service standardsTable 5: Service standards – Early childhood education and care
Service standards Notes2012–13
Target/estimate Actual
Proportion of Queensland children enrolled in an early childhood education program KPI
1, 2, 3, 4 86% 76.6%
AccessProportion of enrolments in an early childhood education program: 3, 4, 5
Indigenous children KPI 6 78% 65.6%
Children in disadvantaged communities KPI 7 75% 71.4%
RegulationProportion of complaints relating to serious safety breaches in licensed child care services that are responded to within two working days
8 100% 100%
Proportion of early childhood education and care services with a current assessment against the National Quality Framework
100% 100%
Source: Queensland State Budget 2012–13 Service Delivery Statements and Performance, Monitoring and Reporting, Department of Education, Training and Employment
Notes:1. Under the National Partnership Agreement on Early Childhood Education, Queensland is committed to ensuring that by 2013 every
child will have access to early childhood education programs.2. The wording of this measure has been changed from “quality kindergarten program” to “early childhood education program” to
align with the National Partnership Agreement on Early Childhood Education. The methodology has not changed.3. Early childhood education program: a play-based program provided by a degree-qualified teacher to children in the year before
school.4. Variance between the 2012–13 target/estimate and 2012–13 actual is due to fluctuations in the estimated resident population, the
voluntary nature of kindergarten participation and the availability of four year university trained early childhood teachers to deliver kindergarten programs.
5. These proportions are measured by the number of enrolments from each population group as a percentage of the total population of four year olds in that group in Queensland.
6. Indigenous: a person of Aboriginal and/or Torres Strait Islander origin whose parents identify the child at enrolment to be of Aboriginal and/or Torres Strait Islander origin.
7. Disadvantaged children: the cohort population that reside in statistical local areas classified by the Australian Bureau of Statistics (ABS) in the bottom two deciles using the Index of Relative Socio Economic Disadvantage.
8. The measure previously only related to child care services licensed under the Child Care Act 2002. The wording of this measure has been changed to also include education and care services approved under the Education and Care Services National Law (Qld) Act 2011 and data should not be compared against previous years or targets.
Early childhood education and careThe department is committed to providing Queensland children with the start to life they deserve. In addition, the department is committed to ensuring that all Queensland children have the opportunity to access safe
Department of Education, Training and Employment | Annual Report 2012–13 23

and quality early childhood education and care regardless of where they live, or the economic circumstances of their families. As one of its key priorities, the department aims to ensure that by mid-2013, all Queensland children are able to access a kindergarten program in the year before they commence Prep.
Integration of early years services
Strategy: Strengthen integrated early years services that support children and their families
Integrated early years services provide early childhood education and care, family support and health services to families with children aged from birth to eight years. The department’s framework for integrated early childhood development will support and enhance integration across funded service providers.
During 2012–13, the department: Published the findings of an evaluation of the Early Years Centre (EYC) initiative demonstrating the
positive achievements of the integrated service model delivered by EYC services across 15 communities including the new facility at Coomera Springs which opened in April 2013.
Provided funding and support to integrated services including the EYCs, Child and Family Support Hubs and Remote Area Aboriginal and Torres Strait Island Child Care.
Continued to fund and support a range of early years services that build the capacity of parents and carers to support their children’s early learning and development and help prepare them for kindergarten and school.
Children and family centresThe National Partnership Agreement for Indigenous Early Childhood Development provides for the establishment of 10 children and family centres in Queensland. The locations include: Cairns, Doomadgee, Ipswich, Logan, Mackay, Mareeba, Mornington Island, Mount Isa, Palm Island and Rockhampton. The children and family centres provide integrated early childhood education and care, parenting and family support, and maternal and child health services. These centres focus on providing services to Aboriginal and Torres Strait Islander families with children from pre-birth to eight years. However, services are able to be accessed by all families.
Significant achievements during 2012–13 include: Children and family centre services commenced from permanent premises in Doomadgee, Logan,
Mareeba, Mornington Island, Mount Isa, Palm Island and Rockhampton. The permanent facilities in Cairns, Ipswich and Mackay are scheduled to be completed in late 2013.
Children and family centres continued to work closely and consolidate relationships with their local Aboriginal and Torres Strait Islander community to determine the kind of services and programs they require.
Families across Queensland continued to receive parenting and family support services through 25 child and family hubs.
Universal access to kindergarten programs
Strategies: Build additional kindergartens and support the long day care sector to provide approved
kindergarten programs Increase kindergarten participation of children from at-risk groups, living in small or remote
communities, and who are Indigenous
The introduction of the kindergarten reforms led to a significant increase in the proportion of Queensland children enrolled in early childhood education (kindergarten programs). In 2008, 29 per cent of children in Queensland were enrolled in an early childhood education program. This increased to 77 per cent by the end of July 2012 KPI .
During 2012–13, the department worked towards delivering extra kindergarten services by 2014. In 2012–13, a total of 19 extra kindergarten services were established (two on state schools and 17 on non-state schools).
The department commissioned the Brisbane School of Distance Education (SDE) to develop a distance education kindergarten program called eKindy. The program commenced in Term 1, 2013 and provides
Department of Education, Training and Employment | Annual Report 2012–13 24

children who cannot easily access a centre-based kindergarten program due to isolation, illness or family lifestyle with access to a kindergarten program. In 2013, a total of 165 children were enrolled in eKindy.
The department administered the Renovation and Refurbishment Grant Program for Kindergarten Services and the Essential Upgrades for Not-for-profit ECEC services capital grant programs which provide up to $34 million for eligible services to improve facilities to assist in delivery of kindergarten programs and meet new national quality framework standards.
The department funded Childcare Queensland to deliver the Kindergarten Advisory Support Service (KASS) to assist long day care services to implement and maintain an approved kindergarten program and meet the requirements of the Queensland Kindergarten Funding Scheme.
All new and existing kindergarten services are required to be a member of a central governing body (CGB) in order to access kindergarten funding. CGBs support the provision of quality and inclusive kindergarten services and programs. CGBs are the primary contact for kindergarten services for all matters relating to the delivery of their kindergarten program. Administrative support is provided by CGBs to ensure kindergarten services fulfil their financial and performance reporting requirements and obligations. The department has five organisations approved as CGBs:
The Crèche and Kindergarten Association Limited Independent Schools Queensland Queensland Catholic Education Commission Queensland Lutheran Early Childhood Services The Gowrie (QLD) Inc.
Bilateral agreement targets
While strong progress continues to be made, meeting the targets set for providing universal access to kindergarten is a major challenge for Queensland. In 2012, Queensland exceeded many of the key performance benchmarks set in the Bilateral Agreement on Achieving Universal Access to Early Childhood Education and Care.
In 2012, 66 per cent of Indigenous children and 71 per cent of disadvantaged children were enrolled in early childhood education (kindergarten) programs KPI . The number of four-year university trained (or equivalent) and early childhood qualified teachers delivering a kindergarten program continued to grow from 1082 in 2011 to 1773 in 2012.
Responding to diverse needs
The Queensland Government is committed to ensuring that kindergarten services provide inclusive programs that reflect their community’s diverse needs. During 2012–13, the department strived to ensure that children in disadvantaged communities were provided with the opportunities to participate in a kindergarten program. Notably, the low socioeconomic subsidy under the Queensland Kindergarten Funding Scheme was increased and extended in January 2012, to kindergarten services operating in additional Low Socioeconomic Status (SES) communities. In addition, the following programs were implemented during 2012–13:
The Specialised Equipment and Resources program to provide eligible kindergarten services with free, on-loan access to specialised equipment and professional resources to support children with disabilities to participate in their kindergarten program.
The $1.7million Disability Support Funding program which provides between $2000 and $6000 per eligible child to support children with a suspected or diagnosed disability to participate in a quality kindergarten program.
The kindergarten transport initiative to increase the participation of children in 11 locations enrolled in approved kindergarten programs where attendance is impeded by the lack of available transport.
The Transition to Kindergarten Program to support Aboriginal and Torres Strait Islander and culturally and linguistically diverse (CALD) families in playgroup settings to learn about the importance of kindergarten and make connections to local approved providers.
Pre-Kindergarten Grants which seek to build the capacity of existing early years and family-centred services to address challenges to kindergarten access and participation for Aboriginal and Torres Strait Islander children and children from CALD backgrounds.
Pilot trial of a cultural competence support and guidance program to strengthen the capacity of kindergarten providers to effectively engage with Aboriginal and Torres Strait Islander families and
Department of Education, Training and Employment | Annual Report 2012–13 25

deliver inclusive early childhood education programs to meet the learning needs of Aboriginal and Torres Strait Islander children.
Grants for kindergarten program providers to encourage qualified early childhood teachers from Aboriginal, Torres Strait Islander or non-English speaking backgrounds to commence work in an eligible kindergarten program and also support activities that assist cultural inclusion and promote collaborative partnerships with local culturally and linguistically diverse families and communities.
Pre-Prep – Aboriginal and Torres Strait Islander communities
Under the department's Foundations for Success: Guidelines for an early learning program in Aboriginal and Torres Strait communities, pre-Prep is a part-time, targeted education program for children who turn four years of age by 30 June in the year they participate. Pre-Prep builds children's early language skills, improves family participation in early learning, and enables smoother transitions into the school setting. During 2012–13, the department continued delivering pre-Prep early learning programs across 35 Aboriginal and Torres Strait Islander communities.
School readiness and transitions
Strategies: Support service providers to implement a quality early years curriculum Assist parents, carers and volunteers to gain skills that support early literacy and numeracy
development
Queensland Kindergarten Learning Guideline
The Queensland Kindergarten Learning Guideline (QKLG), developed by the QSA, represents Queensland's first statewide kindergarten-specific learning program. The QKLG provides advice and guidance to teachers in delivering approved kindergarten programs and monitoring children’s progress. A suite of online professional development materials and free statewide, face-to-face workshops developed and delivered by the QSA support kindergarten teachers with the implementation of the QKLG. The QKLG professional development materials are available online at www.qsa.qld.edu.au/10192.html.
Quality standards
Strategies: Implement the National Quality Framework for Early Childhood Education and Care, including
standards and streamlined regulatory requirements Simplify regulation of early years services not covered by the national quality framework Work with the sector to attract and retain a highly skilled and diverse workforce
The department is responsible for approving and regulating education and care services in Queensland and is leading Queensland's implementation of the National Quality Framework (NQF). The NQF commenced on 1 January 2012. It provides for a quality assessment and rating system and National Quality Standard for long day care, kindergarten, pre-Prep, family day care and outside school-hours care. Since June 2012, NQF services have started being assessed against seven quality areas and assigned a quality rating. They will also be given an overall rating. Under the NQF, service providers will be required to display their specific service ratings. From 1 May 2013, ratings of those education and care services that have received an assessment and rating have also been published by the Australian Children’s Education and Care Quality Authority established under the NQF. Queensland legislation for services not covered by the NQF has been reviewed. As a result, the Education and Care Services Bill 2013 has been developed and consultation has commenced.
The department continues to lead Queensland's input into the national early childhood reform agenda being progressed. More information is available online at www.dete.qld.gov.au/earlychildhood/.
Early childhood workforce
The department has developed and released its Early Childhood Education and Care Workforce Action Plan 2011–2014. The plan includes programs which aim to attract and retain qualified early childhood teachers, up-skill the existing early childhood workforce, and further develop Aboriginal and Torres Strait Islander early
Department of Education, Training and Employment | Annual Report 2012–13 26
childhood educational leaders. The range of initiatives under the ECEC Workforce Action Plan 2011–2014 include:
tuition-free TAFE Bridging Program for primary-qualified teachers to obtain early childhood qualifications to be recognised as an early childhood teacher or approved Diploma holder
scholarships for existing ECEC staff with three-year degree or Advanced Diploma qualifications to become qualified early childhood teachers
incentive grants of $12 000 for early childhood teachers to relocate to rural and remote locations to deliver an approved kindergarten program
delivery of training support to existing and prospective educators in rural and remote areas provision of qualifications in children’s services to Indigenous educators in the Cape, Gulf and Torres
Strait Islands provision of leadership and professional development programs for educators across the sector.
As at March 2013, 414 individuals have enrolled in the Early Childhood Bridging Program. In addition, the department has continued to implement the Kindy Rural and Remote Teacher Incentive Scheme, providing financial incentives to support 13 early childhood teachers to deliver an approved kindergarten program in a rural and remote service.
Throughout 2012–13, the department continued to manage the Early Childhood Teacher Scholarship Program, upgrading staff teachers' qualifications to facilitate delivery of approved kindergarten programs. A total of 352 scholarships have been offered to ECEC educators to support universal access to kindergarten programs. As at 30 June 2013, 50 scholarship recipients had completed their studies with remaining scholarship recipients due to complete their studies by 2015. In addition, the department implemented a range of strategies to increase and retain the cultural and linguistic diversity of the ECEC workforce. To date, a total of 86 grants have been provided across the four programs.
To support the achievement of our target of universal access to kindergarten, the department provides funding to approved kindergarten providers. One criterion of the funding approval process is that the kindergarten program be delivered by a suitably qualified teacher. From 1 January 2013, the teacher qualification guidelines were revised and a ‘self-assessment’ process was implemented to replace the teacher recognition process. The department supports the decision-making process of services through a dedicated hotline and online resources.
Sector, parent and community partnerships
Strategies: Enhance stakeholders’ understanding of the benefits of quality early years programs Work with stakeholders to provide parenting support and promote kindergarten participation
The department continues to fund more than 200 services to deliver early years programs and services, including child and family support hubs and playgroups, and early childhood development services such as family support and parenting programs. Throughout 2012–13, the department continued to encourage parents to enrol their children in an approved kindergarten program through a range of strategies including:
a statewide awareness campaign to Aboriginal and Torres Strait Islander communities and communities from culturally and linguistically diverse backgrounds
support to parents and services through the Kindy Hotline access to accredited interpreters and translated posters, brochures and fact sheets available in 30
languages.
The department continued to engage with key stakeholders throughout 2012–13, including all Central Governing Body organisations, as well as other key stakeholders to inform the ongoing review and implementation of universal access initiatives. The department also convened a number of forums to engage stakeholders in the direction of early years programs. As a consequence of national and state reforms being well progressed, changes occurred to the department’s engagement strategy including ceasing the Early Childhood Development Forum and the Queensland Early Years Parent Roundtable.
The Legislative and National Implementation Reform Committee (LNIRC) continues to provide a mechanism for the ECEC sector to inform implementation of key state and national ECEC reform agendas. In addition, the Children and Family Centre Implementation Reference Group, formed in 2010, continues to provide advice to inform implementation of the National Partnership Agreement for Indigenous Early Childhood Development, and strategies for increasing participation of Aboriginal and Torres Strait Islander children in kindergarten programs.
Department of Education, Training and Employment | Annual Report 2012–13 27
Chapter 4
School educationObjective: Every young Queenslander will be prepared with the educational foundations for successful transitions to further education, training and work
Key performance indicators Proportion of students at or above the national minimum standard (NMS) and in the upper two bands in
reading, writing and numeracy The gap between Indigenous and non-Indigenous attendance; reading, writing and numeracy
achievements; and Year 12 outcomes Proportion of 20–24 year olds having attained Year 12 or equivalent Proportion of students who, in the year after completing Year 12, are participating in education, training
or employment Proportion of parents satisfied with their child’s school
Service standardsTable 6: Service standards – School education
Service standards Notes2012–13
Target/est. Actual
Literacy and numeracy
Year 3 Test – Proportion of students at or above the National Minimum Standard:
1, 2
All students:
Reading 92% 91.6%
Writing 3 93% 93.8%
Numeracy 94% 90.5%
Indigenous students: 4
Reading 84% 80.0%
Writing 3 84% 82.8%
Numeracy 86% 73.4%
Year 5 Test – Proportion of students at or above the National Minimum Standard:
1, 2
All students:
Reading 88% 83.2%
Writing 3 90% 83.3%
Numeracy 93% 87.3%
Indigenous students: 4
Reading 67% 61.5%
Writing 3 72% 62.0%
Numeracy 78% 66.7%
Year 7 Test – Proportion of students at or above the National Minimum Standard:
1, 2
All students:
Reading 94% 90.0%
Writing 3 92% 87.0%
Numeracy 95% 92.3%
Indigenous students: 4
Reading 85% 75.4%
Writing 3 78% 69.2%
Numeracy 85% 80.7%
Department of Education, Training and Employment | Annual Report 2012–13 28

Service standards Notes2012–13
Target/est. Actual
Year 9 Test – Proportion of students at or above the National Minimum Standard:
1, 2
All students:
Reading 90% 87.0%
Writing 3 86% 69.8%
Numeracy 94% 92.2%
Indigenous students: 4
Reading 75% 71.0%
Writing 3 69% 46.3%
Numeracy 82% 84.1%
Attainment outcomes
Proportion of Year 12 students awarded a QCE 5, 10, 11 80% 82.5%
Proportion of Year 12 students who are completing or have completed a SAT or were awarded one or more of: QCE, IBD or VET qualification
5, 10, 11 93% 94.5%
Proportion of OP/IBD students who received an OP 1 to 15 or an IBD 10, 11 70% 74.9%
Number of students awarded a Queensland Certificate of Individual Achievement (QCIA)
10, 11 550 550
Number of students with disabilities who have completed 12 years of schooling 6 1400 1283
Post-schooling destinations
Proportion of students who, six months after completing Year 12, are participating in education, training or employment KPI
7 88% Data unavailable
Cost and satisfaction
Average cost of service per student Primary (Prep – Year 7) $11,082 $10 829
Secondary (Year 8 – Year 12) $13,816 $13 565
Students with disabilities $27,785 $27 072
Proportion of parents satisfied with their child’s school KPI 8, 9 84% 95.2%
Source: Queensland State Budget 2012–13 Service Delivery Statements
Notes:1. These service standards relate to the State Schooling sector only.2. NAPLAN NMS targets represent the aspirational goals for achievement against these measures and should be read in conjunction
with other NAPLAN data, which show broad improvements.3. In 2011, the Australian Curriculum, Assessment and Reporting Authority (ACARA) included in NAPLAN a genre (Persuasive) for
testing Writing that was different from the genre used in previous years (Narrative). The Persuasive Writing results for 2011 should not be directly compared to the Narrative Writing results from earlier years.
4. Indigenous: a person of Aboriginal and/or Torres Strait Islander origin who identifies as being of Aboriginal and/or Torres Strait Islander origin.
5. Attainment Outcomes acronyms: SAT – School-based Apprenticeship and Traineeship, IBD – International Baccalaureate Diploma, OP – Overall Position and QCE – Queensland Certificate of Education, VET – Vocational Education and Training.
6. Year-on-year variations are due to changes in the number of senior secondary school students who have a recorded disability.7. ‘Students’ refers to year 12 completers. Data relates to students who attended state schools only and is sourced from the Next
Step Survey conducted by DETE each year. Due to the legislative requirement to table agency annual reports in September 2013, 2013 Next Step survey data was not available at the time of printing. When the data becomes available, it will be uploaded to the DETE online annual report at www.dete.qld.gov.au/publications/annual-reports/12-13/index.html.
8. Sourced from the School Opinion Survey conducted by DETE in all state schools in July/August each year. A redevelopment of the Parent/Caregiver Survey in 2012 constituted a break in the time series and 2012 data should not be compared against previous years or targets. The change in response scale (from five-point satisfaction to six-point agreement) resulted in an increase in positive responses in 2012 as respondents could not select a neutral response. Data are presented as the aggregation of positive agreement responses, namely ‘Somewhat Agree’, ‘Agree’ and ‘Strongly Agree’.
9. Confidence intervals for agreement estimates derived from sample survey responses need to be considered when interpreting relative performance.
10. QSA data as at 2 May 2013.11. Data for Queensland state schools only.
School curriculum
Strategies: Continue implementation of the Australian Curriculum Deliver high-quality digital resources targeted at curriculum
Department of Education, Training and Employment | Annual Report 2012–13 29

Australian Curriculum
The Australian Curriculum, developed by the Australian Curriculum, Assessment and Reporting Authority (ACARA), sets out the core knowledge, understanding, skills and general capabilities important for all Australian students. Throughout 2012–13, the department worked closely with the QSA and all schooling sectors to plan, prepare for and support the implementation of the Prep to Year 10 Australian Curriculum in all Queensland schools.
Implementation of the Australian Curriculum for English, mathematics and science in Prep to Year 10 commenced in Queensland state schools in 2012. In 2013, Queensland state schools continued to plan, teach, assess and report on the Australian Curriculum for English, mathematics and science in Prep to Year 10 and commenced implementation of the Australian Curriculum for history in Prep to Year 10.
Support for state schools to implement the Australian Curriculum is provided in the C2C curriculum planning and support package consisting of:
examples of planning materials at whole school, year level, unit plan and lesson plan levels along with assessment tasks and marking guides
examples of multi-level planning materials example Prep to Year 2 curriculum planning and classroom practice materials to support students
with disability.
Queensland curriculum
During the transition to the Australian Curriculum, Queensland teachers will continue to teach, assess and report using the Queensland curriculum for learning areas that have not yet been developed by ACARA. In 2012 and 2013, schools implemented the following Queensland curriculum for Prep to Year 10:
Queensland Early Years Curriculum Guidelines Queensland Curriculum, Assessment and Reporting (QCAR) Framework Essential Learnings in
Years 1 to 9 for: studies of society and the environment technology health and physical education languages the arts.
a program for Year 10 informed by the Year 10 guidelines.
P–12 curriculum, assessment and reporting framework
The P–12 curriculum, assessment and reporting framework specifies the requirements for Queensland state schools in implementing both the Australian Curriculum and the Queensland curriculum from 2013. The framework’s policy document and supplementary policy statements establish the expectations for Queensland state schools in delivering curriculum to optimise learning for all students from Prep to Year 12. The framework reflects Education Queensland's agenda for improvement as part of a commitment to providing a world-class education for all students.
Learning languages as part of mainstream education provides our students with a range of intellectual, social, cultural and economic benefits in the future. Learning languages provides students with analytical and communication skills that will enhance their learning in other areas. From 2012, schools, in consultation with their local Aboriginal or Torres Strait Islander community, may implement the community's Indigenous language based on the QSA's Aboriginal and Torres Strait Islander Languages P–10 Queensland Syllabus 2010 or the Aboriginal and Torres Strait Islander Languages Trial Senior Syllabus 2011. Principals, in consultation with the community, the cluster and the region, can determine the language to be taught to ensure continuity of language instruction.
Core learning priorities
Strategies: Focus on core learning priorities: reading, writing (including spelling, grammar and
punctuation), numeracy and science Improve retention, attainment and transition of students at key junctures of schooling
Department of Education, Training and Employment | Annual Report 2012–13 30

Close the gap between the attendance and outcomes of Indigenous and non-Indigenous students
NAPLAN
During May 2012, the annual National Assessment Program – Literacy and Numeracy (NAPLAN) tests were conducted for students in Years 3, 5, 7 and 9 from all state and non-state schools across Australia. The national tests assess the skills of these students in reading, writing, language conventions (spelling, grammar and punctuation) and numeracy. These tests measure how all students are performing against national standards and provide students, parents, teachers, schools and school systems with information about the literacy and numeracy achievements of students.
NAPLAN was developed collaboratively by the Australian Government, state and territory governments and non-state school sectors. The national reports on NAPLAN test results are produced by the Standing Council of School Education and Early Childhood (SCSEEC). The administration, marking and reporting of the NAPLAN tests in Queensland is coordinated by the QSA.
NAPLAN outcomes
NAPLAN test results are reported across a 10-band national scale for Years 3, 5, 7 and 9, with results for any one year level reported across six bands as follows:
Year 3 – bands 1 to 6 Year 5 – bands 3 to 8 Year 7 – bands 4 to 9 Year 9 – bands 5 to 10.
The NMS is located at the second lowest band for each year level. Students whose results are in the NMS band are considered to have demonstrated the basic elements of literacy and numeracy for the year level. The 2012 NAPLAN outcomes report, providing results for all Queensland schools by test area, is available online at www.nap.edu.au/Test_Results/National_reports/index.html.
Upper two bands
In terms of the proportion of students who achieved results in the upper two bands of each year level, Queensland improved in 14 of the 16 result areas between 2008 and 2012. Also, in 2012, the highest ranking achieved by Queensland, relative to other states and territories, was in Years 3 and 9 grammar and punctuation and Years 7 and 9 numeracy, where Queensland ranked fifth KPI .
National Minimum Standard
Between 2008 and 2012, Queensland improved its NMS performance in 13 of the 16 result areas. The highest ranked result area in 2012 was Year 9 numeracy where Queensland ranked third relative to other states and territories KPI .
Mean scale scores
Between 2008 and 2012, Queensland improved its mean scale score performance in 14 of the 16 result areas. In 2012, the highest ranking achieved by Queensland, relative to other states and territories, was in Years 3 and 9 grammar and punctuation, Year 9 spelling and Years 7 and 9 numeracy, where Queensland ranked fifth.
Department of Education, Training and Employment | Annual Report 2012–13 31

Figures 7–9 show the percentage of all Queensland students at or above the NMS in reading, writing and numeracy compared to the nation.
Figure 7: NAPLAN 2008–2012 Reading comparative data: Queensland and Australia KPI
Year 3 Year 5 Year 7 Year 9
0
25
50
75
100
Queensland 2008 Australia 2008 Queensland 2009 Australia 2009 Queensland 2010
Australia 2010 Queensland 2011 Australia 2011 Queensland 2012 Australia 2012
Perce
ntage
of st
uden
ts
Figure 8: NAPLAN 2008–2012 Writing comparative data: Queensland and Australia KPI
Year 3 Year 5 Year 7 Year 9
0
25
50
75
100
Queensland 2008 Australia 2008 Queensland 2009 Australia 2009 Queensland 2010
Australia 2010 Queensland 2011 Australia 2011 Queensland 2012 Australia 2012
Perce
ntage
of st
uden
ts
Figure 9: NAPLAN 2008–2012 Numeracy comparative data: Queensland and Australia KPI
Year 3 Year 5 Year 7 Year 9
0
25
50
75
100
Queensland 2008 Australia 2008 Queensland 2009 Australia 2009 Queensland 2010
Australia 2010 Queensland 2011 Australia 2011 Queensland 2012 Australia 2012
Perce
ntage
of st
uden
ts
Source: Data is drawn from NAPLAN – National Assessment Program – Literacy and Numeracy National Report
Department of Education, Training and Employment | Annual Report 2012–13 32

Figures 10–12 show the percentage of Queensland state school students at or above the NMS in reading, writing and numeracy compared to the nation.
Figure 10: NAPLAN 2008–2012 Reading comparative data: Queensland state schools and Australia
Year 3 Year 5 Year 7 Year 9
0
25
50
75
100
Queensland state schools 2008 Australia 2008 Queensland state schools 2009 Australia 2009 Queensland state schools 2010 Australia 2010
Queensland state schools 2011 Australia 2011 Queensland state schools 2012 Australia 2012
Perce
ntage
of st
uden
ts
Figure 11: NAPLAN 2008–2012 Writing comparative data: Queensland state schools and Australia
Year 3 Year 5 Year 7 Year 9
0
25
50
75
100
Queensland state schools 2008 Australia 2008 Queensland state schools 2009 Australia 2009 Queensland state schools 2010 Australia 2010
Queensland state schools 2011 Australia 2011 Queensland state schools 2012 Australia 2012
Perce
ntage
of st
uden
ts
Figure 12: NAPLAN 2008–2012 Numeracy comparative data: Queensland state schools and Australia
Year 3 Year 5 Year 7 Year 9
0
25
50
75
100
Queensland state schools 2008 Australia 2008 Queensland state schools 2009 Australia 2009 Queensland state schools 2010 Australia 2010
Queensland state schools 2011 Australia 2011 Queensland state schools 2012 Australia 2012
Perce
ntage
of st
uden
ts
Source: Data is drawn from NAPLAN – National Assessment Program – Literacy and Numeracy National Report
Department of Education, Training and Employment | Annual Report 2012–13 33

Aboriginal and Torres Strait Islander student performance
In the 2012 NAPLAN results, Queensland Indigenous students ranked fifth on average in all jurisdictions across all result areas of literacy and numeracy. In absolute terms, a higher proportion of Queensland Indigenous students achieved the NMS than Indigenous students nationally in 19 of the 20 test results in 2012, and 20 of the 20 test results in 2011.
Across all year levels and result areas, 50.3 to 81.7 per cent of Indigenous students in Queensland achieved the NMS in 2012, compared with 60.8 to 86.9 per cent in 2011. Comparing 2008 and 2012, Queensland Indigenous students scored higher in 11 of the 16 test areas in 2012. The largest gains for Indigenous students occurred in Year 3, with improvements in four domains.
For Queensland Indigenous state school students, there was an improvement between 2008 and 2012 in the percentage of students achieving NMS in 11 of the 16 tested result areas. The largest gains for Indigenous students occurred in Year 3, with improvements in all domains.
Since 2008, the gap between Indigenous state school students and non-Indigenous state school students in Queensland narrowed in 12 of the 20 tested result areas in the percentage of students achieving NMS.
For mean scale scores, the strongest improvement for Queensland Indigenous state school students between 2008 and 2012 was Year 3 grammar and punctuation KPI . In absolute terms, Queensland Indigenous students have achieved higher mean scale scores in 18 of the 20 test results in 2012 when compared with Indigenous students across the nation. For each of the years 2008, 2009, 2010, 2011 and 2012 Queensland Indigenous students achieved a statistically higher result in Year 7 spelling than Australian Indigenous students.
In 2012, across all year levels and result areas, Indigenous students in Queensland achieved mean scale scores ranging from 320.1 to 530.0, compared with 335.5 to 533.9 in 2011. Comparing 2008 and 2012, the mean scale score for Queensland Indigenous students was higher in 13 of the 16 test results in 2012.
Department of Education, Training and Employment | Annual Report 2012–13 34

Figures 13–15 show the percentage of Queensland Indigenous students in all schools, compared with all Queensland students at or above the NMS in reading, writing and numeracy.
Figure 13: NAPLAN 2008–2012 Reading comparative data: Queensland students and Queensland Indigenous students
Year 3 Year 5 Year 7 Year 9
0
25
50
75
100
Queensland 2008 Queensland Indigenous 2008 Queensland 2009 Queensland Indigenous 2009
Queensland 2010 Queensland Indigenous 2010 Queensland 2011 Queensland Indigenous 2011
Queensland 2012 Queensland Indigenous 2012
Perce
ntage
of st
uden
ts
Figure 14: NAPLAN 2008–2012 Writing comparative data: Queensland students and Queensland Indigenous students
Year 3 Year 5 Year 7 Year 9
0
25
50
75
100
Queensland 2008 Queensland Indigenous 2008 Queensland 2009 Queensland Indigenous 2009
Queensland 2010 Queensland Indigenous 2010 Queensland 2011 Queensland Indigenous 2011
Queensland 2012 Queensland Indigenous 2012
Perce
ntage
of st
uden
ts
Figure 15: NAPLAN 2008–2012 Numeracy comparative data: Queensland students and Queensland Indigenous students
Year 3 Year 5 Year 7 Year 9
0
25
50
75
100
Queensland 2008 Queensland Indigenous 2008 Queensland 2009 Queensland Indigenous 2009
Queensland 2010 Queensland Indigenous 2010 Queensland 2011 Queensland Indigenous 2011
Queensland 2012 Queensland Indigenous 2012
Perce
ntage
of st
uden
ts
Source: Data is drawn from NAPLAN – National Assessment Program – Literacy and Numeracy National Report
Department of Education, Training and Employment | Annual Report 2012–13 35

Figures 16–18 show the percentage of Queensland Indigenous students from state schools compared with all Queensland students at or above the NMS in reading, writing and numeracy.
Figure 16: NAPLAN 2008–2012 Reading comparative data: Queensland students and Queensland state school Indigenous students
Year 3 Year 5 Year 7 Year 9
0
25
50
75
100
Queensland state school Indigenous 2008 Queensland 2008 Queensland state school Indigenous 2009 Queensland 2009
Queensland state school Indigenous 2010 Queensland 2010 Queensland state school Indigenous 2011 Queensland 2011
Queensland state school Indigenous 2012 Queensland 2012
Perce
ntage
of st
uden
ts
Figure 17: NAPLAN 2008–2012 Writing comparative data: Queensland students and Queensland state school Indigenous students
Year 3 Year 5 Year 7 Year 9
0
25
50
75
100
Queensland state school Indigenous 2008 Queensland 2008 Queensland state school Indigenous 2009 Queensland 2009
Queensland state school Indigenous 2010 Queensland 2010 Queensland state school Indigenous 2011 Queensland 2011
Queensland state school Indigenous 2012 Queensland 2012
Perce
ntage
of st
uden
ts
Figure 18: NAPLAN 2008–2012 Numeracy comparative data: Queensland students and Queensland state school Indigenous students
Year 3 Year 5 Year 7 Year 9
0
25
50
75
100
Queensland state school Indigenous 2008 Queensland 2008 Queensland state school Indigenous 2009 Queensland 2009
Queensland state school Indigenous 2010 Queensland 2010 Queensland state school Indigenous 2011 Queensland 2011
Queensland state school Indigenous 2012 Queensland 2012
Perce
ntage
of st
uden
ts
Source: Data is drawn from NAPLAN – National Assessment Program – Literacy and Numeracy National Report
Department of Education, Training and Employment | Annual Report 2012–13 36

Figures 19–21 show the percentage of Queensland Indigenous students from all schools compared with all Australian Indigenous students at or above the NMS in reading, writing and numeracy.
Figure 19: NAPLAN 2008–2012 Reading comparative data: Queensland Indigenous students and Australian Indigenous students
Year 3 Year 5 Year 7 Year 9
0
25
50
75
100
Queensland Indigenous 2008 Australian Indigenous 2008 Queensland Indigenous 2009 Australian Indigenous 2009
Queensland Indigenous 2010 Australian Indigenous 2010 Queensland Indigenous 2011 Australian Indigenous 2011
Queensland Indigenous 2012 Australian Indigenous 2012
Perce
ntage
of st
uden
ts
Figure 20: NAPLAN 2008–2012 Writing comparative data: Queensland Indigenous students and Australian Indigenous students
Year 3 Year 5 Year 7 Year 9
0
25
50
75
100
Queensland Indigenous 2008 Australian Indigenous 2008 Queensland Indigenous 2009 Australian Indigenous 2009
Queensland Indigenous 2010 Australian Indigenous 2010 Queensland Indigenous 2011 Australian Indigenous 2011
Queensland Indigenous 2012 Australian Indigenous 2012
Perce
ntage
of st
uden
ts
Figure 21: NAPLAN 2008–2012 Numeracy comparative data: Queensland Indigenous students and Australian Indigenous students
Year 3 Year 5 Year 7 Year 9
0
25
50
75
100
Queensland Indigenous 2008 Australian Indigenous 2008 Queensland Indigenous 2009 Australian Indigenous 2009
Queensland Indigenous 2010 Australian Indigenous 2010 Queensland Indigenous 2011 Australian Indigenous 2011
Queensland Indigenous 2012 Australian Indigenous 2012
Perce
ntage
of st
uden
ts
Source: Data is drawn from NAPLAN – National Assessment Program – Literacy and Numeracy National Report
Department of Education, Training and Employment | Annual Report 2012–13 37

International assessment
The Programme for International Student Assessment (PISA), the Trends in International Mathematics and Science Study (TIMSS), the Progress in International Reading Literacy Study (PIRLS) and the International Computer and Information Literacy Study (ICILS) provide information about Queensland's relative performance against other Australian jurisdictions in science.
Every three years, PISA collects information on the achievement of a sample of students aged 15 years and contextual information about the students, teachers and schools, and derives educational indicators that can monitor differences (and similarities) over time. In 2012, the PISA cycle focused the majority of the assessment on mathematical literacy. Testing for PISA 2012 Main Study occurred between 30 July and 7 September 2012. The PISA 2012 report is due for release in December 2013.
TIMSS and PIRLS are designed to inform educational policy and practice by providing an international perspective on teaching and learning in reading, mathematics and science. TIMSS reports every four years on the achievement of a sample of Year 4 and Year 8 students. In TIMSS 2011, 65 per cent and 66 per cent of Year 4 students achieved the intermediate benchmark in mathematics and science respectively, while for Year 8 students the intermediate benchmark was achieved by 58 per cent of students in mathematics and 69 per cent in science. PIRLS reports every five years on the achievement of a sample of Year 4 students. In PIRLS 2011, 70 per cent of students achieved the intermediate benchmark.
ICILS is the first international comparative study of student preparedness for study, work and life in the information age. Year 8 students from approximately 325 schools across Australia will participate in the ICILS testing for the first time in November 2013.
Student attendance
Student attendance can significantly affect a student's education, and can be associated with a student leaving school early or having limited employment and life opportunities. Schools have guidelines to address chronic absenteeism, school refusal and truancy. In many cases, schools may involve other agencies, including the Queensland Police Service, Child Safety Services (Department of Communities) and other local, non-government organisations to assist students and their families.
In 2012–13, the Every Day Counts campaign continued to raise awareness of the importance of regular school attendance. The Every Day Counts website provides brochures, posters, postcards and fact sheets for use by parents, students and the community. Case studies and resources such as an Attendance Improvement Plan and Student Attendance Profile are also available to assist schools in planning and documenting their approach to improving school attendance.
Departmental policies and procedures on attendance, absences and roll-marking provide guidance to all schools on improving attendance. These policies are supported by mechanisms for data collection within the OneSchool system. The department continues to build on the range of reporting available to schools to assist them in monitoring and managing student attendance. Many schools use automated text messaging services to alert parents when students are absent from school. Schools routinely follow up with parents when a persistent pattern of non-attendance is evident.
Table 7: Queensland state school attendance rates by regionRegion 2008 2009 2010 2011 2012
Central Queensland 90.5% 90.4% 90.5% 90.4% 90.8%Darling Downs South West 91.1% 90.5% 90.4% 90.3% 91.0%Far North Queensland 88.7% 88.6% 89.3% 88.1% 88.1%Metropolitan 92.6% 92.2% 92.3% 92.3% 92.6%North Coast 91.3% 90.6% 90.9% 90.9% 90.7%North Queensland 89.5% 89.0% 89.6% 88.3% 89.4%South East 90.8% 90.5% 91.0% 91.1% 91.0%Queensland 91.1% 90.7% 91.0% 90.9% 91.1%
Source: Department of Education, Training and Employment
Notes: The attendance calculations include all full-time students, providing students were enrolled for at least some period during
Semester 1 and were still enrolled as at August Census. The student attendance rate is based on Semester 1 each year and is generated by dividing the total of full-days and part-days
that students attended, and comparing this to the total of all possible days for students to attend, expressed as a percentage.
Department of Education, Training and Employment | Annual Report 2012–13 38

It should be noted that during 2009, the Human Swine Influenza Pandemic (H1N1) occurred and in 2011 extreme weather events impacted much of the state.
Indigenous student school attendance
There is evidence to suggest that the more regularly students attend school, the greater their success in learning. In 2012, Queensland had 29.4 per cent of the full-time Indigenous students in Australia. The 2012 gap between Queensland Indigenous state school student attendance rates and Queensland non-Indigenous state school student attendance rates is 7.3 percentage points KPI . This is why school attendance for Indigenous students is a major priority for all Queensland state schools.
State school educationDuring 2012, the department provided services to 321 025 full-time students in state primary schools, 173 280 full-time students in state secondary schools and 3708 full-time students in state special schools as indicated in Table 8. In 2012, Prep was recognised as the first year of schooling in all Queensland state schools.
Table 8: Number of full-time students in Queensland state schoolsSchool education 2008 2009 2010 2011 2012
Primary (Prep–Year 7) 307 143 308 597 309 661 313 413 321 025Secondary (Year 8–Year 12) 169 577 172 726 172 749 172 576 173 280Special 3 130 3 292 3 388 3 529 3 708Total 479 850 484 615 485 798 489 518 498 013
Source: Department of Education, Training and Employment
Note: 2008–09 primary and secondary enrolments include ungraded students. Full-time enrolments as at August of each year.
The 2012 School Opinion Survey showed that 95.2 per cent of parents of students in state schools agreed that their child's school is a good school KPI .
Senior schooling
Youth transitions and attainment
Strategies: Provide multiple pathways and diverse learning experiences, including school-based
apprenticeships and traineeships to engage senior students and increase Year 12 attainment Develop and support more effective pathways for all students from school into tertiary
education and training institutions, and into work
School education: Years 10–12
Queensland’s compulsory schooling requirement means that all young people must remain in school until they finish Year 10 or turn 16 years of age, whichever comes first. The compulsory participation phase requires all young Queenslanders to be engaged in education or training for a further two years or until they have attained one of the following:
the age of 17 years a Queensland Certificate of Education (QCE) (or equivalent) a Certificate III vocational qualification (or higher).
Young people who are working at least 25 hours a week can leave education or training to enter the workforce during this period. Queensland's compulsory participation requirement meets the strengthened participation requirements mandated at a national level through the National Partnership Agreement on Youth Attainment and Transitions. To support the compulsory participation phase, the department provides young people with opportunities to set education and career goals, and to work towards those goals in a broad range of education settings, including school, TAFE and other training.
In Queensland, as part of the commitment to improving young people's attainment and transitions, 15 to 19 year olds not at school are entitled to a government-subsidised training place (subject to admission requirements and course availability). The department remains committed to improving young people's
Department of Education, Training and Employment | Annual Report 2012–13 39

attainment and transitions to ensure that education and training entitlements, such as subsidised training places, are accessed by young people.
The number of students enrolled in Years 10 to 12 in state schools increased by 0.4 per cent between 2011 and 2012 with 100 277 full-time students. There have been steady increases in recent years, with students enrolled in Years 10 to 12 increasing by 6.0 per cent since 2008.
The apparent retention rate of students from Years 10 to 12 is demonstrated in Figure 22. The apparent retention rates are a broad but limited indicator of young people's participation in secondary school education or its equivalent. It is only one measure of positive engagement for young people, who may choose to participate in a range of school, training or work options. The 2012, Year 10 to 12 apparent retention rate for all Queensland schools (82.2 per cent) was higher than for Australia overall (79.3 per cent). In 2012, the apparent retention rate for female students in Years 10 to 12 in all Queensland schools was higher, at 84.7 per cent, than male students, at 79.9 per cent. In Queensland, 60.9 per cent of Year 10 to 12 students attended a state school.
Figure 22: Apparent retention rates of Queensland and Australian students in Years 10–12, 2008–12
2008 2009 2010 2011 2012
0
20
40
60
80
100
Queensland Australia
Perce
ntage
of st
uden
ts
Source: ABS, Schools, Australia
Note: Queensland state and non-state school students compared with Australian state and non-state school students.
Indigenous participation at school
The department is committed to closing the gap in Year 12 or equivalent attainment, and has a range of strategies to retain Indigenous senior students at school. Figure 23 demonstrates that the Queensland Indigenous student Year 10 to 12 apparent retention rate of 62.4 per cent in 2012 was still above the national figure of 53.3 per cent. The number of Queensland Indigenous young people in Years 10 to 12 in 2012 remains relatively steady when compared to the previous year.
Department of Education, Training and Employment | Annual Report 2012–13 40

Figure 23: Apparent retention rates for Indigenous students in Years 10–12, 2008–12, Queensland and Australia
2008 2009 2010 2011 2012
0
20
40
60
80
100
Queensland Australia
Perce
ntage
of st
uden
ts
Source: ABS, Schools, Australia
Note: Queensland state and non-state school Indigenous students compared with Australian state and non-state school Indigenous
students.
School-based apprenticeships and traineeships
School-based apprenticeships and traineeships (SATs) are designed to support student career choices and are available in a range of fields including rural, retail, business, building, hospitality, hairdressing, automotive and arts. SATs provide high school students, typically in Years 11 and 12, with:
a pathway to transition from school to employment after school the opportunity to incorporate employment with training towards a recognised qualification credit towards their QCE.
Many students can complete a school-based traineeship while at school, depending on the vocational qualification and when they commence. A school-based apprenticeship allows students to achieve up to one-third of an apprenticeship while at school, providing a head start into a full-time or part-time apprenticeship and trade career. National Centre for Vocational Education Research (NCVER) figures reflect that Queensland continues to be a national leader in the uptake of SATs. Queensland consistently accounts for around half of all SAT commencements in Australia. The number of SAT commencements in Queensland is projected to be 9300 in 2012–13, a growth of nearly nine per cent since 2008–09.
Figure 24: Number of school-based apprenticeship and traineeship commencements
2008-09 2009-10 2010-11 2011-12 2012-13
0
2000
4000
6000
8000
10000
12000
2681 271
3
2668
2131
1900
5884
5915
7328
8613
7300
Apprenticeship Traineeship
Source: Department of Education, Training and Employment – Contract of Training Database (DELTA)
Notes: Includes new commencements and re-commencements. The 2012–13 data are projected results. The sum of apprentices and trainees does not equal total due to rounding. While lower than the previous year, the level of commencements in 2012–13 remains strong and reflects the impacts of changing
economic conditions.
Department of Education, Training and Employment | Annual Report 2012–13 41

In 2012, 15.4 per cent of students had completed or were completing a SAT at the end of Year 12. This represented a slight increase on the 2011 figure of 14.1 per cent of Year 12 students. SAT completions have also increased by over 60.0 per cent since 2008–09, from 4145 completions in 2008–09 to a projected 6800 in 2012–13. These figures include those who have transitioned from SATs to other arrangements and subsequently completed.
Figure 25: Number of school-based apprenticeship and traineeship completions
2008-09 2009-10 2010-11 2011-12 2012-13
0
1000
2000
3000
4000
5000
6000
7000
8000
568 62
3
789
916
860
3577
4016 41
64
4859
5900
Apprenticeship Traineeship
Source: Department of Education, Training and Employment – Contract of Training Database (DELTA)
Notes: The 2012–13 data are projected results. Completions are for those who commenced training as a SAT.
Figure 26 shows the percentage of Queensland students completing Year 12 with a VET qualification has increased markedly over the past five years, from 52.2 per cent in 2008 to 66.4 per cent in 2012.
Figure 26: Proportion of Year 12 Queensland students with a VET qualification
2008 2009 2010 2011 2012
0
20
40
60
80
52.2
56.9
61.964.2
66.4
Perce
ntage
of st
uden
ts
Source: Queensland Studies Authority (as at 2 May 2013)
Department of Education, Training and Employment | Annual Report 2012–13 42

The proportion of Queensland 20 to 24 year olds who completed Year 12 (or equivalent) or attained a Certificate II or above increased from 83.0 per cent in 2011 to 85.8 per cent in 2012 (see Figure 27). These results are statistically similar to the Australian figures over the same period (84.1 per cent to 85.9 per cent).
Figure 27: Proportion of 20 to 24 year olds having attained Year 12 or equivalent or Certificate II or above (both state and non-state schools) KPI
2008 2009 2010 2011 2012
0
20
40
60
80
100
Perce
ntage
of Q
ld po
pulat
ion ag
ed 20
to 24
Source: ABS Education and Work Australia May 2012 (Catalogue No. 6227.0.55.003) (Additional Datacube)
Indigenous school-based apprenticeships and traineeships
SATs continue to provide valuable learning opportunities for Indigenous students, supporting pathways to employment or further education and training. Figure 28 shows that 811 Indigenous students commenced a SAT in 2012, which is 38.6 per cent more than the 585 commencements in 2007. The number of SATs completed by Indigenous students in 2012 is displayed in Figure 29.
Figure 28: Number of Indigenous school-based apprenticeship and traineeship commencements
2008-09 2009-10 2010-11 2011-12 2012-13
0
200
400
600
800
1000
1200
Apprenticeship Traineeship Total
Source: Department of Education, Training and Employment – Contract of Training Database (DELTA)
Notes: Includes new commencements and re-commencements. The 2012–13 data are projected results. The sum of apprentices and trainees may not equal total due to rounding. While lower than the previous year, the level of commencements in 2012–13 remains strong and reflects the impacts of changing
economic conditions.
Department of Education, Training and Employment | Annual Report 2012–13 43

Figure 29: Number of Indigenous school-based apprenticeship and traineeship completions
2008-09 2009-10 2010-11 2011-12 2012-13
0
100
200
300
400
500
600
700
Apprenticeship Traineeship Total
Source: Department of Education, Training and Employment – Contract of Training Database (DELTA)
Note: Completions are for those who commenced training as a SAT. The 2012–13 data are projected results.
Queensland Certificate of Education
The QCE is Queensland’s senior schooling qualification administered by the QSA. The QCE offers flexibility in students’ learning options, including:
senior school subjects VET SATs recognised workplace and community learning university subjects undertaken while at school.
The QCE provides young people with a valuable passport to further education, training and employment. The QCE indicates to employers that an individual has achieved a significant amount of learning at a set standard and a pattern which meets literacy and numeracy requirements. In December 2012, 86.1 per cent of all Year 12 students graduated with a QCE (see Table 9). Students who did not meet the QCE requirements at the end of Year 12 can continue to work towards their certificate for up to nine years after leaving school.
Table 9: Proportion of all Queensland students awarded a Queensland Certificate of Education (QCE) by the end of Year 12Measure 2008 2009 2010 2011 2012
Students awarded a QCE by the end of Year 12 75.5% 78.2% 81.0% 84.0% 86.1%Source: Queensland Studies Authority (as at 2 May 2013)
Queensland Certificate of Individual Achievement
The Queensland Certificate of Individual Achievement (QCIA) recognises and reports the learning achievements of students who have completed at least 12 years of education. To be eligible for a certificate, students need to have impairments or difficulties in learning. The certificate provides these students with a summary of their skills and knowledge, which they can present to employers and training providers. In 2012, 550 state school students received a QCIA and 1283 state school students with disabilities completed 12 years of schooling.
Year 12 outcomes
Queensland students have shown a broad pattern of improved outcomes, leaving schools with a variety of qualifications and ready to continue learning or enter the workforce. Year 12 outcomes reports are released by the QSA. The 2012 Year 12 outcomes report shows that Queensland’s Year 12 students are graduating from high school with the skills and qualifications to follow a range of rewarding work, further education and training pathways. In 2012, 94.5 per cent of Year 12 students in state schools are completing or completed a SAT or were awarded QCE, IBD or VET qualifications, compared with 95.0% for all schools.
Department of Education, Training and Employment | Annual Report 2012–13 44

Overall achievement of Year 12 completion has improved as students have the opportunity to move between learning outcomes, with study pathways suited to learning styles. Overall Positions (OPs) provide a statewide rank order of students from 1 (highest) to 25 (lowest). OPs show how well students have performed in their senior studies when compared with the performances of all other OP-eligible students in Queensland.
The International Baccalaureate Diploma (IBD) is an internationally recognised pre-university level qualification that allows subjects to be accelerated and graduating students to study at Australian tertiary institutes, as well as overseas universities.
OPs and IBDs are used in the selection of students for tertiary education courses. An OP 1 to 15 is the range generally used to indicate those students most likely to succeed at tertiary level. In 2012, 21 065 students achieved an OP of 1 to 15 or an IBD, an increase on previous years as shown in Figure 30. This indicates that more students had the option of gaining entrance into a tertiary education course through these pathways.
Figure 30: Proportion of Year 12 Queensland OP-eligible or International Baccalaureate students with an OP 1 to 15 or an International Baccalaureate Diploma
2008 2009 2010 2011 2012
0
20
40
60
80
100
72.1 73.3 75.1 75.979.1
Perce
ntage
of st
uden
ts
Source: Queensland Studies Authority (as at 2 May 2013)
Note: IBD award has only been included in this data since 2008.
In June 2013, the department engaged the Australian Council of Educational Research (ACER) to conduct a major independent review of Queensland senior assessment and reporting and OP tertiary entrance processes. The review’s commencement forms part of the Government’s Six month action plan (January – June 2013).
Queensland Year 12 destinations
The department undertakes the Next Step survey of students who completed Year 12 during the previous year from state, Catholic and independent schools. Results identify the future employment, study and life choices that these students are making. The results of the survey also give an insight into how well schools are preparing students for adult life, and help to formulate policy and develop services. The survey showed that 89.2 per cent of young Queenslanders were engaged in education, training or employment six months after completing Year 12 in 2011.
Due to the legislative requirement to table agency annual reports in September 2013, 2013 Next Step survey data was not available at the time of printing. When the data becomes available, it will be uploaded to the DETE online annual report at www.dete.qld.gov.au/publications/annual-reports/12-13/index.html.
Indigenous student destinations
The results of the 2013 Next Step survey provide information about post-school destinations of Indigenous students who completed Year 12 in 2012. When the 2013 Next Step survey data becomes available, it will be uploaded to the DETE online annual report at www.dete.qld.gov.au/publications/annual-reports/12-13/index.html
Department of Education, Training and Employment | Annual Report 2012–13 45

Teaching practice
Strategies: Transition Year 7 to secondary Support high-quality teaching practices focusing on improvement and achievement of every
student Provide a safe, supportive, inclusive and disciplined learning environment Foster collaboration within and across schools to optimise instructional practices Use system and local performance data to drive improvement and support differentiated
learning
Year 7 to secondary
From 2015, Year 7 will become the first year of high school across Queensland. Moving Year 7 to high school is a significant step in the ongoing transformation of Queensland’s education system. This move is the culmination of changes in education over the past decade, including the introduction of full-time Prep in 2007, which added an extra year of schooling to our education system. The school entry age was also raised by six months, which means that from 2015 more than half of Queensland students will turn 13 years of age and be in their eighth year of schooling, which is the right time to be entering high school.
In preparation for the implementation of this major reform, the department has worked with both the Catholic and Independent sectors to plan for the statewide move in 2015. During 2012–13, the department continued to pilot Year 7 in a secondary setting. The experiences of the pilot schools will inform the statewide approach for the move in 2015. Murrumba State Secondary College was the first state high school to pilot Year 7. In 2013, a further 18 pilot schools welcomed their first Year 7 students. Information about the state schools taking part in the Year 7 pilot program is available online at www.flyingstart.qld.gov.au/Pages/home.aspx.
Throughout 2012–13, the department worked with state schools and regions to plan and prepare for the introduction of a phase of education known as Junior Secondary. Junior Secondary is an intentional approach to the academic, social and emotional needs of state school students in Years 7, 8 and 9.
Teaching and Learning Audits
In 2012–13, the department conducted Teaching and Learning Audits in 542 Queensland state educational institutions. To ensure a consistent and evidence-based audit process, the Teaching and Learning Audit Instrument, developed by ACER, is used to provide high-quality feedback on key curriculum, teaching, learning and assessment practices in each school. Following audits, each school was provided with a detailed report relating to its progress against system expectations and accountabilities. The reports were designed to inform future developmental needs of each school, as well as developmental needs of the system.
Science Spark
The Science Spark initiative focused on enhancing the teaching of science in state primary schools. This included the provision of funded science professional development to all Years 4 to 7 teachers (one day) as well as in-class support modelling effective teaching strategies within an inquiry approach. While the initiative was completed by June 2012, the 15 Regional Managers (Science) continued to work in the regions to further support science teaching and learning until December 2012.
Student support
Inclusive education
Inclusive education requires schools to provide quality support and services that engage all students, teachers and members of the school community. Schools are committed to ensure that all students feel a sense of belonging, interact respectfully with others, appreciate diversity and involve members of the community. The department's policies and programs aim to:
assist schools to improve the achievement, participation and retention of marginalised students ensure all students acquire the knowledge and skills required for working and living with people from
all backgrounds
Department of Education, Training and Employment | Annual Report 2012–13 46

support students to develop healthy personal relationships actively shape social, economic and political life.
Students with disability
The department is committed to providing high-quality education across primary, secondary and special schools for students with disability and educational support needs. A broad range of educational programs and support services, including specialist teachers and teacher aides, therapy, nursing and guidance services are available in primary, secondary and special schools.
The Autism Spectrum Disorder (ASD) – Online Resource Transition Package is a joint project between the department, Autism Queensland and the Autism Early Intervention Outcomes Unit (AEIOU) Foundation. Throughout 2012–13, the online resource package continued to assist children with ASD to successfully transition to Queensland state schools. Further information is available online at www.education.qld.gov.au/asd-online-resource-kit/index.html.
As Table 10 demonstrates, the department supports a growing number of students with disabilities each year.
Table 10: Summary data – students with disabilityStudents with disabilities 2008 2009 2010 2011 2012
Number of students with disabilities identified as needing specialist support enrolled in state primary and secondary schools1
17 497 18 944 19 316 20 127 21 063
Number of students in special schools2 3198 3379 3506 3665 3 892Source: Department of Education, Training and Employment
Notes:1. Full-time enrolments as at August of each year.2. Includes Prep students attending a special school.
Table 11: Summary data – schools supporting students with disabilityStudents with disabilities 2009 2010 2011 2012 20132
Number of state schools providing special education programs (SEP)1
545 558 567 600 609
Number of state special schools3 47 43 43 43 43Source: Department of Education, Training and Employment
Notes:1. Schools with multiple SEPs will be counted only once. Prior to 2008, programs were identified by centre types — SEU, SEU (SEC),
SEDU and SEDC, and also included schools with an associated service of SEC. Schools with multiple programs (of any type above) will be counted only once. Special schools that also provide a SEP are not included in the “Number of state schools providing SEP” figure (in 2013 there are 11 such special schools).
2. Official school counts are reported in August of each year. The 2013 count is a preliminary figure as at 10 May 2013.3. During 2010, the Mater Hospital School, the Royal Brisbane Hospital School, the Barrett Adolescent Centre and the Tennyson
Special School, previously classified as special schools, were reclassified as special purpose schools. This reduced the special school count by four. The 43 special schools include Innisfail State College – Diverse Learning Centre, a special campus of Innisfail State College.
The 2012 School Opinion Survey showed that 98.5 per cent of parents of students in special schools agreed that their child's school is a good school. These opinions might have been influenced by the specialised nature of the programs that special schools offer for students with disability.
Low SES communities
During 2012–13, the department continued to implement strategies to improve student learning outcomes in disadvantaged communities through the Low SES School Communities National Partnership Agreement. These strategies included:
incentives to attract high-quality teachers and principals to participating schools greater flexibility for principals in staffing, management arrangements and school budgets more flexible school operational arrangements innovative and tailored learning opportunities strengthened school accountability improved external partnerships with parents, other schools, businesses and communities access to a range of extended services.
Department of Education, Training and Employment | Annual Report 2012–13 47

Youth Support Coordinator Initiative
The Queensland Government is committed to supporting all young people to complete their education in order to enhance opportunities for further education and sustainable employment. The Youth Support Coordinator Initiative supports at-risk 14 to 17 year olds to stay at school or make a successful transition to further education, training or employment. In 2012, the Youth Support Coordinator Initiative supported 11 351 young people.
Young carers
The department appreciates the challenges faced by young carers as they seek to continue their education while assuming significant family responsibilities. The department is committed to recognising and supporting young carers to help them maintain a balance between their family responsibilities and their education.
During 2012–13, the department continued to provide services and activities under the Carers Charter, these included:
providing school communities with support and information on young carers via electronic networks embedding information around the roles and value of carers and their value to the community into all
of their training across the Community Services, Aged Care and Disability Training packages providing a range of educational programs, support, strategies and alternative options in inclusive
settings to support student attendance and engagement in education during the compulsory schooling and compulsory participation phases
providing flexible training through the TAFE system to support young carers to continue their education
including carers in policy and service delivery planning and development at the individual and system level, where carers’ interests are affected.
Students in out-of-home care
The department makes a significant contribution to the wellbeing of students in out-of-home care, who can face additional challenges in their schooling. The Department of Communities (Child Safety Services) provides some additional funding under the Education Support Funding Program to improve the educational outcomes of students in out-of-home care. Departmental staff work cooperatively with the student, child safety officers, foster carers, specialist support staff and others with an interest in the wellbeing of individual students to develop education support plans. The department has provided enhanced functionality in OneSchool for the recording and tracking of students in out-of-home care that require an education support plan and is working with the Department of Communities, Child Safety and Disability Services to improve the quality and timeliness of the information recorded.
Support for students from EAL/D backgrounds
English as an additional language or dialect (EAL/D) students are those whose main language of proficiency is a language or dialect other than Standard Australian English (SAE), and who require additional support to assist them to develop proficiency in SAE. The department’s P–12 curriculum, assessment and reporting framework specifies how schools provide for students learning EAL/D by:
identifying and monitoring their development of English language proficiency using the Queensland Bandscales for EAL/D Learners
supporting their learning as specified in Policy statement: Curriculum provision to students with diverse learning needs.
In 2012–13, the department provided more than 210 FTE teachers and almost 2900 teacher aide hours per week to support EAL/D students.
The department recognises that Aboriginal and Torres Strait Islander students are often learners of SAE as a second language. The Aboriginal and Torres Strait Islander Languages Statement supports schools in understanding and valuing the language backgrounds of Indigenous students in our schools. The statement recognises that an increased awareness of Aboriginal and Torres Strait Islander students' languages will contribute towards greater learning outcomes for students.
The After Hours Ethnic Schooling (AHES) program is managed by the department and consists of community-based, not-for-profit organisations which provide classes in a number of community languages and cultures that make up Queensland’s multicultural diversity. The AHES program is recognised as a
Department of Education, Training and Employment | Annual Report 2012–13 48

complementary provider of languages education in Australian schools. In 2012, there were 30 funded AHES establishments teaching 12 languages to 4123 students.
Isolated students (distance education)
Half of Queensland's state schools are located in rural and remote areas. These schools cater for approximately one-quarter of all students in the public education system. The department supports students from regional and remote Queensland areas through innovative delivery models and options, such as:
seven state schools of distance education (SDE) digitised workbooks that can be used in hardcopy, offline and online, including delivery through
student courses available through 24/7 access to the Learning Place regional technology managers.
Australian Curriculum resources have been adapted by the SDE for use by distance education teachers and home tutors to use with their students. These independent learning materials are specifically designed to be self-contained to support online or offline usage by SDE students, parents and home tutors. These materials have been updated to include guide sheets to support home tutors with the ‘new’ language of the Australian Curriculum, step-by-step instructions and answer sheets to model appropriate student responses. They also identify core and non-core activities to enable delivery of the required content within a given timeframe.
Youth in detention centres
The department provides a range of education and training programs to students in youth detention centres. As well as general education programs, the department provides a range of VET courses and access to higher-level vocational qualifications as required.
Home education
Home education is a recognised and lawful alternative for educating children in Queensland. At the 2012 August census, there were 951 children registered for home education. Further information about home education in Queensland is available at www.education.qld.gov.au/parents/home-education/index.html.
Positive schools and studentsAll students have a right to learn in classrooms free from disruption and poor behaviour and teachers a right to teach in a safe and supportive school environment. The department is committed to ensuring Queensland state schools provide positive, safe and supportive learning environments for all students and staff. The Queensland Government’s Great teachers = Great results action plan will cut red tape and give greater flexibility and increased power to principals. The reforms include:
introducing behaviour contracts with students and their parents which outline clear and agreed behaviour expectations and consequences
removing unnecessary red tape so that principals can develop localised and meaningful approaches to discipline such as requiring a student to undertake beneficial tasks in the community or attending a Saturday detention as a consequence for inappropriate behaviour
building relationships with Special Assistance Schools to provide alternative school environments and specialist support for students with complex behaviour needs
auditing every state school between July 2013 and November 2014 to ensure they have a strong approach to discipline.
A key theme of these reforms is the goal to give state school principals more independence and flexibility to use disciplinary measures that meet the specific behavioural needs of the student, in consideration of the family and community context.
A broad range of strategies and responses are used by state schools to address unacceptable student behaviour. These may include suspension, expulsion and cancellation of enrolment. Queensland state schools must record any unacceptable behaviour that results in a school disciplinary absence. Table 12 provides a summary of state school disciplinary absences during 2012.
Department of Education, Training and Employment | Annual Report 2012–13 49

Table 12: School disciplinary absences by reason of absence, 2012
ReasonShort suspension Long suspension Exclusion Cancellation
Total incidents
Avg. rate per 1000 students per term
Total incidents
Avg. rate per 1000 students per term
Total incidents
Avg. rate per 1000 students per term
Total incidents
Avg. rate per 1000 students per term
Absences 943 0.5 69 0.0 11 0.0 - -Other conduct prejudicial to the good order and management of the school (including serious conduct)
8209 4.1 1334 0.7 247 0.1 - -
Persistently disruptive behaviour adversely affecting others
5038 2.5 620 0.3 96 0.0 - -
Physical misconduct 17 689 8.8 2369 1.2 417 0.2 - -Property misconduct 3234 1.6 548 0.3 74 0.0 - -Refusal to participate in the program of instruction
4107 2.0 353 0.2 34 0.0 1249 0.6
Substance misconduct involving an illicit substance
169 0.1 286 0.1 267 0.1 - -
Substance misconduct involving tobacco and other legal substances
2186 1.1 301 0.1 38 0.0 - -
Verbal or non-verbal misconduct 12 949 6.4 1340 0.7 147 0.1 - -
All reasons 54 524 27.0 7220 3.6 1331 0.7 1249 0.6Source: Department of Education, Training and Employment
Notes: School disciplinary absence (SDA) rates of less than 0.05 are rounded to 0.0. A dash (-) indicates that a reason is not applicable to the SDA type. The SDA data presented comprises the total of short suspensions (1–5 days), long suspensions (6–20 days), suspensions with
recommendation for exclusion, and cancellations of enrolment. The enrolments used to calculate the SDA rates for 2012 were based on February, August and November 2012 enrolment data. The information is displayed in terms of aggregate incident counts and the average rate of SDAs per 1000 students per term. The
data does not represent the outcomes of any related appeal decisions. Incidents: Count of incidents resulting in an SDA during 2012. This does not represent the number of students who received a disciplinary absence as a student can receive more than one during the year.Average rate per 1000 students per term: An effective average number of SDA incidents per 1000 students per term for the reporting period. Due to rounding, discrepancies may occur between sums of the component items and totals in the average rate per 1000 figures.
Department of Education, Training and Employment | Annual Report 2012–13 50

Improving the educational environment and student wellbeing
During 2012–13, the department continued to improve the educational environment, and student wellbeing, through implementation of the Learning and Wellbeing Framework for all Queensland state schools. The framework is available online at www.dete.qld.gov.au/initiatives/learningandwellbeing/.
Table 13 provides a summary of directives issued under the Education (General Provisions) Act 2006.
Table 13: Summary of directions and orders – Queensland schools
Type of direction or orderDirections or orders given to personnel other than children
2012–13
Directions or orders given to children
2012–13
State and non-state schools
Prohibition from entering premises of all state educational institutions and non-state schools for up to one year — section 352
0 0
State schools
Direction about conduct or movement — section 337 145 0
Direction to leave and not re-enter — section 339 6 0
Prohibition from entering premises for up to 60 days — section 340 5 0
Prohibition from entering premises for more than 60 days but not more than one year — section 341
0 0
Review of direction — section 338:
the number of review applications made 10 0
the number of directions confirmed 9 0
the number of directions cancelled 1 0
Prohibition from entering premises of all state education institutions for up to one year — section 353
0 0
Non-state schools
Direction about conduct or movement — section 346 12 1
Direction to leave and not re-enter — section 348 1 0
Prohibition from entering premises for up to 60 days — section 349 4 0
Prohibition from entering premises for more than 60 days but not more than one year — section 350
1 0
Review of direction — section 346–347:
the number of review applications made 0 0
the number of directions confirmed 0 0
the number of directions cancelled 0 0Source: Department of Education, Training and Employment
Note: Sections refer to the Education (General Provisions) Act 2006, Chapter 12, Parts 6–8.
Department of Education, Training and Employment | Annual Report 2012–13 51

Principal leadership and school capability
Strategies: Further develop school leadership to promote inclusive environments and foster a culture of
high expectations and enhanced school performance Cultivate instructional leadership that builds capability and collaboration in teaching and
learning practice with a commitment to sustained improvement Support principals through moderated supervision that develops collective capacity and
ensures consistency of practice
Principals’ Capability and Leadership Framework
The department’s Principals' Capability and Leadership Framework (PCLF) continues to provide consistent professional language to describe the leadership knowledge, skills and behaviours required of principals to effectively lead an explicit school improvement agenda in Queensland small, medium and large schools. Capability and leadership frameworks are now available for deputy principals and heads of programs. The frameworks are available online at www.education.qld.gov.au/staff/development/performance/toolkit/capability-frameworks.html.
Further information about principal leadership can be found in Section 6 – Corporate Services.
Strong futures for Aboriginal and Torres Strait Islander studentsIn 2012, more than 51 000 Aboriginal and Torres Strait Islander full-time students were enrolled in Queensland schools – which is nearly one-third (29.4 per cent) of Australia's Aboriginal and Torres Strait Islander student population. More than three-quarters (84.3 per cent) of Queensland’s Aboriginal and Torres Strait Islander full-time students were enrolled in Queensland state schools in 2012 – making up 8.7 per cent of all Queensland state school students.
Aboriginal and Torres Strait Islander students enrolled in Queensland state schools continue to increase. Over the past five years (from 2008 to 2012) Aboriginal and Torres Strait Islander enrolments grew by 12.3 per cent, compared with 3.8 per cent for all students. In 2012, approximately 29 370 students (67.9 per cent) of state school Aboriginal and Torres Strait Islander students were enrolled in state primary year levels, and almost 13 570 students (31.4 per cent) were enrolled in state secondary year levels.
There were close to 300 Aboriginal and Torres Strait Islander students (0.7 per cent) enrolled in special schools. Queensland had the highest number of Aboriginal and Torres Strait Islander students enrolled in Year 12 state schools in Australia during 2012, with more than 1682 students.
Aboriginal and Torres Strait Islander Education Action Plan
The Aboriginal and Torres Strait Islander Education Action Plan 2010–2014 commits all governments in Australia to a unified approach to closing the gap in education outcomes between Indigenous and non-Indigenous students. Under the action plan, each state and territory is to identify focus schools to ensure that those Aboriginal and Torres Strait Islander students most in need benefit from education reforms. There have been 206 focus state schools identified in Queensland, accounting for more than 16 900 Aboriginal and Torres Strait Islander primary school students.
In 2012–13, $10 million of Commonwealth funds were allocated under the Investing in Focus Schools Agreement to 61 specially selected Queensland state focus schools to complement and accelerate implementation of local level actions in the engagement and connections, attendance, and literacy and numeracy domains of the action plan.
Approximately $11 million of Commonwealth funds were allocated under the Focus Schools Next Steps initiative to a further 35 Queensland focus schools. The initiative assists the schools to implement strategies to improve school attendance, classroom engagement and academic achievement of Aboriginal and Torres Strait Islander students.
Under the Australian Government’s Closing the Gap Intensive Literacy and Numeracy program, funding has been allocated to selected focus schools for three Queensland projects:
Principals as Literacy Leaders with Indigenous Communities
Department of Education, Training and Employment | Annual Report 2012–13 52
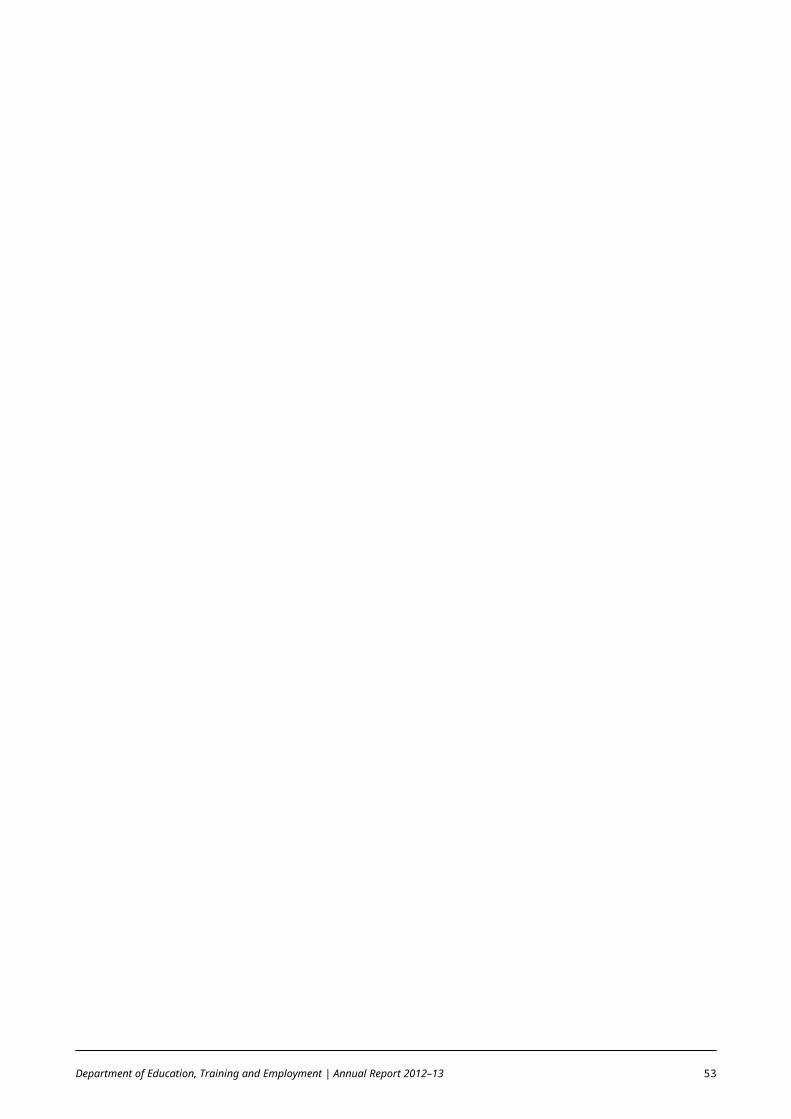
Moving Together Bridging the Language Gap.
The list of Queensland focus schools is available online at www.dete.qld.gov.au/indigenous/strategies/ed-action-plan.html.
Closing the Gap Education Grants
Closing the Gap Indigenous Education Grants provide support to regions to implement the Closing the Gap Education Strategy. Regions either distribute these funds to schools to implement initiatives or retain them to implement programs and activities that contribute to the closing of the educational performance gap for Aboriginal and Torres Strait Islander students enrolled in state schools.
Embedding Aboriginal and Torres Strait Islander Perspectives
The Embedding Aboriginal and Torres Strait Islander Perspectives (EATSIPS) Framework offers educational administrators and teachers the strategies to embed Aboriginal and Torres Strait Islander perspectives across all areas of school practice, giving all students access to a balanced educational curriculum. All state schools are supported in implementing EATSIPS by regional project officers and facilitated online professional development.
Cape York Aboriginal Australian Academy
The Cape York Aboriginal Australian Academy is a unique partnership between Cape York Partnerships and the department to improve the educational outcomes of Aboriginal and Torres Strait Islander students in three Cape York communities. The trial in Aurukun, Coen, and Hope Vale was extended until the end of 2013. An evaluation of the trial commenced in October 2012.
Transition Support Service
The Transition Support Service assists Aboriginal and Torres Strait Islander students to make the transition from the primary phase of schooling in their remote home communities to secondary schooling in large metropolitan or urban areas. The department supported students from Cape York and Palm Island while they studied away from home at secondary boarding schools. Throughout 2012, a total of 500 students were case managed by the Transition Support Service. In 2012, 428 students were supported to transition to 30 boarding schools. Of these students 53 per cent were retained at boarding schools and 23 per cent were supported to re-engage in state schooling following de-enrolment from boarding school. Transition support officers assist students and their families to select, apply to and enrol at secondary school and assist students to manage transition challenges while attending boarding school.
Deadly Ears Action Plan 2012–13
The Deadly Ears program is a statewide ear health program for Aboriginal and Torres Strait Islander children. As part of the department's commitment to the Deadly Ears, Deadly Kids, Deadly Communities 2009–2013 the Deadly Ears, Deadly Kids, Deadly Communities Action Plan 2012–13 was developed to address ear health issues that impact on the presence, participation and achievement of Aboriginal and Torres Strait Islander children in Queensland schools.
The department offers online professional development with a focus on evidence-based practices in the education of students with conductive hearing loss as a result of otitis media (CHL:OM) through the Deadly Kids Can Listen and Learn facilitated course, Sound Classrooms presentation and What is CHL:OM? resource.
Department of Education, Training and Employment | Annual Report 2012–13 53
School, parent and community partnerships
Strategy: strengthen partnerships with parents, communities and stakeholders to improve student learning outcomes
Parent and community engagement
During 2012–13, the department launched the new Parent and Community Engagement Framework to guide schools in setting, planning and monitoring their parent and community engagement. The framework supports schools at the local level in their activities to communicate and actively engage with their parents and community members.
The fourth annual event celebrating successful and effective parent and community engagement and partnerships was held in Townsville, North Queensland in August 2013. These celebration events occur annually as part of the Low SES National Partnership.
Working with the non-state education sector
The non-state education sector is an essential part of Queensland's education system. It offers Queensland students and parents a diverse choice of educational philosophies and religious affiliations. The department maintains strong links and works collaboratively with the non-state sector in key schooling areas, such as:
implementing the Australian Curriculum preparing for the transfer of Year 7 to secondary working together with the non-state sector and other Government departments on the Queensland
Schools Planning Commission administering recurrent and capital funding to the non-state sector, which includes non-state schools
and community-based organisations for students with special needs monitoring and developing policy and legislation that underpins the sector's sustainability providing secretariat support to the Non-State Schools Accreditation Board in accrediting and
monitoring non-state schools providing secretariat support to the Non-State Schools Eligibility for Government Funding Committee
to enable the committee to perform its statutory functions, including making recommendations to the Minister on non-state school eligibility for government funding.
Non-state education students
During 2012, the non-state school sector supported approximately one-third of Queensland’s school students. See Table 14 for the number of students attending Queensland non-state schools. Through participation in the cyclical review program, usually once every five years, non-state schools are able to demonstrate their compliance with statutory requirements for accreditation. Further details about non-state schools, and the cyclical review process, are available through the independent Non-State Schools Accreditation Board annual report.
Table 14: Number of students in Queensland non-state schoolsStudents in Queensland non-state
schools2008 2009 2010 2011 2012
Primary (Prep–Year 7) 123 795 128 204 131 443 135 099 139 105
Secondary (Year 8–Year 12) 102 817 105 169 107 715 109 035 110 564
Total 226 612 233 373 239 158 244 134 249 669Source: ABS, Schools, Australia
Note: Primary and secondary enrolments include ungraded students. Full-time enrolments as at August of each year.
Department of Education, Training and Employment | Annual Report 2012–13 54

Chapter 5
Training, tertiary education and employmentObjectives: Queenslanders will be skilled to maximise their opportunities and productively contribute to
Queensland’s economy Queensland’s economic growth is supported by a strong and healthy labour market
Key performance indicators Proportion of Queenslanders with higher qualifications Proportion of VET graduates in employment or further study Proportion of graduates and employers satisfied with the overall quality of their training Proportion of funding that aligns to local skill demand areas
Service standardsTable 15: Service standards – Tertiary education (vocational education and training, and higher education)
Service standards Notes2012–13
Target/est. Actual
VET outcomes
Proportion of all attempted competencies successfully completed 89% 89.3%
Proportion of Queenslanders with higher qualifications 1, 2, 3 56% 56.4%
Proportion of graduates in employment or further study KPI 1, 4 87% 85.9%
Cost and satisfaction
Proportion of graduates satisfied with the overall quality of their training KPI 1, 4 89% 89.0%
Proportion of employers satisfied with graduates of: 1, 5
nationally-accredited training 83% 91.0%
apprenticeships and traineeships 83% 78.6%
Average cost per competency successfully completed 6 $683 $725
Other measuresVET engagementNumber of 15–19 year olds enrolled in VET at Certificate II and above:
All students 75 500 70 667
Indigenous students 7 4 500 4 604
Number of commencements: 8
Apprenticeships 18 000 17 300
Traineeships 9 47 000 32 000
School-based Apprenticeships and Traineeships (SATs) 9 000 9 300
VET outcomesNumber of students awarded Certificate III and above: 10
All students 65 000 62 321
Indigenous students 7 2 500 2 565
Number of completions: 8
Apprenticeships 11 000 9 900
Department of Education, Training and Employment | Annual Report 2012–13 55

Service standards Notes2012–13
Target/est. Actual
Traineeships 24 000 32 000
School-based Apprenticeships and Traineeships (SATs) 5 000 6 700Source: Queensland State Budget 2012–13 Service Delivery Statements and State Training Agency Clearing House Database
Notes:1. Confidence intervals for satisfaction estimates derived from sample survey responses need to be considered when interpreting
relative performance.2. ‘Higher qualifications’ means Certificate III and above.3. The wording of this measure has been changed to align with the National Agreement for Skills and Workforce Development. The
calculation methodology has not changed.4. Data are sourced from the annual National Centre for Vocational Education Research (NCVER) Student Outcomes Survey.5. Employer satisfaction estimates are obtained from the biennial national survey, Employers’ Use and Views of the VET System,
which was last conducted by NCVER in 2011.6. Variance between the 2012–13 target estimate and 2012–13 actual is due to the impact of the National Partnership Productivity
Places Program (PPP) being withdrawn. Competencies were efficient to deliver under the contestable PPP and its withdrawal had an impact on the overall efficiency of delivery as well as a larger than expected impact on the number of competencies completed.
7. Indigenous: a person of Aboriginal and/or Torres Strait Islander origin who identifies at enrolment to be of Aboriginal and/or Torres Strait Islander origin.
8. Apprenticeships and traineeships measures include school-based apprenticeships and traineeships (SATs).9. Variance between the 2012–13 target/estimate and 2012–13 estimated actual is due to decreased employer demand following
rationalisation of Commonwealth incentives.10. Awarded students: students who have successfully completed all of the requirements to make them eligible to be awarded the
qualification. Students achieving more than one Certificate III or above qualifications only counted once.
Training and tertiary reform
Strategies: Reduce red tape to remove barriers created for employers to hire new apprentices and trainees Improve alignment of skills outcomes with jobs through a demand-driven training system Reposition VET within the broader tertiary education sector Implement regulatory reform and improved teacher and provider quality and transparency Improve VET system information to allow consumers to make informed decisions and choices
regarding training options Focus on skills to support tourism, agriculture, resources and construction industries, as the
platform for a stronger economy
The Queensland Government is committed to growing a four-pillar economy through focusing on resources, construction, agriculture and tourism, and by reducing unemployment to four per cent over the next six years. The department’s strategic direction is aligned to deliver on the following key strategies:
Property and Construction Strategy – addressing skills needs Resources and Energy Strategy – addressing skills shortages Tourism Strategy – improve tourism skills and career pathways.
The state’s training sector plays a key role in enabling Queenslanders to develop the right skills for employment, and enabling individuals and industry to contribute to the growth of the state’s economy. In June 2013, the Queensland Government released an action plan to reform the state's further education and training sector. Great skills. Real opportunities. brings together reforms contained in key investigations into the Queensland training sector undertaken in 2012–13, including the Queensland Skills and Training Taskforce and the final report of the Commission of Audit.
Great skills. Real opportunities. outlines the action the Government will take to create a new era for training, characterised by:
contestable training funding targeted investment based on industry advice closer alignment between training and the skills required for employment student choice and access certainty for training providers.
Department of Education, Training and Employment | Annual Report 2012–13 56

Improved outcomes
Strategies: Increase participation and completions in higher-level qualifications, particularly in skills
shortage areas Reform funding arrangements to remove financial barriers to participation in VET Improve training completion rates for all students Improve participation and qualification outcomes for Aboriginal and Torres Strait Islanders and
people with disabilities
Developing skills is fundamental to Queensland's economic prosperity. It is a key driver of productivity and economic growth, and is central to shaping our human capital and community capacity. According to the Australian Bureau of Statistics (ABS) survey of education and work, the proportion of Queenslanders aged 25 to 64 years with Certificate III or higher qualifications was 56.4 per cent in 2012, an increase from 51.4 per cent in 2008.
Figure 31: Proportion of 25 to 64 year olds with Certificate III or higher qualifications
2008 2009 2010 2011 2012
0
10
20
30
40
50
60
51.4
54.4 54.155.3 56.4
Perce
ntage
of st
uden
ts
Source: ABS Education and Work May 2012 (Catalogue No. 6227.0.55.003) Additional Datacube
The department supports a range of programs aimed at stimulating increased participation within the state’s VET sector. The User Choice program supports apprenticeship and traineeship training, VET Revenue General supports targeted training through the Public Provider, and further training is supported through National Partnership Agreements with the Australian Government and in partnership with industry. In 2012–13, the department increased the skills of around 250 000 Queenslanders. VET participation in schools can count towards a student’s QCE and encompasses a range of training options for school students in secondary school (Years 10 to 12), including:
courses delivered at school SATs courses offered at a TAFE institute or by another training organisation.
In 2012–13, around 17 300 new apprenticeships are projected to have commenced in Queensland. While lower than the previous year, the level of commencements remains stronger than at any time before 2005–06 and reflects the impacts of changing economic conditions. Overall apprenticeship and traineeship commencements were impacted by the rationalisation of Commonwealth incentives payable to employers. This affected the uptake of traineeships, in particular.
Department of Education, Training and Employment | Annual Report 2012–13 57
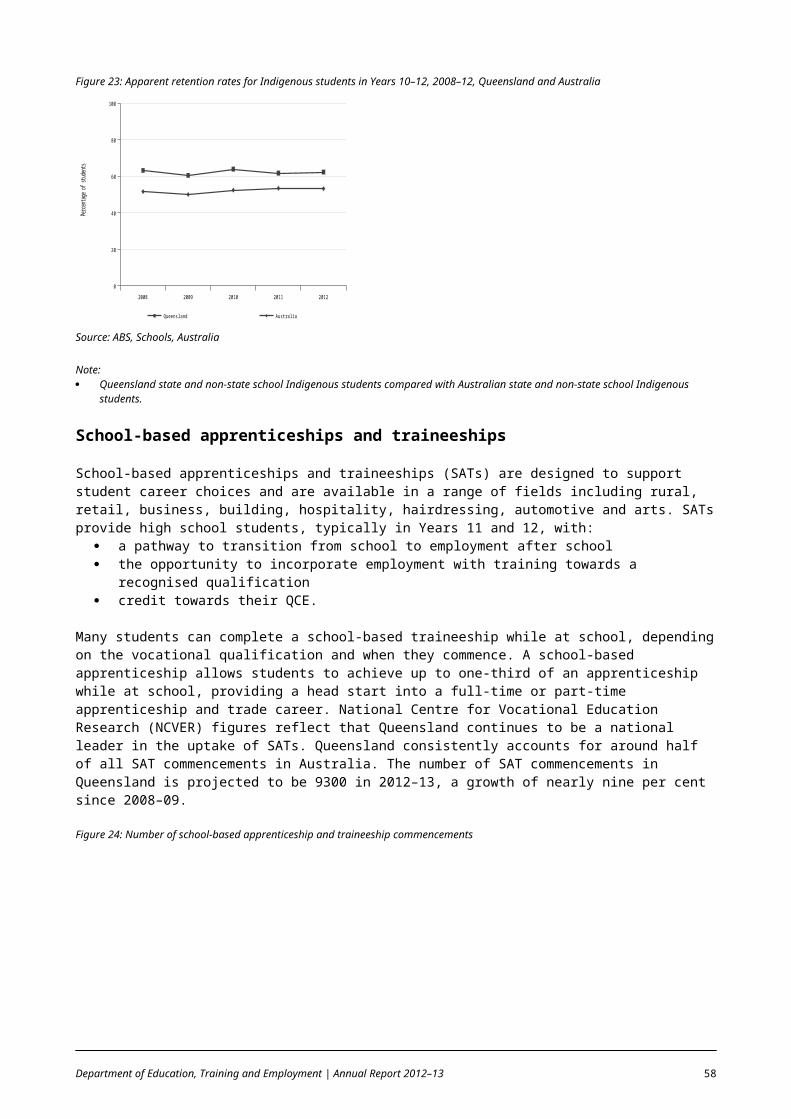
Figure 32: Number of apprentice and trainee commencements
2008-09 2009-10 2010-11 2011-12 2012-13
0
10000
20000
30000
40000
50000
60000
70000
80000
90000
Apprenticeship Traineeship Total
Source: Department of Education, Training and Employment – Contract of Training Database (DELTA)
Note: The 2012–13 data are projected results. Apprenticeships and traineeships include school-based apprenticeships and traineeships (SATs).
In 2012–13, it is projected that 9900 Queenslanders will have completed apprenticeships and 32 000 completed traineeships. The number of apprenticeship completions reduced following several exceptionally strong years associated with commencements in the period prior to the global financial crisis.
Figure 33: Number of apprentice and trainee completions
2008-09 2009-10 2010-11 2011-12 2012-13
0
5000
10000
15000
20000
25000
30000
35000
40000
45000
Apprenticeship Traineeship Total
Source: Department of Education, Training and Employment – Contract of Training Database (DELTA)
Note: The 2012–13 data are projected results. Apprenticeships and traineeships include school-based apprenticeships and traineeships (SATs).
Despite the impact of the rationalisation of Commonwealth incentives and the global financial crisis Queensland’s apprenticeship activity performance continues to compare favourably with the nation as a whole. Queensland’s share of apprenticeship commencements is greater than its share of the working age population, and has been for over 10 years. Additionally, there is around one apprentice employed for every six tradespeople in Queensland, a ratio that is consistent with the national average.
VET graduate results
Queensland's VET sector continues to strive to address the needs of Queensland's economy, achieving strong results in producing job-ready graduates. The VET system continued to deliver vocational programs that lead to successful student outcomes, particularly the gaining of qualifications. Figure 34 demonstrates a decline in completions which reflects the removal of Commonwealth PPP funding.
Figure 34: Publicly-funded Australian Qualifications Framework Certificate I or above qualifications awarded
Department of Education, Training and Employment | Annual Report 2012–13 58

2008-09 2009-10 2010-11 2011-12 2012-13
0
10000
20000
30000
40000
50000
60000
Cert I-II Cert III Cert IV
Source: Department of Education, Training and Employment – Training System Information
Note: The dip in 2012–13 was associated with the cessation of National Partnership; Productivity Places Program funding with no
immediate replacement.
Table 16: Total number of VET qualifications awarded – Certificate I or above qualification levels2008–09 2009–10 2010–11 2011–12 2012–13
72 926 82 777 104 631 120 022 86 215Source: Department of Education, Training and Employment – Training System Information
Note: For consistency of reporting with other jurisdictions, the total number of VET qualifications awarded only includes Certificate I or
above qualification levels. All qualification levels have been reported in the past.
In 2012–13, 68 450 Certificate III and above qualifications were completed, an increase of nearly 20.0 per cent compared to the 57 400 completions reported in 2008–09.
User Choice program
The demand-driven User Choice program provides employers with greater choice of training provider and ensures that funding provided for the training of apprentices and trainees is aligned to the skills needs of industry. The program:
prioritises funding based on industry advice received through Skills Queensland establishes consistent and appropriate pricing, with the government contribution to the cost of training
varying with the priority of the training implements a simplified government purchasing strategy which increases choice of training provider
and ensures that funding responds to demand for apprentices and trainees.
Recognition of prior learning
Recognising an individual's skills and experience using Recognition of Prior Learning (RPL) assessment is one of the department's strategies to efficiently and effectively address Queensland's future skills needs. RPL and the credit transfer process are a process of qualifying individuals effectively, saving time and resources by negating the need for people to retrain in skills and knowledge they already possess. In 2012, 11.7 per cent of all full-year training equivalents in Queensland were assessed through RPL, up from 8.6 per cent in 2008. The Queensland proportion of RPL is 2.8 percentage points above the national average.
Department of Education, Training and Employment | Annual Report 2012–13 59

Figure 35: Full-year training equivalents in Recognition of Prior Learning (share of total training activity) — Queensland’s position relative to Australia, 2008–12
2008 2009 2010 2011 2012
0
2
4
6
8
10
12
14
Queensland Aus tralia
%
Source: Australian vocational education and training statistics: Students and courses 2012, NCVER
Note: Full-year training equivalents measure the training activity undertaken by a student on a full-time basis for one year. Calculations
are based on hours of delivery (720 hours = 1 FYTE).
VET professional learning
Queensland recognises that the skills and knowledge of our VET educators are fundamental to the success of the sector in contributing to the achievement of the Government's social, environmental and economic priorities. In support of the Queensland VET Continuous Professional Learning Strategy: 2012–2015, the Queensland VET Development Centre (QVDC) developed a 2012–13 Professional Learning Program.
The professional learning program was designed to provide opportunities for both public and private registered training organisations (RTOs) in Queensland for continuous development of their professional learning. It considers the workforce capability development requirements of RTOs in responding to the changing VET policy environment. As at 30 June 2013, over 1100 participants from public and private RTOs have participated in the face-to-face and virtual activities on offer.
Apprentice retention and completion
The department operates a proactive visit service to employers, apprentices and trainees. Regional officers visit workplaces to assess the progression of apprentices and trainees, and identify any issues which may prevent the completion of the training contract. Follow-up activities are conducted to resolve the issues at a local and systemic level as required. Visits are mostly aimed at apprentices in areas identified as requiring additional support.
Indigenous training and skillingThe department is committed to providing accessible and relevant Indigenous education and training pathways that lead to skills acquisition and employment outcomes. A number of department partnerships for Indigenous VET Initiatives operate through the COAG agenda of closing the gap in Indigenous disadvantage.
Indigenous participation in vocational education and training
Using Year 12 state school student outcomes as a measure, in 2009, the gap between Indigenous and non-Indigenous Year 12 students who received an OP, QCE, QCIA, IBD or VET qualification or who undertook a SAT was 13.7 per cent. In 2011, the equivalent gap was 5.5 per cent and, most recently in 2012, this gap was 4.0 per cent indicating that this gap is closing steadily KPI .
In 2012–13, Indigenous students represented 6.1 per cent of total publicly-funded VET students, compared to 5.2 per cent representation in 2008–09.
Department of Education, Training and Employment | Annual Report 2012–13 60

Figure 36: Number of Indigenous students in the publicly-funded VET system
2008-09 2009-10 2010-11 2011-12 2012-13
0
2000
4000
6000
8000
10000
12000
14000
16000
18000
20000
Indigenous All Students Indigenous Cert III+ Students
Source: Department of Education, Training and Employment
The declining number of Indigenous students in the publicly-funded VET system and the number of VET qualifications awarded to Indigenous students in Queensland reflects the impact of the removal of Commonwealth PPP funding. The trends in qualifications awarded to Indigenous persons reflect the department's commitment to higher-level qualifications. Figure 37 demonstrates how completion of Certificate III or above qualifications increased 47.9 per cent from 1931 in 2008–09, to 2856 in 2012–13.
Figure 37: Number of VET qualifications awarded to Indigenous students in Queensland
2008-09 2009-10 2010-11 2011-12 2012-13
0
1000
2000
3000
4000
5000
6000
7000
8000
9000
Indigenous all awards Indigenous Cert III+ awards
Source: Department of Education, Training and Employment
Note: For consistency of reporting with other jurisdictions, the total number of VET qualifications awarded only include Certificate I or
above qualification levels from 2012–13; while it reported all qualification levels in the past.
Indigenous participation in apprenticeships and traineeships
The department continues to encourage Indigenous Queenslanders to engage in all training pathways, including apprenticeships and traineeships. In 2012–13, some 2600 Indigenous people are anticipated to have commenced apprenticeship and traineeship training. The number of Indigenous people commencing apprenticeships and traineeships was also impacted by the rationalisation of Commonwealth incentives payable to employers.
Department of Education, Training and Employment | Annual Report 2012–13 61

Figure 38: Number of Indigenous apprentice and trainee commencements
2008-09 2009-10 2010-11 2011-12 2012-13
0
500
1000
1500
2000
2500
3000
3500
4000
4500
Apprenticeship Traineeship Total
Source: Department of Education, Training and Employment – Contract of Training Database (DELTA)
Note: The 2012–13 data are projected results. Apprenticeships and traineeships include school-based apprenticeships and traineeships (SATs).
Figure 39: Number of Indigenous apprentice and trainee completions
2008-09 2009-10 2010-11 2011-12 2012-13
0
200
400
600
800
1000
1200
1400
1600
1800
2000
Apprenticeship Traineeship Total
Source: Department of Education, Training and Employment – Contract of Training Database (DELTA)
Note: The 2012–13 data are projected results. Apprenticeships and traineeships include school-based apprenticeships and traineeships (SATs).
During 2012, 91.5 per cent of Indigenous apprentices and trainees successfully completed all competencies attempted. This is similar to the rate of 94.5 per cent for all apprentices and trainees.
Table 17: Proportion of Indigenous apprentices and trainees completing all modules/competencies2008 2009 2010 2011 2012
Successful completion of all modules/competencies 92.4% 92.9% 91.4% 92.4% 91.5%Source: Department of Education, Training and Employment – Training System Information from VOCSTATS
Indigenous training support initiativesThe department continued to target strategies specifically designed to encourage Indigenous participation during 2012–13.
Department of Education, Training and Employment | Annual Report 2012–13 62
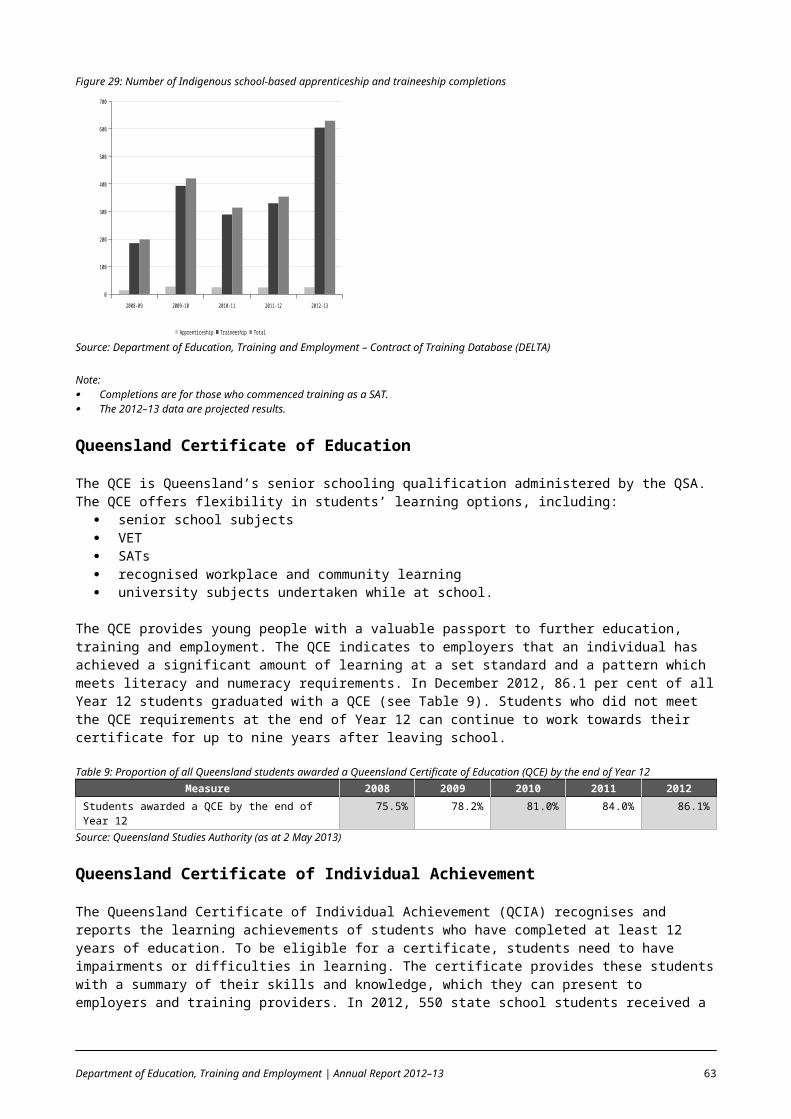
Cape York Employment and Training Strategy
During 2012–13, the Cape York Employment and Training Strategy provided community-driven, targeted training to support employment and enterprise development opportunities in the Cape York region. As at 30 June 2013, 70 participants were enrolled in competencies and qualifications funded under this initiative.
Indigenous Funding Pool
The Indigenous Funding Pool (IFP) program provided demand-driven training for Indigenous people in Queensland in 2012–13. The department provided IFP funds to the TAFE Queensland Institutes, TAFE Statutory Authorities and other private training organisations to support the department’s aim of increasing Indigenous participation and achievement of higher-level qualifications in VET. Activities funded in 2012–13 included training, support, capacity building and innovative pilot programs.
In 2012–13, 76 young Indigenous performing artists from across the state undertook accredited training at Certificate III to Advanced Diploma levels at the Aboriginal Centre for the Performing Arts supported by the Creative Industries initiative and the IFP.
Regional and Remote Indigenous training initiatives
The regional and remote training for Aboriginal and Torres Strait Islander peoples initiative enabled tailored training at Certificate III level and above to help meet industry and community demand across a range of industry areas. In 2012–13, five TAFE Queensland institutes delivered training under this initiative, which resulted in a total of 131 participants enrolled in nine different courses, including horticulture, business, construction, children’s services and primary health care.
The Indigenous Remote Area Strategy supports quality outcomes for children through a skilled ECEC workforce. The Tropical North Queensland Institute of TAFE delivers the strategy through targeted and culturally appropriate Certificate III, Diploma and Advanced Diploma of Children's Services training to existing and new-entrant early childhood educators in the Cape, Gulf and Torres Strait Islands, and other Indigenous remote locations. During 2012–13, 206 participants received training through this initiative.
Public provider
Strategies: Clarify the role and purpose of the VET public provider Enhance TAFE institutes’ leadership and staffing capacity to support performance in the
contemporary training market to deliver the Government’s policies for employment and the economy
TAFE Queensland
TAFE Queensland is the largest provider of practical, relevant and quality VET in Queensland. The TAFE system supports the development of a highly skilled and flexible workforce to ensure Queensland's continuing growth and prosperity. In 2012–13, the TAFE Queensland network delivered educational excellence to over 193 000 students through a network of 13 institutes across Queensland, including two statutory TAFE institutes. More than 800 nationally-accredited programs are offered by TAFE institutes, spanning over 70 locations across the state.
Information about TAFE institutes is available online at www.tafe.qld.gov.au/courses-and-campuses/institutes/index.html.
Maintaining a quality VET system
An essential mechanism for ensuring the quality of VET delivery and assessment is the national standards against which RTOs are measured and with which they must comply. The VET Quality Framework (VQF) is aimed at achieving greater national consistency in the way providers are registered and monitored and in how standards in the VET sector are enforced. The VQF is critical in protecting the interests of all students undertaking VET in Australia. It includes a set of standards that assures nationally consistent, high-quality training and assessment services for clients of the VET system. The concept of continuous improvement
Department of Education, Training and Employment | Annual Report 2012–13 63

underpins the VQF, ensuring that RTOs regularly review their operations and build on the quality of training and assessment and their clients’ outcomes.
As has been the case in Queensland for many years, the Australian Skills Quality Authority (ASQA) applies a risk management approach to the registration and regulation of RTOs to ensure the most efficient application of resources and to reduce the regulatory burden on RTOs.
Satisfaction with VET services
Surveys conducted by NCVER have revealed the majority of students and employers are satisfied with VET training services and products in Queensland. Results of the Student Outcome Survey show that VET graduates' satisfaction with their training remains high at 89.0 per cent.
Table 18: Proportion of graduates satisfied with the overall quality of their training, 2008–12 KPI2008 2009 2010 2011 2012
Queensland 85% 87% 88% 89% 89%
Australia 88% 89% 88% 89% 89%Source: Student Outcome Survey – NCVER
Note: 2009, 2010 and 2011 data were revised by NCVER.
Results of the last Survey of Employers' Use and Views of the VET System, conducted in 2011, showed Queensland on par with national performance. An estimated 91.0 per cent of employers utilising nationally-accredited training were satisfied with their experience. The survey is conducted biennially and results of the 2013 Survey of Employer Employers' Use and Views are not available for this report.
Table 19: Level of employer satisfaction with nationally-accredited training2005 2007 2009 2011
Queensland 71% 88% 83% 91%
Australia 80% 81% 86% 89%Source: Employers' Use and Views of the VET System – NCVER (biennial survey)
Employer, business and industry partnerships
Strategies: Work with industry to support training investment and skills reform Improve pathways through collaboration between industry, the training sector and the higher
education sector Develop international partnerships and markets for education and training sectors
Skills Queensland
During 2012–13, Skills Queensland provided strategic advice on future directions for skills and workforce development and employment, and worked with industry to identify its skilling needs to better align training delivery with industry demand. Skills Queensland provided advice to the department on the prioritisation of programs and funding based on industry advice. DETE provides administered funding to Skills Queensland each year. The Skills Queensland annual report is available online at www.skills.qld.gov.au.
Higher education
Quality accessible higher education
Higher education institutions in Queensland make a significant contribution to economic growth, developing social capital and helping to build community capacity within the state. The department's higher education goals are to:
manage the administration of state-enabling legislation for Queensland universities and university and government relations
influencing appropriate policy responses to higher education issues.
Department of Education, Training and Employment | Annual Report 2012–13 64
The Tertiary Education Quality and Standards Agency (TEQSA) is the national regulator of the higher education sector.
Employment transitions
Strategy: Drive economic participation by providing a range of pathways for disadvantaged job seekers who wish to enter the skills system or gain work
Skills Recognition
The Skills Recognition program area assesses formal qualifications gained overseas by comparing these qualifications to Australian Education Awards. The Skills Recognition program area forms part of a national network of Overseas Qualifications Units, with one in each state and territory. During 2012–13, the Skills Recognition program area assessed and assisted more than 1200 overseas-qualified Queenslanders and facilitated their pathway to employment and further study. Additionally, Skills Recognition publishes pathway information for professional and paraprofessional registration in Queensland which was accessed by over 24 000 customers.
Skilled and Business Migration
Until the end of March 2013, the department managed the Skilled and Business Migration function of the Queensland Government. During this period, the department processed nominations for the following visas:
74 skilled visa nominations 62 business visa nominations. This included 28 Significant Investor Visa nominations, a new visa
implemented by the Department of Immigration and Citizenship in November 2012.
As a result of a review of the Skilled and Business Migration program, the function transferred to Queensland Treasury and Trade from 1 April 2013.
Black Business Finder
In March 2013, the Minister for Education, Training and Employment launched an online Aboriginal and Torres Strait Islander business database — known as the Black Business Finder (BBF). BBF is part of a national database hosted by the Industry Capability Network (ICN) that contains more than 60 000 suppliers and project opportunities worth $247 billion. There are currently 143 Indigenous businesses listed on the BBF, employing over 2000 workers of which more than 1100 are Indigenous.
The BBF maximises participation by indigenous businesses in major projects. The online database provides opportunity for these businesses to participate in private and government supply chains and will enable private and public sector procurement personnel to identify Indigenous business capabilities across Queensland for potential tendering and contracting opportunities. This in turn will encourage the growth of the Indigenous business sector and increase employment. The BBF database is available online at www.bbf.org.au/.
Training and employment research
The department undertakes a broad range of high-level statistical analysis research services that focus on effective transitions from school, training and higher education to employment. Disadvantaged learners (including young people, early school leavers and Indigenous Queenslanders) may find these transitions difficult because they lack the necessary human capital — that is, that combination of education, training and skills formation that enables them to participate fully in the labour market. Higher participation rates in work confer significant benefits to the Queensland economy in improving wellbeing, providing higher incomes and increased labour productivity. The department’s research provides an evidence base for policy development and enhancing service delivery.
Department of Education, Training and Employment | Annual Report 2012–13 65
Coordinated responses
Strategies: Lead coordinated responses across all tiers of government to intervene in the labour market Connect strategic labour market drivers and influences with localised responses
Government and Industry Skilling Response to ex-Tropical Cyclone Oswald
The department, along with industry partner Construction Skills Queensland, contributed to efforts to recover and build resilience to natural disasters, specifically flood and storm impacts of the aftermath of ex-Tropical Cyclone Oswald in early 2013. Local Government Traineeships (LGT) is a strategic intervention program and forms part of the Government and Industry Skilling Response package. Through LGT, wage subsidies totalling $1.8 million were awarded to local government authorities in storm and flood affected areas to provide 120 new traineeship opportunities.
To mitigate the risk of residents leaving regional areas due to the economic and labour market impacts following the devastation caused by the natural disasters of 2011, the LGT provided individuals with paid employment and an opportunity to gain a nationally recognised qualification.
Industry and community partnerships
Strategies: Work with industry to develop workforce strategies that meet skills and labour needs and
contribute to community and government objectives Build capacity in communities to develop responses to support the local labour market and
contribute to regional economic growth
Influencing Australian Government employment services
The department is continuing to influence the Australian Government’s responsibility for the delivery of employment services through the provision of appropriate advice on Queensland labour market conditions and working to improve the interface between training and employment services for all Queensland jobseekers. In March 2013, the department formalised this advice with a submission to the review of Australian Government employment services titled Employment Services: Building on Success. In its submission to the Australian Government, DETE outlined gaps in employment service delivery for Queenslanders and promoted the best-practice approach to employment service delivery pioneered under the Skilling Queenslanders for Work initiative.
To continue to influence the employment agenda, the department implemented the Interagency Group on Employment and Training. This group consists of senior State and Australian Government representatives and works in partnership to achieve Queensland and Australian Government policy objectives around workforce participation, improving educational, training and productivity outcomes, with a particular focus on those who are disadvantaged in the labour market.
The closure of the Skilling Queenslanders for Work initiative was announced in July 2012. This reflects the Government’s withdrawal from activity that is the responsibility of the Australian Government. During 2012–13, in addition to the existing Skilling Queenslanders for Work commitment, $5 million was invested to honour long-term contracts and to help 2800 jobless or underemployed Queenslanders. In June 2013, all activity under this initiative ceased.
Department of Education, Training and Employment | Annual Report 2012–13 66

Chapter 6
Corporate servicesObjective: We will manage our resources effectively to strengthen service delivery
Key performance indicators Achievement of a balanced budget Percentage of identified Government capital commitments delivered on time and within budget Proportion of departmental staff in frontline service delivery roles Proportion of staff who are satisfied that the department is a good place to work Rates of WorkCover claim and short-term absences
Corporate Services Renewal programThe Queensland Government has an ambitious reform agenda to transform the Queensland Public Sector into the best public sector in the nation with the renewal of corporate services being a key focus. DETE has commenced the revitalisation of its corporate services with a focus on providing cost effective solutions for frontline service delivery. A key component of the DETE Corporate Services Renewal program will be an increase in contestability arrangements through the application of the whole-of-government contestability framework.
Workforce
Strategies: Attract, retain and develop a high-quality, agile, skilled and professional work-force Promote safe and healthy work environments
Workforce Strategic Plan 2011–14
The Workforce Strategic Plan 2011–14 establishes a clear vision for the department, as well as providing specific workforce goals and outcomes. It is designed to strengthen our workplace practices, allowing us to keep pace with government and community expectations, while delivering world-class education and training opportunities for all Queenslanders. A copy of the department's Workforce Strategic Plan 2011–14 is available at www.dete.qld.gov.au/publications/strategic/pdf/workforce-strategic-plan-11-14.pdf.
Workforce strategies
During 2012–13, the department continued to improve the management of DETE’s large and diverse workforce through a range of initiatives, including:
enhancing the use of employee self-service, for corporate staff in central and regional offices, through the introduction of an online leave facility, which enables the online submission and approval of employee leave applications
introducing electronic distribution of employee pay advices, reducing the number of printed employee pay advices by 75 per cent
extending the Principal Performance and Development Plan tool to deputy principals and other associated administrator roles
releasing the Great teachers = Great results direct action plan for Queensland schools that focuses on supporting teachers throughout their careers.
Our people
The department employs approximately one third of the Queensland Government workforce and rates among the largest organisations in Australia. Our diverse profile includes school and TAFE teachers and specialist staff, as well as professionals engaged in the education and training sectors.
Department of Education, Training and Employment | Annual Report 2012–13 67
Figure 40: Location of the department’s workforce, 2012–13Central Office
3%Regions
2%
Schools and TAFEs95%
Source: Department of Education, Training and Employment
As at 30 June 2013, the department had a combined workforce of 84 200 people, which equates to 66 629 FTE staff across the state in various full-time and part-time roles. The department’s staff numbers are based on Quarter 2 Minimum Obligatory Human Resource Information (MOHRI) point-in-time data.
Support staff in schools, TAFE institutes and regional offices include cleaners, grounds staff and employees supporting regulation of early childhood education and care, and the apprenticeship and traineeship system. Corporate staff provide functions to the department’s service areas such as human resources, infrastructure, information technology and finance, including payroll and accounts receivable/accounts payable. In other agencies these may be delivered through a Shared Service Provider.
The average age of departmental employees is 45 years, compared to 44 years across the Queensland Public Sector (see Figure 41). Queensland's average state school teaching age is 43 years.
Figure 41: The department’s age profile, 2012–13
0-19 20-24 25-29 30-34 35-39 40-44 45-49 50-54 55-59 60-64 65+
0
5
10
15
20
0.48
3.85
7.80
9.7710.76
14.69 14.99 15.32
12.65
6.96
2.72
Per
cent
age
Source: Department of Education, Training and Employment
The staff retention rate for 2012–13 was 93.2 per cent, and the annual separation rate was 6.8 per cent.
The 2011–12 Employee Engagement Survey of non-school based employees showed 71 per cent rated job satisfaction, workplace morale favourably KPI . The results of the Working for Queensland Employee Opinion Survey conducted in June 2013 were not available at the time of printing. In the 2012 School Opinion Survey, 93.6 per cent of school staff, including principals, agreed that their school was a good place in which to work.
Department of Education, Training and Employment | Annual Report 2012–13 68

Human resource managementThe department’s Developing Performance Framework provides a process for employees to clarify what is expected of them in their role, identify their performance and development goals and career aspirations, and access support and relevant professional development. The framework is supported by:
DETE Induction Strategy and resources Public Service Commission's (PSC) Capability and Leadership Framework Valuing Performance policy statement Professional Standards for Teachers Principals' Capability and Leadership Framework mentoring and coaching initiatives.
Attracting new employees
The department acknowledges the need to attract and retain a high-quality workforce in schools, TAFEs and the corporate sector to deliver world-class education and training services for Queensland. In 2012–13, the department employed more than 1348 graduates to permanent teaching positions, and created an additional 359 teachers and teacher aide positions to meet enrolment growth in Queensland state schools and support students with disabilities.
A range of strategies were implemented during 2012–13 to attract and retain frontline staff, build capacity, and value people in the early childhood, education and training workforce, including:
continuing the five Teacher Education Centres of Excellence to better prepare high-calibre pre-service teachers
continuing the expanded Remote Area Teacher Education Program – the Community-based Aboriginal and Torres Strait Islander Teacher Education Program – which supports Aboriginal people and Torres Strait Islander people in remote communities in gaining professional qualifications
continuing the expanded Beyond the Range program, providing pre-service teachers with support to undertake field studies in rural and remote schools
continuing a professional development scholarship focussed on behavioural management of students with Autism Spectrum Disorders
implementing an ACER Institute Graduate Program to support the development of the teaching workforce to gain postgraduate qualifications in identified priority areas, including assessment of student learning
continuing the Step into Teaching scholarship, supporting talented professionals to undertake postgraduate teaching studies complementing their existing undergraduate degree in high-demand areas of mathematics, physics and chemistry
continuing scholarship programs to assist high-achieving Year 12 school leavers to undertake an approved initial teacher education program
continuing support of scholarship programs that support and increase the presence of qualified and registered teachers in the ECEC sector
assisting teachers seeking a career change through the Career Change program continuing to provide targeted incentives to teachers to work in rural and remote school locations
through the Remote Area Incentive Scheme implementing an incentives scheme to attract and retain early childhood teachers in hard-to-staff
services offering an approved kindergarten program implementing grants aimed at supporting diversity in both kindergarten and family day care across the
state redeveloping the Make a Difference. Teach marketing campaign promoting teaching as a career of
choice, employment opportunities across the state and across all sectors implementing scholarships for existing teachers with a focus on student assessment and learning
outcomes continuing scholarship programs to assist regions in meeting workforce demand for specialist
teachers in high-demand curriculum areas and difficult-to-staff locations across Queensland developing the Fresh Start strategy which focuses on:
attracting the highest quality applicants into the teaching profession ensuring that they have the essential skills, knowledge and experience supporting their transition from pre-service to beginning teacher.
Department of Education, Training and Employment | Annual Report 2012–13 69

During 2012–13, the department further supported service delivery in state schools by: Providing the equivalent of an additional 8.5 FTE’s for teachers to provide relief across one-teacher
schools from the start of the 2013 school year. Allocating 359 teachers and teacher aides to meet enrolment growth and to support students with
special needs in Queensland state schools. An additional 2341 teacher aide hours per week were also provided to primary schools to increase teacher aide support in their Prep classes.
Employee induction
Induction is an essential element of professional development, assisting employees to develop their performance and provide high-quality service. The DETE Induction Strategy outlines our model for best-practice employee induction, which is provided locally and supported by regional offices and a range of online resources. These resources include:
DETE induction website online mandatory induction program induction guidelines for Education Queensland state schools, TAFE institutes, central and regional
offices induction planners for a wide range of employee groups principals' induction website and resources.
By engaging all new employees in consistent, contextualised induction programs, the department ensures they receive the information needed to develop their performance and provide high-quality service.
Developing our leaders
The department maintained its commitment to coordinate, support and strengthen the continuing professional and leadership development of all DETE employees during 2012–13. Principals and leadership aspirants developed their leadership capabilities through various regional programs and initiatives. Initiatives that fostered executive, school, TAFE and public sector leadership included:
continuing the Take the Lead Program to strengthen small school leadership across Queensland, including Leadership Professional Development workshops and a structured induction program for leadership aspirants
developing a Deputy Principals’ Capability and Leadership Framework and Head of Programs’ Capability and Leadership Framework
supporting implementation of capability and leadership frameworks through the Developing Performance process
continuing the implementation of a differentiated supervision and capability framework for principals delivering the Inspiring Leadership Program for AO6 to AO8 employees delivering the Working SMARTer Program for AO2 to AO5 employees maintaining a Workplace Coaching Register, comprising 45 trained internal workplace coaches.
Improving teacher quality
The department has continued to work with Queensland higher education providers to boost the standard of teaching graduates and ensure beginning teachers are well prepared for their important role in schools. In addition, the department has continued to work with all state and territory educational authorities to implement actions under the Improving Teacher Quality National Partnership Agreement, which was established to drive and reward systemic reforms to improve the quality of teaching and leadership in Australian schools. Key reforms being driven through the National Partnership include:
new Australian Professional Standards for Teachers, which provide a reference point for teacher professionalism
nationally consistent teacher registration nationally consistent processes for accrediting initial teacher education programs.
As part of the National Partnership, the department established five Teacher Education Centres of Excellence that focus on better preparing high-performing graduate teachers for working in contemporary state schools.
Department of Education, Training and Employment | Annual Report 2012–13 70

From June 2013, the department is implementing Great teachers = Great results to lift the standards of teaching and give schools more flexibility to get on with the job including:
supporting teachers with mentoring, training and resources rewarding outstanding performers with career opportunities, scholarships and bonuses allowing each school to have more say in how they are run fast-tracking the careers of high-performing teachers creating new Master Teacher positions to ensure quality teachers are working where they are needed
most strengthening state school discipline.
Restart Teaching
Restart Teaching is a Queensland College of Teachers accredited 30-hour professional development program. The program is designed for teachers who do not meet recency of practice (have completed less than 100 days of teaching in the five-year period of registration). Restart Teaching helps returning teachers to understand the current curriculum frameworks, teaching and learning practices, and legislative and legal responsibilities that are central to their work with students in contemporary school settings. In 2012–13, the Restart Teaching program was completed by 107 participants.
Workforce diversity
The department is committed to the inclusion of diversity and equity principles and practices across our workforce. Programs are also implemented to support the recruitment of potential staff from the Equal Employment Opportunity Groups, and the career development of current departmental staff from diverse backgrounds. The department’s Diversity Online Training Program boosts understanding about anti-discrimination, disability awareness, Aboriginal and Torres Strait Islander cultural awareness, multicultural awareness and gender equity.
Recognising our staff and students
The department recognises and celebrates the achievements, talents, creativity and enthusiasm of our students, teachers and staff at various events, awards and competitions. Further information about the achievements of our students and staff may be found on the department’s website at www.dete.qld.gov.au.
Organisational health
The department is committed to the health, safety and wellbeing of our staff, students and visitors to our workplaces. Creating a culture that supports and fosters safe and healthy working and learning environments is a key priority. During 2012–13, the department:
delivered key workplace health, safety and wellbeing risk-based strategies enhanced management of workplace health and safety across the department through the MyHR
Workplace Health and Safety IT solution updated all Health, Safety and Wellbeing procedures to align with the Work Health and Safety Act
2011 developed the Industrial Technology and Design (ITD) Guideline which is designed to be a source of
information relating to the establishment, management and maintenance of a healthy and safe teaching, learning and working environment for staff and students
developed resources for over 85 pieces of plant and equipment including fixed and portable machinery and equipment for schools. These resources included Safe Operating Procedures, Equipment Maintenance Records and Plant and Equipment Risk Assessments which assist in demonstrating a robust system for the safe management of plant/equipment in ITD workplaces in accordance with the Plant Code of Practice 2005
conducted audiometric assessments in line with the department’s hearing conservation program developed a pilot workshop training program for the Prevention of Workplace Bullying commenced a review of DETE’s internal and external models of Employee Assistance services launched the inaugural DETE Health, Safety and Wellbeing Awards to recognise and share quality
practices for improving the safety of DETE workplaces and the health and wellbeing of staff reviewed and finalised the Smart Moves for Staff health and wellbeing pilot commenced the development of a suite of online resources to enable all DETE workplaces to develop
a staff wellness program that is based on local identified workforce health needs.
Department of Education, Training and Employment | Annual Report 2012–13 71

The department's WorkCover claims during 2012–13 totalled 3427 claims KPI .
Figure 42: The rate of WorkCover claims – per 100 FTE KPI
2008-09 2009-10 2010-11 2011-12 2012-13
4.9
5.0
5.1
5.2
5.3
5.4
5.5
5.6
5.7
Lodgem
ent ra
te
Source: Department of Education, Training and Employment
Further information is available on the department’s Creating Healthier Workplaces website at www.education.qld.gov.au/health.
Reducing unscheduled leave
The department continues to monitor and implement strategies to reduce the rate of employees' unscheduled leave. The department's overall unscheduled leave rate for 2012–13 was 4.1 per cent. This compares to the Queensland Public Sector's unscheduled leave rate for 2012–13 of 4.5 per cent KPI .
Figure 43: Unscheduled leave rate for Queensland state school teachers, 2012–13 – by age group
20-24 25-29 30-34 35-39 40-44 45-49 50-54 55-59 60-64 65+0
1
2
3
4
5
6
7
8
1.98
2.97
3.733.88 3.82 3.90
4.44
5.67
6.12
7.28
Perc
enta
ge
Source: Department of Education, Training and Employment
Note: The rate is based on total absent hours divided by available working hours using MOHRI methodology to allow for comparison to
the QPS absenteeism rate.
Code of Conduct and public sector ethics
All employees must observe the ethical principles and obligations arising from those principles defined in the Public Sector Ethics Act 1994. The department is committed to maintaining a positive ethical culture, and delivering the ethical message to ensure all its employees have access to, and become familiar with, their obligations under the Code of Conduct for the Queensland Public Sector and the department’s Standard of Practice. The department is dedicated to the implementation and inclusion of the four ethics principles and associated values in the Code of Conduct and Standards of Practice in its administrative procedures and management practices.
Department of Education, Training and Employment | Annual Report 2012–13 72

The Code of Conduct provides employees with a framework of ethical principles, obligations and standards to guide them in how to perform their work and professional standards as public service employees, and how to conduct their relationships with others. A copy of the Code of Conduct is available at www.psc.qld.gov.au/includes/assets/qps-code-conduct.pdf.
The department ensures staff have access to appropriate education and training about public sector ethics through regular ethical decision-making training, including awareness of the Code of Conduct and Standard of Practice. Regional and institute training is facilitated locally utilising resources developed by the department’s Ethical Standards Unit and enhanced through the recent development and pilot of a train-the-trainer package. Online training is also available for all employees through the Learning Place.
Better workplace relations
The department has continued its commitment to open communication and consultation with staff, stakeholders and the unions that represent its workforce. The department is committed to resolving issues locally to ensure ongoing successful delivery of services across Queensland. The department participates in the State Government Departments Certified Agreement 2009, and is currently responsible for the following enterprise bargaining agreements:
Department of Education, Training and Employment State School Teachers' Certified Agreement 2012
Department of Education and Training Teacher Aides' Certified Agreement 2011 Department of Education and Training (Education) Cleaners' Certified Agreement 2011 Department of Education, Training and Employment TAFE Educational Employees Certified
Agreement 2012.
Early retirement, redundancy, retrenchment and voluntary separation
A program of redundancies was implemented during 2012–13. Employees who did not accept an offer of a redundancy were offered case management for a set period of time, where reasonable attempts were made to find alternative employment placements. At the conclusion of this period, and where it is deemed that continued attempts of ongoing placement were no longer appropriate, employees yet to be placed were terminated and paid a retrenchment package. During 2012–13, 967 employees received voluntary early retirement, redundancy and retrenchment packages at a cost of $48 287 641.01, excluding accrued leave payments.
The department’s voluntary Primary Teacher Career Change Program assists staff to achieve new career objectives. During 2012–13, 513 primary teachers received grants under this program at a cost of $22 820 000.
During 2012–13, the department did not offer any voluntary separation packages to employees.
Information and communication technologies
Information and Knowledge Strategic Plan 2012–16
The Information and Knowledge Strategic Plan 2012–16 focuses on engaging the digital generation, improving individual learning opportunities and getting the best from our ICT investment. The department is using an eBusiness strategy to transform the department’s business processes to feature consistent and integrated end-to-end work processes and efficient end-to-end work flows. This technology-enabled business transformation facilitates a stronger focus on the learning needs of Queenslanders and positions the organisation to:
streamline the way education and training is delivered embrace eLearning enable secure access to information when and where appropriate provide data integrity, availability and certainty through a single-point-of-truth automate business processes and work flows to assist education and training service delivery.
The Information and Knowledge Strategic Plan 2012–16 can be found online at www.dete.qld.gov.au/publications/strategic/other/information10-14.html.
The Learning Place
Department of Education, Training and Employment | Annual Report 2012–13 73

The Learning Place is the department's comprehensive eLearning environment. It provides secure access to an innovative range of digital tools, resources and eSpaces for teaching and learning, collaboration and networking. During 2012–13, 197 927 unique students and 56 067 unique staff used the Learning Place staff and student spaces.
Staff access professional development and training via OneChannel and online courses. As at 30 June 2013, 20 584 Virtual Classrooms were created to support professional development and student learning. The Learning Place has 318 quality-assured online courses and more than 44 800 quality-assured digital resources. In addition, there have been more than 29 900 staff registrations for 809 live web conferencing professional development programs through OneChannel.
In 2012–13, students participated in a range of online events and projects, including: Literature Festival where more than 9010 students and their teachers interacted with 23 Australian
authors across a total of 31 web conferencing sessions Anzac Day event where more than 2390 students interacted with World War II veterans, current
defence force personnel and a war historian to commemorate and deepen understandings of ANZAC day and war.
Computers for Teachers
The Computers for Teachers program enables teachers to better connect with a generation of students who use ICT to play, live and study. In addition, the initiative helps teachers plan lessons, communicate about events and issues, and work together on curriculum and assessment. Under the program, all permanent teachers in Queensland state schools and TAFE institutes who work two or more days a week are allocated a computer to support their teaching. In 2012–13, the department maintained a fleet of 42 584 laptops and provided the third round of 13 492 replacement and additional laptops to school and TAFE teachers.
OneSchool
OneSchool is a Smart Classrooms' flagship business-transformational initiative. OneSchool supports schools in:
student management curriculum and learning management finance and asset management resource management performance, reporting and analysis.
Further information about OneSchool is available online at www.education.qld.gov.au/smartclassrooms/working-digitally/oneschool.html.
Websites for Schools
The Websites for Schools initiative offers state schools a solution for creating and managing a public website – providing useful information for current and prospective parents and community. The department’s new websites are based on input from teachers, principals and technical staff across the state. The new websites bring consistency and ensure compliance with accessibility and usability requirements. The school website platform offers schools improved flexibility and choice about features (look and feel) and functionality and will allow integration with other departmental information systems.
During 2012–13, the Websites for Schools initiative launched approximately 450 websites bringing the current total to more than 600. The QSchools smartphone application was launched in May 2013 to integrate with the Websites for Schools solution. The application provides an additional tool for schools to keep the school community engaged through the promotion of news, events and newsletters.
Department of Education, Training and Employment | Annual Report 2012–13 74

Cyber-safety
During 2012–13, the department’s cyber-safety team continued to receive an increase in requests from schools for advice and support in investigating and managing cyber bullying and inappropriate online behaviours. As social media use amongst students increases requests from schools for support and assistance in the use and misuse of social media has also increased. The cyber-safety team responded to 338 incidents in 2012, this represents an increase of almost 60 per cent on the 2011 figure. Approximately 90 per cent of the assistance provided to schools related to the misuse of social media and social networking websites and their impact on schools’ reputation and student wellbeing.
The department has developed cyber-safety resources to assist schools in involving their school communities in cyber-safety education, understanding and policy development.
Service Centre Online
During 2012, Service Centre Online was launched enabling departmental staff to search self-help articles, view common ICT requests, request IT services, log a job, check existing job statuses and see outage information without having to call the Service Centre. Service Centre Online is available 24 hours a day, seven days a week from any computer with an internet connection.
eLearning for special needs
During 2012, the department implemented the $3.5 million eLearning initiative for special needs students as part of the Government’s commitment to ensuring that all special needs students have support to meet their full potential. This included the provision of more than 7300 eTablets, including over 7000 iPads, to 633 schools. Each school also received an allocation of funds towards the purchase of applications. More than 2700 state school teachers participated in online training which focussed on technical support, operational aspects and management of these devices.
Rapid Response Unit
The department’s Rapid Response Unit provides mobile phone and data communications in areas that do not have any other means of communication, due to remoteness or because of a disaster. During 2013, the Rapid Response Unit was deployed to Bundaberg to help schools get back online after ex-Tropical Cyclone Oswald. The unit provides both electricity and communications to help schools reconnect to the department’s network.
Upgrading TAFE ICT capabilities
During 2012–13, the department upgraded TAFE ICT infrastructure and systems for central training functions and non-statutory institutes to support and enhance their local ICT infrastructure. Key projects included:
enhancements to the TAFE student management system to improve its student and information security
implementation of an Academic Advisement module which improved student eligibility checking development of a Student Entitlement Model to administer enrolments under new funding policies functionality to electronically distribute student results core hardware upgrade program market engagement for the replacement of the TAFE Learning Management System new or improved contractual arrangements to support videoconferencing services, ICT support
services, TAFE training packages and TAFE internet services.
Stakeholder satisfaction with ICT resources
Results from the 2012 School Opinion Survey showed that 93.0 per cent of students agreed that they used computers and other technologies at their school for learning, while 94.8 per cent agreed that they can access computers and other technologies at their school for learning. Additionally, 89.8 per cent of students agreed that they were encouraged to use computers and other technologies at their school for learning, and 92.5 per cent agreed that they enjoyed using computers and other technologies at their school for learning.
Of the school staff surveyed, 89.7 per cent agreed that they could access appropriate ICTs to do their job well. Additionally, 66.9 per cent of teaching staff were satisfied with the opportunities to develop their knowledge and skills in making ICT integral to learning, compared with 65.9 per cent in 2011.
Department of Education, Training and Employment | Annual Report 2012–13 75

Performance enhancement
Strategy: Strengthen use of performance information, research and evaluation
Risk management and business continuity
The department has a strong commitment to Enterprise Risk Management and Business Continuity. Risks are identified by applying the Australian/New Zealand and International Standard for Risk Management (AS/NZS ISO 31000:2009), which involves an understanding of the impact of uncertainty on the successful achievement of the department's objectives. The department’s business continuity planning aligns with the Standard for Business Continuity – Managing Disruption-Related Risk (AS/NZS 5050:2010) and ensures the department is well prepared for major adverse events while continuing to deliver its critical services.
Research and evaluation
The department works with universities and subject matter specialists to undertake independent research in key areas of client service delivery and to evaluate the impact and effectiveness of major programs and initiatives.
The department’s Evaluation Strategy 2012–16 demonstrates the department’s commitment to accountability and performance improvement to strengthen service delivery. The department undertakes evaluations through a phased process with formal governance throughout to provide assurance on the quality and credibility of the evaluation. Findings of evaluations are available online at www.dete.qld.gov.au/publications/strategic/evaluation/.
Internal Audit
Internal Audit has responsibility for assessment and evaluation of the effectiveness and efficiency of departmental financial and operational systems and activities, as well as provision of assistance, and identification of deficiencies in risk management. The Executive Director, Internal Audit, reports to the Director-General and also to the Audit and Risk Management Committee which meets on a quarterly basis, and operates with due regard to Queensland Treasury's best-practice Audit Committee Guidelines. Internal Audit operates in accordance with its charter, which was developed to comply with the International Standards for the Professional Practice of Internal Auditing and the Financial Accountability Act 2009.
Internal Audit works in accordance with a strategic and annual plan approved by the Director-General. During 2012–13, Internal Audit completed 511 audit reports, comprising 481 standard school audit reports, two TAFE audit reports, 21 general audit reports and seven information systems audit reports. Internal Audit also assisted the Queensland Audit Office with the audit of the department’s financial statements, audited several financial acquittals, and provided ad hoc advice to managers on a wide range of issues including IT advice on information systems. A quality assessment review of Internal Audit is carried out regularly by the Institute of Internal Auditors Australia in accordance with the above International Standards. Key achievements of Internal Audit during 2012–13 included:
piloting the Controls Optimisation Project across the procure-to-pay and Central Office general journal processes to review the efficiency, effectiveness and economy of agency internal controls
launching a Computer Assisted Audit Techniques data analytics centre of excellence within the branch to interrogate data in departmental systems for specific risks and to identify anomalies in an efficient manner
preparing a comprehensive risk-based Annual Audit Plan completing the Annual Audit Program in accordance with the approved Annual Audit Plan providing professional and timely advice to management and clients including assurance over
projects receiving positive feedback on the audit services provided formally obtaining acceptance of all audit recommendations reported, or confirmation that an alternate
solution would be implemented following up all audit recommendations made to ensure they had been actioned by management.
External scrutiny
Department of Education, Training and Employment | Annual Report 2012–13 76

The Auditor-General is responsible for the annual audits of public sector clients, including DETE. The Auditor-General provides Parliament with independent assessment of activities in the public sector. Information about Auditor-General, and other significant external audits and reviews of the department during the 2012–13 financial year, is available in Appendix 4.
Public interest disclosure
The department supports the investigation of public interest disclosures in keeping with its culture of openness and transparency. The department also protects from reprisal any employee who genuinely makes a disclosure of wrongdoing. The Queensland Ombudsman is responsible for the oversight of public interest disclosures and preparing an annual report on the operation of the Public Interest Disclosure Act 2010 (PID Act). Information regarding public interest disclosures under the PID Act is available at www.ombudsman.qld.gov.au/PublicationsandReports/PublicInterestDisclosures/tabid/339/Default.aspx
The department’s procedure Making and Managing a Public Interest Disclosure under the Public Interest Disclosure Act 2010 (Qld) supports the PID Act. The procedure aims to provide protection for those staff members who speak out about wrongdoing (make a public interest disclosure). A copy of the procedure is available at www.ppr.det.qld.gov.au/corp/hr/management/Pages/Making-and-Managing-a-Public-Interest-Disclosure-under-the-Public-Interest-Disclosure-Act-2010-(Qld).aspx.
Information systems and recordkeeping
All DETE records are 'public records' as defined under the Public Records Act 2002. Physical and electronic records are necessary for business operations, accountability requirements, and to meet community expectations. The department applies whole-of-government information policies and standards to departmental records, and continues to progressively implement the requirements of Information Standard 40: Recordkeeping. Effective document and records management provides:
reliable access to information assets informed decision-making cost-effective use of information resources business continuity compliance with legislation compliance with departmental policies and procedures.
The department uses an electronic Document and Records Management System (eDRMS) to manage its documents and records. The eDRMS assists departmental officers in corporate areas to effectively manage all types of corporate records. In 2012–13, the department:
provided public access to legislated delegations in the department’s Policy Instruments Framework commenced a review of the department’s policy instruments introduced new records retention and disposal processes for business records including, work related
processes, guidelines and training material for use by all departmental employees, including schools and TAFEs to efficiently manage the retention of electronic and physical records and their disposal once the retention period is exceeded
developed and submitted to Queensland State Archives for approval, two new Records Retention and Disposal Schedules for:- education records- early childhood education and care records.
developed ready for submission to Queensland State Archives, a Records Retention and Disposal Schedule for Vocational Education and Training records
reviewed and redeveloped the ‘Managing the Department’s Records’ procedure ready for publishing in the department’s Policy and Procedure Register.
Recordkeeping training and awareness
The department conducts recordkeeping training programs regularly to provide an opportunity for all departmental employees to attend or read information to better manage documents and records within the department. Face-to-face recordkeeping awareness sessions are also provided to departmental employees to improve their knowledge and awareness of the Recordkeeping Legislative Framework, key elements of recordkeeping, and access and availability of support material. Online recordkeeping awareness training is available to improve the accessibility of training programs to departmental staff.
Infrastructure
Department of Education, Training and Employment | Annual Report 2012–13 77

Strategy: Deliver high-quality, fit-for-purpose and future-focussed built and ICT infrastructure
Our infrastructure
Progressive infrastructure and modern equipment form the basic foundation for the delivery of world-class education services. The department's infrastructure program funds new facilities to deliver additional services and upgrades to existing facilities essential to keep pace with technological change and new teaching and training practices. The department's current infrastructure across the state includes:
1239 state schools, 26 Environmental and Outdoor Education Centres and one Sports Education Centre
11 TAFE institutes (excluding two statutory institutes) 153 early childhood facilities.
Major investment in education infrastructure during 2012–13 included: $53.7 million to continue the implementation of Year 7 as the first year of secondary school from 2015 $2.6 million of the $28.8 million total infrastructure component, to continue the implementation of the
Building our Future Schools Fund to invest $115 million over four years to provide improved infrastructure and planning for government and non-government schools
$61.2 million to open two new high schools, Pimpama State Secondary College and Mackay Northern Beaches State High School
$97.4 million to replace and enhance facilities at existing schools, including completion of projects for schools damaged by natural disasters
$3.9 million to acquire new employee housing and refurbish existing housing assets $16.0 million of Australian Government funding to upgrade or build new training facilities for schools
under the Trade Training Centres in Schools Program in Queensland $7.8 million to complete Stage 3 at Ormeau Woods State High School $10.3 million to complete Stage 2 at Springfield Central State High School and State School $0.4 million towards the construction of a new two-storey classroom building to replace existing
relocatable buildings at Ashgrove State School $0.5 million towards the construction of a new sports hall at The Gap State High School.
During 2012–13, significant investment in training infrastructure included $32.7 million to complete the Mackay Trade Training Centre.
Queensland Schools Public Private Partnership Project
On 22 May 2013, the Government announced that two new secondary schools and eight new primary schools would be built in high-growth areas of Pimpama, Burpengary, Pallara, Ripley Valley, Springfield, Griffin, Bellbird Park, Caboolture and Redbank Plains via an innovative Public Private Partnership.
The procurement phase is being run by Projects Queensland within Queensland Treasury and Trade and is expected to be completed by the end of 2013 at which time the project will be handed over to DETE to deliver. The 10 new schools will cater for 10 800 students during peak periods of enrolment and employ up to 540 teachers and 130 non-teaching staff. The project is also expected to generate 1700 jobs a year during the construction phase.
South East Queensland Schools Public Private Partnership Project
New schools are being built through the South East Queensland (SEQ) Schools Public Private Partnership Project, to meet the needs of an increasing SEQ population. In April 2009, the department entered into a contract with the Aspire Schools consortium, to design, build and maintain seven new schools in the high-growth areas of the Sunshine Coast, Western Corridor, Gold Coast and Redlands. As at 30 June 2013:
Stage 2 at Augusta State School, Coomera Rivers State School and WoodLinks State School were completed for the commencement of school in 2013
Stage 2 at Murrumba State Secondary College and Brightwater State School commenced and is scheduled to be completed for the commencement of school in 2014.
The project will generate an estimated 2150 new jobs over the four-and-a-half-year construction period, with additional jobs to be created during the 30-year ongoing maintenance period delivered by the consortium.
Department of Education, Training and Employment | Annual Report 2012–13 78

Asset maintenance
Well maintained facilities support student learning outcomes and the quality of the education and training experience offered in schools and TAFE institutes. Refurbishing and maintaining departmental assets is critical to ensure that those assets support contemporary service delivery. The department delivers both general and special maintenance programs to ensure that early childhood, school, TAFE and housing facilities are repaired and maintained to meet the requirements of the asset base.
In 2012–13, the Advancing Our Schools Maintenance (AoSM) initiative injected an additional $100 million into school maintenance. The objective of this significant investment is to reduce the pre-existing maintenance liability of approximately $300 million in Queensland state schools. Over the next two years a further $200 million will be invested in schools to address as many outstanding maintenance items as possible through the continuation of the AoSM in 2013–14 and the introduction of the Fixing Our Schools Fund in 2014–15.
As a part of the AoSM initiative, schools are now provided the choice to engage contractors directly to deliver planned and routine breakdown maintenance works, allowing for greater savings to be achieved to complete further maintenance in schools. QBuild continues to deliver high-risk maintenance services including service maintenance, asbestos removal, management of asbestos incidents, emergency and disaster response maintenance to all schools.
Early childhood education centres and school facilities
During 2012–13, the department's total expenditure for early childhood education centre and school maintenance was $193.3 million. This comprised:
$0.7 million for Early Childhood Education Centres $87.8 million for the School Annual Maintenance Program $100 million for the Advancing Our Schools Maintenance initiative $4.8 million for targeted maintenance.
TAFE facilities
The department allocated $11.6 million in 2012–13 for the maintenance of TAFE facilities. The statewide funding program funded service maintenance, building repairs and assessments, as well as the upkeep of critical infrastructure, such as electrical and sewerage services. Of this funding, $0.8 million was directed to asbestos removal.
Managing asbestos-containing material in DETE facilities
The department’s Asbestos Management Plan provides the operational context for schools and TAFE institutes, and provides clarity regarding the roles and responsibilities in the management of asbestos and any incidents that may arise. The department also continued asbestos management and awareness training to all staff responsible for the management of sites where facilities have assumed or confirmed asbestos-containing materials. The training covers the department's policy for the management of asbestos in the department’s facilities, asbestos management procedures and information about the Built Environment Materials Information Register. This training will be ongoing and delivered through regional/TAFE institute inductions. Further information about asbestos management can be found online at www.education.qld.gov.au/asbestos.
Staff accommodation
The department maintains 1516 facilities for accommodation, 164 of which are located in remote communities. The provision of suitable and safe employee accommodation is a very high priority for the department. In 2012–13, initiatives included allocating:
$2 million for minor works and air-conditioning in the department’s staff accommodation $8.3 million for maintenance of the department’s staff accommodation.
In April 2012, the Government approved the transfer of all government-owned employee housing to the Department of Housing and Public Works (DHPW) for ongoing management.
Partnerships
Department of Education, Training and Employment | Annual Report 2012–13 79

Strategy: Maximise opportunities through effective partnerships
International engagement
The Department of Education and Training International (DETi) has continued to mitigate external pressures affecting international education and training to remain competitive in the current global financial environment by delivering high-quality programs. During 2012–13, the department:
supported English as a Second Language (ESL) needs of international students through delivering approximately $2.27 million in funding to Queensland regions
attained a 98 per cent satisfaction rate from full-fee-paying international students in state schools regarding overall study experience
enrolled 1333 international FTE students holding a 571 Student Visa in Queensland state schools. These students participated in a variety of Education Queensland International (EQI) programs across the state
enrolled 1151 FTE dependants of adult students studying in Queensland training and higher education institutions in Queensland state schools
secured 50 Tokyo Board of Education Scholarship students for 2013. Funded and supported by the Tokyo Board of Education, the scholarship students are completing their studies in 50 EQI-accredited state high schools across Queensland
continued to mitigate risk associated with increased international competition through the introduction of new programs. From 2014, the Queensland Academies will join the suite of programs and pathways offered to international students.
In 2012–13, TAFE Queensland International continued to provide leadership to the Queensland public VET sector's international engagement to build sustainable growth. Through coordinated and strategic liaison with an extensive network of public RTOs, the department:
supported the public VET sector to develop a strong position internationally coordinated and managed joint projects, actively built relationships with international government
agencies, industry and educational sector representatives, and supported a cohesive and informed sector
supported the development of the Queensland public VET sector's capacity through the provision of seminars and professional development events
project managed the Papua New Guinea Technical and Vocation Education and Training Skill Scholarships (TVETSS) program that seeks to up-skill 2000 Papua New Guineans, in line with the Papua New Guinea Vision 2050. The Barrier Reef Institute of TAFE and Tropical North Queensland Institute of TAFE are responsible for the direct delivery of this five-year program.
As at June 2013, 1834 international student enrolments were recorded in VET programs offered by public VET providers in Queensland. This represents a 19.0 per cent decline in international VET enrolments over the previous 12 months. The decline has been linked to a number of factors including changes to migration policies, increased global competition from other countries, and the appreciation of the Australian dollar against other currencies.
Professional visit programs
Professional visit programs provide a great opportunity for international delegates to obtain professional and educational knowledge, to increase career potential, as well as professional and personal growth. These visits provide an excellent opportunity for networking with Queensland professionals who demonstrate world’s best practice. During 2012–13, EQI hosted 108 groups incorporating 1435 international delegates from 11 different countries under EQI professional visit programs.
Overseas travel
Overseas travel information may be found online at www.dete.qld.gov.au/publications/annual-reports/12-13/index.html.
Department of Education, Training and Employment | Annual Report 2012–13 80

Appendix 1
Executive Management Group membersDr Jim WatterstonDirector-General, DETE (Chair)
As Director-General, Dr Jim Watterston is responsible for leading and managing one of the state’s largest government departments, and for setting the direction of early childhood education and care, state schooling, training and employment for Queensland.
Jim was appointed as Director-General of Education, Training and Employment in April 2013. Jim has a wealth of education and leadership experience and achievement, including senior executive management roles with the Victorian, ACT and Western Australian education systems. Jim also has 14 years of experience as a principal in both primary and secondary schools and as the National President of the Australian Council of Educational Leaders, a Board Member of Education Services Australia and a Member of the Governing Council of the Victorian Institute of Teaching.
Prior to Jim’s appointment, Ms Annette Whitehead acted in this position following the retirement of Ms Julie Grantham in November 2012.
Annette WhiteheadDeputy Director-General, Policy and Programs
Ms Annette Whitehead is responsible for the regulation of education and care services, the management of grants programs for early years services and non-state education, and the development of the portfolio’s legislation and strategic policies for early childhood, schooling, indigenous, tertiary education and training. Annette is also responsible for providing services through Home Education and the Australian Music Examination Board and supports the Non-state School Accreditation Board and registration of education providers to international students. Annette assists the Minister for Education, Training and Employment on the Standing Council on Tertiary Education, Skills and Employment, and the Standing Council on School Education and Early Childhood, and leads negotiations for national projects/partnership agreements.
Annette has extensive experience in a diverse range of portfolios including ageing, child care and child safety. Prior to returning to the department in 2011, Annette coordinated social policy initiatives in the Department of the Premier and Cabinet.
Patrea WaltonDeputy Director-General, Education Queensland
As acting Deputy Director-General, Education Queensland, Ms Patrea Walton provides leadership in the development and implementation of innovative and effective education models and policies for over 500 000 students in 1239 Queensland state schools. In addition, Patrea has supervisory responsibility for the seven regional directors of the department.
Patrea was appointed to act as the Deputy Director-General, Education Queensland on 17 June 2013. Patrea has had previous experience in this role and has a strong background in the education sector as a principal, a supervisor of schools, an Assistant Director-General, a leader of the Flying Start reforms and, more recently, as the Chief Executive Officer of the QSA.
Department of Education, Training and Employment | Annual Report 2012–13 81

Jodi SchmidtDeputy Director-General, TAFE Queensland
As Deputy Director-General, TAFE Queensland, Ms Jodi Schmidt is responsible for leading and providing strategic direction for TAFE Queensland as it transitions to a separate legal entity as a statutory body. Jodi was appointed to this position on 10 June 2013.
Prior to her current appointment, Jodi was Deputy Director-General, Training and Employment with responsibility for Employment, Skills and Training Investment, DET International, Training Queensland and Support Services, as well as TAFE Queensland within DETE. Jodi moved to the department in 2010 to lead the implementation of new directions for the Training sector in Queensland.
Jodi joined the VET sector in 2005 as a Director at Southbank Institute of Technology and was instrumental in the development and implementation of new governance models for TAFE Institutes in Queensland. Prior to joining the VET sector, Jodi held various senior positions in both the public and private sectors both in Australia and the United Kingdom.
Drew EllemDeputy Director-General, Skills Reform, Training and Employment
Mr Drew Ellem joined the department as acting Deputy Director-General, Skills Reform, Training and Employment in June 2013. Drew has specific responsibility for implementing the Government’s broader VET reform agenda and overseeing DETE’s existing training and employment functions, supported by the Assistant Director-General, Employment, Skills and Training Investment.
Drew has 30 years’ experience in the Queensland Public Sector. Prior to his current appointment, Drew was Assistant Under Treasurer, Education Group, with responsibility for providing financial and policy advice on education, training and employment; police; justice; community safety; tourism, major events, small business and the Commonwealth Games; and agriculture, fisheries and forestry.
Geoff FavellAssistant Director-General, Employment, Skills and Training Investment
As Assistant Director-General, Employment, Skills and Training Investment, Mr Geoff Favell is responsible for Skills Investment, Skills and Employment, DET International and apprenticeships and traineeships under the Queensland Apprenticeships and Traineeship Office.
Geoff has over 29 years’ experience in the Queensland Public Sector with senior roles across the Employment, Industrial Relations and Training portfolios in metropolitan and regional centres.
Jeff HuntDeputy Director-General, Corporate Services
As Deputy Director-General, Corporate Services, Mr Jeff Hunt is responsible for the department’s human resources, information and technologies, finance, corporate procurement, infrastructure services, and corporate strategy and performance functions.
Prior to his current appointment, Jeff’s roles included Assistant Director-General, Corporate Strategy and Performance; Executive Director, Performance Monitoring and Reporting; and Director, Workforce Modelling and Resourcing. Jeff is also a former preschool and primary school teacher and primary principal, and has 25 years’ experience in the department.
Jeff currently represents the department on a range of committees and working groups. These include the Non-State Schools Eligibility for Government Funding Committee and the national Strategic Policy Working Group.
Department of Education, Training and Employment | Annual Report 2012–13 82

Adam BlackAssistant Director-General, Finance and Chief Finance Officer
As Assistant Director-General, Finance and Chief Finance Officer, Mr Adam Black provides strategic financial advice to the department’s executive, overall leadership to the department’s finance functions and has responsibilities under section 77 of the Financial Accountability Act 2009 (QLD).
Adam has over 20 years’ experience in the Queensland Public Sector and has been the department’s Chief Finance Officer since 2009. Prior to Adam’s appointment in DETE, he served as Chief Finance Officer in another Queensland government department. During his time with DETE, Adam has also worked in senior finance roles in both regional and central offices within DETE.
Adam is a Fellow Certified Practising Accountant and a Chartered Accountant.
Department of Education, Training and Employment | Annual Report 2012–13 83
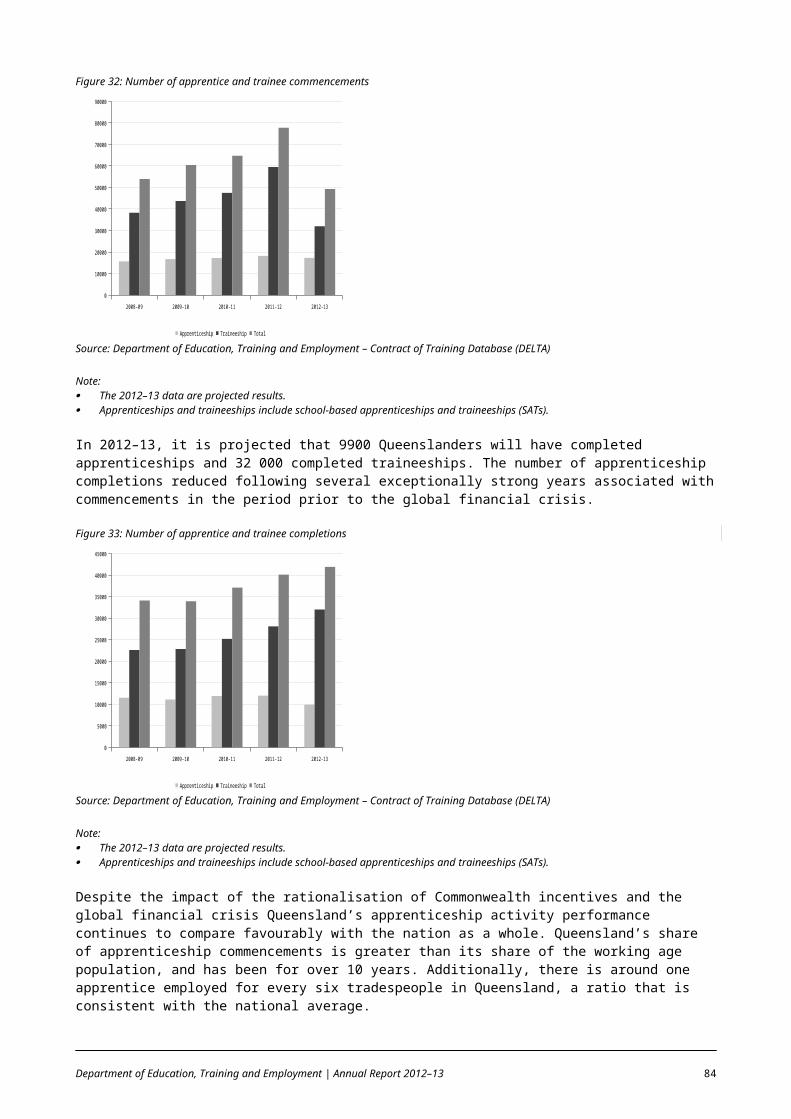
Appendix 2
Governance committees1. Portfolio Budget Review CommitteePurpose The Portfolio Budget Review Committee provides advice to the Cabinet Budget
Review Committee regarding strategies to develop, review and monitor current and future budgets, ensuring efficient and effective allocation of resources to achieve key government priorities.
Membership Minister for Education, Training and Employment (Chair) Director-General, DETE Deputy Director-General, Corporate services Assistant Director-General, Finance and Chief Financial Officer Chief of Staff, Office of the Minister for Education, Training and Employment Senior Policy Advisor, Office of the Minister for Education, Training and
EmploymentSignificant achievements 2012–13
Balanced the 2011–12 and 2012–13 portfolio budgets. Scrutinised portfolio budget allocations with business representatives. Considered the 2012–13 and 2013–14 budget submissions and endorsed
budget papers. Developed options to contribute to the State’s fiscal repair program. Considered the department’s Cabinet Budget Review Committee
submissions in support of the Government’s agenda. Monitored the portfolio’s financial performance.
2. Executive Management GroupPurpose EMG provides executive leadership to support the Director-General to positively
position the portfolio for the future, including setting and reviewing the strategic direction, priorities, and performance objectives of the department to enable the efficient and effective achievement of outcomes for Queensland. The group also ensures departmental legislative, policy and management accountabilities are met.EMG is supported by the Budget Committee, Investment Committee, Integrated Service Delivery Board and Special Purpose Taskforces (when required).
Membership Director-General, DETE (Chair) Deputy Director-General, Policy and Programs Deputy Director-General, Education Queensland Deputy Director-General, TAFE Queensland Deputy Director-General, Skills Reform, Training and Employment Assistant Director-General, Employment, Skills and Training Investment Deputy Director-General, Corporate Services Assistant Director-General, Finance and Chief Finance Officer
Significant achievements 2012–13
Implemented fiscal repair strategies, including Public Sector Renewal initiatives.
Implemented red tape reduction initiatives with quantifiable benefits to business and/or the community.
Delivered Government election commitments.
Department of Education, Training and Employment | Annual Report 2012–13 84

3. Audit and Risk Management CommitteePurpose The Audit and Risk Management Committee (ARMC) provides independent
audit and risk management advice to the Director-General to assist in the discharge of financial management responsibilities under the Financial Accountability Act 2009 and the Financial and Performance Management Standard 2009.The Fraud and Corruption Control Committee reports through the ARMC as a sub-committee.
Membership Mr Robert Forbes, External Member (Chair) – paid $800 per meeting Dr Jim Watterston, Director-General, DETE Ms Patrea Walton, Acting Deputy Director-General, Education Queensland Mr Jeff Hunt, Deputy Director-General, Corporate Services Ms Jodi Schmidt, Deputy Director-General, TAFE Queensland External Member – vacant
Significant achievements 2012–13
Approved the 2012–13 Internal Audit Plan. Evaluated the quality and facilitated the practical discharge of the internal
audit function, particularly in respect of planning, monitoring and reporting. Continued a stringent approach to the follow-up of audit recommendations. Considered all audit recommendations by the Queensland Audit Office,
including performance audit recommendations. Reviewed and endorsed the department’s financial statements. Monitored a range of internal audit performance measures to ensure a
robust accountability framework for the department. Noted the Enterprise Risk Management Framework 2012–16 and the
bi-annual Corporate Risk Reports for 2012–13.
4. Fraud and Corruption Control Committee (sub-committee)Purpose The Fraud and Corruption Control Committee monitors and co-ordinates the
various fraud and corruption mitigation mechanisms in effect in the department and reports through the ARMC.
5. Budget CommitteePurpose The Budget Committee provides advice to EMG regarding strategies to develop,
review and monitor current and future internal budgets, ensuring efficient and effective allocation of resources to achieve key departmental and government priorities.
Membership Deputy Director-General, Corporate Services (Chair) Director-General, DETE Assistant Director-General, Finance and Chief Finance Officer Deputy Director-General, Education Queensland (EMG member on a
12-month rotational basis)Significant achievements 2012–13
Balanced the 2011–12 and 2012–13 internal budgets. Supported the 2012–13 and 2013–14 budget submissions. Developed options to contribute to the State’s fiscal repair program. Monitored the financial performance of divisions, regions and TAFE
institutes against allocations on a monthly basis, including the achievement of savings required to repair the State’s fiscal position.
Conducted the Mid-Year Review to ensure emerging financial issues were appropriately addressed.
Monitored the five-year budget plan to ensure the budget remained balanced.
Department of Education, Training and Employment | Annual Report 2012–13 85

6. Investment CommitteePurpose The Investment Committee drives strategic discussion on financial strategy and
related long-term financial planning issues and provides advice to EMG on investment strategies to positively position the department for the future and to enable the efficient achievement of outcomes.The Strategic Assets Planning Committee, Information Steering Committee, Data Analytics Committee, DETE Health, Safety and Wellbeing Committee and DETE Evaluation Committee are sub-committees that report through the Investment Committee.
Membership Deputy Director-General, Corporate Services (Chair) Deputy Director-General, Policy and Programs Deputy Director-General, Education Queensland Deputy Director-General, Skills Reform, Training and Employment Assistant Director-General, Finance and Chief Finance Officer Assistant Director-General, Information and Technologies and Chief
Information Officer Assistant Director-General, Human Resources Assistant Director-General, Infrastructure Services Executive Director, Corporate Procurement Executive Director, Performance Monitoring and Reporting Executive Director, Governance Strategy and Planning
Significant achievements 2012–13
Endorsed the Long Term Financial Plan 2013–17, with closer alignment to the department’s Strategic Plan.
Considered the draft Financial Sustainability Progress Report. Commenced a series of presentations on progress toward financial
sustainability. Considered the project plan for review of long-term financial scenario
modelling. Approved the ICT Program of Work 2012–13 and the DETE Evaluation
Schedule 2012–16. Noted the regular updates from sub-committees.
7. Strategic Asset Planning Committee (sub-committee)Purpose The Strategic Asset Planning Committee provides advice and determines and
monitors the strategic direction and investment in facilities and asset maintenance. The committee reviews and endorses infrastructure policy and contributes to policy development.
8. Information Steering Committee (sub-committee)Purpose The Information Steering Committee oversees the strategic directions and
proactively manages the investments in information management and information and communication technologies within the department. The committee provides advice in relation to directing the strategy, policy and optimal utilisation of investments in information and technology resources ensuring alignment with departmental and whole-of-Government priorities.
9. Data Analytics Committee (sub-committee)Purpose The Data Analytics Committee undertakes an information management
governance function to promote the development of sustainable analytic and performance management practices across the department. The committee provides advice regarding policy development and the synergies and collective impact of major policy initiatives to the achievement of the portfolio’s priorities.
10. DETE Health, Safety and Wellbeing Committee (sub-committee)Purpose The DETE Health, Safety and Wellbeing Committee acts as the peak body for
health, safety and wellbeing and plays a strategic role in defining the direction for the department in managing workplace health, safety and wellbeing issues.
11. DETE Evaluation Committee (sub-committee)
Department of Education, Training and Employment | Annual Report 2012–13 86

Purpose The DETE Evaluation Committee provides whole-of-department oversight, advice and endorsement for evaluation. The committee is responsible for the four-year rolling evaluation schedule, supports continuous improvement in evaluation practice, and ensures that scheduled evaluations are rigorous, relevant to the department and support decision-making and performance improvement.
12. Integrated Service Delivery BoardPurpose The Integrated Service Delivery Board supports integrated and effective service
delivery across the department.Membership Director-General, DETE (Chair)
Deputy Director-General, Policy and Programs Deputy Director-General, Education Queensland Deputy Director-General, Skills Reform, Training and Employment Assistant Director-General, Employment, Skills and Training Investment Deputy Director-General, Corporate Services Assistant Director-General, Finance and Chief Finance Officer Regional Director, Central Queensland Regional Director, South East Region Regional Director, Far North Queensland Region Regional Director, Darling Downs South West Region Regional Director, North Queensland Region Regional Director, North Coast Region Regional Director, Metropolitan Region
Significant achievements 2012–13
Championed strategic service delivery implementation, alignment and improvement.
Undertook Regional Performance Reviews for the financial year. Endorsed the Regional Operational Plans.
13. Special Purpose TaskforcesPurpose Special Purpose Taskforces are formed when needed to deal with emerging
issues.There were no Special Purpose Taskforces during 2012–13.
Department of Education, Training and Employment | Annual Report 2012–13 87

Appendix 3
Statutory bodies and other entitiesAustralian Music Examination Board (AMEB)Objective/function AMEB was constituted by agreement between the Ministers for Education of
Queensland, New South Wales and Tasmania and the Universities of Melbourne, Adelaide and Western Australia.
Constituting Act Not applicable.Financial reporting arrangement
Included in the financial statements of this report.
Cost to DETE Nil.Achievements 2012–13 AMEB examined approximately 19 000 candidates in music and speech and
drama in 98 centres across the state. Primary and secondary school children made up 94.8% of candidates.At the Annual Presentation of Awards and Diploma Concert in March 2013, 116 candidates were awarded their diplomas in speech and drama, and in music.
Aviation AustraliaObjective/function In 2001, Aviation Australia Pty Ltd was established by DETE, and the former
Department of State Development, Trade and Innovation to provide aviation training.
Constituting Act Not applicable.Financial reporting arrangement
Included as a note in the financial statements of this report.
Cost to DETE Nil.Achievements 2012–13 Aviation Australia provided training for:
56 participants — Certificate IV in Aeroskills: Mechanical 37 participants — Certificate IV in Aeroskills: Structures 36 participants — Certificate IV in Aeroskills: Avionics.Aviation Australia has provided employment services for 30 aviation companies and approximately 79 individuals, of whom 25 gained apprenticeships and three gained other employment in the aviation industry.Aviation Australia also provided fee-for-service training for a number of courses.
Gold Coast Institute of TAFE (GCIT)Objective/function GCIT was established as a statutory body on 1 July 2008. The institute’s vision
is to be an internationally-renowned provider of outstanding vocational services, and it will achieve this vision by bringing together exceptional people to produce highly-sought-after graduates.On 1 July 2013, GCIT ceased operating as a statutory body.
Constituting Act Vocational Education, Training and Employment Act 2000.Financial reporting arrangement
GCIT tables its own annual report.
Cost to DETE Costings are outlined in the GCIT final annual report.Achievements 2012–13 Achievements are outlined in the GCIT final annual report.
Department of Education, Training and Employment | Annual Report 2012–13 88
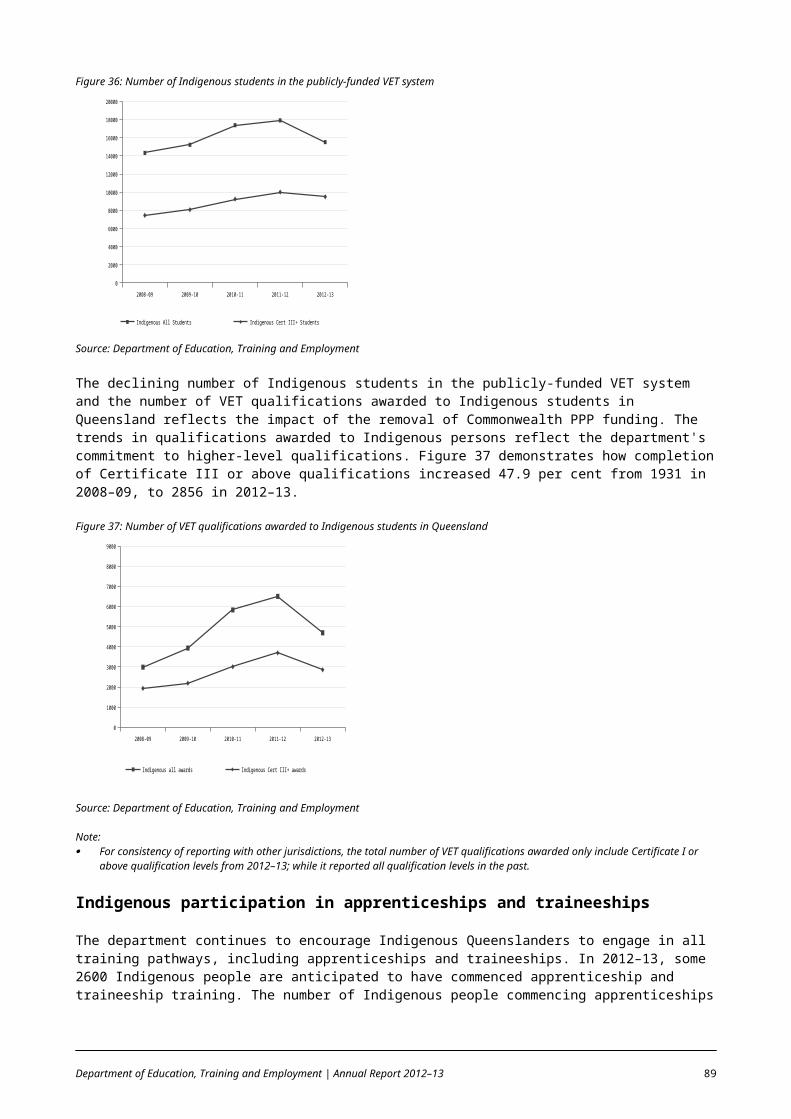
Grammar schoolsObjective/function A school that has either obtained ministerial approval to establish as a
grammar school, or is established by the Grammar School Act 1975, and has met the accreditation criteria prescribed by the Education (Accreditation of Non-State Schools) Act 2001.
Constituting Act Grammar Schools Act 1975.Financial reporting arrangement
The following boards table their own annual report: Board of Trustees of the Brisbane Girls’ Grammar School Board of Trustees of the Brisbane Grammar School Board of Trustees of the Ipswich Girls’ Grammar School Board of Trustees of the Ipswich Grammar School Board of Trustees of the Rockhampton Girls’ Grammar School Board of Trustees of the Rockhampton Grammar School Board of Trustees of the Toowoomba Grammar School Board of Trustees of the Townsville Grammar School.
Cost to DETE Costings are outlined in the individual annual reports.Achievements 2012–13 Achievements are outlined in the individual annual reports.
Non-State Schools Accreditation BoardObjective/function The functions of the Non-State Schools Accreditation Board include the
accreditation of new non-state schools, and monitoring the ongoing compliance of non-state schools with the legislated requirements for accreditation.
Constituting Act Education (Accreditation of Non-State Schools) Act 2001.Financial reporting arrangement
The Non-State Schools Accreditation Board tables its own annual report.
Cost to DETE Costings are outlined in the board’s annual report.Achievements 2012–13 Achievements are outlined in the board’s annual report.
Non-State Schools Eligibility for Government Funding CommitteeObjective/function The Non-State Schools Eligibility for Government Funding Committee is an
independent committee of the Non-State Schools Accreditation Board. The funding committee assesses applications for government funding eligibility for non-state schools, and makes recommendations to the Minister.
Constituting Act Education (Accreditation of Non-State Schools) Act 2001.Financial reporting arrangement
Expenditure related to the funding committee is included in the annual report tabled by the Non-State Schools Accreditation Board.
Cost to DETE Costings are outlined in the board’s annual report.Achievements 2012–13 Achievements are outlined in the board’s annual report.
Parents and Citizens’ Associations (P&Cs)Objective/function P&Cs play an important role in education service delivery through their
promotion of parent participation and encouragement of collaboration between parents, students, school communities and non-Government entities to foster a commitment to achieving the best educational outcomes for children and young people.
Constituting Act P&Cs are regulated under the Education (General Provisions) Act 2006.Financial reporting arrangement
P&Cs Qld audited financial statements, and reports from regional and state committees, are presented to the state annual general meeting in the President’s report.
Cost to DETE In 2012–13, DETE paid $287 216 (GST inclusive) to P&Cs Qld under the terms of a partnership agreement. This increases each year in line with the Consumer Price Index.Education Queensland provides a grant to new P&Cs in the amount of $4000 per new school. DETE also funds the P&Cs Qld Voluntary Workers insurance premium. In 2013, this amount was $37 086 (GST inclusive).
Achievements 2012–13 Achievements include:
Department of Education, Training and Employment | Annual Report 2012–13 89

the 2012 State Conference was held in Townsville the Queensland Council of Parents and Citizens Association (QCPCA)
Incorporated was officially dissolved and transferred to QCPCA trading as P&Cs Qld
conducted a Webinar Series of the P&C executive members and grant writing
DETE launched the Parent and Community Engagement Framework following close collaboration with P&Cs Qld
commenced Area Skilling Days unveiled a new P&Cs Qld logo developed a Facebook web presence.
Queensland Indigenous Education Consultative Committee (QIECC)Objective/function The QIECC is an independent advisory body to the Queensland and Australian
governments on issues relevant to Aboriginal and Torres Strait Islander education. QIECC enables governments to consult with Aboriginal and Torres Strait Islander peoples and communities on education and training views and issues in Queensland.The QIECC takes community views into account and focuses on strategies for improving the education outcomes of Queensland’s Aboriginal and Torres Strait Islander students from the early years of schooling through to post school training and higher education. This advice includes views and concerns on the effectiveness of Commonwealth and State Government education programs and strategies.
Constituting Act Not applicable.Financial reporting arrangement
Financial reporting provided to the Australian Government.
Cost to DETE QIECC is funded by the Australian Government.Achievements 2012–13 The QIECC held three business meetings during 2012–13. The meetings were
held in: Brisbane during December 2012 Brisbane during February 2013 Hervey Bay during May 2013.Two community forums were also hosted in association with business meetings and took place in: Atherton during May 2012 Hervey Bay during May 2013.The reports of each of these community forums have been circulated to key stakeholders and posted on the QIECC website.The QIECC’s Parent and Community Engagement Coordinators’ Roundtable, held in 2013, attracted approximately 150 delegates from across Australia. The two-day forum was based on the theme ‘Evidence-Innovation-Networking’.A quarterly newsletter Community Connections is also published and posted on the QIECC’s website at www.qiecc.eq.edu.au.
Queensland College of Teachers (QCT)Objective/function The QCT regulates and promotes the teaching profession in Queensland.Constituting Act Education (Queensland College of Teachers) Act 2005.Financial reporting arrangement
The QCT tables its own annual report. The QCT must develop a budget for each financial year and provide the budget to the Minister for approval.
Cost to DETE Costings are outlined in the QCT annual report.Achievements 2012–13 Achievements are outlined in the QCT annual report.
Department of Education, Training and Employment | Annual Report 2012–13 90
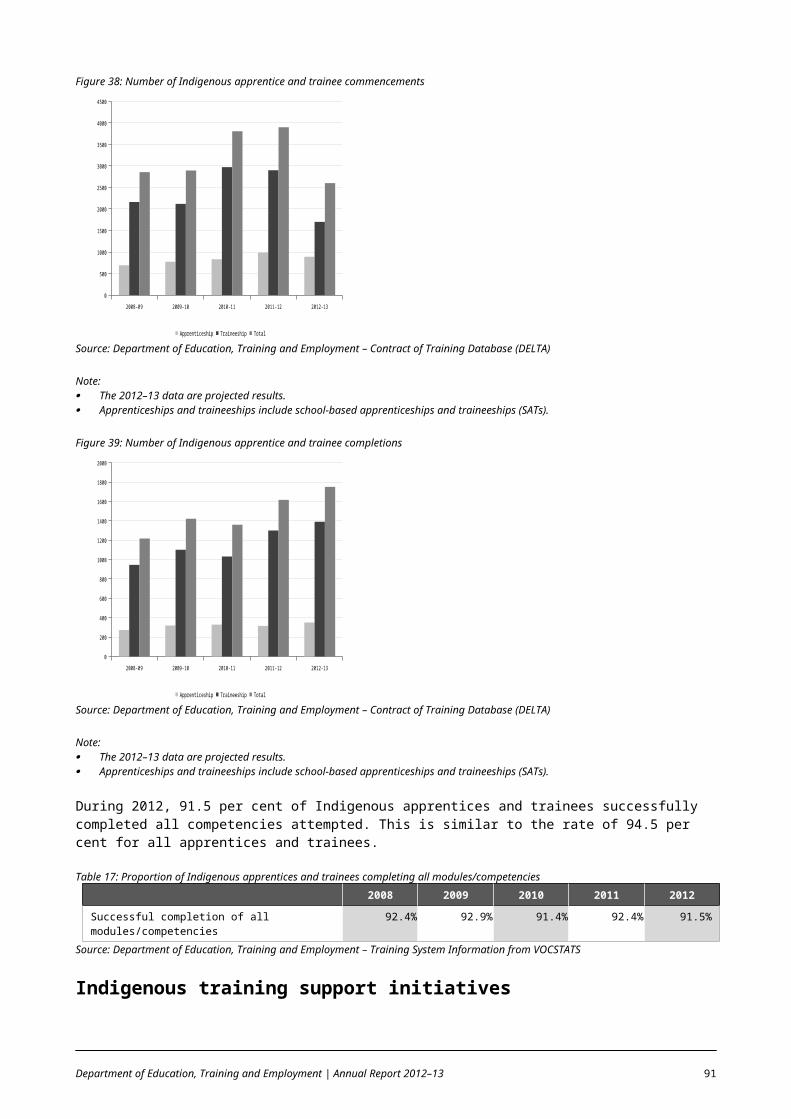
Queensland Education Leadership Institute (QELI)Objective/function QELI is a not-for-profit company limited by guarantee, jointly owned by the
three school sectors. QELI provides a range of programs, training, courses and related services in school leadership development for current and aspiring school leaders across the state, independent and Catholic education sectors.
Constituting Act Not applicable.Financial reporting arrangement
QELI reports to its members in accordance with its constitution and the Corporations Act 2001(Cth).
Cost to DETE Costings are outlined in financial reporting to members.Achievements 2012–13 Achievements are outlined in reporting to members.
Queensland Studies AuthorityObjective/function The functions of the QSA include:
the development and approval of syllabuses testing and assessment moderation certification accreditation vocational education tertiary entrance research.
Constituting Act Education (Queensland Studies Authority) Act 2002.Financial reporting arrangement
The QSA tables its own annual report. The QSA must develop a budget for each financial year and provide the budget to the Minister for approval.
Cost to DETE Costings are outlined in the QSA annual report.Achievements 2012–13 Achievements are outlined in the QSA annual report.
Skills QueenslandObjective/function Skills Queensland was established as a statutory body on 20 December 2010,
and formally commenced operations on 1 January 2011. Skills Queensland is responsible for aligning Queensland’s skills system with the needs of employers, individuals, industry and the community to alleviate skills shortages and better position Queensland to address skills needs.
Constituting Act Vocational Education, Training and Employment Act 2000.Financial reporting arrangement
Skills Queensland tables its own annual report.
Cost to DETE Costings are outlined in the Skills Queensland annual report.Achievements 2012–13 Achievements are outlined in the Skills Queensland annual report.
Southbank Institute of Technology (SBIT)Objective/function SBIT was established as a statutory body on 1 April 2008. The institute’s vision
is to empower VET and higher education students for rewarding careers in the global community as Queensland’s lead VET provider of high-level skills training. SBIT offers a range of high-level vocational qualifications, associate degrees, university pathways and articulation arrangements in key industries.On 1 July 2013, SBIT ceased operating as a statutory body.
Constituting Act Vocational Education, Training and Employment Act 2000.Financial reporting arrangement
SBIT tables its own annual report.
Cost to DETE Costings are outlined in the SBIT final annual report.Achievements 2012–13 Achievements are outlined in the SBIT final annual report.
Department of Education, Training and Employment | Annual Report 2012–13 91

TAFE Queensland Institute CouncilsObjective/function TAFE Queensland Institute Councils provide vision, strategic direction,
guidance and support to TAFE Queensland institutes. TAFE Queensland Institute Councils also make a significant contribution to the maintenance of strategic industry partnerships.TAFE Queensland Institute Councils have the following functions: to support VET through the institute to advise and report on the activities of the institute to:
the Minister the Institute Director.
to develop and approve institute directions.The Institute Council has power to do all things necessary or desirable to be done for the performance of its functions.
Constituting Act Vocational Education, Training and Employment Act 2000.Financial reporting arrangement
TAFE Queensland Institute Council costs are contained within the department’s financial statements.
Cost to DETE $28 174Achievements 2012–13 In 2012–13, TAFE Queensland Institute Councils provided leadership as TAFE
institutes undertook significant organisational restructures in response to changing market conditions and prepared for the introduction of more commercial governance arrangements.
The Building and Construction Industry Training Fund (BCITF) (Qld) trading as Construction Skills QueenslandObjective/function The BCITF was established on 1 January 1999 to assist in the acquisition and
enhancement of the knowledge, skills, training and education of workers in the building and construction industry.On 1 September 2005, the company revised its constitution to establish the Minister as sole shareholder.
Constituting Act Not applicable.Financial reporting arrangement
BCITF tables its own annual report.
Cost to DETE Costings are outlined in the BCITF annual report.Achievements 2012–13 Achievements are outlined in the BCITF annual report.
Training OmbudsmanObjective/function The Training Ombudsman was established to provide an impartial and
independent office for resolving complaints pertaining to apprenticeships and traineeships, particularly matters relating to the quality of training received and the environment in which it is received.On 1 November 2012, the Training Ombudsman ceased operating.
Constituting Act Vocational Education, Training and Employment Act 2000.Financial reporting arrangement
Included in the financial statements of this report, and referenced in the Training Ombudsman final annual report.
Cost to DETE Costings are included in the financial statements of this report, and referenced in the Training Ombudsman final annual report.
Achievements 2012–13 Achievements are outlined in the Training Ombudsman’s final annual report.
UniversitiesObjective/function Queensland universities provide university services across the state.Constituting Act Queensland universities have their own constituting Acts.Financial reporting arrangement
Each university tables its own annual report: Central Queensland University Griffith University James Cook University Queensland University of Technology
Department of Education, Training and Employment | Annual Report 2012–13 92

The University of Queensland University of Southern Queensland University of the Sunshine Coast.
Cost to DETE Costings are outlined in the individual annual reports.Achievements 2012–13 Achievements are outlined in the individual annual reports.
Department of Education, Training and Employment | Annual Report 2012–13 93

Appendix 4
External scrutinyQueensland Audit Office reports to ParliamentReports to Parliament tabled in the 2012–13 financial year are available at www.qao.qld.gov.au/reports-tabled-in-2012-13-financial-year.
Report to Parliament No. 2 for 2012–13: Follow up of 2010 audit recommendations
The Queensland Audit Office (QAO) tabled this report in Parliament in October 2012. This report includes a follow-up survey of recommendations made in the Using Student Information to Inform Teaching and Learning Audit (Report No. 6 for 2010). The QAO note that DETE has made good progress towards implementing the 2010 audit report recommendations, with six recommendations fully implemented and the remaining two partially implemented.
Report to Parliament No. 5 for 2012–13: Results of audit: State public sector entities for 2011–12
The QAO tabled this report in Parliament in November 2012. This report summarises the results of all 2011–12 State public sector entity audits. The report includes favourable comments on the preparation of financial statements for all entities in the portfolio required to produce financial statements. Unqualified opinions were issued for all 11 entities. Chapter 8 discusses DETE’s results of audits and includes topical issues and general challenges the QAO see for the department, as well as significant transactions and events and future financial risk areas.
Report to Parliament No. 7 for 2012–13: Results of audit: Queensland state government financial statements 2011–12
The QAO tabled this report in Parliament in March 2013. This report provides further information on the results of the Queensland State Government audit beyond the independent audit opinion. It contains insights into the Total State Sector's and General Government Sector's financial performance in 2011–12, its position at the end of the year, and factors impacting on the financial sustainability of the state.
Report to Parliament No. 9 for 2012–13: Fraud risk management
The QAO tabled this report in Parliament in March 2013. The QAO examined whether selected Queensland public sector agencies are effectively managing fraud risks. They used recognised best-practice criteria to assess the control measures in three agencies (Queensland Health including six Hospital and Health Services, Department of Housing and Public Works and The Public Trustee) for preventing, detecting and responding to fraud. The three agencies were assessed against 15 attributes of better practice fraud control programs.
The QAO recommended that all public sector agencies should assess their fraud control program against the better practice principles in their report and, as required, implement a plan to address deficiencies identified by this self-assessment. Where not in place, agencies should conduct and regularly update their fraud risk assessments; implement routine data analytics over areas identified as inherently susceptible to fraud; and use their fraud data to inform ongoing development of fraud control programs.
Department of Education, Training and Employment | Annual Report 2012–13 94
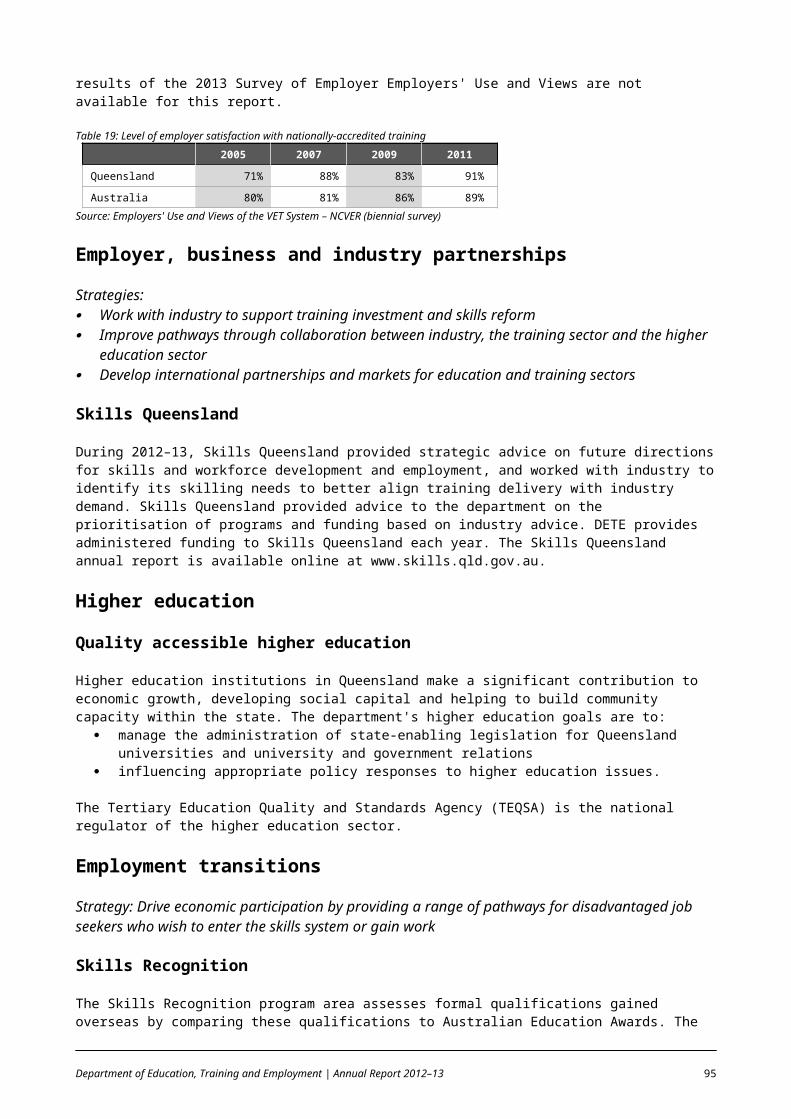
Report to Parliament No. 11 for 2012–13: Results of audits: Education sector entities 2012
The QAO tabled this report in Parliament in April 2013. This report summarises the results of the 2012 financial audits of universities and grammar schools, and the entities they control. Overall the audit found that:
the financial statements of universities and grammar schools were timely and of good quality, with a few exceptions
the number of control weaknesses identified decreased from the prior year but there is still scope for improvement in the performance and monitoring of internal controls
financially, universities and most grammar schools remain in a sound position, except Ipswich Grammar School and, to a lesser extent, Ipswich Girls' Grammar School.
The report made one recommendation aimed at Ipswich Grammar School and Ipswich Girls' Grammar School continuing their efforts to improve future performance.
External reviews
Evaluation of Skilling Queenslanders for Work
Deloitte Access Economics was engaged by DETE to evaluate the impact and effectiveness of Skilling Queenslanders for Work (SQW) in meeting its program objectives, over the period 2007–08 to 2009–10. The purpose of the evaluation was to determine whether SQW constitutes good public policy, by examining its effectiveness and efficiency in improving the labour market outcomes of disadvantaged Queensland job seekers. The report is available at www.dete.qld.gov.au/publications/strategic/evaluation/pdf/evaluation-skilling-queenslanders-work.pdf.
Queensland Commission of Audit
The Queensland Commission of Audit Final Report was tabled in Parliament by the Treasurer and Minister for Trade on 30 April 2013. The report provides information on the Queensland government’s current and forecast financial position, and recommendations on strategies to strengthen the Queensland economy, restore the State’s financial position (including its AAA credit rating) and to ensure value for money in the delivery of frontline services. The Commission’s final report is available at www.commissionofaudit.qld.gov.au/.
Department of Education, Training and Employment | Annual Report 2012–13 95

Glossary
AApprenticeship A system of training regulated by law or custom, which combines on-the-
job training and work experience with formal off-the-job training, while in paid employment.
AS/NZS ISO 31000:2009 An International Standard which provides principles and generic guidelines on risk management.
AS/NZS 5050:2010 A Standard which describes the application of the principles, framework and process for risk management, as set out in AS/NZS ISO 31000:2009, to disruption-related risk.
Australian Curriculum, Assessment and Reporting Authority
National body responsible for the development of the Australian Curriculum from kindergarten to Year 12, and for a national assessment program and national data collection and reporting.
Australian Curriculum The national curriculum being developed for students in K(Prep)–Year 12 covering subject areas outlined in the Melbourne Declaration (2008).
Australian Music Examination Board (AMEB)
Provides a graded system of examinations in music, speech and drama, as well as syllabuses, educative services and other publications, to teachers, examiners and candidates.
Australian Qualifications Framework
A comprehensive nationally-consistent framework incorporating all qualifications recognised in post-compulsory education throughout Australia. The framework identifies six levels in the VET sector: Certificate I, Certificate II, Certificate III, Certificate IV, Diploma and Advanced Diploma.
Aviation Australia The Centre of Excellence established by the government in 2001 to provide skills development for the aviation and aerospace industries.
CCentres of Excellence A partnership between industry and government to provide a proactive
coordinated response to skills shortages and to meet labour market needs. The current centres of excellence service the aviation, mining, building and construction, manufacturing and engineering and energy industries.
Council of Australian Governments (COAG)
The peak intergovernmental forum in Australia. COAG comprises the Prime Minister, state premiers, territory chief ministers and the President of the Australian Local Government Association. It initiates, develops and monitors the implementation of policy reforms that are of national significance and which require cooperative action by Australian governments.
Crèche and Kindergarten Association Limited
An association providing kindergarten and preschool services to three and four year olds.
EEducation Queensland International (EQI)
The trading name for the department's international activities. EQI operates within DETE International (DETEi), within the Tertiary and Non-State Education division of the department. DETEi is the key coordination point for international activity, both within Queensland and where the department exports its education and training expertise. DETE (trading as EQI) is a registered education provider on the Commonwealth Register of Institutions and Courses for Overseas Students (CRICOS).
English as a Second Language (ESL)
A program in Queensland state schools that provides English language support to students from language backgrounds other than English. The program aims to develop these students' English to enable them to participate fully in mainstream classrooms and to enhance their learning outcomes.
Essential learnings Clear statements of what is important for all students to know and be able
Department of Education, Training and Employment | Annual Report 2012–13 96

to do at the end of Years 3, 5, 7 and 9, outlined in the QCAR Framework. They describe the key concepts, facts, procedures and ways of working that students need for ongoing learning, social and personal competence and participation in a democratic society. They encompass knowledge, skills and attributes that are specific to content areas and required for complex, real-life challenges, and social and personal competence needed for good communication and ongoing learning.
Education Support Funding Program
Funds made available by the Department of Child Safety to DETE to assist students across the state, Catholic and independent schooling sectors. Assistance must be linked to goals identified through the education support planning process. Education Support Plans are the trigger for identifying appropriate strategies to address priority education needs for these students.
FFull-time equivalents (FTEs) A representative number that is calculated by assessing the hours worked
over the financial year by all full-time and part-time employees, and converting this to a corresponding number of employees as if all staff were full-time.
GGold Coast Institute of TAFE (GCIT)
An independent statutory authority in Queensland's TAFE network as from 1 July 2008. GCIT is a publicly-funded training provider and operates within the Queensland Government guidelines of DETE.
IInformation and communication technologies (ICT)
An umbrella term that describes the use of all technologies in the manipulation and communication of information.
International Baccalaureate Diploma (IBD)
An internationally recognised, two-year curriculum that prepares 16 to 19 year old students for university. Students receive credit for subjects studied in the program at leading universities around the world, reducing the time required to complete a Bachelor degree.
KKey performance indicator (KPI)
Tracking indicator used to measure the achievement of outputs against goals.
Kindergarten program An education program planned and delivered by a qualified early childhood teacher for children in the year prior to Prep (i.e. who are least four years old by 30 June in the year they participate) for at least 15 hours per week, 40 weeks a year. Government-approved kindergarten programs are available in a range of settings, including community kindergarten services, kindergarten services operated by non-state schools, long day care services, and selected schools in discrete Indigenous communities.
NNational Assessment Program Literacy and Numeracy (NAPLAN)
Annual tests conducted nationally in Years 3, 5, 7 and 9 covering reading, writing, spelling, grammar and punctuation, and numeracy. The results provide information for teachers and schools on individual student performance on a national basis. This is used to identify areas of strength and where further assistance may be required. NAPLAN tests are part of a collaborative process between states and territories, the Australian Government and non-government schools sectors.
National Centre for Vocational Education Research (NCVER)
Australia's principal provider of VET research and statistics.
National Minimum Standard (NMS)
Nationally-set standards against which the results of NAPLAN tests are compared. For each year level, a minimum standard is defined and
Department of Education, Training and Employment | Annual Report 2012–13 97

located on the common underlying scale. Band 2 is the minimum standard for Year 3; Band 4 is the minimum standard for Year 5; Band 5 is the minimum standard for Year 7; and Band 6 is the minimum standard for Year 9.
National Partnership Agreement
An agreement between the Commonwealth and the states and territories to facilitate coordination, monitoring and delivery of strategies to improve service delivery.
National Quality Framework (NQF)
A 2007 COAG partnership between Commonwealth, state and territory governments to pursue substantial reform in the areas of education, skills and early childhood development, and deliver significant improvements in human capital.
OOneSchool An automated system in all Queensland state schools which, when fully
implemented, will provide teachers, administrators and principals with secure easy access to information about students, curriculum, assessment and progress reporting, school facilities and school finance.
Operational plan Translates agency objectives into the services (outputs) that it will provide to its clients, and the standards for those services (performance measures).
Overall Position (OP) A student's statewide rank based on overall achievement in QSA-approved subjects. It indicates how well the student has done in comparison to all other OP-eligible students in Queensland. Students who want an OP must study 20 semester units of QSA subjects, including at least three subjects for four semesters each, and must sit the Queensland Core Skills test.
PParents and Citizens' Association (P&C)
A group of community-minded parents and citizens who take on a more formal role to assist a school by providing feedback on school policies and activities, additional resources to be used to enhance student learning, and providing parents with extra opportunities to be involved in their child's education.
People from non-English speaking backgrounds
An equity and diversity group identifying people who have migrated to Australia and whose first language is a language other than English.
Portfolio The department or group of departments for which a Minister is responsible.
Prep A full-time, non-compulsory program that replaced preschool. It runs five days a week and follows the established school times and routines. Taking a play and inquiry-based approach to learning, Prep is offered at every Queensland state school and selected independent and Catholic schools.
Pre-Prep Refer to kindergarten program.Public-private partnership A mutually beneficial partnership between the public and private sectors
aimed at achieving value for money and the provision of services that would otherwise be wholly funded by the public sector.
QQueensland Curriculum, Assessment and Reporting (QCAR) Framework
The Queensland Curriculum, Assessment and Reporting (QCAR) Framework informs the learning programs for all state school students in Years 1 to 9.
Queensland Studies Authority (QSA)
A statutory body of the Queensland Government, providing Prep to Year 12 syllabuses, assessment, reporting, testing, accreditation and certification services for Queensland schools.
Department of Education, Training and Employment | Annual Report 2012–13 98

RRecognition of Prior Learning (RPL)
The recognition of competencies currently held, regardless of how, when or where the learning occurred. A person's skills and knowledge acquired through previous formal or informal education and training, work or life experience may be used to grant status or credit in a subject or module.
Registered training organisation (RTO)
An organisation registered to deliver and assess nationally recognised VET.
SSchool-based apprenticeships and traineeships (SATs)
Pathways for Year 10, 11 and 12 students combining senior studies, VET and employment.
Service Delivery Statement (SDS)
Budget papers prepared on a portfolio basis by agencies reporting to each minister and the Speaker. The document comprises a section for each departmental portfolio and one for the Legislative Assembly of Queensland. It is produced annually and provides budgeted financial and non-financial information for the budget year. The SDS sets out the priorities, plans and financial statements of agencies.
Smart Classrooms A state government overarching strategy for digital initiatives, implemented in 2005, that is helping schools meet the requirements of 21st century students by embedding ICT into learning.
Southbank Institute of Technology (SBIT)
A registered provider of high-level vocational education and technical training, established as a statutory institute of DETE. SBIT has campuses at Southbank and Morningside on the south side of Brisbane.
Special Education Programs (SEP)
A clustering of students with disabilities and specialist teachers, with experience or qualifications in dedicated areas of specialisation, to support the educational program of these students at selected schools within a local community.
Strategic plan The document which provides the agency's purpose and direction. It outlines the department's overall objectives (including its contribution to whole-of-government objectives, ambitions and targets) and how it will know if it has achieved those agency objectives (performance indicators).
TTechnical and further education (TAFE)
Provides a wide range of predominantly vocational tertiary education courses, mostly qualifying courses under the National Training System, Australian Qualifications Framework or Australian Quality Training Framework.
Trends in International Mathematics and Science Study (TIMSS)
A project of the International Association for the Evaluation of Educational Achievement to collect educational achievement data in mathematics and science at Year 4 and Year 8 in more than 60 countries, to provide information about trends in performance over time.
Traineeship A system of training regulated by law or custom which combines on-the-job training and work experience with formal off-the-job training, while in paid employment.
VVocational education and training (VET)
Post-compulsory education and training which provides people with occupational or work-related knowledge and skills.
YYoung Carers An individual who provides, in a non-contractual and unpaid capacity,
ongoing care or assistance to another person who, because of disability, frailty, chronic illness or pain, requires assistance with everyday tasks.
Department of Education, Training and Employment | Annual Report 2012–13 99

Acronyms and abbreviations
AABS Australian Bureau of StatisticsACARA Australian Curriculum, Assessment and Reporting AuthorityACER Australian Council of Educational ResearchAEIOU Autism Early Intervention Outcomes UnitAHES After Hours Ethnic SchoolingAMEB Australian Music Examination BoardAOSM Advancing our schools maintenanceARMC Audit and Risk Management CommitteeASD Autism Spectrum DisorderASQA Australian Skills Quality Authority
BBBF Black Business FinderBCITF Building and Construction Industry Training Fund
CC2C Curriculum into the ClassroomCALD Culturally and linguistically diverseCGB Central Governing BodyCOAG Council of Australian Governments
DDELTA Direct Entry Level Training AdministrationDETE Department of Education, Training and EmploymentDETi Department of Education and Training International
EEAL/D English as an additional language or dialectEATSIPS Embedding Aboriginal and Torres Strait Islander PerspectivesECEC Early Childhood Education and CareEDRMS Electronic document and records management systemEMG Executive Management GroupEQI Education Queensland InternationalESL English as a second languageESL/D English as a subsequent language/dialectEYC Early years centre
FFTE Full-time Equivalent
GGCIT Gold Coast Institute of TAFEGST Goods and services tax
IIBD International Baccalaureate DiplomaICILS International Computer and Information Literacy Study
Department of Education, Training and Employment | Annual Report 2012–13 100

ICN Industry capability networkICT Information and communications technologyIFP Indigenous Funding PoolITD Industrial technology and design
KKASS Kindergarten Advisory Support ServiceKPI Key performance indicator
LLGT Local Government TraineeshipsLNIRC Legislative and National Implementation Reform Committee
MMOHRI Minimum Obligatory Human Resource InformationMP Member of Parliament
NNAPLAN National Assessment Program Literacy and NumeracyNCVER National Centre for Vocational Education ResearchNMS National Minimum StandardNQF National Quality Framework
OOP Overall Position
PP&C Parents and Citizens’ AssociationPCLF Principals Capability and Leadership FrameworkPID Public Interest DisclosurePIRLS Progress in International Reading Literacy StudyPISA Programme for International Student AssessmentPPP Productivity Places ProgramPSC Public Service Commission
QQAO Queensland Audit OfficeQCAR Queensland Curriculum, Assessment and ReportingQCE Queensland Certificate of EducationQCIA Queensland Certificate of Individual AchievementQCPCA Queensland Council of Parents and Citizens AssociationQCT Queensland College of TeachersQELI Queensland Education Leadership InstituteQIECC Queensland Indigenous Education Consultative CommitteeQKLG Queensland Kindergarten Learning GuidelineQld QueenslandQSA Queensland Studies AuthorityQVDC Queensland VET Development Centre
RRPL Recognition of Prior Learning
Department of Education, Training and Employment | Annual Report 2012–13 101

RTO Registered training organisation
SSAE Standard Australian EnglishSAT School-based apprenticeship and traineeshipSBIT Southbank Institute of TechnologySCSEEC The Standing Council of School Education and Early ChildhoodSEDC Special education development centresSEDU Special education development unitsSEP Special Education ProgramsSEQ South East QueenslandSES Socioeconomic statusSEU Special education unitsSDA School disciplinary absenceSDE School of Distance EducationSQW Skilling Queenslanders for Work
TTAFE Technical and further educationTEQSA Tertiary Education Quality and Standards AgencyTIMSS Trends in International Mathematics and Science StudyTVETSS Technical and Vocational Education and Training Skills Scholarships
VVET Vocational education and trainingVQF VET Quality Framework
Department of Education, Training and Employment | Annual Report 2012–13 102

Financial statements 2012–13Understanding our financial statements
Statement 1 – Statement of Comprehensive Income
Statement 2 – Statement of Financial Position
Statement 3 – Statement of Changes in Equity
Statement 4 – Statement of Cash Flows
Statement 5 – Statement of Comprehensive Income by Major Departmental Services – Controlled
Statement 6 – Statement of Assets and Liabilities by Major Departmental Services – Controlled
Notes to and Forming Part of the Financial Statements
Certificate of the Department of Education, Training and Employment
Independent Auditor’s Report
Note No.Accrued employee benefits 26
Administered transactions and balances 36
Asset revaluation surplus by class 28
Cash and cash equivalents 16
Commitments for expenditure 31
Contingencies 33
Controlled entities 34
Depreciation and amortisation 12
Employee expenses 8
Events occurring after balance date 35
Finance/borrowing costs 14
Financial instruments 39
Grants and other contributions 6
Grants and subsidies 11
Impairment losses 13
Intangible assets 23
Inventories 18
Key executive management personnel and remuneration 9
Major departmental services of the department 3
Monies held in trust 38
Non-cash financing and investing activities 30
Non-current assets classified as held for sale 21
Objectives and principal activities of the department 1
Other current assets 19
Other current liabilities 27
Other expenses 15
Other financial assets 20
Other financial liabilities 25
Other revenues 7
Payables 24
Department of Education, Training and Employment | Annual Report 2012–13 103

Note No.Private Provision of Public Infrastructure (PPPI) arrangements 32
Property, plant and equipment 22
Receivables 17
Reconciliation of operating surplus to net cash from operating activities 29
Reconciliation of payments from Consolidated Fund to Administered Revenue 37
Reconciliation of payments from Consolidated Fund to Departmental services revenue recognised in Statement of Comprehensive Income 4
Reconciliation of payments from Consolidated Fund to equity adjustment recognised in Contributed Equity 4
Summary of significant accounting policies 2
Supplies and services 10
User charges 5
Department of Education, Training and Employment | Annual Report 2012–13 104

ISSN: 2200-9051
© The State of Queensland (Department of Education, Training and Employment) 2013.
LicenceThis annual report is licensed by the State of Queensland (Department of Education, Training and Employment) under a Creative Commons Attribution (CC BY) 3.0 Australia licence.
CC BY Licence Summary Statement
In essence, you are free to copy, communicate and adapt this annual report, as long as you attribute the work to the State of Queensland (Department of Education, Training and Employment). To view a copy of this licence, visit www.creativecommons.org/licenses/by/3.0/au/deed.en.
Attribution
Content from this annual report should be attributed as: The State of Queensland (Department of Education, Training and Employment) Annual Report 2012–13.
Department of Education, Training and Employment Education House30 Mary StreetBrisbane QLD 4000
General enquiries:PO Box 15033City EastBrisbane QLD 4002
www.dete.qld.gov.au
Department of Education, Training and Employment | Annual Report 2012–13 105


![[PPT]PowerPoint Presentation - dsm4b · Web viewWELCOME TO The Netherlands Maritime Institutes of Technology Our vision is to be a leading maritime institute offering education, training](https://img.dokumen.tips/doc/110x75/5aa4b5777f8b9afa758c41ae/pptpowerpoint-presentation-dsm4b-viewwelcome-to-the-netherlands-maritime-institutes.jpg)


![[PPT]Welcome to Ethics Training! - EWU | EWU Homeweb.ewu.edu/groups/internalaudit/Ethics Principles May... · Web viewWelcome to Ethics Training! “The reputation of a thousand years](https://img.dokumen.tips/doc/110x75/5b09ef707f8b9ae61b8b47f3/pptwelcome-to-ethics-training-ewu-ewu-principles-mayweb-viewwelcome-to.jpg)