Embed Size (px)
Citation preview

Core Inflation: A Monetary Criterion for
Attending the GCC Monetary Union
A Study Presented to The Technical Committee for
Monetary Union among the GCC States 18th Meeting
Abu Dhabi, UAE
October 7-8 / 2006
By
Elsayed M. Elsamadisy Khalid R. AlKhater Farag I. Mahmoud
Department of Economic Policies Qatar Central Bank

2
Core Inflation: A Monetary Criterion for Attending the GCC Monetary Union
A Study Presented to
The Technical Committee I. Introduction
This study argues for the use of core inflation measures rather than the general CPI inflation measures as an entrance criterion for the GCC monetary union. It is argued that certain CPI categories should be excluded from the regular CPI to attain an inflation measure appropriate for assessing and forecasting inflation for the purposes of making and conducting monetary policy in the union member states. Certainly, there is a need for monetary-policy makers to decompose the headline (CPI) inflation figures into a trend component that reflects persistent sources of inflationary pressures, and a transient reversible component. GCC central banks should be much more concerned with the first component—termed as underlying or core inflation—since it reflects the underlying trends in prices caused by aggregate demand and aggregate supply pressures and changes in inflationary expectations.
The study sites that the majority of central banks around the glob focus on the rate of change in some variant of the CPI for the purposes of analyzing current and forecasting future inflation. CPI can be adjusted in various ways such that an adjusted index can provide valuable information on the extent to which an observed increase in inflation is temporary. By far, the most common and closely watched measures of core inflation are the so-called exclusion-based measures. At the most basic level, such measures typically involve excluding certain price categories from the headline inflation rate.
The study argues for the adoption of the concept of core (underlying) inflation measure as a monetary criterion for the GCC monetary union instead of the general headline CPI measure. Applying the exclusion-based measures to data from Qatar, this study reveals that some CPI categories are irrelevant to the making and implementation of the monetary policy in Qatar, precisely, housing rent. This might also be the case for the United Arab Emirates (UAE), particularly Dubai. Applying exclusion-based measures; other CPI categories may be relevant for other GCC economies. Some pure statistical methods may be applied uniformly to the six GCC economies.

3
Therefore, we propose the preparation of a detailed analytical study of the CPI baskets in the six GCC countries to identify the appropriate methodology for the construction of the core inflation measure for each. Having constructed the six core inflation measures, the agreed rules to compute the entry criterion’s index can be applied to them. A corresponding index, to be constructed of these core inflation measures, is proposed to be used by the central monetary authorities as an information variable for the making of the unified monetary policy and as a basis for inflation control within the union.
The study is structured as follows. Section one briefs on the concepts of the headline (CPI) and underling (core) inflation, and sites some major central banks employing measures of core inflation. Section two applies the concept of core inflation to the Qatari data, summarizes the history of the headline and core inflation in Qatar since 1980, and discusses the recent developments of inflation at annual and quarterly levels. The section highlights the temporary nature of rent inflation and argues that it is mostly a supply-side phenomenon that is, to a great extent, out of QCB control. Section three concludes.
I. Headline and Underlying Inflation
I.1. Headline Inflation
The consumer price index (CPI) is the most acceptable measure of headline inflation. It approximates changes in the cost of living; and it is the final cost of consumer’s goods and services that are relevant for many contracts. The CPI is often used as the basis for the formation of inflation expectations that are incorporated into households and business decisions and contracts. Nonetheless, the CPI may not be the best inflation measure, to focus on, for practical monetary policy purposes. Changes in the monetary policy stance affect only underlying inflationary pressures and, hence affect inflation rates, slowly over an extended period of time. In view of the lags in the transmission mechanism and the medium-term orientation of monetary policy, central bankers have long accepted that short-term transitory developments in inflation should not, in principle, unduly affect monetary policy decisions.
Therefore, there are needs for monetary-policy makers to decompose headline inflation figures into a trend component that reflects persistent sources of inflationary pressures, on the one hand, and a transient reversible component, on the other hand. Central banks are typically more concerned with the first

4
component—customarily termed as underlying or core inflation—since it reflects the underlying trends in prices caused by aggregate demand and supply pressures and/or changes in inflationary expectations. Therefore, from the perspective of monetary-policy-makers, it incorporates the most relevant information.1 Thus, central banks typically tend to disregard transient changes in the inflation rate which owe to supply and price shocks that arise as a result of causes not related to monetary policy; and rely on one or more measures of core or underlying inflation that excludes the effects of such factors.
I.2. Underlying Inflation
The concept of underlying or core inflation rests, at its most general level, on the assertion that it is the monetary policy that determines the price level in the long run; and that non-monetary factors can cause (in the short-run) transitory deviations of the price level from its long-run trend. However, it is easier, in theory than in practice, to distinguish supply-induced temporary changes from demand-induced persistent changes in inflation. Therefore, most central banks adopt a more statistical rather than behavioural (modelling) approach to the problem of price measurement; while invoking the traditional microeconomic cost of living concept as a guiding theory to the choice of the appropriate core price index.
In this context, the majority of central banks focus on the rate of change in some variant of the CPI for the purposes of analyzing current, and forecasting future inflation. CPI can be adjusted in various ways such that an adjusted index can provide valuable information on the extent to which an observed increase in inflation is temporary. The trimmed mean and median of the cross-sectional distribution of individual price changes are in use as core inflation measures, while more sophisticated statistical approaches are being debated in the academic literature. Yet, the most common and closely watched measures of core inflation are the so-called exclusion-based measures. At the most basic level, such measures typically involve excluding certain price categories from the headline inflation rate. There is a consensus in the literature that there are primarily three types of price movements that central banks tend to want to remove:
1) Movements associated with temporary changes in the rate of CPI inflation. Examples are movements in highly volatile, but over time offsetting, CPI components; and changes in regulated prices that lead to jumps in the price
1 Since monetary policy actions affect the economy in the medium-to-long-run; non-trend short-run temporary changes in inflation represent information that is either unnecessary or misleading for the purposes of making monetary policy.

5
level, without long-term effects on the inflation rate. Monetary policy should not respond to such temporary price movements.
2) Inflation shocks with possibly long-lasting effects, but where a strong monetary policy response would result in intolerably large fluctuations in the real economy. Examples are dramatic supply or price shocks such as large changes in commodity prices and/or natural disasters.
3) The direct effects resulting from changes in monetary policy on inflation; if some CPI components vary directly with the level of short-term interest rates. Mortgage cost is an example; increasing short-term interest rates results in higher mortgage interest cost which if included in the CPI results in higher level of the index, hence higher level of measured inflation. If not excluded, the central bank may decide to tighten its policy stance to help curb inflation. This would be mislead and inappropriate policy.
Specifically, an underlying inflation indicator may exclude CPI components on basis of their volatility, temporality, source (supply or price shocks), and the extent to which they are influenced by the monetary policy stance. Some central banks exclude CPI items that are subject to one-time permanent price-level shocks if it is believed that these are understood by the public as level-shocks and, therefore, will not feed through into their inflation expectations. Fore instance, The Bank of Canada excludes food, energy, and the effects of changes in indirect taxes from CPI to construct a measure of core inflation; National Bank of Belgium excludes unprocessed food and energy; National Bank of Poland excludes regulated prices, most volatile prices and fuel prices; the Federal Reserves excludes a collection of erratic prices; Banco Central Do Brasil excludes government monitored prices and food taken home; Narodna Banka Slovenska excludes prices of energy and unprocessed food; the Sveriges Riksbank of Sweden excludes indirect taxes and subsidies, interest costs for owner occupied housing, effects of the krona’s depreciation, and heating oil and propellants; the Monetary Authority of Singapore excludes costs of accommodation and private road transport; Bank of Japan excludes fresh food; the Swiss National Bank excludes the 15% of goods with the lowest annual inflation rate and the 15% of goods with the highest annual inflation rate. The Central Bank of the Republic of Turkey compiles several core measures that exclude variable sets of commodities whose prices are determined by factors other than monetary policy.

6
II. The Example from Qatar
II.1 QCB Core Inflation Measures
Housing rent is a particular CPI component that meets most of the exclusion criteria. Firstly, housing rent has been conspicuously volatile and its rate of change has been predominantly temporary and/or mostly reversible (Criterion 1). Secondly, although effects of the current rent inflation shock may last for some time, should QCB decide to combat rent inflation via direct or indirect monetary instruments (radically reducing credit ceilings or radically raising its policy interest rates, respectively) it may cause a contraction in the non-oil-non-gas sectors, whose severeness depends on the tightness of QCB monetary policy stance (Criterion 2). Thirdly, the Planning Council adopts consumption rather than expenditure approach for weighting and pricing housing services in the CPI basket. Applying the consumption approach, the Planning Council adopts the ‘rental equivalence’ rather than the ‘user cost’ method. Hence, mortgage interest costs are not included in the CPI component of housing services. However, actual rent for rented dwellings and rent equivalence for owner occupied dwellings reflect changes in mortgage interest costs that are due to changes in QCB policy stance. That is so because financing the construction of new dwellings or the purchase of an existing one typically carries interest charges; particularly during the current inflationary period. Therefore, although mortgage interest costs are not included directly in the CPI, housing rent reflects developments in such costs (Criterion 3).2 Therefore, a strong monetary-policy reaction may not be appropriate. Table 1: Inflation Variability: 1982-2005
Index N Minimum Maximum Range Mean Std. Deviation CF* CPI 24 -0.812 8.477 9.289 3.131 2.428 77.536
CPIxTR 24 -0.642 6.874 7.516 2.723 1.756 64.484 CPIxNRS 24 -5.334 13.669 19.003 2.895 4.030 139.187
CPIxR 24 -15.213 27.777 42.990 2.962 10.762 363.294 CCPI 24 -0.542 8.153 8.695 2.686 1.849 68.847
* CF= Coefficient of Variation; N=Number of observations. See abbreviation list for the definition of variables. Table (1) computes some basic descriptive statistics for annual inflation rates in the CPI, CCPI, and Sub-CPI price index for rent and water cost (CPIxR), for the period 1982-2005. Volatility in levels of CPIxR-inflation relative to CPI-inflation and CCPI-inflation is evident. Likewise, the graphs in Figures (1a-1c) reveal the reversibility of the CPIxR inflation rates. 2 Therefore, changes in the lending interest rates impinge on the levels of housing rent and/or their rates of change.

7
Figure 1.a: Annual Inflation in CPIxR
%
- 1 6
- 1 2
- 8
- 4
0
4
8
1 2
1 6
2 0
2 4
2 8
3 2
3 6
4 0
1 9 8 2 1 9 8 3 1 9 8 4 1 9 8 5 1 9 8 6 1 9 8 7 1 9 8 8 1 9 8 9 1 9 9 0 1 9 9 1 1 9 9 2 1 9 9 3 1 9 9 4 1 9 9 5 1 9 9 6 1 9 9 7 1 9 9 8 1 9 9 9 2 0 0 0 2 0 0 1 2 0 0 2 2 0 0 3 2 0 0 4 2 0 0 5
Figure 1.b: Y-O-Y Quarterly Inflation in CPIxR %
0
5
1 0
1 5
2 0
2 5
3 0
3 5
4 0
2 0 0 2 -Q 4
2 0 0 3 -Q 1
Q 2 Q 3 Q 4 2 0 0 4 -Q 1
Q 2 Q 3 Q 4 2 0 0 5 -Q 1
Q 2 Q 3 Q 4
Moreover, shocks in rent inflation represent influences on CPI inflation that are beyond QCB control because they are essentially supply induced shocks. Furthermore, it is arguedon the basis that monetary policy neither can nor should attempt to influence relative pricesthat QCB should not attempt to counteract effects of changes in housing rent. Removing housing rent from CPI, we obtain a core inflation measure denoted CCPI; whose rate of growth measures underlying inflation.

8
Figure 1.c Q-o-Q Inflation in CPIxR %
- 202468
1 01 21 41 61 82 02 22 4
2 0 0 2 -Q 1
Q 2 Q 3 Q 4 2 0 0 3 -Q 1
Q 2 Q 3 Q 4 2 0 0 4 -Q 1
Q 2 Q 3 Q 4 2 0 0 5 -Q 1
Q 2 Q 3 Q 4
There are more price indexes monitored by QCB. Owing to the fixed parity between the QR and the US dollar, it is imported inflation that dominates (and sets the pace for) the core inflation in the long run.3 Therefore, QCB monitors a sub-CPI index of consumers’ tradables to proxy imported inflation. The consumer tradables sub-index denoted, CPIxTR, aggregates over prices of tradable goods and services contained in the CPI. Since most consumer tradables are imported, changes in CPIxTR represent a better surrogate than changes in the Imports Unit Price Index (UPI) published by the Planning Council; to measure the imported inflation component of the CCPI or CPI inflation.4 That is, CPIxTR approximates the imported inflation component of the underlying and headline inflation measures5.
To facilitate the analyses, QCB compiles a consumer Non-Housing-Services Index denoted CPIxNRS that aggregates over prices of all non-housing-non-tradable services contained in the CPI. Since nontradables are domestically produced, changes in CPIxNRS approximate the non-imported component of the CCPI inflation. To measure the non-imported component of the CPI inflation, the housing rent and water cost price index, denoted CPIxR, is incorporated into CPIxNRS to generate a nontradables price index denoted CPIxNT.
3 The essence of a monetary strategy of exchange rate targeting is to anchor domestic inflation expectations to inflation in the anchor country. 4 That is because the published UPI is weighted differently from the CPI, since it is disaggregated based on the Standard International Trade Classification of the UN Revision 3 (SITC-R3) and, therefore, inappropriate for our purposes. 5 CPIxTR does not reflect imported only inflation since influenced by demand pressures. However, imports is highly supply elastic, the domestic component of CPIxTR is minor and temporary, depending on the importation lag.

9
II.2. History of Inflation in Qatar
Headline Inflation: headline CPI (base year 2001) and its annual inflation rate over the period 1981-2005 are presented in Table (2) and depicted in Figures (2a-2b). Three inflation cycles with distinct inflationary periods can be identified. Headline inflation had peaked at 8.52% in 1981, 4.56% in 1988, and 7.84% in 1996. It had reached its troughs at 1.11% in 1986, -0.81% in 1993, and -0.21% in 2002; and has been rising robustly since then. While the upward marches of headline inflation were relentless, its downward marches were not without respite. Some tightness occurred in 1985, 1991, and 1998. Table 2: Headline and Underlying Inflation. (2001 = 100)
Headline Underlying Year
CPI πcpi CCPI πccpi 1981 58.19 8.52* 55.70 1982 61.49 5.67 58.59 5.19 1983 63.16 2.72 61.22 4.50 1984 63.88 1.13 62.72 2.45 1985 65.41 2.40 64.33 2.56 1986 66.14 1.11 65.25 1.43 1987 67.66 2.31 66.68 2.20 1988 70.75 4.56 69.19 3.76 1989 73.07 3.28 71.46 3.29 1990 75.31 3.05 73.80 3.27 1991 78.58 4.35 77.22 4.63 1992 80.97 3.04 79.01 2.33 1993 80.31 -0.81 79.08 0.08 1994 81.39 1.34 80.28 1.52 1995 83.79 2.95 82.94 3.32 1996 90.36 7.84 89.71 8.15 1997 92.40 2.25 91.39 1.87 1998 94.88 2.68 94.49 3.39 1999 96.95 2.19 96.53 2.16 2000 98.56 1.66 98.54 2.08 2001 100.00 1.46 100.00 1.48 2002 99.79 -0.21 99.46 -0.54 2003 103.00 3.21 98.38 -1.08 2004 111.73 8.48 103.10 4.80 2005 125.83 12.62 107.62 4.39
π =Respective Inflation rate. Data for 2002 – 2005 are end- of period. See abbreviation list for the definition of variables.

10
Figure 2a: Headline Index.
(2001 = 100)
5 5
6 5
7 5
8 5
9 5
1 0 5
1 1 5
1 2 5
1 9 8 1 1 9 8 3 1 9 8 5 1 9 8 7 1 9 8 9 1 9 9 1 1 9 9 3 1 9 9 5 1 9 9 7 1 9 9 9 2 0 0 1 2 0 0 3 2 0 0 5
C P I Figure 2b: Headline (CPI) Inflation.
%
- 2
0
2
4
6
8
1 0
1 2
1 4
1 9 8 0 1 9 8 1 1 9 8 2 1 9 8 3 1 9 8 4 1 9 8 5 1 9 8 6 1 9 8 7 1 9 8 8 1 9 8 9 1 9 9 0 1 9 9 1 1 9 9 2 1 9 9 3 1 9 9 4 1 9 9 5 1 9 9 6 1 9 9 7 1 9 9 8 1 9 9 9 2 0 0 0 2 0 0 1 2 0 0 2 2 0 0 3 2 0 0 4 2 0 0 5
Table (3) decomposes CPI inflation into its main components and computes the relative contributions of each to the overall headline inflation. A thorough examination of this table reveals that headline inflation had been mostly core inflation driven prior to 2003; particularly tradables inflation (hence, imported inflation) driven. Nonetheless, headline inflation clearly turned to be rent-inflation driven over the period 2003-2005. Moreover, the upward march of headline inflation over its first (1987-88) and second (1993-96) inflationary

11
periods was driven by the march up in CCPI inflation; while its march up during its third inflationary period (2003-present) was mainly driven by the march up in the CPIxR inflation. Table 3: Contributions to Annual Headline CPI Inflation
CPI CPIxTR CPIxNRS CPIxR CCPI
Year π % π % π % π % π % 1982 5.67 100 5.38 72.36 4.21 11.22 10.80 16.42 5.19 83.58 1983 2.72 100 2.70 75.53 13.67 74.79 -15.16 -50.32 4.50 150.32 1984 1.13 100 2.03 136.99 4.35 63.55 -15.21 -100.54 2.45 200.54 1985 2.40 100 2.85 91.09 1.26 8.91 0.00 0.00 2.56 100.00 1986 1.11 100 1.21 84.10 2.42 36.61 -3.76 -20.71 1.43 120.71 1987 2.31 100 2.82 97.97 -0.04 3.19 3.70 -1.17 2.20 101.17 1988 4.56 100 3.46 55.46 4.87 20.98 15.07 23.56 3.76 76.44 1989 3.28 100 3.43 75.62 2.78 16.72 3.20 7.65 3.29 92.35 1990 3.05 100 3.79 89.99 1.36 8.77 0.48 1.24 3.27 98.76 1991 4.35 100 5.25 88.30 2.25 10.00 0.96 1.70 4.63 98.30 1992 3.04 100 2.32 56.19 2.34 14.56 12.03 29.25 2.33 70.75 1993 -0.81 100 -0.64 57.87 2.89 -66.81 -11.00 108.94 0.08 -8.94 1994 1.34 100 0.35 19.23 5.92 85.93 -0.96 -5.15 1.52 105.15 1995 2.95 100 3.58 87.99 2.41 16.63 -1.93 -4.63 3.32 104.63 1996 7.84 100 6.87 64.02 12.76 32.96 3.53 3.03 8.15 96.97 1997 2.25 100 1.88 60.49 1.85 17.35 7.73 22.16 1.87 77.84 1998 2.68 100 3.32 89.31 3.65 28.72 -7.11 -18.03 3.39 118.03 1999 2.19 100 2.33 77.23 1.58 15.43 2.61 7.34 2.16 92.66 2000 1.66 100 2.06 90.08 2.16 27.50 -4.73 -17.58 2.08 117.58 2001 1.46 100 1.24 115.85 2.32 14.07 1.10 -29.92 1.48 129.92 2002 -0.21 100 0.82 -219.09 -3.72 425.31 1.13 -106.22 -0.54 206.22 2003 3.21 100 0.66 11.67 -5.33 -38.59 20.31 126.92 -1.08 -26.92 2004 8.48 100 5.11 33.28 4.00 10.05 20.51 56.66 4.80 43.34 2005 12.62 100 5.81 24.65 0.65 1.05 36.04 74.30 4.39 25.70
Note: negative signs associated with contributions to CPI inflation are to be interpreted in correspondence with signs on both CPI and component inflation rates.
The core inflation is decomposable into inflation in the prices of consumers’ tradables and inflation in the prices of consumers’ non-housing-services (non-tradables). Table (4) decomposes CCPI inflation into its main components and computes the relative contributions of each to overall underlying inflation. A thorough examination of Table (4) reveals that the core inflation had been mostly driven by inflation in prices of tradables (thus, by imported inflation).
Specifically, consumer tradables weight heavier than non-housing services in the core price index. The CPIxTR constitutes 83.47% and 78.61% of the total weights of CCPI fore base years 1981 and 1988, respectively, compared with 16.54% and 21.39% for CPIxNRS. In the weighting scheme for base year

12
2001, CPIxTR weights 69.94% and CPIxNRS weights 30.06% (Table 5). Inflation in prices of non-housing services had contributed more than one third to the core inflation in four out of twenty-four years (1983; 1993; 1994; 1996). These results are illustrated in Figures (4a-4b).
Figure 3a: Core Index (CCPI). (2001 = 100)
5 5
6 5
7 5
8 5
9 5
1 0 5
1 1 5
1 9 8 1 1 9 8 3 1 9 8 5 1 9 8 7 1 9 8 9 1 9 9 1 1 9 9 3 1 9 9 5 1 9 9 7 1 9 9 9 2 0 0 1 2 0 0 3 2 0 0 5
Figure 3b: Core (CCPI) Inflation
%
- 2
0
2
4
6
8
1 0
1 9 8 2 1 9 8 3 1 9 8 4 1 9 8 5 1 9 8 6 1 9 8 7 1 9 8 8 1 9 8 9 1 9 9 0 1 9 9 1 1 9 9 2 1 9 9 3 1 9 9 4 1 9 9 5 1 9 9 6 1 9 9 7 1 9 9 8 1 9 9 9 2 0 0 0 2 0 0 1 2 0 0 2 2 0 0 3 2 0 0 4 2 0 0 5

13
Figure 3C: Headline and Core Inflation %
- 2
0
2
4
6
8
1 0
1 2
1 4
1 9 8 2 1 9 8 3 1 9 8 4 1 9 8 5 1 9 8 6 1 9 8 7 1 9 8 8 1 9 8 9 1 9 9 0 1 9 9 1 1 9 9 2 1 9 9 3 1 9 9 4 1 9 9 5 1 9 9 6 1 9 9 7 1 9 9 8 1 9 9 9 2 0 0 0 2 0 0 1 2 0 0 2 2 0 0 3 2 0 0 4 2 0 0 5
C P I C C P I
Table 4: Contributions to the Annual Core Inflation
CCPI CPIxTR CPIxNRS Year π % π % Π % 1982 5.19 100 5.38 86.58 4.21 13.42 1983 4.50 100 2.70 50.24 13.67 49.76 1984 2.45 100 2.03 68.31 4.35 31.69 1985 2.56 100 2.85 91.09 1.26 8.91 1986 1.43 100 1.21 69.67 2.42 30.33 1987 2.20 100 2.82 96.14 -0.04 3.86 1988 3.76 100 3.46 72.55 4.87 27.45 1989 3.29 100 3.43 81.89 2.78 18.11 1990 3.27 100 3.79 91.12 1.36 8.88 1991 4.63 100 5.25 89.83 2.25 10.17 1992 2.33 100 2.32 79.42 2.34 20.58 1993 0.08 100 -0.64 -647.02 2.89 747.02 1994 1.52 100 0.35 18.29 5.92 81.71 1995 3.32 100 3.58 84.10 2.41 15.90 1996 8.15 100 6.87 66.01 12.76 33.99 1997 1.87 100 1.88 77.71 1.85 22.29 1998 3.39 100 3.32 75.67 3.65 24.33 1999 2.16 100 2.33 83.35 1.58 16.65 2000 2.08 100 2.06 76.61 2.16 23.39 2001 1.48 100 1.24 95.06 2.32 4.94 2002 -0.54 100 0.82 -106.24 -3.72 206.24 2003 -1.08 100 0.66 -43.35 -5.33 143.35 2004 4.80 100 5.11 76.80 4.00 23.20 2005 4.39 100 5.81 95.91 0.65 4.09
Note: negative signs associated with contributions to CCPI inflation are to be interpreted in correspondence with signs on both CCPI and its component inflation rates.

14
Such apparent cyclical pattern of the core and headline inflation processes in Qatar relates to the cyclicality in oil prices, global economic growth, and the exchange rate of US dollar against currencies of Qatar’s major trading partner countries. Cyclicality in oil prices results in a pro-cyclical pattern in domestic government spending and, therefore, in the growth in domestic liquidity and aggregate demand. Strengthening global economy results in upward pressures on world prices of consumer tradables, hence, elevates imported inflation as measured by CPI and/or CCPI, and vice versa. Ceteris paribus, weakness of the USD results in rising QR prices of imported consumer tradables, therefore, fuels imported inflation, and vice versa.
An interesting fact that comes out of all of these is that both headline and core inflation had been moderate for most of the time over the period 1982-2002. Over the twenty-two-year interval 1982-2003, the underlying inflation had exceeded 3.5% in five years (1982, 1983, 1988, 1991, and 1996). Headline inflation had exceeded the 3.5% level only in four years (1982, 1988, 1991, and 1996). On the contrary, CPIxR inflation fluctuated widely over the same period.
Figure 4a: CPIxTR and Core CCPI Inflation
%
- 2
0
2
4
6
8
1 0
1 9 8 2 1 9 8 3 1 9 8 4 1 9 8 5 1 9 8 6 1 9 8 7 1 9 8 8 1 9 8 9 1 9 9 0 1 9 9 1 1 9 9 2 1 9 9 3 1 9 9 4 1 9 9 5 1 9 9 6 1 9 9 7 1 9 9 8 1 9 9 9 2 0 0 0 2 0 0 1 2 0 0 2 2 0 0 3 2 0 0 4 2 0 0 5
C P I xT R C C P I
15
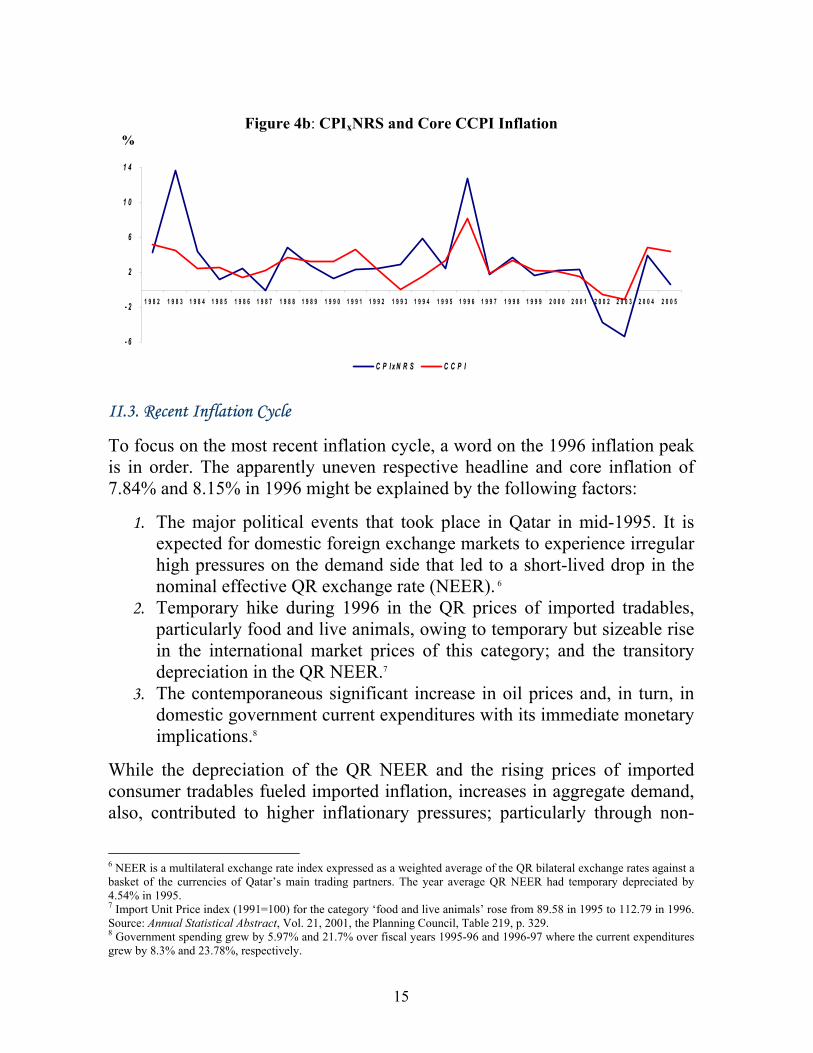
Figure 4b: CPIxNRS and Core CCPI Inflation
%
- 6
- 2
2
6
1 0
1 4
1 9 8 2 1 9 8 3 1 9 8 4 1 9 8 5 1 9 8 6 1 9 8 7 1 9 8 8 1 9 8 9 1 9 9 0 1 9 9 1 1 9 9 2 1 9 9 3 1 9 9 4 1 9 9 5 1 9 9 6 1 9 9 7 1 9 9 8 1 9 9 9 2 0 0 0 2 0 0 1 2 0 0 2 2 0 0 3 2 0 0 4 2 0 0 5
C P I xN R S C C P I II.3. Recent Inflation Cycle
To focus on the most recent inflation cycle, a word on the 1996 inflation peak is in order. The apparently uneven respective headline and core inflation of 7.84% and 8.15% in 1996 might be explained by the following factors:
1. The major political events that took place in Qatar in mid-1995. It is expected for domestic foreign exchange markets to experience irregular high pressures on the demand side that led to a short-lived drop in the nominal effective QR exchange rate (NEER). 6
2. Temporary hike during 1996 in the QR prices of imported tradables, particularly food and live animals, owing to temporary but sizeable rise in the international market prices of this category; and the transitory depreciation in the QR NEER.7
3. The contemporaneous significant increase in oil prices and, in turn, in domestic government current expenditures with its immediate monetary implications.8
While the depreciation of the QR NEER and the rising prices of imported consumer tradables fueled imported inflation, increases in aggregate demand, also, contributed to higher inflationary pressures; particularly through non-
6 NEER is a multilateral exchange rate index expressed as a weighted average of the QR bilateral exchange rates against a basket of the currencies of Qatar’s main trading partners. The year average QR NEER had temporary depreciated by 4.54% in 1995. 7 Import Unit Price index (1991=100) for the category ‘food and live animals’ rose from 89.58 in 1995 to 112.79 in 1996. Source: Annual Statistical Abstract, Vol. 21, 2001, the Planning Council, Table 219, p. 329. 8 Government spending grew by 5.97% and 21.7% over fiscal years 1995-96 and 1996-97 where the current expenditures grew by 8.3% and 23.78%, respectively.

16
housing services which showed a radically high inflation rate during the year. It is worth noting that the CPIxR grew by 3.53% versus 12.76% growth in CPIxNRS and 6.87% growth in CPIxTR in 1996 (Table 3).
Examination of historical data suggests a lagged negative effect of the QR nominal effective exchange rate on core inflation. Marching down; the decline in the core inflation until 2002 seems to have owed to a strengthening QR in addition to falling world prices of consumer tradables and waning non-rent-nontradables inflation. Following a temporary drop in 1995, the QR resumed appreciation reaching a new peak in 2001. Strengthening QR, coupled with falling international prices of tradables resulted in lower and generally falling imported inflation.9
However, in the shorter-run changes in the core inflation seem to have been dominated by changes in world prices of consumer tradables and inflation in non-housing services. While the inflation in CPIxTR averaged about 1.94%, inflation in the CPIxNRS averaged less than 1.31%, and inflation in CPIxR averaged around 0.12% over the period 1997-2002 (Table 3). The average headline and core inflation rates have been practically identical over the same period at 1.67% and 1.74%, respectively.
Notably, low domestic inflation over the period 1997-2002, had been a result of the favorable conditions of a strong US economy and US dollar during the ‘new economy’ boom when the US economy enjoyed six consecutive years of rapid growth with low inflation rates (1995-2000). Inflationary expectations in Qatar were anchored to low US inflation while a strong US dollar translated into a strong QR.
Yet, after reaching a new peak in February 2002, the USD had been falling hastily until the end of 2004. Persistent depreciation of the dollar has resulted in weakening the QR against currencies of major trading partners of Qatar. After the QR NEER reached a new peak in 2001, it had depreciated by 16.23% over the period 2001-2004 at an average rate of 5.41% per annum. Changes in the exchange value of the QR had a significant negative impact on imported inflation, where the CPIxTR grew by 5.11% during 2004 and 5.81% during 2005.10 9The QR exchange rate plays a direct role in the determination of QR prices of imported goods because the cost of producing these goods is incurred in foreign currency. Since most importers in GCC countries adopt long-term contracts, exchange rate changes affect the QR prices of imported merchandise with a lag. 10 The seemingly moderate inflation in prices of consumers’ tradables during 2005 can be partly explained, among other things, by importers switching to cheaper sources; and possible falls in margins in the distribution sector.

17
II.4. Rent Inflation is a Temporary Phenomenon
Table (2) shows that the respective averages of headline and core inflation rates for the first inflationary period 1987-1988, were about 3.43% and 2.98% respectively; and were about 4.04% and 4.33%, respectively for the second inflationary period, 1994-1996. However, since 2002, the two indexes began to diverge widely with sharp and steadily rising CPI and a generally upward-creeping CCPI (with slight respite in 2002-2003). While headline inflation averaged 8.1%, core inflation averaged 2.7% for the period 3003-2005. The respective year-end annual inflation rates for the CPI and CCPI had been 3.21% and -1.08% for 2003; 8.48% and 4.80% for 2004; and 12.62% and 4.39% for 2005.
Evidently, headline inflation was core-inflation-dominated during its first (87-88) and second (94-96) inflationary periods; and CPIxR inflation dominated over the third (2003-present) inflationary period. Sharp increases in housing rent since early 2003 have had distinctly much more influence on the headline inflation (please review Table 3 above, and Figure 5 below). Rent inflation contributed about 85.96% to CPI inflation, over the current inflationary period during 2003-2005.
Contemporaneous acceleration in inflation in housing rent over the last three years has been the legacy of fiscal and monetary corollaries of the booming hydrocarbons sector, on the one hand, and ambitious government plans for speedy development on the other hand. Such ambitious plans positively affect the economy in several ways but at economic costs. One such cost is the so-far-prevailing structural inflation.
Figure 5: Y-O-Y Inflation in CPI, CCPI, and CPIxR %
- 5
0
5
1 0
1 5
2 0
2 5
3 0
3 5
4 0
2 0 0 2 -Q 4
2 0 0 3 -Q 1
Q 2 Q 3 Q 4 2 0 0 4 -Q 1
Q 2 Q 3 Q 4 2 0 0 5 -Q 1
Q 2 Q 3 Q 4
C P I C C P I C P I xR

18
A sizeable shortage in residential units has been the outcome of demolition of large number of homes and residential compounds in a number of sections of the Capital City of Doha and its metropolitan area (within a newly executed infrastructure and construction plans to revamp the city). Implementation of such renovation plans was espoused with the implementation of mega hydrocarbon projects and preparations for the Asian Olympics to be held in December 2006 in Doha.
This has led to large increases in population (owing to increasing numbers of expatriates to work in the new projects), which resulted in speedy rising demand for housing units. Furthermore, owing to the speedy implementation of infrastructure and construction projects, the demand for building and construction materials has surged, leading to large increases in their prices, given the limited production capacity of domestic industries and delivery lags of importation. As such, the phenomenon of excess demand in the market for rentable dwellings has been supply side originated. Meanwhile, temporary increases in the costs of building and construction materials represent price shocks that can be traced back to the rightward shift in population and the leftward shift in the supply of rentable dwellings.
On the other hand, due to narrow domestic production base and the lack of well-diversified non-hydrocarbon real sector, excess domestic liquidity has been channeled into viable investment outlets in the real and financial assets markets (real estates and stock exchange). Duly, commercial banks were keen to utilize their excess resources into financing shares, land, construction, and real estate trading. Expectedly, even under gradual tightening of QCB policy stance started by mid-2004, assets’ prices kept increasing rapidly. Thus, besides mentioned supply and price shocks, there existed two channels for demand shocks through: (a) the rise in household expenditures on dwellings due to income, wealth and/or liquidity effects; and (b) high trading and speculative activities in the land and real estate markets due to wealth and/or liquidity effects. Therefore, rent inflation was further escalated due to growing demand pressures resulting from higher private income and wealth and/or fast growing domestic liquidity (hence, consumption).
The appealing realism is that sharp increases in housing rent have been directly and indirectly driving headline inflation since early 2003: Directly as a component of the headline inflation measure; Indirectly via spreading through to the general economy and leveling prices of consumer tradables and nontradables. It is worth emphasizing in this context that the CPIxR inflation throughout the contemporaneous inflationary period is basically-supply rather

19
than demand originated. Other things being equal, the acceleration in the growth of domestic liquidity during 2005 has resulted in higher demand pressures in the market fore housing dwellings as well as for tradables and other nontradables. Whereas the supply shocks had arisen due to causes not related to QCB monetary policy, the associated demand shocks are too costly to be eliminated via indirect-market-oriented monetary policy instruments. Therefore, it is argued—on basis that the monetary policy neither can nor should attempt to influence relative prices—that QCB should not attempt to counteract the effects of changes in housing rent.
In brief, headline inflation seems to have experienced a dramatic structural change since its last turning point by the end of 2002, whence it turned out to be largely driven by the recent sharp increases in housing rent. While end-year inflation in CPIxR averaged around 28.95% over the three-year period 2003 to 2005, underlying inflation averaged about 2.7% (where inflation in CPIxTR averaged about 3.84% and inflation in CPIxNRS averaged about -0.23%). The next section utilizes available quarterly price indexes to examine the factors contributing to the CPI inflation since 2003. II.5. Quarterly Inflation Since 2003
We disaggregate over time into quarterly indexes to further uncover the major factors underpinning the remarkable surge in the headline CPI inflation over the last three-year period. Overall CPI and its sub-indexes are available on quarterly basis from the Planning Council starting the first quarter of 2002, for base year 2001. Consider Y-O-Y quarterly inflation rates: the twelve-quarter period Q1-2003 to Q4-2005 averages 20.75% for inflation in CPIxR; 2.49% for inflation in CPIxTR; and -0.88% for inflation in CPIxNRS. Meanwhile, the respective underlying and headline inflation rates average 1.56% and 6.02% for the same period.
Core Inflation: Figures (6a)-(6b) trace the core index CCPI, and its components, CPIxTR and CPIxNRS, from the first quarter of 2002 to the fourth quarter of 2005, while Table (5) contains the relevant price indexes. The CCPI had been virtually invariable across 2002; started to crawl down from 99.46 in Q4-2002 reaching a trough of 97.21 in Q3-2003. It then peaked at 103.10 in Q4-2004 to reach a new trough in Q2-2005 at 101.97 and increase to 104.84 and 107.62 in Q3 and Q4-2005, respectively.

20
Table 5: Quarterly Consumer Price Indexes
Quarter CPI CPIxTR CPIxNT CPIxNRS CPIxR CCPI 2002- Q1 100.22 101.16 99.01 96.92 101.56 99.89
Q2 100.16 99.88 100.52 98.49 102.98 99.46 Q3 99.89 100.48 99.12 97.12 101.56 99.47 Q4 99.79 100.82 98.47 96.28 101.13 99.46
2003- Q1 102.21 100.74 104.09 91.90 118.92 98.08 Q2 102.57 100.70 104.95 92.46 120.14 98.22 Q3 102.32 100.16 105.08 90.35 122.99 97.21 Q4 103.00 101.49 104.92 91.14 121.67 98.38
2004- Q1 107.72 104.49 111.85 92.52 135.35 100.89 Q2 108.75 104.55 114.11 92.73 140.11 101.00 Q3 109.73 104.57 116.32 94.03 143.42 101.40 Q4 111.73 106.67 118.18 94.79 146.63 103.10
2005- Q1 111.48 106.21 118.20 93.93 147.71 102.52 Q2 117.98 105.35 134.11 94.09 182.76 101.97 Q3 121.20 109.36 136.31 94.33 187.36 104.84 Q4 125.83 112.87 142.37 95.40 199.48 107.62
The time path of the CCPI is easily readable from those of its components. It is clear that the crawl-down of CCPI was driven by a steep decline (although with respite) in CPIxNRS over the interval Q2-2002 to Q3-2003 that had over compensated for a slight increase in CPIxTR. The upward trend in CCPI (Q4-2003 to Q4-2005) was the outcome of a combination of a generally rising CPIxTR and a steadily increasing CPIxNRS index during the period. CCPI was driven mainly by CPIxTR over its cycle in 2005. While the CPIxNRS had generally crept upward, the CPIxTR had cycled over 2005.
Figure 6a: CCPI and CPIxTR. (2001=100)
9 5
9 8
1 0 1
1 0 4
1 0 7
1 1 0
1 1 3
2 0 0 2 -Q 1
Q 2 Q 3 Q 4 2 0 0 3 -Q 1
Q 2 Q 3 Q 4 2 0 0 4 -Q 1
Q 2 Q 3 Q 4 2 0 0 5 -Q 1
Q 2 Q 3 Q 4
C C P I C P I x T R

21
Figure 6b: CCPI and CPIxNRS. (2001=100)
9 0
9 3
9 6
9 9
1 0 2
1 0 5
1 0 8
2 0 0 2 -Q 1
Q 2 Q 3 Q 4 2 0 0 3 -Q 1
Q 2 Q 3 Q 4 2 0 0 4 -Q 1
Q 2 Q 3 Q 4 2 0 0 5 -Q 1
Q 2 Q 3 Q 4
C C P I C P I xN R S
Turning to the core CCPI inflation, Figures (7a)-(7b) depict Y-O-Y quarterly inflation in the CCPI and its two components: CPIxTR and CPIxNRS and Table (6) contain the relevant inflation rates. CCPI inflation had been negative prior to Q1-2004 whence it rose to 2.86%; trended upward over the interval Q4-2003 to Q4-2004; declined over the first two quarters of 2005; and picked up to 3.39% in Q3 and 4.39% in Q4.
Table 6: Y-O-Y Quarterly Inflation Rates
Quarter CPI CPIxTR CPIxNT CPIxNRS CPIxR CCPI 2002- Q4 -0.21 0.82 -1.53 -3.72 1.13 -0.54 2003- Q1 1.99 -0.42 5.13 -5.18 17.09 -1.81
Q2 2.40 0.82 4.41 -6.12 16.66 -1.25 Q3 2.44 -0.32 6.01 -6.97 21.10 -2.27 Q4 3.21 0.66 6.55 -5.33 20.31 -1.08
2004- Q1 5.39 3.72 7.45 0.67 13.82 2.86 Q2 6.03 3.83 8.73 0.30 16.62 2.83 Q3 7.24 4.40 10.70 4.08 16.61 4.31 Q4 8.48 5.11 12.64 4.00 20.51 4.80
2005- Q1 3.49 1.64 5.68 1.53 9.13 1.61 Q2 8.49 0.77 17.52 1.47 30.44 0.96 Q3 10.45 4.58 17.19 0.32 30.64 3.39 Q4 12.62 5.81 20.47 0.65 36.04 4.39
The path of CCPI inflation is easily readable from those of its components. The Y-O-Y inflation in consumer tradables index, CPIxTR, has been low or negative up to Q4-2003; rose significantly during 2004; declined (to an almost unobservable 0.77%) over the first half and picked up high during the second half of 2005 (Table 6). Meanwhile, the CPIxNRS inflation had been negative prior to Q1-2004 whence it surfaced at 0.67% to heave to 4.08% in Q3-2004, decline over the interval Q4-2004 to Q3-2005 to pick up in Q4-2005. A careful

22
examination of the fifth columns in Tables (5)-(6) and Figures (6b) and (7b) concludes that CPIxNRS inflation had been reversible over a twelve-quarter cycle. Having indicated that, a glance at Figure (7a) reveals that all turning points of the CCPI inflation are identical to those of CPIxTR inflation. Both CPIxTR and CPIxNRS inflation and their union (CCPI inflation) trended upward between the third quarter of 2003 and third quarter of 2004.
Consequently, CCPI inflation had reflected a mitigated image of CPIxTR inflation prior to Q3-2003 and over Q3-2004 to Q3-2005, owing to steadily falling CPIxNRS inflation (which reached a minimum in Q3-2005). That is, more influenced by CPIxTR, CCPI inflation followed its path, albeit at moderated pace. Table (7) computes the shares of CPIxTR and CPIxNRS inflation in the CCPI inflation.
Figure 7a: Y-O-Y Quarterly Inflation %
- 3
- 2
- 1
0
1
2
3
4
5
6
2 0 0 2 -Q 4
2 0 0 3 -Q 1
Q 2 Q 3 Q 4 2 0 0 4 -Q 1
Q 2 Q 3 Q 4 2 0 0 5 -Q 1
Q 2 Q 3 Q 4
C C P I C P I x T R Figure 7b: Y-O-Y Quarterly Inflation
%
- 7
- 5
- 3
- 1
1
3
5
2 0 0 2 -Q 4
2 0 0 3 -Q 1
Q 2 Q 3 Q 4 2 0 0 4 -Q 1
Q 2 Q 3 Q 4 2 0 0 5 -Q 1
Q 2 Q 3 Q 4
C C P I C P I xN R S

23
Table 7: Contributions to Y-O-Y Quarterly CCPI Inflation
CCPI % of CCPI Inflation Quarter Inflation CPIxTR CPIxNRS
2003- Q1 -1.81 16.40 83.60 Q2 -1.25 -46.05 146.05 Q3 -2.27 9.89 90.11 Q4 -1.08 -43.35 143.35
2004- Q1 2.86 93.38 6.62 Q2 2.83 97.02 2.98 Q3 4.31 73.56 26.44 Q4 4.80 76.80 23.20
2005- Q1 1.61 73.82 26.18 Q2 0.96 57.81 42.19 Q3 3.39 97.40 2.60 Q4 4.39 95.93 4.07
Imported Inflation: As indicated above, CCPI inflation has been mostly influenced by inflation in CPIxTR. To reiterate, imported consumer tradables dominate domestic market for consumer tradables. Therefore, owing to high supply elasticity of imports, under normal circumstances, core inflation is imported inflation dominated. Two major factors have determined imported inflation over most of the last three-year period: the weakening of the QR vis-à-vis currencies of the major trading-partner countries of Qatar; and the changes in foreign currency prices of imported merchandise. Thus, imported inflation has influenced the CCPI inflation significantly via exchange rate pass-through.11
Headline Inflation: one way, headline CPI is decomposable into core index, CCPI, and housing rent index CPIxR. Another way, it is decomposable into a consumer tradables index CPIxTR and a consumer nontradables index CPIxNT; Table (8) decomposes CPI into its major components. Iterating on the effects the CPIxR inflation had on the CPI inflation consider its effect on the inflation in the CPIxNT, which combines CPIxNRS and CPIxR, as shown in Table (9). An examination of Tables (8) and (9) reveals that while the Y-O-Y quarterly inflation in CPIxNT contributed 80.85%on averageto the CPI inflation, rent inflation has never contributed less than 82% of the Y-O-Y inflation in CPIxNT during the three-year period Q1-2003 to Q42005. Comparing Figures (7b), (8a) and (8b), it can be seen that the rent inflation increased significantly over the first quarter of 2003 and trended upward (albeit with respite) during the year. The acceleration in CPIxR inflation was
11 That is despite a reduction in the relative weight of the CPIxTR components in the CCPI from 0.786 for base year 1988 to 0.699 for base year 2001; a reduction of 11%.

24
high enough to overcompensate for the deflation in CPIxNRS during 2003 so that their aggregate (CPIxNT inflation) had been generally on the rise (with respite in the second quarter).
Table 8: Contributions to the Y-O-Y Quarterly CPI Inflation
CPI % of CPI Inflation Quarter Inflation CPIxTR CPIxNT CPIxNRS Rent CCPI
2003- Q1 1.99 -11.91 111.91 -60.70 172.61 -72.61 Q2 2.40 19.05 80.95 -60.42 141.37 -41.37 Q3 2.44 -7.35 107.35 -66.99 174.34 -74.34 Q4 3.21 11.67 88.33 -38.59 126.92 -26.92
2004- Q1 5.39 38.19 61.81 2.71 59.11 40.89 Q2 6.03 34.93 65.07 1.07 63.99 36.01 Q3 7.24 33.35 66.65 11.98 54.67 45.33 Q4 8.48 33.28 66.72 10.05 56.66 43.34
2005- Q1 3.49 25.65 74.35 9.10 65.25 34.75 Q2 8.49 4.87 95.13 3.55 91.58 8.42 Q3 10.45 23.43 76.57 0.63 75.94 24.06 Q4 12.62 24.66 75.34 1.05 74.29 25.71
Table 9: Contributions to the Y-O-Y Quarterly Inflation in CPIxNT
CPIxNT % of CPIxNT Inflation Quarter Inflation CPIxNRS Rent
2003- Q1 5.13 -54.24 154.24 Q2 4.41 -74.64 174.64 Q3 6.01 -62.40 162.40 Q4 6.55 -43.69 143.69
2004- Q1 7.45 4.38 95.62 Q2 8.73 1.65 98.35 Q3 10.70 17.98 82.02 Q4 12.64 15.07 84.93
2005- Q1 5.68 12.23 87.77 Q2 17.52 3.74 96.26 Q3 17.19 0.82 99.18 Q4 20.47 1.39 98.61
The inflation in the CPIxNRS had turned positive during 2004, but was almost unobservable (notably less than 1%) during the first half of the year and hiked to about 4% during the second half. The growing rent inflation during 2004 had, therefore, accelerated the inflation in CPIxNT during the year. That is, the growth in the CPIxR had much reinforced the growth in CPIxNRS up to the end of 2004. Following a strong respite in the first quarter of 2005, the CPIxR inflation surged vigorously in the second quarter and continued to accelerate during the third and fourth quarters. Meanwhile, inflation in the CPIxNRS had

25
been creeping down during 2005. That is, the acceleration in rent inflation had overcome the disinflation in CPIxNRS during 2005 (i.e., crawling inflation) into a sharply rising CPIxNT inflation (also see Table 9).12
Figure 8a: CPIxR, CPIxNRS, and CPIxNT. (2001=100)
8 09 0
1 0 01 1 01 2 01 3 01 4 01 5 01 6 01 7 01 8 01 9 02 0 0
2 0 0 2 -Q 1
Q 2 Q 3 Q 4 2 0 0 3 -Q 1
Q 2 Q 3 Q 4 2 0 0 4 -Q 1
Q 2 Q 3 Q 4 2 0 0 5 -Q 1
Q 2 Q 3 Q 4
C P I xN R S C P I xN T C P I xR
Figure8b: Inflation in CPIxR, CPIxNRS, and CPIxNT
%
- 1 0
- 5
0
5
1 0
1 5
2 0
2 5
3 0
3 5
4 0
2 0 0 2 -Q 4
2 0 0 3 -Q 1
Q 2 Q 3 Q 4 2 0 0 4 -Q 1
Q 2 Q 3 Q 4 2 0 0 5 -Q 1
Q 2 Q 3 Q 4
C P I x N R S C P I x N T C P I x R
In a nutshell, inflation in the price index of nontradables (CPIxNT) had mostly reflected rent rather than non-rent inflation. Such effects of rent inflation are reflected on, and embedded in headline CPI inflation, even if partly masked by the behaviour of CPIxTR inflation. Figure (9) depicts the headline CPI and its main components: CCPI and CPIxR. The CPI had been almost intangibly creeping down during 2002; started to crawl up in Q1-2003 to reach 103 in Q4-2003; jump to 107.72 in Q1-2004; and trend upward to reach 111.73 and 12 The high rise in rent inflation has been due to sizeable supply shortage in residential housing owing to the demolition of large number of homes and residential compounds in a number of sections of the capital city; and increasing demand for housing and office space owing to economic expansion and sharply rising expatriate population.

26
111.48 in Q4-2004 and Q1-2005, respectively. The CPI then accelerates to reach its highest of 125.83 in the forth quarter of 2005.
Turning to headline inflation, refer to figure (5), which depicts Y-O-Y quarterly CPI headline inflation and its components: CCPI and CPIxR inflation. The CPI inflation had been trending upward over the interval Q1-2003 to Q4-2005 with noticeable shift in Q1-2004 (due to a corresponding shift in CCPI inflation), to reach about 8.48% by the fourth quarter of 2004. CPI inflation then declined sharply in the first quarter of 2005 (due to a corresponding passing drop in CPIxR inflation and a reduction in CCPI inflation) to pick up in second quarter and accelerate to reach about 12.6% in the fourth quarter.
Figure 9: CPI, CCPI, and CPIxR. (2001=100)
9 01 0 01 1 0
1 2 01 3 01 4 01 5 01 6 01 7 0
1 8 01 9 02 0 0
2 0 0 2 -Q 1
Q 2 Q 3 Q 4 2 0 0 3 -Q 1
Q 2 Q 3 Q 4 2 0 0 4 -Q 1
Q 2 Q 3 Q 4 2 0 0 5 -Q 1
Q 2 Q 3 Q 4
C P I C C P I C P I xR
The time path of the CPI inflation is determined by those of its component indexes. Table (8) contains relevant inflation rates and Table (10) shows the relative shares of rent and core inflation in the headline inflation. Inflation in the core CCPI contributed negatively at an average share of -53.81% to headline inflation during 2003; positively at an average share of 41.39% during 2004; and 23.24% during 2005. Rent inflation contributed the rest.
Headline inflation has reflected a mitigated image of rent inflation prior to Q1-2004 due to deflation in the core index. The acceleration in the headline inflation over the interval Q3-2003 to Q1-2004 was underlying inflation driven (notice the deceleration in the CPIxR inflation). Upward trending core and rent inflation during 2004 had reinforced each other, resulting in the upward trend in headline CPI inflation over the year. After witnessing a passing drop due to a drop in both of its components in Q1-2005; CPI inflation picked up in Q2 driven only by rent inflation; resumed rising driven by inflation in CPIxTR in Q3, and by both rent inflation and inflation in CPIxTR in Q4-2005.
27
III. Conclusion There is a need for monetary-policy makers to decompose headline (CPI) inflation figures into a trend component that reflects persistent sources of inflationary pressures, and a transient reversible component. Central banks are typically more concerned with the first component—termed as underlying or core inflation—since it reflects the underlying trends in prices caused by aggregate demand and aggregate supply pressures and changes in inflationary expectations.
The majority of central banks focus on the rate of change in some variant of the CPI for the purposes of analyzing current, and forecasting future inflation. CPI can be adjusted in various ways such that an adjusted index can provide valuable information on the extent to which an observed increase in inflation is temporary. By far, the most common and closely watched measures of core inflation are the so-called exclusion-based measures. At the most basic level, such measures typically involve excluding certain price categories from the headline inflation rate.
This study introduces the concept and the measurement of core inflation to the economies of the GCC countries for the purposes of proposing the use of such concept as a monetary criterion for attending the GCC monetary union instead of the general CPI. Employing data from Qatar, the study argues that some CPI categories are irrelevant to the making and implementation of the QCB monetary policy, precisely, housing rent. It is conjectured that this might also be the case for the UAE; Dubai in particular. Other CPI categories may be relevant for other GCC economies.
Therefore, we propose the preparation of a detailed analytical study of the CPI baskets in the six countries to identify the appropriate methodology for the construction of the core inflation measure for each. Having constructed the six core inflation measures, they are to be used as entry criterion to the monetary union. A corresponding index, that would be constructed out of these core inflation measures, is proposed to be used by the central monetary authorities as an information variable for the making of the unified monetary policy and as the basis for inflation control within the union.

28
ABBREVIATIONS
CPI Consumer Price Index. CCPI Core Consumer Price Index: Excludes housing rent. CPIxTR Consumer Tradables Price Index: Excludes all nontradables. CPIxNT Consumer Nontradables Price Index: Excludes all tradables. CPIxNRS Non-Rent-Services Price Index: Excludes rent and tradables. CPIxR Housing Rent Price Index. GDP Gross Domestic Product. NEER Nominal Effective Exchange Rate Index. QCB Qatar Central Bank. QR Qatari Riyal. PC Planning Council in Qatar. USD United States Dollar. Y-O-Y Analyzed period compared to same period of previous year. q-o-q Quarter compared to previous quarter. π Inflation Rat.

29
References
Bryan, M.F., and S.G., Cecchetti (1999), “The Monthly Measurement of Core Inflation in Japan,” Monetary and Economic Studies, May 1999, Bank of Japan.
Hogan, S., Johnson, M., and Lafleche, T. (2001), £Core Inflation,” Technical Report No. 89, Bank of Canada.
Mio, H., and M. Higo (1999), “Underlying Inflation and the Distribution of Price Changes: Evidence from the Japanese Trimmed Mean CPI,” IMES discussion paper No. 99-E-5, Bank of Japan.
Nielsen, H.B, and D. Knudsen (2002), “Robust estimation of the expected inflation,” Danmarks' National Bank.
Roger, S. (1997), “A robust measure of core inflation in New Zealand, 1949-96,” Reserve Bank of New Zealand.
Several Inflation Report Published by National Central Banks. Vega, J.L., and M.A. Wynne (2001), “An Evaluation of Some Measures of
Core Inflation for the Euro Area,” Working Paper No.53, European Central Bank.
Wynne, M.A. (1999), “Core Inflation: A Review of Some Conceptual Issues,” Working Paper No.5, European Central Bank.


![Short-Term Forecasting of Nigeria Inflation Rates Using ...article.sciencepublishinggroup.com/pdf/10.11648.j.sjams...Doguwa and Alade [6] proposed four short term headline inflation](https://img.dokumen.tips/doc/110x75/5adf6ed77f8b9afd1a8cb3f0/short-term-forecasting-of-nigeria-inflation-rates-using-and-alade-6-proposed.jpg)