Embed Size (px)
Citation preview

Journal of Molecular Liquids 170 (2012) 30–36
Contents lists available at SciVerse ScienceDirect
Journal of Molecular Liquids
j ourna l homepage: www.e lsev ie r .com/ locate /mol l iq
Densities and refractive indices for the ternary mixturemethanol/propan-1-ol/acetonitrile
Filomena Martins a,⁎⁎, Ruben Elvas Leitão b, M. Cristina Ventura a,c, Lídia Pinheiro d, Nélson Nunes b,⁎a Departamento de Química e Bioquímica and Centro de Química e Bioquímica (CQB), Faculdade de Ciências, Universidade de Lisboa, Ed. C8, Campo Grande 1749-016 Lisboa, Portugalb Área Departamental de Engenharia Química, Instituto Superior de Engenharia de Lisboa (ISEL), Instituto Politécnico de Lisboa and Centro de Química e Bioquímica (CQB),R. Conselheiro Emídio Navarro, 1959-007 Lisboa, Portugalc Instituto Superior de Educação e Ciências, Alameda das Linhas de Torres, 179, 1750-142 Lisboa, Portugald Research Institute for Medicines and Pharmaceutical Sciences (iMED.UL), Faculdade de Farmácia, Universidade de Lisboa, Av. Prof. Gama Pinto, 1649-003 Lisboa, Portugal
⁎ Correspondence to: N. Nunes, ÁreaDepartamental dSuperior de Engenharia de Lisboa (ISEL), Instituto PolitéQuímica e Bioquímica (CQB), R. Conselheiro Emídio NavaTel.: +351 218317000; fax: +351 218317001.⁎⁎ Correspondence to:F. Martins, Departamento de Qu
de Química e Bioquímica (CQB), Faculdade de Ciências,Campo Grande 1749-016 Lisboa, Portugal. Tel.:+351 217
E-mail addresses: [email protected] (N. Nunes)
0167-7322/$ – see front matter © 2012 Elsevier B.V. Alldoi:10.1016/j.molliq.2012.03.015
a b s t r a c t
a r t i c l e i n f oArticle history:Received 9 August 2011Received in revised form 11 March 2012Accepted 14 March 2012Available online 29 March 2012
Keywords:Ternary mixtureMethanolAcetonitrilePropan-1-olRefractive indexDensityMolar volumeExcess properties
Refractive indices, nD, and densities, ρ, at 298.15 K were measured for the ternary mixture methanol (MeOH)/propan-1-ol (1-PrOH)/acetonitrile (MeCN) for a total of 22 mole fractions, along with 18 mole fractions of eachof the corresponding binary mixtures, methanol/propan-1-ol, propan-1-ol/acetonitrile and methanol/acetoni-trile. The variation of excess refractive indices and excess molar volumes with composition was modeled bythe Redlich–Kister polynomial function in the case of binarymixtures and by the Cibulka equation for the ternarymixture. A thermodynamic approach to excess refractive indices, recently proposed by other authors, wasapplied for the first time to ternary liquid mixtures. Structural effects were identified and interpreted both inthe binary and ternary systems. A complex relationship between excess refractive indices and excess molarvolumes was identified, revealing all four possible sign combinations between these two properties. Structuringof the mixtures was also discussed on the basis of partial molar volumes of the binary and ternary mixtures.
© 2012 Elsevier B.V. All rights reserved.
1. Introduction
Structural studies on mixed solvents have known significant devel-opments both in experimental terms and from an interpretative pointof view (theoretical and empirical), not only due to the foreseen appli-cations of solventmixtures in fields such as analytical chemistry, indus-trial processes and the design of biological environments, but also dueto the pressing demands for greener liquid media [1].
Most publishedworks refer to binary systems, inwhich complexitiesarising from synergistic effects have been detected and discussed.However, ternary (and higher order) mixtures, which are, in general,not only more complex but also potentially more informative, sincetheir properties can be tunned through an adequate choice of compo-nents and compositions, are still scarcely addressed in the literature.
e Engenharia Química, Institutocnico de Lisboa and Centro derro, 1959-007 Lisboa, Portugal.
ímica e Bioquímica and CentroUniversidade de Lisboa, Ed. C8,500870; fax: +351 217500088., [email protected] (F. Martins).
rights reserved.
From the properties that have a marked influence on the physico-chemical behavior of solvents, polarizability and molar volume areamong themost prominent. These properties can be expressed by the re-fractive index, nD, and the density, ρ, respectively. Variations of these andother derived properties, as well as of the corresponding excess proper-ties may reveal particular structural characteristics, which may shedsome light into the interplay of intermolecular forces and the local order-ing induced by them throughout the whole composition range.
Although refractive indices and densities have been studied byother authors in the three binary mixtures that compose the ternarymixture methanol/propan-1-ol/acetonitrile (MeOH/1-PrOH/MeCN)which is the object of our study, namely, in methanol/propan-1-ol[2], in methanol/acetonitrile [3–14], and in propan-1-ol/acetonitrile[5,6,9,10,13–17], themain purpose of thiswork is to continue a system-atic characterization of the referred ternary mixture [18,19], along witha further characterization of the underlying binary mixtures. Addition-ally,we have calculated and compared excess refractive indices derived,on one hand, assuming the commonly used approach of consideringthis quantity as the difference between experimental values andmole-fraction weighted average values for the refractive indices beforemixing (unmixed) and, on the other hand, taking into account a recent-ly proposed thermodynamically based approach. The latter considersthat the refractive indices before mixing and the corresponding ideal

31F. Martins et al. / Journal of Molecular Liquids 170 (2012) 30–36
values are expressed, respectively, in terms of the volume-fractionweighted average and the square-root of volume-fraction weightedaverage of pure component squared refractive indices [20].
2. Materials and methods
All chemicals employed were supplied by Sigma-Aldrich (purity>99%). SolventswereHPLC grade and their puritywas confirmed by ascer-taining that values obtained for the measured physical properties forthe pure solvents (densities and refractive indices) were in agreementwith literature values (Table 1). Water used for calibration purposeswas obtained from a Milli-Q Water purification system (Millipore).Mixtures were carefully prepared by mass in a precision balance withan uncertainty in mole fraction of ±2×10⁻⁴. Precautions were takento avoid evaporation and contamination by humidity. The water con-tent of the alcohols and acetonitrile (below 0.08%) was not found tobe relevant to incorporate in the calculation of the mole fraction.
Refractive indices were measured with an accuracy of±2×10⁻⁴ at298.15±0.5 K with a thermostated ATAGO model 302 refractometer,calibrated with 1-bromonaphthalene, as recommended in the oper-ating manual. The refractive index measurements were performedat the sodium D1 wavelength (589.6 nm) after the liquid mixturereached a constant temperature in the refractometer cell, as measuredby a control thermometer.
Densities of the pure chemicals and their mixtures were measuredwith a precision of ±10−5 g cm−3 using an Anton Paar vibrating-tube digital densimeter consisting of 3 units (cell unit DMA 512, pro-cessing unit DMA 60 and display unit DT 100–30), which measures os-cillating periods and controls temperature with a precision of ±0.01 K.Freshly prepared and degassed, high-purity water (κ=0.8 μS m−1)was used to calibrate the densimeter prior to each set ofmeasurements,taking ρH2O
* at 25 °C as 0.997047 g cm−3 [21]. The density of dry air,also used in the calibration process, was calculated as ρair (25 °C)/(g cm−3)=1.16914×10⁻⁶ p/(hPa) [22]. All measurements weremade at atmospheric pressure. After allowing 30 min for thermal equil-ibration, each density measurement was taken as the average value often consecutive readings.
3. Results and discussion
The experimental refractive indices,nD, at 298.15 K, the refractiveindices of mixing, nDE *, defined on a mole fraction basis, the refractiveindices of the thermodynamically ideal mixtures, nDid, and the thermo-dynamic excess refractive indices, nDE, are presented in tables S1 (binarymixtures) and S2 (ternary mixture) of the Supplementary Material.
The deviation of nD from ideality, or in other words, the refractiveindex of mixing, Δmix, xnD, defined on a mole fraction basis, as it isusually reported in the literature, is given by Eq. (1):
Δmix;xnD ¼ nE�D ¼ nD−∑xinDi
ð1Þ
where xi is themole fraction of each component, nDithe refractive index
of the pure component, and nD the refractive index of the mixture.However, Brocos et al. [23] have suggested that the refractive index
ofmixing should instead be defined on a volume fraction basis, inwhichxi is replaced byϕi, the volume fraction of each component, so that it can
Table 1Refractive indices, nD, and densities, ρ, of pure components at 298.15 K, and literaturereference values for comparison purposes.
Component nD ρ/g cm−3
Exp. Lit. [24] Exp. Lit. [24]
Methanol 1.3269 1.36652 0.78665 0.786371-Propanol 1.3831 1.38370 0.79979 0.79960Acetonitrile 1.3414 1.34163 0.77657 0.77649
be interpreted as reflecting changes in free volume. According to theseauthors, Δmix, xnD is not physically significant although it has beenoften used as a suitable mean of reporting high quality data.
Reis et al. [20] have very recently proposed a new approach todefine and interpret the refractive indices of binary liquid mixtures,which is based on the Maxwell relationship between refractive indicesand relative permittivities, and on a clear distinction between refractiveindex before and after thermodynamically idealmixing, both expressedin terms of volume fractions.
These authors define the refractive index before mixing, nD(unmixed), by Eq. (2):
nD unmixedð Þ ¼ ∑ϕinDið2Þ
and the refractive index of mixing, Δmix,φnD by Eq. (3):
Δmix;ϕnD ¼ nD−nD unmixedð Þ: ð3Þ
The thermodynamic ideal refractive index of mixture, nDid, is definedby Eq. (4):
nidD ¼ ∑ϕi nDi
� �2� �1=2: ð4Þ
According to this formalism, the thermodynamic excess refractiveindex, nDE, is given by Eq. (5):
nED ¼ nD−nid
D ¼ nD− ∑ϕi nDi
� �2� �1=2¼ Δmix;ϕnD−Δmix;ϕn
idD ð5Þ
where Δmix,ϕnDid=nD
id−∑(ϕinDi). The remaining symbols are either
introduced in the text or have the same meaning as above.We have applied, compared and discussed both treatments of
refractive indices: the frequently used Eq. (1) and the newly proposedEq. (5). To the best of our knowledge the new thermodynamic treat-ment of mixing and excess refractive indices developed for binarymixtures has never before been applied to ternary mixtures.
In Tables S3 and S4 of the Supplementary Material the values ofdensity, respectively for the binary and ternary mixtures at 298.15 K,are presented along with the calculated values of excess molar vol-umes and partial molar volumes of the different mixture components.
Excess molar volume, VmE, was calculated using the Eq. (6):
VmE ¼ ∑xiMi ρ−1−ρ−1
i
� �ð6Þ
where xi is the mole fraction of each component,Mi is the molar massof the component i, ρi, the density of the pure component and ρ thedensity of the mixture.
The partial molar volume of each component, V̄ i, was calculatedusing Eq. (7).
V¯ i ¼ V0i þ V E
i ð7Þ
where Vi0 is the molar volume of the pure component and V E
i is theexcess partial molar volume of component i, which is determinedusing Eq. (8) [24,25]:
V Ei ¼ VE þ 1−xið Þ ∂VE
∂xi
!T ;p
ð8Þ
In the case of the ternarymixtures the excess partial molar volumewas determined using Eq. (9) [26,27]:
V Ei ¼ VE þ ∂VE
∂xi
!T;p;xj≠xi
−Xnk¼1
xk∂VE
∂xk
!T;p;xj≠xk
ð9Þ
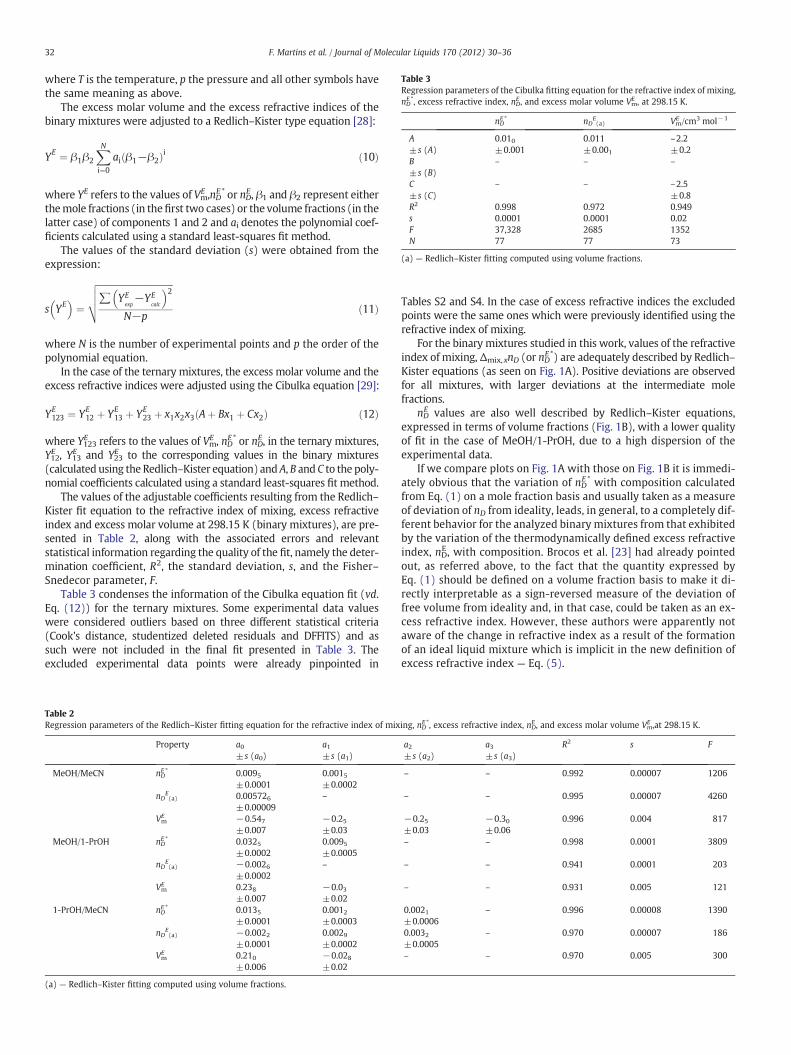
Table 3Regression parameters of the Cibulka fitting equation for the refractive index of mixing,nDE *, excess refractive index, nDE , and excess molar volume Vm
E , at 298.15 K.
nDE * nD
E(a) Vm
E /cm3 mol−1
A±s (A)
0.010±0.001
0.011±0.001
–2.2±0.2
B±s (B)
– – –
C±s (C)
– – –2.5±0.8
R2 0.998 0.972 0.949s 0.0001 0.0001 0.02F 37,328 2685 1352N 77 77 73
(a) — Redlich–Kister fitting computed using volume fractions.
32 F. Martins et al. / Journal of Molecular Liquids 170 (2012) 30–36
where T is the temperature, p the pressure and all other symbols havethe same meaning as above.
The excess molar volume and the excess refractive indices of thebinary mixtures were adjusted to a Redlich–Kister type equation [28]:
YE ¼ β1β2
XNi¼0
ai β1−β2ð Þi ð10Þ
where YE refers to the values of VmE ,nDE * or nDE, β1 and β2 represent eitherthemole fractions (in thefirst two cases) or the volume fractions (in thelatter case) of components 1 and 2 and ai denotes the polynomial coef-ficients calculated using a standard least-squares fit method.
The values of the standard deviation (s) were obtained from theexpression:
s YE� �
¼
ffiffiffiffiffiffiffiffiffiffiffiffiffiffiffiffiffiffiffiffiffiffiffiffiffiffiffiffiffiffiffiffiffiffi∑ YE
exp−YE
calc
� �2N−p
vuut ð11Þ
where N is the number of experimental points and p the order of thepolynomial equation.
In the case of the ternary mixtures, the excess molar volume and theexcess refractive indices were adjusted using the Cibulka equation [29]:
YE123 ¼ YE
12 þ YE13 þ YE
23 þ x1x2x3 Aþ Bx1 þ Cx2ð Þ ð12Þ
where Y123E refers to the values of VmE , nDE * or nDE, in the ternary mixtures,
Y12E , Y13E and Y23
E to the corresponding values in the binary mixtures(calculated using the Redlich–Kister equation) and A, B and C to the poly-nomial coefficients calculated using a standard least-squares fit method.
The values of the adjustable coefficients resulting from the Redlich–Kister fit equation to the refractive index of mixing, excess refractiveindex and excess molar volume at 298.15 K (binary mixtures), are pre-sented in Table 2, along with the associated errors and relevantstatistical information regarding the quality of the fit, namely the deter-mination coefficient, R2, the standard deviation, s, and the Fisher–Snedecor parameter, F.
Table 3 condenses the information of the Cibulka equation fit (vd.Eq. (12)) for the ternary mixtures. Some experimental data valueswere considered outliers based on three different statistical criteria(Cook's distance, studentized deleted residuals and DFFITS) and assuch were not included in the final fit presented in Table 3. Theexcluded experimental data points were already pinpointed in
Table 2Regression parameters of the Redlich–Kister fitting equation for the refractive index of mix
Property a0±s (a0)
a1±s (a1)
MeOH/MeCN nDE * 0.0095
±0.00010.0015±0.0002
nDE(a) 0.005726
±0.00009–
VmE −0.547
±0.007−0.25±0.03
MeOH/1-PrOH nDE * 0.0325
±0.00020.0095±0.0005
nDE(a) −0.0026
±0.0002–
VmE 0.238
±0.007−0.03±0.02
1-PrOH/MeCN nDE * 0.0135
±0.00010.0012±0.0003
nDE(a) −0.0022
±0.00010.0029±0.0002
VmE 0.210
±0.006−0.028±0.02
(a) — Redlich–Kister fitting computed using volume fractions.
Tables S2 and S4. In the case of excess refractive indices the excludedpoints were the same ones which were previously identified using therefractive index of mixing.
For the binary mixtures studied in this work, values of the refractiveindex of mixing, Δmix, xnD (or nDE *) are adequately described by Redlich–Kister equations (as seen on Fig. 1A). Positive deviations are observedfor all mixtures, with larger deviations at the intermediate molefractions.
nDE values are also well described by Redlich–Kister equations,
expressed in terms of volume fractions (Fig. 1B), with a lower qualityof fit in the case of MeOH/1-PrOH, due to a high dispersion of theexperimental data.
If we compare plots on Fig. 1A with those on Fig. 1B it is immedi-ately obvious that the variation of nDE * with composition calculatedfrom Eq. (1) on a mole fraction basis and usually taken as a measureof deviation of nD from ideality, leads, in general, to a completely dif-ferent behavior for the analyzed binary mixtures from that exhibitedby the variation of the thermodynamically defined excess refractiveindex, nDE, with composition. Brocos et al. [23] had already pointedout, as referred above, to the fact that the quantity expressed byEq. (1) should be defined on a volume fraction basis to make it di-rectly interpretable as a sign-reversed measure of the deviation offree volume from ideality and, in that case, could be taken as an ex-cess refractive index. However, these authors were apparently notaware of the change in refractive index as a result of the formationof an ideal liquid mixture which is implicit in the new definition ofexcess refractive index — Eq. (5).
ing, nDE *, excess refractive index, nDE , and excess molar volume VmE ,at 298.15 K.
a2±s (a2)
a3±s (a3)
R2 s F
– – 0.992 0.00007 1206
– – 0.995 0.00007 4260
−0.25±0.03
−0.30±0.06
0.996 0.004 817
– – 0.998 0.0001 3809
– – 0.941 0.0001 203
– – 0.931 0.005 121
0.0021±0.0006
– 0.996 0.00008 1390
0.0032±0.0005
– 0.970 0.00007 186
– – 0.970 0.005 300

Fig. 1. Variation of refractive index of mixing, nDE * (A), excess refractive index, nDE (B) andexcess molar volume, VmE (C) with composition, and Redlich–Kister fittings to experimen-tal data (full and dashed lines) for the three binary mixtures, at 298.15 K.
33F. Martins et al. / Journal of Molecular Liquids 170 (2012) 30–36
A close inspection of Fig. 1A and B (and of values on Table S2) showsthat from all three binary mixtures, only MeOH/MeCN presents a goodcorrelation between nD
E * and nDE. Moreover, this mixture is the only
one for which there is an almost perfect overlap between Δmix,ϕnDand nD
E, indicating that for this mixture the refractive index before mix-ing and after ideal mixing does not vary significantly or, in other words,
thatΔmix,ϕnDid→0. On the contrary, for the other twomixtures these dif-
ferences are very expressive.From Fig. 1B it is also apparent that the two binary mixtures
involvingmethanol behave in opposite directions as regards the refrac-tive index. In MeOH/MeCN there is a strengthening of polarizability inthe whole composition range by comparison with ideality, and nD
E
attains a maximum value at x2=0.5. On the contrary, the mixtureMeOH/1-PrOH shows a negative deviation (nDE b0) for allmole fractions,going through a minimum at x2=0.275. The mixture 1-PrOH/MeCNexhibits a sigmoidal behavior, with nD
E>0 in the range 0bx2b0.333and nD
E b0 for the remaining compositions.Following the same approach used for the binary mixtures, it is
possible to extend this analysis to the ternary mixtures using theCibulka equation to define the surface created by the experimentaldata (Fig. 2A and 2B).
Excess refractive indices are also effectively described both by theRedlich–Kister and Cibulka equations (in terms of mole fractions inFig. 2A and of volume fractions in Fig. 2B), depending on whetherone looks at the borderlines (binary systems) or at the surface ofthe plot (ternary systems). The apparent higher dispersion in theseplots when compared to the previous (binary) plots, which is particu-larly evident in Fig. 2B, is due to the smaller magnitude of the derivedquantities (either nDE * or nDE) and thus to a higher relative uncertainty.
Also worth of notice is that for the great majority of the ternarymixture mole fractions,nDE is different from Δmix,ϕnD which meansthat Δmix,ϕnD
id≠0. On the other hand, excess refractive indices aremostly positive reaching their maximum at the following composition:x(MeCN)=0.5, 0.35bx (MeOH)b0.45 and 0.05bx(1-PrOH)b0.15.
Inwhat regards excessmolar volumes the analysis is relatively com-plex, since their magnitude and sign may be due to several contribu-tions associated with various physicochemical and geometric aspects[31,32]. Thus, an increase in molar volume may be ascribed to:
(a) Bond breaking within one or all components of the mixture, forexample, hydrogen bond breaking or disruption in the interac-tion between molecules associated by weaker forces such asdipole–dipole or dipole-induced dipole;
(b) Non-favorable molecular geometry to mutually accommodatedifferent mixture component molecules;
(c) Stereochemical hindrance preventing the effective attractionamong molecules of different mixture components.
In turn, a contraction of molar volume may be attributed to:
(a) Chemical interactions between the various components of themixture through the formation of hydrogen bonds, also calledstrong specific interactions;
(b) Association through weaker intermolecular forces such as di-pole–dipole forces;
(c) Accommodation of molecules of a component in the structuralnetwork of another component;
(d) Favorable geometry accommodation of molecules within themixture.
In the case of the studied binary mixtures (Fig. 1C), the observedresults corroborate the information already existing in the literatureconcerning some of these mixtures [2–17], in particular, as to theshape of the curves obtained (both concavity and magnitude of varia-tion). At this point it is, however, worth of mentioning the reversedtrend observed in nD
E and VmE plots against x2 for all three binary
mixtures.All studied solvents are clearly identified as associated pure liq-
uids: (i) acetonitrile, due to its high dipole moment, favors non-specific dipole-dipole interactions; (ii) methanol and propan-1-olare highly associated solvents since, besides being able to establish di-polar interactions, they also have their structures strengthened
E*Dn
EDn
EmV
/ cm3 mol-1
A
B
C
34 F. Martins et al. / Journal of Molecular Liquids 170 (2012) 30–36
through hydrogen bonds. In the case of themixture 1-PrOH/MeCN theprevailing effect is the breaking of hydrogen bonds which is not coun-terbalanced by the formation of new bonds or by their replacementthrough weaker heteromolecular specific and non-specific interac-tions, leading therefore to a molar volume expansion [16]. This effectresults in a positive excess molar volume, as shown in Fig. 1C, moreprominent in MeCN rich regions, which attains a maximum value at0.695bx2b0.725. In the alcohol rich fractions, alcohol–alcohol specificinteractions dominate and excess molar volume is globally nearlyzero.
In the case of MeOH/MeCN the existence of hydrogen bonds of thetype OH---N`C, and specific interactions between \OH groups andthe π electron system, causes a decrease in molar volume (with a max-imum contraction at 0.250bx2b0.375) reported also by other authors[7,33]. The difference for 1-PrOH/MeCN is explained by the highesthydrogen bond donor capacity (HBD) of methanol versus propan-1-ol,with attractive interactions overcoming repulsive ones [9,34,35]. Addi-tionally, and equally important, is the accommodation of MeCN mole-cules in the structure of MeOH.
Lastly, MeOH/1-PrOH shows a positive excess molar volume, as inthe case of 1-PrOH/MeCN. Nevertheless, the profile ismore symmetrical(reaching a maximum value at the equimolar composition) since thereis a break of hydrogen bonds and a simultaneous formation of newspecific heteromolecular bonds which, however, do not compensatethose which were initially present.
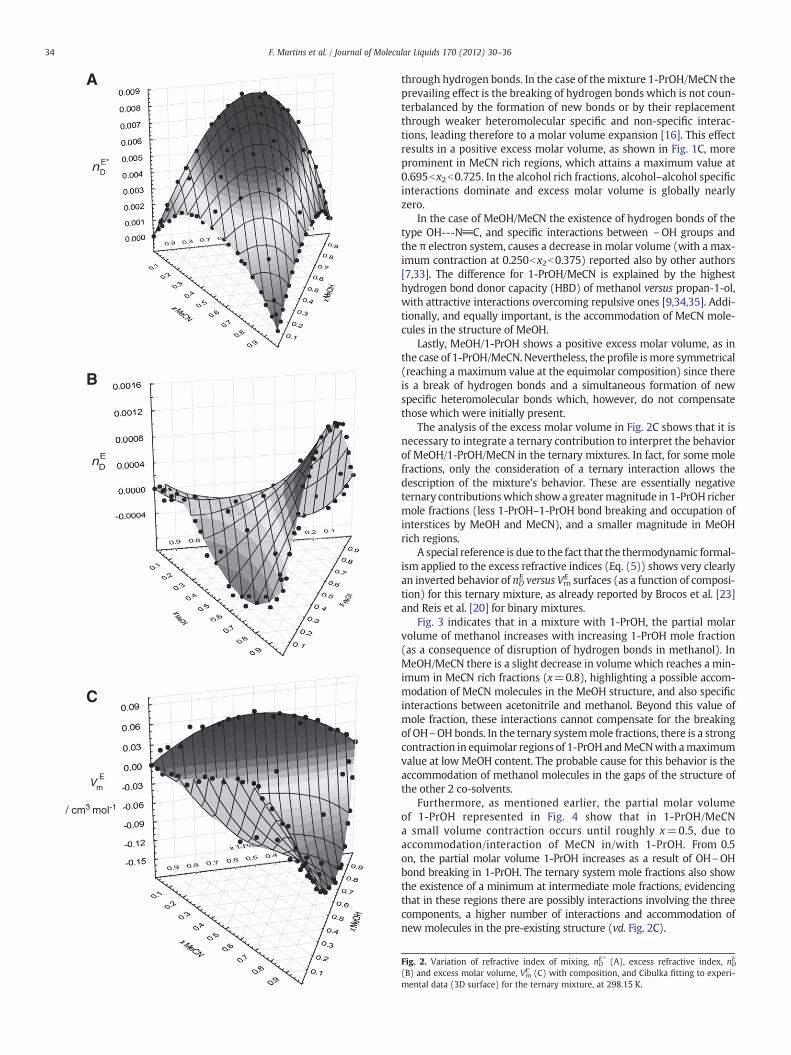
The analysis of the excess molar volume in Fig. 2C shows that it isnecessary to integrate a ternary contribution to interpret the behaviorof MeOH/1-PrOH/MeCN in the ternary mixtures. In fact, for some molefractions, only the consideration of a ternary interaction allows thedescription of the mixture's behavior. These are essentially negativeternary contributionswhich show a greatermagnitude in 1-PrOH richermole fractions (less 1-PrOH–1-PrOH bond breaking and occupation ofinterstices by MeOH and MeCN), and a smaller magnitude in MeOHrich regions.
A special reference is due to the fact that the thermodynamic formal-ism applied to the excess refractive indices (Eq. (5)) shows very clearlyan inverted behavior of nDE versus VmE surfaces (as a function of composi-tion) for this ternary mixture, as already reported by Brocos et al. [23]and Reis et al. [20] for binary mixtures.
Fig. 3 indicates that in a mixture with 1-PrOH, the partial molarvolume of methanol increases with increasing 1-PrOH mole fraction(as a consequence of disruption of hydrogen bonds in methanol). InMeOH/MeCN there is a slight decrease in volume which reaches a min-imum in MeCN rich fractions (x=0.8), highlighting a possible accom-modation of MeCN molecules in the MeOH structure, and also specificinteractions between acetonitrile and methanol. Beyond this value ofmole fraction, these interactions cannot compensate for the breakingof OH\OH bonds. In the ternary systemmole fractions, there is a strongcontraction in equimolar regions of 1-PrOHandMeCNwith amaximumvalue at low MeOH content. The probable cause for this behavior is theaccommodation of methanol molecules in the gaps of the structure ofthe other 2 co-solvents.
Furthermore, as mentioned earlier, the partial molar volumeof 1-PrOH represented in Fig. 4 show that in 1-PrOH/MeCNa small volume contraction occurs until roughly x=0.5, due toaccommodation/interaction of MeCN in/with 1-PrOH. From 0.5on, the partial molar volume 1-PrOH increases as a result of OH\OHbond breaking in 1-PrOH. The ternary system mole fractions also showthe existence of a minimum at intermediate mole fractions, evidencingthat in these regions there are possibly interactions involving the threecomponents, a higher number of interactions and accommodation ofnew molecules in the pre-existing structure (vd. Fig. 2C).
Fig. 2. Variation of refractive index of mixing, nDE * (A), excess refractive index, nDE
(B) and excess molar volume, VmE (C) with composition, and Cibulka fitting to experi-
mental data (3D surface) for the ternary mixture, at 298.15 K.

Fig. 3. Variation of partial molar volume of methanol with composition in the ternarymixture MeOH/1-PrOH/MeCN, at 298.15 K.
Fig. 5. Variation of partial molar volume of acetonitrile with composition in the ternarymixture, MeOH/1-PrOH/MeCN at 298.15 K.
35F. Martins et al. / Journal of Molecular Liquids 170 (2012) 30–36
A close inspection of Fig. 5 shows that the partial molar volume ofMeCN increases when the mole fraction of MeCN increases. In thecase of MeOH, there is a rise followed by a plateau and in the caseof 1-PrOH a slight increase followed by a slight decrease is observed.This behavior seems to confirm the accommodation of MeCN in pre-existing structural networks and an increase of specific interactions,especially in MeCN rich regions. The opposite effect is clearly visiblein ternary mixture mole fractions with a slight maximum in acetoni-trile rich regions.
Partialmolar volumemeasurements also allow the determination ofpartial molar volumes at infinite dilution. Infinite dilution propertiesreflect what happens when solute–solute interactions are negligibleand solute–solvent interactions become independent of the effect ofthe composition of the mixture [36].
As can be seen in Table 4, in the case of methanol, the molar volumeat infinite dilution obtained for the various mixtures with this compo-nent, presents a shift when compared to its molar volume when
Fig. 4. Variation of partial molar volume of propan-1-ol with composition in the ternarymixture MeOH/1-PrOH/MeCN, at 298.15 K.
pure, negative in the case of MeCN mixtures and positive for 1-PrOH.For 1-PrOH, the difference is always positive, being more pronouncedwhen it is determined in a mixture with acetonitrile. Acetonitrileshows molar volumes at infinite dilution below its pure molar volume,exhibiting in methanol the largest variation and in 1-PrOH an almostnull variation.
These observations can be related to what has been mentionedpreviously: MeOH has favorable interactions with MeCN and unfavor-able interactions with 1-PrOH; 1-PrOH has adverse interactions withmethanol and even more with acetonitrile; and finally MeCN hasfavorable interactions with methanol and almost negligible interac-tions with 1-PrOH.
As stated before, there is a relationship between excess refractiveindices and excess molar volumes but the nature of this dependencyis complex. In many mixtures the rule of thumb is that nDE is negativelycorrelatedwith VE. It is, however, worth pointing out that exceptions tothis rule have been reported in the literature as referred by Reis et al.[20] which mention several mixtures that do not comply with therule. These authors suggest that an increasing positive nDE in associationwith a decreasing negative VmE , when themole fraction is changed, indi-cates the presence of directional interactions such as hydrogen bonds,whereas when changes of both excess properties occur in the samedirection thatmay imply thatmolecular reorganization effects predom-inate in the given composition range [20].
In the case of the mixtures studied in this work the correlationbetween nD
E and VmE is depicted in Fig. 6.
The analysis of Fig. 6 shows that, in general, there is a negative cor-relation between the two properties, as mentioned above. For theMeOH/MeCN mixture this relationship results in a pear-shaped curve,in which three regions can be spotted (the arrow indicates the direction
Table 4Molar volumes at infinite dilution for each component obtained from partial molarvolumes at infinite dilution, V∞, and corresponding shifts from molar volumes forthe pure components (in parenthesis).
Mixtures V ∞1 (cm3 mol−1) V ∞
2 (cm3 mol−1)
MeOH/1-PrOH 40.97 (0.24) 75.38 (0.24)MeOH/MeCN 40.48 (−0.25) 51.51 (−1.35)1-PrOH/MeCN 75.63 (0.49) 52.79 (−0.07)
V0MeOH=40.73 cm3 mol−1; V0
MeCN=52.86 cm3 mol−1; V01-PrOH=75.14 cm3 mol−1
[30].

Fig. 6. Correlation between excess refractive indices, nDE , and excess molar volumes, VmE ,
at 298.15 K for the three binary and the ternary mixtures.
36 F. Martins et al. / Journal of Molecular Liquids 170 (2012) 30–36
in which x1 increases): i — in regions where 0bx1(MeOH)b0.595,increasing positive values of nDE are associated with decreasing negativevalues of VmE , and this behavior signals the prevalence of directionalhydrogen bonds such as OH---N`C and also some –OH---NOH–bonds; ii — when the concentration of MeOH varies between 0.595and 0.750, both nD
E and VmE decrease and molecular reorganization
prevails over hydrogen bonding; iii — finally, for MeOH rich regions,i.e., x1>0.750, nD
E decreases and VmE increases, pointing out again
towards an intensification of hydrogen bonding, in this case mainlydue to –OH---OH– interactions. In MeOH/1-PrOH and 1-PrOH/MeCNmixtures there is a random behavior with somehow a general tendencyfor a decrease in nD
E along with an increase in VmE . The ternary mixture
mole fractions display a mix of all these various effects and, in addition,a fourth nD
E–VmE combination, with some mole fractions revealing
decreasing negative values for both nDE and Vm
E , also a sign of molecularreorganization.
4. Conclusions
We have characterized the ternary mixture methanol/propan-1-ol/acetonitrile and the corresponding underlying binary mixtures interms of refractive indices, molar volumes and respective excess prop-erties. Themodeling of these propertieswas achieved by Redlich–Kisterfittings in the case of the binary mixtures and by Cibulka fittings in thecase of the ternary system.
We have applied for the first time to a ternary mixture a recentlyproposed [20] thermodynamic formalism to excess refractive indiceswhich makes a clear distinction between refractive index before andafter thermodynamically ideal mixing, both expressed in terms ofvolume fractions. This new approach allowed amore sound rational-ization of this property and, especially, a better understanding of itsrelation with excess molar volumes. In the binary mixtures and, ingeneral, in the ternary system, it was possible to observe plots (re-spectively, curves and surfaces) that revealed an inverted trend ofnDE by comparison with Vm
E , with a change in composition. However,a simultaneous analysis of both excess properties revealed a morecomplex relationship: the studied binary mixtures showed a behav-ior of nDE vs. Vm
E in the second and fourth quadrants (i.e., VmE b0/nDE>0
and VmE >0/nDE b0), whereas for some compositions of the ternary
mixture, the behavior of nDE vs. VmE appeared in the first, second and
third quadrants.
Acknowledgments
The authors are grateful to one of the reviewers for pertinent andhelpful comments and suggestions. Financial support from Fundaçãopara a Ciência e a Tecnologia (FCT), Portugal, is greatly appreciated.
Appendix A. Supplementary material
Supplementary data to this article can be found online at doi:10.1016/j.molliq.2012.03.015.
References
[1] Y. Marcus, Solvent Mixtures: Properties and Selective Solvation, Marcel Dekker,New York, 2002.
[2] M. Iglesias, B. Orge, J. Tojo, Journal of Chemical and Engineering Data 41 (1996)218–221.
[3] G.P. Cunningham, G.A. Vidulich, R.L. Kay, Journal of Chemical and EngineeringData 12 (1967) 336–337.
[4] I. Cibulka, V. Hynek, R. Holub, J. Pick, Collection of Czechoslovak Chemical Communi-cations 44 (1979) 295–306.
[5] I. Cibulka, V.D. Nguyen, R. Holub, The Journal of Chemical Thermodynamics 16(1984) 159–164.
[6] J.S. Sandhu, A.K. Sharma, R.K. Wadi, Journal of Chemical and Engineering Data 31(1986) 152–154.
[7] N. Saha, B. Das, D.K. Hazra, Journal of Chemical and Engineering Data 40 (1995)1264–1266.
[8] M.S. Bakshi, J. Singh, H. Kaur, S.T. Ahmad, G. Kaur, Journal of Chemical andEngineering Data 41 (1996) 1459–1461.
[9] P.S. Nikam, L.N. Shirsat, M. Hasan, Journal of Chemical and Engineering Data 43(1998) 732–737.
[10] S.B. Aznarez, M.A. Postigo, Journal of Solution Chemistry 27 (1998) 1045–1053.[11] K. Hickey, W.E. Waghorne, Journal of Chemical and Engineering Data 46 (2001)
851–857.[12] I.R. Grguric, A.Z. Tasic, B.D. Djordjevic, M.L. Kijevcanin, S.P. Serbanovic, Journal of
the Serbian Chemical Society 67 (2002) 581–586.[13] R.B. Torres, A.Z. Francesconi, P.L.O. Volpe, Journal of Molecular Liquids 110 (2004)
81–85.[14] R. Tahery, H. Modarress, J. Satherley, Journal of Chemical and Engineering Data 51
(2006) 1039–1042.[15] G. Narayanaswamy, G. Dharmaraju, G.K. Raman, The Journal of Chemical Thermody-
namics 13 (1981) 327–331.[16] S. Paez, M. Contreras, Journal of Chemical and Engineering Data 34 (1989) 455–459.[17] A. Ali, A.K. Nain, V.K. Sharma, S. Ahmad, Physics and Chemistry of Liquids 42
(2004) 375–383.[18] R.E. Leitao, F. Martins, M.C. Ventura, N. Nunes, Journal of Physical Organic Chemistry
15 (2002) 623–630.[19] R.E. Leitao, N. Nunes, C. Ventura, F. Martins, The Journal of Physical Chemistry. B
113 (2009) 3071–3079.[20] J.C.R. Reis, I.M.S. Lampreia, A.F.S. Santos, M.L.C.J. Moita, G. Douheret, ChemPhysChem
11 (2010) 3722–3733.[21] G.S. Kell, Journal of Chemical and Engineering Data 12 (1967) 66–69.[22] Handbookof Chemistry andPhysics, 68th ed., CRC Press, BocaRaton, FL, 1987, p. F-10.[23] P. Brocos, A. Pineiro, R. Bravo, A. Amigo, Physical Chemistry Chemical Physics 5
(2003) 550–557.[24] P. Baraldi, M.G. Giorgini, D. Manzini, A. Marchetti, L. Tassi, Journal of Solution
Chemistry 31 (2002) 873–893.[25] R.B. Torres, A.Z. Francesconi, P.L.O. Volpe, Journal of Solution Chemistry 32 (2003)
417–434.[26] M. Dominguez, L. Gascon, A. Valen, F.M. Royo, J.S. Urieta, The Journal of Chemical
Thermodynamics 32 (2000) 1551–1568.[27] M. Tjahjono, L.F. Guo, M. Garland, Chemical Engineering Science 60 (2005)
3239–3249.[28] O. Redlich, A.T. Kister, Industrial and Engineering Chemistry 40 (1948) 345–348.[29] I. Cibulka, Collection of Czechoslovak Chemical Communications 47 (1982)
1414–1419.[30] Y. Marcus, The Properties of Solvents, Wiley, Chichester, New York, 1998.[31] S. Aznarez, M. Katz, E.L. Arancibia, Journal of Solution Chemistry 31 (2002)
639–651.[32] M.M.H. Bhuiyan, M.H. Uddin, Journal of Molecular Liquids 138 (2008) 139–146.[33] R.B. Torres, A.Z. Francesconi, P.L.O. Volpe, Journal of Molecular Liquids 131 (2007)
139–144.[34] H. Iloukhani, J.B. Parsa, M. Soltanieh, Journal of Solution Chemistry 30 (2001)
807–814.[35] S. Aznarez, M.A. Postigo, G.C. Pedrosa, I.L. Acevedo, M. Katz, Journal of Solution
Chemistry 27 (1998) 949–964.[36] L. Lepori, E. Matteoli, Fluid Phase Equilibria 145 (1998) 69–87.