Embed Size (px)
Citation preview

United States Department of Agriculture / Forest Service
Rocky Mountain Research Station
Research Paper RMRS-RP-78
October 2010
Response of Six Non-Native Invasive Plant Species
to Wildfires in the Northern Rocky Mountains, USA
Dennis E. Ferguson and Christine L. Craig
2001 2003
2005 2007

You may order additional copies of this publication by sending your mailing information in label form through one of the following media. Please specify the publication title and series number.
Publishing Services
Telephone (970) 498-1392 FAX (970) 498-1122 E-mail [email protected] Web site http://www.fs.fed.us/rm/publications Mailing address Publications Distribution Rocky Mountain Research Station 240 West Prospect Road Fort Collins, CO 80526
Ferguson, Dennis E.; Craig, Christine L. 2010. Response of six non-native plant species to wildfires in the northern Rocky Mountains, USA. Res. Pap. RMRS-RP-78 Fort Collins, CO: U.S. Department of Agriculture, Forest Service, Rocky Mountain Research Station. 12 p.
AbstrActThis paper presents early results on the response of six non-native invasive plant species to eight wildfires on six National Forests (NFs) in the northern Rocky Mountains, USA. Stratified random sampling was used to choose 224 stands based on burn severity, habitat type series, slope steepness, stand height, and stand density. Data for this report are from 219 stands (875 plots) that have repeated measures 1 to 7 years post-fire. Six invasive plant species are abundant enough to analyze for early indications of response to burning. Spotted knapweed occurrence is highest on Douglas-fir and ponderosa pine habitat types on the Bitterroot NF. Canada thistle occurs on most of the sampled wildfires but at low occurrences and percent plot coverage. Bull thistle has rapid increases on the Bitterroot, Flathead, Kootenai, and Malheur NFs, generally with increasing occurrence at higher burn severities, but average percent coverage is low. Orange hawkweed has low occurrences (<5 percent) and never more than 1 percent coverage on a plot. Meadow hawkweed has its highest occurrence on the Bitterroot NF in low burn severities on Douglas-fir and ponderosa pine habitat types. Prickly lettuce is found on most NFs, the highest occurrences being on the Malheur and Panhandle NFs, with increasing occurrence at higher burn severities; however, average percent cover of prickly lettuce is low. Populations of the six species (especially spotted knapweed, bull thistle, and prickly lettuce) need continued monitoring to determine if occurrence and cover continue to change.
Keywords: Centaurea stoebe L. (= C. biebersteinii = C. maculosa), Cirsium arvense, Cirsium vulgare, Hieracium aurantiacum, Hieracium caespitosum, Lactuca serriola
AuthorsDennis E. Ferguson is a Research Silviculturist and, at the time of this study, Christine L. Craig was a Biological Science Technician, both with the USDA Forest Service, Rocky Mountain Research Station in Moscow, Idaho.
AcknowledgmentsWe are grateful to Kate Schneider and John Byrne for assistance in collecting data and preparing datasets and to field crews who diligently collected the data. We also thank Carolyn Sieg, Linda Pietarinen, and John Byrne for reviewing earlier drafts of this manuscript.
Cover photos: Plot 060, Bitterroot National Forest, 2001, 2003, 2005, and 2007.

USDA Forest Service RMRS-RP-78. 2010. 1
Introduction
Forest ecosystems in the Interior West are adapted to wildfire as a periodic disturbance agent (Arno 1980, Roe and others 1971, Wellner 1970). Indeed, many for-est plant species are fire dependent (see Fischer and Bradley 1987, Smith and Fischer 1997). Recent wild-fires in dry Interior West forests have increasingly been crown fires that kill much of the overstory, while histor-ic low-severity ground fires have become less common (Covington and Moore 1994, Steele and others 1986). Fire exclusion and suppression, which have resulted in increased fuel load and fuel connectivity (Auclair and Bedford 1994, Hessburg and others 2000), may explain the increase in wildfire severity.
Establishment and growth of non-native invasive plant species are a major concern for western U.S. forest managers because invasive species alter these forests, resulting in ecological and economic losses (Evans 2003, Perrings and others 2002). Disturbances caused by wildfires create the potential for establish-ment and growth of non-native species, especially when coupled with the pre-fire presence of these spe-cies along roadsides and trails; in meadows; and in highly disturbed sites such as campsites, logging land-ings, and landslides. Disturbances create microsites for non-native species establishment and reduce competi-tion from native plants. Therefore, it is important to understand secondary succession by non-native inva-sive plant species following wildfires.
This study was conducted in Montana, Idaho, and Oregon on wildfires that occurred from 2000 to
2003. The study area encompasses forest types from Douglas-fir/ponderosa pine (Pseudotsuga menzie-sii/Pinus ponderosa) to grand fir/western redcedar/western hemlock (Abies grandis/Thuja plicata/Tsuga heterophylla) to subalpine fir/lodgepole pine forests (Abies lasiocarpa/Pinus contorta).
We obtained a list of 32 non-native invasive plant spe-cies in Montana and Idaho (table 1) from the PLANTS database (USDA NRCS 2001). Five to 7 years after the wildfires, six species were abundant enough to warrant analyses and are the subject of this report. These spe-cies are spotted knapweed (Centaurea stoebe L. [= C. biebersteinii DC, = C. maculosa Lam.]), Canada this-tle (Cirsium arvense (L.) Scop.), bull thistle (Cirsium vulgare (Savi) Ten.), orange hawkweed (Hieracium aurantiacum L.), meadow hawkweed (Hieracium caespitosum Dumort. = H. pratense Tausch), and prickly lettuce (Lactuca serriola L.).
Ecology of Invasive Species
Spotted Knapweed
Spotted knapweed is a short-lived perennial com-posite that is native to central Europe and Asia Minor (Sheley and others 1998). It primarily invades semi-arid pastures and rangelands (Jacobs and Sheley 1998) and low-elevation forests (Forcella and Harvey 1983, Roche and Roche 1988), but is not a serious threat in subalpine fir forests following wildfires (Ferguson and others 2007). Knapweed does not compete well
Table 1—Selected non-native invasive plant species in Montana and Idaho (extracted from PLANTS Database, http://plants.usda.gov).
Scientific name Common name Scientific name Common name
Acroptilon repens Russian knapweed Hieracium caespitosum Meadow hawkweedCardaria draba Whitetop Hyoscyamus niger Black henbaneCarduus nutans Nodding plumeless thistle Hypericum perforatum Common St. JohnswortCentaurea stoebe Spotted knapweed Isatis tinctoria Dyer’s woadCentaurea diffusa White knapweed Lepidium latifolium Broadleaved pepperweedCentaurea solstitialis Yellow star-thistle Linaria dalmatica DalmationtoadflaxChondrilla juncea Rush skeletonweed Linaria vulgaris YellowtoadflaxCirsium arvense Canada thistle Lythrum salicaria Purple loosestrifeCirsium vulgare Bull thistle Onopordum acanthium Scotch thistleConium maculatum Poison hemlock Potentilla recta Sulfur cinquefoilConvolvulus arvensis Field bindweed Ranunculus acris Tall buttercupCrupina vulgaris Common crupina Senecio jacobaea Tansy ragwortCytisus scoparius Scotchbroom Sonchus arvensis Field sowthistleEuphorbia dentata Toothed spurge Tamarix sp. SaltcedarEuphorbia esula Leafy spurge Tribulus terrestris PuncturevineHieracium auranthiacum Orange hawkweed Zygophyllum fabago Syrian beancaper
2 USDA Forest Service RMRS-RP-78. 2010.
in moist areas such as near wet microsites or irrigated fields (Harris and Cranston 1979, Powell and others 1997).
Disturbances are associated with establishment of knapweed populations (Ferguson and others 2007, Forcella and Harvey 1983, Watson and Renney 1974). Expansion of spotted knapweed colonies occurs through germination of seed along the periphery of stands, which may be aided by allelopathic compounds (Bais and others 2003). Burning can reduce population growth (Emery and Gross 2005), but it does not con-trol knapweed (Sheley and others 1998). Burning can also facilitate colonization by decreasing competition and providing microsites for seedling establishment (Emery and Gross 2005, Ferguson and others 2007, Sheley and others 1998). Measures to reduce knapweed populations include hand weeding, plowing, selective animal grazing, herbicides, biological control, and re-vegetation (Sheley and others 1998).
Canada Thistle
Canada thistle is a native species of southeastern Europe and the eastern Mediterranean that is consid-ered naturalized worldwide (Bayer 2000, Mitich 1988, Morishita 1999, Parish and others 1996, Whitson and others 1996). It is an early successional, slender tap-rooted, perennial composite (Parish and others 1996, Whitson and others 1996). In the northern Rocky Mountains at all elevations and habitat types, it invades disturbed areas—roadsides, fence lines, clear-ings, meadows, ditches, and stream banks (Meier and Weaver 1997, Morishita 1999, Parish and others 1996, Weaver and others 1990). Canada thistle does not com-pete well in full shade or dry, poor soils (Bayer 2000, Morishita 1999).
Growth of Canada thistle populations occurs by vegetative creeping roots and seed production, pos-sibly aided by allelopathic compounds (Bayer 2000, Friedli and Bacher 2001, Morishita 1999, Stachon and Zimdahl 1980, Thomas and others 1994). Two charac-teristics that promote population growth are the ability to sprout from root fragments and seeds that can persist in the soil up to 22 years (Bayer 2000, Mitich 1988, Morishita 1999). Results of burning Canada thistle are mixed—burning initially decreases population size but enhances population establishment and growth. The roots are capable of surviving severe fires, thus allow-ing for sprouting from roots and seed establishment on bare soil, though it can be delayed up to 2 years (Travnicek and others 2005). Common methods of pop-ulation control are hand weeding, mowing, selective
animal grazing, chemical application, and biological control agents. Canada thistle is able to resist any one method of treatment, including many types of biologi-cal controls (Bayer 2000, Morishita 1999, Thomas and others 1994, Travnicek and others 2005).
Bull Thistle
Bull thistle is a native composite of Europe, west-ern Asia, and northern Africa (Klinkhamer and de Jong 1993, Mitich 1998, Parish and others 1996, Randall 2000, Whitson and others 1996) and is becoming naturalized (Mitich 1998, Randall 2000). It is an early successional, tap-rooted biennial that prefers moist soils (Beck 1999, Mitich 1998, Parish and others 1996, Randall 2000, Whitson and others 1996). The common areas of invasion are mid to low elevations; recent or repeatedly disturbed forests, roadsides, ditches, and fences; or undisturbed grasslands, meadows, and forest openings (Beck 1999, Mitich 1998, Parish and others 1996, Randall 2000). The disturbance can be as small as gopher mounds (Randall 2000). Bull thistle does not compete well in densely shaded or waterlogged soil (Klinkhamer and de Jong 1993).
Bull thistle can only expand its population through seed germination (Beck 1999, Klinkhamer and de Jong 1993, Randall 2000). A highly debated issue is the lon-gevity of seeds in soils, which can possibly be up to 5 years but, depending on conditions, may be far less (Beck 1999, Downs and Cavers 2000, Mitich 1998). Burning has mixed results but generally promotes establishment (Arno 1999). Common methods of pop-ulation control are hand pulling, tilling, mowing, and using chemical and biological controls (Beck 1999, Randall 2000). Bull thistle requires multiple control applications, and the biological controls are problem-atic because of their potential to attack native thistles (Louda and others 1997, Randall 2000).
Orange and Meadow Hawkweed
There are two non-native invasive hawkweeds—orange and meadow hawkweed—that are nearly identical species, differing only by the extent of their origin and floret color (Mangold and Kittle 2009, Wilson and Callihan 1999). Orange hawkweed is na-tive to restricted areas in northern and central Europe, whereas meadow hawkweed is native to northern, cen-tral, and eastern Europe (Gleason and Cronquist 1991, Mangold and Kittle 2009, Parish and others 1996, Wilson and Callihan 1999). Orange hawkweed has or-ange florets, and meadow hawkweed has yellow florets
USDA Forest Service RMRS-RP-78. 2010. 3
(Gleason and Cronquist 1991, Mangold and Kittle 2009, Parish and others 1996, Whitson and others 1996). Hawkweeds are mat-forming, fibrous-rooted, stolon-producing perennial composites that prefer well-drained soils (Wilson and Callihan 1999, Wilson and others 1997). They invade low to mid elevations in mountain meadows, forest clearings, logged areas, roadsides, and other disturbed areas (Gleason and Cronquist 1991, Parish and others 1996, Wilson and Callihan 1999, Wilson and others 1997).
Hawkweed populations expand through vegeta-tive growth from rhizomes, stolons, adventitious root buds, and seed germination (Mangold and Kittle 2009, Wilson and Callihan 1999), which may be aided by allelopathic compounds (Wilson and Callihan 1999). Plants can sprout from root fragments, and the seeds are viable in soil up to 7 years (Mangold and Kittle 2009, Wilson and Callihan 1999). The most effective methods of control are hand pulling, digging, and ap-plying chemicals. Multiple applications of chemical control are the most effective treatment, as well as digging small infestations to completely remove roots (Mangold and Kittle 2009, Wilson and Callihan 1999, Wilson and others 1997).
Prickly Lettuce
Prickly lettuce is a native of Europe, western Asia, and northern Africa (Parish and others 1996, Prince and others 1978, Weaver and Downs 2003). It is a tap-rooted biennial composite (Parish and others 1996, Weaver and Downs 2003) that is naturalized through-out the United States (Gleason and Cronquist 1991). Prickly lettuce invades low- to mid-elevation disturbed sites such as waste areas, roadsides, and open sites (Gleason and Cronquist 1991, Parish and others 1996, Prince and others 1978, Weaver and Downs 2003).
Expansion of prickly lettuce populations occurs through seed germination (Meier and Weaver 1997, Weaver and Downs 2003). A short-term seed bank of 1 to 3 years can develop (Weaver and Downs 2003). The primary methods of control are chemical and bio-logical. However, there have been mixed results with chemical application due to natural genetic resistance to some chemicals (Weaver and Downs 2003).
Study Design
The data reported are part of an overall study to quantify secondary plant succession following
wildfires in the northern Rocky Mountains. A stratified random sample was used to select stands within burn perimeters. Stratification insured a range of conditions was sampled, using combinations of:
• Three pre-fire cover types (Douglas-fir/ponderosa pine; grand fir/western redcedar/western hemlock; and subalpine fir/lodgepole pine);
• Two burning index classes (<75 and ≥75), an index of predicted fire spread and energy release (Bradshaw and others 1984);
• Two slope steepness classes (≤35 percent and >35 percent);
• Two pre-fire canopy heights (≤40 ft tall and >40 ft tall); and
• Two pre-fire stand densities (≤35 percent and >35 percent conifer canopy cover).
Within each of the combinations, three low-densi-ty stands were randomly selected for sampling. The location of the stand center and the first plot was de-termined using aerial photographs. Transect lines were drawn, and the intersection at the approximate stand center was assigned a GPS point. At this GPS point, field crews installed a four-point cluster of plots. A second four-point cluster was installed in an adjacent higher-density stand within the burn perimeter. This second stand was chosen to represent a change in pre-fire density, cover type, or forest structure. There were only a few instances when an acceptable adjacent stand was unavailable.
The four-point cluster plot design was similar to the sample design used by Forest Inventory and Analysis (Bechtold and Scott 2005). The center of plot 1 was the basis for the location of three satellite plots, which were 120 ft at azimuths of 0°, 120°, and 240°. Each of the four points had three associated plots. First was a 1/300-acre plot to record slope, aspect, and burn se-verity to the forest floor, low shrubs, and tall shrubs. Second was a 1/24-acre plot to record habitat type (Cooper and others 1991, Johnson and Clausnitzer 1992, Pfister and others 1977) and burn severity to overstory trees. The third plot was a variable radius plot for sampling overstory trees.
Elevation, the only variable recorded strictly at the stand level, was recorded at plot 1. All other variables were recorded at the plot level to make plots as inde-pendent as possible. Burn severity classes were used to characterize the effects of fire on vegetation and soil. Classes were recorded for each of four strata (forest floor, short shrubs, tall shrubs, and overstory trees) us-ing the following categories: 0 = unburned, 1 = light (blackened duff, scorched foliage, and overstory trees

4 USDA Forest Service RMRS-RP-78. 2010.
predominately green and/or brown needles), 2 = mod-erate (duff consumed, shrubs mostly consumed but stubs remaining, and overstory trees predominately brown and/or burned needles), and 3 = severe (mineral soil colored orange; shrubs consumed, leaving holes in the soil; and overstory trees predominately black). Each burn severity class was recorded by percent of the plot that it occupied; for example, 70 percent severe burn and 30 percent moderate burn to the forest floor.
Identification of habitat types can be difficult fol-lowing wildfires, but it is not impossible. Species of fire-killed trees could usually be identified, and all vegetation was not consumed by the fire or it often sprouted from the roots. Field crews examined adja-cent unburned stands to determine common habitat types in the area. Also at each re-measurement, crews reassessed habitat types and provided evidence for changes.
Vegetation abundance was estimated using Daubenmire’s (1959) ocular estimate of canopy cov-erage method, but two differences are that we used 1/300-acre circular plots instead of rectangular plots, and we recorded vegetation by percentages rather than by broad cover classes. A value of 1 percent was used to note occurrence only (trace); otherwise, percent cov-er classes were 5 through 100 by 5 percent increments. As lifeforms, percent cover was recorded for shrubs, forbs, grasses, and ferns. For non-native invasive species, percent cover was recorded and, as of 2004, heights (nearest 0.5 ft) were also recorded. Occurrence is defined as any aerial part of a species being within the vertical cylinder of the 1/300-acre circular plot.
Vegetation sampling was done in late June through September, beginning at low elevations where the growing season starts earlier and progressing upward in elevation. Vegetation dried early in 2001 on the Bitterroot National Forest (NF), so we did not record vegetation for 25 stands. For these 25 stands, burn se-verity was recorded and overstory trees were measured in 2001, and vegetation was recorded in 2002.
Overstory trees were sampled to quantify pre-fire overstory density and post-fire overstory competition. Basal area factors of 10, 20, or 40 ft2/acre were used to sample five to seven trees or snags per plot, if present. The same basal area factor was used on all plots within a stand.
Data AnalysisOur analyses used techniques applicable to two-state
modeling systems (Hamilton and Brickell 1983). The
first step was to analyze the occurrence of species—a species either occurs on a plot or it does not. All plots were used to calculate percent occurrence. The second step looked at attributes on plots where the species occurs—in this case, the attribute was percent cover. Analyzing data in this sequence could detect if spe-cies were expanding by becoming established on more plots (occurrence) or expanding horizontally (cover). Conversely, species could decrease in occurrence or cover over time.
Although there were 224 stands in the study, only 219 were used in this report because several stands were not re-measured at years 5 and 6 due to shortfalls in funding. Therefore, only stands that had a complete series of measurements were used in analyses. Also, we inadvertently missed measuring one plot in 2003 on the Bitterroot NF, so all data for this plot were withheld from the analyses.
Burn severity indices were calculated for each plot. The burn severity codes (0, 1, 2, and 3) were weighted by the proportion of the plot they occupied to calculate a burn severity index. For presentation of results, the burn severity index was then classified into three cate-gories: low (0.0 to 1.0), moderate (1.0 to 2.0), and high (2.0 to 3.0). Preliminary analyses showed the forest floor burn severity was the best predictor of occurrence and cover compared to burn severity for low shrubs, tall shrubs, or overstory trees.
Results
Table 2 summarizes information about the 219 stands used in this report. Table 3 summarizes data by important plot attributes, which shows how strati-fied random sampling incorporates variation into the data. A total of 290 plots were sampled on Douglas-fir/ponderosa pine habitat types, 145 on grand fir/west-ern redcedar/western hemlock habitat types, and 440 on subalpine fir/lodgepole pine habitat types. When plots were summarized by forest floor burn severity, 210 were in the low burn severity class, 369 were in the moderate class, and 296 were in the high burn severity class.
Occurrence
For the six species in this report, bull thistle had the highest overall occurrence at 23.0 percent, followed by prickly lettuce at 19.8 percent, spotted knapweed at 15.1 percent, Canada thistle at 8.8 percent, meadow
USDA Forest Service RMRS-RP-78. 2010. 5
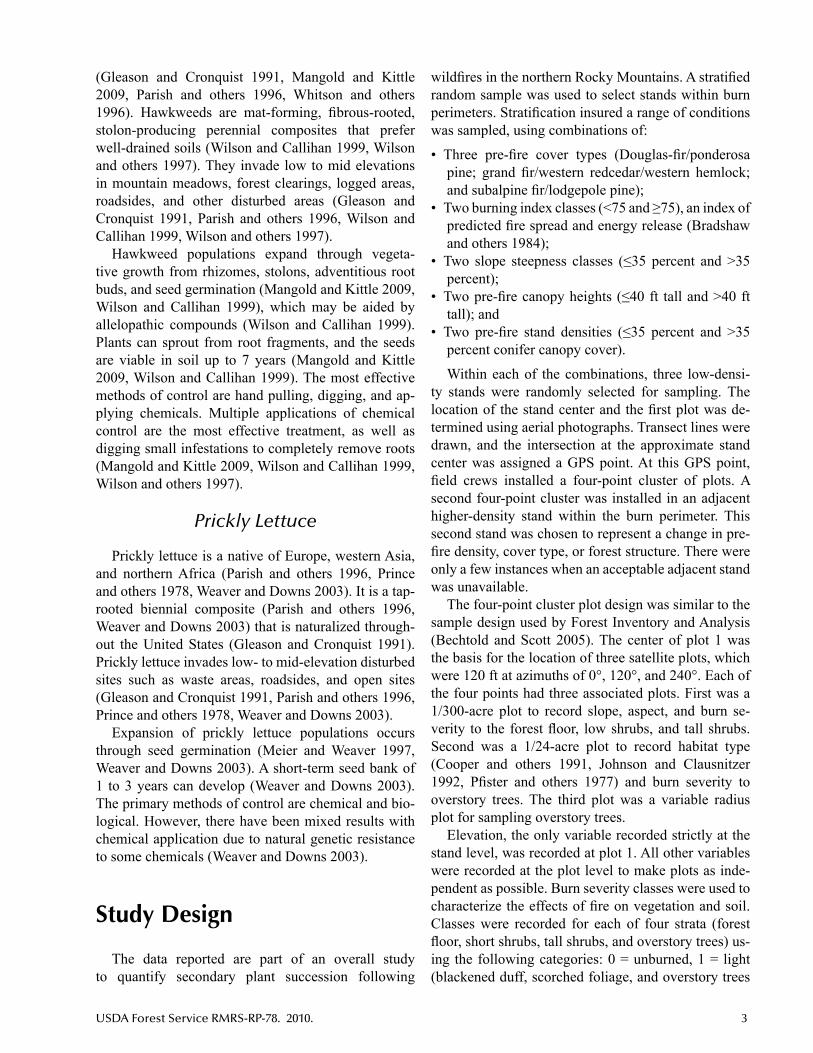
hawkweed at 2.2 percent, and orange hawkweed at 0.5 percent. Figure 1 shows species occurrence by wildfire.
Spotted knapweed was most abundant on the Bitterroot NF, where it occurred on 19.4 percent of plots at 1 or 2 years, 26.1 percent at 3 years, 37.1 per-cent at 5 years, and 41.3 percent at 7 years (table 4). When these data are summarized by time and forest floor burn severity (table 5), there is a clear trend of de-creasing occurrence with increasing burn severity at 1 or 2 years, coupled with higher increases in occurrence over time on higher burn severities.
Canada thistle had low occurrences on most wildfires (table 4). The highest occurrences were 13.5 percent on the Flathead-Roberts NF at 3 years and 25.0 percent on the Malheur NF at 5 years; otherwise, occurrences were below 3.9 percent. There were no clear trends of
occurrence versus burn severity on the Bitterroot NF (table 5).
Occurrence of bull thistle was virtually non-exis-tent at 1 year but had rapid increases by year 3 or 5 (table 4). The most rapid increase was on the Malheur NF where bull thistle occurred on 41.1 percent of plots at 3 years. High occurrences did not appear until 5 years on the Bitterroot NF (15.2 percent), Flathead-Moose (19.5 percent), and Kootenai NF (17.5 percent) at 6 years. There were also higher occurrences of bull thistle with increasing burn severity for most habitat type series (table 5). For example, the highest occur-rence of bull thistle was on Douglas-fir habitat types on the Malheur NF, where it increased from 6.9 percent in the low burn severity class to 41.1 percent in the moderate class to 74.3 percent in the high burn sever-ity class.
Hawkweeds were found on the Bitterroot and Flathead NF wildfires, and occurrence was less than about 5 percent at 5 years (table 4). There was no clear trend for meadow hawkweed occurrence as a function of burn severity (table 5). By year 7, hawkweeds were no longer found on the Bitterroot NF plots.
Occurrence of prickly lettuce was quite low except on the Malheur and Panhandle NFs. Occurrence was highest (71.7 percent) on the Malheur NF at 3 years (table 4). It was also high (35.0 percent) on the Panhandle NF at 3 years, but this average represents only 40 plots. Occurrence increased rapidly with
Table 2—Attributesofsamplestandsbywildfire.
Wildfire Number Habitat type Wildfire name National Year of size of stands seriesa and Years and acronym Forest wildfire (acres) sampled (number of plots) sampled
Bitterroot Complex, Bitterroot 2000 356,075 71 DF/PP (154), 1 or 2, 3, 5, 7 BITT AF/LP (129)
Kootenai Complex, Kootenai 2000 34,600 30 DF/PP (12), 2, 4, 6 KOOT GF/RC/WH (15), AF/LP (93)
Ninemile Complex, Lolo 2000 38,700 18 GF/RC/WH (9), 2, 4, 6 LOLO AF/LP (63)
Moose, FLMO Flathead 2001 70,975 32 AF/LP (128) 1, 3, 5
Robert and Flathead 2003 24,125 13 RC/WH (28), 1, 3, 6 Crazy Horse, FLRO AF/LP (24)
Flagtail, MAHL Malheur 2002 7,250 45 DF/PP (120), GF 1, 3, 5 (57), AF/LP (3)
Myrtle Creek, Panhandle 2003 3,450 10 DF/PP (4), RC (36) 1, 3, 6 PANH
aDF=Douglas-fir,PP=ponderosapine,GF=grandfir,RC=westernredcedar,WH=westernhemlock,AF=subalpinefir,and LP = lodgepole pine community type.
Table 3—Number of 1/300-acre plots sampled by forest floorburnseverityandhabitattypeseries(codesfromtable 2).
Forest floor burn severity Habitattype series Low Medium High Total
DF/PP 88 121 81 290GF/RC/WH 30 97 18 145AF/LP 92 151 197 440
Total 210 369 296 875

6 USDA Forest Service RMRS-RP-78. 2010.
increased burn severity (table 5). For example, occur-rence of prickly lettuce at 3 years on Douglas-fir habitat types on the Malheur NF increased from 62.1 percent in the low burn severity class to 89.3 percent in the moderate burn severity class to 97.1 percent in the high burn severity class. Also, the occurrence of prickly let-tuce decreased after 5 years on the Bitterroot NF and after 3 years on the Malheur and Panhandle NFs.
Cover
Percent cover is an ocular estimate of the vertical projection of each species’ foliage on the horizontal plane of the plot, expressed as a percentage of the plot area. Data are shown only for the plots on which the species occurs.
Table 6 shows the number of plots where species oc-cur by percent cover. This display of cover data shows where high coverage may be a concern. With one ex-ception, coverage was fairly low for invasive species. The exception was for spotted knapweed on Douglas-fir and ponderosa pine habitat types on the Bitterroot NF. There were more plots with higher percent cover compared to the other species and locations. For ex-ample, after 7 years, there were 42 plots with a trace of spotted knapweed cover, 14 with 5 percent cover, 12 with 10 percent cover, 5 with 15 percent cover, 8 with 20 percent cover, and continuing to 2 plots with ≥50 percent cover (table 6).
In contrast, cover for the other species seldom ex-ceeded 20 percent (table 6). Bull thistle on the Bitterroot NF showed a decline in cover over time, as did prickly lettuce on the Malheur and Panhandle NFs.
Figure 1—Percent occurrence of six non-native invasive plant species by wildfire. Occurrence for this figure is defined as the species being present on the plot at any of the measurements. Species abbreviations are CEST8 = spotted knapweed, CIAR4 = Canada thistle, CIVU = bull thistle, HIAU = orange hawkweed, HICA10 = meadow hawkweed, and LASE = prickly lettuce. Wildfire acronyms are from table 2.
Wildfire

USDA Forest Service RMRS-RP-78. 2010. 7
Table 4—Percentoccurrenceofinvasiveplantspecieson1/300-acreplotsbywildfireandmeasurement.
National Forest, Years since fire number of plots, andwildfire acronym Species 1 or 2 3 5 7
Bitterroot, n = 283 Spotted knapweed 19.4 26.1 37.1 41.3BITT Canada thistle 1.8 1.1 3.9 3.2 Bull thistle 0.0 0.7 15.2 12.0 Orange hawkweed 0.0 0.0 0.0 0.0 Meadow hawkweed 0.4 0.0 5.7 0.0 Prickly lettuce 0.0 0.0 5.3 3.9
1 3 6Flathead-Roberts, n = 52 Spotted knapweed 0.0 1.9 3.8FLRO Canada thistle 0.0 13.5 3.8 Bull thistle 0.0 1.9 5.8 Orange hawkweed 0.0 0.0 1.9 Meadow hawkweed 0.0 0.0 0.0 Prickly lettuce 3.8 5.8 0.0
1 3 5Flathead-Moose, n = 128 Spotted knapweed 0.0 0.0 0.8FLMO Canada thistle 1.6 3.9 2.3 Bull thistle 0.0 0.0 19.5 Orange hawkweed 0.0 0.0 2.3 Meadow hawkweed 0.0 0.0 0.0 Prickly lettuce 0.0 2.3 0.8
2 4 6Kootenai, n = 120 Spotted knapweed 0.0 0.0 0.0KOOT Canada thistle 0.0 0.8 0.8 Bull thistle 0.0 0.0 17.5 Orange hawkweed 0.0 0.0 0.0 Meadow hawkweed 0.0 0.0 0.0 Prickly lettuce 0.0 0.0 0.0
2 4 6Lolo, n = 72 Spotted knapweed 0.0 0.0 1.4LOLO Canada thistle 1.4 1.4 1.4 Bull thistle 0.0 0.0 4.2 Orange hawkweed 0.0 0.0 0.0 Meadow hawkweed 0.0 0.0 0.0 Prickly lettuce 0.0 0.0 0.0
1 3 5Malheur, n = 180 Spotted knapweed 0.0 0.0 0.0MAHL Canada thistle 0.0 0.0 25.0 Bull thistle 0.6 41.1 41.7 Orange hawkweed 0.0 0.0 0.0 Meadow hawkweed 0.0 0.0 1.1 Prickly lettuce 5.0 71.7 42.8
1 3 6Panhandle, n = 40 Spotted knapweed 0.0 0.0 0.0PANH Canada thistle 0.0 0.0 0.0 Bull thistle 0.0 2.5 2.5 Orange hawkweed 0.0 0.0 0.0 Meadow hawkweed 0.0 0.0 0.0 Prickly lettuce 15.0 35.0 10.0

8 USDA Forest Service RMRS-RP-78. 2010.
Table 5—Percentoccurrenceofinvasiveplantspecieson1/300-acreplotsbywildfire,measurement,andforestfloorburnseverity.
National Forest Forest and Habitat floor Years since fire wildfire type burn # of Species acronym series severity 1-2 3-4 5-6 7 plots
Spotted knapweed Bitterroot DF/PP Low 51.9 46.3 59.3 63.0 54 BITT Medium 32.8 51.7 62.1 60.3 58 High 9.5 23.8 54.8 73.8 42 AF/LP Low 5.4 5.6 10.8 10.8 37 Medium 0.0 11.9 16.7 14.3 42 High 3.9 3.9 5.9 13.7 51
Canada thistle Bitterroot DF/PP Low 3.7 1.9 1.9 3.7 54 BITT Medium 1.7 0.0 5.4 3.4 58 High 0.0 0.0 0.0 0.0 42 AF/LP Low 0.0 0.0 5.4 5.4 37 Medium 4.8 4.8 9.5 4.8 42 High 0.0 0.0 2.0 2.0 51
Bull thistle Bitterroot DF/PP Low 0.0 0.0 5.6 1.9 54 BITT Medium 0.0 1.7 19.0 10.3 58 High 0.0 0.0 33.3 28.6 42 AF/LP Low 0.0 0.0 5.4 0.0 37 Medium 0.0 0.0 9.5 21.4 42 High 0.0 2.0 17.6 11.8 51
Bull thistle Flathead-Moose AF/LP Low 0.0 0.0 20.0 10 FLMO Medium 0.0 0.0 16.7 42 High 0.0 0.0 21.1 76
Bull thistle Kootenai AF/LP Low 0.0 0.0 21.7 23 KOOT Medium 0.0 0.0 21.4 28 High 0.0 0.0 14.3 42
Bull thistle Malheur DF/PP Low 0.0 3.4 6.9 29 MAHL Medium 1.8 42.9 41.1 56 High 0.0 57.1 74.3 35 GF Low 0.0 23.5 11.8 17 Medium 0.0 51.6 51.6 31 High a a a 9
Meadow hawkweed Bitterroot DF/PP Low 0.0 0.0 13.0 0.0 54 BITT Medium 0.0 0.0 10.3 0.0 58 High 0.0 0.0 4.8 0.0 42 AF/LP Low 2.7 0.0 0.0 0.0 37 Medium 0.0 0.0 2.4 0.0 42 High 0.0 0.0 0.0 0.0 51
Prickly lettuce Bitterroot DF/PP Low 0.0 0.0 0.0 3.7 54 BITT Medium 0.0 0.0 3.4 0.0 58 High 0.0 0.0 28.6 21.4 42 AF/LP Low 0.0 0.0 0.0 0.0 37 Medium 0.0 0.0 0.0 0.0 42 High 0.0 0.0 2.0 0.0 51
Prickly lettuce Malheur DF/PP Low 3.4 62.1 34.5 29 MAHL Medium 5.4 89.3 51.8 56 High 8.6 97.1 68.6 35 GF Low 0.0 23.5 0.0 17 Medium 6.5 41.9 29.0 31 High a a a 9
Prickly lettuce Panhandle RC Low a a a 2 PANH Medium 12.5 25.0 3.1 32 High a a a 2a <10 plots, no average calculated.

USDA Forest Service RMRS-RP-78. 2010. 9
Tab
le 6
—N
umbe
r of
plo
ts o
n w
hich
the
spec
ies
occu
rred
by
perc
ent c
over
.
N
atio
nal
F
ore
st
Per
cen
t co
ver
an
d
Hab
itat
%
wild
fire
ty
pe
occ
ur-
Sp
ecie
s ac
ron
ym
seri
es
Yea
r 1
5 10
15
20
25
30
35
40
45
≥5
0 re
nce
Spo
tted
knap
wee
d,
Bitt
erro
ot
DF
/PP
1-
2 22
7
10
3
1 2
2 2
2
33.1
n =
154
B
ITT
3 32
14
2
5 1
3 1
2 3
1 1
42.2
5 49
9
9 6
7 2
3 1
1 1
3 59
.1
7 42
14
12
5
8 4
6 3
3 1
2 64
.9
Spo
tted
knap
wee
d,
Bitt
erro
ot
AF
/LP
1-
2 2
1
1
3.1
n =
129
B
ITT
3 7
2
7.0
5
10
2 2
10.9
7
13
2
1
1
13.2
Can
ada
this
tle,
Bitt
erro
ot
DF
/PP,
1-
2 4
1
1.8
n =
283
B
ITT
A
F/L
P
3 2
1
1.1
5
8
1
1
1 3.
9
7 6
1
1
1
3.2
Bul
l thi
stle
, B
itter
root
D
F/P
P,
1-2
0.
0n
= 2
83
BIT
T
AF
/LP
3
2
0.
7
5 42
1
15
.2
7 31
3
12
.0
Bul
l thi
stle
,
Mal
heur
D
F/P
P,
1
1
0.6
n =
180
M
AH
L G
F,
3 68
5
1
41
.1
A
F/L
P
5 58
12
2
2
1
41.7
Mea
dow
haw
kwee
d,
all
all
1-2
1
0.
1 n
= 8
75
3-4
0.
0
5-6
18
2.1
Pric
kly
lettu
ce,
Bitt
erro
ot
DF
/PP,
1-
2
0.0
n =
283
B
ITT
A
F/L
P
3
0.0
5
12
1 2
5.3
7
10
1
3.9
Pric
kly
lettu
ce,
Mal
heur
, D
F/P
P,
1 15
6.
8n
= 2
20
Pan
hand
le
GF
/RC
, 3
117
9 8
3 3
2
1
65.0
M
AH
L A
F/L
P
5/6
76
5
36.8
P
AN
H

10 USDA Forest Service RMRS-RP-78. 2010.
Discussion
Spotted knapweed occurred primarily on the Bitterroot NF, especially on Douglas-fir and ponderosa pine habitat types. It was not particularly invasive on subalpine fir habitat types. Occurrence was initially lower at higher burn severities versus lower burn se-verities, but the rate of increase over time was greater at higher burn severities. It is not yet clear how knap-weed occurrence and cover will continue to change as secondary succession continues.
Canada thistle occurred on most of the sampled wildfires but at low occurrences. Only 9 percent of the 875 plots had Canada thistle, and average coverage was low. Therefore, Canada thistle was only a minor problem on these wildfires.
Bull thistle was not present immediately after wild-fires but increased rapidly over time on several NFs. Occurrence usually increased with increasing burn se-verity. However, average percent cover was very low; where bull thistle did occur, cover was generally only a trace. Even though bull thistle readily invaded some areas, it did not dominate vegetation succession 3 to 7 years after wildfire. Continued plot re-measurement will determine if bull thistle populations continue to expand.
Hawkweeds were found on the Bitterroot and Flathead NFs, with occurrences less than about 5 per-cent. In addition to low occurrences, percent cover was never more than 1 percent on any plot. Hawkweeds were only a minor problem.
Prickly lettuce was found on most NFs, generally with occurrences less than about 5 percent, except on the Malheur and Panhandle NFs. The Malheur NF had 71.7 percent occurrence 3 years after the wildfire, but this decreased to 42.8 percent by year 5. The Panhandle NF had 35.0 percent occurrence 3 years after the wildfire, but this decreased to 10.0 percent by year 6. Occurrence generally increased rapidly with increas-ing burn severity. Even though prickly lettuce readily invaded some areas, percent cover was very low.
Results for these six invasive species provide in-formation on responses to disturbance during the first 7 years after wildfires. More insights will be gained through re-measurement of these plots. For example, will occurrence and coverage for some of these inva-sives continue to increase? Will development of native vegetation reduce or eliminate these invasive species?
Various approaches can be used to study non-native invasive plant species. Some investigators might locate areas that are being invaded and then study their size,
density, expansion rate, and effects on native vegeta-tion. In this study, the approach was to randomly select stands that were forested at the time of the wildfire and then study the vegetation that developed following the fire. We did not deliberately seek out heavily infested areas, nor did we sample meadows, logging landings, or along roads. Our results show what can be expected within previously forested areas.
Wildfires selected for this study were chosen to include a range of habitat types, overstory densities, slopes, and burn severities. However, the choice of study areas was dependent on finding suitable areas that had been recently burned. Results of this study may or may not extrapolate well to other areas. We feel that the presentation of data by habitat type series and burn severity will help with extrapolation of results to other areas.
References
Arno, S.F. 1980. Forest fire history in the northern Rockies. Journal of Forestry. 78: 460-465.
Arno, S.F. 1999. Undergrowth response, shelterwood cutting unit. In: Smith, H.Y.; Arno, S.F., eds. Eighty-eight years of change in a managed ponderosa pine forest. Gen. Tech. Rep. RMRS-GTR-23. Ogden, UT: USDA Forest Service, Rocky Mountain Research Station. 36-37.
Auclair, A.N.D.; Bedford, J.A. 1994. Conceptual origins of catastrophic forest mortality in the western United States. Journal of Sustainable Forestry. 2: 249-265.
Bais, H.P.; Vepachedu, R.; Gilroy, S.; Callaway, R.M.; Vivanco, J.M. 2003. Allelopathy and exotic plant invasion: from molecules and genes to species interactions. Science. 301: 1377-1380.
Bayer, D.E. 2000. Cirsium arvense. In: Bossard, C.C.; Randall, J.M.; Hoshovsky, M.C., eds. Invasive plants of California’s wildlands. Berkeley, CA: University of California Press. 106-111.
Bechtold, W.A.; Scott, C.T. 2005. The forest inventory and analysis plot design. In: Bechtold, W.A.; Patterson, P.L., eds. The enhanced forest inventory and analysis program—national sampling design and estimation procedures. Gen. Tech. Rep. SRS-80. Asheville, NC: USDA Forest Service, Southern Research Station. 27-42.
Beck, K.G. 1999. Biennial thistles. In: Sheley, R.L.; Petroff, J.K., eds. Biology and management of noxious rangeland weeds. Corvallis, OR: Oregon State University Press. 145-161.
Bradshaw, L.S.; Deeming, J.E.; Burgan, R.E.; Cohen, J.D., comp. 1984. The 1978 National Fire-Danger Rating System: technical documentation. Gen. Tech. Rep. INT-169. Ogden, UT: USDA Forest Service, Intermountain Forest and Range Experiment Station. 44 p.
USDA Forest Service RMRS-RP-78. 2010. 11
Cooper, S.V.; Neiman, K.E.; Roberts, D.W. 1991. Forest habitat types of northern Idaho: a second approximation. Gen. Tech. Rep. INT-236. Ogden, UT: USDA Forest Service, Intermountain Research Station. 143 p.
Covington, W.W.; Moore, M.M. 1994. Postsettlement changes in natural fire regimes and forest structure: ecological restoration of old-growth ponderosa pine forests. Journal of Sustainable Forestry. 2: 153-181.
Daubenmire, R. 1959. A canopy-coverage method of vegetational analysis. Northwest Science. 33: 43-64.
Downs, M.P.; Cavers, P.B. 2000. Effects of wetting and drying on seed germination and seedling emergence of bull thistle, Cirsium vulgare (Savi) Ten. Canadian Journal of Botany. 78: 1545-1551.
Emery, S.M.; Gross, K.L. 2005. Effects of timing of prescribed fire on the demography of an invasive plant, spotted knapweed Centaurea maculosa. Journal of Applied Ecology. 42: 60-69.
Evans, E.A. 2003. Economic dimensions of invasive species. Choices. 2: 5-10.
Ferguson, D.E.; Craig, C.L.; Schneider, K.Z. 2007. Spotted knapweed (Centaurea biebersteinii DC) response to forest wildfires on the Bitterroot National Forest, Montana. Northwest Science. 81: 138-146.
Fischer, W.C.; Bradley, A.F. 1987. Fire ecology of eastern Montana forest habitat types. Gen. Tech. Rep. INT-223. Ogden, UT: USDA Forest Service, Intermountain Research Station. 95 p.
Forcella, F.; Harvey, S.J. 1983. Eurasian weed infestation in western Montana in relation to vegetation and disturbance. Madrono. 30: 102-109.
Friedli, J.; Bacher, S. 2001. Direct and indirect effects of a shoot-base boring weevil and plant competition on the performance of creeping thistle, Cirsium arvense. Biological Control. 22: 219-226.
Gleason, H.; Cronquist, A. 1991. Manual of vascular plants of northeastern United States and adjacent Canada. 2nd ed. New York: The New York Botanical Garden. 910 p.
Hamilton, D.A.; Brickell, J.E. 1983. Modeling methods for a two-state system with continuous responses. Canadian Journal of Forest Research. 13: 1117-1121.
Harris, P.; Cranston, R. 1979. An economic evaluation of control methods for diffuse and spotted knapweed in western Canada. Canadian Journal of Plant Science. 59: 375-382.
Hessburg, P.F.; Smith, B.G.; Salter, R.B.; Ottmar, R.D.; Alvarado, E. 2000. Recent changes (1930s-1990s) in spatial patterns of interior northwest forests, USA. Forest Ecology and Management. 136: 53-83.
Jacobs, J.S.; Sheley, R.L. 1998. Observation: life history of spotted knapweed. Journal of Range Management. 51: 665-673.
Johnson, C.G., Jr.; Clausnitzer, R.R. 1992. Plant associations of the Blue and Ochoco Mountains. R6-ERW-TP-036-92. Baker City, OR: USDA Forest Service, Pacific Northwest Region, Wallowa-Whitman National Forest. 207 p.
Klinkhamer, P.G.L.; de Jong, T.J. 1993. Biological flora of the British Isles, Cirsium vulgare (Savi) Ten. (Carduus lanceolatus L., Cirsium lanceoltum (L.) Scop., non Hill). The Journal of Ecology. 81: 177-191.
Louda, S.M.; Kendall, D.; Connor, J.; Simberloff, D. 1997. Ecological effects of an insect introduced for the biological control of weeds. Science. 277: 1088-1090.
Mangold, J.; Kittle, R. 2009. Orange and meadow hawkweed. Montana State University Extension Service MontGuide. MT199816AG. 4 p.
Meier, G.; Weaver, T. 1997. Desirables and weeds for roadside management—a northern Rocky Mountain catalogue. State of Montana Department of Transportation. 145 p.
Mitich, L.W. 1988. Thistles I: Cirsium and Carduus. Weed Technology. 2: 228-229.
Mitich, L.W. 1998. Bull thistle, Cirsium vulgare. Weed Technology. 12: 761-763.
Morishita, D.W. 1999. Canada thistle. In: Sheley, R.L.; Petroff, J.K., eds. Biology and management of noxious rangeland weeds. Corvallis, OR: Oregon State University Press. 162-174.
Parish, R.; Coupé, R.; Lloyd, D., eds. 1996. Plants of southern interior British Columbia and the Inland Northwest. Vancouver, BC: Lone Pine. 463 p.
Perrings, C.; Williamson, M.; Barbier, E.B.; Delfino, D.; Dalmazzone, S.; Shogren, J.; Simmons, P.; Watkinson, A. 2002. Biological invasion risks and the public good: an economic perspective. Conservation Ecology. 6: 1.
Pfister, R.D.; Kovalchik, B.L.; Arno, S.F.; Presby, R.C. 1977. Forest habitat types of Montana. Gen. Tech. Rep. INT-34. Ogden, UT: USDA Forest Service, Intermountain Forest and Range Experiment Station. 174 p.
Powell, G.W.; Wikeem, B.M.; Sturko, A.; Boateng, J. 1997. Knapweed growth and effect on conifers in a montane forest. Canadian Journal of Forest Research. 27: 1427-1433.
Prince, S.D.; Marks, M.K.; Carter, R.N. 1978. Induction of flowering in wild lettuce (Lactuca serriola L.). New Phytologist. 81: 265-277.
Randall, J.M. 2000. Cirsium vulgare. In: Bossard, C.C.; Randall, J.M.; Hoshovsky, M.C., eds. Invasive plants of California’s wildlands. Berkeley, CA: University of California Press. 112-116.
Roche, C.T.; Roche, B.F., Jr. 1988. Distribution and amount of four knapweed (Centaurea L.) species in eastern Washington. Northwest Science. 62: 242-253.
Roe, A.L.; Beaufait, W.R.; Lyon, L.J.; Oltman, J.L. 1971. Fire and forestry in the northern Rocky Mountains—a task force report. Journal of Forestry. 68: 464-470.
Sheley, R.L.; Jacobs, J.S.; Carpinelli, M.F. 1998. Distribution, biology, and management of diffuse knapweed (Centaurea diffusa) and spotted knapweed (Centaurea maculosa). Weed Technology. 12: 353-362.
Smith, J.K.; Fischer, W.C. 1997. Fire ecology of the forest habitat types of northern Idaho. Gen. Tech. Rep. INT-363. Ogden, UT: USDA Forest Service, Intermountain Research Station. 142 p.

12 USDA Forest Service RMRS-RP-78. 2010.
Stachon, W.J.; Zimdahl, R.L. 1980. Allelopathic activity of Canada thistle (Cirsium arvense) in Colorado. Weed Science. 28: 83-86.
Steele, R.; Arno, S.; Geier-Hayes, K. 1986. Wildfire patterns change in central Idaho’s ponderosa pine-Douglas-fir forest. Western Journal of Applied Forestry. 1: 16-18.
Thomas, R.F.; Tworkoski, T.J.; French, R.C.; Leather, G.R. 1994. Puccinia punctiformis affects growth and reproduction of Canada thistle (Cirsium arvense). Weed Technology. 8: 488-493.
Travnicek, A.J.; Lym, R.G.; Prosser, C. 2005. Fall-prescribed burn and spring-applied herbicide effects on Canada thistle control and soil seedbank in a northern mixed-grass prairie. Rangeland Ecology and Management. 58: 413-422.
U.S. Department of Agriculture, Natural Resources Conservation Service [USDA NRCS]. 2001. The PLANTS Database, Version 3.1 [Online]. National Plant Data Center. Baton Rouge, LA. Available: http://plants.usda.gov.
Watson, A.K.; Renney, A.J. 1974. The biology of Canadian weeds. 6. Centaurea diffusa and C. maculosa. Canadian Journal of Plant Science. 54: 687-701.
Weaver, S.E.; Downs, M.P. 2003. The biology of Canadian weeds. 122. Lactuca serriola L. Canadian Journal of Plant Science. 83: 619-628.
Weaver, T.; Lichthart, J.; Gustafson, D. 1990. Exotic invasion of timberline vegetation, northern Rocky Mountains, USA. In: Schmidt, W.C.; McDonald, K.J., comp. Proceedings—symposium on whitebark pine ecosystems: ecology and management of a high-mountain resource; 1989; Bozeman, MT. Gen. Tech. Rep. INT-270. Ogden, UT: USDA Forest Service, Intermountain Research Station. 208-213.
Wellner, C.A. 1970. Fire history in the northern Rocky Mountains. In: The role of fire in the Intermountain West. Missoula, MT: University of Montana, School of Forestry. 42-64.
Whitson, T.D.; Burrill, L.C.; Dewey, S.A.; Cudney, D.W.; Nelson, B.E.; Lee, R.D.; Parker, R., eds. 1996. Weeds of the West. 5th ed. Jackson, WY: Pioneer of Jackson Hole. 628 p.
Wilson, L.M.; Callihan, R.H. 1999. Meadow and orange hawkweed. In: Sheley, R.L.; Petroff, J.K., eds. Biology and management of noxious rangeland weeds. Corvallis, OR: Oregon State University Press. 238-248.
Wilson, L.M.; McCaffrey, J.P.; Quimby, P.C.; Birdsall, J.L. 1997. Hawkweeds in the northwestern United States. Rangelands. 19: 18-23.

Federal Recycling Program Printed on Recycled Paper
Rocky Mountain Research Station
The Rocky Mountain Research Station develops scientific information and technology to improve management, protection, and use of the forests and rangelands. Research is designed to meet the needs of the National Forest managers, Federal and State agencies, public and private organizations, academic institutions, industry, and individuals. Studies accelerate solutions to problems involving ecosystems, range, forests, water, recreation, fire, resource inventory, land reclamation, community sustainability, forest engineering technology, multiple use economics, wildlife and fish habitat, and forest insects and diseases. Studies are conducted cooperatively, and applications may be found worldwide.
Station HeadquartersRocky Mountain Research Station
240 W Prospect RoadFort Collins, CO 80526
(970) 498-1100
Research Locations
Reno, NevadaAlbuquerque, New MexicoRapid City, South Dakota
Logan, UtahOgden, UtahProvo, Utah
The U.S. Department of Agriculture (USDA) prohibits discrimination in all its programs and activities on the basis of race, color, national origin, age, disability, and where applicable, sex, marital status, familial status, parental status, religion, sexual orientation, genetic information, political beliefs, reprisal, or because all or part of an individual’s income is derived from any public assistance program. (Not all prohibited bases apply to all programs.) Persons with disabilities who require alternative means for communication of program information (Braille, large print, audiotape, etc.) should contact USDA’s TARGET Center at (202) 720-2600 (voice and TDD). To file a complaint of discrimination, write to USDA, Director, Office of Civil Rights, 1400 Independence Avenue, S.W., Washington, DC 20250-9410, or call (800) 795-3272 (voice) or (202) 720-6382 (TDD). USDA is an equal opportunity provider and employer.
Flagstaff, ArizonaFort Collins, Colorado
Boise, IdahoMoscow, Idaho
Bozeman, MontanaMissoula, Montana


![[Tsuga Sword Scantrad]Edição de Mangás](https://img.dokumen.tips/doc/110x75/557212a8497959fc0b90ac20/tsuga-sword-scantradedicao-de-mangas.jpg)