Embed Size (px)
Citation preview
Denbury.com | NYSE: DNR
Corporate Presentation June 2014
Click to edit Master title style
Denbury.com | NYSE: DNR
Click to edit title style
2
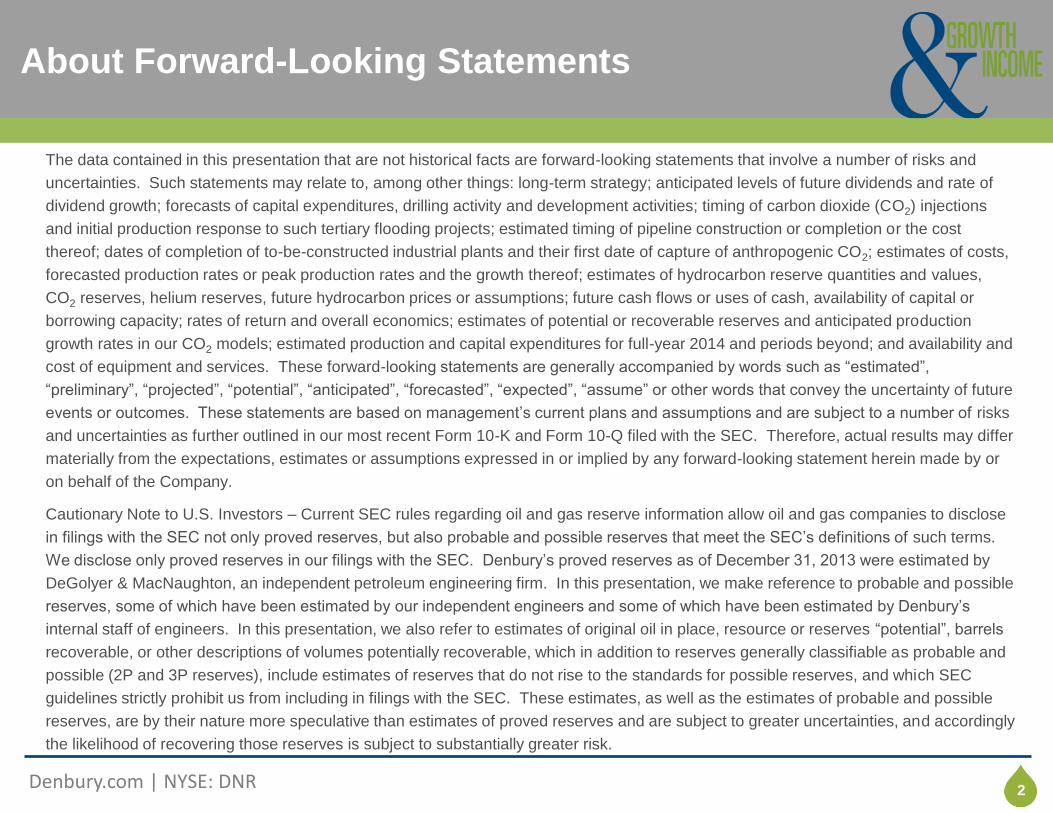
The data contained in this presentation that are not historical facts are forward-looking statements that involve a number of risks and
uncertainties. Such statements may relate to, among other things: long-term strategy; anticipated levels of future dividends and rate of
dividend growth; forecasts of capital expenditures, drilling activity and development activities; timing of carbon dioxide (CO2) injections
and initial production response to such tertiary flooding projects; estimated timing of pipeline construction or completion or the cost
thereof; dates of completion of to-be-constructed industrial plants and their first date of capture of anthropogenic CO2; estimates of costs,
forecasted production rates or peak production rates and the growth thereof; estimates of hydrocarbon reserve quantities and values,
CO2 reserves, helium reserves, future hydrocarbon prices or assumptions; future cash flows or uses of cash, availability of capital or
borrowing capacity; rates of return and overall economics; estimates of potential or recoverable reserves and anticipated production
growth rates in our CO2 models; estimated production and capital expenditures for full-year 2014 and periods beyond; and availability and
cost of equipment and services. These forward-looking statements are generally accompanied by words such as “estimated”,
“preliminary”, “projected”, “potential”, “anticipated”, “forecasted”, “expected”, “assume” or other words that convey the uncertainty of future
events or outcomes. These statements are based on management’s current plans and assumptions and are subject to a number of risks
and uncertainties as further outlined in our most recent Form 10-K and Form 10-Q filed with the SEC. Therefore, actual results may differ
materially from the expectations, estimates or assumptions expressed in or implied by any forward-looking statement herein made by or
on behalf of the Company.
Cautionary Note to U.S. Investors – Current SEC rules regarding oil and gas reserve information allow oil and gas companies to disclose
in filings with the SEC not only proved reserves, but also probable and possible reserves that meet the SEC’s definitions of such terms.
We disclose only proved reserves in our filings with the SEC. Denbury’s proved reserves as of December 31, 2013 were estimated by
DeGolyer & MacNaughton, an independent petroleum engineering firm. In this presentation, we make reference to probable and possible
reserves, some of which have been estimated by our independent engineers and some of which have been estimated by Denbury’s
internal staff of engineers. In this presentation, we also refer to estimates of original oil in place, resource or reserves “potential”, barrels
recoverable, or other descriptions of volumes potentially recoverable, which in addition to reserves generally classifiable as probable and
possible (2P and 3P reserves), include estimates of reserves that do not rise to the standards for possible reserves, and which SEC
guidelines strictly prohibit us from including in filings with the SEC. These estimates, as well as the estimates of probable and possible
reserves, are by their nature more speculative than estimates of proved reserves and are subject to greater uncertainties, and accordingly
the likelihood of recovering those reserves is subject to substantially greater risk.
About Forward-Looking Statements
Click to edit Master title style
Denbury.com | NYSE: DNR
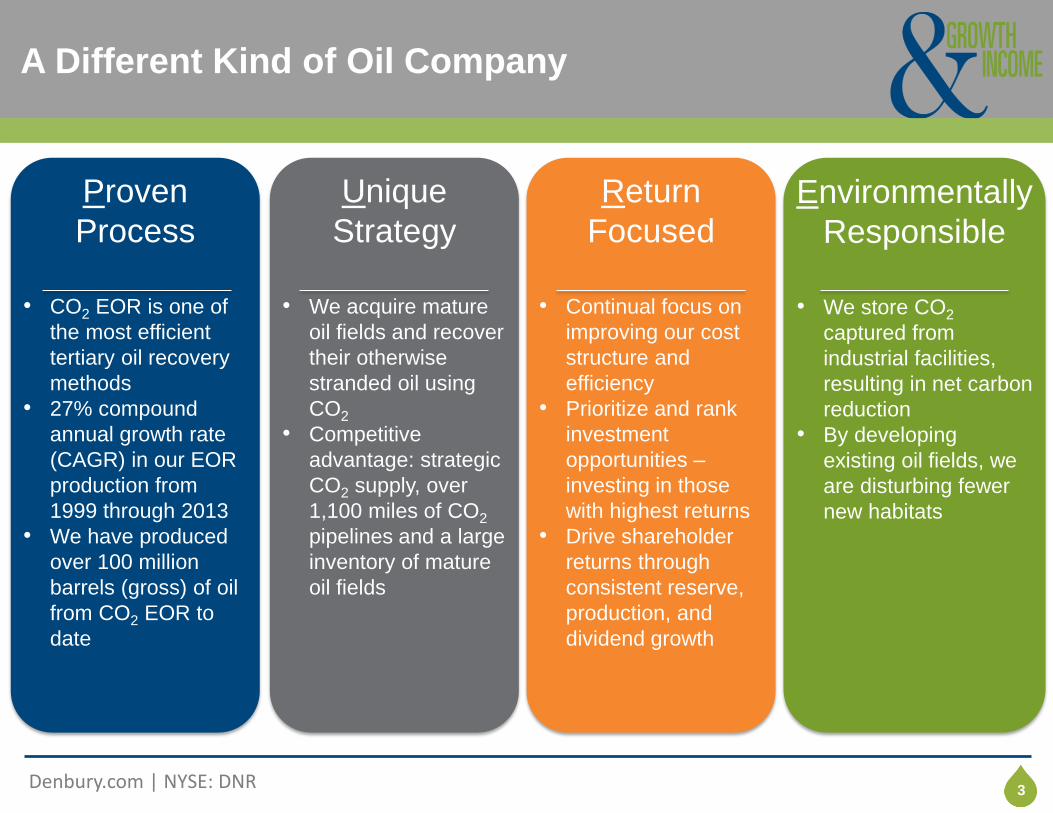
Click to edit title style A Different Kind of Oil Company
3
Proven
Process
• CO2 EOR is one of
the most efficient
tertiary oil recovery
methods
• 27% compound
annual growth rate
(CAGR) in our EOR
production from
1999 through 2013
• We have produced
over 100 million
barrels (gross) of oil
from CO2 EOR to
date
Unique
Strategy
• We acquire mature
oil fields and recover
their otherwise
stranded oil using
CO2
• Competitive
advantage: strategic
CO2 supply, over
1,100 miles of CO2
pipelines and a large
inventory of mature
oil fields
Return
Focused
• Continual focus on
improving our cost
structure and
efficiency
• Prioritize and rank
investment
opportunities –
investing in those
with highest returns
• Drive shareholder
returns through
consistent reserve,
production, and
dividend growth
Environmentally
Responsible
• We store CO2
captured from
industrial facilities,
resulting in net carbon
reduction
• By developing
existing oil fields, we
are disturbing fewer
new habitats

Click to edit Master title style
Denbury.com | NYSE: DNR
Click to edit title style Total Return Focus
4
Growth Income
● Estimated 4%-8% organic
production growth through 2020
● Large portfolio of lower-risk,
long-lived assets
● Balanced and disciplined
approach
● Capital flexibility
● Supplement with acquisitions
● Estimated dividend yield(1) of
1.5% for 2014 and 3.3% for 2015
● Stability and sustainability are
key:
Target funding capital
expenditures and dividends
within cash flow
Maintain a healthy balance
sheet
(1) Based on $16.78 share price and $0.25 expected annualized dividend rate in 2014 and $0.55 (mid-point of guidance) expected dividend rate in 2015.
Click to edit Master title style
Denbury.com | NYSE: DNR
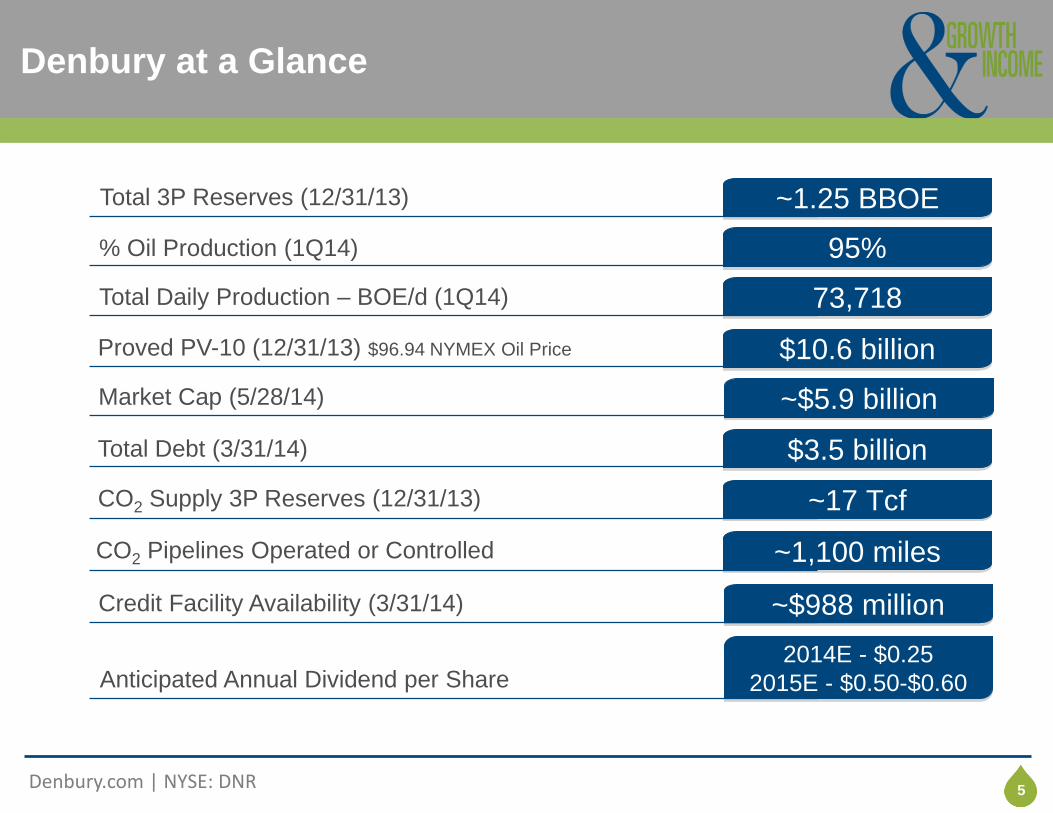
Click to edit title style Denbury at a Glance
5
~$5.9 billion
73,718
$10.6 billion
~17 Tcf
~1,100 miles
Market Cap (5/28/14)
Total Daily Production – BOE/d (1Q14)
Proved PV-10 (12/31/13) $96.94 NYMEX Oil Price
CO2 Supply 3P Reserves (12/31/13)
CO2 Pipelines Operated or Controlled
~1.25 BBOE
95%
Total 3P Reserves (12/31/13)
% Oil Production (1Q14)
$3.5 billion Total Debt (3/31/14)
~$988 million Credit Facility Availability (3/31/14)
2014E - $0.25
2015E - $0.50-$0.60 Anticipated Annual Dividend per Share
Click to edit Master title style
Denbury.com | NYSE: DNR
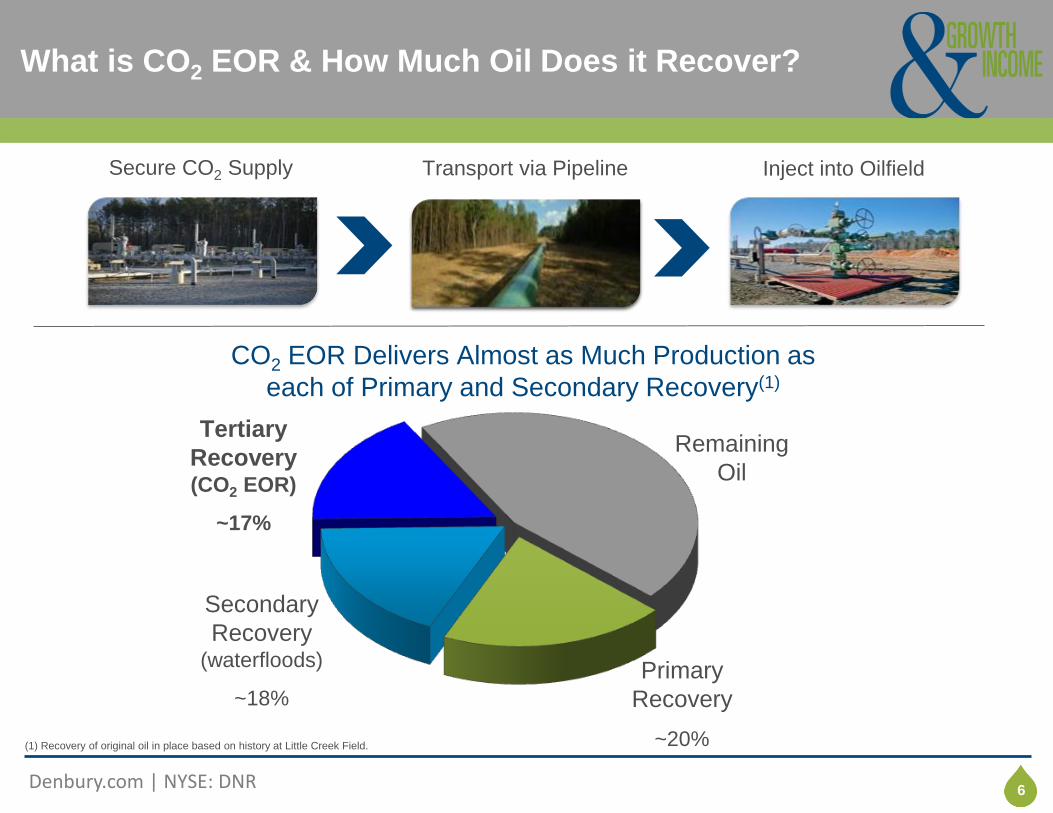
Click to edit title style What is CO2 EOR & How Much Oil Does it Recover?
6
Secure CO2 Supply Transport via Pipeline Inject into Oilfield
CO2 EOR Delivers Almost as Much Production as
each of Primary and Secondary Recovery(1)
Secondary
Recovery (waterfloods)
~18%
Tertiary
Recovery (CO2 EOR)
~17%
Remaining
Oil
Primary
Recovery
~20% (1) Recovery of original oil in place based on history at Little Creek Field.
Click to edit Master title style
Denbury.com | NYSE: DNR
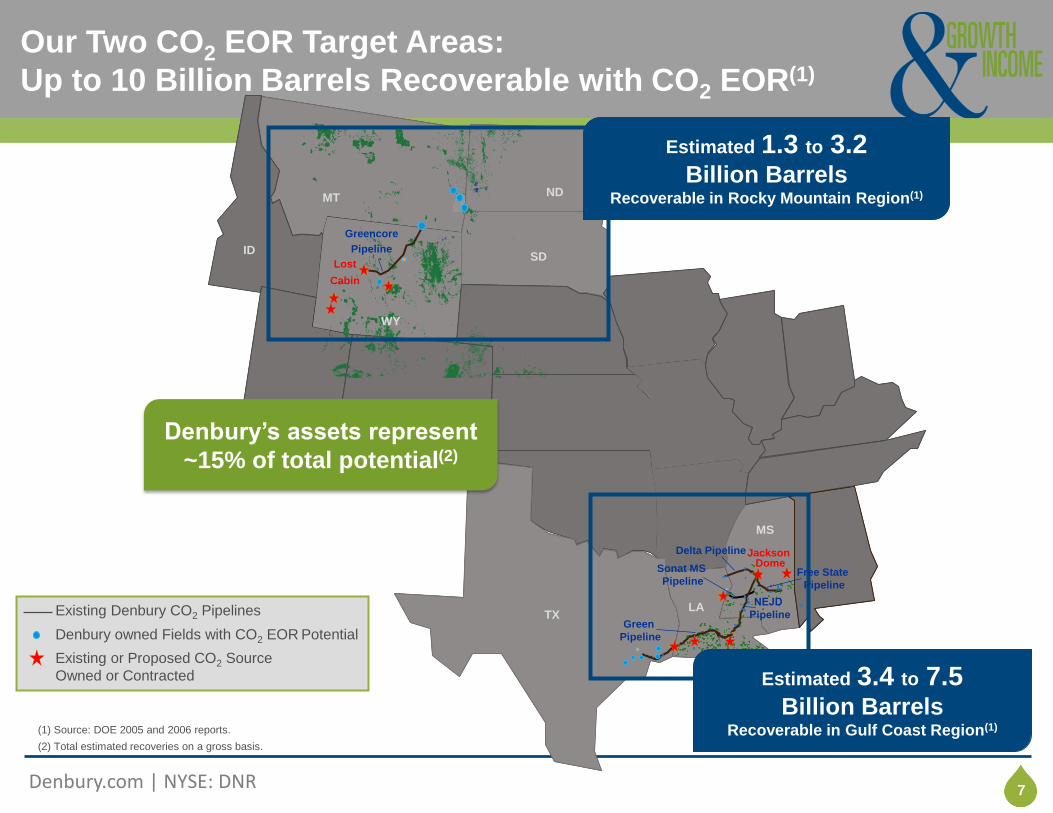
Click to edit title style Our Two CO2 EOR Target Areas:
Up to 10 Billion Barrels Recoverable with CO2 EOR(1)
7 7
Existing or Proposed CO2 Source
Owned or Contracted
Existing Denbury CO2 Pipelines
Denbury owned Fields with CO2 EOR Potential Green
Pipeline
Jackson Dome
Delta Pipeline
Sonat MS
Pipeline
ND
SD Lost
Cabin
ID
MT
WY
TX LA
MS
Greencore
Pipeline
Estimated 3.4 to 7.5 Billion Barrels
Recoverable in Gulf Coast Region(1) (1) Source: DOE 2005 and 2006 reports.
(2) Total estimated recoveries on a gross basis.
Estimated 1.3 to 3.2 Billion Barrels
Recoverable in Rocky Mountain Region(1)
Free State
Pipeline
Denbury’s assets represent
~15% of total potential(2)
Click to edit Master title style
Denbury.com | NYSE: DNR
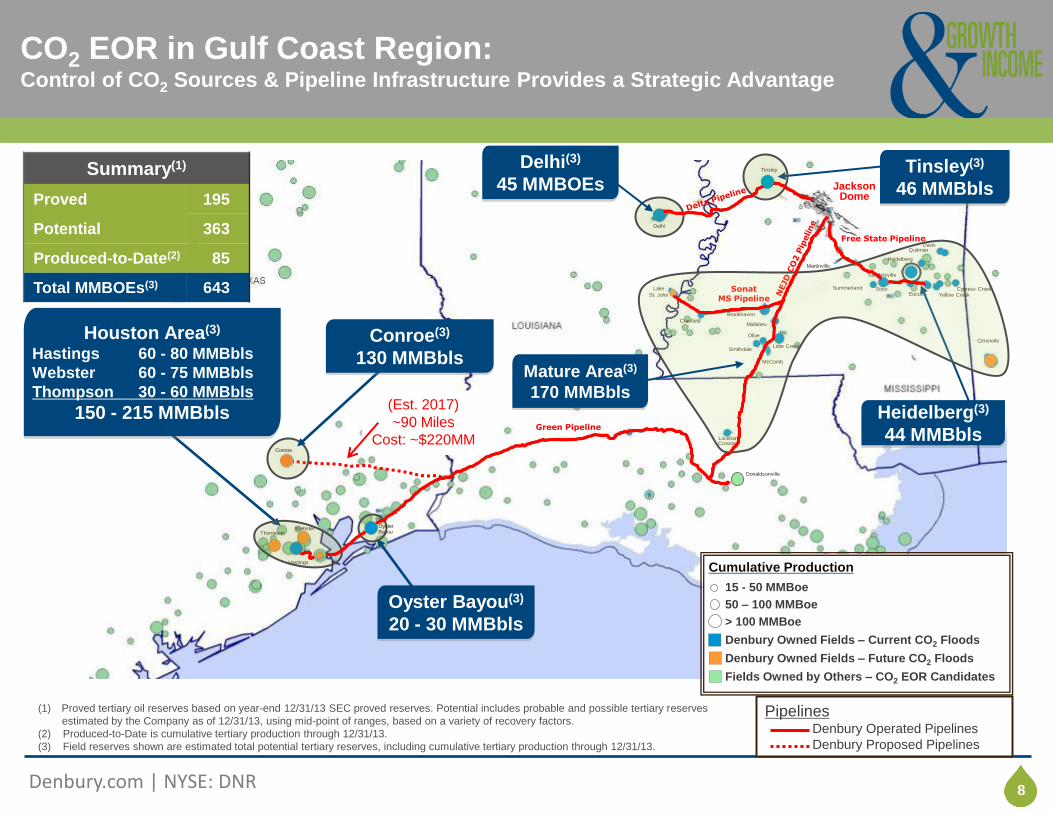
Click to edit title style CO2 EOR in Gulf Coast Region: Control of CO2 Sources & Pipeline Infrastructure Provides a Strategic Advantage
8
(1) Proved tertiary oil reserves based on year-end 12/31/13 SEC proved reserves. Potential includes probable and possible tertiary reserves
estimated by the Company as of 12/31/13, using mid-point of ranges, based on a variety of recovery factors.
(2) Produced-to-Date is cumulative tertiary production through 12/31/13.
(3) Field reserves shown are estimated total potential tertiary reserves, including cumulative tertiary production through 12/31/13.
Jackson Dome
Sonat MS Pipeline
Green Pipeline
Citronelle
(2)
Tinsley
Free State Pipeline
Martinville
Davis Quitman
Heidelberg
Summerland Soso
Sandersville
Eucutta Yellow Creek Cypress Creek
Brookhaven
Mallalieu
Little Creek
Olive
Smithdale
McComb
Donaldsonville
Delhi
Lake
St. John
Cranfield
Lockhart Crossing
Hastings
Conroe
Oyster Bayou
Delhi(3)
45 MMBOEs Tinsley(3)
46 MMBbls
Mature Area(3)
170 MMBbls
Oyster Bayou(3)
20 - 30 MMBbls
Conroe(3)
130 MMBbls
Summary(1)
Proved 195
Potential 363
Produced-to-Date(2) 85
Total MMBOEs(3) 643
15 - 50 MMBoe
50 – 100 MMBoe
> 100 MMBoe
Denbury Owned Fields – Current CO2 Floods
Denbury Owned Fields – Future CO2 Floods
Fields Owned by Others – CO2 EOR Candidates
Cumulative Production
Thompson
Heidelberg(3)
44 MMBbls
Houston Area(3)
Hastings 60 - 80 MMBbls
Webster 60 - 75 MMBbls
Thompson 30 - 60 MMBbls
150 - 215 MMBbls
Webster
(Est. 2017)
~90 Miles
Cost: ~$220MM
Pipelines Denbury Operated Pipelines
Denbury Proposed Pipelines
Click to edit Master title style
Denbury.com | NYSE: DNR
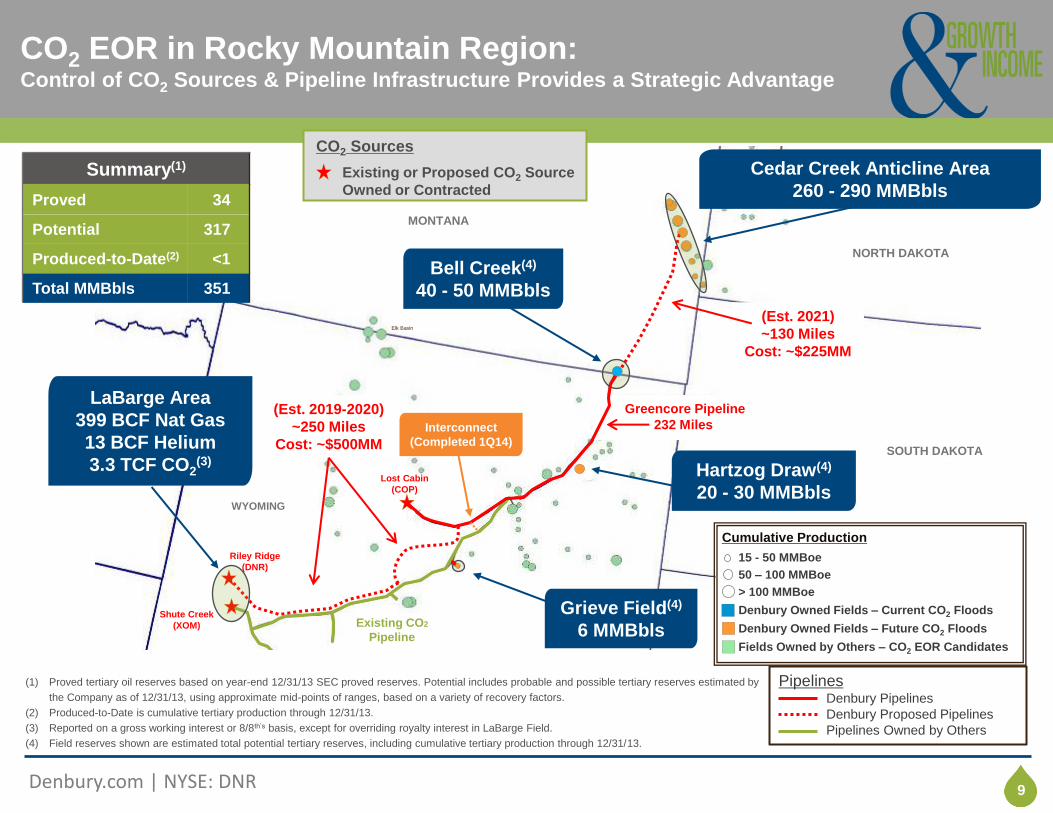
Click to edit title style CO2 EOR in Rocky Mountain Region: Control of CO2 Sources & Pipeline Infrastructure Provides a Strategic Advantage
9
MONTANA
NORTH DAKOTA
SOUTH DAKOTA
WYOMING
Elk Basin
Shute Creek
(XOM)
Lost Cabin
(COP)
DGC Beulah
Riley Ridge
(DNR)
Greencore Pipeline
232 Miles
Bell Creek(4)
40 - 50 MMBbls
Cedar Creek Anticline Area
260 - 290 MMBbls
Grieve Field(4)
6 MMBbls Existing CO2
Pipeline
CO2 Sources
(1) Proved tertiary oil reserves based on year-end 12/31/13 SEC proved reserves. Potential includes probable and possible tertiary reserves estimated by
the Company as of 12/31/13, using approximate mid-points of ranges, based on a variety of recovery factors.
(2) Produced-to-Date is cumulative tertiary production through 12/31/13.
(3) Reported on a gross working interest or 8/8th’s basis, except for overriding royalty interest in LaBarge Field.
(4) Field reserves shown are estimated total potential tertiary reserves, including cumulative tertiary production through 12/31/13.
Existing or Proposed CO2 Source
Owned or Contracted
Hartzog Draw(4)
20 - 30 MMBbls
Summary(1)
Proved 34
Potential 317
Produced-to-Date(2) <1
Total MMBbls 351
(Est. 2019-2020)
~250 Miles
Cost: ~$500MM
Interconnect
(Completed 1Q14)
(Est. 2021)
~130 Miles
Cost: ~$225MM
LaBarge Area
399 BCF Nat Gas
13 BCF Helium
3.3 TCF CO2(3)
Pipelines Denbury Pipelines
Denbury Proposed Pipelines
Pipelines Owned by Others
15 - 50 MMBoe
50 – 100 MMBoe
> 100 MMBoe
Denbury Owned Fields – Current CO2 Floods
Denbury Owned Fields – Future CO2 Floods
Fields Owned by Others – CO2 EOR Candidates
Cumulative Production

Click to edit Master title style
Denbury.com | NYSE: DNR
Click to edit title style
(1) Based on year-end 2012 and 2013 SEC reported proved reserves.
(2) Based on internal estimates, refer to slide 2 for full disclosure relative to forward-looking statements.
More than a Billion Barrels of Oil Potential
10
0
250
500
750
1,000
1,250
1,500
12/31/12Proved
Reserves
12/31/13 Proved
Reserves
+ CO2 EORPotential
+ OtherPotential
Total Potential
MM
BO
E
.....
.....
.....
80%
Oil
90%
Oil 54%
Oil
83%
Oil
100%
Oil
(2) (2)
1,250
409
102
468
680
(1) (1)
=
Click to edit Master title style
Denbury.com | NYSE: DNR
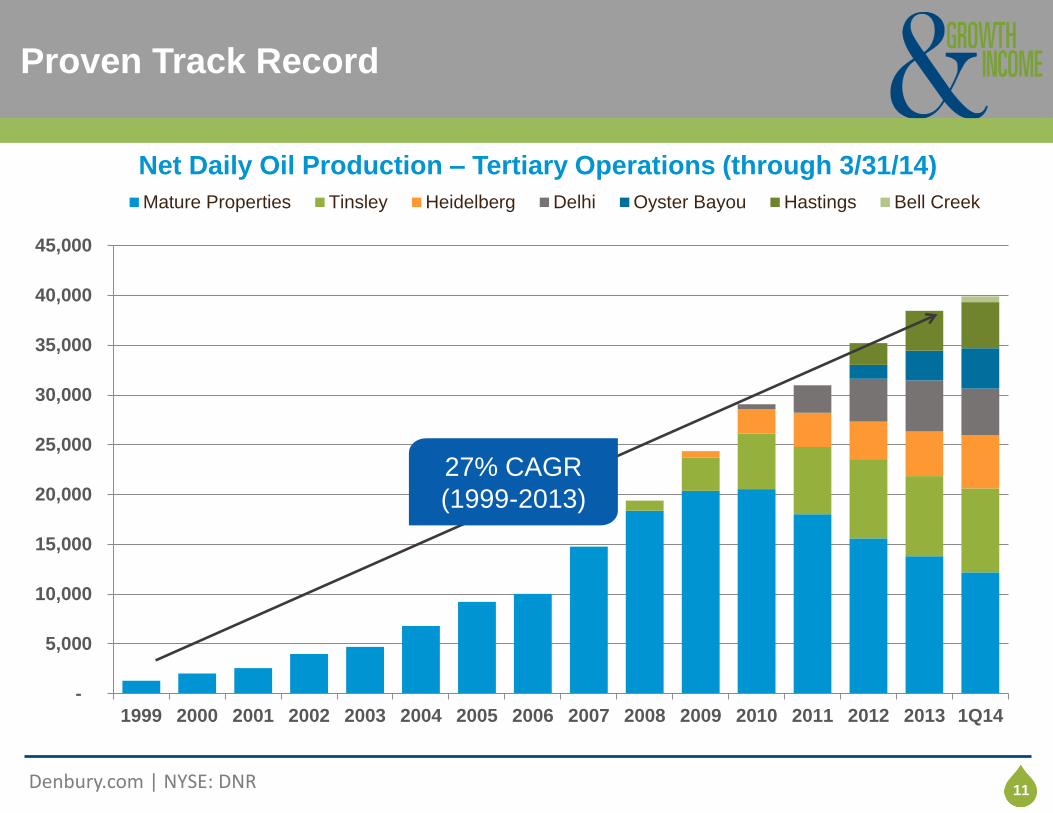
Click to edit title style Proven Track Record
11
-
5,000
10,000
15,000
20,000
25,000
30,000
35,000
40,000
45,000
1999 2000 2001 2002 2003 2004 2005 2006 2007 2008 2009 2010 2011 2012 2013 1Q14
Mature Properties Tinsley Heidelberg Delhi Oyster Bayou Hastings Bell Creek
Net Daily Oil Production – Tertiary Operations (through 3/31/14)
27% CAGR
(1999-2013)
Click to edit Master title style
Denbury.com | NYSE: DNR
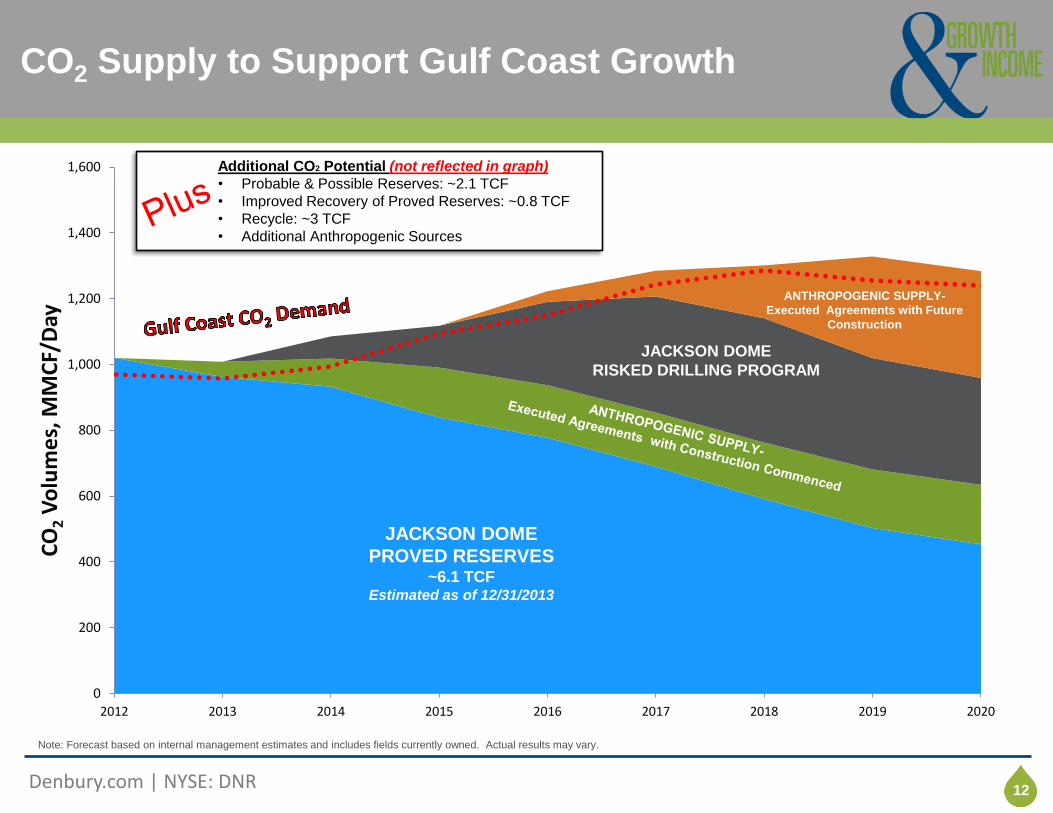
Click to edit title style CO2 Supply to Support Gulf Coast Growth
12
0
200
400
600
800
1,000
1,200
1,400
1,600
2012 2013 2014 2015 2016 2017 2018 2019 2020
CO
2 V
olu
me
s, M
MC
F/D
ay ANTHROPOGENIC SUPPLY-
Executed Agreements with Future
Construction
JACKSON DOME
RISKED DRILLING PROGRAM
JACKSON DOME
PROVED RESERVES ~6.1 TCF
Estimated as of 12/31/2013
Additional CO2 Potential (not reflected in graph)
• Probable & Possible Reserves: ~2.1 TCF
• Improved Recovery of Proved Reserves: ~0.8 TCF
• Recycle: ~3 TCF
• Additional Anthropogenic Sources
Note: Forecast based on internal management estimates and includes fields currently owned. Actual results may vary.
Click to edit Master title style
Denbury.com | NYSE: DNR
Click to edit title style Gulf Coast Industrial Partners
13 13
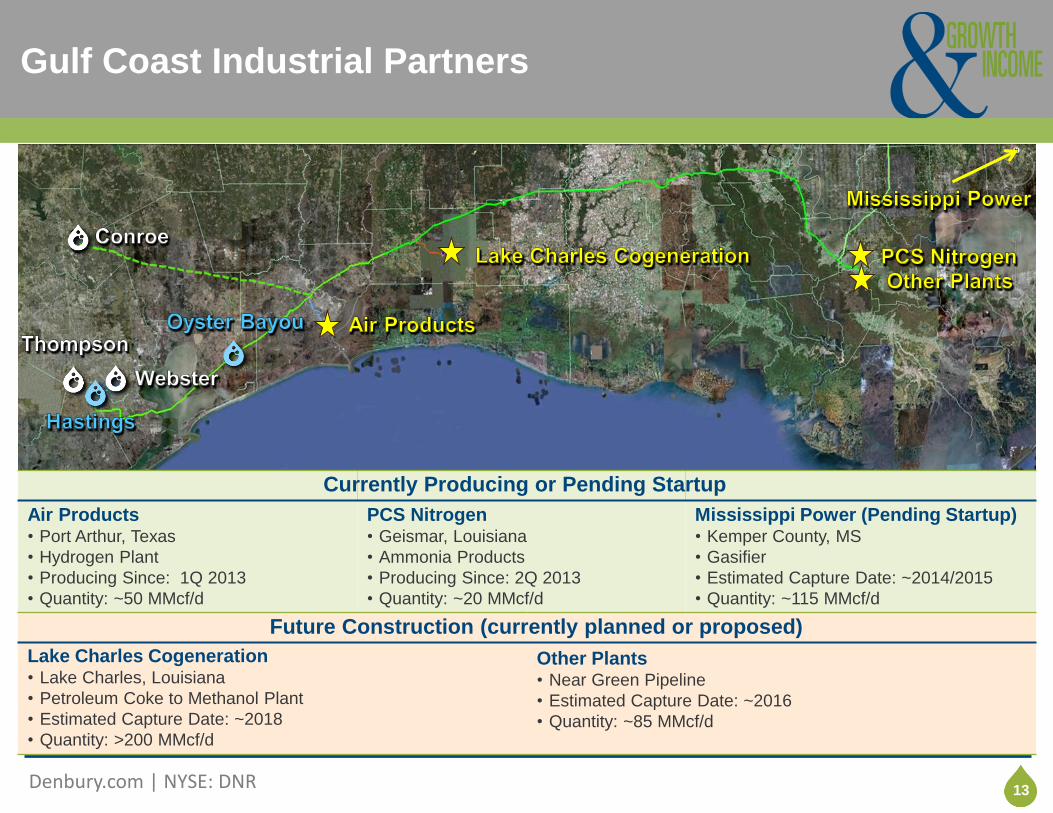
Air Products • Port Arthur, Texas
• Hydrogen Plant
• Producing Since: 1Q 2013
• Quantity: ~50 MMcf/d
PCS Nitrogen • Geismar, Louisiana
• Ammonia Products
• Producing Since: 2Q 2013
• Quantity: ~20 MMcf/d
Mississippi Power (Pending Startup) • Kemper County, MS
• Gasifier
• Estimated Capture Date: ~2014/2015
• Quantity: ~115 MMcf/d
Lake Charles Cogeneration
• Lake Charles, Louisiana
• Petroleum Coke to Methanol Plant
• Estimated Capture Date: ~2018
• Quantity: >200 MMcf/d
Other Plants • Near Green Pipeline
• Estimated Capture Date: ~2016
• Quantity: ~85 MMcf/d
Currently Producing or Pending Startup
Future Construction (currently planned or proposed)
Click to edit Master title style
Denbury.com | NYSE: DNR
Click to edit title style CO2 Supply to Support Rocky Mountain Growth
14
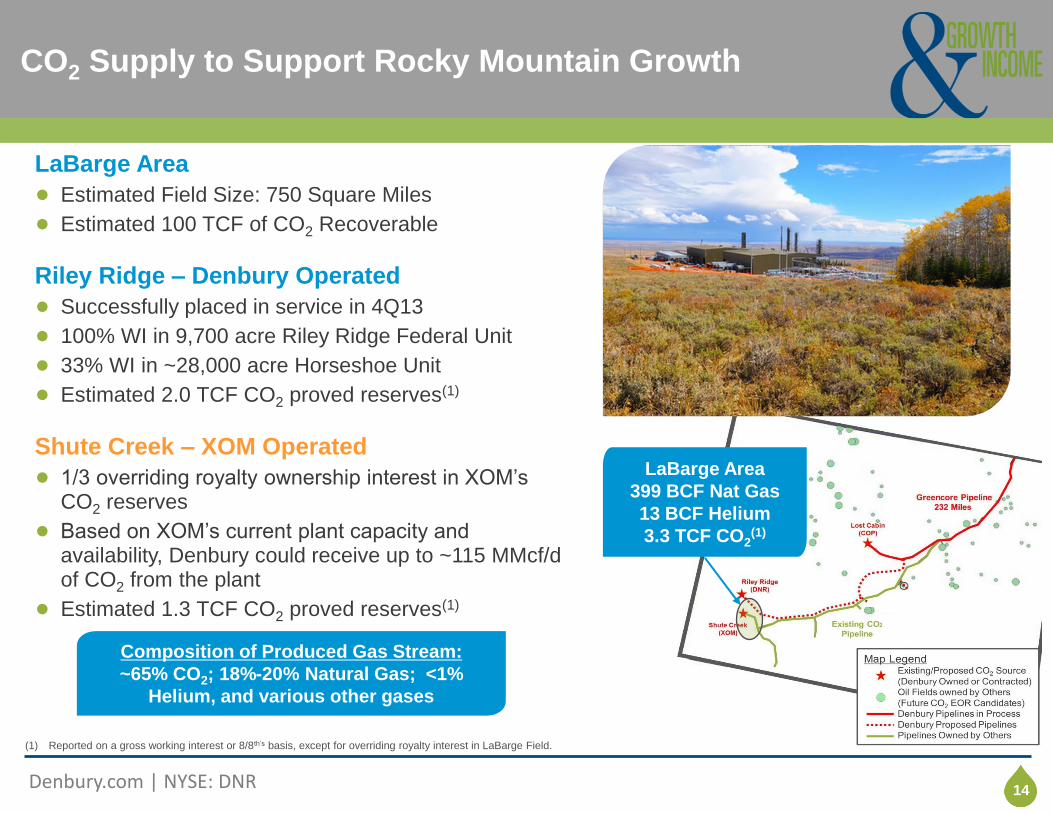
LaBarge Area
● Estimated Field Size: 750 Square Miles
● Estimated 100 TCF of CO2 Recoverable
Riley Ridge – Denbury Operated
● Successfully placed in service in 4Q13
● 100% WI in 9,700 acre Riley Ridge Federal Unit
● 33% WI in ~28,000 acre Horseshoe Unit
● Estimated 2.0 TCF CO2 proved reserves(1)
Shute Creek – XOM Operated
● 1/3 overriding royalty ownership interest in XOM’s CO2 reserves
● Based on XOM’s current plant capacity and availability, Denbury could receive up to ~115 MMcf/d of CO2 from the plant
● Estimated 1.3 TCF CO2 proved reserves(1)
LaBarge Area
399 BCF Nat Gas
13 BCF Helium
3.3 TCF CO2(1)
Composition of Produced Gas Stream:
~65% CO2; 18%-20% Natural Gas; <1%
Helium, and various other gases
(1) Reported on a gross working interest or 8/8th’s basis, except for overriding royalty interest in LaBarge Field.
Click to edit Master title style
Denbury.com | NYSE: DNR
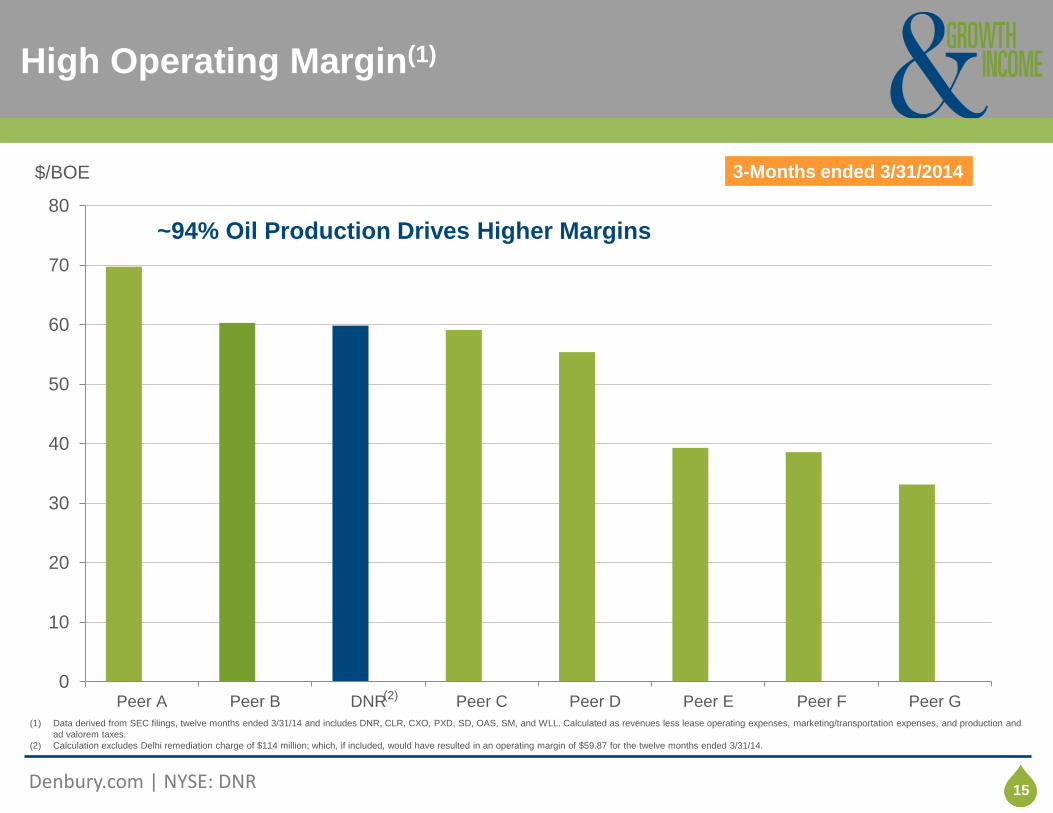
Click to edit title style High Operating Margin(1)
15
0
10
20
30
40
50
60
70
80
Peer A Peer B DNR Peer C Peer D Peer E Peer F Peer G
$/BOE
~94% Oil Production Drives Higher Margins
3-Months ended 3/31/2014
(2) 1
5 (1) Data derived from SEC filings, twelve months ended 3/31/14 and includes DNR, CLR, CXO, PXD, SD, OAS, SM, and WLL. Calculated as revenues less lease operating expenses, marketing/transportation expenses, and production and
ad valorem taxes.
(2) Calculation excludes Delhi remediation charge of $114 million; which, if included, would have resulted in an operating margin of $59.87 for the twelve months ended 3/31/14.
Click to edit Master title style
Denbury.com | NYSE: DNR
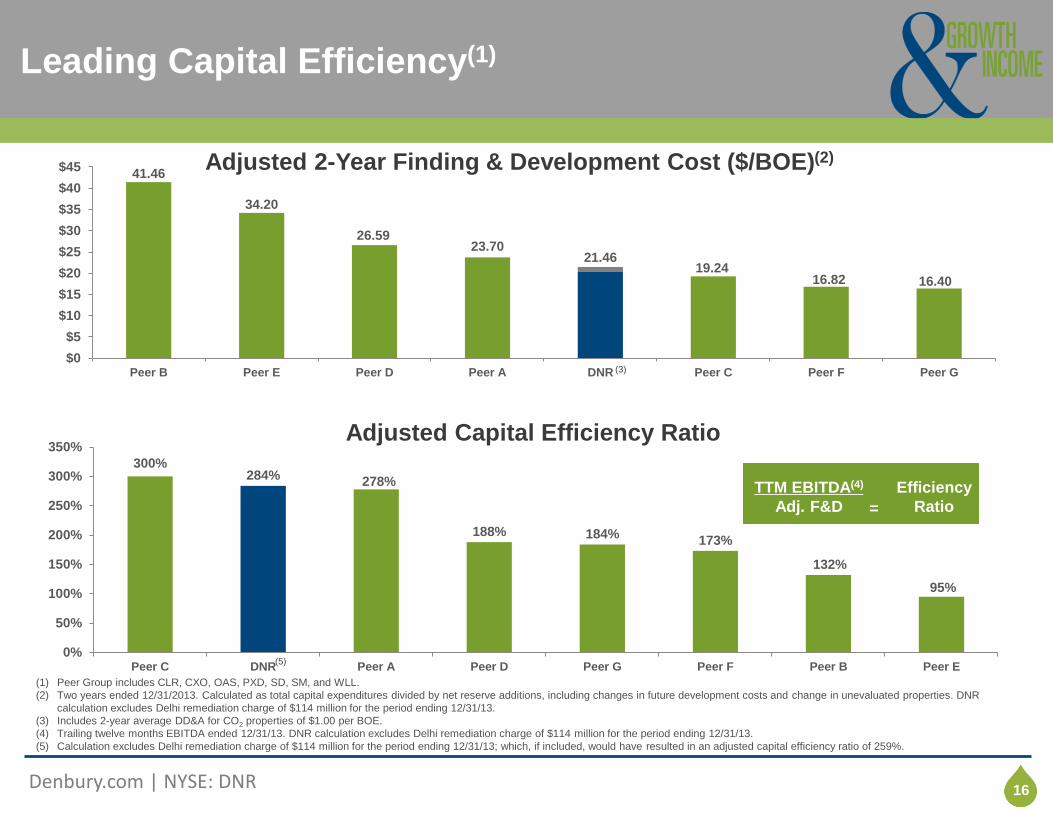
Click to edit title style Leading Capital Efficiency(1)
16
16 16
(1) Peer Group includes CLR, CXO, OAS, PXD, SD, SM, and WLL.
(2) Two years ended 12/31/2013. Calculated as total capital expenditures divided by net reserve additions, including changes in future development costs and change in unevaluated properties. DNR
calculation excludes Delhi remediation charge of $114 million for the period ending 12/31/13.
(3) Includes 2-year average DD&A for CO2 properties of $1.00 per BOE.
(4) Trailing twelve months EBITDA ended 12/31/13. DNR calculation excludes Delhi remediation charge of $114 million for the period ending 12/31/13.
(5) Calculation excludes Delhi remediation charge of $114 million for the period ending 12/31/13; which, if included, would have resulted in an adjusted capital efficiency ratio of 259%.
300% 284% 278%
188% 184% 173%
132%
95%
0%
50%
100%
150%
200%
250%
300%
350%
Peer C DNR Peer A Peer D Peer G Peer F Peer B Peer E
Adjusted Capital Efficiency Ratio
41.46
34.20
26.59 23.70
21.46 19.24
16.82 16.40
$0
$5
$10
$15
$20
$25
$30
$35
$40
$45
Peer B Peer E Peer D Peer A DNR Peer C Peer F Peer G
Adjusted 2-Year Finding & Development Cost ($/BOE)(2)
(3)
TTM EBITDA(4)
Adj. F&D
Efficiency
Ratio =
(5)
Click to edit Master title style
Denbury.com | NYSE: DNR
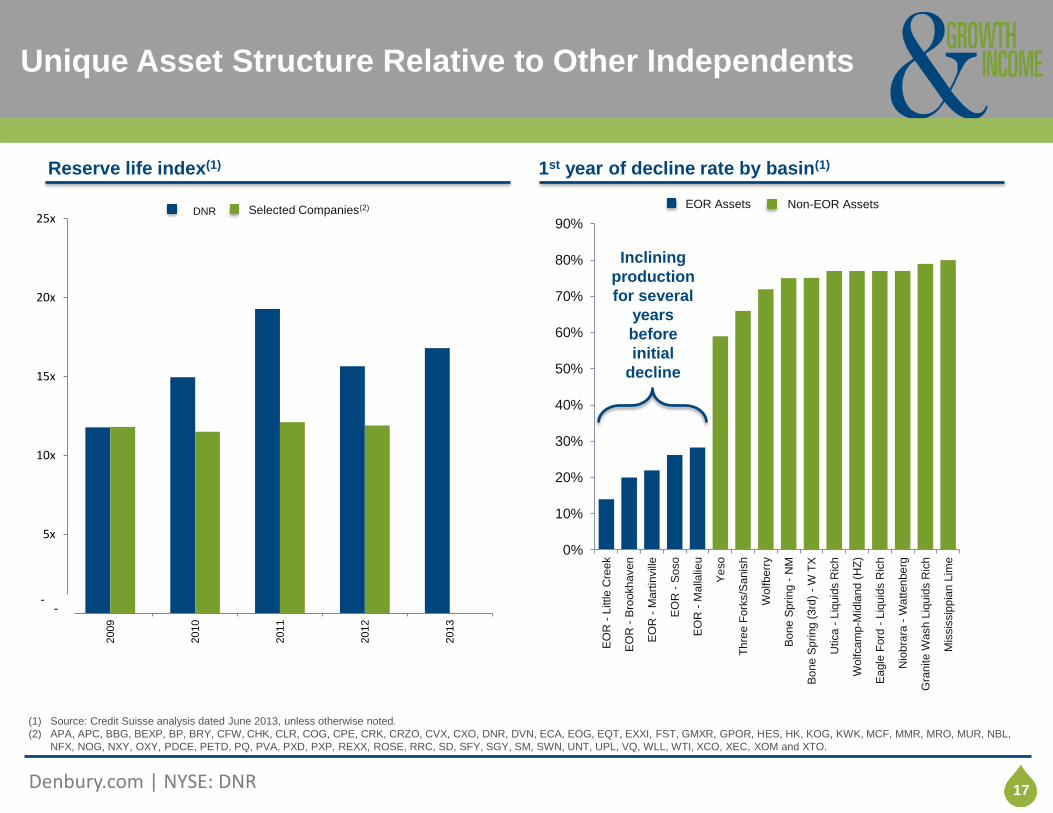
Click to edit title style Unique Asset Structure Relative to Other Independents
17
(1) Source: Credit Suisse analysis dated June 2013, unless otherwise noted.
(2) APA, APC, BBG, BEXP, BP, BRY, CFW, CHK, CLR, COG, CPE, CRK, CRZO, CVX, CXO, DNR, DVN, ECA, EOG, EQT, EXXI, FST, GMXR, GPOR, HES, HK, KOG, KWK, MCF, MMR, MRO, MUR, NBL,
NFX, NOG, NXY, OXY, PDCE, PETD, PQ, PVA, PXD, PXP, REXX, ROSE, RRC, SD, SFY, SGY, SM, SWN, UNT, UPL, VQ, WLL, WTI, XCO, XEC, XOM and XTO.
Reserve life index(1) 1st year of decline rate by basin(1)
0%
10%
20%
30%
40%
50%
60%
70%
80%
90%
EO
R -
Little C
reek
EO
R -
Bro
okh
aven
EO
R -
Ma
rtin
vill
e
EO
R -
Soso
EO
R -
Ma
llalie
u
Ye
so
Th
ree F
ork
s/S
anis
h
Wolfberr
y
Bo
ne S
pring
- N
M
Bo
ne S
pring
(3rd
) -
W T
X
Utica -
Liq
uid
s R
ich
Wolfcam
p-M
idla
nd (
HZ
)
Ea
gle
Ford
- L
iquid
s R
ich
Nio
bra
ra -
Wa
tten
be
rg
Gra
nite W
ash L
iquid
s R
ich
Mis
sis
sip
pia
n L
ime
EOR Assets Non-EOR Assets
Inclining
production
for several
years
before
initial
decline
DNR Selected Companies(2)
x
5x
10x
15x
20x
25x
2009
2010
2011
2012
2013
- -
Click to edit Master title style
Denbury.com | NYSE: DNR
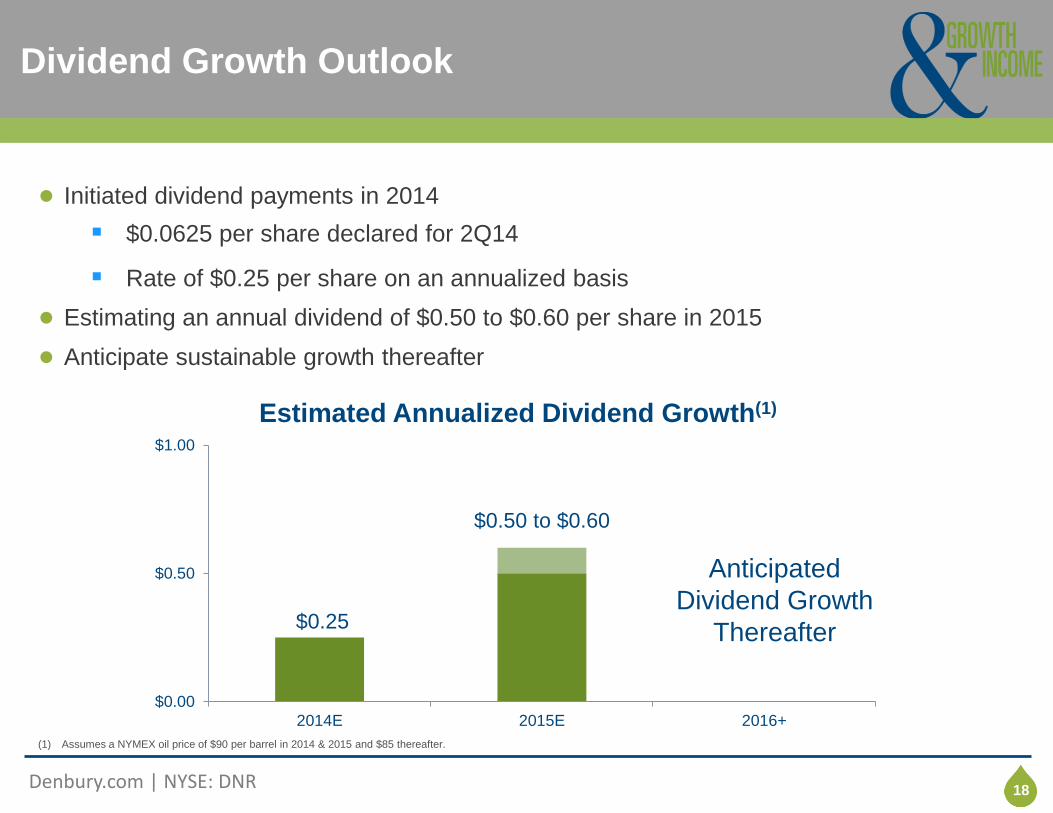
Click to edit title style Dividend Growth Outlook
18
● Initiated dividend payments in 2014
$0.0625 per share declared for 2Q14
Rate of $0.25 per share on an annualized basis
● Estimating an annual dividend of $0.50 to $0.60 per share in 2015
● Anticipate sustainable growth thereafter
$0.25
$0.50 to $0.60
$0.00
$0.50
$1.00
2014E 2015E 2016+
Estimated Annualized Dividend Growth(1)
Anticipated
Dividend Growth
Thereafter
(1) Assumes a NYMEX oil price of $90 per barrel in 2014 & 2015 and $85 thereafter.
Click to edit Master title style
Denbury.com | NYSE: DNR
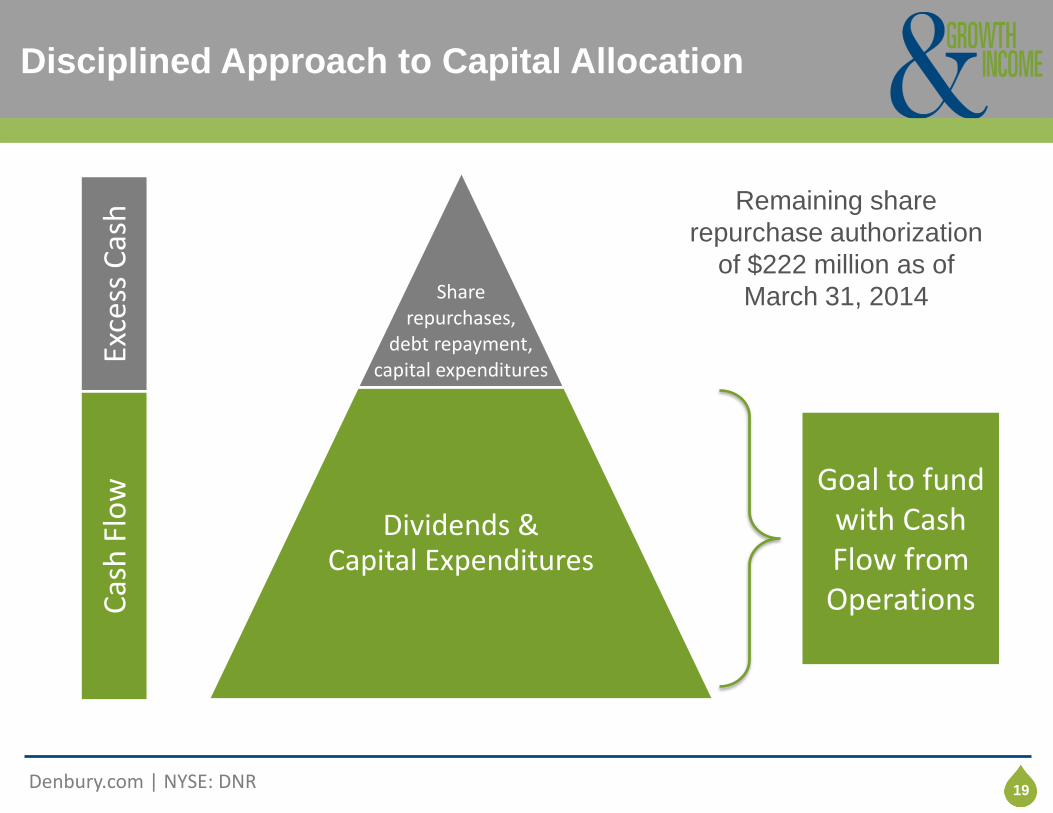
Click to edit title style Disciplined Approach to Capital Allocation
19
Share
repurchases, debt repayment,
capital expenditures
Dividends & Capital Expenditures
Cas
h F
low
Ex
cess
Cas
h
Goal to fund with Cash Flow from Operations
Remaining share
repurchase authorization
of $222 million as of
March 31, 2014
Click to edit Master title style
Denbury.com | NYSE: DNR
Click to edit title style
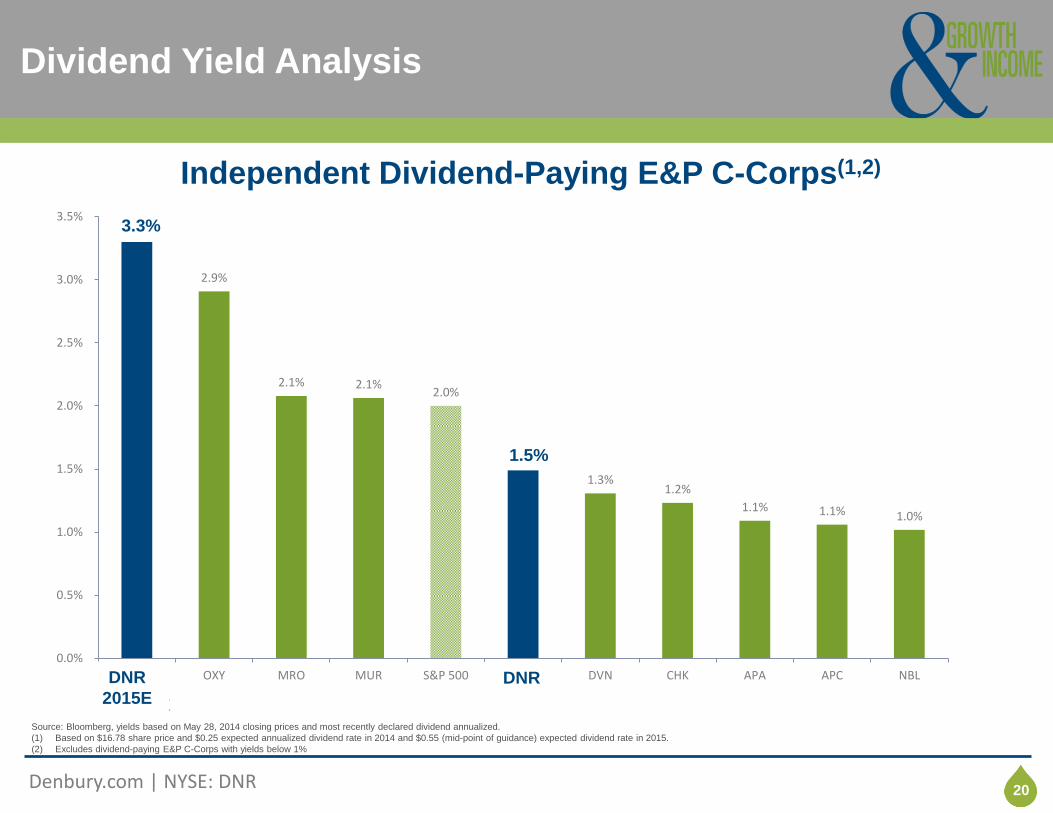
3.3%
2.9%
2.1% 2.1% 2.0%
1.5%
1.3% 1.2%
1.1% 1.1% 1.0%
0.0%
0.5%
1.0%
1.5%
2.0%
2.5%
3.0%
3.5%
DNR 2015 OXY MRO MUR S&P 500 DNR DVN CHK APA APC NBL
Dividend Yield Analysis
20
Independent Dividend-Paying E&P C-Corps(1,2)
Source: Bloomberg, yields based on May 28, 2014 closing prices and most recently declared dividend annualized.
(1) Based on $16.78 share price and $0.25 expected annualized dividend rate in 2014 and $0.55 (mid-point of guidance) expected dividend rate in 2015.
(2) Excludes dividend-paying E&P C-Corps with yields below 1%
DNR
2015E
1.5%
3.3%
DNR
2015E
DNR
Click to edit Master title style
Denbury.com | NYSE: DNR
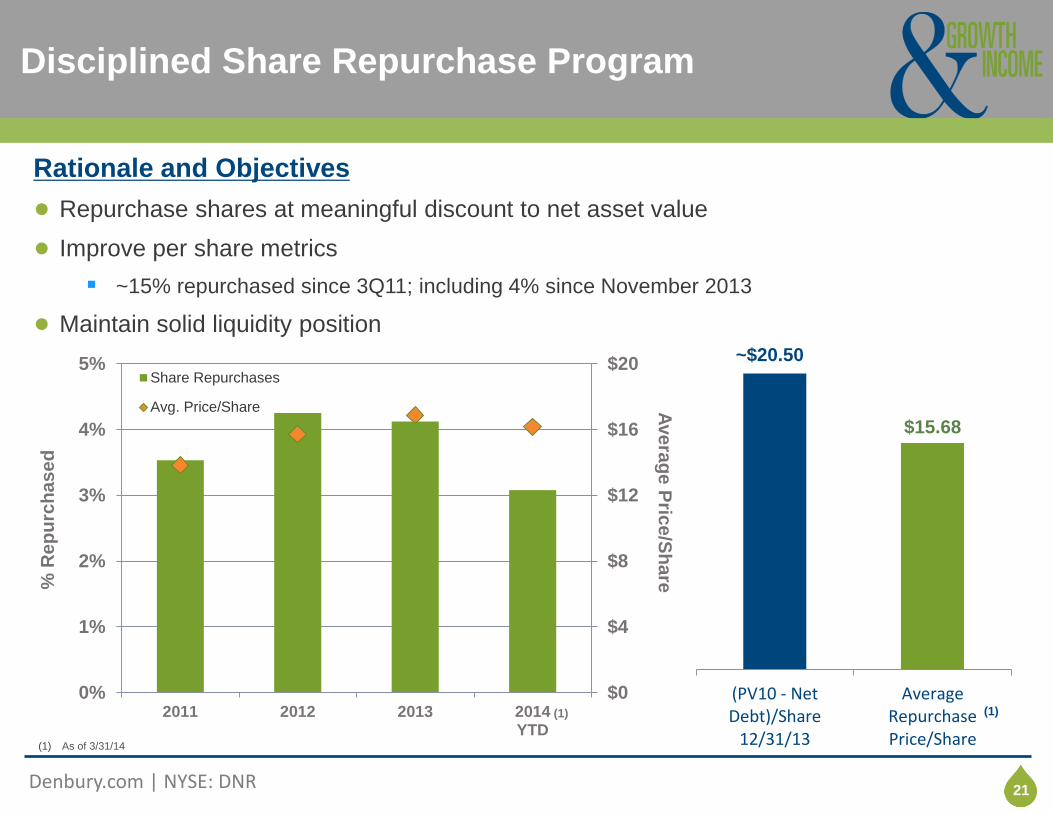
Click to edit title style Disciplined Share Repurchase Program
21
$15.68
(PV10 - NetDebt)/Share
12/31/13
AverageRepurchasePrice/Share
~$20.50
(1) As of 3/31/14
$0
$4
$8
$12
$16
$20
0%
1%
2%
3%
4%
5%
2011 2012 2013 2014YTD
Ave
rag
e P
rice
/Sh
are
% R
ep
urc
ha
se
d
Share Repurchases
Avg. Price/Share
(1) (1)
Rationale and Objectives
● Repurchase shares at meaningful discount to net asset value
● Improve per share metrics
~15% repurchased since 3Q11; including 4% since November 2013
● Maintain solid liquidity position
Click to edit Master title style
Denbury.com | NYSE: DNR
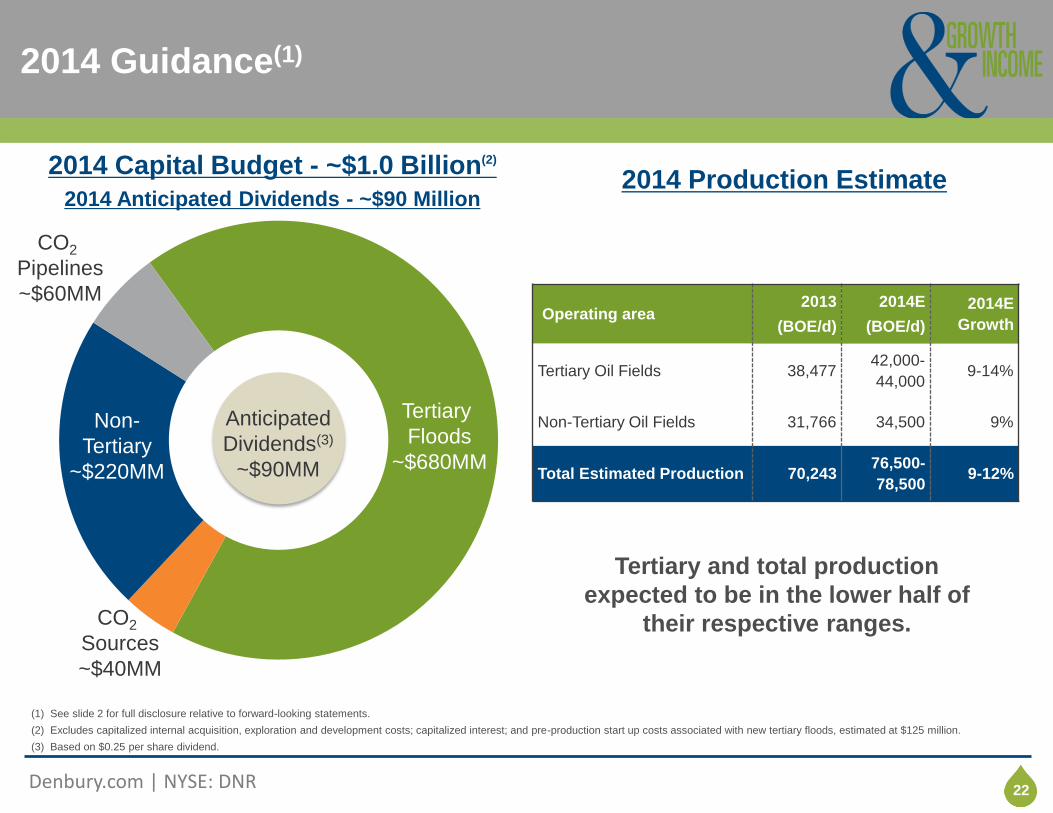
Click to edit title style 2014 Guidance(1)
22
Operating area 2013
(BOE/d)
2014E
(BOE/d)
2014E
Growth
Tertiary Oil Fields 38,477 42,000-
44,000 9-14%
Non-Tertiary Oil Fields 31,766 34,500 9%
Total Estimated Production 70,243 76,500-
78,500 9-12%
2014 Production Estimate
(1) See slide 2 for full disclosure relative to forward-looking statements.
(2) Excludes capitalized internal acquisition, exploration and development costs; capitalized interest; and pre-production start up costs associated with new tertiary floods, estimated at $125 million.
(3) Based on $0.25 per share dividend.
Tertiary
Floods
~$680MM
Non-
Tertiary
~$220MM
2014 Capital Budget - ~$1.0 Billion(2)
2014 Anticipated Dividends - ~$90 Million
CO2
Pipelines
~$60MM
CO2
Sources
~$40MM
Anticipated
Dividends(3)
~$90MM
Tertiary and total production
expected to be in the lower half of
their respective ranges.
Click to edit Master title style
Denbury.com | NYSE: DNR
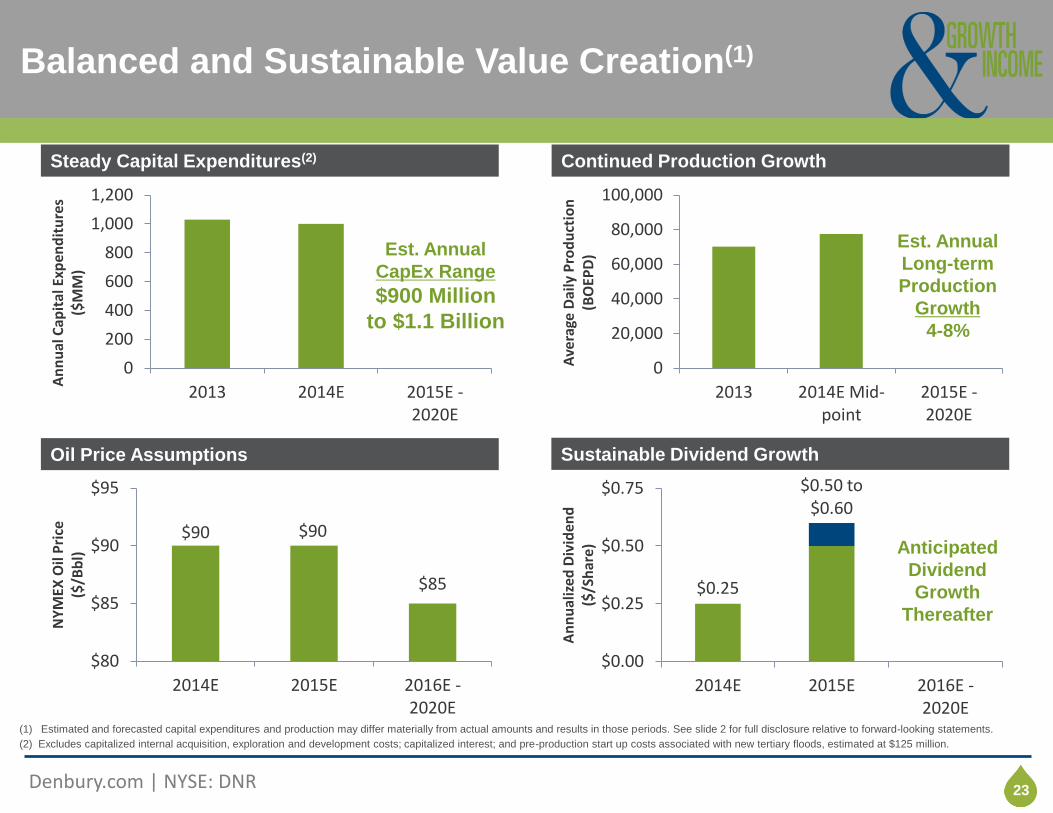
Click to edit title style Balanced and Sustainable Value Creation(1)
23
0
20,000
40,000
60,000
80,000
100,000
2013 2014E Mid-point
2015E -2020E
Ave
rage
Dai
ly P
rod
uct
ion
(B
OEP
D)
Continued Production Growth
Est. Annual
Long-term
Production
Growth
4-8%
0
200
400
600
800
1,000
1,200
2013 2014E 2015E -2020E
An
nu
al C
apit
al E
xpen
dit
ure
s ($
MM
)
Steady Capital Expenditures(2)
Est. Annual
CapEx Range
$900 Million
to $1.1 Billion
$0.25
$0.50 to $0.60
$0.00
$0.25
$0.50
$0.75
2014E 2015E 2016E -2020E
An
nu
aliz
ed D
ivid
end
($
/Sh
are)
Sustainable Dividend Growth
Anticipated
Dividend
Growth
Thereafter
(1) Estimated and forecasted capital expenditures and production may differ materially from actual amounts and results in those periods. See slide 2 for full disclosure relative to forward-looking statements.
(2) Excludes capitalized internal acquisition, exploration and development costs; capitalized interest; and pre-production start up costs associated with new tertiary floods, estimated at $125 million.
Oil Price Assumptions
$90 $90
$85
$80
$85
$90
$95
2014E 2015E 2016E -2020E
NY
MEX
Oil
Pri
ce
($/B
bl)
Click to edit Master title style
Denbury.com | NYSE: DNR
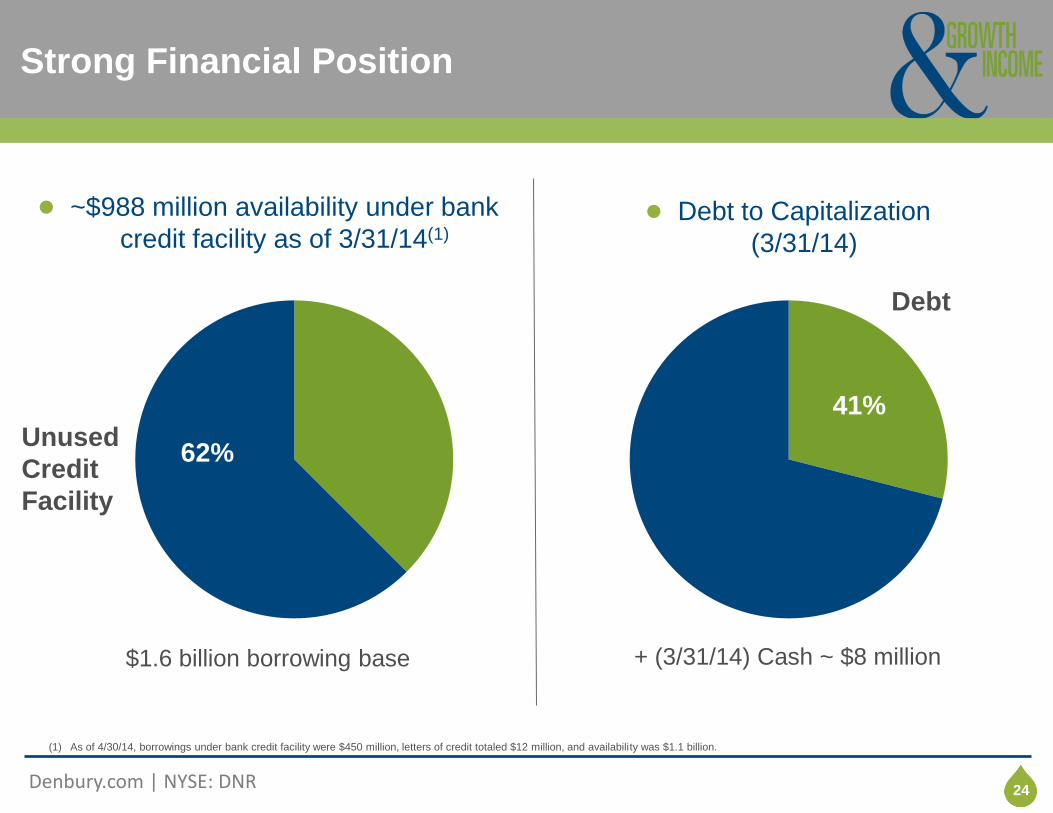
Click to edit title style Strong Financial Position
24
62%
● ~$988 million availability under bank
credit facility as of 3/31/14(1) ● Debt to Capitalization
(3/31/14)
38%
Debt
+ (3/31/14) Cash ~ $8 million
41%
(1) As of 4/30/14, borrowings under bank credit facility were $450 million, letters of credit totaled $12 million, and availability was $1.1 billion.
$1.6 billion borrowing base
Unused
Credit
Facility
Click to edit Master title style
Denbury.com | NYSE: DNR
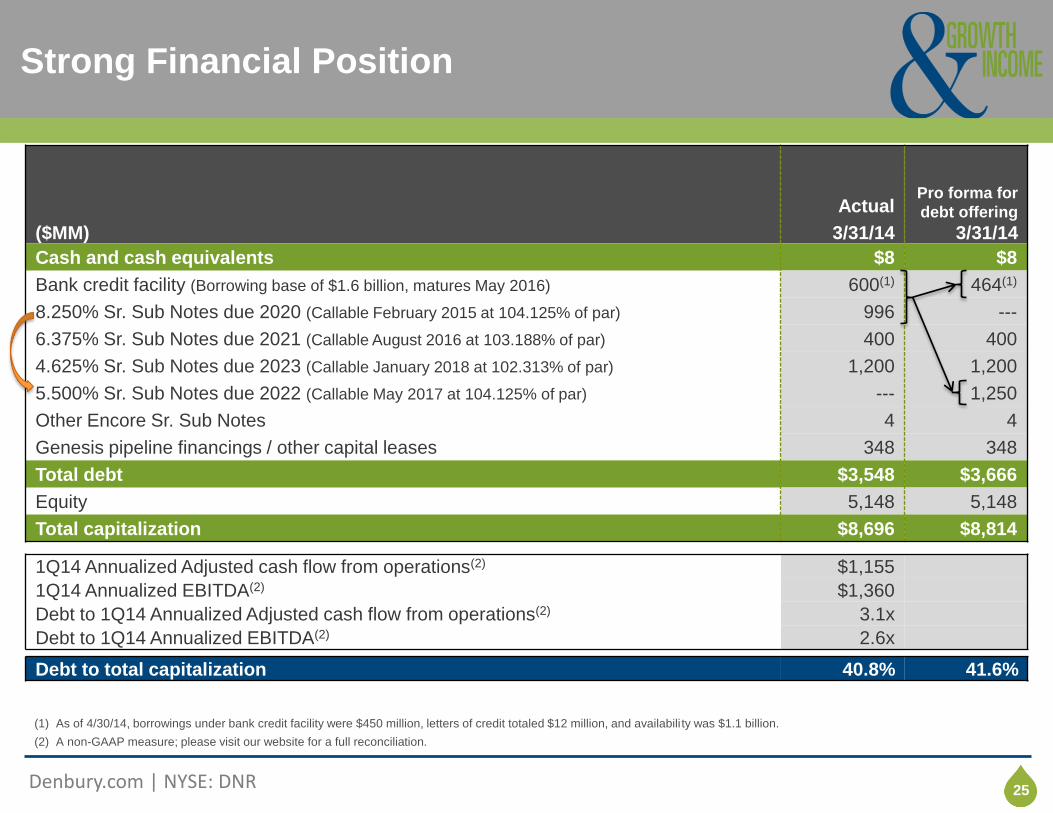
Click to edit title style Strong Financial Position
25
($MM)
Actual
3/31/14
Pro forma for
debt offering
3/31/14
Cash and cash equivalents $8 $8
Bank credit facility (Borrowing base of $1.6 billion, matures May 2016) 600(1) 464(1)
8.250% Sr. Sub Notes due 2020 (Callable February 2015 at 104.125% of par) 996 ---
6.375% Sr. Sub Notes due 2021 (Callable August 2016 at 103.188% of par) 400 400
4.625% Sr. Sub Notes due 2023 (Callable January 2018 at 102.313% of par) 1,200 1,200
5.500% Sr. Sub Notes due 2022 (Callable May 2017 at 104.125% of par) --- 1,250
Other Encore Sr. Sub Notes 4 4
Genesis pipeline financings / other capital leases 348 348
Total debt $3,548 $3,666
Equity 5,148 5,148
Total capitalization $8,696 $8,814
1Q14 Annualized Adjusted cash flow from operations(2) $1,155
1Q14 Annualized EBITDA(2) $1,360
Debt to 1Q14 Annualized Adjusted cash flow from operations(2) 3.1x
Debt to 1Q14 Annualized EBITDA(2) 2.6x
Debt to total capitalization 40.8% 41.6%
(1) As of 4/30/14, borrowings under bank credit facility were $450 million, letters of credit totaled $12 million, and availabili ty was $1.1 billion.
(2) A non-GAAP measure; please visit our website for a full reconciliation.
Click to edit Master title style
Denbury.com | NYSE: DNR
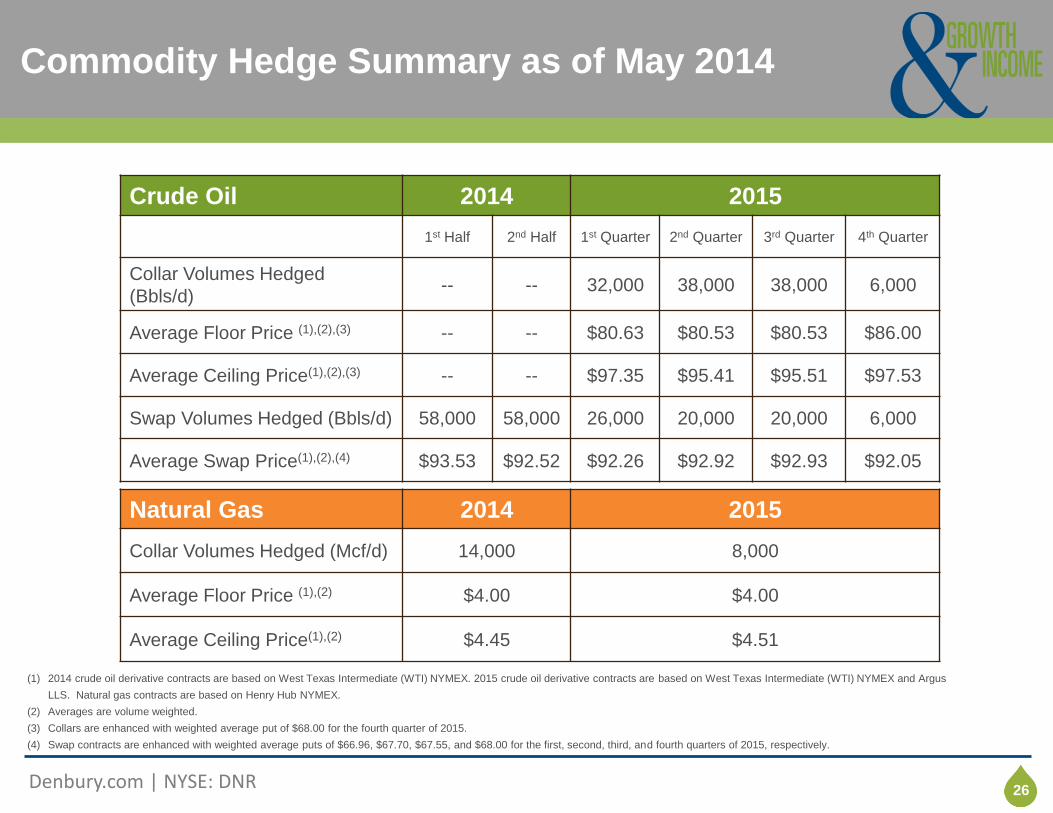
Click to edit title style Commodity Hedge Summary as of May 2014
26
Natural Gas 2014 2015
Collar Volumes Hedged (Mcf/d) 14,000 8,000
Average Floor Price (1),(2) $4.00 $4.00
Average Ceiling Price(1),(2) $4.45 $4.51
Crude Oil 2014 2015
1st Half 2nd Half 1st Quarter 2nd Quarter 3rd Quarter 4th Quarter
Collar Volumes Hedged
(Bbls/d) -- -- 32,000 38,000 38,000 6,000
Average Floor Price (1),(2),(3) -- -- $80.63 $80.53 $80.53 $86.00
Average Ceiling Price(1),(2),(3) -- -- $97.35 $95.41 $95.51 $97.53
Swap Volumes Hedged (Bbls/d) 58,000 58,000 26,000 20,000 20,000 6,000
Average Swap Price(1),(2),(4) $93.53 $92.52 $92.26 $92.92 $92.93 $92.05
(1) 2014 crude oil derivative contracts are based on West Texas Intermediate (WTI) NYMEX. 2015 crude oil derivative contracts are based on West Texas Intermediate (WTI) NYMEX and Argus
LLS. Natural gas contracts are based on Henry Hub NYMEX.
(2) Averages are volume weighted.
(3) Collars are enhanced with weighted average put of $68.00 for the fourth quarter of 2015.
(4) Swap contracts are enhanced with weighted average puts of $66.96, $67.70, $67.55, and $68.00 for the first, second, third, and fourth quarters of 2015, respectively.
Click to edit Master title style
Denbury.com | NYSE: DNR
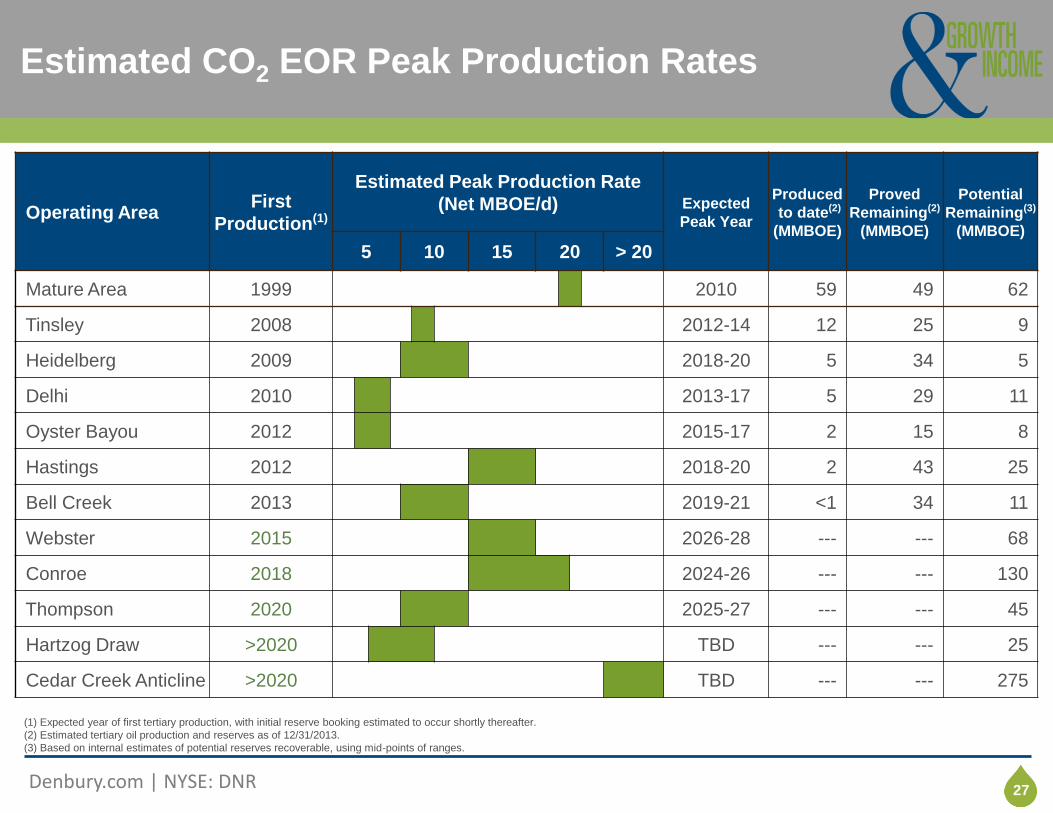
Click to edit title style Estimated CO2 EOR Peak Production Rates
27
Operating Area First
Production(1)
Estimated Peak Production Rate
(Net MBOE/d) Expected
Peak Year
Produced
to date(2)
(MMBOE)
Proved
Remaining(2)
(MMBOE)
Potential
Remaining(3)
(MMBOE)
5 10 15 20 > 20
Mature Area 1999 2010 59 49 62
Tinsley 2008 2012-14 12 25 9
Heidelberg 2009 2018-20 5 34 5
Delhi 2010 2013-17 5 29 11
Oyster Bayou 2012 2015-17 2 15 8
Hastings 2012 2018-20 2 43 25
Bell Creek 2013 2019-21 <1 34 11
Webster 2015 2026-28 --- --- 68
Conroe 2018 2024-26 --- --- 130
Thompson 2020 2025-27 --- --- 45
Hartzog Draw >2020 TBD --- --- 25
Cedar Creek Anticline >2020 TBD --- --- 275
(1) Expected year of first tertiary production, with initial reserve booking estimated to occur shortly thereafter.
(2) Estimated tertiary oil production and reserves as of 12/31/2013.
(3) Based on internal estimates of potential reserves recoverable, using mid-points of ranges.
Click to edit Master title style
Denbury.com | NYSE: DNR
Click to edit title style IN SUMMARY: Value Driven
28
● Focused on delivering value through consistent growth in production,
reserves, and dividends
● Strategic advantage in CO2 EOR supports lower-risk, long-term growth
outlook and substantial free cash flow generation
● High operating margin and capital efficiency
● Funding capex and dividends with cash flow, strong oil hedging
program and disciplined share repurchase program
Leading Growth & Income, CO2 EOR Company in the US
Click to edit Master title style
Denbury.com | NYSE: DNR
Click to edit title style Corporate Information
29
Corporate Headquarters
Denbury Resources Inc.
5320 Legacy Drive
Plano, Texas 75024
Ph: (972) 673-2000
denbury.com
Contact Information Jack Collins
Executive Director, Finance and Investor Relations
(972) 673-2028
Ross Campbell
Manager, Investor Relations
(972) 673-2825
Lauren Power
Financial Analyst, Investor Relations
(972) 673-2433

Appendix
Click to edit Master title style
Denbury.com | NYSE: DNR
Click to edit title style Why is CO2 EOR our core focus?
31
● High Confidence of Oil Target
Over 100 million barrels (gross) produced by Denbury to date
Net upward adjustments to reserves to date
● CO2 Flooding Recovers Oil (CO2 ♥’s Crude Oil)
First commercial CO2 EOR flood started production in 1972
Over 1.5 billion barrels produced to date in the US(1)
Current estimated production in the US is >280 MBbls/d(2)
● A Very Repeatable Process with a lot of Running Room
Up to 10 Billion Barrels Recoverable with CO2 EOR in our two operating areas(3)
Over 900 Million Barrels (net) of 3P CO2 EOR reserves in our portfolio today
(1) Oil & Gas Journal, Dec. 7, 2009.
(2) Oil & Gas Journal, July 2, 2012.
(3) Source: DOE 2005 and 2006 reports.
Click to edit Master title style
Denbury.com | NYSE: DNR
Click to edit title style CO2 EOR is a Proven Process
32
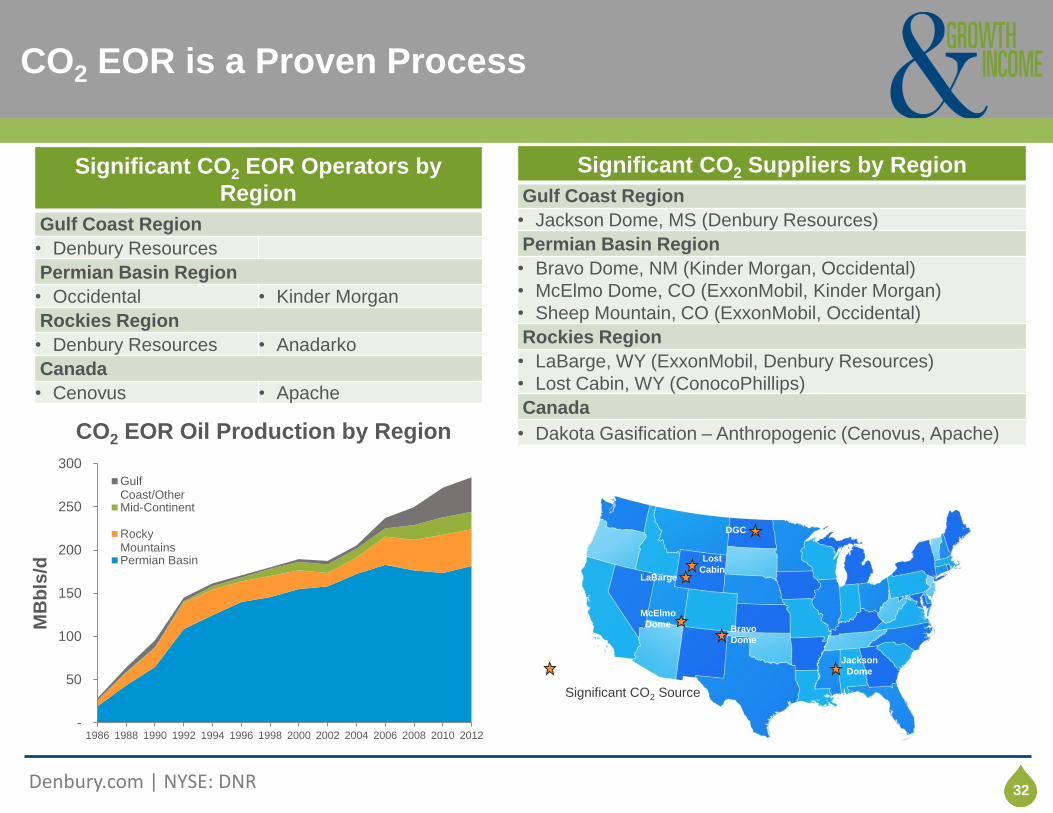
Significant CO2 Suppliers by Region
Gulf Coast Region
• Jackson Dome, MS (Denbury Resources)
Permian Basin Region
• Bravo Dome, NM (Kinder Morgan, Occidental)
• McElmo Dome, CO (ExxonMobil, Kinder Morgan)
• Sheep Mountain, CO (ExxonMobil, Occidental)
Rockies Region
• LaBarge, WY (ExxonMobil, Denbury Resources)
• Lost Cabin, WY (ConocoPhillips)
Canada
• Dakota Gasification – Anthropogenic (Cenovus, Apache)
Significant CO2 EOR Operators by
Region
Gulf Coast Region
• Denbury Resources
Permian Basin Region
• Occidental • Kinder Morgan
Rockies Region
• Denbury Resources • Anadarko
Canada
• Cenovus • Apache
Jackson
Dome
Bravo
Dome
LaBarge
Lost
Cabin
DGC
McElmo
Dome
Significant CO2 Source
-
50
100
150
200
250
300
1986 1988 1990 1992 1994 1996 1998 2000 2002 2004 2006 2008 2010 2012
MB
bls
/d
CO2 EOR Oil Production by Region
GulfCoast/OtherMid-Continent
RockyMountainsPermian Basin

Click to edit Master title style
Denbury.com | NYSE: DNR
Click to edit title style CO2 Operations: Oil Recovery Process
33
CO2 PIPELINE - from Jackson Dome
CO2 moves through formation mixing with oil droplets, expanding them and moving them to producing wells.
INJECTION WELL - Injects
CO2 in dense phase
PRODUCTION WELLS
Produce oil, water and CO2 (CO2 is recycled)
Model for Oil Recovery Using CO2 is +/- 17%
of Original Oil in Place (Based on Little Creek)
Primary recovery = +/- 20%
Secondary recovery (waterfloods) = +/- 18%
Tertiary (CO2) = +/- 17%
Oil Formation
Click to edit Master title style
Denbury.com | NYSE: DNR
Click to edit title style CO2 EOR – Superior Production Profile
34
0
2,000
4,000
6,000
8,000
10,000
12,000
1 2 3 4 5 6 7 8 9 10 11 12 13 14 15 16 17 18
Pro
du
ctio
n (B
bls
/d)
Years
Gulf Coast EOR Field
Bakken
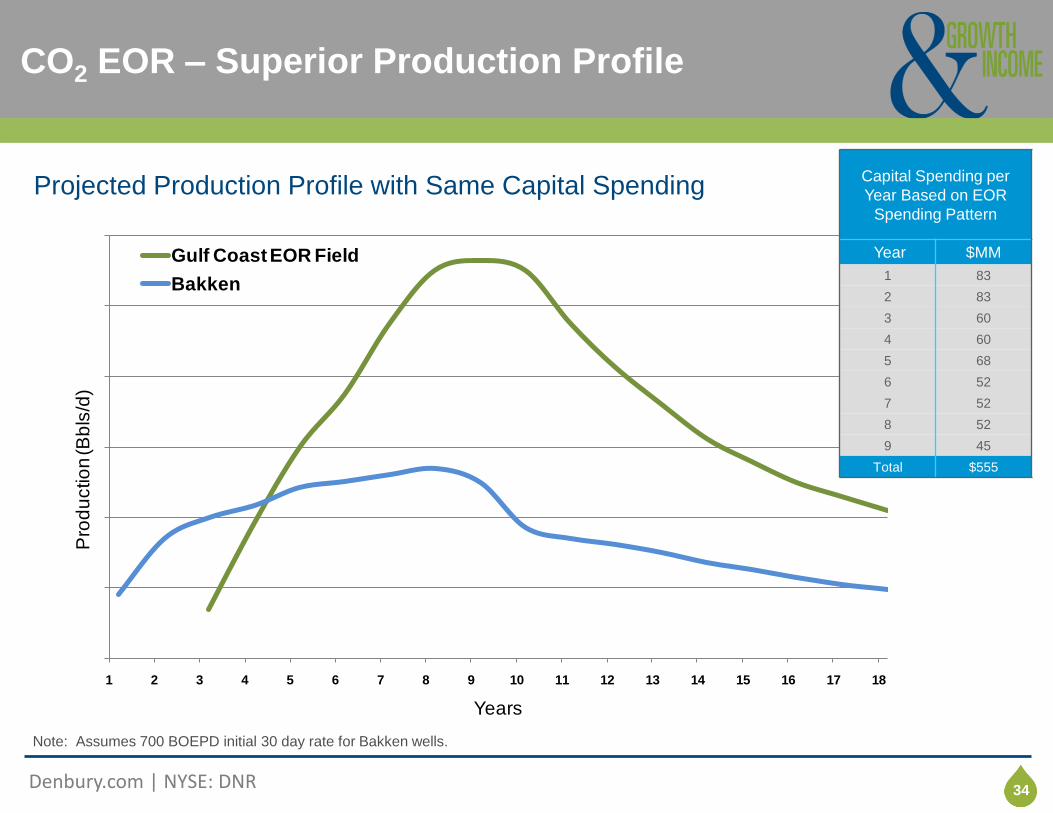
Projected Production Profile with Same Capital Spending Capital Spending per
Year Based on EOR
Spending Pattern
Year $MM
1 83
2 83
3 60
4 60
5 68
6 52
7 52
8 52
9 45
Total $555
Note: Assumes 700 BOEPD initial 30 day rate for Bakken wells.
Click to edit Master title style
Denbury.com | NYSE: DNR
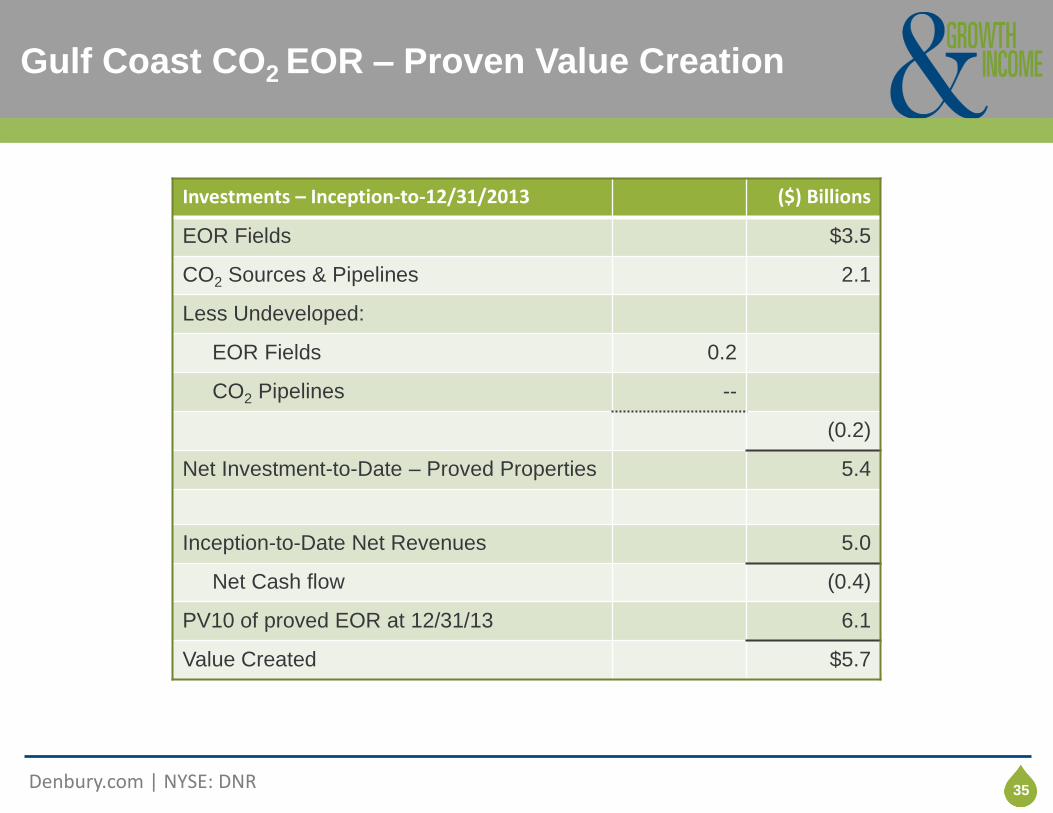
Click to edit title style Gulf Coast CO2 EOR – Proven Value Creation
35
Investments – Inception-to-12/31/2013 ($) Billions
EOR Fields $3.5
CO2 Sources & Pipelines 2.1
Less Undeveloped:
EOR Fields 0.2
CO2 Pipelines --
(0.2)
Net Investment-to-Date – Proved Properties 5.4
Inception-to-Date Net Revenues 5.0
Net Cash flow (0.4)
PV10 of proved EOR at 12/31/13 6.1
Value Created $5.7
Click to edit Master title style
Denbury.com | NYSE: DNR
Click to edit title style
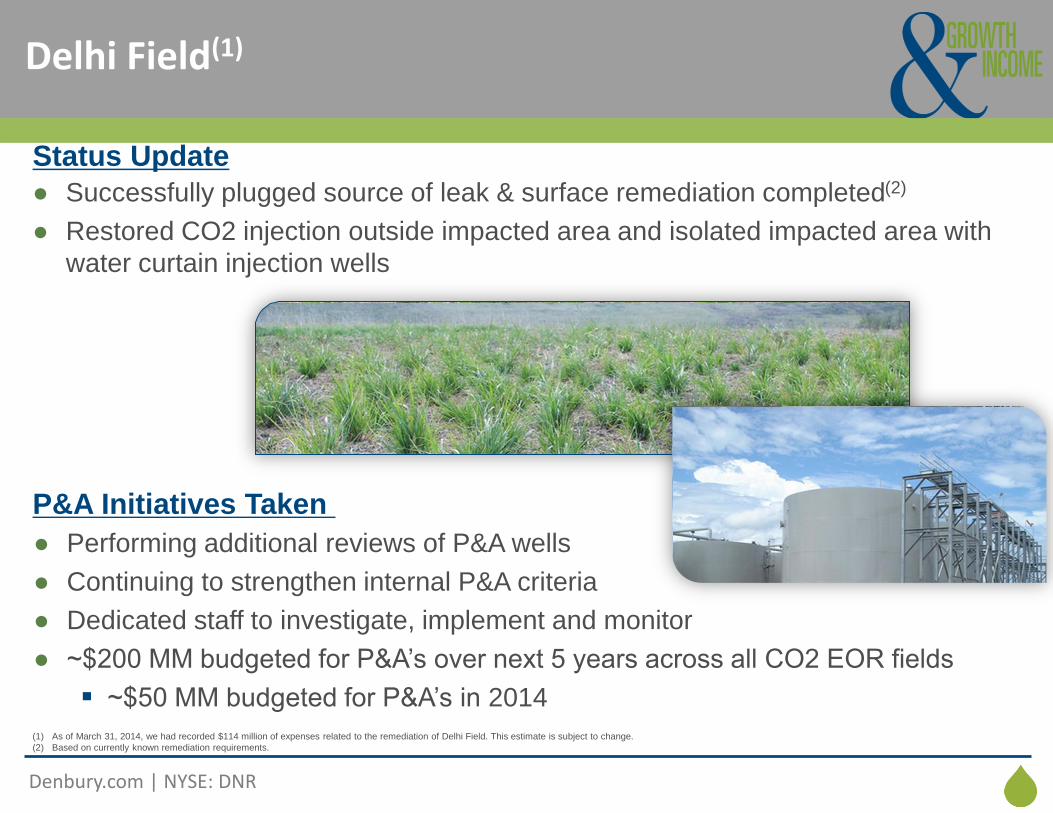
● Successfully plugged source of leak & surface remediation completed(2)
● Restored CO2 injection outside impacted area and isolated impacted area with
water curtain injection wells
(1) As of March 31, 2014, we had recorded $114 million of expenses related to the remediation of Delhi Field. This estimate is subject to change.
(2) Based on currently known remediation requirements.
Status Update
● Performing additional reviews of P&A wells
● Continuing to strengthen internal P&A criteria
● Dedicated staff to investigate, implement and monitor
● ~$200 MM budgeted for P&A’s over next 5 years across all CO2 EOR fields
~$50 MM budgeted for P&A’s in 2014
P&A Initiatives Taken
Delhi Field(1)
Click to edit Master title style
Denbury.com | NYSE: DNR
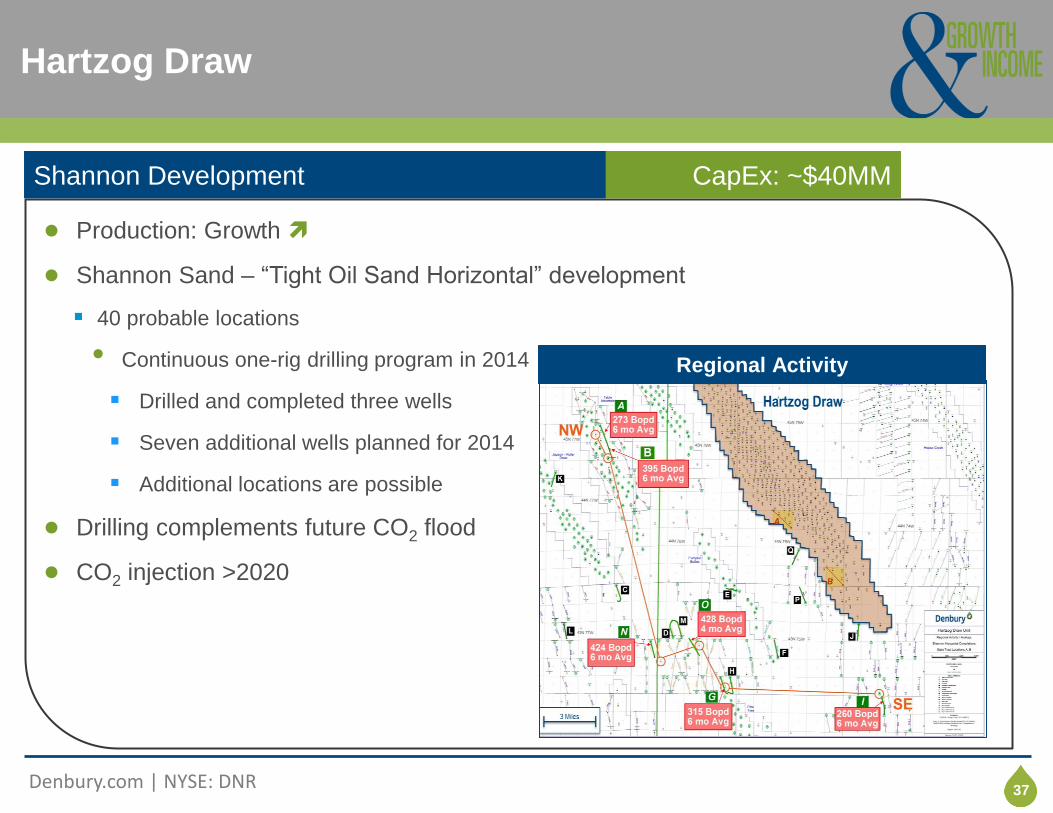
Click to edit title style Hartzog Draw
37
● Production: Growth
● Shannon Sand – “Tight Oil Sand Horizontal” development
40 probable locations
• Continuous one-rig drilling program in 2014
Drilled and completed three wells
Seven additional wells planned for 2014
Additional locations are possible
● Drilling complements future CO2 flood
● CO2 injection >2020
Shannon Development CapEx: ~$40MM
Regional Activity
Click to edit Master title style
Denbury.com | NYSE: DNR
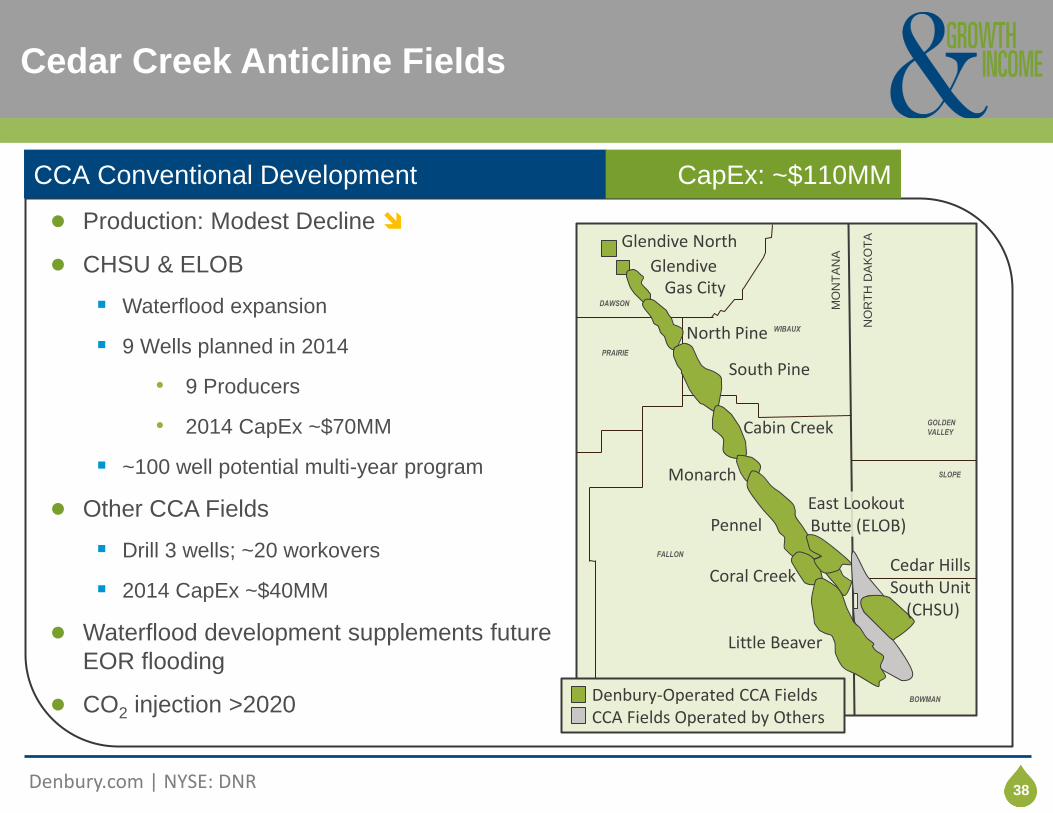
Click to edit title style Cedar Creek Anticline Fields
38
MO
NT
AN
A
NO
RT
H D
AK
OT
A
DAWSON
PRAIRIE
WIBAUX
GOLDEN
VALLEY
FALLON
SLOPE
BOWMAN
Glendive North
Glendive Gas City
North Pine
South Pine
Cabin Creek
Monarch
Pennel
Coral Creek
Little Beaver
East Lookout Butte (ELOB)
Denbury-Operated CCA Fields CCA Fields Operated by Others
Cedar Hills South Unit
(CHSU)
● Production: Modest Decline
● CHSU & ELOB
Waterflood expansion
9 Wells planned in 2014
• 9 Producers
• 2014 CapEx ~$70MM
~100 well potential multi-year program
● Other CCA Fields
Drill 3 wells; ~20 workovers
2014 CapEx ~$40MM
● Waterflood development supplements future
EOR flooding
● CO2 injection >2020
CCA Conventional Development CapEx: ~$110MM
Click to edit Master title style
Denbury.com | NYSE: DNR
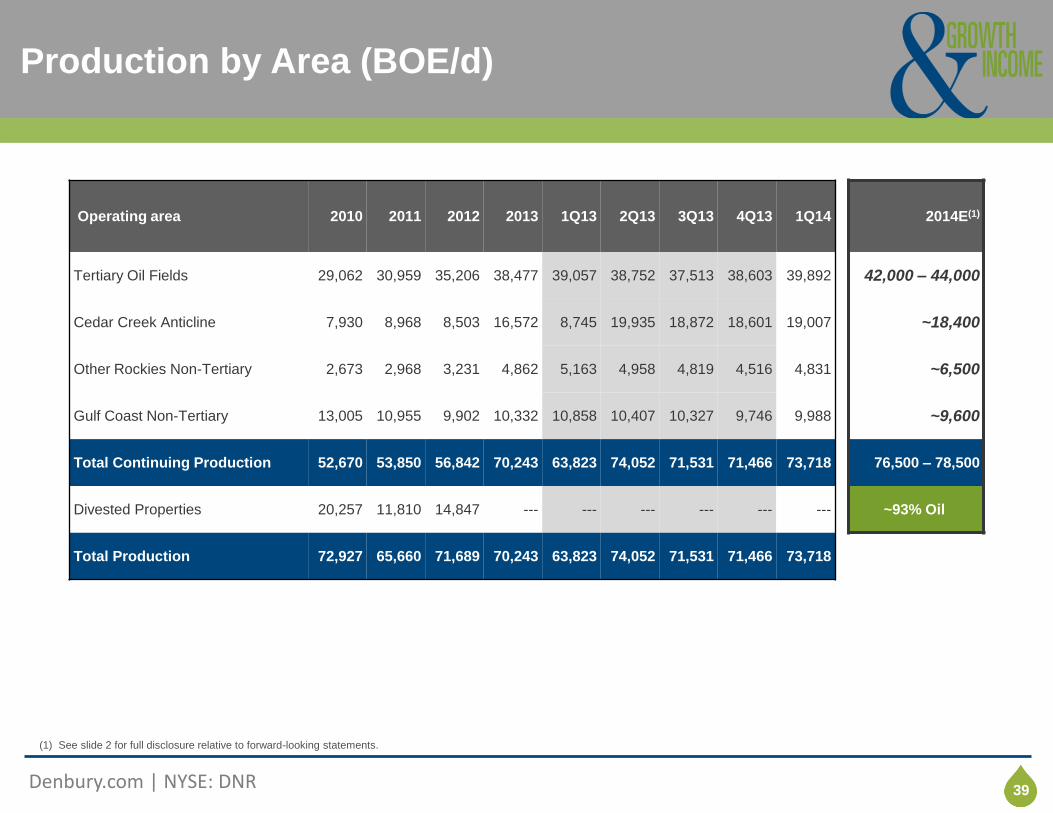
Click to edit title style Production by Area (BOE/d)
39
(1) See slide 2 for full disclosure relative to forward-looking statements.
Operating area 2010 2011 2012 2013 1Q13 2Q13 3Q13 4Q13 1Q14 2014E(1)
Tertiary Oil Fields 29,062 30,959 35,206 38,477 39,057 38,752 37,513 38,603 39,892 42,000 – 44,000
Cedar Creek Anticline 7,930 8,968 8,503 16,572 8,745 19,935 18,872 18,601 19,007 ~18,400
Other Rockies Non-Tertiary 2,673 2,968 3,231 4,862 5,163 4,958 4,819 4,516 4,831 ~6,500
Gulf Coast Non-Tertiary 13,005 10,955 9,902 10,332 10,858 10,407 10,327 9,746 9,988 ~9,600
Total Continuing Production 52,670 53,850 56,842 70,243 63,823 74,052 71,531 71,466 73,718 76,500 – 78,500
Divested Properties 20,257 11,810 14,847 --- --- --- --- --- --- ~93% Oil
Total Production 72,927 65,660 71,689 70,243 63,823 74,052 71,531 71,466 73,718
Click to edit Master title style
Denbury.com | NYSE: DNR
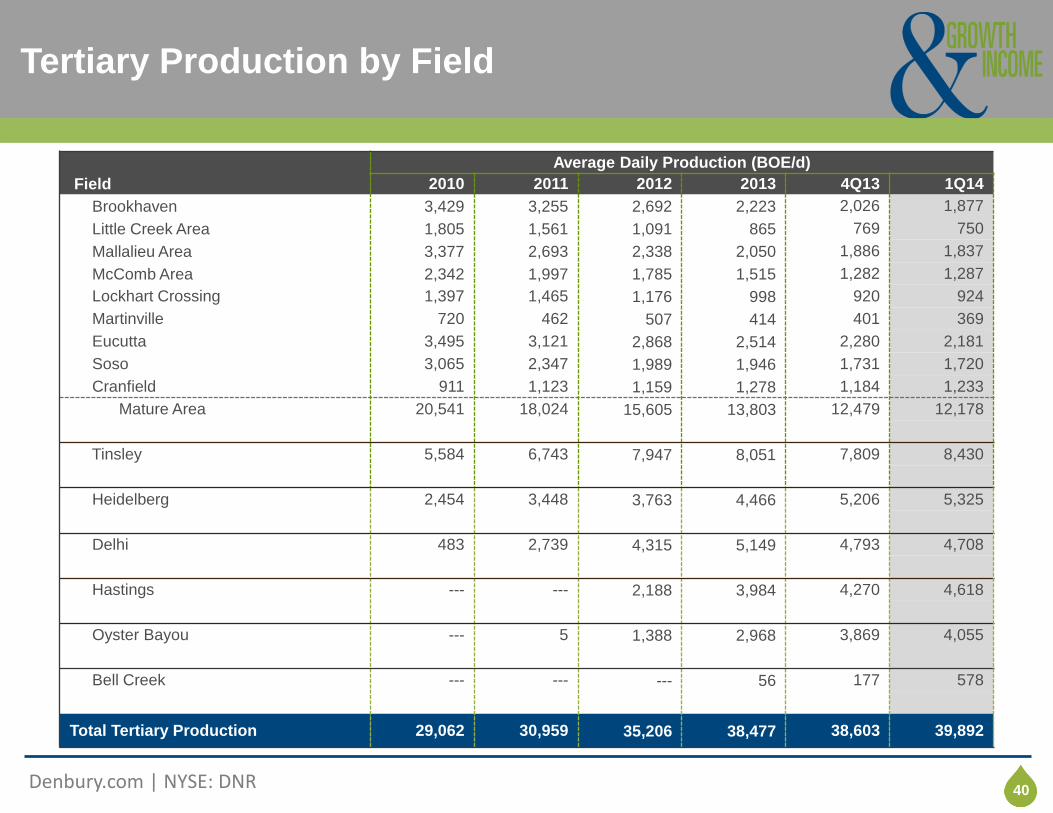
Click to edit title style Tertiary Production by Field
40
Average Daily Production (BOE/d)
Field 2010 2011 2012 2013 4Q13 1Q14
Brookhaven 3,429 3,255 2,692 2,223 2,026 1,877
Little Creek Area 1,805 1,561 1,091 865 769 750
Mallalieu Area 3,377 2,693 2,338 2,050 1,886 1,837
McComb Area 2,342 1,997 1,785 1,515 1,282 1,287
Lockhart Crossing 1,397 1,465 1,176 998 920 924
Martinville 720 462 507 414 401 369
Eucutta 3,495 3,121 2,868 2,514 2,280 2,181
Soso 3,065 2,347 1,989 1,946 1,731 1,720
Cranfield 911 1,123 1,159 1,278 1,184 1,233
Mature Area 20,541 18,024 15,605 13,803 12,479 12,178
Tinsley 5,584 6,743 7,947 8,051 7,809 8,430
Heidelberg 2,454 3,448 3,763 4,466 5,206 5,325
Delhi 483 2,739 4,315 5,149 4,793 4,708
Hastings --- --- 2,188 3,984 4,270 4,618
Oyster Bayou --- 5 1,388 2,968 3,869 4,055
Bell Creek --- --- --- 56 177 578
Total Tertiary Production 29,062 30,959 35,206 38,477 38,603 39,892
Click to edit Master title style
Denbury.com | NYSE: DNR
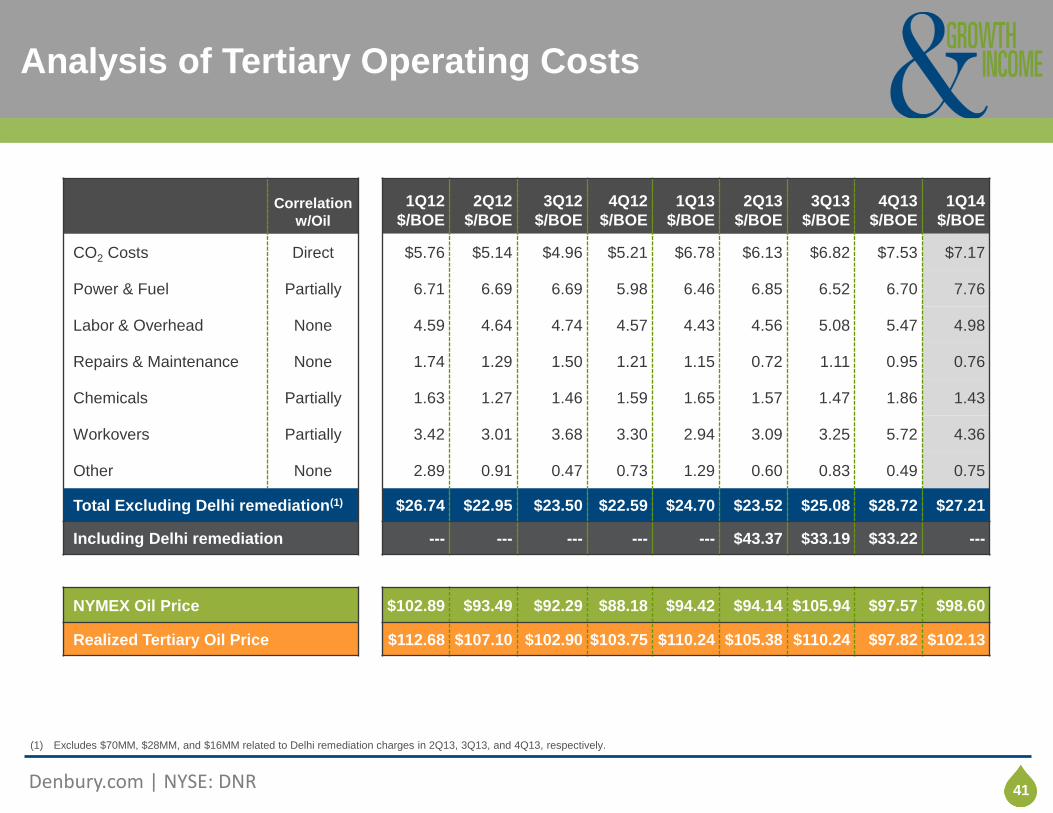
Click to edit title style Analysis of Tertiary Operating Costs
41
Correlation
w/Oil
1Q12
$/BOE
2Q12
$/BOE
3Q12
$/BOE
4Q12
$/BOE
1Q13
$/BOE
2Q13
$/BOE
3Q13
$/BOE
4Q13
$/BOE
1Q14
$/BOE
CO2 Costs Direct $5.76 $5.14 $4.96 $5.21 $6.78 $6.13 $6.82 $7.53 $7.17
Power & Fuel Partially 6.71 6.69 6.69 5.98 6.46 6.85 6.52 6.70 7.76
Labor & Overhead None 4.59 4.64 4.74 4.57 4.43 4.56 5.08 5.47 4.98
Repairs & Maintenance None 1.74 1.29 1.50 1.21 1.15 0.72 1.11 0.95 0.76
Chemicals Partially 1.63 1.27 1.46 1.59 1.65 1.57 1.47 1.86 1.43
Workovers Partially 3.42 3.01 3.68 3.30 2.94 3.09 3.25 5.72 4.36
Other None 2.89 0.91 0.47 0.73 1.29 0.60 0.83 0.49 0.75
Total Excluding Delhi remediation(1) $26.74 $22.95 $23.50 $22.59 $24.70 $23.52 $25.08 $28.72 $27.21
Including Delhi remediation --- --- --- --- --- $43.37 $33.19 $33.22 ---
NYMEX Oil Price $102.89 $93.49 $92.29 $88.18 $94.42 $94.14 $105.94 $97.57 $98.60
Realized Tertiary Oil Price $112.68 $107.10 $102.90 $103.75 $110.24 $105.38 $110.24 $97.82 $102.13
(1) Excludes $70MM, $28MM, and $16MM related to Delhi remediation charges in 2Q13, 3Q13, and 4Q13, respectively.
Click to edit Master title style
Denbury.com | NYSE: DNR
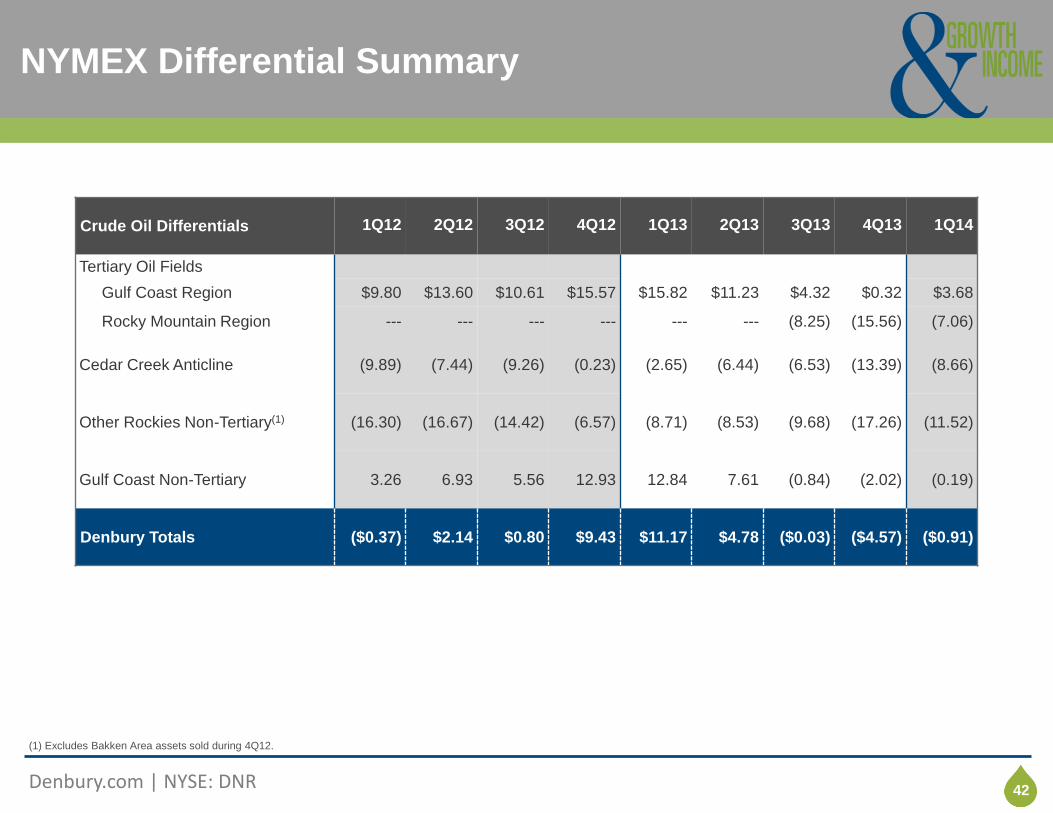
Click to edit title style NYMEX Differential Summary
42
(1) Excludes Bakken Area assets sold during 4Q12.
Crude Oil Differentials 1Q12 2Q12 3Q12 4Q12 1Q13 2Q13 3Q13 4Q13 1Q14
Tertiary Oil Fields
Gulf Coast Region $9.80 $13.60 $10.61 $15.57 $15.82 $11.23 $4.32 $0.32 $3.68
Rocky Mountain Region --- --- --- --- --- --- (8.25) (15.56) (7.06)
Cedar Creek Anticline (9.89) (7.44) (9.26) (0.23) (2.65) (6.44) (6.53) (13.39) (8.66)
Other Rockies Non-Tertiary(1) (16.30) (16.67) (14.42) (6.57) (8.71) (8.53) (9.68) (17.26) (11.52)
Gulf Coast Non-Tertiary 3.26 6.93 5.56 12.93 12.84 7.61 (0.84) (2.02) (0.19)
Denbury Totals ($0.37) $2.14 $0.80 $9.43 $11.17 $4.78 ($0.03) ($4.57) ($0.91)
Click to edit Master title style
Denbury.com | NYSE: DNR
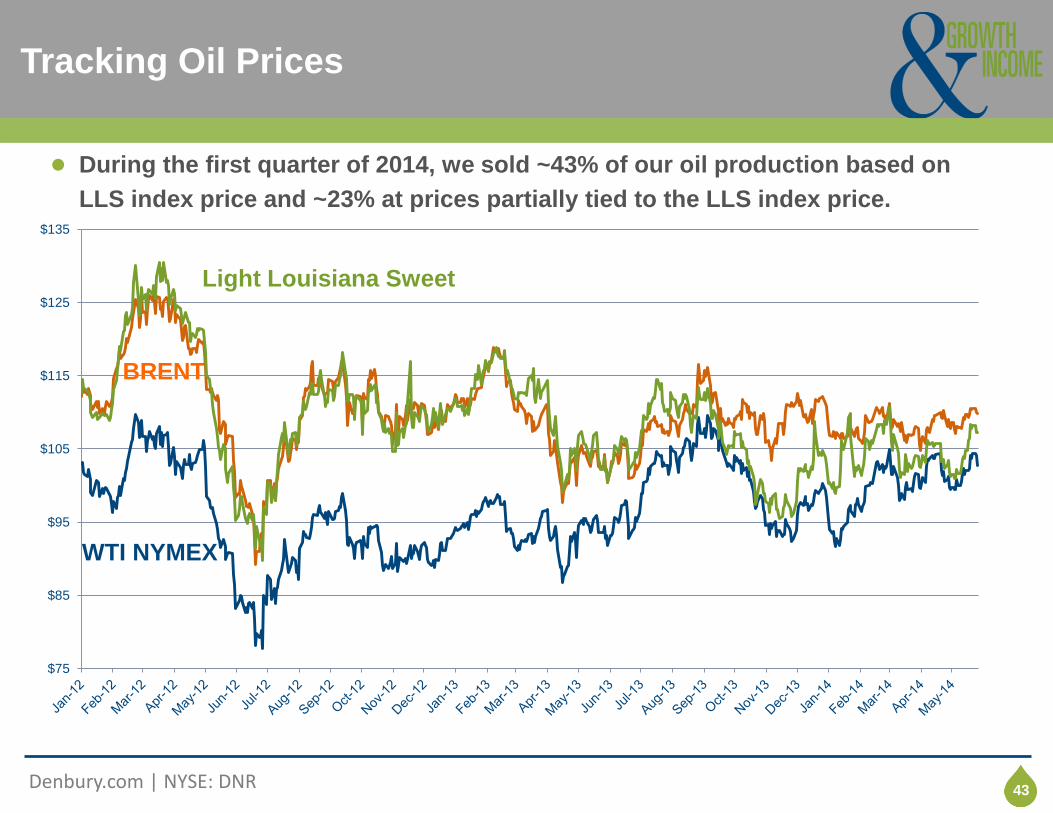
Click to edit title style Tracking Oil Prices
43
Light Louisiana Sweet
WTI NYMEX
BRENT
● During the first quarter of 2014, we sold ~43% of our oil production based on
LLS index price and ~23% at prices partially tied to the LLS index price.
$75
$85
$95
$105
$115
$125
$135
Click to edit Master title style
Denbury.com | NYSE: DNR
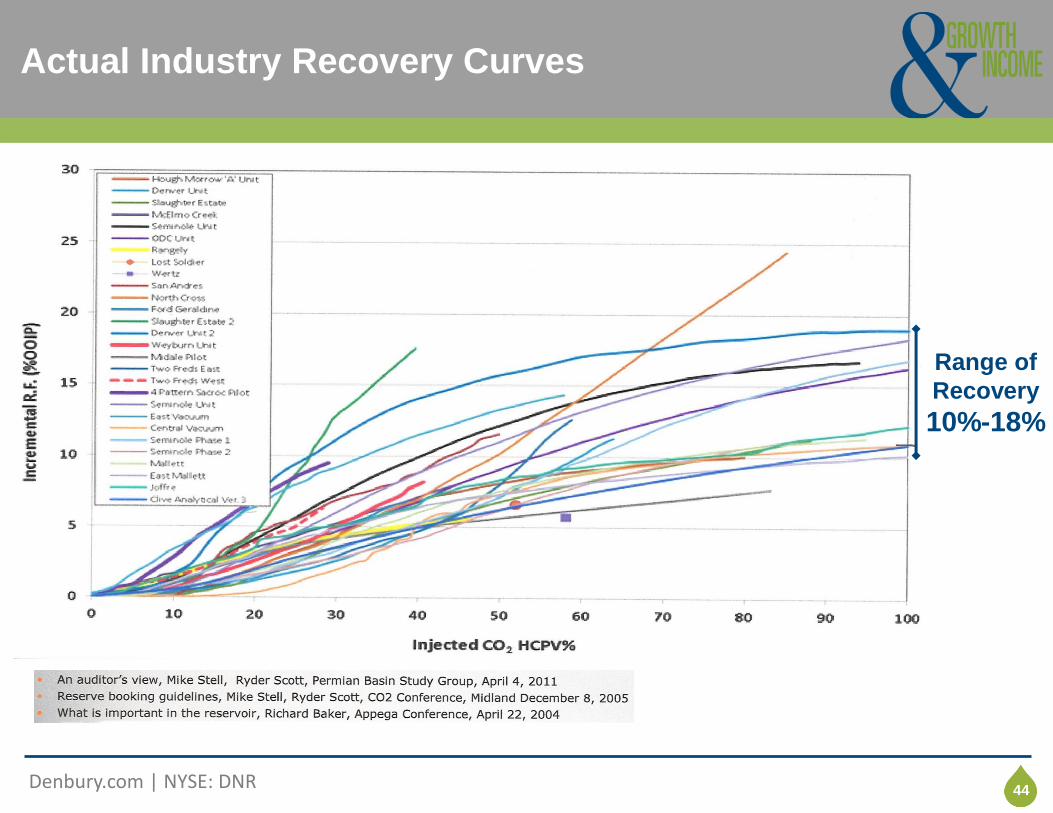
Click to edit title style Actual Industry Recovery Curves
44
Range of
Recovery
10%-18%
Click to edit Master title style
Denbury.com | NYSE: DNR
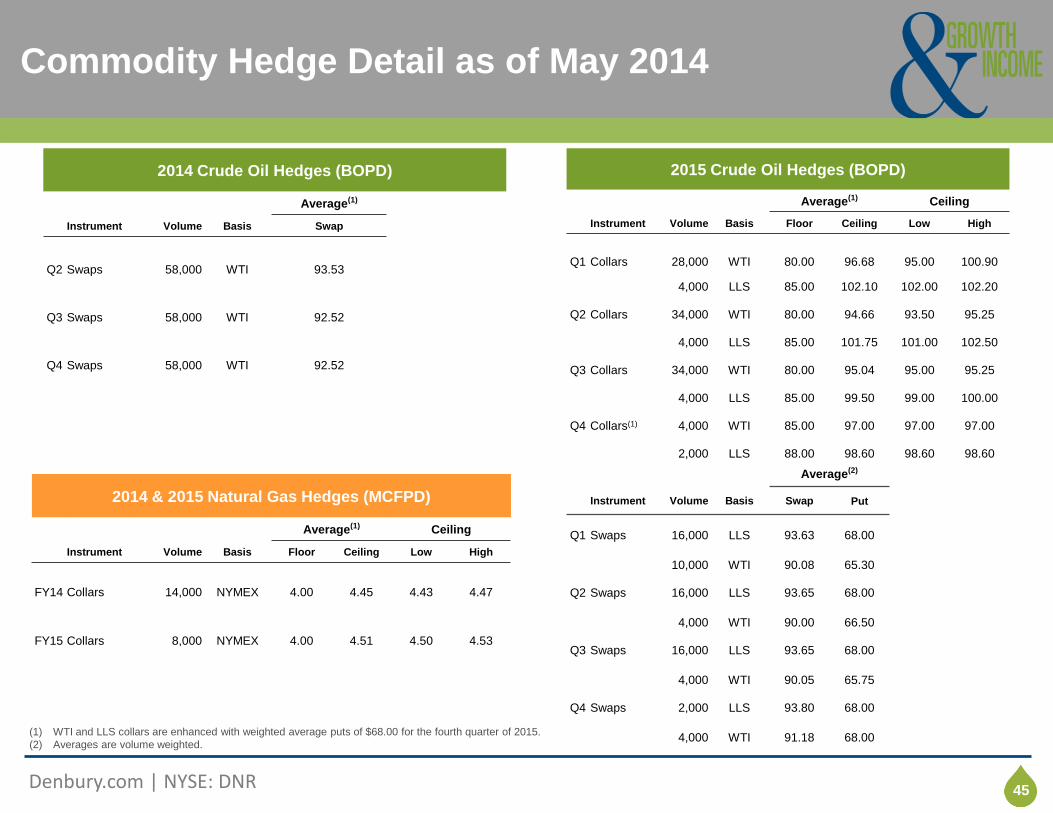
Click to edit title style Commodity Hedge Detail as of May 2014
45
(1) WTI and LLS collars are enhanced with weighted average puts of $68.00 for the fourth quarter of 2015.
(2) Averages are volume weighted.
2014 & 2015 Natural Gas Hedges (MCFPD)
Average(1) Ceiling
Instrument Volume Basis Floor Ceiling Low High
FY14 Collars
14,000 NYMEX 4.00 4.45 4.43 4.47
FY15 Collars 8,000 NYMEX 4.00 4.51 4.50 4.53
2015 Crude Oil Hedges (BOPD)
Average(1) Ceiling
Instrument Volume Basis Floor Ceiling Low High
Q1 Collars
28,000 WTI 80.00 96.68 95.00 100.90
4,000 LLS 85.00 102.10 102.00 102.20
Q2 Collars 34,000 WTI 80.00 94.66 93.50 95.25
4,000 LLS 85.00 101.75 101.00 102.50
Q3 Collars 34,000 WTI 80.00 95.04 95.00 95.25
4,000 LLS 85.00 99.50 99.00 100.00
Q4 Collars(1) 4,000 WTI 85.00 97.00 97.00 97.00
2,000 LLS 88.00 98.60 98.60 98.60
Average(2)
Instrument Volume Basis Swap Put
Q1 Swaps 16,000 LLS 93.63 68.00
10,000 WTI 90.08 65.30
Q2 Swaps 16,000 LLS 93.65 68.00
4,000 WTI 90.00 66.50
Q3 Swaps 16,000 LLS 93.65 68.00
4,000 WTI 90.05 65.75
Q4 Swaps 2,000 LLS 93.80 68.00
4,000 WTI 91.18 68.00
2014 Crude Oil Hedges (BOPD)
Average(1)
Instrument Volume Basis Swap
Q2 Swaps 58,000 WTI 93.53
Q3 Swaps 58,000 WTI 92.52
Q4 Swaps 58,000 WTI 92.52
Click to edit Master title style
Denbury.com | NYSE: DNR
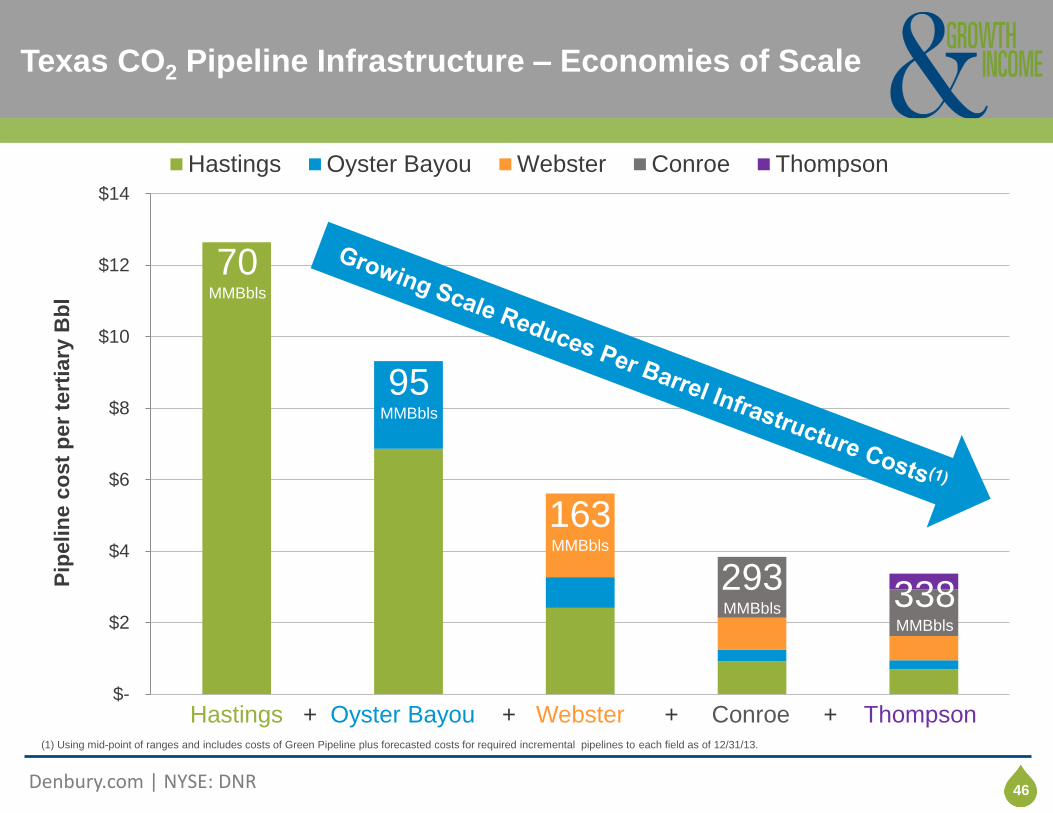
Click to edit title style Texas CO2 Pipeline Infrastructure – Economies of Scale
46
$-
$2
$4
$6
$8
$10
$12
$14
Pip
elin
e c
ost
per
tert
iary
Bb
l
Hastings Oyster Bayou Webster Conroe Thompson
Hastings + Oyster Bayou + Webster + Conroe + Thompson
70 MMBbls
95 MMBbls
163 MMBbls
293 MMBbls 338
MMBbls
(1) Using mid-point of ranges and includes costs of Green Pipeline plus forecasted costs for required incremental pipelines to each field as of 12/31/13.
Click to edit Master title style
Denbury.com | NYSE: DNR
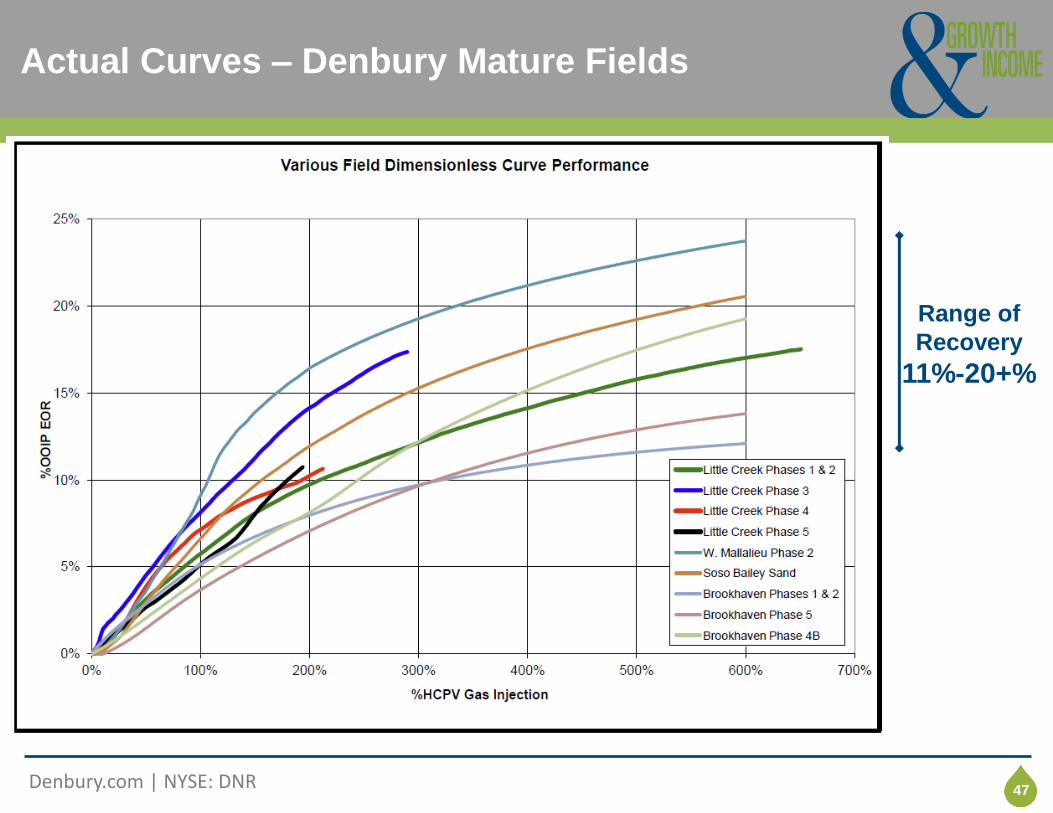
Click to edit title style Actual Curves – Denbury Mature Fields
47
Range of
Recovery
11%-20+%