Embed Size (px)
Citation preview

Demystifying Productivity: A Foundation for Policy Debate
March 2013

Acknowledgements This synthesis paper is underpinned by material from two separate working papers published by staff
from the Department of Industry, Innovation, Science, Research and Tertiary Education (DIISRTE). The
working papers are titled Productivity Concepts and Policy Directions by Stanislav Bucifal and
Introduction to Productivity Measurement Framework by Jianke Li.
The authors have prepared this material in their capacity as officers in the Business Capabilities and
Productivity Section, Industry Policy and Analysis Branch, Industry and Innovation Division at DIISRTE,
with the helpful guidance and valuable contributions from Richard Snabel, General Manager of the
Industry Policy and Analysis branch at DIISRTE, and Professor Quentin Grafton, Executive Director and
Chief Economist at the Bureau of Resources and Energy Economics (BREE).
The original working papers on which this synthesis paper is based also benefitted from comments by
Dean Parham in his capacity as Visiting Fellow Crawford School of Public Policy at the Australian
National University (ANU), Dr Christopher Vas from the HC Coombs Policy Forum at the Crawford
School of Public Policy at ANU, and other officers at DIISRTE.

1
Introduction Since the turn of the millennium, measured productivity growth has slowed markedly both in Australia and
across the developed world. The current mining boom (call it the ‘Millennium Mining Boom’) has boosted
Australian national income through record-high terms of trade1 (Figure 1).
Figure 1: Contributions to Average Incomes Growth, by decade
Source: Treasury calculations as cited in Dolman and Gruen (2012). Note: GNI per person refers to Gross National Income
divided into total population. GNI is equal to the gross domestic product adjusted for the terms of trade and net foreign
income flows.
The higher exchange rate associated with the Millennium Mining Boom has lifted the purchasing power of
Australian incomes and reinforced the structural change2 under way across trade-exposed non-mining
sectors of the economy. Beyond the mining boom, and against the backdrop of significant demographic
change, productivity is once again set to become a key determinant of future national income.
While the basic idea of productivity is simple enough, the difficulties in its measurement and identifying the
causes behind measured productivity give rise to a wide range of alternative perspectives and interpretations.
Compounding this situation is limited data availability and a scarcity of evidence generally. As a result, there
seems to be a divergence of views about what, if anything, should be done on the policy front about the
recent slowing of Australia’s measured productivity growth.
In this paper we wish to contribute to the productivity debate by describing the basic concepts that underpin
productivity and its measurement, with a view of and making them more easily accessible to policy makers
1 The terms of trade is simply the ratio of the value of a country’s exports to its imports. 2 Structural change is the movement of workers, capital and other production inputs between different industries as a result of sustained or permanent changes in market conditions. The main current drivers of structural change include globalisation, the widespread use of information and communication technologies (ICT), the centre of economic gravity moving to Asia and changing consumer preferences. More recently the effect of Australia’s sustained higher exchange rate has been felt across export-oriented industries and import-competing industries. This includes not only Australian manufactures but also some tradeable services, such as tourism and education (Lowe 2012).

2
and the interested public. We offer our own understanding of what productivity is, how it is measured and
what the key policy considerations are. In doing so, we address the following questions:
• What is productivity and why is it important?
• Why productivity isn't everything
• How is productivity measured?
• What determines productivity growth?
• What role do policy, institutions and social factors play?
• What is the nature of the current policy debate around productivity?
This paper is underpinned by two staff working papers published by the Department of Industry, Innovation,
Science, Research and Tertiary Education, one titled Productivity Concepts and Policy Directions and the
other titled Introduction to Productivity Measurement Framework.
1. What is productivity and why is it important? Productivity is the amount of goods and services produced by an individual, a business or a whole economy,
relative to the amount of resources or inputs used in production. It measures how efficiently and effectively
those production inputs, such as labour and capital, are used to produce goods and services.3
used inputs of Volumeproduced outputs of Volume tyProductivi =
At the economy-wide scale productivity refers to the total volume of all the goods and services a country
produces relative to inputs employed in production. These inputs include the total number of hours worked, all
the human effort, materials, energy and equipment and so on. Over the long-term, this output-input ratio is
thought to be linked to the nation’s overall material living standards. In this context, productivity growth can be
viewed as one of the most important means of achieving sustainable, long-term growth in the material living
standards of a nation.
Productivity growth occurs at the level of firms. The personal capabilities of individuals and the application of
new knowledge to production (also referred to as technological progress4 or innovation) are therefore key
ingredients of productivity growth. The terms ‘productivity’ and ‘productivity growth’ are sometimes used
interchangeably in public discussions, but the distinction between them is important:
growthInput growthOutput growthty Productivi −=
As policy makers we are often more interested in productivity growth, rather than the actual level of
productivity. A higher level of productivity generates a higher level of income over time, but higher productivity 3 Labour refers to the time and effort that people devote to producing the goods and services. Capital, in the context of productivity measurement, refers to all the things people use as inputs to the production of other goods and services. The denominator of the productivity ratio typically includes physical capital (such as tools, factories, machines etc.), natural capital (land, air, water, minerals, oil etc.) and other measurable tangible inputs. Depending on what we want to measure, human capital (such as education, skills, knowledge, experience, etc.) and other forms of capital may also be included. 4 Economists use the term ‘technology’ in its broadest possible sense, encompassing the full spectrum of human knowledge on how to organise the production and supply of goods and services, including both tangible capital and intangible capital. A widely accepted definition of intangible (or knowledge-based) capital distinguishes between three types: computerised information (software and databases); innovative property (patents, copyrights, designs, trademarks); and economic competencies (including brand equity, firm-specific human capital, networks joining people and institutions, organisational know-how that increases enterprise efficiency, and aspects of advertising and marketing), see OECD 2012b.

3
growth results in progressively higher income gains over time. A higher and sustained productivity growth rate
is more difficult to achieve than a permanently higher level of productivity because it requires continuous
improvements in the use of inputs and/or continuous growth in output (or more precisely its economic value)
to generate ongoing increases in income. By contrast, a permanently higher level of productivity could arise
from a one-off improvement in the use of inputs and/or increase in output that may arise from the application
of new knowledge, for example through the introduction of a new technology or new production process.5
There are four main channels through which productivity growth can directly lift the purchasing power of
consumers, enhance the profitability of businesses and improve the material wellbeing of all individuals
across society:6
• lower relative prices for consumers with more goods and services being made available;
• higher real wages for workers through their creation of higher economic value;
• higher profits for business through wider margins between unit value and cost; and
• higher tax revenues for governments which can be spent on better services to the public.
In the long term, the incomes and living standards of a nation or an economy are ultimately determined by the
volume of goods and services produced by its citizens over a given period, typically expressed in terms of
real gross domestic product (GDP) per capita. The more GDP (or output) that is generated per person, the
higher the national average income. Growth in GDP per capita is generally supported by increasing the
number of hours we work (labour utilisation), or by improving the efficiency and effectiveness with which we
work (labour productivity). These can be unpacked into three distinct sources:
• the size of the working age population, relative to total population;
• the rate at which workers participate in the labour force and have jobs; and
• the productivity of that labour force.
The relationship between these three sources and growth in per capita GDP has been popularised in the
‘three Ps’ analytical framework, as espoused in a number of key publications released by the Commonwealth
of Australia, for instance the 2003-04 Budget Papers (Figure 2).7 The three Ps framework clearly shows that
a nation’s material living standards can be improved through growth in any of these three sources.
Figure 2: The three Ps framework
Source: Adapted from 2003-04 Budget Papers, Budget Paper No. 1
5 Productivity Commission (2009) 6 Kaci (2006) 7 Commonwealth of Australia (2003). The three Ps framework is a central feature of the Intergenerational Report.

4
Since there are three sources of growth in per capita GDP, it is possible for output per capita to increase even
if one or both of the other two sources slow down or decline. This could occur if, for instance, accelerating
growth in the working age population participating in production outweighed a slowing in productivity growth.8
A lift in the participation rate was a major contributor to Australia’s economic growth during the mid-to-late
1980s, when it increased permanently from around 61 to 63 per cent, and again between 2004 and 2008,
when it rose to more than 65 per cent.9 Similarly, the remarkable decline over the past two decades in
Australia’s rate of unemployment (to less than 6 per cent currently, despite the ongoing economic fallout in
many other parts of the world following the global financial crisis of 2008) has supported our living standards
as more Australians have become employed (Figure 3).
Figure 3: Unemployment and participation rates
Source: Thomson Reuters Datastream
However, the gains in economic welfare from reducing the rate of unemployment or increasing the rate of
workforce participation can only be temporary because the scope for such gains is finite.10 The only source
of increase in GDP per capita that can be maintained over the long term is productivity growth.11
GDP per capita provides a simple approximation of living standards. It captures the average annual output
per head of population as measured by the value of production in constant prices. Of course, the living
standards of individuals in society are shaped by more than just our average output per person. We now take
a brief look at some of these factors.
8 There may also be a short term tradeoff between participation and productivity: as more and more marginal workers enter the workforce the average output per worker will tend to decline. Also, as can be seen in the three Ps framework, the participation P is determined by three components: the rate of participation, the rate of unemployment, and the average hours worked. 9 ABS (2012a) Cat. No. 6202.0 Labour Force. 10 Indeed, growth of the working age population (relative to total population), as well as the workforce participation rate and the average hours worked are all subject to limits in that they cannot continue to increase indefinitely. This also applies to reductions in the rate of unemployment (see Figure 2). 11 D’Arcy & Gustafsson (2012)

5
2. Why productivity isn’t everything As the economist Paul Krugman famously proclaimed ‘productivity isn't everything, but in the long run it is
almost everything. A country’s ability to improve its standard of living over time depends almost entirely on its
ability to raise its output per worker’.12 It is worth reflecting for a moment on why productivity isn’t everything.
Firstly, as shown in the three Ps framework (Figure 2), productivity growth is only one of three key
determinants of per capita income growth. Workforce participation and population age structure also matter,
at least in the short term, where they may offer scope for improvement. Secondly, the benefits of higher
productivity are typically enjoyed over the long term, but also frequently involve short-term adjustment costs
that may include the displacement of workers from one industry or region to another.
And thirdly, temporary price fluctuations matter. Record high prices for mineral exports in the last couple of
years have lifted Australia’s terms of trade, which effectively boosted all Australian incomes.13 The Millennium
Mining Boom has generated the longest and largest increase in the terms of trade since the gold rush of the
1850s, and has contributed to about 40 per cent of the overall annual increase in Australia’s gross national
income per person over the period 2002–03 to 2010–11.14
In addition to the above, we should emphasise that the concept of GDP as a measure of wellbeing suffers
from a number of shortcomings, all of which are well known and well documented. Poor policy decisions and
outcomes can arise if we lose sight of the ultimate objective of raising living standards.15 The notion of living
standards goes well beyond raising our GDP per capita. It includes access to opportunities, quality health
care and education, meaningful employment, a safe and engaging social life, a diverse and sustainable
environment, the distribution of risk across society, as well as a host of other factors.
In short, productivity isn’t everything. In the broadest sense, our wellbeing is determined in significant part by
having the freedom and opportunity to lead a life we have reason to value.16 A powerful reminder of this
simple fact is another conceptual framework developed by the Treasury—the Wellbeing Framework,17 which
recognises that living standards have many dimensions that need to be kept in mind as we contemplate the
possible directions for policy.
3. Measuring productivity It turns out that measurement issues are of critical importance to the policy debate around productivity.
Although productivity growth occurs at the level of the firm, productivity statistics can potentially be estimated
at three levels of aggregation: economy-wide, industry and firm level. In practice, estimates are produced
using a top-down approach, rather than by aggregating from the ground up. At the aggregate or industry
levels, productivity measures can be broadly classified by inputs (labour, capital and intermediate inputs) and
outputs (gross output or value added), as set out in Table 1.18
12 Krugman (1994) 13 The terms of trade increase whenever the prices of exports grow faster than the prices of imports. 14 Grafton (2012) 15 Productivity Commission (2009) 16 The Treasury, as cited in Gorecki and Kelly (2012) 17 Ibid. 18 Intermediate inputs are production inputs which are not readily classified as labour or capital. They include things such as energy, materials and services.

6
Table 1: Classification of different measures of productivity
Source: Organisation of Economic Cooperation and Development (OECD, 2001)
The two measures most frequently used in practice are:
• labour productivity (LP)—value added per hour worked; and
• multifactor productivity (MFP)—value added from a combination of labour and capital inputs.
Despite the apparent simplicity of the concept, measuring productivity is complex in practice. Both estimates
inform policy and the targeting of inputs to lift productivity. The Australian Bureau of Statistics (ABS)
publishes estimates of both LP growth and MFP growth at the economy-wide aggregate level. Industry-level
estimates are currently labelled as ‘experimental’ and their interpretation requires caution.19
Measured labour productivity correlates positively with GDP per capita. It includes, but does not separately
identify, different sources of growth that do not necessarily stem from the personal capacities of workers or
the intensity of their effort.20 It reflects the joint contribution of capital intensity and MFP.21
MFP growth, in turn, is measured indirectly. It is the unexplained residual left over when labour and (tangible)
capital are controlled for. In theory, the residual reflects changes embodied in labour and capital (particularly
improvements in the quality of capital and the skills of workers), as well as the application of new
knowledge—broadly referred to as innovation.22 In practice, however, the residual contains a range of other
factors and influences that are unrelated to quality improvement or technological progress. Changes in some
of these effects have little to do with long-term prosperity as they do not represent a change of productive
capacity. Measurement errors aside, these effects include:23
• The business cycle—temporary downturns or build-up of capital due to ‘lumpy’ investment cycles,
resulting in fluctuations in capacity utilisation.
• Changes in industry composition—shifts in the relative size of industries and firms (that is, structural
change and firm entries/exits).
• Adjustment pressures—conditions and events that induce increased investment in new capital,
leading to greater inputs without immediate output responses.
19 ABS (2007) Cat. No. 5260.0.55.001 Experimental Estimates of Industry Multifactor Productivity. 20 OECD (2001) 21 Capital intensity refers to the amount of capital available per unit of labour. At its simplest, this may be the number of tools available per worker. 22 Wei (2011) 23 Parham (2012a)

7
Table 1 shows that inputs and outputs can be defined in different ways. Single inputs are conventionally
classed as labour, capital or intermediate inputs. While estimating labour inputs is relatively straightforward,
capital inputs are more complicated, not least of all because our measure of capital should account for the
depreciation of assets and the role of knowledge-based capital in production. Complications arise when input
measures need to be adjusted for changes in quality, labour and capital need to be combined into a single
measure of input, and different products and services need to be combined into a single measure of output.
Combined inputs and outputs are converted into indexes, and this allows for the measurement of changes
over time (productivity growth) but not productivity levels.24 Policy makers need to keep all this in mind when
interpreting MFP estimates.
Whilst labour productivity can be potentially estimated for the whole economy, MFP statistics cover only part
of the private sector of the economy, collectively labelled the ‘market sector’. Table 2 shows (coloured) the
industries which are included in the two current market sector definitions. The exclusion of the remaining
unmeasured part is largely due to the fact that outputs of some service-producing industries are hard to
measure independently of input use.25 This applies especially to government services, education and training,
and healthcare services. In an ideal world, MFP statistics would cover all market economic activities.
Table 2: The ‘market sector’ as a subset of ABS industry divisions
Source: ABS (2008) Cat. No. 1292.0; ANZSIC = Australian and New Zealand Standard Industrial Classification.
Each of the two market sector definitions shown in Table 2 has its advantages and drawbacks. The
advantage of the 12-industry market sector is that estimates go back as far as the 1970s. The drawback is
that this definition is narrower in scope, accounting for around 67 per cent of industry value added, compared
24 Broadly speaking, combined labour and capital inputs are transformed using the so-called Tornqvist index, while the output measure makes use of chained Laspeyers index (see ABS Cat. No. 5260.0.55.001 for detail). The practice of indexation allows for the aggregation of multiple inputs and multiple outputs into single input and output measures, respectively. It also allows for the aggregation of inputs and outputs from industry level to the level of the whole economy. However, indexes are unit-free, which means they do not allow for the comparison of productivity levels across different industries. To the extent that we may be interested in knowing what those levels are, the use of indexes is a limitation. 25 Wei (2011)

8
to the 16-industry definition.26 The 16-industry market sector is broader in coverage, accounting for just over
80 per cent of industry value added, but data is only available from the late 1990s which prevents a longer
term perspective. The blue arrows in Table 2 roughly show the additional industry divisions in the expanded
16-industry definition, which are omitted from the 12-industry definition. Even with the expanded scope, the
16-industry definition leaves nearly 20 per cent of the economy (divisions O, P and Q) unmeasured.27
Productivity is a long run concept. This means that productivity trends are best examined over longer term
periods called ‘productivity cycles’—periods between peaks in measured productivity growth (typically
between four and six years) identified by the ABS. This practice helps average out short-term statistical
‘noise’ and temporary effects mentioned earlier. Shorter term data is subject to significant volatility. Australia’s
two most recent productivity cycles are from 1998-99 to 2003-04 and from 2003-04 to 2007-08. The current
period since 2007-08 is an incomplete cycle.28 Note, however, that productivity cycles are defined separately
from business cycles,29 so there is not necessarily a correlation between the two.
Aside the issues outlined above, there is only a limited availability of data and reliable evidence. For these
reasons productivity statistics should always be interpreted with caution.
4. What determines productivity growth? This section expands on the idea that improvements in material living standards are linked to the ability of a
nation to increase average incomes. Over the long term, this essentially means producing more output per
person, which can be done in two ways: either by employing more inputs in production, or by improving the
effectiveness with which existing inputs and capabilities are being utilised.30
Productivity growth occurs when more outputs are being produced from the same amount of inputs (or when
fewer inputs are being employed to produce the same amount of output) than previously, which translates to
output growth being faster than input growth. The broadest productivity measure is labour productivity, which
can be broken into two components, MFP and capital intensity (see also Figure 2):
• MFP refers to the efficiency and effectiveness with which labour is combined with capital and
intermediate inputs (such as materials, energy and services) to produce output. An increase in MFP
is usually attributed to improvements in the quality of labour, quality of capital, or some form of
technological advance. It can also come from efficiencies or value creation associated with changes
in the scale, scope or specialisation of production.31
• Capital intensity is, roughly speaking, the amount of capital available per worker. Recall that the term
‘capital’ refers generically to any physical plant, machinery and equipment, as well as measurable
intangible assets such as blueprints, brand, intellectual property or knowledge that can be readily
26 ABS (2012b) Cat. No. 5204.0 Australian System of National Accounts, 2011-12, Table 5. 27 Ibid. 28 ABS (2012c) Cat. No. 5260.0.55.002 Estimates of Industry Multifactor Productivity, Australia: Detailed Productivity Estimates, Table 3. 29 Business cycle is a period between two economic recessions, defined statistically by examining GDP growth. 30 Dolman and Gruen (2012) 31 In addition to economies of scale (defined earlier), economies of scope are savings in average costs from producing more than one type of product, while the gains from specialisation are cost savings that can come about when producers focus on what they do best and abandoning (or outsourcing) non-core product lines or activities.

9
applied to production to add value to output. An increase in capital intensity is referred to as ‘capital
deepening’.
A convenient way of organising the different factors and influences which impact on labour productivity (via
MFP and capital intensity) is to group them into three groups by their causal proximity, accepting that there
will be some overlap. In the first group are causes which are closest to productivity growth. They can be
labelled as immediate causes. The second group comprises causes that support productivity growth by
creating conditions conducive to immediate causes. These can be seen as underlying factors. In the third
group are fundamental influences—causes which are most remote, containing a whole range of deep-seated
policy, social and institutional factors that affect economic activity broadly (Figure 4).32
Figure 4: Determinants of productivity growth
Source: Productivity Commission (2009)
4.1 ‘Immediate causes’ of productivity growth
Productivity growth may be attributed to a number of immediate causes occurring at the level of individual
firms (Figure 4). These can be organised under four headings:
• economies of scale, scope and specialisation;
• resource allocation across industries and firm turnover within an industry;
• embodied technical change (improvements towards best practice); and
• disembodied technical change (innovation and new best practices).
32 Productivity Commission (2009)

10
4.1.1 Economies of scale, scope and specialisation
As defined earlier, efficiency gains and the creation of additional economic value can come about from firms
increasing the amount they produce of a particular output by adding more inputs (scale), expanding the mix of
products and services offered (scope), or focusing on doing what they do best (specialisation). These actions
reflect firms becoming more productive within the industry in which they currently operate.
The expansion of production scale can boost MFP and increase capital intensity at the same time. The size of
the gain is influenced by the availability of appropriately skilled workers, high-quality capital and technology.
The gains may initially be substantial, but as capital intensity increases they are likely to diminish. The
expansion of scope and specialisation in areas of genuine advantage can also unlock potential savings and
tap knowledge embodied in labour, capital and technology.
4.1.2 Resource allocation across industries and firm turnover
Another immediate cause of productivity growth stems from the reallocation of inputs (or resources) across
different industries33 as firms enter more productive industries and exit less productive ones. Similarly, the
turnover of firms within the same industry can be a source of productivity growth whenever less efficient firms
exit and more efficient ones enter an industry, or whenever efforts and resources are redirected to higher
value activities. The reallocation of labour and capital between industries and firms does not necessarily
involve the introduction of new technologies to generate efficiency gains or create additional value.
Although resource reallocation and firm exits often involve costs and some loss of productive capacity, the
turnover of firms can be a significant force in productivity growth even in periods of strong economic growth,
and especially in the early years of a new firm’s operation. One possible reason for this is the wide dispersion
of measured productivity performance across individual firms, though some of this may be attributable to
differences in firm structure, size and nature of the specific markets in which they operate. Research
suggests that up to one-half of labour productivity growth may potentially be attributable to changes in
industry composition.34
4.1.3 ‘Embodied’ technical change
The movement of firms and industries towards best practice can also come about from so-called embodied
technical change.35 This refers mainly to improvements in the quality of labour and capital, which can come
about, for example, through the acquisition of new skills, the introduction of better management practices or
improvements in operating processes within firms.
Skilled employees are generally more productive and can raise the productivity of their co-workers. Higher
stocks of human capital facilitate investments in physical capital and enhance the development and diffusion
33 Industries are, roughly speaking, groups of firms that compete in the same markets, supplying the same or very similar output. The conceptual framework adopted for the development of ANZSIC 2006 uses supply-side based industry definitions and groupings. Using this approach, business units engaged in similar productive activities are grouped together. Units in an industry therefore exhibit similar production functions (a term used to describe the transformation of intermediate inputs, through the application of labour and capital, to produce outputs), see ABS 2008. 34 Dolman and Gruen (2012) 35 Firms will only pursue technical change that they expect to be profitable if they want to stay in business—that is, carry on a ‘going concern’.

11
of new technologies, which in turn, increases output per worker. The deployment of better plant, equipment
and other means of production is also a source of greater efficiency and economic value.
On aggregate, embodied technical change reflects businesses catching up to industry best practice. From the
individual firm’s perspective, embodied technical change can also be seen as a form of innovation in the
sense that it is ‘new to the firm’, although the term innovation is usually associated with disembodied
technical change (discussed below). For example, the introduction of better management practices is both an
improvement in the quality of management personnel and an improvement in the allocation of labour and
capital within firms. Whether better management practices are best viewed as embodied or disembodied
technical change is ultimately of little consequence, what matters is that they lift the firm’s productivity.
4.1.4 ‘Disembodied’ technical change
Strictly speaking, disembodied technical change is a catch-all term for everything that isn’t embodied
technical change—including the economies of scale, scope and specialisation, the utilisation of labour and
capital, and the structural change associated with the reallocation of inputs within and across industries—all
of which were mentioned previously. However, by far the most important form of disembodied technical
change for long term growth is innovation.36
Innovation is central as a driver of productivity growth over the long term. It can lift productivity whenever it
has a practical use in industry and is genuinely new. It can take many forms, including the adoption of new
technology, modification of an existing one, the application of a new idea, to name just a few. Innovative
businesses can boost their productivity by, for instance, transforming their capabilities, collaborating with
suppliers and peers, adapting existing technologies and processes to new uses or creating customised
solutions to meet customers’ needs.
Quite a lot of innovation is incremental (for example, the evolution of mobile phones to smart phones). Much
less frequently it can also be radical, in the sense that it introduces a truly revolutionary step change in
production possibilities (for example, the invention of the combustion engine, electricity, air travel, the
microprocessor, and more recently the Internet). Radical innovation can become a platform for many
subsequent incremental improvements.37
The reason is fairly straightforward: for businesses which are already operating at the best practice frontier
and at scale, further productivity growth is only possible with new-to-the-world innovation—the kind that
expands the production possibilities of the industry or the economy at large. By expanding the best practice
frontier, innovation effectively creates new scope for individual firms to improve their productive efficiency and
create additional value by adopting it, incorporating it into their production regime and commercialising it.
Innovation is a lot more than a linear progression from scientific research to discovery to technological
improvements to finished products and their diffusion in society.38 It is a broad phenomenon that entails the
complex interaction of human ingenuity, creativity and talent in the process of discovering new practical
applications of knowledge. In terms of wellbeing, it involves the deployment of new ideas to production and all
36 Innovation is defined as the implementation of a new or significantly improved product (good or service), or process, a new marketing method, or a new organisational method in business practices, workplace organisation or external relations (OECD 2005). 37 Gordon (2012) 38 OECD (2010)

12
areas of life in society that boosts living standards. Recent thinking on innovation recognises the role of
intangible capital (or knowledge-based capital) a major driver of productivity growth.39
These forms of capital allow businesses to compete less on price and more on value (for example, on various
product characteristics such as quality, reliability, sustainability, differentiation, brand image—all of which
motivate customers to pay a higher price). Competing on value, rather than price, and occupying high-value
market niches, is likely to become increasingly important for the success Australia’s businesses going forward
with the rapid rise of lower cost foreign producers (particularly from Asia) and increased contestability in
domestic and foreign markets.40
Box 1: Productivity and profitability: the business lens
Production and wealth creation occur at the level of firms. Lifting the productivity of a nation, therefore,
ultimately depends on the performance of the individual businesses operating within it.41
Productivity may be one of a whole range of considerations in business decisions, but for the most part
businesses are hopefully guided primarily by profitability.42 The distinction between productivity and
profitability is an important one. Profitability reflects more broadly the ability of a business to generate income
as compared to costs. Productivity, by contrast, relates the volume of output to the volume of inputs, nothing
more. The key insight for both businesses and policy makers is that competition influences firm decisions in a
way that binds the two together.
Profitability and productivity are linked through costs, prices and quantities. In competitive markets, lifting
productivity supports profit growth over the long term but profit maximising behaviour can actually reduce
productivity in the short term. For example, high world commodity prices can make it profitable for miners to
extract inferior mineral deposits using relatively inefficient means, which would reduce short-term measured
productivity. Similarly, rapid capital investment in response to an increase in demand can translate into a
temporary slowing in productivity growth unless the capital is quickly brought to use.43
Notwithstanding the short-term effects, the long-term relationship between productivity and profitability is a
positive one. In some highly competitive markets, productivity and its growth is simply a matter of survival.44
Practical ways of lifting firm productivity include improved management practices, finding new markets for
existing products, creating new products for existing markets and adopting new knowledge.45 Skills and
innovation are essential to all of this.46 Statistical evidence suggests that innovative Australian firms are more
than twice as likely to report increased productivity.47
39 See, for example, Barnes and McClure (2009). 40 Roberts and Stewart (2012) 41 Productivity Commission (2009) 42 In practice, businesses may also pursue a number of other objectives, such as maintaining market share, increasing responsiveness to customer needs or improving product/service quality (see Dolman and Gruen 2012). 43 See, for example, the work of Topp et al (2008) on capital deepening in the mining sector. 44 Syverson (2011) 45 Productivity Commission (2009) 46 See Appendix for a statistical summary of the role of innovation and skills in business performance. 47 ABS (2012i) Cat. No. 8158.0 Innovation in Australian Business, 2008-09

13
4.2 Underlying factors: competition, market conditions and trade
While productivity is at the core of long term profitability, the success of individual businesses also depends
critically on the external environment in which they operate. That environment comprises a vast and complex
array of players, groups and relationships. Firms are beholden to market conditions and depend on them for
survival. The nature and scale of all these external forces bearing down on individual firms, relative to their
own size and market power, determines how they conduct their business, how they interact, and how they
compete, and how they innovate.
The relative size of businesses and market concentration defines the relationships between them and how
they are likely to respond in the face of changing market conditions. Power imbalances coupled and
sustained changes in market conditions drive businesses within the supply chain to either adapt or exit.
Under the right conditions, these competitive pressures can provide a powerful motivation for firms to look for
opportunities for cost savings and the creation of new value.
Broadly speaking, in well-functioning competitive markets supported by good institutions of governance, the
profit-oriented behaviour of firms can unleash the immediate causes of productivity growth by bringing the
focus on efficiency and value creation. By contrast, weak or distorted competition or dysfunctional institutions
create incentives for the abuse of market power and ‘rent seeking’ anywhere along the supply chain, which
ultimately leads to inferior welfare outcomes for the whole community.48 However, the relationship between
competition and innovation is highly complex and differs from industry to industry. For instance, some
innovative activities (such as R&D) occur largely in highly concentrated markets with limited competition.49
The competitive environment drives the reallocation of inputs between firms, industries and activities as
individual businesses respond to the external pressures. Productivity will tend to increase whenever people
and resources move from low-productivity activities to high-productivity ones. Part of this movement may
reflect less efficient firms exiting markets and more efficient ones entering, but an industry with relatively low
labour productivity is not necessarily an inefficient or ineffective one in terms of its ability to create value.
There may be other reasons. As may be expected, capital-intensive industries generally tend to exhibit higher
levels of labour productivity, while labour-intensive services often have lower labour productivity levels.50
International trade and investment can be an important source of innovation whenever it leads to ‘spillovers’
of knowledge and new technology to local firms. The transmission of knowledge brought in from abroad
depends on the closeness of linkages between local and foreign firms, the skills and absorptive capacities of
local firms and existing technological sophistication of local industries. Networks and face-to-face interaction
play a particularly important role in the dissemination and adoption of knowledge between people and
organisations—especially where a lot of the knowledge being transferred is tacit.51
Openness to international trade and investment can also enhance competition. The added pressure from
international competition introduces greater contestability in domestic markets, which may in turn strengthen
the imperative to innovate. However, as noted above, in a dysfunctional institutional setting it may instead
48 Rent seeking is the practice of extracting from customers returns in excess of the amount required to induce a producer to supply a particular good or service in a competitive market. Rent seeking typically involves price discrimination and the restriction of supply, so that market prices are artificially bid up. 49 OECD (2012b) 50 Uppenberg and Strauss (2010) 51 Nelson & Winter (1982) point out that not all knowledge is formal or explicit. Some knowledge is tacit, in the sense that it is not easy to codify and disseminate. It is only disseminated through face-to-face interaction and experience.

14
distort competition and exacerbate market power imbalances. These influences can be quite broad,
encompassing a whole range of political, social and policy factors that affect society. In short, market
concentration, power relationships, and the quality of the social and institutional environment all have an
impact on the nature of competition and its relationship to innovation and productivity growth.
4.3 Fundamental influences: policy, institutions and people
Maximising a nation’s economic efficiency potential for value creation requires having in place sound
framework conditions, including well-defined and well-protected property rights, strong institutions of
governance and healthy competition. Economic efficiency and effectiveness is also supported by low
sovereign risk, sound fiscal and monetary policies, well-developed infrastructure and a skilled workforce.
Policy helps create and shape all these conditions.
Government action (or inaction) can influence the decisions of firms and individuals regarding the supply and
use of capital and labour, which in turn affects productivity. The Productivity Commission offers the following
perspective:52
The policy environment can affect the emphasis given to economic objectives and the
development of productivity-enhancing capabilities, and the stability of policy settings can
affect the risks involved in making long-term investment decisions. Formal and informal
institutional ‘rules of the game’ influence the costs of coordinating production activities and
conducting business. They influence the incentives facing firms and individuals to raise
productivity.
As noted previously, competition, trade openness, and demand and supply conditions impact quite broadly on
whole industries and policy and institutions have a clear role in shaping these forces. Together with the
fundamental influences which operate across the whole economy they help to define a nation’s economic
efficiency—the extent to which scarce resources are being directed towards their most valuable uses.
Beyond this, governments also frequently employ a whole range of complementary policies to address
specific issues and achieve desired objectives. A typical rationale for the use of complementary policies is the
presence of market failure—conditional on there being a demonstrable potential for the intervention to deliver
net public benefits.53 Market failures can result from the under-provision of public goods, externalities,
information asymmetries or structural and competition failure; and the potential for net public benefits can be
quantified using cost-benefit analysis.54
The concept of market failure as a justification for policy action is not without controversy. It is sometimes
argued that the concept of market failure is too narrow as a rationale for policy action, or that some of what is
52 Productivity Commission (2009) 53 Market failure refers to situations where markets do not produce economically efficient outcomes and can arise for a number of reasons such as restricted competition, lack of adequate information about a good or service or where pollution or other factors affect third parties (Commonwealth of Australia 2010a). Net public benefit is a dollar figure (or range of values) that indicates whether the outcomes achieved through a particular policy can justify the resources used, relative to alternative uses (Commonwealth of Australia 2006). 54 In a cost-benefit analysis, costs and benefits are valued in terms of the claims they make on and the gains they provide to the community as a whole (see Commonwealth of Australia 2006).
15
considered as market failure may actually be ‘an intrinsic consequence of the process of innovation itself’,
without which innovation (or any change of human knowing) could not occur.55
Indeed, modern policy practice in Australia and elsewhere in the developed world takes into account a whole
range of competing perspectives—including social, environmental, strategic and national interest
considerations.56 These and other factors are deeply embedded in the nation’s institutions, values, people
and society. They develop over time in the course of the ongoing interactions and form part of the social,
economic and political life of society.
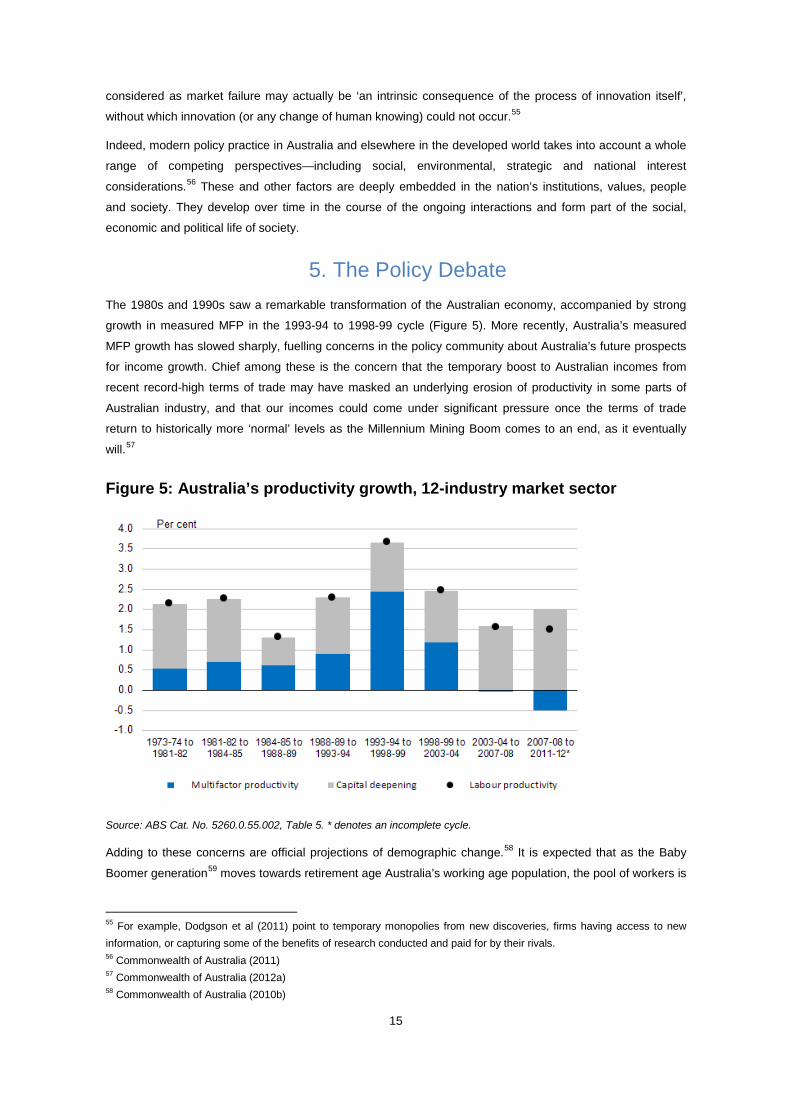
5. The Policy Debate The 1980s and 1990s saw a remarkable transformation of the Australian economy, accompanied by strong
growth in measured MFP in the 1993-94 to 1998-99 cycle (Figure 5). More recently, Australia’s measured
MFP growth has slowed sharply, fuelling concerns in the policy community about Australia’s future prospects
for income growth. Chief among these is the concern that the temporary boost to Australian incomes from
recent record-high terms of trade may have masked an underlying erosion of productivity in some parts of
Australian industry, and that our incomes could come under significant pressure once the terms of trade
return to historically more ‘normal’ levels as the Millennium Mining Boom comes to an end, as it eventually
will.57
Figure 5: Australia’s productivity growth, 12-industry market sector
Source: ABS Cat. No. 5260.0.55.002, Table 5. * denotes an incomplete cycle.
Adding to these concerns are official projections of demographic change.58 It is expected that as the Baby
Boomer generation59 moves towards retirement age Australia’s working age population, the pool of workers is
55 For example, Dodgson et al (2011) point to temporary monopolies from new discoveries, firms having access to new information, or capturing some of the benefits of research conducted and paid for by their rivals. 56 Commonwealth of Australia (2011) 57 Commonwealth of Australia (2012a) 58 Commonwealth of Australia (2010b)

16
likely to decline, relative to total population, while at the same time the number of retirees per worker will rise.
All else remaining constant, this will reduce the growth in GDP per capita and tax revenues, and put
significant pressure on our health care system, the pension and social security system, and government
budgets.60 This is likely to have serious implications for our incomes and living standards.
International research indicates that the slowing of measured MFP growth and demographic change is a
common trend across major developed economies observed in recent years, suggesting that there may be
some bigger structural phenomena at play on an international scale.61 An interesting and audacious
interpretation of these trends is that rapid economic progress made over the past 250 years could, in fact, be
a unique episode in human history rather than a guarantee of endless future advance.62
Nonetheless, material living standards are fundamentally linked to production. For obvious reasons, then,
productivity growth is a major pre-occupation for policy. As the income boost from the mining boom dissipates
and the full impact of demographic change comes into play, the potential for economic and social dislocation
in Australia is significant. For good policy development it is essential to identify the drivers behind the recent
sharp slowing in measured MFP growth and reach a shared understanding of what was behind the apparent
strong MFP upsurge in the late 1990s. Let’s briefly look at some of the different perspectives:
• Many analysts attribute Australia’s recent slowing in measured MFP growth to a combination of a
surge in capital investment (mainly in utilities and mining), the impact of drought on agriculture, and
factors such as the business cycle and firm entry and exit.63 In this view it can be expected that at
least some of the negative impact on measured MFP of unrequited input growth is only temporary,
and is likely to reverse as new capacity gradually comes on stream. There is significant agreement on
the need for more evidence and more research, especially in those few sectors that are believed to
have been responsible for the decline in measured MFP growth (mainly mining and utilities but also
manufacturing). Some key policy recommendations focus on the importance of improving framework
conditions by setting the right incentives, building capabilities and improving flexibility,64 while others
emphasise the key role of the innovative capabilities of businesses and their ability of utilise skills in
the workplace—both of which are linked to the quality of management practices.65
• Some analysts argue that the slowing in Australia’s measured productivity growth has been far more
broad-based and systemic than what can be explained by special circumstances in a handful of
industries. In this world view the slowdown in measured productivity growth represents a serious
problem for future incomes and has different policy implications compared to the relatively benign
situation described above. Proponents of this view emphasise the need for pressing on with
economic reforms aimed at reducing “rigidities” in markets, for example by focusing on workplace
relations, reviewing sector-specific assistance, abolishing preferential public procurement, reducing
environmental regulations and other forms of red tape. These reforms are seen as necessary steps in
59 The Baby Boomer generation can be loosely defined as the strong demographic cohort of people born roughly over the two decades immediately following the end of World War II in 1945. 60 Commonwealth of Australia (2010b) 61 OECD (2012a) 62 Gordon, R. J. (2012) 63 For example Parham (2012a); Productivity Commission (2009); Banks (2012) 64 Banks (2012) 65 For example Green et al (2012)

17
driving further efficiency improvements and the ability of markets to allocate scarce resources to their
highest value uses.66
• There are some analysts who argue that the persistent data limitations and scarcity of evidence have
led to a greater reliance on a ‘story telling’ approach to explaining what happened to Australia’s
productivity growth in the last two complete cycles. This approach entails the development of
compelling intuitive narratives around measured productivity trends, which may or may not be
substantiated by evidence. Some have suggested that the productivity surge of the late 1990s was
little more than a statistical illusion—an artefact of the way productivity cycles are defined separately
from the business cycle.67 This view is sceptical of the idea that the surge in measured productivity in
the late 1990s was driven by microeconomic reform, suggesting instead that factors such as
increased work intensity may have led to a temporary overestimation of measured MFP growth in the
1993-94 to 1998-1999 cycle.
Notwithstanding the diversity of views, we offer a few observations of what we consider as common themes:
First, there is widespread acceptance of the idea that productivity growth is important to incomes and living
standards (although it clearly isn’t everything), and that the impact of the mining boom ending and
demographic change presents a productivity challenge for Australia. Second, analysis of the causes behind
Australia’s productivity performance is made quite difficult by measurement issues and scarcity of evidence.
Third, there is a shared understanding that policy plays an important role in supporting productivity growth,
although there is a fair bit of disagreement on the specifics (largely because of the difficulties in
unambiguously attributing measured trends to specific causes). And fourth, granted that this view is not
shared universally, there is also significant agreement that special circumstances in certain sectors (mainly
mining and utilities) have contributed to the slowing in measured MFP growth in the last two complete cycles.
Further to the above, we note the widespread agreement at the conceptual level that certain long-term
drivers, such as skills and innovation, are essential for productivity growth.68 These and other drivers are
thought to fundamentally underpin long-term embodied and disembodied technical change (see section 4).
However, the relative importance of these and the other drivers of productivity growth in Australia’s current
circumstances is less clear. It is essentially an empirical question. Given the scarcity of evidence to underpin
analysis that would allow for the prioritisation of various policy proposals,69 we see expanding the evidence
base as the highest value opportunity to pursue at this point. In order to properly asses and appropriately
prioritise potential policies, we need more information (both quantitative and qualitative), more research,
improved measurement techniques and a more inclusive public debate.
66 For example Eslake and Walsh (2011) 67 For example Quiggin (2006) 68 See Appendix for a quick statistical snapshot. 69 See, for example, Banks (2012)

18
6. Concluding Remarks The current productivity debate is about finding the best ways of securing Australia’s future living standards.
Through record-high terms of trade, the Millennium Mining Boom has delivered a boost to our national
income in recent years and shielded us from the worst of the global financial crisis and the subsequent global
economic fallout. But mining booms don’t last forever. Going forward, however, the temporary income boost
from the mining boom will eventually subside and Australia’s ageing demographic is likely to reduce the pool
of workers, relative to total population. Adding to this is the economic rise of Asia, the emergence of the
digital economy and other major structural shifts in the global economy, all of which imply that our future living
standards will rely a lot more on productivity growth than has been the case over the past decade.
The policy and institutional environment is clearly an integral part of the economic environment and can help
support productivity growth. However, good policy is predicated on good process, reliable evidence and a
well-informed public debate.70 The widespread divergence of perspectives across the policy community about
the underlying nature and causes of measured productivity trends is symptomatic of the scarcity of evidence
and uncertainty surrounding measurement. It is here that we see the biggest opportunities to add value.
Some good work has been done so far but more could be done.
Productivity is about long-term prosperity. There are encouraging signs that the policy debate has matured,
with the wider acknowledgement of the uncertainty and complexity that surrounds productivity measurement
and scarcity of evidence. All this suggests that more effort and resources could be channelled into finding
new ways of working with the complexity, mitigating it, and overcoming it. It is our view that we need to start
assessing the merits and relative importance of individual policy proposals so that policy attention can give
priority to those that offer the highest long-term payoff for Australia.
70 Parham (2012b)

19
Appendix: Innovation and Skills Innovation delivers productivity, but not only productivity. ABS data shows the benefits of business innovation
at a firm level (Figure 6). Innovative firms are twice as likely to report an increase in productivity compared
with the previous year averaged across all firm sizes.
Figure 6: Increase in business performance or activity from the previous year, by innovation status, 2010-11
Source: ABS (2012h) Cat. No. 8167.0, Table 3.
Productivity is not the only benefit generated by innovative firms. Innovation encourages a more connected
and skilled economy with greater market diversity and consumer choice. Compared to firms that don’t
innovate, innovative Australian firms are also:71
• 42 per cent more likely to report increased profitability;
• three times as likely to export;
• four times more likely to increase the range of goods or services offered;
• more than twice as likely to increase employment;
• more than three times as likely to increase training for employees; and
• more than three times as likely to increase social contributions. Source: Commonwealth of Australia (2012b)
For a detailed account of Australia’s innovation performance and opportunities, readers are encouraged to
refer to the Australian Innovation System Report 2012, available here:
http://www.innovation.gov.au/Innovation/Policy/AustralianInnovationSystemReport/AISReport2012.pdf
71 ABS (2012h) Cat. No. 8167.0

20
Skills are at the core of long-term productivity growth. Australia has a well-developed vocational education
and training (VET) system which allows people of all ages to participate and our higher education system also
compares well internationally.72 Education, training and work experience drive skills creation and correlate
with long-term productivity. Skills are often reflected in the earning capacity of individuals.
In 2009, the median weekly earnings for employed persons of working age whose highest educational
attainment was a Bachelor degree was $1,351 compared with $907 for those with Year 10 or below (Figure
7).
Figure 7: Median weekly earnings by level of educational attainment in 2009
Source: ABS (2010b) Cat. No. 6278.0, Table 11.
In 2009, the median weekly earnings for employed persons of working age who have completed three or
more non-school qualifications was $1,180 compared with $670 for those with no non-school qualifications
(Figure 8).
Figure 8: Median weekly earnings by number of non-school qualifications in 2009
Source: ABS (2010b) Cat. No. 6278.0, Table 15.
72 Koutsogeorgopoulu and Barbiero (2013)

References Australian Bureau of Statistics (ABS)
(2007) Cat. No. 5260.0.55.001 Experimental Estimates of Industry Multifactor Productivity.
(2008) Cat. No. 1292.0 Australian and New Zealand Standard Industrial Classification.
(2012i) Cat. No. 8158.0 Innovation in Australian Business 2008-09.
(2010b) Cat. No. 6278.0 Educational and Training Experience
(2012a) Cat. No. 6202.0 Labour Force.
(2012b) Cat. No. 5204.0 Australian System of National Accounts, 2011-12.
(2012c) Cat. No. 5260.0.55.002 Estimates of Industry Multifactor Productivity, Australia:
Detailed Productivity Estimates, Table 3.
(2012d) Cat. No. 8165.0 Counts of Australian Businesses, including Entries and Exits, Jun
2007 to Jun 2011.
(2012e) Cat. No. 6291.0.55.003 Labour Force, Australia, Detailed, Quarterly, Aug 2012.
(2012f) Cat. No. 5206.0Australian National Accounts: National Income, Expenditure and
Product, Sep 2012.
(2012g) Cat. No. 8104.0 Research and Experimental Development, 2010-11.
(2012h) Cat. No. 8167.0 Selected Characteristics of Australian Business, 2010-11.
Banks, G. (2012) Productivity policies: the ‘to do list’, [presentation by outgoing Productivity
Commission’s Chief Commissioner, Gary Banks, at the Melbourne Institute 2012 Economic and Social
Outlook Conference: Securing the Future] Melbourne, 1-2 November 2012.
Barnes, P. and McClure, A. (2009) Investments in Intangible Assets and Australia’s productivity Growth,
Productivity Commission Staff Working Paper, Canberra.
Brennan, G. and Pincus, J. (2002) From the Australian Settlement to Microeconomic Reform: the
Change in Twentieth Century Policy Regimes. Centre for international Economic Studies, Adelaide
University, (Discussion Paper No. 0213).
Commonwealth of Australia
(2003) 2003-04 Budget, Budget Paper No. 1, Statement 4: Sustaining Growth in Australia's
Living Standards. [report] Canberra: Australian Government.
(2006) Handbook of Cost-Benefit Analysis. [report] Canberra: Department of Finance and
Administration, Australian Government.
(2010a) Best practice regulation handbook. [report] Canberra: Office of Best Practice
Regulation, Australian Government, p.29.
(2010b) Australia to 2050: future challenges, Attorney-General’s Department, Commonwealth
of Australia

(2011) Policy Development Framework. [report] Canberra: Department of Innovation, Industry,
Science and Research, Australian Government.
(2012a) 2012-13 Budget, Budget Paper No 1. Statement 2: Economic Outlook.
(2012b) Australian Innovation System Report 2012 [report] Canberra: Department of
Innovation, Industry, Science and Research, Australian Government.
D’Arcy, P. and Gustafsson, L. (2012) Australia’s Productivity Performance and Real Incomes, RBA
Bulletin, (June Quarter 2012).
Dodgson, M., Hughes, A., Foster, J., and Metcalfe, S. (2011) Systems thinking, market failure, and the
development of innovation policy: The case of Australia, Research Policy 40 (9), p.1145-1146.
Dolman, B. and Gruen, D. (2012) Productivity and Structural Change, Paper presented to the 41st
Australian Conference of Economists, Australian Treasury, 10 July.
Dolman, B., Parham, D., and Zeng, S. (2007) Can Australia Match US Productivity Performance?, [staff
working paper] Productivity Commission, March.
Eslake, S. and Walsh, M. (2011) Australia's Productivity Challenge, [report] Melbourne: Grattan Institute.
Forsyth, P. (2000) Microeconomic Policies and Structural Change. In: Gruen, D. and Shrestha, S. eds.
(2000) The Australian Economy in the 1990s, 1st ed. Sydney: Reserve Bank of Australia, p.235-267.
Gordon, R. J. (2012) Is U.S. economic growth over? Faltering innovation confronts the six headwinds,
National Bureau of Economic Research, (Working paper 18315, August 2012), Cambridge MA.
Gorecki, S. and Kelly, J. (2012) Treasury's Wellbeing Framework, Economic Roundup, (3 October),
p.27-64.
Grafton, Q. (2012) Australia and the Millennium Mining Boom, [remarks made by Professor Grafton,
Executive Director/Chief Economist of the Bureau of Resources and Energy Economics (BREE), at the
Australian National Conference on Resources and Energy (ANCRE)], September 2012.
Green, R., Toner, P. and Agarwal, R. (2012) Understanding Productivity: Australia's Choice, [report]
Sydney: The McKell Institute, University of Technology Sydney.
Gruen, D. (2001) Australia’s Strong Productivity Growth: Will it be Sustained?, RBA Bulletin, February
2001, p.62-69
Jones, E. (2006) The Australian retail duopoly as contrary to the public interest, [report for the Fair
Trading Coalition] Sydney: University of Sydney, Department of Political Economy.
Kaci, M. (2006) Understanding Productivity: A Primer. The Canadian Productivity Review, Catalogue
No. 15-206-XIE (002).
Koutsogeorgopoulu, V. and Barbiero, O. (2013) Boosting Productivity in Australia, OECD Working
Paper No. 1025, Paris.
Krugman, P. (1994) The Age of Diminishing Expectations: US Economic Policy in the 1980s, MIT Press,
Cambridge MA
Lowe, P. (2012) The Forces Shaping the Economy over 2012, RBA Bulletin, (Address to the Committee
for Economic Development of Australia), p.85-90.

Nelson, R. and Winter, S. (1982) An Evolutionary Theory of Economic Change, Harvard College Press,
Cambridge, MA.
Organization for Economic Co-operation and Development (OECD)
(2001) OECD Productivity Manual: A Guide to the Measurement of Industry Level and
Aggregate Productivity Growth, Paris.
(2005) Oslo Manual: Guidelines for Collecting and Interpreting Innovation Data, 3rd ed.
(2010) The OECD Innovation Strategy: Innovation to Strengthen Growth and Address Global
and Social Challenges
(2012a) OECD Compendium of Productivity Indicators 2012.
(2012b) New Sources of Growth Knowledge-Based Capital Driving Investment and Productivity
in the 21st Century
Parham, D. (2002) Microeconomic reforms and the revival in Australia’s growth in productivity and living
standards, [Paper presented to the Conference of Economists, Adelaide] Productivity Commission,
Canberra, October 2002.
Parham, D. (2012a) Australia’s Productivity Growth Slump: Signs of Crisis, Adjustment or Both?
Productivity Commission, Visiting Fellow at the Crawford School at ANU.
Parham, D. (2012b) Key Issues on the Understanding of Productivity Performance, [panel discussion at
the PC/ABS Productivity Perspectives Conference] Canberra, November 2012
Productivity Commission (2009) Australia’s Productivity Performance: Submission to the House of
Representatives Standing Committee on Economics - Inquiry into Raising the Level of Productivity
Growth in Australia, [report] Canberra: Commonwealth of Australia, p.XI-XX; 1-10.
Quiggin, J. (2001) The Productivity Miracle: A Sceptical View, Agenda, 8(4), p.333-348.
Quiggin, J. (2006) Stories about productivity, Australian Public Policy Program Working Papers,
University of Queensland, Brisbane.
Roberts , P. and Stewart, C. (2012) Innovation, skills key to growth: study, Roy Green, Phillip Toner and
Renu Agarwal. UST Sydney and McKell Institute. Australian Financial Review. 12 November, p.4.
Syverson, C. (2012) What Determines Productivity? Journal of Economic Literature, 49 (2), p.326–365.
Topp, V., Soames, L., Parham, D. and Bloch, H. (2008) Productivity in the Mining Industry:
Measurement and Interpretation, [staff working paper] Productivity Commission, December.
Uppenberg, K. and Strauss, H. (2010) Innovation and productivity growth in the EU services sector,
[report] Luxembourg: European Investment Bank, Economic and Financial Studies, p.3.
Wei, H. (2011) The ABS Productivity Measurement Program, Australian Bureau of Statistics Research
paper prepared for the 40th Annual Conference of Economists, (July 2011).