Embed Size (px)
Citation preview
NASA Technical Memorandum 2004-21 1533
DEMONSTRATION OF A POROUS TUBE HYDROPONIC SYSTEM TO CONTROL PLANT MOISTURE AND GROWTH
T. W. Dreschel C. R. Hall T. E. Foster
October 2003
National Aeronautics and Space Administration
NASA
NASA Technical Memorandum 2004-21 1533
https://ntrs.nasa.gov/search.jsp?R=20050215299 2018-03-21T21:26:40+00:00Z
DEMONSTRATION OF A POROUS TUBE HYDROPONIC SYSTEM TO CONTROL PLANT MOISTURE AND GROWTH
T. W. Dreschell C. R. Hall2 T. E. Foste?
"NASA The Dynamac Corporation 2
October 2003
National Aeronautics and Space Administration
John F. Kennedy Space Center
NASA
1
DEMONSTRATION OF A POROUS TUBE HYDROPONIC SYSTEM TO CONTROL PLANT MOISTURE AND GROWTH
T. Dreschel', C. Hall', and T. Foste2 'NASA, Mail Code: YA-E4 and
'Dynamac Corporation, Mail Code: DYN-2 Kennedy Space Center, FL 32899
ABSTRACT
Accurate remote detection of plant health indicators such as moisture, plant pigment concentrations, photosynthetic flux, and other biochemicals in canopies is a major goal in plant research. Influencing factors include complex interactions between wavelength dependent absorbing and scattering features from backgrounds as well as canopy biochemical and biophysical constituents. Accurately controlling these factors in outdoor field studies is difficult. Early testing of a porous tube plant culture system has indicated that plant biomass production, biomass oartitiming. and leaf moisture of plants can be controlled bv Preciselv manacine the - r - 0' 1 d 1 .' v u _ _
root water potential. Managing nutrient solution chemistry can also control plant pigments, biochemical concentrations, plant biomass production, and photosynthetic rates. A test bed wa I - . I . ~ 1 I - I > - I * - . J & I . - - - - L 1 . L - - I - I &I . r I I-_- - _ _ _ _ -
sterns, spectral analyses procedures. gas-exchange, and fluorescence measurement! iility to detect small differences in plant water status. Spectral analysis was able to n n l l .-I;fT~yPnmPe in thP m p a m lpaf ir iotpr ofintpnt ket imrer -n thm troitrnent.c Dniirev.-p th
s oeveiepea wnicn utIiiLcu me purvux iuuc uxnno-iogy witn cne intent or evaluating remme sensing SJ 3 for their al I detect srLKU., uIIIbIbIIyba ,,, L1lw llluull luul IvuIyL yvl lcuLLc VuC..w,,II CICIaCIIIbI,CJ. , L v v v c I &,lese small differences were not detectable ita the gas-exchange or fluorescence measurements.
INTRODUCTION
Many types of plant research can benefit from development of technoIogies to preciseIy control, alter, and monitor plant growth and physiological processes. The ideal test plant growth system would allow for control of the spectral quality and intensity of the light environment, the water and nutrient contact with the root system. the temperature and humidity of the growth area, and the concentration of gases in the atmosphere. Today's high quality plant growth chambers can be used to address the atmospheric gas, temperature, and humidity concerns. Advances in lighting technology such as light-pipe, LED and other innovative lamps as light sources are addressing issues associated with control of the photosynthetically active radiation environment. Creation of a reliable simple system for controlling the flow of water and chemicals directly available to plant roots provides tremendous opportunities for plant research in areas such as remote sensing of plant stress, toxicology testing, tissue culture of plants, and plant physiology. By accurately controlling the plants growth environment to minimize variance resulting from environmental responses we can begin to more accurately define treatment effects and minimum detectable differences in physiological characteristics as they relate to sampling strategies and procedures. For this research we are evaluating configurations of the porous tube plant nutrient delivery system (PTPNDS) and assessing our ability to detect plant responses to the various configurations.
2
The PTPNDS (Dreschel 1990) was originally designed for NASA for growing plants in the microgravity af space. In microgravity, plant rhizospheres tend to become anoxic because gravity-mediated convection is nsn-existent. To avoid these problems, the delivery of water and dissolved nutrients to roots grown in microgravity must be done in a precise fashion. The PTPNDS utilizes a controlled fluid loop to supply nutrients and water to plant mats growing on a ceramic surface moistened by capillary action. See Berry and others (E 992) for 8 detailed description of the PTPNDS.
The PTPNDS has been specifically developed to overcome many of the challenges in providing water and mineral nutrients to the roots of plants in microgravity (Dreschel 1990) and in certain ground systems (Dreschel and Brown 1993). Preliminary studies with the PTPNDS have centered around testing the system with various crop plants (Dreschel et aI. 1988, Dreschel et al. 1992, Bubenheiin et al. 1987), developing hydraulic pressure control systems for Iaboratory- scaIe crop tests (Dreschel 1992), measuring the effects of hydraulic pressure, pore size, and root zone volume on plant growth (Dreschel et al. 1989a, Dreschel et al. 1989b, DrescheE et al. 1994, Peterson et aI. 1989, Berry et al. 1992) developing physical and mathematical models to describe the operation of the system (Tsao et al. 1992, Tsao et al. 1996) and utilizing the system to grow crop plants in the confines of ground-based spaceflight plant growth unit such as the one patterned afrer the Russian SVET hardware (Chetirkin et al. 1994). The PTPNDS has also been used as a research tool to evaluate the response of plants to varying degrees of water and nutrient stress (Dreschel and Sager 1989, Dreschel et al. 1989b) and to investigate the hydrotropic response of plant roots to moisture gradients (Takahashi et al. 1992).
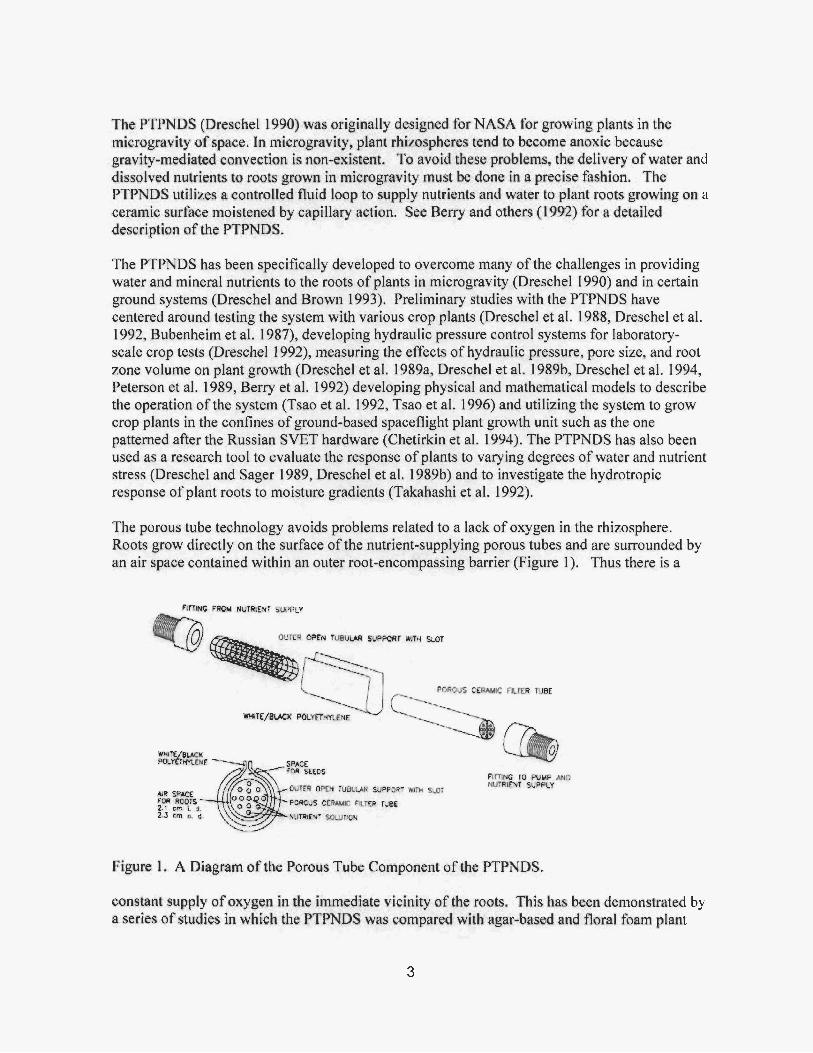
The porous tube technology avoids problems related to a lack of oxygen in the rhizosphere. Roots grow directly on the surface of the nutrient-supplying porous tubes and are surrounded by an air space contained within an outer root-encompassing barrier (Figure 1). Thus there is a
Figure 1, A Diagram of t k Porous Tube Component of the FTPNDS.
constant supply af oxygen in the immediate vicinity o f the roots. This has been demonstrated by a series of studies in which the PTPNDS was compared with agar-based and floral foam plant
3

culture systems developed for space flight applications. In these investigations alcohol dehydrogenase (ADH) levels in the roots were used to indicate water-logging (oxygen- deprivation) stress. Of the three systems tested, the PTPNDS grown plants produced the lowest amount of ADH in their roots and the highest shoot biomass, indicating the lowest level of stress (Porterfield 1996).
In ground-based studies water flux measurements were made with a series ofgravimetric tests and absorbent material {germination paper) on various pore size tubes (Figure 2). Results indicated a dependence of water flux on applied water potential (suction pressure) and pore size. Other studies (Dreschel et al. 1993) have indicated that water flux for various pore sizes differs according to the magnitude of the gravitational force.
IO' a 10.0 micron
2.0 micron 0.7 micron
0 0.3 micron
-2 10 l " l " l " l "
0 2 4 6 8 10
Suct ion Pressure (inches of water) Figure 2. A semi-log plot of the water flux rate versus suction pressure (applied water potential) fTsao et al. 1992).
OBJECTIVE
Determination of biomass, water status, photosynthetic rates, chemicai concentrations, and biophysical features of vegetation are recognized as important objectives for remote sensing in agriculture, terrestrial ecology, and earth system science. Successful algorithm development for feature characterization requires development of a quantitative understanding of complex interactions that occur between photons and the numerous absorbing and scattering components of targets (Bostater et al. 1994, Asner 1998). For plants, these wavelength dependent interactions involve tissue optical properties, canopy biophysical attributes, bottom reflectance (soil and litter), and illumination characteristics.
In remote sensing, two regions of the infrared reflectance spectra. the near- (700- I TOO nm) and middle- (1300-3000 nm), have been identified as being especially useful for the detection of vegetation water stress or water content (RippIe 1986, Tucker 1980) and other plant constituents
4

such as cellulase, lignin, starch and nitrogen compounds (Jacquemoud et a!. 1995). Organic bonds found in foliar mass exhibit vibrational stretching modes that absorb radiation in these regions of the spectrum. Water absorption bands occur at around 760,970, 1450, 1940, and 2950 nm in response to the OH bond (Grant 1987). Changes in the curvature or inflection of the reflectance signature in the 970 nm region have been found to have high correlation with water potential and percent moisture of scrub oak leaves (Bostater et al. 1994).
Under water-stressed conditions, plants are expected to exhibit a decrease in photosynthesis and conductance while experiencing an increase in fluorescence at higher light intensities. It has been found that water-stress does not directly affect the biochemistry of photosystem TI (Lu and Zhang 1998). If photosystem I1 was directly affected, differences in fluorescence should be detected in the dark adapted state. However, studies have found that water stress does not affect fluorescence measurements in the dark adapted state (Monje et al. 2001, Lu and Zhang 1998). Instead, water-stress increases the potential for damage caused by high light intensities, otherwise referred to as photoinhibition (Lu and Zhang 1998).
The objective of this study is to investigate the potential for using remote sensing instrumentation, infrared gas exchange system, or a fluorometer to detect small differences in the water status of plants being grown OR the PTPNDS at varying water potentials.
METHQDS AND MATERIALS
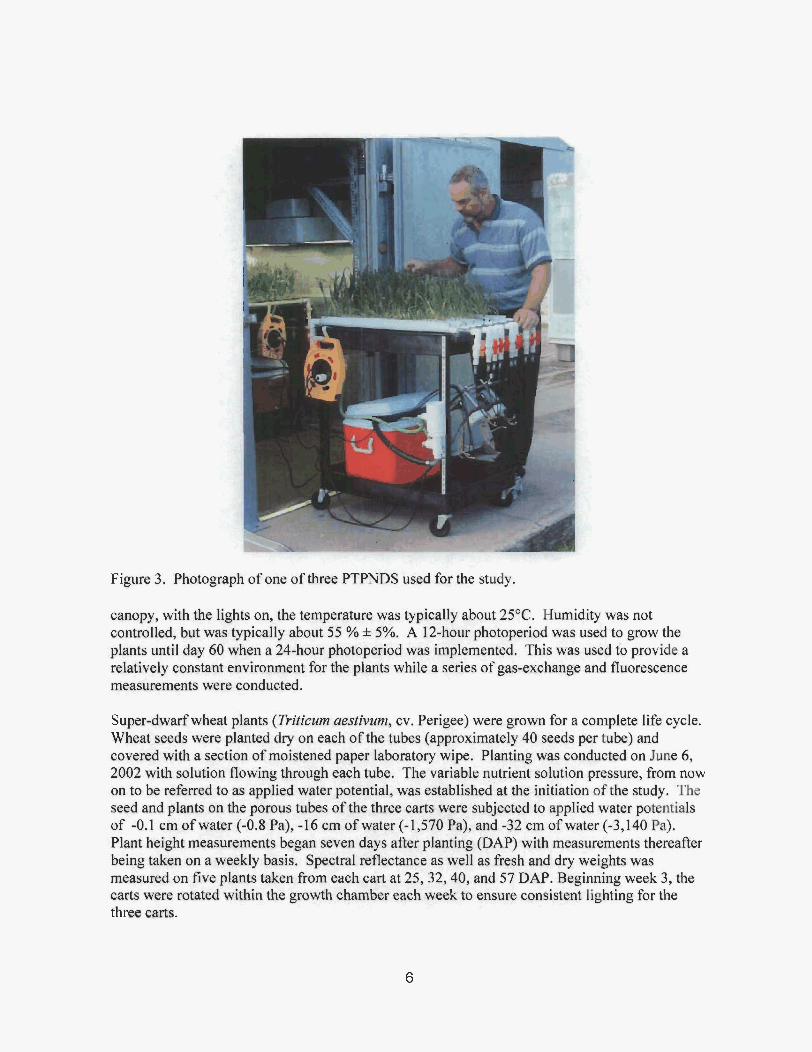
Eight porous ceramic tubes, 2 CM in diameter and 80 crn in length were placed on each of three laboratory carts. These tubes were connected to a standpipe using a manifold at the upstream end and connected to a peristaltic pump at the downstream end. The nutrient solution for each cart was contained in an insulated 80-liter covered container (cooler) and the sdution was pumped to the standpipe using a submersible (magnetically coupled impeller) pump. One-half inch vinyl hose carried the solution to lthe standpipe and three-eighths inch vinyl hose carried the overflow firom the standpipe back to the reservoir. Solution was supplied from the standpipe to the manifold via another one-half inch vinyl hose. Two laboratory-scale peristaltic pumps, each with four heads, draw the s o h i o n through each ceramic tube and return it to the reservoir at a rate of nine milliliters per minute, per porous tube. Each cart can be independently moved relative to the others, allowing ready ficcess to any rrfthe plants being grown an the cart (Figure 3).
Metal-halide lamps provided lthe photosynthetically active radiation for the plants and were hung on a structure that allowed the carts to; be moved underneath the lights. Nutrient soIution was maintained by adding water daily to the reservoir and periodicaIly adding concentrated nutrients to maintain solution conductivity. A bracket system allowed the standpipes to be placed at the level of the porous tubes down to about 40 crn below the tubes, This creates a pressure difference beEween the tubes and the standpipe and was used to establish the initial three treatments: near zero pressure; -t6.Q crn of water pressure; and -32.0 cm of water pressure on the nutrient solution within the porous tubes. The entire system was constructed and maintained within a controlled temperature chamber, a walk-in refrigerator (3 m x 4 m x 2.51-n). Chamber temperature was typically 22°C with lights on and 18°C with the lights OK Within the plant
5
1
i
I-
t ':-
Figure 3. Photograph of one of three PTPNDS used for the study.
canopy, with the lights on, the temperature was typically about 25°C. Humidity was not controlled, but was typically about 55 % f 5%. A 12-hour photoperiod was used to grow the plants until day 60 when a 24-hour photoperiod was implemented. This was used to provide a relatively constant environment for the plants while a series of gas-exchange and fluorescence measurements were conducted.
Super-dwarf wheat plants (Triticum aestivurn, cv. Perigee) were grown for a complete life cycle. Wheat seeds were planted dry on each of the tubes (approximately 40 seeds per tube) and covered with a section of moistened paper laboratory wipe. Planting was conducted on June 6, 2002 with solution flowing through each tube. The variable nutrient solution pressure, from now on to be referred to as applied water potential, was established at the initiation of the study. The seed and plants on the porous tubes of the three carts were subjected to applied water potentials of -0.1 cm of water (-0.8 Pa), -I6 cm of water (-1,570 Pa), and -32 cm of water (-3,140 Pa). Plant height measurements began seven days after planting (DAP) with measurements thereafter being taken on a weekly basis, Spectral reflectance as well as fresh and dry weights was measured on five plants taken from each cart at 25, 32,40, and 57 DAP. Beginning week 3, the carts were rotated within the growth chamber each week to ensure consistent lighting for the three carts.
6
Spectrdon-white reflectance panel, Upwelling radiance was measure( spectral samples of each leaf. Reflectance was calculated as the ratio Afi-trminrwmll;nn v q l i i c e d 11 e f i ~ ~ t m l rneociirempntE 1 1 7 p t - e r n i l l m i p e ; n r r 9 ~ I I
Spectral data were collected using an Analytical Spectral Devices (ASD) Fieldspec Pro spectrograph (ASD 1999). Downwelling radiance (as digital number) was estimated using a
1 as the average of30 of the upuelling to the
uw.v,,y.b,a,,,6 .ZIIUbJ. J y b v I L u I .llvucluLI.llclllccl ..uLl UJI ,mb ~ n g s t e n light source set at a constant output level with a rheostat. All angles of measurement, illumination and distances between target leaves, light source and ASD optical probe were held constant to minimize bi- directional influences. For each treatment, flag leaves from five randomly selected plants were used ir s. Leaf spectral reflectance w a s measured immediately after fresh v letermined (Ohaus Analytical Plus Balance; k0.00 1 g). The plants were then dried at 7U"L for 72 hours and reweighed to determine the pEant dry weight.
1 the spectral measurement veights af the plants were c
a . . - - A - n
Data collected with the ASD spectrograph were sub-sampled at 5nm intervals to reduce issues associated with correlations between adjacent spectral bands (Demetriades-Shah et al. 1990). Analyses focused on data from DAP 57, a period that demonstrated significant differences in leaf percent moisture for the three applied water potentials. A simple correlation analysis was run between the spectral reflectance data and the percent moisture to define first order relationships between reflectance values and leaf moisture, To assess possible relationships between leaf percent moisture and spectral curvature or inflection a three band inflection ratio (Grew 1980, Bostater et al. 1994) was computed. Spectral smoothing was utilized to reduce influences of noise and maximize the signal (Demetriades-Shah et al. 1990). The inflection estimator was defined as:
where I ( A ~ is the inflection or curvature estimator centered at band i calculated from the reflectance signature. M and n are forward and backward operators, respectively. For this analysis m and n were 9 band steps or about 50 nrn after smoothing. Correlograms were generated to identify areas of strong correlation between the inflection estimator and leaf percent moisture. Analysis of variance was used to test for significant differences between inflection values in the regions of highest correlation associated with the three levels of root water potential. The Bonferroni painvise mean comparison test was used to test between individual treatment differences. A least squares linear model was calculated to describe the strength of the relationship between leaf percent moisture and the three band inflection estimator computed from reflectance data. Analyses and data processing were conducted with Systat 9 (SPSS 1999).
PhysialogicaI parameters were measured with a LiCos 6406 Portable Photosynthesis System (LiCor; Lincoln, NE) Q ~ I flag leaves of pPants from each treatment. Measurements of photosynthesis, stomatal conductance, and fluorescence were taken on one or two plants from each cart I5,26,32.34,36,39,41, and 55 DAP. Leaves were dark adaloted for 20 minutes using the LiCor 6400 with the leaf chamber fluorometer attachment. Fluorescence and gas-exchange measurements were made on the dark adapted leaf. After dark adapted measurements were
. . . . - . -
000, 800,600,300, i00,50, and 0 I rends between the treatments.
7

Regular additions of wafer to the reservoirs were recorded to provide a rough estimate of evaporation and water uptake by the plants. The number of plants that had produced tillen was counted on DAP 60 to determine differences between treatments.
In order to determine if the different applied water pressures affected the various growth parameters (YO moisture, height, # tillers, fresh weight, dry weight, etc), analysis of variances were conducted. If a significant difference was found, then Games-Howell Post Hoc tests were conducted to determine which treatments differed from the others.
RESULTS
Following planting of the wheat seed, approximately 85% germination was observed over the next two days. No trend in plant height growth persisted through the entire study (Figure 4). Plant height growth was statistically different between all three treatments for DAP 7, 14 and 21, however the order of the treatments did not remain the same. By DAP 21 height growth in the - 0.1 em treatment was significantly lower than in the other two treatments. This trend persisted until DAP 69, when the -0.1 cm treatment increased dramatically relative to the other two treatments so that by DAP 69 the height was statistically similar to that of the plants in the -16.0 cm treatment. The height growth of the -32.0 cm treatment was significantly lower than the other two treatments by DAP 69.
Tiller production varied between the three treatments (Figure 53. The -0.1 cm treatment demonstrated a much higher production of tillers at DAP 60 and 69 than did the other two treatments, such that 38% and 49% of the stalks were tillers respectively. The difference in tiller production between the -1 6.0 cm and -32.0 cm treatments was greater at DAP 60 than at DAP 69 {EO% rend 2% respectively).
No trend in photosynthesis between the treatments was observed (Figure 6) . In fact little variation was observed in either respiration or photosynthesis under low Iight (300 pmols rn? s-'}. However, photosynthesis under high light (1 200 pmols m-* s-'> was more variable, but no treatment consistently had higher rates of photosynthesis.
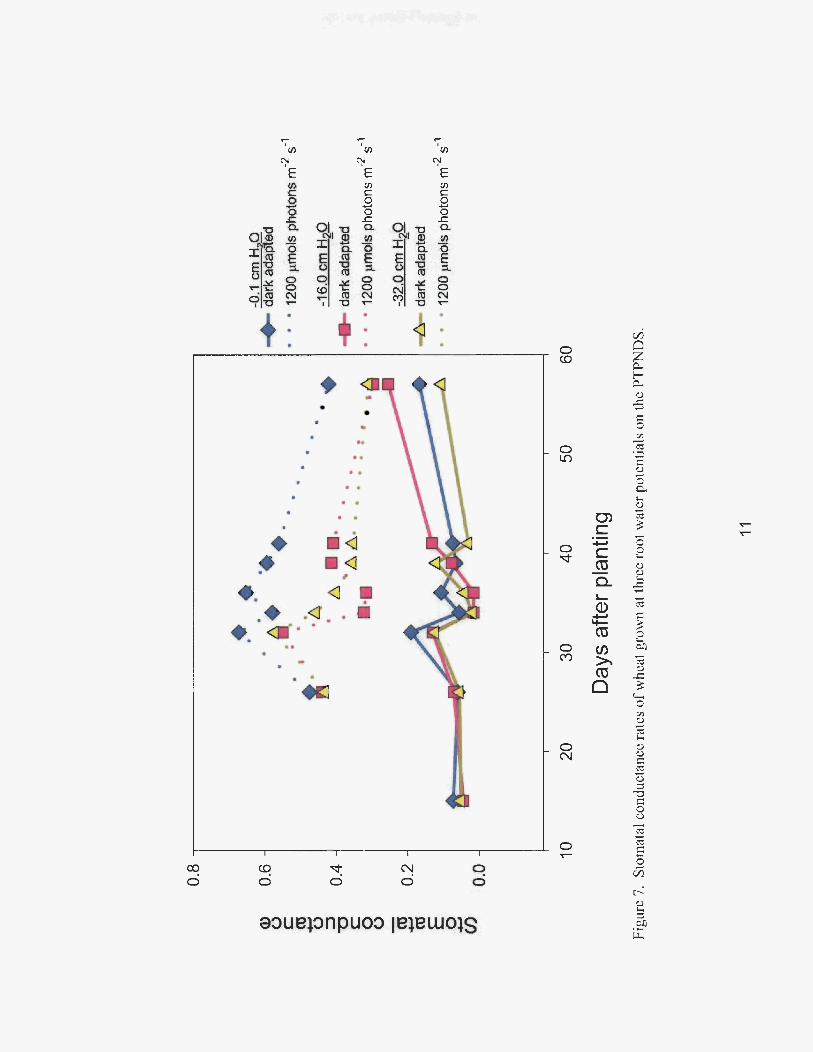
Unlike photosynthesis, trends were observed in stomatal conductance when the plants were Iight adapted (Figure 7). The -0.1 cm treatment consistently had higher stomata1 conductance than did the other two treatments. This increase in stomatal conductance without a corresponding increase in photosynthesis, indicates that the plants in the -0. I crn treatment were less water use efficient (WUE) than the plants in the other two treatments. No consistent trend was found in Conductance between the -I 6.0 cm and -32.0 cm treatments. Interestingly, trends in the amount of water added to the reservoirs were not in agreement with the conductance data (Figure 8). Both the -0.1 crn and the -1 6.0 cm trays had more water added to the reservoir late in the experiment where as the -32.0 crn treatment had less water added. This would suggest that conductance of the two stressed treatments should differ considerably. This difference was not observed.
8

35
n 25 - E
E 2 0 -
0 W
0)
a)
I 1 5 -
.-
10 -
D I
I i a
t n
-0.1 cm H,O -16.0 cm H,O
0 10 20 30 40 50 60 70 80
Days after planting Figure 4. Measuremmk of plant hebht for the wheat grown at three appIied water potentials on the PTPNDS.
60
0 -0.1 -1 6 -32
Pressure [cm H20)
9

1
f I I 1 I r L
A
0 hl
0 Y
T
u)
9 E
T
u)
9 E u) c 0 0 CI
0 m U
0 m
& 0 .a U
3 0 Tf
+ 0 0
0 0 3 5 + m
0 m a
r -
1 .
U + .a 0 c 3 rr 0 m 0 .a +
0 cv
0 7 I
c9 0
I
(4 0
I
c\! 0
I
7 0

140000 -
120000 -
100000 -
80000 -
60000 -
40000 -
20000 -
0 - I b I
0 20 40 60 80 100
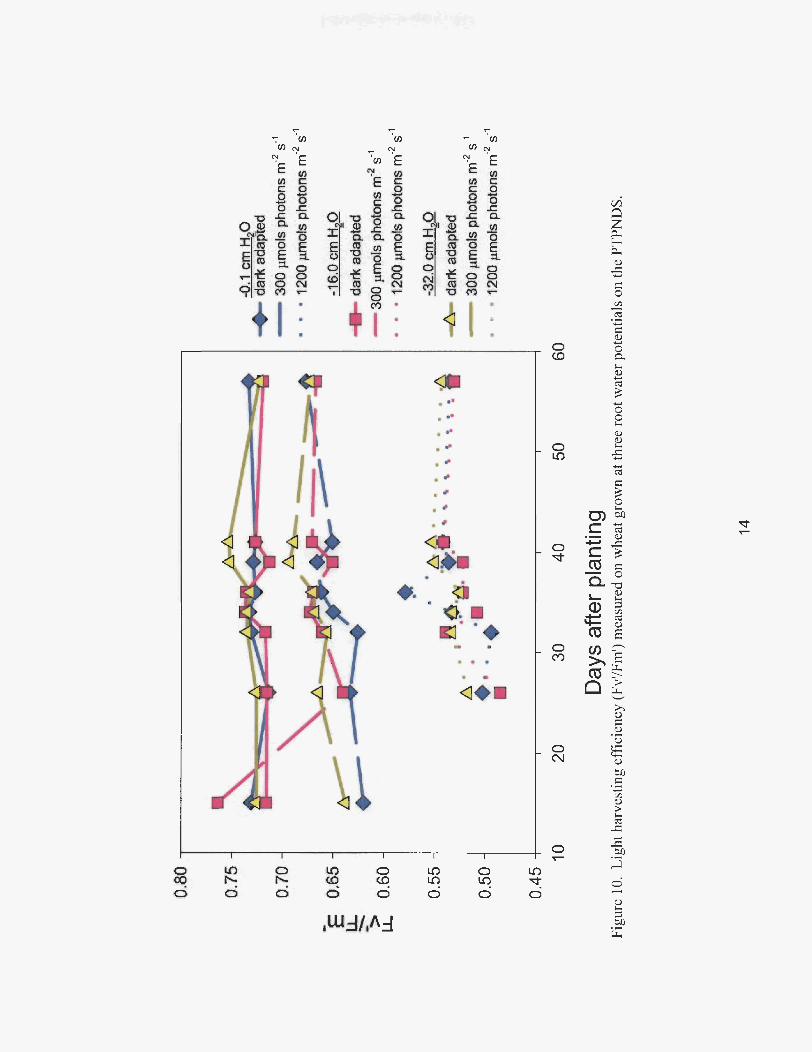
No trends hetwmn the three RreerSrnents were. exhibited in the fluorescence measurements. For exrunpie, the light harvesting eBdmciw (Figure 10) as we11 as the ma-photochemical quenching (Figure 11) of plants on all t h e treatments were sirnilm during both dmk and light adaptahon.
12

inflection paints across the SO0 m near-inhmd region (Figure I2 and Table 1). Trends between the treatments can be seen in the mean reflectance signatures for the region 750 to 1000 run, during the time frame when significant differews in l d percent moisture were exhibited Figure 13). Interestingly the nbrpt ian mea centered sound 860 nm, when converted from refleetmce to the hfl wtim & W e , is strongly related to Iea€pawnt moisture (Fi re 14).
~ treatments explain a 1wge amount ofttx variayity in iaaeotion estimate PC.75, p =O.OOO}. The -32.0 cm txmtmmt had significantly difikmt iriflecth estirnaks t b the -0.1 cm and -16.0 cm treatmats (p-a.000 and 0.003 mpectivdy). No significant difference was found h the Median estimates of the - 0 . 1 crn and -1 6,0 cm treatments.
85 -
r
s C
d + -0.1 cm H,O
-16.0 cm H,O A -32.0cm H,O
# 8 0 -
3 cn 0
CI
.-
E 7 5 - CI c m - n
70 -
65 1 I
25 32 40 57 69
Days after planting Figure 9. Percent leaf moisture of wheat plants grown at three different appIied water potentials on the PTPNDS.
13
7
(I)
7 "
'0 E
0 In Ln T 0 0
0 (D
0 In
0 *
0 m
0 cv
0 7

'E
0 a
i I II
/n u? 2 0
Nb
t' 0
c9 0
c? 0
7
0
0 rn
0 d-
0 cr)
0 (v
0 7
i c)
m +
3 + 0 e 0 2 _- c + + c
m s e M
cr 0 h
z

0.75 -
0.50 -
0.25 -
0.00
-0.25 -
-0.50
-0.75
-1 .oo
. . . . . . . . . . . . . . . . . . . . . . . - . - . . . . . .
. . . . . . . . . . . . . .
. , .
Reflectance l - . . , . . , . Inflection
400 500 600 700 800 900 1000 1100
Wavelength (nm) Figure 12. Correlation between leaf percent moisture, measured reflectance and calculated inflection estimates for leaves collected on DAP 57.
Table 1. Correlation between estimates of inflection and percent leaf moisture for six bands. Mean inflection estimates of 1 .O represent a flat line; values above 1 .O are concave down.
Probability Inflection Bands
- * A A n-. * n-- - Mean Inflection
Estimate - A n - ?
Pearson Correlation Coefficient
--_.- I I I I I
/bV.Y, 8L1 ,b, 813 .5 U.VY53 U.3JU41 0.04192 775.7,827.4, 878.9 0.9747 0.7 1373 0.00281 781.5,833.1,884.7 0.955 1 0.59977 0.0181 1 827.4,878.9,930.6 0.9966 -0.58545 0.02 185 833.1,883.7,936.4 1 .0283 -0.686 1 1 0.00470 838.8,890.5,942.I 1.053 1 -0.5753 1 0.02480
16

0'42 c
0.36
0 40
0.34 800 850
Wavelength (nm)
900 950
Figure 13. Average reflectance signatures far leaves W a s t e d at DAP 57 for each applied water potential.
L - 0.9
0.8 800 820 840 860 880 900 920
Wavelength (nm) Figwe 14. kat^ h f k h euithata fofeuchappbkl w r pmtid.
800 tind 920 m h r l e a w hm.wc&d at DAP 57
17
DISCUSSION
The porous tube nutrient delivery system performed well and wheat plants were cultured using three different applied water potentials in the rhizosphere; -0.1 cm of water (-.8 Pa), -16 cm of water (1,570 Pa), and -32 cm of water (3,140 Pa), In a previous study, Dreschel et al. ( I 990) found that wheat plants grown to maturity under three different water potentials demonstrated differences in yield relative to the water potential. For example, with a decrease in applied water potential (becoming more negative), the resultant yield was decreased. Therefore it was expected that the -0.1 cm treatment would exhibit superior growth compared to the other two applied water potentials. It was evident after the first week post planting that this was not the case. Instead these plants appeared to be under water-logged conditions early in their life cycle and until the amount of leaf transpiration was sufficient to overcome this condition, the plant roots were oxygen stressed. When the leaf transpiration rates were sufficient, the growth rate of the p1ants accelerated and matched or exceeded the growth rate of the plants grown with the other two applied water potentials (Figures 4 and 5) . Plants grown on the PTPNDS, when compared to other growth techniques, have k e n found to exhibit Tower levels of stress due to oxygen deprivation in the rhizosphere (Porterfield 1996). However the cmditicms were such in the early stages of development for the -0.1 cm treatment, that oxygendeprivation stress was exhibited. The ather two treatments grew as anticipated, with the plants on the -1 6.0 cm treatment growing faster and with a higher moisture content and fresh weight than their counterparts on the -32.6 cm treatment.
The amount ofapplied water potential that the roots were exposed to was small when compared to commonly accepted field capacity values (soil at near water saturation) of around -1J3 atmosphere. Even the largest of our three applied water potentials (-32 cm of water = -0.03; atmosphere) was m l y about me-tenth that of an accepted value for field capacity. Yet these differences were detectabIe using spectral altalysis.
Two regions of the infrared reflectance spectra, the near- (700-1 300 nm) and middle- (1 300-3000 nm), have been identified as being useful for the detection of vegetation water stress or water content (Tucker 1980, Ripple 1986). Organic bonds found in foliar mass exhibit vibrational stretching modes that absorb radiation in these regions of the spectrum. Pure water absorption bands occur at around 760,970, 1450, 1940, and 2950 nm in response to the OH bond (Grant 1987). Bostater et al. (1 994) found that changes in the curvature or inflection of the reflectance signature in the 970 nm region was highly correlated with water potential and percent moisture of scrub oak leaves. In this study, changes in the shape of the spectral curve between 790 and 945 nrn displayed strong significant correlations with percent moistwe in the super dwarf wheat plant leaves. An especially encouraging result was the ability to detect, in a statistically significant fashion, the small change in mean leaf water content of 5% that occurred between treatments. This feature could not be detected utilizing standard reflectance data values that displayed RO significant correlations with percent moisture in leaves.
Although these small differences in leaf water content were detected in the spectral analysis, they were not detected in the gas-exchange or fluorescence measurements. Under water-stressed conditions. plants arc expected t~ exhibit a decrease in photosynthesis and conductance while experiencing an increase in fluorescence ht higher light intensities. Berry et al. (1992) found that
18
wheat plants grown under various applied water potentials on the PTPNDS demonstrated differences in net carbon dioxide uptake and water use efficiency. However, in this study, the expected trends were not observed for most parameters. The plants on the -0.1 cm tray were expected to be the least water stress, thus exhibiting higher photosynthesis and conductance while having the least amount of non-photochemical quenching. The plants on the -32.0 cm tray were expected to have the lowest rates of photosynthesis and conductance, while exhibited high levels of non-photochemical quenching particularly at high light intensities. However in most cases, no distinguishable trends were found for the parameters, with the exception of conductance. The -0. I cm tray consistently had the highest conductance of the three treatments. Since photosynthesis was similar between all treatments, this indicates that plants on the -0.1 cm tray were the least water-use efficient. The most probable reason for the discrepancy between the expected and observed results is that the water potentials applied using the PTPNDS were not sufficient to induce severe water-stress in this species. Lu and Zhang (1 998) found that a cultivar of wheat (Triticum uestivium L. cv. Shannong 229) when exposed to high light it was only the more severely water-stressed plants that exhibited a difference in measures of fluorescence. The most severely stressed plants (-1.8 and -2.1 Mpa) exhibited lower light harvesting efficiencies (Fv’/Frn’) as well as increases in non-photochemical quenching (qN).
CONCLUSIONS
The rkizospheric water potential of super dwarf wheat plants (Triticum aestivum, cv. Perigee) was maintained at three different pressures using the Porous Tube Plant Nutrient Delivery System. Varying this water potential was found to impact the growth and development of the plants and altered the water content of the leaves. The applied water potentials used in this study are small when compared to field capacity values reported in the literature, and yet there was a measurable effect on plant moisture content, growth, and development. The difference in water content was detectable using spectral analysis, but was too small for gas-exchange or fluorescence measurements to detect. However there is still a great deal of work to be done to develop robust algorithms or methods for precisely estimating plant biochemical and biophysical properties utilizing remote sensing approaches.
ACKNOWLEDGEMENTS
This work was conducted under NASA contract NAS10-I2 I80 and the Life Sciences Services Contract at Kennedy Space Center. Technician support was provided by Caroline Peterson and Max Salganic through the NASA Spaceflight and Life Sciences Training Program, The NASA Summer High School Apprenticeship Research Program and the Brevard County Executive Intern Program at Titusville High School. Special thanks to DG William Knott 111, Senior Scientist at Kennedy Space Center, for his support and continued encouragement.
REFERENCES
Asner, G. P. 1998. Biophysical and biochemical sources of variability in canopy reflectance. Remote Sens. Environ. 64:234-253.
19

Berry, W. L., G. Goldstein, T. W. Dreschel, R. M. Wheeler, J. C . Sager, and W. M. Knott. 1992. Water relations, gas exchange, and nutrient response to a long term constant water deficit. Soil Science 153:442-450.
measurements of high resolution spectral signatures of plants and reIationships indicating water status. Pages 387-402 in R. B. Gomez, editor. International Symposium on Spectral Sensing Research, San Diego, CA.
tubular membrane hydroponic system with that in conventional hydroponic culture. HortScience 22:75 (abstr.),
Chetirkin, P. V,, T. W. Dreschel, J. C. Sager, and Y . A. Berkovitch. 1994. WET-M (CBET-MI): Evaluation of a ground-based version of a Russian plant growth chamber. ASGSB Bulletin 8:37-38 (abstr.).
Demetriades-Shah, T. H., M. D. Steven, and J. A. Clark. 1990. High resolution derivative spectra in remote sensing. Remote Sens. Environ. 33:55-64.
Dreschel, T. W. 1990. Plant nutrient delivery system having a porous tubular member. in, United States Patent and Trademark Office, Washington, D. C .
Dreschel, T. W. 1992. Monitoring and controlling hydroponic flow. NASA Tech Briefs 16: 1 13- 114.
Dreschel, T. W., and C. S. Brown. 1993. Water conserving plant-growth system. NASA Tech Briefs 17:89-90.
Dreschel, T. W., C. S . Brown, C. R. Hinkle, J. C. Sager, and W. M. Knott. 1990. Development of a porous tube plant nutrient delivery system for the space shuttle middeck locker plant growth unit. ASGSB Bulletin 4:5 1 (abstr.).
A summary of porous tube nutrient delivery system investigations from 1985-1991. NASA Technical Memorandum # 107546 The National Aeronautics and Space Administration, Kennedy Space Center, FL.
plant nutrient delivery system development: A device for nutrient delivery in microgravity. Advances in Space Research 14:47-5 1.
Dreschel, T. W., C. W. Carlson, H. W. Wells, K. F. Anderson, W. M. Knott, and W. Munsey. 1993. Physical testing for the Microgravity Plant Nutrient Experiment. in Mimeogr. Paper #93-4007 presented at the American Society of Agricultural Engineers, Chicago, IL.
Dreschel, T. W., and J. C. Sager. 1989. Control of water and nutrients using a porous tube: a method for growing plants in space. HortScience 24:944-947.
Dreschel, T. W., J. C. Sager, and R. M. Wheeler. 1988. Status of porous tube plant growth unit research. Mimeogr. Paper #88-4524 presented to the American Society of Agricultural Engineers.
Dreschel, T. W., J. C . Sager, and R. M. Wheeler. 1989a. Plant growth in a porous tube nutrient delivery system: the effects of pressure and pore size on productivity. ASGSB Bulletin 2:37-38 (abstr.).
Dreschel, T. W., R. M. Wheeler, J. C . Sager, and W. M. Knott. 1989b. Factors affecting plant growth in membrane nutrient delivery. ipl R. D. MacElroy, editor. Controlled Ecological Life Support Systems: CELSS '89 Workshop, Ames Research Center, Moffett Field, CA.
Bostater, C . R., C. R. Hall, D. Vieglais, J. Rebmann, and M. Provancha. 1994. Temporal
Bubenheim, D. L., T. W. Dreschel, and C. A. Mitchell. 1987. Comparison of plant growth in a
Dreschel, T. W., C . S. Brown, C. R. Hinkle, J. C. Sager, R. M. Wheeler, and W. M. Knott. 1992.
Dreschel, T. W., C. S. Brawn, W. C. Piastuch, C. R. Hinkle, and W. M. Knott. 1994, Porous tube
20

Grant, C. 1987. Diffuse and specular characteristics of leaf reflectance. Remote Sens. Environ.
Grew, G. 1980. Real-time test of MOCS algorithm during Superflux 1980: in. Pages 301 -322 in Chesapeake Bay Plume Study, Superflux 1980. NASA Pub. 21 88, Washington, D. C.
Jacquemoud, S., J. Vredebout, G. Schmuck, G . Andreoli, and B. Hosgood. 1995. Investigation of leaf biochemistry by statistics. Remote Sesn. Environ. 54: 180-1 88.
Lu, C., and J. Zhang. 1998. Effects of water stress on photosynthesis, chlorophyll fluorescence and photoinhibition in wheat plants. Aust. J. Plant Physiol. 25883-892.
Monje, O., G. W. Stutte, H. T. Want, and C. J . Kelly. 200 1. NDS water pressures affect growth rate by changing leaf area, not single leaf photosynthesis.
Peterson, T. A., D. T. Krizek, and T. W. Dreschel. 1989. Tomato plant growth on a CELSS tubular membrane growth unit. ASGSB Bulletin 3:93 (abstr.).
Porterfield, D. M. 1996. Characterization of physiological changes in roots grown in spaceflight conditions: a comparison of nutrient delivery technologies. Dissertation. Louisiana State University, Baton Rouge, LA.
Remote Sens. 52:1669-1775.
a porous tube-water delivery system. HortScience 27:430-432.
tube system subjected to non-standard gravities. in Mimeogr. paper #961505 presented to the 26th International Conference on EnvironmentaI Systems. The Society of Automotive Engineers, Monterey, CA.
mathematical models for the Porous Ceramic Tube Plant Nutrification System (PCTPNS). NASA Technical Memorandum # 10755 1 The National Aeronautics and Space Administration, Kennedy Space Center, FL.
Tucker, C. J. 1980. Remote sensing of leaf water content in the near infrared. Remote Sens. Environ. 10:23-32.
22:309-322.
Ripple, W. J. 1986. Spectral reflectance relationships to leaf water stress. Photogramm. Eng.
Takahashi, H., C. S. Brown, T. W. Dreschel, and T. K. Scott. 1992. Hydrotropism in pea roots in
Tsao, D., M. R. Okos, and J. C. Sager. 1996. Controlling the water availability from a ceramic
Tsao, D., M. R. Okos, J. C. Sager, and T. W. Dreschel. 1992. Development of physical and
21
Demonstration of e p o r o u ~ tube hydroponic a p t e m to contro: plant moirrture a d growth
NAS10-02-001
I
T. Dreschal'J C. Hall2, T. pouter 2
-corporation
ONSORING I MONITORIN iENCY AEPORT HUMBER
Wheat p l m t a , porous tube, spectral analysis, photosynthesis, I fluorescence

r s d i u r r i i i r i q UIUOIII.
esl. Self-emtanaton
I .
. - . - - - . - - . . , . - . -. - . . . - - . . . . 4dd rersIes). Sel f-ex pl a na to