Embed Size (px)
Citation preview

water
Article
Demonstrating Commercial Hollow Fibre Membrane ContactorPerformance at Industrial Scale for Biogas Upgrading at aSewage Treatment Works
Sam Houlker 1, Tony Rutherford 2, Daniel Herron 2, Adam Brookes 3, Andrew Moore 2, Peter Vale 4, Marc Pidou 1
and Ewan McAdam 1,*
Citation: Houlker, S.; Rutherford, T.;
Herron, D.; Brookes, A.; Moore, A.;
Vale, P.; Pidou, M.; McAdam, E.
Demonstrating Commercial Hollow
Fibre Membrane Contactor
Performance at Industrial Scale for
Biogas Upgrading at a Sewage
Treatment Works. Water 2021, 13, 172.
https://doi.org/10.3390/w13020172
Received: 12 November 2020
Accepted: 14 December 2020
Published: 13 January 2021
Publisher’s Note: MDPI stays neu-
tral with regard to jurisdictional clai-
ms in published maps and institutio-
nal affiliations.
Copyright: © 2021 by the authors. Li-
censee MDPI, Basel, Switzerland.
This article is an open access article
distributed under the terms and con-
ditions of the Creative Commons At-
tribution (CC BY) license (https://
creativecommons.org/licenses/by/
4.0/).
1 Cranfield Water Science Institute, Cranfield University, Bedfordshire MK43 0AL, UK;[email protected] (S.H.); [email protected] (M.P.)
2 Northumbrian Water, Boldon House, Pity Me, Durham DH1 5FJ, UK; [email protected] (T.R.);[email protected] (D.H.); [email protected] (A.M.)
3 Anglian Water, Thorpewood House, Peterborough PE3 6SR, UK; [email protected] Severn Trent Water, Coventry CV1 2LZ, UK; [email protected]* Correspondence: [email protected]
Abstract: Hollow fibre membrane contactor (HFMC) technology has been developed for CO2 absorp-tion primarily using synthetic gas, which neglects the critical impact that trace contaminants mighthave on separation efficiency and robustness in industrial gases. This study, therefore, commissioneda demonstration-scale HFMC for CO2 separation at a full-scale anaerobic digester facility to evaluatemembrane integrity over six months of operation on real biogas. The CO2 capture efficiency identifiedusing real biogas was benchmarked at comparable conditions on synthetic gas of an equivalent partialpressure, and an equivalent performance identified. Two HFMC were subsequently compared, onewith and one without a pre-treatment stage that targeted particulates, volatile organic compounds(VOCs) and humidity. Similar CO2 separation efficiency was again demonstrated, indicating limitedimpact within the timescale evaluated. However, gas phase pre-treatment is advised in order toensure robustness in the long term. Over longer-term operation, a decline in CO2 separation efficiencywas observed. Membrane autopsy identified shell-side deposition, where the structural morphologyand confirmation of amide I and II groups, indicated biofouling. Separation efficiency was reinstatedvia chemical cleaning, which demonstrated that proactive maintenance could minimise process risk.
Keywords: carbon capture; biogas; prefiltration; membrane fouling; wastewater treatment works
1. Introduction
Anaerobic Digestion (AD) at wastewater treatment works (WWTW) can recover 34% ofthe initial energy of raw wastewater as biogas [1]. When upgraded to biomethane (≥98% CH4),it is an energy-dense renewable heat source [2–4]. In the UK by the end of 2017, around 90 siteswere producing biomethane, which was primarily facilitated through gas-liquid absorptioncolumns at larger wastewater treatment installations [5,6]. Absorption columns are energy-intensive, requiring up to 0.3 kWh Nm−3 biogas [7] and suffer from flooding, channellingand entrainment, which limits their operational range [8]. Hollow fibre membrane contactors(HFMC) are a promising alternative to gas-liquid absorption as the membrane extends therange of operating conditions that can be applied, due to imparting a phase change between theliquid and gas, which eliminates flooding and entrainment [8–10]. The increased interfacial areaalso introduces a 15-fold process intensification into the absorption column [11,12], reducingthe process footprint, capital cost and energy demand.
Whilst much of the HFMC development has been undertaken on synthetic gases,several authors have sought to validate their robustness in an industrial setting with theuse of real gases, with particular emphasis on their application to post-combustion carboncapture storage (CCS) [13]. Pilot plant trials by Kværner Process Systems demonstrated
Water 2021, 13, 172. https://doi.org/10.3390/w13020172 https://www.mdpi.com/journal/water
Water 2021, 13, 172 2 of 14
sustained module performance for 7000 h across eight modules employing polytetrafluo-roethylene (PTFE) fibres, with the longest-running module operating for 5000 h [14] on realindustrial flue gas from natural gas combustion [15], which evidenced weight, footprint,operational and capital cost reduction versus packed columns [14,16]. Comite et al. [17]applied HFMC to prefiltered industrial flue gases from a coal-fired power station andreported mass transfer data comparable to that derived on synthetic gas, which supportsobservations of Klaassen et al. [18] who did not observe a reduction in mass transfer overan operating period of 12 months on flue gas. Whilst successful, these examples primarilystudied application to gases derived from natural gas combustion, or prefiltered gaseswhere particulates could be expectedly limited. Biogas can be conceived as a more com-plex gas mixture containing a broad spectrum of trace contaminants including siloxanes,organic halides, microorganisms, terpenes, aldehydes and ketones, ammonia, particulates,pesticides, pharmaceuticals and moisture [19–23]. The introduction of such a complexmixture of trace determinants can be expected to increase the risk of membrane fouling orcapillary wetting [24].
Particulate fouling was experienced for a polypropylene HFMC applied to unfilteredflue gas [25], the authors reporting a visible build-up of fly ash on the membrane after 60h of operation [25], which accords with observations from another study [26–28]. Severalstudies using both PTFE and PP HFMC have also inferred that gas phase fouling degradedmass transfer when applied to gas comprised of SO2, fine particulates, H2O and CO2 [26,28].Consequently, whilst several studies report positively on the long-term demonstration inan industrial setting, evidence of deterioration in mass transfer during operation reportedby other researchers, suggest there is some discontinuity in the literature, likely due to thechanges in the composition of the gas. This is particularly important for biogas, since thegas is ostensibly more complex, yet the evaluation of commercially available membranes forbiogas in an industrial setting has been studied significantly less. To our knowledge, Vogleret al. [29] are the only authors to report on the stability of HFMC for biogas upgradingin an industrial setting. Their system comprised potable water as the absorbent and pre-treatment using a carbon filter [29]. An important distinction between flue gas and biogasis also the risk of liquid side fouling by the absorption fluid, which has been observed toblock packing media in classical gas-liquid absorption columns due to biological foulingintroduced through regrowth, despite the deployment of potable water as the absorptionsolvent [23]. This study proposes to complement and build upon the limited existingliterature on real gases, through implementing a demonstration-scale HFMC system withina full-scale anaerobic digestion facility in order to determine technology robustness for CO2separation on real biogas. The specific objectives of the study are to: (i) evaluate the effect ofgas-phase contaminants on HFMC robustness through the inclusion and gradual removalof multi-media prefiltration (activated carbon, a molecular sieve and a desiccant) whichimmediately protects the membrane from particulates, volatile organics and moisture; (ii)evidence the (in)significance of the liquid phase to sustaining the mass transfer of CO2from real gas; and (iii) determine the recoverability of membrane performance throughstandard cleaning protocols, following fouling.
2. Materials and Methods2.1. Experimental Set-Up
Biogas (CO2: 34%–39%) produced on-site at an anaerobic digester was redirected fromthe primary biogas pipeline to the HFMC system post chiller (Figure 1) and gas booster,which removed ‘free water’ from the gas phase and increased gas pressure to 75 mBar.Due to the low gas pressure following prefiltration (<60 mBar), the gas flow rate wasmaintained using an inline double-acting flow control valve (F.lli Tognella Spa, Rome, Italy)and manually corrected according to the inlet ST75V Mass Flow Meter (3.4–30 L min−1,error ± 1.5, Fluid Components International LLC., San Marcos, CA, USA). Gas prefiltrationwas achieved using VACU-GUARD 150 (Whatman International Ltd., Maidstone, UK)inline filters comprised of activated carbon/PTFE membrane (AC) for particulate and

Water 2021, 13, 172 3 of 14
siloxane removal, anhydrous calcium sulphate/PTFE membrane (ACS) for gas dryingand Silica-Alumina zeolite/PTFE membrane (SAZ) as a molecular sieve. Gas and liquidpressure were measured using PX319 series pressure transducers (0–10 BarG, OmegaEngineering Ltd., Manchester, UK). Unfiltered or prefiltered biogas flowed on the lumenside of the transverse flow HFMC. The EXF Series 2.5 × 8 inch 3M Liqui-Cel HFMC module(3M Industrial Group, Charlotte, NC, USA) comprised of 10200 microporous polypropyleneX-50 fibres, with an outer diameter, inner diameter and fibre length of 300 µm, 240 µm,and 0.16 m respectively. The surface area of each module was 1.2 m2 based on internalfibre diameter [30].
Potable water was stored in a 1 m3 IBC tank and applied as an absorbent to the shellside (0.6–9.5 L min−1) in counter-current mode using a centrifugal pump (SP5/A, Lowara,Xylem Water Solutions UK Ltd., Axminster, UK). The liquid flow rate was measuredusing a FMG90 series electromagnetic flowmeter (Omega Engineering Ltd., Manchester,UK). On-site biogas upgrading was undertaken in a non-controlled environment whereambient temperature (0–30 C), gas-phase pressure (0–80 mBar) and gas-phase composition(60–63% CH4 v/v) all varied. Two identical modules were used to separately study theimpact of prefiltration on the gas phase, and the impact of water source on membranefouling (potable, de-ionised water). To benchmark HFMC performance before and afterCO2 separation from real biogas, the HMFC was tested using synthetic biogas (50/50 and60/40 CH4/CO2) by mixing methane (CH4, 99.995%) and carbon dioxide (99.7%) (BOCgases, Ipswich, UK) using mass flow controllers with two prescribed flow rate ranges(0.01–1.0 L min−1 and 0.2–20 L min−1, Roxspur Measurement and Control Ltd., Sheffield,UK) to provide a combined flow rate between 0.05 and 3.5 L min−1 at a feed pressurecomparable to the real biogas. Absorption solvent (potable water or de-ionised water(15 MΩ)), was stored in an 85 L PVC storage tank. Experimentation on synthetic biogaswas undertaken in a temperature-controlled environment (20 C) with a third modulethat had been subject to 150 combined hours of on-site biogas upgrading over a period of150 days, using potable water and de-ionised water to investigate the impact of absorbenton membrane performance. Shell side membrane chemical cleaning was undertakenaccording to manufacturer guidelines [31] and consisted of a hydraulic cleaning step(75 min contact time, de-ionised water), a biological cleaning step (120 min contact time,4% (w/w) NaOH) a second hydraulic clean (15 min contact time, de-ionised water), aninorganic cleaning step (120 min contact time, 3% (w/w) HCl), a final hydraulic cleaningstep (75 min contact time, de-ionised water) followed by a 90 min gas drying step.
2.2. Experimental Analysis
Gas composition was determined using inline infrared CO2 and CH4 analysers (BCP-CO2 or BCP-CH4, accuracy <0.5% full-scale, Bluesens gas sensor GmbH, Herten, Germany).Outlet gas flow rate was measured by a QuadraTherm 640i series inline mass flow meter(1–30 L min−1, error ± 1.25%, Sierra Instruments, Monterey, CA, USA) utilising the QMixfunction to account for changing composition. Carbon dioxide removal was analysedthrough mass balance [32]:
ηCO2 =[(QG,in × CG,in)− (QG,out × CG,out)]
(QG,in × CG,in)
where ηCO2 is the dimensionless CO2 capture ratio, QG,in and QG,out are inlet and outletgas flow rates respectively (m3 s−1), and CG,in and CG,out are inlet and outlet gas-phaseconcentrations respectively (mol m−3). All gas mass flow data were standardised using nor-malised units (NL min−1). When varying the L/G ratio, absorbent flow rate (QL) was fixedbetween 0.2 and 8 L min−1, at each fixed QL, QG was fixed between 0.05 and 7 L min−1.When maintaining a constant L/G at 0.29, QL was fixed at 1 L min−1 and QG at 3.5 L min−1.A GC-MS suite of analytes comprising a range of trace volatile organic compounds (VOCs),total petroleum hydrocarbons (TPH) and gravimetric moisture analysis of raw biogas andprefiltered biogas was undertaken by Lucideon (Lucideon Ltd., Stoke-on-Trent, UK) using

Water 2021, 13, 172 4 of 14
a UKAS accredited methodology. Gas samples were collected in 0.5 L Tedlar bags andactivated carbon tubes exposed to 15 L (250 mL min−1) of the sample gas. Moisture contentwas assessed using gravimetric analysis of pre-weighed silica beads exposed to 15 L (250mL min−1) of the sample gas. Surface fouling was assessed through solvent extraction(dichloromethane) of volatile organic compounds and GC-MS analysis, undertaken byNorthumbrian Water Scientific Services (NWSS, Tyne and Wear, UK) using a UKAS accred-ited methodology. Fourier transform infrared spectroscopy (Bruker Vertex 70, Bruker UKLimited, Coventry, UK) was used to characterise the functional groups within the foulinglayer which was complemented by environmental scanning electron microscopy (ESEM)and energy-dispersive X-ray spectroscopy (EDX) (XL30 ESEM-FEG, Philips/FEI (part ofThermoFisher Scientific, Hillsboro, OR, USA) to determine bound inorganic compounds.
Water 2021, 13, x FOR PEER REVIEW 3 of 14
was maintained using an inline double-acting flow control valve (F.lli Tognella Spa, 97 Rome, Italy) and manually corrected according to the inlet ST75V Mass Flow Meter (3.4–98 30 L min−1, error ± 1.5, Fluid Components International LLC., San Marcos, CA, USA). Gas 99 prefiltration was achieved using VACU-GUARD 150 (Whatman International Ltd., Maid-100 stone, UK) inline filters comprised of activated carbon/PTFE membrane (AC) for particu-101 late and siloxane removal, anhydrous calcium sulphate/PTFE membrane (ACS) for gas 102 drying and Silica-Alumina zeolite/PTFE membrane (SAZ) as a molecular sieve. Gas and 103 liquid pressure were measured using PX319 series pressure transducers (0–10 BarG, 104 Omega Engineering Ltd., Manchester, UK). Unfiltered or prefiltered biogas flowed on the 105 lumen side of the transverse flow HFMC. The EXF Series 2.5 × 8 inch 3M Liqui-Cel HFMC 106 module (3M Industrial Group, Charlotte, NC, USA) comprised of 10200 microporous pol-107 ypropylene X-50 fibres, with an outer diameter, inner diameter and fibre length of 300 108 μm, 240 μm, and 0.16 m respectively. The surface area of each module was 1.2 m2 based 109 on internal fibre diameter [30]. 110
111
Figure 1. Schematic of experimental set up used for determining CO2 capture under differing L/G set points and integration 112 with existing absorption column upgrading system on-site at a wastewater treatment works (WWTW). 113
Potable water was stored in a 1 m3 IBC tank and applied as an absorbent to the shell 114 side (0.6–9.5 L min−1) in counter-current mode using a centrifugal pump (SP5/A, Lowara, 115 Xylem Water Solutions UK Ltd., Axminster, UK). The liquid flow rate was measured us-116 ing a FMG90 series electromagnetic flowmeter (Omega Engineering Ltd., Manchester, 117 UK). On-site biogas upgrading was undertaken in a non-controlled environment where 118
Figure 1. Schematic of experimental set up used for determining CO2 capture under differing L/G setpoints and integration with existing absorption column upgrading system on-site at a wastewatertreatment works (WWTW).
3. Results3.1. Operational Characteristics
The inlet biogas pressure fixed the gas flow rate to the HFMC, which measuredbetween 10 mBar (QG, 3.5 L min−1) and 33 mBar (QG, 7 L min−1). For these gas flow rates,the practicable liquid flow rate range was between 0.5 and 9.5 L min−1 correspondingto a liquid-to-gas ratio (L/G ratio) of between 0.2 and 2.7 (Figure 2). The CO2 captureratio (ηCO2) was characterised on-site for prefiltered biogas using potable water as theabsorption solvent (Figure 2). As the L/G was increased, an increase in ηCO2 was determined.This was comparable to the response observed for synthetic biogas, but a higher ηCO2 wasdetermined on-site for prefiltered biogas when compared over the same operating range.The average absorbent temperature was 14 C when on-site, compared to 20 C when in thelaboratory. Consequently, a discrete dataset collected on-site for an absorbent temperatureof 20 C was compared to laboratory data (Figure 2, Inset). A t-test for independent samples

Water 2021, 13, 172 5 of 14
yielded t = 0.7, which was markedly below tcritical (2.1, p-value 0.5), indicating data fromreal and synthetic biogas is comparable.
Water 2021, 13, x FOR PEER REVIEW 5 of 14
3. Results 168
3.1. Operational Characteristics 169
The inlet biogas pressure fixed the gas flow rate to the HFMC, which measured be-170 tween 10 mBar (QG, 3.5 L min−1) and 33 mBar (QG, 7 L min−1). For these gas flow rates, the 171 practicable liquid flow rate range was between 0.5 and 9.5 L min−1 corresponding to a 172 liquid-to-gas ratio (L/G ratio) of between 0.2 and 2.7 (Figure 2). The CO2 capture ratio (ηCO2) 173 was characterised on-site for prefiltered biogas using potable water as the absorption sol-174 vent (Figure 2). As the L/G was increased, an increase in ηCO2 was determined. This was 175 comparable to the response observed for synthetic biogas, but a higher ηCO2 was deter-176 mined on-site for prefiltered biogas when compared over the same operating range. The 177 average absorbent temperature was 14 °C when on-site, compared to 20 °C when in the 178 laboratory. Consequently, a discrete dataset collected on-site for an absorbent tempera-179 ture of 20 °C was compared to laboratory data (Figure 2, Inset). A t-test for independent 180 samples yielded t = 0.7, which was markedly below tcritical (2.1, p-value 0.5), indicating data 181 from real and synthetic biogas is comparable. 182
183
Figure 2. Comparison between CO2 separation observed with a hollow fibre membrane contactor (HFMC) for synthetic 184 and WWTW derived biogas. On-site: Absorbent, potable water, 14 °C; QG was fixed between 0.05 and 7 L min−1, QL was 185 then varied between 0.1 and 9.5 L min−1 for each QG. Lab operation: Absorbent, potable or DI water, 20 °C; QG and QL 186 varied across equivalent coordinates. Inset: absorbent temperature is on-site is comparable to laboratory conditions, 20 °C; 187 40/60 CO2/CH4 for both lab and WWTW operation. 188
A HFMC module was operated for an extended period of 115 days at a fixed L/G ratio 189 of 0.29 (QG, 3.5 L min−1; QL, 1 L min−1). During this period, the HFMC was permanently in 190 contact with the absorbent solution and achieved 76 h of cumulative biogas upgrading 191 (Figure 3a). Gaps in data represent time where data were not collected due to periods of 192 non-continuous reporting. After 35 h operation of another HFMC module, gas prefiltra-193 tion was removed and the membrane subject to approximately 12.5 h operation without 194 prefiltration, equivalent to a gas loading of 2625 L (2188 L m−2) (Figure 2). During this 195 phase, ηCO2 recorded without prefiltration was similar to that recorded with prefiltration 196 installed. Over the full duration, an average ηCO2 of 0.17 was determined up to day 115, 197 for the HFMC with prefiltration, after which a progressive decline in ηCO2 to 0.08 was ob-198 served. 199
Figure 2. Comparison between CO2 separation observed with a hollow fibre membrane contactor(HFMC) for synthetic and WWTW derived biogas. On-site: Absorbent, potable water, 14 C; QG
was fixed between 0.05 and 7 L min−1, QL was then varied between 0.1 and 9.5 L min−1 for eachQG. Lab operation: Absorbent, potable or DI water, 20 C; QG and QL varied across equivalentcoordinates. Inset: absorbent temperature is on-site is comparable to laboratory conditions, 20 C;40/60 CO2/CH4 for both lab and WWTW operation.
A HFMC module was operated for an extended period of 115 days at a fixed L/G ratioof 0.29 (QG, 3.5 L min−1; QL, 1 L min−1). During this period, the HFMC was permanentlyin contact with the absorbent solution and achieved 76 h of cumulative biogas upgrading(Figure 3a). Gaps in data represent time where data were not collected due to periods of non-continuous reporting. After 35 h operation of another HFMC module, gas prefiltration wasremoved and the membrane subject to approximately 12.5 h operation without prefiltration,equivalent to a gas loading of 2625 L (2188 L m−2) (Figure 2). During this phase, ηCO2recorded without prefiltration was similar to that recorded with prefiltration installed.Over the full duration, an average ηCO2 of 0.17 was determined up to day 115, for theHFMC with prefiltration, after which a progressive decline in ηCO2 to 0.08 was observed.
3.2. Gas-Phase Characteristics
Trace contaminants were measured through GC-MS analysis (Table 1), which demon-strated considerable concentrations of VOCs (320 mg m−3) and total petroleum hydro-carbons (TPH, 187 mg m−3) within the inlet biogas. Trace contaminant characterisationbetween discrete prefiltration stages showed that the Silica-Alumina Zeolite (SAZ) molec-ular sieve was the most effective pre-treatment stage. Solvent extraction of this media,evidenced primary adsorption of octamethylcyclotetrasiloxane (D4) and decamethylcy-clopentasiloxane (D5), which are members of the siloxane family, C12–C14 hydrocarbons,sulphur compounds, terpenes and alcohols.

Water 2021, 13, 172 6 of 14Water 2021, 13, x FOR PEER REVIEW 6 of 14
200 (a) 201
202 (b) 203
Figure 3. Long-term CO2 separation performance for biomethane production from HFMC technol-204 ogy using potable water: (a) with prefiltration; and (b) comparing ηCO2 before and after prefilter 205 removal. For (a) x-axis error bars are the time period over which the data is collected; y-axis is the 206 mean and standard deviation of ηCO2 over the discrete period measured. For (b) box edges, 25th 207 and 75th percentile; centre line, median; whiskers, min. and max.; n = 17). 208
3.2. Gas-Phase Characteristics 209
Trace contaminants were measured through GC-MS analysis (Table 1), which 210 demonstrated considerable concentrations of VOCs (320 mg m−3) and total petroleum hy-211 drocarbons (TPH, 187 mg m−3) within the inlet biogas. Trace contaminant characterisation 212 between discrete prefiltration stages showed that the Silica-Alumina Zeolite (SAZ) molec-213 ular sieve was the most effective pre-treatment stage. Solvent extraction of this media, 214 evidenced primary adsorption of octamethylcyclotetrasiloxane (D4) and decamethylcy-215 clopentasiloxane (D5), which are members of the siloxane family, C12–C14 hydrocarbons, 216 sulphur compounds, terpenes and alcohols. 217
218
0
50
100
150
0
0.1
0.2
0.3
0 10 20 30 40 50 60 70 80
Cum
ulat
ive
days
of a
bsor
bent
con
tact
CO
2C
aptu
re R
atio
(ηC
O2)
Cumulative hours of biogas contact (h)
HFMC (with prefiltered biogas)Cumulative water contact with HFMC
0
0.05
0.1
0.15
0.2
0.25
HFMC (before prefiltrationremoved at 35h)
HFMC (after prefiltration removed,to 47.5h)
CO
2C
aptu
re R
atio
(ηC
O2)
Figure 3. Long-term CO2 separation performance for biomethane production from HFMC technologyusing potable water: (a) with prefiltration; and (b) comparing ηCO2 before and after prefilter removal.For (a) x-axis error bars are the time period over which the data is collected; y-axis is the mean andstandard deviation of ηCO2 over the discrete period measured. For (b) box edges, 25th and 75thpercentile; centre line, median; whiskers, min. and max.; n = 17).
Following a reduction in ηCO2 observed on-site after 115 days operation, laboratoryevaluation was undertaken to determine whether this could be accounted for by con-densation mechanisms on the gas side, where gas moisture content for the inlet biogasapproached the dewpoint (~17–19.7 g m−3). The fouled membrane was dried by passing90 L of CO2 through the fibre lumen and then subjected to the same hydrodynamic condi-tions as used on-site, but using synthetic biogas of equivalent concentration (an industriallydry gas) and potable water as the solvent (Figure 4). Comparison of the fouled membraneunder site conditions with operation on synthetic biogas demonstrated comparable ηCO2,which confirmed a change in module performance rather than gas-phase capillary wettingto be the dominant mechanism for the decline on CO2 separation efficiency.

Water 2021, 13, 172 7 of 14
Table 1. GC-MS analysis and moisture content of biogas pre and post-filtration.
WWTWBiogas +ACS 1 +ACS,
+SAZ 2 SAZ 3
Compound mg m−3 mg m−3 mg m−3 mg kg−1
Carbon Disulphide 3.3 4.2 <1 -Total Organo-SulphurCompounds 5.3 4.2 <1 -
Total Volatile OrganicCompounds 320 256 <100 4 -
Total Petroleum Hydrocarbons 187 117 35.1 -
Cyclic Octatomic Sulphur - - - 2.5Octamethylcyclotetrasiloxane(D4) - - - 1.8
Decamethylcyclopentasiloxane(D5) - - - 10
Terpenes - - - 4.933,7-Dimethyl-3-octanol - - - 2.6Total C12-C14 Hydrocarbons - - - 27
- Not recorded. 1 Anhydrous Calcium Sulphate 2 Silico Aluminate Zeolite. 3 Analysis of biogas compounds boundto 300 g SAZ prefiltration media. 4 Limit of detection.
Water 2021, 13, x FOR PEER REVIEW 7 of 14
Table 1. GC-MS analysis and moisture content of biogas pre and post-filtration. 219
WWTW Biogas +ACS 1 +ACS, +SAZ 2 SAZ 3
Compound mg m−3 mg m−3 mg m−3 mg kg−1 Carbon Disulphide 3.3 4.2 <1 - Total Organo-Sulphur Compounds 5.3 4.2 <1 - Total Volatile Organic Compounds 320 256 <100 4 - Total Petroleum Hydrocarbons 187 117 35.1 - Cyclic Octatomic Sulphur - - - 2.5 Octamethylcyclotetrasiloxane (D4) - - - 1.8 Decamethylcyclopentasiloxane (D5) - - - 10 Terpenes - - - 4.93 3,7-Dimethyl-3-octanol - - - 2.6 Total C12-C14 Hydrocarbons - - - 27
- Not recorded. 1 Anhydrous Calcium Sulphate 2 Silico Aluminate Zeolite. 3 Analysis of biogas compounds bound to 300 g 220 SAZ prefiltration media. 4 Limit of detection. 221
Following a reduction in ηCO2 observed on-site after 115 days operation, laboratory 222 evaluation was undertaken to determine whether this could be accounted for by conden-223 sation mechanisms on the gas side, where gas moisture content for the inlet biogas ap-224 proached the dewpoint (~17–19.7 g m−3). The fouled membrane was dried by passing 90 L 225 of CO2 through the fibre lumen and then subjected to the same hydrodynamic conditions 226 as used on-site, but using synthetic biogas of equivalent concentration (an industrially dry 227 gas) and potable water as the solvent (Figure 4). Comparison of the fouled membrane 228 under site conditions with operation on synthetic biogas demonstrated comparable ηCO2, 229 which confirmed a change in module performance rather than gas-phase capillary wetting 230 to be the dominant mechanism for the decline on CO2 separation efficiency. 231
232
Figure 4. The impact of membrane drying on the recovery of HFMC CO2 separation performance, to determine the role of 233 capillary wetting on membrane operation. QG, 3.5 L min−1; QL, ranging 0.1–9.5 L min−1. 234
3.3. Hollow Fibre Membrane Contactor Fouling Diagnostics 235
Detailed foulant characterisation was first undertaken using ESEM, where the lu-236 men-side and shell-side of the membrane were both inspected (Figure 5). No particle dep-237 osition was evident within the hollow-fibre lumen (example Figure 5b(iii)) where biogas 238 was introduced. This is supported by the FTIR spectra (Figure 6) where no evidence for 239 the adsorption of siloxanes (Si-O bond, 1150–1000 cm−1), carbon disulphide (C-S bond, 240
0
0.25
0.5
0 0.25 0.5 0.75
CO
2C
aptu
re R
atio
(ηC
O2)
Liquid to Gas Ratio (L/G)
WWTW, Potable Water, WWTW Biogas, Fouled after 70h Operation
Lab, Potable Water, Synthetic Biogas, Fouled after 70h Operation, Dried
Figure 4. The impact of membrane drying on the recovery of HFMC CO2 separation performance,to determine the role of capillary wetting on membrane operation. QG, 3.5 L min−1; QL, ranging0.1–9.5 L min−1.
3.3. Hollow Fibre Membrane Contactor Fouling Diagnostics
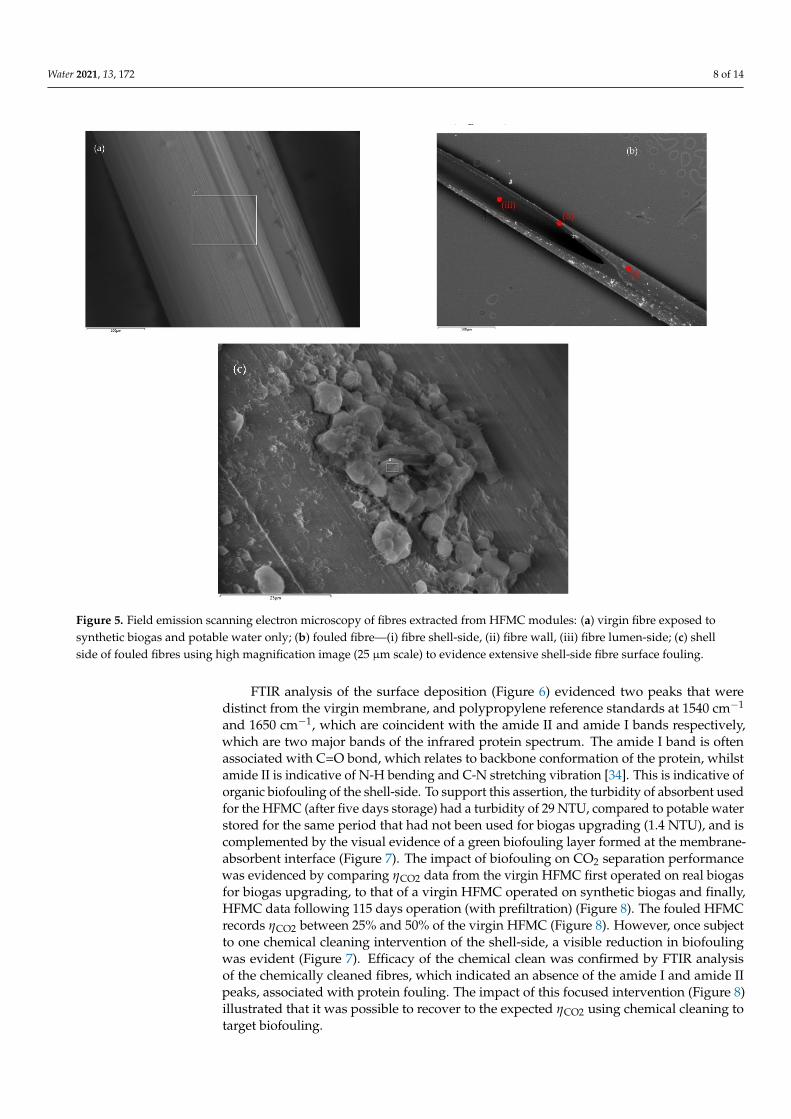
Detailed foulant characterisation was first undertaken using ESEM, where the lumen-side and shell-side of the membrane were both inspected (Figure 5). No particle depositionwas evident within the hollow-fibre lumen (example Figure 5b(iii)) where biogas wasintroduced. This is supported by the FTIR spectra (Figure 6) where no evidence forthe adsorption of siloxanes (Si-O bond, 1150–1000 cm−1), carbon disulphide (C-S bond,700–600 cm−1), or aromatic hydrocarbons was evidenced (C-H bond, 900–690 cm−1) [33].However, considerable deposition was noted on the shell-side of the hollow fibre mem-branes, where the absorbent circulated (Figure 5).
Water 2021, 13, 172 8 of 14
Water 2021, 13, x FOR PEER REVIEW 8 of 14
700–600 cm−1), or aromatic hydrocarbons was evidenced (C-H bond, 900–690 cm−1) [33]. 241 However, considerable deposition was noted on the shell-side of the hollow fibre mem-242 branes, where the absorbent circulated (Figure 5). 243
Figure 5. Field emission scanning electron microscopy of fibres extracted from HFMC modules: (a) virgin fibre exposed 244 to synthetic biogas and potable water only; (b) fouled fibre—(i) fibre shell-side, (ii) fibre wall, (iii) fibre lumen-side; (c) 245 shell side of fouled fibres using high magnification image (25 μm scale) to evidence extensive shell-side fibre surface foul-246 ing. 247
Figure 5. Field emission scanning electron microscopy of fibres extracted from HFMC modules: (a) virgin fibre exposed tosynthetic biogas and potable water only; (b) fouled fibre—(i) fibre shell-side, (ii) fibre wall, (iii) fibre lumen-side; (c) shellside of fouled fibres using high magnification image (25 µm scale) to evidence extensive shell-side fibre surface fouling.
FTIR analysis of the surface deposition (Figure 6) evidenced two peaks that weredistinct from the virgin membrane, and polypropylene reference standards at 1540 cm−1
and 1650 cm−1, which are coincident with the amide II and amide I bands respectively,which are two major bands of the infrared protein spectrum. The amide I band is oftenassociated with C=O bond, which relates to backbone conformation of the protein, whilstamide II is indicative of N-H bending and C-N stretching vibration [34]. This is indicative oforganic biofouling of the shell-side. To support this assertion, the turbidity of absorbent usedfor the HFMC (after five days storage) had a turbidity of 29 NTU, compared to potable waterstored for the same period that had not been used for biogas upgrading (1.4 NTU), and iscomplemented by the visual evidence of a green biofouling layer formed at the membrane-absorbent interface (Figure 7). The impact of biofouling on CO2 separation performancewas evidenced by comparing ηCO2 data from the virgin HFMC first operated on real biogasfor biogas upgrading, to that of a virgin HFMC operated on synthetic biogas and finally,HFMC data following 115 days operation (with prefiltration) (Figure 8). The fouled HFMCrecords ηCO2 between 25% and 50% of the virgin HFMC (Figure 8). However, once subjectto one chemical cleaning intervention of the shell-side, a visible reduction in biofoulingwas evident (Figure 7). Efficacy of the chemical clean was confirmed by FTIR analysisof the chemically cleaned fibres, which indicated an absence of the amide I and amide IIpeaks, associated with protein fouling. The impact of this focused intervention (Figure 8)illustrated that it was possible to recover to the expected ηCO2 using chemical cleaning totarget biofouling.

Water 2021, 13, 172 9 of 14Water 2021, 13, x FOR PEER REVIEW 9 of 14
248
Figure 6. FTIR spectra detailing surface bound functional groups present on polypropylene (PP) hollow fibres pre and 249 post shell-side chemical clean. Additional peaks at 1542 cm−1 and 1647 cm−1 are attributed to amide II and amide I stretches 250 respectively [34] whilst the stretch from 3100 cm−1 downwards is attributed to water [35]. Inset: Close up of spectra between 251 1500 and 1700 cm−1. 252
FTIR analysis of the surface deposition (Figure 6) evidenced two peaks that were dis-253 tinct from the virgin membrane, and polypropylene reference standards at 1540 cm−1 and 254 1650 cm−1, which are coincident with the amide II and amide I bands respectively, which 255 are two major bands of the infrared protein spectrum. The amide I band is often associated 256 with C=O bond, which relates to backbone conformation of the protein, whilst amide II is 257 indicative of N-H bending and C-N stretching vibration [34]. This is indicative of organic 258 biofouling of the shell-side. To support this assertion, the turbidity of absorbent used for 259 the HFMC (after five days storage) had a turbidity of 29 NTU, compared to potable water 260 stored for the same period that had not been used for biogas upgrading (1.4 NTU), and is 261 complemented by the visual evidence of a green biofouling layer formed at the mem-262 brane-absorbent interface (Figure 7). The impact of biofouling on CO2 separation perfor-263 mance was evidenced by comparing ηCO2 data from the virgin HFMC first operated on 264 real biogas for biogas upgrading, to that of a virgin HFMC operated on synthetic biogas 265 and finally, HFMC data following 115 days operation (with prefiltration) (Figure 8). The 266 fouled HFMC records ηCO2 between 25% and 50% of the virgin HFMC (Figure 8). How-267 ever, once subject to one chemical cleaning intervention of the shell-side, a visible reduc-268 tion in biofouling was evident (Figure 7). Efficacy of the chemical clean was confirmed by 269 FTIR analysis of the chemically cleaned fibres, which indicated an absence of the amide I 270 and amide II peaks, associated with protein fouling. The impact of this focused interven-271 tion (Figure 8) illustrated that it was possible to recover to the expected ηCO2 using chemi-272 cal cleaning to target biofouling. 273
Water
Amide I (C=O
stretching
vibration)
Amide II (N-H bending
vibration; C-N stretching
vibration)
Polypropylene reference
Virgin membrane
Fouled membrane
Fouled membrane (post-chemical clean)
Figure 6. FTIR spectra detailing surface bound functional groups present on polypropylene (PP)hollow fibres pre and post shell-side chemical clean. Additional peaks at 1542 cm−1 and 1647 cm−1
are attributed to amide II and amide I stretches respectively [34] whilst the stretch from 3100 cm−1
downwards is attributed to water [35]. Inset: Close up of spectra between 1500 and 1700 cm−1.Water 2021, 13, x FOR PEER REVIEW 10 of 14
274
Figure 7. Fouling during dispersive, absorption column and non-dispersive, HFMC gas-liquid 275 contacting. The left-hand photograph of liquid-phase fouling shows from left to right: a chemically 276 cleaned, unused, and fouled membrane, respectively. 277
278
Figure 8. Performance recovery parity of a fouled membrane after chemical cleaning of the mem-279 brane shell. Gas flow rate (QG) was fixed at 3.5 L m−1 and liquid flow rate (QL) varied between 0.5 280 and 1.2 L m−1, inlet gas comprised 60/40 CO2/CH4 and PG 0.5 BarG and potable water at 20 °C. 281 Straight lines represent synthetic data from virgin membrane for comparison; deviations plotted 282 from this data to indicate the impact of fouling and subsequently cleaning of the module. 283
4. Discussion 284
In this study, consistent CO2 mass transfer was identified for HFMC technology 285 when applied to real biogas in an industrial setting, and during a period of steady-state 286 operation, the response in CO2 capture ratio was comparable to that of synthetic biogas 287 with an equivalent composition (Figure 2). Slight discrimination in responsiveness (the 288
Figure 7. Fouling during dispersive, absorption column and non-dispersive, HFMC gas-liquidcontacting. The left-hand photograph of liquid-phase fouling shows from left to right: a chemicallycleaned, unused, and fouled membrane, respectively.

Water 2021, 13, 172 10 of 14
Water 2021, 13, x FOR PEER REVIEW 10 of 14
274
Figure 7. Fouling during dispersive, absorption column and non-dispersive, HFMC gas-liquid 275 contacting. The left-hand photograph of liquid-phase fouling shows from left to right: a chemically 276 cleaned, unused, and fouled membrane, respectively. 277
278
Figure 8. Performance recovery parity of a fouled membrane after chemical cleaning of the mem-279 brane shell. Gas flow rate (QG) was fixed at 3.5 L m−1 and liquid flow rate (QL) varied between 0.5 280 and 1.2 L m−1, inlet gas comprised 60/40 CO2/CH4 and PG 0.5 BarG and potable water at 20 °C. 281 Straight lines represent synthetic data from virgin membrane for comparison; deviations plotted 282 from this data to indicate the impact of fouling and subsequently cleaning of the module. 283
4. Discussion 284
In this study, consistent CO2 mass transfer was identified for HFMC technology 285 when applied to real biogas in an industrial setting, and during a period of steady-state 286 operation, the response in CO2 capture ratio was comparable to that of synthetic biogas 287 with an equivalent composition (Figure 2). Slight discrimination in responsiveness (the 288
Figure 8. Performance recovery parity of a fouled membrane after chemical cleaning of the membrane shell. Gas flowrate (QG) was fixed at 3.5 L m−1 and liquid flow rate (QL) varied between 0.5 and 1.2 L m−1, inlet gas comprised 60/40CO2/CH4 and PG 0.5 BarG and potable water at 20 C. Straight lines represent synthetic data from virgin membrane forcomparison; deviations plotted from this data to indicate the impact of fouling and subsequently cleaning of the module.
4. Discussion
In this study, consistent CO2 mass transfer was identified for HFMC technology whenapplied to real biogas in an industrial setting, and during a period of steady-state operation,the response in CO2 capture ratio was comparable to that of synthetic biogas with an equiv-alent composition (Figure 2). Slight discrimination in responsiveness (the slope identifiedbetween L/G ratio and ηCO2) was identified between the synthetic and real data which canbe accounted for by the complex and dynamic physical chemistry of both phases in anindustrial environment (e.g., density, viscosity, diffusivity and solubility). Importantly, thisis in contradiction to observations from HFMC applied to industrial flue gases [25,26,28],where gas phase contaminants, were identified to contribute to fouling, resulting in a lossof CO2 flux within comparatively short timeframes. Three gas-phase mechanisms arethought to reduce CO2 flux during industrial operation: accumulation of particulate matter(channel clogging), surface adsorption [26,28] and capillary wetting [24,36]. Particulateaccumulation was observed on the gas-side of a HFMC after 7 h exposure to unfilteredindustrial flue gas from a coal-fired power station [26–28]. Whilst gas-phase particulateswere not explicitly characterised in this study; no particle deposition was observed inthe lumen using FESEM following over 76 h exposure (Figure 5b(iii)). This could beattributed to the lower particulate concentration thought to be present in biogas [37],which is supported by the limited impact exhibited when prefiltration was removed (Fig-ure 3). However, some particulate deposition was noted on the prefiltration media, whichcould indicate the importance of preconditioning industrial gases before use. Trace biogascomponential analysis was comparable to the literature on sewage biogas in concentrationand speciation [20–22]. The trace siloxanes (D4 and D5) and VOCs identified, possesshigh octanol-water partitioning coefficients which increase the probability for adsorptionto hydrophobic substrates [38]. Surface characterisation by FTIR analysis was unableto determine bond energies characteristic of these compounds on the membrane surface(Figure 6) [33]. This was accounted for by the efficacy of preconditioning with the molecularsieve, which reduced VOCs and TPHs by 69% and 81% respectively. It should be notedthat this nevertheless indicates breakthrough of these compounds through the precondi-tioning filters, which would imply that other mechanisms such as residence time in the

Water 2021, 13, 172 11 of 14
HFMC, in addition to functional characteristics of the membrane surface [39], may alsobe important in determining the probability for adsorption to the polypropylene hollowfibre membranes. Whilst biogas moisture content approached the dew point of the gasphase; membrane drying did not improve the ηCO2 (Figure 4). Gas drying has previouslybeen identified as an effective strategy for the recovery of HFMCs that have undergoneprogressive wetting over a period of 7 d operation [40,41] and would indicate that capillarywetting was not the primary mechanism for the reduction in CO2 separation efficiency. Up-stream preconditioning with the chiller, may have contributed to this since it is employedto reduce the ‘free water’ concentration of the gas phase to reduce the risk of condensation.Biogas installations typically also comprise of adsorption technology, which may increaserobustness if placed upstream of HFMC technology. Importantly, since preconditioningrequirements are aligned to those of existing combined heat and power and biogas upgrad-ing installations, the cost of ancillary engineering will not increase through the adoption ofHFMC technology.
Evidence for biofouling on the shell-side of the membrane was provided through FTIRanalysis, which indicated protein deposition (Figure 6), and FESEM where the presence ofan organic foulant layer was shown (Figure 5), which we suggest is the primary mechanismfor the 50% reduction in CO2 flux (Figure 8). Biological fouling has been previously reportedwithin absorption columns for biogas upgrading, deleteriously affecting CO2 mass transferthrough channelling, owing to the growth of methanotrophs (type I and II), gram-negativebacteria, gram-positive bacteria, actinomyces and fungi [23]. Whilst potable water was usedas the absorbent the disinfection residual is quickly consumed, permitting colonisation.Biological growth was also evidenced in this study through the increased turbidity in theabsorbent, which can lead to fibre clogging on the shell-side, subsequently introducing shell-side channelling which dissipates mass transfer [42,43] and is consistent to the observationsof Vogler et al. [29]. Due to the adsorptive potential of biopolymers which can possessstrong lipophilic affinity, desorption can expectedly be thermodynamically unfavourable;thus, chemical cleaning methods are preferred to physical methods [43,44]. Polypropylenedoes not favour oxidants [44] due to their impact upon fibre tensile strength and elongationvalues [31]. In this study, an alkali-acid chemical cleaning cycle was therefore used anddemonstrated almost complete flux recovery, indicating the organic fraction to be stronglyreversible (Figures 7 and 8). Comparable biofouling effects observed in full-scale packedcolumns (the incumbent biogas upgrading technology), result in downtime for reactivemaintenance of up to two weeks, which limits asset availability and reduces profitability [23].Due to the significant reduction in process scale enabled by HFMC, and the relatively lowcost of membrane installations [45,46], a duty-standby HFMC system could be implementedto enable the introduction of scheduled proactive maintenance (regular chemical cleaning),to reduce the risk of biofouling through more frequent intervention, whilst ensuring 100%asset availability.
5. Conclusions
In this study, a transverse flow HFMC has been demonstrated for biogas upgradingon real biogas. Mass transfer characterisation, complemented with membrane autopsy, evi-denced that HFMCs are robust to impurities within industrially produced biogas. This wasconfirmed through benchmarking the same HFMC modules with synthetic biogas ina laboratory environment that evidenced comparable CO2 separation performance forequivalent operating conditions, indicating that HFMC should be scalable from laboratorydata, similar to observations for flue gas [17,25]. Operation without prefiltration did notdeleteriously impact gas separation efficiency, which is dissimilar to the experience ofoperating HFMC on industrial flue gases, possibly due to the lower particle concentration.Nevertheless, upstream gas conditioning is recommended to improve robustness, and asthis technology is often applied to standard biogas facilities, should not entail additionalcost. Shell-side biofouling reduced CO2 separation efficiency in the longer-term. This iscomparable to clogging problems experienced for water scrubbers presently used for biogas

Water 2021, 13, 172 12 of 14
upgrading. Chemical cleaning effectively reversed fouling, which could be introducedproactively to enhance resilience. The low feed gas pressures experienced on-site limitedthe gas flowrate, which made high CO2 capture efficiency difficult to achieve. Technologyscale-up will inevitably require pre-pressurisation similar to packed columns (around 7BarG), the success of which has been demonstrated [11,43,47] and would guarantee theprocess intensification promised by HFMC technology at full scale and demanding con-siderably lower pressure drops [17,25,29,48–50]. For reference, Vogler et al. [29] evaluatedHFMC in an absorption-desorption arrangement at a similar feed pressure to this study(<100 mBar) [29]. Despite the low pressure, the authors reported an energy requirementof 0.3 kWh Nm−3 raw biogas which is comparable to the 0.23–0.3 kWh Nm−3 reportedfor gas-liquid absorption columns, indicating that further energy savings can be realisedwith HFMC through pressurisation [7] making its development toward implementation anexciting proposition.
Author Contributions: Conceptualisation, S.H. and E.M.; methodology, S.H.; formal analysis, S.H.;investigation, S.H.; resources, S.H., E.M., A.M., T.R. and D.H.; writing—original draft preparation,S.H.; writing—review and editing, E.M. and M.P.; supervision, E.M. and M.P.; funding acquisition,E.M., M.P., A.M., A.B. and P.V. All authors have read and agreed to the published version of themanuscript.
Funding: The authors would like to thank Anglian Water, Northumbrian Water and Severn TrentWater for their practical and financial support. We are also grateful for funding from the Engineer-ing and Physical Sciences Research Council (EPSRC), which was provided through the STREAMIndustrial Doctorate Centre.
Data Availability Statement: Data from this article is directly available through this doi:10.17862/cranfield.rd.13560350.
Conflicts of Interest: The authors declare no conflict of interest.
References1. Silvestre, G.; Fernández, B.; Bonmatí, A. Significance of anaerobic digestion as a source of clean energy in wastewater treatment
plants. Energy Convers. Manag. 2015, 101, 255–262. [CrossRef]2. Thrän, D.; Billig, E.; Daniel-Gromke, J.; Ponitka, J.; Seiffert, M.; Persson, T.; Svensson, M.; Balswin, J.; Kranzl, L.; Schipfer, F.; et al.
Biomethane Status and Factors Affecting Market Development and Trade. 2014. Available online: https://www.ieabioenergy.com/publications/biomethane-status-and-factors-affecting-market-development-and-trade/ (accessed on 10 January 2019).
3. Anaerobic Digestion and Biogas Association (ADBA). Anaerobic Digestion Market Report. London. 2015. Available online:http://adbioresources.org/library/market-report-july-2015 (accessed on 10 January 2019).
4. Connor, P.M.; Xie, L.; Lowes, R.; Britton, J.; Richardson, T. The development of renewable heating policy in the United Kingdom.Renew. Energy 2015, 5, 733–744. [CrossRef]
5. IPPT Associates United Kingdom Anaerobic Digestion Market Report. 2017. Available online: https://anaerobic-digestion.com/downloads/free-downloads/uk-anaerobic-digestion-market-report-2017 (accessed on 9 January 2019).
6. Baldwin, J. UK Biomethane Market: Market Update and the Capacity Question. 2017. Available online: http://www.cngservices.co.uk/images/BiomethaneDay/2017/John-Baldwin--%0AUK-Biomethane-Market--the-Capacity-Question.pdf (accessed on 10January 2019).
7. Bauer, F.; Hulteberg, C.; Persson, T.; Tamm, D. Biogas Upgrading—Review of Commercial Technologies. 2013. Available online:http://www.sgc.se/ckfinder/userfiles/files/SGC270.pdf (accessed on 10 January 2019).
8. Cui, Z.; DeMontigny, D. Part 7: A review of CO2 capture using hollow fiber membrane contactors. Carbon Manag. 2014, 4, 69–89.[CrossRef]
9. Heile, S.; Rosenberger, S.; Parker, A.; Jefferson, B.; McAdam, E.J. Establishing the suitability of symmetric ultrathin wallpolydimethylsiloxane hollow-fibre membrane contactors for enhanced CO2 separation during biogas upgrading. J. Memb. Sci.2014, 452, 37–45. [CrossRef]
10. Elhajj, J.; Al-hindi, M.; Azizi, F. A Review of the Absorption and Desorption Processes of Carbon Dioxide in Water Systems. Ind.Eng. Chem. Res. 2014, 53, 2–22. [CrossRef]
11. Belaissaoui, B.; Claveria-Baro, J.; Lorenzo-Hernando, A.; Albarracin, D.; Chabanon, E.; Castel, C.; Rode, S.; Roizard, D.; Favre, E.Potentialities of a dense skin hollow fiber membrane contactor for biogas purification by pressurized water absorption. J. Memb.Sci. 2016, 513, 236–249. [CrossRef]
12. Zaidiza, D.A.; Belaissaoui, B.; Rode, S.; Favre, E. Intensification potential of hollow fiber membrane contactors for CO2 chemicalabsorption and stripping using monoethanolamine solutions. Sep. Purif. Technol. 2017, 188, 38–51. [CrossRef]

Water 2021, 13, 172 13 of 14
13. Zhao, S.; Feron, P.H.M.; Deng, L.; Favre, E.; Chabanon, E.; Yan, S.; Hou, J.; Chen, V.; Qi, H. Status and progress of membranecontactors in post-combustion carbon capture: A state-of-the-art review of new developments. J. Memb. Sci. 2016, 511, 180–206.[CrossRef]
14. Falk-Pedersen, O.; Grønvold, M.S.; Nøkleby, P.; Bjerve, F.; Svendsen, H.F. CO2 Capture with Membrane Contactors. Int. J. GreenEnergy 2004, 2, 157–165. [CrossRef]
15. Falk-Pedersen, O.; Bjerve, Y.; Glittum, G.; Rønning, S. Separation of Carbon Dioxide from Offshore Gas Turbine Exhaust.Energy Convers. Manag. 1995, 36, 393–396. [CrossRef]
16. Herzog, H.; Falk-pedersen, O. The Kvaerner membrane contactor: Lessons from a case study in how to reduce capture costs.In Proceedings of the 5th International Conference on Greenhouse Gas Control Technologies, Cairns, Australia, 13–16 August2000; pp. 121–125.
17. Comite, A.; Costa, C.; Demartini, M.; Di, R.; Oliva, M. Exploring CO2 capture from pressurized industrial gaseous effluents inmembrane contactor-based pilot plant. Int. J. Greenh. Gas Control 2017, 67, 60–70. [CrossRef]
18. Klaassen, R. Achieving flue gas desulphurization with membrane gas absorption. Filtr. Sep. 2003, 40, 26–28. [CrossRef]19. Noble, G.L.; Broomhall, D.; Maple, M.; Shelenko, L.; Truong, J. Hazards Arising from the Conveyance and Use of Gas from
Non-Conventional Sources (NCS). 2011. Available online: http://www.hse.gov.uk/research/rrpdf/rr882.pdf (accessed on 10January 2019).
20. Arrhenius, K.; Johansson, U. Characterisation of Contaminants in Biogas before and after Upgrading to Vehicle Gas. 2012.Available online: http://www.sgc.se/ckfinder/userfiles/files/SGC246_eng.pdf (accessed on 15 January 2019).
21. Rasi, S.; Veijanen, A.; Rintala, J. Trace compounds of biogas from different biogas production plants. Energy 2007, 32, 1375–1380.[CrossRef]
22. Rasi, S.; Läntelä, J.; Rintala, J. Trace compounds affecting biogas energy utilization—A review. Energy Convers. Manag. 2011,52, 3369–3375. [CrossRef]
23. Håkansson, A. Preventing Microbial Growth on Pall-Rings When Upgrading Biogas Using Absorption with Water Wash. 2006.Available online: http://www.sgc.se/ckfinder/userfiles/files/SGC166.pdf (accessed on 20 November 2018).
24. Yu, H.; Thé, J.; Tan, Z.; Feng, X. Modeling SO2 absorption into water accompanied with reversible reaction in a hollow fibermembrane contactor. Chem. Eng. Sci. 2016, 156, 136–146. [CrossRef]
25. Scholes, C.A.; Qader, A.; Stevens, G.W.; Kentish, S.E. Membrane Gas-Solvent Contactor Pilot Plant Trials of CO2 Absorption fromFlue Gas. Sep. Sci. Technol. 2014, 49, 2449–2458. [CrossRef]
26. Zhang, L.; Qu, R.; Sha, Y.; Wang, X.; Yang, L. Membrane gas absorption for CO2 capture from flue gas containing fine particlesand gaseous contaminants. Int. J. Greenh. Gas Control 2015, 33, 10–17. [CrossRef]
27. Zhang, L.; Hu, B.; Song, H.; Yang, L.; Ba, L. Colloidal Force Study of Particle Fouling on Gas Capture Membrane. Sci. Rep. 2017,7, 1–11. [CrossRef]
28. Zhang, L.; Li, J.; Zhou, L.; Liu, R.; Wang, X.; Yang, L. Fouling of Impurities in Desulfurized Flue Gas on Hollow Fiber MembraneAbsorption for CO2 Capture. Ind. Eng. Chem. Res. 2016, 55, 8002–8010. [CrossRef]
29. Vogler, S.; Braasch, A.; Buse, G.; Hempel, S.; Schneider, J.; Ulbricht, M. Biogas conditioning using hollow fiber membranecontactors. Chem. Ing. Tech. 2013, 85, 1254–1258. [CrossRef]
30. Sengupta, A.; Peterson, P.A.; Miller, B.D.; Schneider, J.; Fulk, C.W. Large-scale application of membrane contactors for gas transferfrom or to ultrapure water. Sep. Purif. Technol. 1998, 14, 189–200. [CrossRef]
31. Liqui-Cel. Cleaning Guidelines. 2013, pp. 1–24. Available online: https://www.3m.com/3M/en_US/liquicel-us/resources/operating-and-technical-guides/ (accessed on 5 February 2016).
32. Chabanon, E.; Roizard, D.; Favre, E. Modeling strategies of membrane contactors for post-combustion carbon capture: A criticalcomparative study. Chem. Eng. Sci. 2013, 87, 393–407. [CrossRef]
33. Hepburn, C.A.; Vale, P.; Brown, A.S.; Simms, N.J.; McAdam, E.J. Development of on-line FTIR spectroscopy for siloxane detectionin biogas to enhance carbon contactor management. Talanta 2015, 141, 128–136. [CrossRef] [PubMed]
34. Zarebska, A.; Amor, Á.C.; Ciurkot, K.; Karring, H.; Thygesen, O.; Andersen, T.P.; Hägg, M.B.; Christensen, K.V.; Norddahl,B. Fouling mitigation in membrane distillation processes during ammonia stripping from pig manure. J. Memb. Sci. 2015,484, 119–132. [CrossRef]
35. Luján-Facundo, M.J.; Mendoza-Roca, J.A.; Cuartas-Uribe, B.; Álvarez-Blanco, S. Evaluation of cleaning efficiency of ultrafiltrationmembranes fouled by BSA using FTIR-ATR as a tool. J. Food Eng. 2015, 163, 1–8. [CrossRef]
36. Mahmud, H.; Kumar, A.; Narbaitz, R.M.; Matsuura, T. A study of mass transfer in the membrane air-stripping process usingmicroporous polyproplylene hollow fibers. J. Memb. Sci. 2000, 179, 29–41. [CrossRef]
37. Högström, R.; Vesala, H.; Heinonen, M. Particulate content of biogas. In Proceedings of the 18th International Congress ofMetrology, Paris, France, 19–21 September 2017; p. 08002. [CrossRef]
38. Xu, L.; Shi, Y.; Liu, N.; Cai, Y. Methyl siloxanes in environmental matrices and human plasma/fat from both general industriesand residential areas in China. Sci. Total Environ. 2015, 505, 454–463. [CrossRef]
39. Hepburn, C.A.; Martin, B.D.; Simms, N.; McAdam, E.J. Characterization of full-scale carbon contactors for siloxane removal frombiogas using online Fourier transform infrared spectroscopy. Environ. Technol. 2015, 36, 178–187. [CrossRef]
40. Mavroudi, M.; Kaldis, S.P.; Sakellaropoulos, G.P. A study of mass transfer resistance in membrane gas-liquid contacting processes.J. Memb. Sci. 2006, 272, 103–115. [CrossRef]

Water 2021, 13, 172 14 of 14
41. Fougerit, V.; Pozzobon, V.; Pareau, D.; Théoleyre, M.; Stambouli, M. Gas-liquid absorption in industrial cross-flow membranecontactors: Experimental and numerical investigation of the influence of transmembrane pressure on partial wetting. Chem. Eng.Sci. 2017, 170, 561–573. [CrossRef]
42. D’Souza, N.M.; Mawson, A.J. Membrane cleaning in the dairy industry: A review. Crit. Rev. Food Sci. Nutr. 2005, 45, 125–134.[CrossRef] [PubMed]
43. Shi, X.; Tal, G.; Hankins, N.P.; Gitis, V. Fouling and cleaning of ultrafiltration membranes: A review. J. Water Process. Eng. 2014,1, 121–138. [CrossRef]
44. Porcelli, N.; Judd, S. Chemical cleaning of potable water membranes: A review. Water Res. 2010, 71, 137–143. [CrossRef]45. Boributh, S.; Rongwong, W.; Assabumrungrat, S.; Laosiripojana, N.; Jiraratananon, R. Mathematical modeling and cascade design
of hollow fiber membrane contactor for CO2 absorption by monoethanolamine. J. Memb. Sci. 2012, 401–402, 175–189. [CrossRef]46. Boributh, S.; Assabumrungrat, S.; Laosiripojana, N.; Jiraratananon, R. Effect of membrane module arrangement of gas-liquid
membrane contacting process on CO2 absorption performance: A modeling study. J. Memb. Sci. 2011, 372, 75–86. [CrossRef]47. Bauer, F.; Persson, T.; Hulteberg, C.; Tamm, D. Biogas upgrading—Technology overview, comparison and perspectives for the
future. Biofuels. Bioprod. Biorefin. 2013, 7, 499–511. [CrossRef]48. Belaissaoui, B.; Favre, E. Evaluation of a dense skin hollow fiber gas-liquid membrane contactor for high pressure removal of
CO2 from syngas using Selexol as the absorbent. Chem. Eng. Sci. 2018, 184, 186–199. [CrossRef]49. Dindore, V.Y.; Brilman, D.W.F.; Feron, P.H.M.; Versteeg, G.F. CO2 absorption at elevated pressures using a hollow fiber membrane
contactor. J. Memb. Sci. 2004, 235, 99–109. [CrossRef]50. Belaissaoui, B.; Favre, E. Novel dense skin hollow fiber membrane contactor based process for CO2 removal from raw biogas
using water as absorbent. Sep. Purif. Technol. 2018, 193, 112–126. [CrossRef]