Embed Size (px)
Citation preview

i
DEMOGRAPHY, PERCEPTION AND IMPACT OF TRADITIONAL
PASTORALISTS (VAN GUJJARS) ON BIOTIC RESOURCES OF CORBETT
TIGER RESERVE AND THE ADJOINING FOREST DIVISIONS
A study submitted to H.N.B. Garhwal University (A Central University) Srinagar
(Garhwal) in (Partial) Fulfilment of the Requirements for the Degree M.Sc. Forestry
by AATIF HUSSAIN
Under the Supervision of,
DR. S. DASGUPTA (Department of Forestry and Natural Resources, School of
Agriculture and Allied Sciences, H. N. B. Garhwal University (A Central University),
Srinagar, Garhwal –246 174, Uttarakhand, India
&
DR. H.S. BARGALI
(Deputy Director, The Corbett Foundation, Ramnagar, Uttarakhand)
Citation: A. Hussain, H.S. Bargali, S. Dasgupta and K. Gore (2012).Demography,
perception and impact of traditional pastoralists (Van Gujjars) on biotic resources of
Corbett Tiger Reserve and the adjoining forest divisions. H.N.B. Garhwal University
(A Central University) Srinagar, Garhwal and The Corbett Foundation, Ramnagar,
Uttarakhand. Report submitted to Uttarakhand State forest department.

ii
Foreword Message
I am pleased to forward the report on “Demography, perception and impact of traditional
pastoralists (Van Gujjars) on biotic resources of Corbett Tiger Reserve (CTR) and adjoining
forest divisions”. Van Gujjars are fully tribal pastoralist community that have been living in
Himalayan Shiwalik forests from last many decades. From last many decades the number of
Van Gujjar families has increased and they have to deal with various issues pertaining to
their survival in the changing modern times and consequently adopting with various
adaptation strategies in pursuance their traditional way of living.
This report focuses on a socio-economic condition, dependence and the intensity of
anthropogenic disturbance of Van Gujjars on CTR and adjoining forests. The report enabled
us to explore Van Gujjar’s opinions, preferences, motivations, and perceptions, all of which
influence their willingness for conservation of protected areas and their relocation from this
internationally important protected area. The resettlement of Van Gujjars would provide the
long-term solution because benefits provided by CTR and adjoining forests are non-
substitutable and the damage to the forest ecosystem maybe irreversible. Relocation will be
necessary for the protection and conservation of wildlife, reduction of biotic pressure,
mitigation of human-wildlife conflict, and improving the socio economic condition of the Van
Gujjars. The detailed report and information related with Van Gujjars would help to provide
information for better future management planning and their relocation. I congratulate the
researcher for bringing crucial scientific information in this report and hope that The Corbett
Foundation will keep on funding such applied research and take lead for better conservation
of our nature without hurting the sentiment of people and their long preserved heritage.
Prof. N. P. Todaria
Head, Department of Forestry & Natural Resources
Prof. N. P. Todaria Head, Department of Forestry & Natural Resources HNB Garhwal University (A Central University) Srinagar (Garhwal) 246 174
Uttarakhand (INDIA)
Tel & Fax: +91 1370 267529 (O)
+91 1370 267682 (R)
Email: [email protected]
Mobile: +91 9412079688
Website: forestryhnb.page.tl

iii
Message from Mr. Dilip Khatau, Chairman, The Corbett Foundation
Gujjars, a pastoral and a semi-nomadic tribe, have been living in the forests of Corbett Tiger
Reserve and the adjoining forest divisions for centuries. Traditionally, they depended solely
on rearing of livestock and selling of milk and milk products. Although the impact of their
activities on forests and wild animals in the past has been low, but with the passage of time,
their exploitation of the forests and pressures on wildlife have disturbed the delicate natural
balance. Over the years, the population of Gujjars has increased and it has become
increasingly difficult for them to lead a sustainable way of life in this era of modern
technology, cut-throat competition and dwindling availability of resources. Our biodiversity-
rich forests are now facing serious conservation challenges and their managers are
struggling to conserve these natural treasures. Reduction of anthropogenic pressures on
these areas is of paramount importance in the long term interest of preserving our forests
and it would be in the interest of Gujjars to change their traditional way by being non-
nomadic. They can educate their children, have stable incomes, provide medical and other
social welfare to their families and secure the future for themselves away from their
traditional abode.
The detailed information given in this report which includes socio-economic profile of the
Gujjar community and their interaction with surrounding natural areas will definitely be
helpful for wildlife managers in implementing better management practices including
relocation and rehabilitation plans for the Gujjar community.
We thank the Uttarakhand State Forest Department for giving permission to conduct this
study. Special thanks to Dr. R. B. S. Rawat (IFS), Principal Chief Conservator of Forests for
his support and encouragement.
Dilip Khatau
Chairman, The Corbett Foundation
Email: [email protected] | Website: www.corbettfoundation.org
Registered Office
The Corbett Foundation
P.O. Dhikuli, Ramnagar,
District Nainital, Uttarakhand 244715
Tel. No. +91 5947 284156
Administrative Office
The Corbett Foundation
81-88, Atlanta Bldg, 8th floor,
209 Nariman Point, Mumbai 400021
Tel. No. +91 22 61466400 / 61466417

iv
CONTENTS
Chapter Title Page No.
List of Figures vii
List of Tables viii
List of Plates viii
Used Abbreviations ix
1 Introduction and objectives 1
2 Material and methods 4
2.1 Plan of the study 7
2.2 Study framework 7
2.3 Survey method 8
2.3.1 Demography and socioeconomic profile of Van Gujjars 8
2.3.2 Perceptions and attitudes of Van Gujjars for identifying entry point activities in relocation
9
2.3.3 Focus group discussions 9
2.3.4 Biotic impact estimation 10
2.4 Secondary source review 11
2.5 Data analysis and presentation 12
3 Study Area 17
3.1 Flora and fauna of CTR 18
4 Demography and socioeconomic profile of Van Gujjars 20
4.1 Introduction 20
4.2 Socio-economic features of Van Gujjars 21
4.2.1 Profile of respondent households 21
4.2.2 Category and gender of respondents 21
4.2.3 Age class distribution of respondents 22
4.2.4 Occupation of the respondent households 22
4.2.5 Various temporary places used for grazing 23
4.2.6 Seasonal pattern of Van Gujjar’s temporary migration. 23
4.2.7 Distribution of settlements in different administrative units 24
4.3 Physical capital 25
4.3.1 Housing condition of respondents 25
4.3.2 Sources of water 26
4.3.3 Electricity (% with access) 27
4.3.4 School facility/access 27
4.3.5 Access to motor road. 28
4.3.6 Access to market. 29
4.3.7 Access to health facility 29
4.3.8 Irrigation facility 30
4.4 Financial capital 30
4.4.1 Livestock holding and income from livestock 31
4.4.2 Farm income. 32
4.4.3 Non- farm income (Daily wages) 32
v
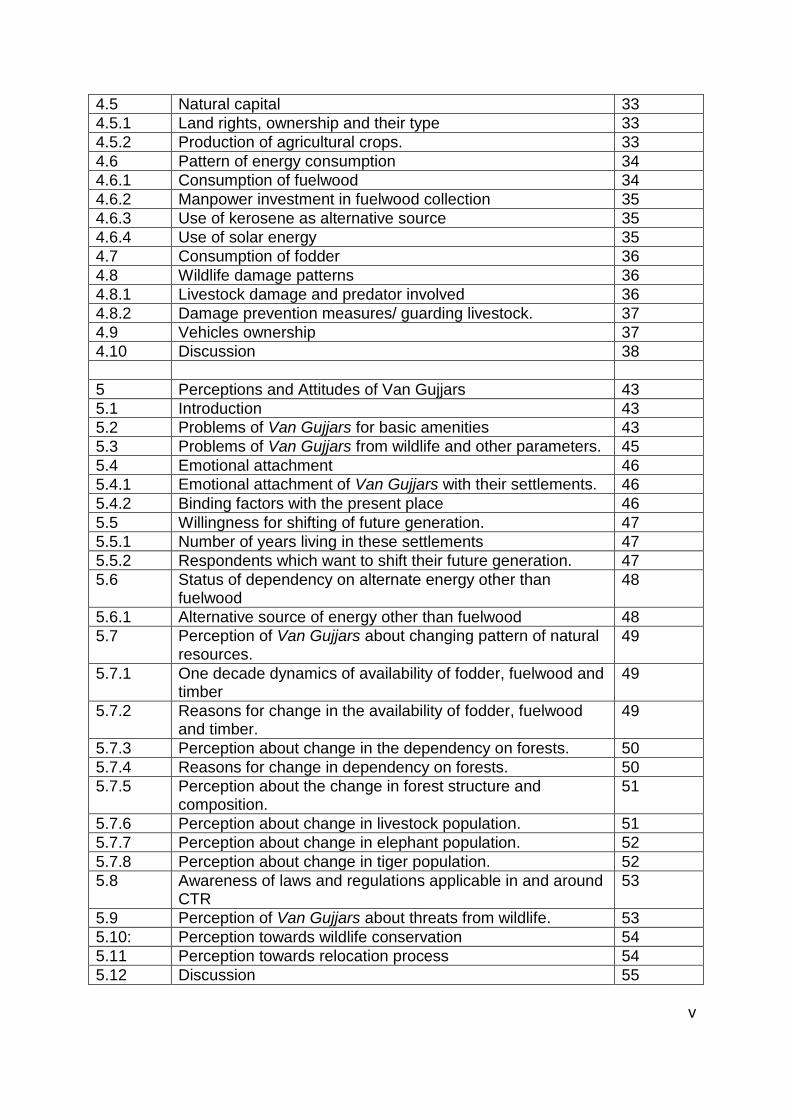
4.5 Natural capital 33
4.5.1 Land rights, ownership and their type 33
4.5.2 Production of agricultural crops. 33
4.6 Pattern of energy consumption 34
4.6.1 Consumption of fuelwood 34
4.6.2 Manpower investment in fuelwood collection 35
4.6.3 Use of kerosene as alternative source 35
4.6.4 Use of solar energy 35
4.7 Consumption of fodder 36
4.8 Wildlife damage patterns 36
4.8.1 Livestock damage and predator involved 36
4.8.2 Damage prevention measures/ guarding livestock. 37
4.9 Vehicles ownership 37
4.10 Discussion 38
5 Perceptions and Attitudes of Van Gujjars 43
5.1 Introduction 43
5.2 Problems of Van Gujjars for basic amenities 43
5.3 Problems of Van Gujjars from wildlife and other parameters. 45
5.4 Emotional attachment 46
5.4.1 Emotional attachment of Van Gujjars with their settlements. 46
5.4.2 Binding factors with the present place 46
5.5 Willingness for shifting of future generation. 47
5.5.1 Number of years living in these settlements 47
5.5.2 Respondents which want to shift their future generation. 47
5.6 Status of dependency on alternate energy other than fuelwood
48
5.6.1 Alternative source of energy other than fuelwood 48
5.7 Perception of Van Gujjars about changing pattern of natural resources.
49
5.7.1 One decade dynamics of availability of fodder, fuelwood and timber
49
5.7.2 Reasons for change in the availability of fodder, fuelwood and timber.
49
5.7.3 Perception about change in the dependency on forests. 50
5.7.4 Reasons for change in dependency on forests. 50
5.7.5 Perception about the change in forest structure and composition.
51
5.7.6 Perception about change in livestock population. 51
5.7.7 Perception about change in elephant population. 52
5.7.8 Perception about change in tiger population. 52
5.8 Awareness of laws and regulations applicable in and around CTR
53
5.9 Perception of Van Gujjars about threats from wildlife. 53
5.10: Perception towards wildlife conservation 54
5.11 Perception towards relocation process 54
5.12 Discussion 55

vi
6 Biotic Impact Estimation 58
6.1 Introduction 58
6.2 Results 61
6.3 Discussion 70
7 Conclusion 73
8 References 74

vii
LIST OF FIGURES Page No.
Figure: 2.1 The distribution of Van Gujjar settlements in and around CTR. 6
Figure: 3.1 The location of the study area. 19
Figure: 4.1 The gender of the respondents in the study area. 21
Figure: 4.2 The age classes of respondents. 22
Figure: 4.3 The various occupations of the respondents. 22
Figure: 4.4 The various temporary locations used for grazing 23
Figure: 4.5 The various months of migration to temporary locations. 24
Figure: 4.6 The distribution of households in various districts. 24
Figure: 4.7 The distribution of households in different ranges. 25
Figure: 4.8 The housing condition of respondents. 26
Figure: 4.9 The various source of drinking water. 26
Figure: 4.10 The distance of water source from household and khatta. 27
Figure: 4.11 Access of electricity to household and Khatta’s. 27
Figure: 4.12 The distance of school from household & khatta. 28
Figure: 4.13 The distance of motarable road from household and Khatta’s. 29
Figure: 4.14 The distance of market from household and Khatta’s. 29
Figure: 4.15 The distance of health centre from households and Khatta’s. 30
Figure: 4.16 The use of kerosene litre per month by households. 35
Figure: 4.17 The use of solar lights by the households. 36
Figure: 4.18 The damage of livestock by wild animals. 37
Figure: 4.19 The vehicle possession by households. 38
Figure: 5.1 The various problems faced by Van Gujjars for basic amenities. 46
Figure: 5.2 The problems faced by Van Gujjars from natural resources. 47
Figure: 5.3 Categories which emotionally bind Van Gujjars with present place. 48
Figure: 5.4 The number of years of settlements establishment in park. 48
Figure: 5.5 The categories for which they want to shift their future generation.
49
Figure: 5.6 Use of alternative sources of energy in study area. 49
Figure: 5.7 Perception about change in fodder, fuelwood and timber. 50
Figure: 5.8 The perception of respondents about the categories which lead to change in availability of fodder, fuelwood and timber during last ten years
51
Figure: 5.9 The perception of respondents about the change in the dependency of settlements on forests during last ten years.
51
Figure: 5.10 The perception of respondents about categories which lead to change in dependency of family on forests during last ten years.
52
Figure: 5.11 The perception about change in forest during last 10 years. 52
Figure: 5.12 The Perception about change in livestock during last 10 years. 53
Figure: 5.13 Perception about change in tiger population during last 10 years. 54
Figure: 5.14 The perception of respondents about awareness about CTR laws.
54
Figure: 5.15 The perception of respondents about threats from wild animals. 55
Figure: 6.1 The figure shows the start and end point of transect around Van Gujjar settlements in and around Corbett Tiger Reserve.
61

viii
LIST OF TABLES Page No.
Table: 2.1 The brief descriptions of studied Van Gujjar’s settlements/ Khatta’s.
4
Table: 2.2 The various classes on the basis of population in settlements. 11
Table: 4.1 The livestock unit owned by household and settlements. 31
Table: 6.1 The standardized loadings on the five principal components used to derive the forest disturbance for category 1 villages or settlements.
64
Table: 6.2 The correlation matrix for thirteen habitat disturbance variables for category 1 villages.
64
Table: 6.3 The standardized loadings on the five principal components used to derive the forest disturbance for category 2 villages or settlements.
66
Table: 6.4 The correlation matrix for thirteen habitat disturbance variables for category 2 villages.
66
Table: 6.5 The standardized loadings on the five principal components used to derive the forest disturbance for category 3 villages or settlements.
68
Table: 6.6 The correlation matrix for thirteen habitat disturbance variables for category 3 villages.
68
Table: 6.7 The standardized loadings on the five principal components used to derive the forest disturbance for category 4 villages or settlements.
70
Table: 6.8 The correlation matrix for thirteen habitat disturbance variables for category 4 villages.
70
LIST OF PLATES Page No.
Plate 1: Coded photographs of various Van Gujjar settlements 13
Plate 3: The demographic profile of Van Gujjars.
42
Plate 2 : Photographs showing the disturbances around settlements by Van Gujjars
73

ix
USED ABBREVIATIONS
ACU Adult Cattle Units
AF Agriculture/ Land presence Frequency
CF Cattle/Frequency
CNP Corbett National Park
CPD Cut poles/Density/25m2
CPF Clear Patch/Frequency
CTR Corbett Tiger Reserve
DF Dung/Frequency
FAM Family
FF Fire/Frequency
FTD Felled trees/ Density/25m2
GBH Girth at Breast Height
HPF Human presence/Frequency
LRF Lopped regeneration/Frequency
LTD Lopped tree/ Density/25m2
MOEF Ministry of Environment and Forests
NF Noise/Frequency
NTCA National Tiger Conservation Authority
PAs Protected Areas
PCA Principal Component Analysis
PF Pellets/Frequency
POP Population
RBF Remnants of branches and leaves/Frequency
RNP Rajaji National Park

x
ST State
THS Total Household Sampled
UK Uttarakhand
UN United Nation
UP Uttar Pradesh

1
CHAPTER – 1
INTRODUCTION
Conservation of biodiversity is a challenging task in the present scenario
where natural habitats are deteriorating with the fast pace of developmental activities.
Protected Areas (PAs) i.e. National Parks and Wildlife Sanctuaries are the home to
provide suitable habitat conditions for wildlife. Nature reserves protect a mere 12% of
the world’s land surface (Rodrigues et al., 2004). Only 4.75% of the geographical
area of India is designated as protected for conservation and development of
sustained wildlife of the country. Most of the protected areas in the country are
having human habitations in the form of well established villages. In India, 5 million
people live inside nature reserves, and a further 147 million depend on resources
provided by these reserves (Kutty and Kothari, 2001). Small PA size (mean area <
300 km2) and enclosure by densely populated areas (>300 people/km2) make PAs in
India vulnerable. PAs meet the demands of human and domestic livestock
populations, and also absorb the associated environmental impacts (Karanth, 2002;
Rodgers et al., 2003). In many Asian PAs, human pressures continue to threaten
wildlife survival, habitat protection and biological diversity (Karanth, 2002; Muller and
Zeller, 2002; Peh et al., 2005). Biodiversity loss, habitat fragmentation and land
cover changes are taking place across many Indian PAs (Gadgil and Guha, 1992;
Kothari et al., 1995).
Anthropogenic disturbance greatly affects the biodiversity and structural
characters of a community. In the Himalayan region, a serious form of disturbance is
the removal of forest biomass in the form of grazing, lopping, surface burning and
litter removal. Although only a small fraction of biomass is removed, the problem with
this form of disturbance is that plants or ecosystems often do not get adequate time
to recover (Singh, 2002). The Shivaliks have faced anthropogenic pressure from both
migratory and resident human populations in this area for at least the last century.
Resident nomadic pastoralists called Van Gujjars have been part of this ecosystem
for the last 60-70 years (Kumar, 1995). The Corbett Tiger Reserve (CTR) is among
the strongholds of good populations of a group of semi-nomadic pastoralist
community called Van Gujjars. Van Gujjars are the semi- nomadic community whose
members stay inside the forest in huts, which are locally known as deras, and these
deras are built using local forest material. The men wear a turban, a lose tahmet

2
(sarong) and generally have a flowing beard. Some wear embroidered waistcoats.
The women wear a long kurta (shirt), churidar (tight pyjamas), and jackets. The
women do not generally veil themselves. Van Gujjars speak Gujjari or Gojri, a dialect
of Hindi. Many speak Urdu, Kashmiri, Garhwali, Pahari or Dogri as well. Milk and
cornmeal are their staple food, and they are strict vegetarians.
In West-Central Terai Arc Landscape, the CTR is managed better than the other
PAs. Apart from the 520 km2 core area of the CTR, which is free from human
disturbance, the rest of the area is subjected to various types of pressures for
fuelwood, fodder collection and grazing both from the Van Gujjar community living
inside the forests and the villages located at the periphery of the PAs (Johnsingh and
Negi, 2003). The Van Gujjars live and move in joint family groups and set up
temporary settlements in places where they can graze their cattle and have easy
access to water and other basic resources. Men graze the animals and sell the milk
and the women milk the cattle, make butter and do other household chores. They lop
the trees badly and in a very unscientific way which affects the growth and
regeneration of the trees in the forest (Singh and Sharma, 2001). Van Gujjar
communities feed their livestock, largely buffaloes (Bubalus bubalis), by lopping trees
and grazing them in the forest, which leads to substantial extraction of forest
resources. Widespread lopping for firewood, fodder and grazing by livestock
maintains a sustained disturbance regime within a fragile ecosystem (Edgaonkar,
1995). In the past, it has been noticed that the intensive lopping, firewood extraction
and grazing led to lack of sustainable regeneration, proliferation of weeds, and lack
of regeneration of palatable plant species (Edgaonkar, 1995; Dabadghao and
Shankarnarayan, 1973; Johnsingh et al., 1990). The Van Gujjars lop the trees badly,
in a very unscientific way, which affects the growth and the regeneration of the trees
in the forest (Singh and Sharma, 2001). It has been observed that the villagers
understand and recognize the need for future consumption but excessive unscientific
lopping by Van Gujjars often clears entire crowns of trees, leaving only a few young
branches. This adversely affects the growth of trees, and thus the productivity of the
forest area as a whole (Rawat, 1993). Van Gujjars generally use almost all the rough
routes present inside the forest for their daily activities, and these routes are the
internal corridors for wild animals to cross the forest beats leading to enormous
disturbance of wildlife habitat throughout the year. Competition from livestock over
space and shared resources can have a particularly severe impact on wildlife, in

3
particular wild ungulates (Madhusudan, 2004), and this is the scenario in most of the
Van Gujjar occupied areas. The Van Gujjar children make loud noise during day time
while playing near to their deras, and they also keep their surroundings clear of trees
or shrubs for better visibility of wild animals. Van Gujjar buffaloes urinate and
defecate in waterholes making them unfit for use by wild animals (Johnsingh and
Joshua, 1995). Primarily consisting of buffaloes (Bubalus bubalis), their livestock
holdings increased over time (Kumar, 1995), and so did their requirements for fodder.
Van Gujjars still exist within the protected area and are currently utilizing waterholes
and fodder resources frequently for their routine requirements. As a result of such
activities several forest patches have been rapidly replaced by toxicious weeds such
as Parthenium histerophorous (Gajjar grass) and Lantana camara (Kuri jhari).
Relocation of human populations from protected areas, as a measure to reduce
pressures on wildlife, has been undertaken in several countries. Thus, human
habitation and uses of natural resources are prohibited or restricted within most PAs.
There are three to four million people living inside these PAs and several million
more in adjacent areas, whose livelihoods depend on natural resources from these
PAs (Kothari et al., 1995). In India, village resettlements to facilitate conservation
date back to the 1960s (Rangarajan and Shahabuddin, 2006). In Corbett National
Park, between 1973 and 2001, four villages (411 families) were relocated near
Ramnagar and Kashipur (Negi, 2003). There were a number of factors driving the
relocation of villages. Factors such as crop damage and intense conflict with wildlife
created a desire to relocate among the village residents. Other factors, such as
exclusion from access to government development projects, implied a more coercive
element to the relocation process.
This study was aimed at understanding Van Gujjars which are residing within
the boundaries of CTR and in adjacent territorial forest divisions. This field study was
conducted on Van Gujjars and a quick appraisal was carried out in 37 settlements
with the following objectives:
1. Demography and socio-economic profile of Van Gujjars.
2. Perceptions and attitudes of Van Gujjars for identifying entry point activities in
relocation.
3. Quantifying the biotic impact and causes of forest disturbance from settlements and
livelihood activities.
4
CHAPTER – 2
MATERIAL AND METHODS
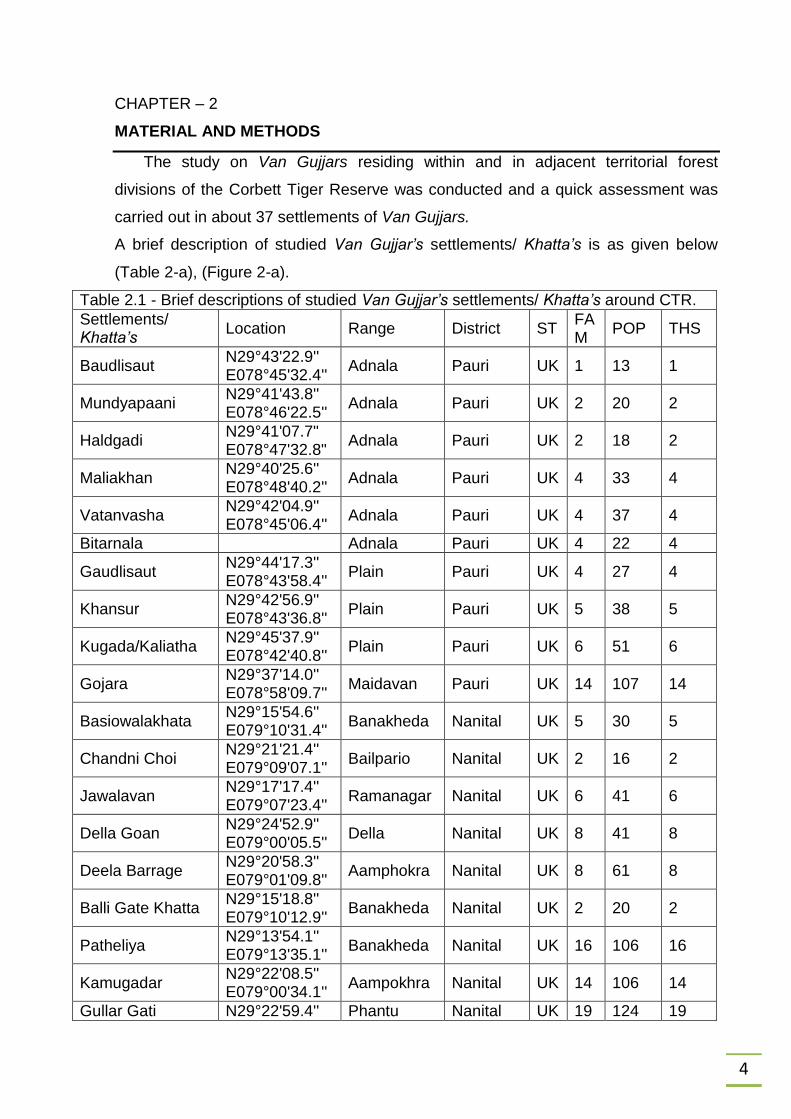
The study on Van Gujjars residing within and in adjacent territorial forest
divisions of the Corbett Tiger Reserve was conducted and a quick assessment was
carried out in about 37 settlements of Van Gujjars.
A brief description of studied Van Gujjar’s settlements/ Khatta’s is as given below
(Table 2-a), (Figure 2-a).
Table 2.1 - Brief descriptions of studied Van Gujjar’s settlements/ Khatta’s around CTR.
Settlements/ Khatta’s
Location Range District ST FAM
POP THS
Baudlisaut N29°43'22.9'' E078°45'32.4''
Adnala Pauri UK 1 13 1
Mundyapaani N29°41'43.8'' E078°46'22.5''
Adnala Pauri UK 2 20 2
Haldgadi N29°41'07.7" E078°47'32.8"
Adnala Pauri UK 2 18 2
Maliakhan N29°40'25.6'' E078°48'40.2''
Adnala Pauri UK 4 33 4
Vatanvasha N29°42'04.9'' E078°45'06.4''
Adnala Pauri UK 4 37 4
Bitarnala Adnala Pauri UK 4 22 4
Gaudlisaut N29°44'17.3'' E078°43'58.4''
Plain Pauri UK 4 27 4
Khansur N29°42'56.9'' E078°43'36.8''
Plain Pauri UK 5 38 5
Kugada/Kaliatha N29°45'37.9'' E078°42'40.8''
Plain Pauri UK 6 51 6
Gojara N29°37'14.0'' E078°58'09.7''
Maidavan Pauri UK 14 107 14
Basiowalakhata N29°15'54.6'' E079°10'31.4''
Banakheda Nanital UK 5 30 5
Chandni Choi N29°21'21.4'' E079°09'07.1''
Bailpario Nanital UK 2 16 2
Jawalavan N29°17'17.4'' E079°07'23.4''
Ramanagar Nanital UK 6 41 6
Della Goan N29°24'52.9'' E079°00'05.5''
Della Nanital UK 8 41 8
Deela Barrage N29°20'58.3'' E079°01'09.8''
Aamphokra Nanital UK 8 61 8
Balli Gate Khatta N29°15'18.8'' E079°10'12.9''
Banakheda Nanital UK 2 20 2
Patheliya N29°13'54.1'' E079°13'35.1''
Banakheda Nanital UK 16 106 16
Kamugadar N29°22'08.5'' E079°00'34.1''
Aampokhra Nanital UK 14 106 14
Gullar Gati N29°22'59.4'' Phantu Nanital UK 19 124 19

5
E078°54'02.6''
Naunyaganj N29°17'20.7'' E079°08'23.4''
Bailparoa Nanital UK 17 132 17
Arjun Naala Khatta
N29°17'24.8'' E079°04'51.7''
Ramnagar Nanital UK 26 189 26
Pather Kaun N29°23'27.2'' E078°55'41.9''
Jirna Nanital UK 7 50 7
Beelghati N29°22'39.4'' E079°01'13.6''
Della Nanital UK 10 63 10
Gallikaithani N29°15'17.9'' E079°11'27.0''
Banakheda Nanital UK 14 88 14
Aamphokra 64-Gate
N29°19'22.7'' E079°01'28.5''
Aamphokra Nanital UK 13 80 13
44No.Shivnath-pur Khatta
N29°21'49.2'' E078°58'26.9''
Aamphokra Nanital UK 9 53 9
Tomarya Khatta N29°21'48.2'' E078°58'52.2''
Aampokhra Nanital UK 8 51 8
Hathi Dangar N29°21'30.4'' E079°01'17.2''
Deela Nanital UK 9 62 9
Phantu N29°22'48.1'' E078°55'32.0''
Phantu Nanital UK 6 23 6
Tomarya Dam N29°18'16.3'' E078°54'55.8''
Patrampur Udamh singhnagar
UK 16 168 16
Kalusaud N29°22'19.3'' E078°53'11.5''
Phantu Nanital UK 6 37 6
Kehri Pur N29°23'11.3'' E078°50'11.4''
Amangarh Bijnor UP 3 18 3
Murgabhoj N29°23'43.2'' E078°54'19.2''
Amangarh Bijnor UP 4 28 4
Raninagal N29°25'25.2'' E078°51'19.8''
Amangarh Bijnor UP 10 75 10
Nabigarh N29°22'31.1'' E078°52'08.0''
Amangarh Bijnor UP 12 86 12
Nabigarh Theeri N29°22'59.6'' E078°52'39.0''
Amangarh Bijnor UP 26 200 26
Makonia N29°20'58.8'' E078°48'45.1''
Amangarh Bijnor UP 18 150 18
ST - State, FAM - Family, POP - Population, THS - Total household sampled,
UK - Uttarakhand, UP - Uttar Pradesh.

6
Figure 2.1 - The distribution of Van Gujjar settlements in and around CTR.
Gujjar Settlements

7
2.1 Plan of the study
The study was conducted in four phases. The first phase involved familiarization
with the study area and making observations with respect to the aims and objectives
of the study. In this phase, an attempt was made to study the broad physical,
demographic, socio-cultural and ecological characteristics of the study area. In
addition, a review of relevant available literature on different aspects was also
undertaken. The second phase of the study was concerned with finalizing the
methodology of the study on the basis of literature surveyed and secondary data
obtained in the first phase. This included developing a suitable framework for data
collection and analysis as well as formalizing the research design. The third phase of
the study involved collection, coding and organizing of the data from secondary and
primary observations, and systematically bringing together all the data and other
information collected in both first and second phase. The fourth and the final phase
included data analysis, interpretation of results and final report writing.
2.2 Study framework
The detailed framework of the study, an essential part of study, is presented in
the flowchart below:
Methodology and Field Techniques
Preliminary Survey
Demography and Socio-
economic Profile of Van
Gujjars
Biotic Impact
Estimation Perception and Attitude
in Relocation Issue
Questionnaire
Survey
Line Transect Focus Group
Discussion
Secondary
Source Review
Quadrants of m2
Objective 2nd
Objective 3rd
Objective Ist

8
2.3 Survey methods
2.3.1 Demography and socio-economic profile of Van Gujjars
To examine the nature and extent of dependency on the forest by these
communities with varying socio-economic status, a household survey was done to
elicit data (Shylajan, 2001). The definition of “household” used by the Census of India
(GOI, 2007) - “a group of persons who normally live together and take their meals
from a common kitchen” - was followed in the study. The questions were composed
in English and then translated in Hindi and Urdu depending on the preference of the
respondent, and interviews were documented in English. At the beginning of
interview respondents were informed that their participation in the survey was
completely voluntary and information provided would be helpful in future
management practices. However, each respondent was also requested to answer
our questions as accurately and honestly as possible. One adult (≥18 years old) in
each household was interviewed at each “dera” (traditional huts or household).
Usually household heads (mostly male) were interviewed; in their absence, any
member willing to participate was interviewed resulting in more male than female
respondents. Interviews were conducted in the manner of a conversation by
memorizing the questions and leading the discussion to acquire the desired
information. While conducting the household survey, the Van Gujjars of the CTR
were interviewed by conducting door to door survey to collect information on:
demographic structure of the households (information on family size, age and sex of
the family members), number of people in working age group, occupation, size of
land holding. The livestock population of the settlements was converted into Adult
Cattle Units (ACU) as per the conversion formula used by Tyagi and Shankar (1995)
given as:
1. Weight of cow (< 2.5 years of age) = 200 kg
2. Weight of cow (> 2.5 years of age) = 300 kg
3. Weight of buffalo (< 2.5 years of age) = 250 kg
4. Weight of buffalo (> 2.5 years of age) = 400 kg
5. Weight of sheep and goat = 1/5th ACU

9
The ACU for other livestock such as horse, mule, ox and hen were calculated as
per the report of FAO (2005a). The animal cattle unit used in this study for livestock
are as follows: cow - 0.86, cow calf - 0.57, buffalo - 1.14, buffalo calf - 0.71, goat -
0.20, horse - 1.25, ox - 1.00, mule - 1.00 and hen - 0.01.
In addition, information on dependency of the families for fuelwood, timber,
fodder etc., were also collected. Data were collected on quantity of fuelwood, timber
collected, and its contribution to the family’s annual income. The data collected
mainly was of secondary nature and also involved information regarding access to
facilities such as PHC’s, schools, bus services, kerosene distribution centres, type of
roads, market, location and distribution of settlements with respect to CTR.
The demographic information of the Gojara settlement was collected from the
secondary sources and also from Van Gujjars of this settlement during their visit to
nearest market Rathuwadhab.
2.3.2 Perceptions and attitudes of Van Gujjars for identifying entry point
activities in relocation
Methods of assessing people's attitudes and behaviour are well documented in
the social science literature (e.g. Lindberg 1929; Young, 1949; Atkinson, 1979; Lloyd
et al., 1984). Generally, the manner in which local communities use forest resources
and react to forest rules determines their social behaviour and attitudes towards the
forest. According to Gross (1987) there is a relationship between one's attitude and
behaviour. Therefore, if one's attitude is known, it is possible to predict his/her
behaviour. But attitudes can only be used to predict behaviour when appropriate
measurement techniques are used. This survey mainly assessed use value of the
CTR and adjoining forests by Van Gujjars, and documents the general attitudes and
perceptions towards education, wildlife conservation, changes that took over the last
decade around them, opinions about their relocation, and awareness about the
protected areas. Perceptions of people were taken into consideration by studying
problems and both the effects of wildlife on people’s lives and effects of people’s
lifestyles on the wildlife in the area.
2.3.3 Focus group discussions
Group discussions provide access to a larger body of knowledge of general
community information (Mikkelsen, 1995; Borrini-Feyerabend, 1997). Group

10
discussions enable quick access to many people and are also cheap and quick to
conduct compared with individual interviews with the same number of respondents.
The reason for such grouping was to capture the perceived needs and problems
faced by Van Gujjars, wildlife conservation and relocation problems.
For achieving the above objectives, two types of questionnaire were devised
as per the following details:
Close-ended structured questionnaire for household (dera) survey
Close and open ended questionnaire for perception/attitude evaluation.
According to Newell (1993), open questions allow the respondent to express
fully her/his opinions freely while the closed questions can be pre-coded easily and
save time for both the interviewer and the respondent.
2.3.4 Quantifying the biotic impact and causes of forest disturbance from
settlement and livelihood activities
Vegetation quantification- The objective of the ecological survey was to quantify
the degree of forest disturbance from livelihood activities of Van Gujjars settlements.
For the impact zone estimation, belt transects were used around the Van Gujjars
settlements (villages), with belt transects conducted for all four sides of the
settlement. The observations were sampled within the same line, with measurements
taken at 20m intervals and using a quadrate of 5m2. Observations were recorded on
tree density, cutting poles, lopped trees, felled trees, presence of pellets and dung,
remnants of branches, stunted regeneration, grazing, fire, and also signs of wildlife
presence. These observations record the impact and influence of Van Gujjars on the
surrounding areas around their deras (traditional huts). GPS locations were recorded
both at the start and end point of each transect.
The proportion of cut poles, felled trees and lopped trees was calculated against
the total number of trees sampled for the entire study area. The enumeration for
lopping was observed by observing each slash mark on the trees that corresponded
to the lopping of branches. The proportion of lopped or cut stems per sampling unit
has often been used as a quantitative measure of human induced disturbance by
various researchers (Barve et al., 2005; Ganeshaiah et al., 1998; Pandey and
Shukla, 2003; Shaanker et al., 2004), while others have used it as an index of
disturbance. A tree was defined as any plant with GBH (girth at breast height) ≥ 20

11
cm. Cut stems refer to residual tree stumps from felling for wood, and the lopped
trees are trees with branches that were cut for fodder and fuelwood although the
main bole remains intact and alive. The fire occurrence was measured by noting
variable identified signs of human induced fires that burnt individual trees or forest
patches. Cattle and human trials were clearly distinguishable paths through
vegetation that result from frequent human and livestock use. Dung and pellet
deposition for cattle and goat were monitored by counting.
To examine relationships between the Principle Component Analysis composite
disturbance variables and settlements, settlements were divided into four size
classes based on the population in each settlement. The choice of four size classes
was based on preliminary non-parametric density estimates that suggest that
disturbance varies within each of the resulting settlement population. The four
classes includes G1 settlements with <50 individuals; G2 settlements with 51-100
individuals; G3 settlements with 101-150 individuals; G4 settlements with 151-200
individuals. Table 2.2 shows various classes on the basis of population in
settlements.
Table 2.2 - Various classes on the basis of population in settlements.
Classes Population Name of Settlements
G1 Less than 50
Mundyapaani,Vatanvasha,Kehripur,Murgabhoj,Basiowalakhatta,Phantu,Kalusaid, Balligate Khatta, Chandni Choi,
Jawalavan, Della Goan, Gaudlisaut, Baudlisaut, Khansur, Haldagadi, Maliakhan, Bitarnala
G2 51-100 Kugada/Kaliatha, Shivnathpur Khatta, Aamphokra 64 – Gate, Tomarya khatta, Raminagal, Hathi Dagar, Della
Barrage, Pather Kaun, Beelghati, Gallikhaithani
G3 101-150 Gojara, Patheliya, Kamugadar, Gullargati, Naunyaganj
G4 151-200 Makonia,Tomarya Dam,Nabigarh Theeri, Arjunnala Khatta
2.4 Secondary source review
Secondary data were obtained from published or unpublished documents,
journals, article, theses etc. Secondary information was also useful for interpretation,
comparison, and triangulation of information gathered from other sources.
Furthermore, different survey reports offer qualitative information that is used to
support the analysis of surveys.

12
2.5 Data analysis and presentation
The quantitative and qualitative information collected through the
questionnaire and ecological survey were coded and entered into the MS-excel and
SPSS Version 11.5 computer programme where descriptive analyses such as
percentages, cross tabulations were performed to show percentage response. Using
tables and graphs, all the parameters of study were calculated using Smart Draw
2012, MS-excel and Dplot software. Correlation matrices were made to see
associations between variables. PCA was performed on the variables collected for
the habitat analysis.

13
Plate 1: Coded photographs of various Van Gujjar settlements.

14

15

16
Haldgadi – 1, Malaikhan – 2, Kalusaid – 5,
Raninagal - 6, Basiowalakhata – 7, Arjunnala – 8,
Hathi dagar – 9, Nabigarh – 10, Deelabarrage – 11,
Murgabhoj – 12, Patherkaun – 13, Tomarya dam – 14,
Shivnathpur (44.no.) – 15, Tomarya khatta – 16, Phantu – 17,
Beelghati – 18, Kamugadar – 19, Jawalavan – 20,
Gullar gati – 21, Nabigarh theeri – 22, Kehri pur – 23
Naunyaganj – 24, Aamphokhra 64 gate – 25, Makonia – 26,
Balligate – 27, Chandni choi – 28, Della goan – 29,
Gallikaithani – 30, Patalia – 31, Kugada/kailatha – 32,
Mundyapani – 33, Vatanvasha – 34, Gaudlisaut – 35,
Baudlisaut – 36, Khansur – 37

17
CHAPTER – 3
STUDY AREA
The study was conducted in Van Gujjar settlements located in and around the
Corbett Tiger Reserve (CTR). The CTR is situated at the foothills of the Western
Himalayas in the civil district of Nainital and Pauri Garhwal in Uttarakhand, India. On
August 8, 1936 it was established as India’s first National Park, and christened
Hailey’s National Park. Post independence, its name was changed to Ramganga
National Park in 1954 and then in 1957 to Corbett National Park, in memory of Jim
Corbett, the legendary hunter and naturalist who had contributed significantly in
marking out its boundaries and setting it up. The area of the National Park was
increased from 323.75 km2 to its present size of 520.82 km2 in 1966. The area of the
Reserve was further increased to 1288.32 km2 by adding 301.18 km2 of Sonanadi
Wildlife Sanctuary and the remaining 466.32 km2 as buffer area. In 1973–1974,
together with Sonanadi Wildlife Sanctuary, it was designated a ‘Tiger Reserve’ under
‘Project Tiger’ of the Government of India, and it is now a premier PA with a high
density of tigers (Jhala et al., 2008; Jhala et al., 2011).
The CTR area extends from 78° 39’ 40” E to 79° 09’ 23” E longitude and
29°48’ N to 29°23’ 32” N latitude. The altitude of Corbett Tiger Reserve ranges
between 385 m to 1100 m above mean sea level. The park receives 1500 mm to
1600 mm of rainfall each year, mainly during the monsoon though some winter rain
occurs. Within the park, temperature variation is minimal, although minor local
variation occurs with variations in aspect and altitude. The temperature ranges
between 4°C in winter to 42°C during the summer season.
CTR includes the foothills of outer Himalayas in the north and the Shivaliks in
the south. Corbett’s northern areas are lined by the Lesser Himalayan chain.
However, most of the Park lies in the Outer- Himalayan or Shiwalik region. The
Shivaliks are at the southern limit of the Himalayan ranges and are much lower than
the Lesser Himalayas. The Shivaliks form the largest ridge across the park, running
east to west from Dhangarhi to Kalagarh. This ridge is covered by Sal forests and
other Sal associated species (Valdiya, 1980). Between the Himalayan and Shiwalik
mountain ranges lie elongated valleys called duns .The southern boundary of Corbett
flanks the ecologically important Tarai-bhabar region

18
3.1 Flora and fauna of CTR
Different types of vegetation are found all along the varied topography, which
comprises hilly and riverine areas, temporary marshy depressions, plateaus and
ravines. This park represents the amalgamation of cultures of these hill regions, and
displays amazing landscapes and diverse flora and fauna. Up to 110 species of
trees, 51 species of shrubs and over 33 species of bamboo and grass are found
here. Ecologically, the vegetation of Corbett landscape can be broadly grouped into
four major types, which are treated as eight subtypes (Champion and Seth, 1968).
1. Northern tropical moist deciduous forests (3C)
2. Northern tropical Dry deciduous forests (5B)
3. Sub tropical pine forests [9] 4. Shiwalik Chir pine forests [9 /C1a]
The CNP is rich in faunal diversity, with 50 species of mammals, 575 species of
birds, and significant tiger and elephant populations (Chape et al., 2003). Some of
the best game fish of India, such as Golden Mahseer (Tor putitora) and Indian Trout
(Barilius bola) abound in the waters of Ramganga streams which flow through the
tiger reserve. The location of the Van Gujjars settlements studied in and around the
Corbett Tiger Reserve is shown in figure 3.1 below.

19
LOCATION OF STUDY AREA
Figure 3.1 - The location of study area.
Gujjar Settlements
20
CHAPTER – 4
DEMOGRAPHY AND SOCIOECONOMIC PROFILE OF VAN GUJJARS
4.1 Introduction
To examine the extent and nature of dependence on the forest by communities in
protected areas with varying socio-economic status, a household survey was done to
elicit data (Shylajan, 2001). Socio-economic research has revealed that rural
households behaviour regarding natural resource management is influenced by
demographic and socio-economic factors. According to Mehta and Kellert (1998), a
sound understanding of local people’s attitude towards wildlife is a vital pre-requisite
to conflict management, and yet remarkably few studies exist to guide conservation
decisions. Most surveys are really socio-economic assessments, focusing on broad
questions related to community-based resource or protected areas management.
According to these assessments, the tailoring of participatory conservation
management not only requires information on the economic status of the
communities involved, but must also take into account an appreciation of their
attitudes and perception towards conservation and the environment in which they
live. Taking recommendations from the local community for what they perceive as
necessary conservation and developmental actions is also vital (Badola, 1998).
Heltberg et al. (2000) revealed that decisions about pattern and extent of resource
extraction from the forest are made at a household level, and thus the household is
an appropriate unit to understand socio-economic factors that influence dependence
on the forest. There are several complex factors that affect dependence and use of
fuelwood from the forest at the household level. According to Harber et al. (2006),
local perceptions of resource use can be explored through different lenses such as
religious, cultural, socio-political and socio-economic practices. Resident nomadic
pastoralists called Van Gujjars have been part of Corbett Tiger Reserve for the last
60-70 years (Kumar, 1995). This chapter provides a comprehensive account of the
demographic and socio-economic profile features of the Van Gujjar’s living inside and
outside the CTR.

21
4.2 Socio-economic features of Van Gujjars
4.2.1 Profile of respondent households
Household surveys were conducted among Van Gujjars residing in the buffer
zone and around the periphery of CTR. A total of 340 households were visited for
door-to-door interviews in 37 settlements falling within four districts, namely Pauri,
Nainital, and Udhamsingh Nagar in Uttarakhand, and Bijnor in Uttar Pradesh. The
data showed that most settlements are small, with few settlements (7) having 15 or
more households. The total population of all the settlements was 2464 members.
Household size ranged from 2 to 18 persons and average household member size
was found to be 7.244 members.
4.2.2 Category and gender of respondents
The Van Gujjars are marginalized as they are not being treated in the same
way by the administrators of state of Uttar Pradesh and Uttarakhand as of Himachal
Pradesh and Jammu and Kashmir. All the Van Gujjars of Himachal Pradesh are
included in the list of Schedule Tribes, and in Jammu and Kashmir these are included
in the list of Other Backward Classes (OBC). The Van Gujjars of Uttarakhand are not
included in the list of OBC. Van Gujjars are seen as intruders with no permanent
state belongings. Usually household heads (mostly male) were interviewed; in their
absence, any member willing to participate was interviewed. The households are
mostly headed by males and it was found that 92.6% are of gender male and 7.4%
are females (Fig. 4.1).
Fig. 4.1 - The gender of the respondents in the study area.
Male: 92.6
Female: 7.4
Percent (n = 340)

22
4.2.3 Age class distribution of respondents
One adult (≥18 years old) in each household was interviewed at each dera. The
average age of the interviewed persons was about 40±0.70 years; 57.6% of the
respondents were aged between 18-40 years (young) followed by 31.8% between
41-60 years (middle aged) and 9.6% was ≥ 61years old (old aged) (Fig. 4.2).
Figure 4.2 - The age classes of respondents.
4.2.4 Occupation of the respondent households
Since these Van Gujjars have been pastoralists for centuries, they are reluctant
to abandon this traditional way of living, and they are cut off from most mainstream
activities. In the present study, 49.7% indicated pastoralism as their primary
livelihood, whereas, others reported combination of other livelihood sources with their
traditional practice of pastoralism. They preferred combining agriculture, daily wage
work along with cattle rearing. The study showed 21.2% combined pastoralism with
agriculture as their occupation, 12.6% reported pastoralism with working as daily
wage labourers, and 9.1% are earning income from pastoralism, agriculture, and
working as daily wage labour. Some people have completely given away their
traditional pastoralist nature and earning their livelihood from daily wage labour
(5.9%), agriculture with daily wage labour (0.9%), and agriculture (0.3%) alone (Fig.
4.3).
Figure - 4.3 The various occupations of the respondents.
(n=340)
9.1 5.9
0.3
12.6
0.3
49.7
21.2
Pastoralist Pastoralist /agriculture/labour Labour Agriculture Pastoralist / labour Pastoralist / business Agricultural/labour Pastoralist /agricultural
P
e
r
c
e
n
t
57.6%
31.8%
9.6%
18-40 41-60 61-100
23
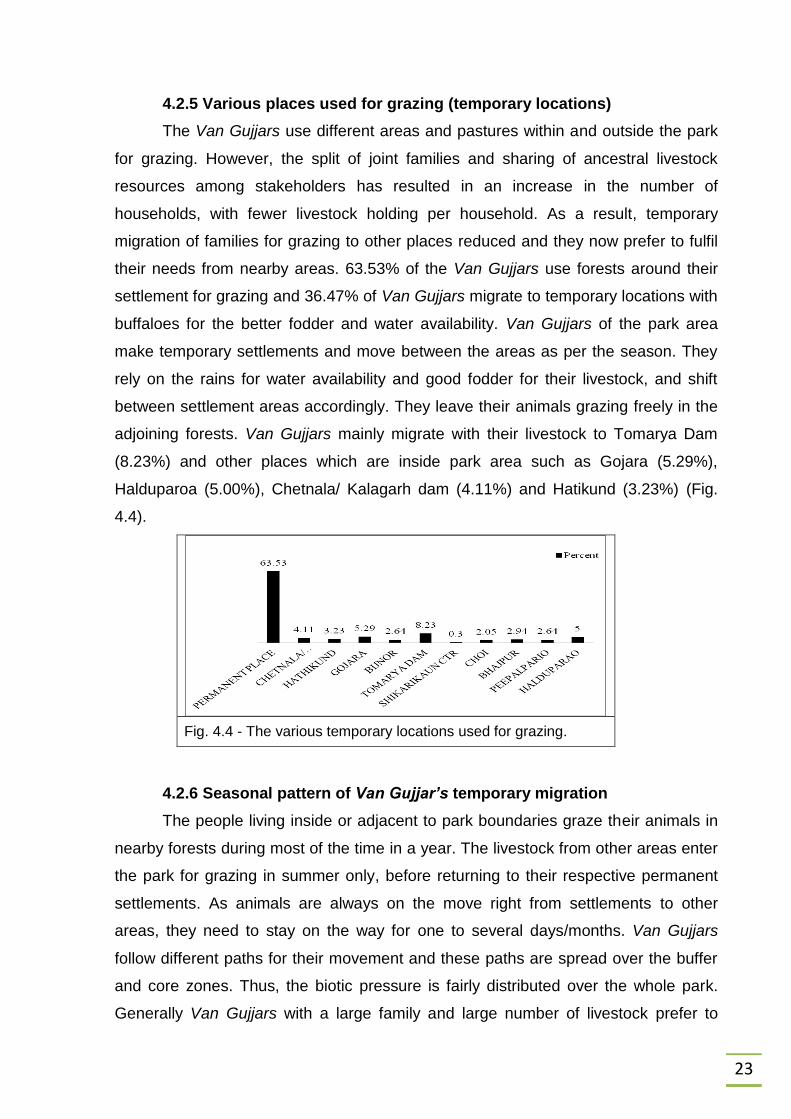
4.2.5 Various places used for grazing (temporary locations)
The Van Gujjars use different areas and pastures within and outside the park
for grazing. However, the split of joint families and sharing of ancestral livestock
resources among stakeholders has resulted in an increase in the number of
households, with fewer livestock holding per household. As a result, temporary
migration of families for grazing to other places reduced and they now prefer to fulfil
their needs from nearby areas. 63.53% of the Van Gujjars use forests around their
settlement for grazing and 36.47% of Van Gujjars migrate to temporary locations with
buffaloes for the better fodder and water availability. Van Gujjars of the park area
make temporary settlements and move between the areas as per the season. They
rely on the rains for water availability and good fodder for their livestock, and shift
between settlement areas accordingly. They leave their animals grazing freely in the
adjoining forests. Van Gujjars mainly migrate with their livestock to Tomarya Dam
(8.23%) and other places which are inside park area such as Gojara (5.29%),
Halduparoa (5.00%), Chetnala/ Kalagarh dam (4.11%) and Hatikund (3.23%) (Fig.
4.4).
Fig. 4.4 - The various temporary locations used for grazing.
4.2.6 Seasonal pattern of Van Gujjar’s temporary migration
The people living inside or adjacent to park boundaries graze their animals in
nearby forests during most of the time in a year. The livestock from other areas enter
the park for grazing in summer only, before returning to their respective permanent
settlements. As animals are always on the move right from settlements to other
areas, they need to stay on the way for one to several days/months. Van Gujjars
follow different paths for their movement and these paths are spread over the buffer
and core zones. Thus, the biotic pressure is fairly distributed over the whole park.
Generally Van Gujjars with a large family and large number of livestock prefer to

24
migrate in this manner. In present study, it was found that 63.8% of households use a
permanent place for grazing throughout the year, whereas, 21.5% of Van Gujjar
households migrate with livestock during the month of May up to August, and 14.7%
migrate between September and March (Fig. 4.5)
4.2.7 Distribution of Van Gujjar settlements in different administrative
units
There are total 37 Van Gujjars settlements spread over 3 districts of the
Uttarakhand and one district of Uttar Pradesh. A total of 340 households, in 37
settlements, were found within four districts of Pauri, Nainital, Udhamsingh Nagar in
Uttarakhand State, and Bijnor district in Uttar Pradesh State. Majority of the
households (58.5%) were located in Nainital district followed by Bijnor (21.5%), Pauri
(13.5%) and Udhamsingh Nagar (6.5%) (Fig. - 4.6).
Fig. 4.6 - The distribution of households in different ranges.
These settlements were spread over twelve forest ranges. The highest number
of households are found in the Amangarh range (21.5%), followed by Aamphokhra
(15.3%), and the lowest number of households are found in Jhirna range (2.1%)
(Fig. - 4.7).
Figure - 4.5 The various months of migration to temporary locations.
(n=340)
63.8
14.7 21.5
P
e
r
c
e
n
t
Sept- March
May - August
Permanent

25
Figure - 4.7 The distribution of households in different ranges.
4.3 Physical Capital
Physical capital comprises the basic infrastructure and producer goods needed
to support livelihoods (DFID, 1999). Ellis (2000) defined physical capital, in economic
terms, as being producer good as opposed to a consumer good. Building irrigation
canals, roads, tools, machines and so on are physical assets.
4.3.1 Housing condition of respondents
Housing situation is an important component of level of living and social rank. In
the present study 97.35% of respondents were living in thatched roof with mud wall
house, indicating that people do not feel settled in the area, and is indicative of the
legal restriction preventing permanent construction. It appears that Van Gujjars are
not legally allowed to construct any permanent settlement in the core/buffer zone of
the CTR or even in adjoining forest areas. The structure of houses is same in all the
settlements in terms of wall and floor material. The khatta (settlements/village) when
viewed from some distance looks very pretty and pleasant. The style of architecture
and construction of this kind requires a lot of timber and grass. The total number of
houses found in the study area were 1161 in which 753 (64.85%) are thatched roof
with mud wall houses, followed by 380 cattle sheds (32.73%), 19 thatched huts
(1.63%) and 9 cemented rooms (0.775%). These cemented rooms are found in Della
village where some Van Gujjar families have their own private property (Fig. 4.8).

26
4.3.2 Sources of water (% with access)
The facility or access to drinking water for the majority of respondents is still
very basic. They usually depend on hand pumps and natural streams (nullahs). It has
been found that 79.7% of the total households rely on hand pumps for drinking water
in which 90% of hand pumps are planted by Van Gujjars at their own expense. The
reliance on natural streams is significant, with a stated 11.1% of respondents (likely
to be more as hand pump holders also fetch water from natural streams) collecting
water freely from natural streams or other water sources within the forests and park
area. The other sources of water for the households are borehole (3.9%) and the
Kalagarh dam (2.9%), while only 8 households had access to tap water supply (Fig.-
4.9).
Figure - 4.9 The various source of drinking water.
Drinking water sources are usually near to Van Gujjar settlements. In the study
area 96.5% of households are drawing their water from a distance of 0 to 0.5 km.,
whereas, 3.5% households travel to a distance of 0.5 to 1km. to collect water. In case
of settlements (Khatta’s), 94.5% are drawing water from a distance of 0 to 0.5 km
followed by 5.5% from a distance of 0.5 to 1km (Fig. - 4.10).
Figure - 4.8 The housing condition of respondents.
64.83
1.63 0.775
32.73
(n=340)
Thatched roof
+ Mud wall Thatched hut Cemented room Cattle shed
P
e
r
c
e
n
t
11.1 3.9 2.9 2.4
79.7 P
e
r
c
e
n
t
Stream/Natural nallah
Bore hole Hand pump
Dam
Tap

27
Figure - 4.10 Distance of water source from household and khatta.
4.3.3 Electricity (% with access)
Lack of electricity is a very significant problem for the Van Gujjars. The vast
majority of respondents (95%) do not have access to electricity, and they light their
homes using kerosene lamps and solar lights. For Van Gujjars and their livestock,
nightfall brings considerable threats from wild animals. Out of the 340 respondents
only 17 respondents (5%) have the facility of electricity, provided via illegal
connections from the nearby villages. Out of 37 settlements, only two settlements
(Tomarya Khatta and Shivnathpur) have access to electricity (Fig. - 4.11).
Figure - 4.11 Access of electricity to household and Khatta’s.
4.3.4 Status of education (school facility/access)
Children of all the settlements in Uttarakhand have some sort of provision for
primary education or access to primary schools, but there is no educational facility in
case of settlements in Uttar Pradesh. These Van Gujjars were mostly educated to
primary standard because the school for further studies were very far from their
settlements and there was a need to pass through forested areas and face threat
from wild animals. This was a major problem for the female children as their parents
were apprehensive in sending their daughter to schools far away from home. Some
of the settlements had no school and cases where schools were available the
condition was very poor and totally unfit for studies.
No
Yes 95.0% 94.5%
5.0% 5.4%
To household (n=340) To khatta (n=37)
0-0.5KM
0.5-1KM
96.5% 94.5%
3.5% 5.5%
To household (n=340) To khatta (n=37)

28
The primary schools are run by NGOs, with few permanent teachers appointed.
Even where permanent teachers are appointed, they visit the schools occasionally,
come only once every few weeks. All the respondents interviewed were illiterate. The
Van Gujjars have been educating their children for the last 10-15 years. Out of the
340 families, 166 families are providing education to their children and the total
number of children getting education is 419 (17%).
It has been found that for 47.4% of households the school facility was available
within 0.5 km. For a further 23.2% of households schools were 2 to 5 km away, and
for 14.4% schools were more than 5 km away. In case of 5.3%, 5.0% and 4.7%
households the facility of primary school was about more than 10 km, 1-2 km and
0.5-1 km respectively. In case of Khatta or settlements 37.8%, 24.3%, and 13.5%
settlements had their school facility within 0-0.5 km, 2-5 km, and more than 5 km
respectively. The distance of settlements from schools is shown in the Fig. - 4.12.
Fig. 4.12 - The distance of school from household & khatta.
4.3.5 Access to motor road
Access to road network, for most of the isolated households away from
settlements, was non-existent. During monsoon season they are totally cut off from
the outside world. The area becomes inaccessible by vehicle. With great difficulty,
travelling long distances on foot, the people visit the market once or twice a week.
Study shows that 32.4% respondent households have access to the motor road after
a distance of 5 km or more, followed by 30.0% respondent with road access at a
distance of 1- 2 km and 27.1% households with road access at a distance of 2- 5 km.
Only 10.6% of households, which are located near to motarable road, have road
access within 1 km.
47.4
4.7 5.0
23.2
14.4
5.3
37.8
8.1 2.7
24.3
13.5
5.4
1-2KM
0-0.5KM 0.5-1KM
>5KM >1OKM
P
e
r
c
e
n
t
To household (n =
340) To khatta (n=37)
2-5KM

29
In case of settlements, 32.43% of the settlements have access to motor road
at a distance of 1-2 km followed by 24.32% at a distance of more than 5 km. It was
found that 21.62% settlements have road access within 1km (Fig. - 4.13).
4.3.6 Access to market
About 55.3% of the respondent’s travel 10 km or more to go to the nearest
market. Whereas, 31.8% of respondents travel between 5-10 km and about 12.9% of
the respondents travel 2 to 5 km to reach market (Fig. - 4.14).
Figure - 4.14 Distance of market from household and Khatta’s.
4.3.7 Access to health facility
Nearly all of the respondents reported that they were not having access to any
kind of health facility, with no healthcare centres within or in the close vicinity of the
settlements. People reported loss of lives because it was not possible for them to
take an ailing person to the nearest available medical centre. They had lost many
newborns and mothers due to the complications developed during the process of
deliveries. It was found that 50.0 % of the respondents have to travel about 10 km to
Figure - 4.13 The distance of motarable road from household and Khatta’s.
Dist. to khatta (n=37)
Dist. to household (n=340)
10.6
21.7
30 32.4
27
21.6
32.4
24.3
0-1KM 1-2KM 2-5KM >5KM P
e
r
c
e
n
t
To khatta (n=37)
To household (340)
12.9 10.81
31.8 32.43
55.3
56.7
p
e
r
c
e
n
t
2-5KM >5KM >1OKM

30
reach the hospital, followed by 35.9% of the respondents having hospital 5-10km
away from their settlements. In most cases they have to purchase medicines from the
private medical stores, however, they get medicines free of cost in areas where The
Corbett Foundation (TCF), a NGO, running Rural Medical Outreach Programme.
54.1% of settlements have primary healthcare facilities at a distance of 10 km
or more, and 35.1% have such facilities situated at a distance of 5 km or more.
10.8% have healthcare facilities at a distance of 2 -5 km away from the settlement.
Figure 4.15 shows details of access to health care facilities
Fig. 4.15 - Distance of health care centre from
households and Khatta’s.
4.3.8 Irrigation facility
It has been found that 31.5% of the households were growing agricultural
crops on the forest land with the permission from the forest department for growing
fodder. Out of the 31.5% of people who are growing crops, 30.8% (33) of the
households are dependent on their own pump sets/ boring, and the remaining 69.2%
households are dependent on seasonal streams and natural rain for irrigation.
4.4: Financial Capital
Financial capital refers to stocks of money to which a household has access
(Ellis, 2000). It denotes the financial resources that people use to achieve their
livelihood objectives. The definition used here is not economically robust in that it
includes flows as well as stocks and it can contribute to consumption as well as
production. However, it has been adopted to try to capture an important livelihood
building block, namely the availability of cash or equivalent that enables people to
adopt different livelihood strategies (DFID, 1999).
To khatta (n=37)
To household (n=340)
14.1 10.81
35.9 35.13
50 54.0
P
e
r
c
e
n
t
2-5KM
>5KM
>1OKM

31
4.4.1 Livestock holding and income from livestock
Livestock is an integral part of the household and has been major component
and primary source of economy of Van Gujjars. Buffaloes, cows, goats, horses,
mules, hens and ox constitute the major livestock types. As per forest records, the
average numbers of livestock per household varies between 1 and 100 individuals.
Many households actually hold more cattle than the record indicates. Most of the
cattle and livestock are grazing in the forests and pastures, though they are
sometimes stall-fed with crop by-products. It was very difficult to extract the reliable
information about the livestock holdings and participants were unwilling to disclose
their actual number. The Van Gujjars were willing to provide only those numbers of
livestock that they had declared to the forest department, as they have to pay fee for
grazing and lopping in the forest based on their livestock holding. In some
households (n=12), when participants became familiar with the survey team, some
figures were provided and it was found that 55% of the livestock were kept beyond
the agreed permissible limit.
The total Adult Cattle Unit (ACU) holding in all 37 settlements is about 7574,
with average ACU of 23.21±9.48 per household. The highest ACU was found in the
settlement of Tomarya Dam 868.54 (11.47%) and least was found for Kehripur 30.32
(0.40%). The total milk production from these settlements in a single day was found
to be 8686.12 litres, with average per household production of 25.75±2.45 litres. It
has been reported that these households sell milk at different rates and the average
rate has been found as Rs. 23 per litre. It has been found that the yearly average
income from the milk production per household is Rs. 2, 16,171.00 (table - 4.1).
Table 4.1- The number of livestock unit owned by households
Settlements Total livestock
unit Average household
livestock unit Percent
Haldagadi 57.40 28.70 0.76
Maliakhan 81.21 20.30 1.07
Bitarnala 65.64 16.41 0.87
Gojara 299.80 21.41 3.96
Kalusaid 147.97 24.66 1.95
Raninagal 413.35 41.34 5.46
Basiowalakhata 130.18 26.04 1.72
Arjunnala 414.34 15.94 5.47
Hathi dagar 186.33 20.70 2.46
Nabigarh 341.30 28.44 4.51
Deelabarrage 313.86 39.23 4.14

32
Murgabhoj 80.10 20.03 1.06
Patherkaun 152.98 21.85 2.02
Tomarya dam 868.54 54.28 11.47
44. No. Shivnathpur 161.09 17.90 2.13
Tomarya khatta 151.83 18.98 2.00
Phantu 72.53 12.09 0.96
Beelghati 146.98 14.70 1.94
Kamugadar 199.39 14.24 2.63
Jawalavan 144.09 24.02 1.90
Gullar gati 251.53 13.24 3.32
Nabigarh theeri 328.67 12.64 4.34
Kehri pur 30.32 10.11 0.40
Naunyaganj 509.92 30.00 6.73
Amphokhra 64 gate 202.14 15.55 2.67
Makonia 496.05 27.56 6.55
Balligate 36.76 18.38 0.49
Chandni choi 43.47 21.73 0.57
Della goan 99.99 12.50 1.32
Gallikaithani 199.15 14.22 2.63
Patalia 404.94 25.31 5.35
Kugada/kailatha 158.27 26.38 2.09
Mundyapani 83.94 41.97 1.11
Vatanvasha 72.78 18.19 0.96
Gaudlisaut 40.06 10.01 0.53
Baudlisaut 57.85 57.85 0.76
Khansur 129.28 25.86 1.71
Total/Average 7574.01 23.31 100.0
4.4.2 Farm income
As discussed, 31.5% (n=107) of the total households are growing agricultural
crops and fodder on the allotted forest land after having permission from the forest
department. They grow crops like wheat, rice and vegetables for their own
requirements only and do not sell in the markets.
4.4.3 Non-farm income (daily wages)
In areas where there is opportunity, working as daily wage labourers provides
secondary sources of income to Van Gujjars. It was found that 28.2% families are
earning from daily wages. The total income earned by these households (n=96)
round the year was fifty one lakh rupees with average income per household being
Rs. 53,687±412.40 per year. The highest daily wage average per household was
found for Dhela village Rs. 66, 750.00 followed by Chandni Choi (Rs. 60, 000.00),
and it has been found that these settlements are nearer to the town or other villages.

33
Other settlements located in the buffer zone of the CTR were not involved in labour
or any daily wage activities and they remain dependent on earning from milk or
livestock business only.
4.5 Natural Capital
Natural capital is the term used for natural resource stocks from which
resource flows and services (e.g. nutrient cycling, erosion protection) useful for
livelihoods are derived. There is wide variation in the resources that make up natural
capital, from intangible public good such as the atmosphere and biodiversity to
divisible assets used directly for production (DFID, 1999). Natural capital comprises
the biological resources that are utilized by people to generate means of survival
(Ellis 2000).
4.5.1 Land rights, ownership and their type
There are no clear land rights given to the Van Gujjars. There is no uniform
policy deciding the permission of forest department to grow fodder or crops.
Depending on the temporary arrangements Van Gujjars manage to grow crops on
certain amount of land. According to the respondents, the total land used by the 107
Van Gujjar’s families for agricultural purposes is 9,20,594 m2 (227.48 acres) with
average land size per household being 8219±474.8 m2 (2 acres). Only 6.25% of the
respondents reported having private land (16 acres) under their ownership. This
number is likely to be higher as the respondents were hesitant to disclose about their
private landholding details. There are 9 settlements, namely Tomarya Khatta, 44.No.
Shivnathpur Khatta, Kamugadaar Khatta, Jawalavan, Balligate, Gallikhaitani,
Arjunnala Khatta, Naunyaganj and Basiowala Khatta where Van Gujjars had used
allocated forest land as the agricultural land and all these settlements were found in
Nainital district of Uttarakhand.
4.5.2 Production of agricultural crops
The types of crops grown in the different settlements were found to be similar,
with people growing mostly fodder crops such as wheat and grass, and sometimes
rice and some vegetables. The total amount of wheat production in these settlements
round the year is about 53.9 tonnes, with average wheat production per household
(only for the 107 families having agricultural land) of 0.5 tonnes, and the by-product
34
of crop is used as fodder for livestock. As rice is not considered as fodder crop and
not allowed to grow in these fields, its cultivation and the total production is only 6.3
tonnes.
4.6 Pattern of energy consumption
4.6.1 Consumption of fuelwood
Van Gujjars use the live branches of trees for fodder and deadwood for
fuelwood and dera construction. In the majority of the households, cooking and
heating energy comes from fuelwood. Large quantities of wooden poles are needed
for fences, and old poles need to be replaced in every four or five years. Fuelwood
consumption is very high because of lack of other sources of energy. Most of the
fuelwood is collected from nearby forests, but sometimes people have to go long
distances of about 4 to 5 km to collect fuelwood as these resources are scarce in the
nearby areas. According to respondents, this scarcity is attributed to plantation of
monoculture species. However, respondents from some settlements reported that
there is no shortage of fuelwood as the tree damaged by elephants provides them
ample quantity of such resources. The total fuelwood consumption in all households
for one day was found to be 10500 kg with average consumption per household per
day being 30.9± 0.7kg, and the yearly consumption of fuelwood per household
estimated to be about 11282.1 kg. The total yearly consumption of fuelwood in all
households was estimated at about 3836800 kg. According to WWF research (2011),
the average rate value of fuelwood in Ramnagar Division of Uttarakhand is Rs. 2.1
per kg and it has been estimated that per year consumption of fuelwood per
household in relation to economic market value is Rs. 23,692.00 and for all
households it was estimated to be Rs. 80, 57,175.00. Based on the effective heat
produced, a 2 m3 biogas plant could replace, in a month, fuel equivalent of 26 kg
LPG (nearly two standard cylinders), or 37 litres of kerosene, or 88 kg of charcoal, or
210 kg of fuelwood, or 740 kg of animal dung (Ramachandra, 2008). The heat
produced from 1 kg of LPG is equivalent to 8.08 kg of fuelwood. The yearly
consumption of fuelwood per household is about 11,282.15 kg. Therefore, if replaced
with LPG, the yearly consumption of LPG per household will be 1396.30 kg and for
all households it will be 4, 74,845.29 kg.

35
4.6.2 Manpower investment in fuelwood collection
The settlements inside and adjacent to the park depend entirely on fuelwood
from forest for all energy (cooking/heating/lighting) requirements. Nearly all
households in these settlements collect firewood from the forest. The total numbers
of members collecting fuelwood from all settlements in a single day were found as
443 individuals and average number of members per household collecting fuelwood
in one day was found to be 1.30±0.0019 individuals.
4.6.3 Use of kerosene as alternate energy source
The vast majority of respondents (95%) did not have access to electricity and
they light their homes with kerosene lamps and solar lights. For the Van Gujjars and
their livestock, considerable threats in the night were attacks by wild animals. It has
been found that 178 households (52.4%) used kerosene ranging between 1 to 5 litre
per months, with a further 108 households (31.8%) using 6 to 10 litre per month, and
19 households (5.6%) using 11 to 15 litres per month (figure - 4.16).
Figure - 4.16 Use of kerosene as a source of energy.
4.6.4 Use of solar energy
The use of solar lights has been found as a preferred alternative source of
energy for the lighting of deras. It has been found that nearly 219 households
(64.5%) are using solar lights to illuminate their deras. These solar lights are
provided by the forest department in some parts of the buffer zone of CTR. People
living outside the park area have purchased their own solar lights (fig. - 4.17).
10.3%
31.8%
5.6%
(n=34
0)
No use 01-05 lit 06-10 lit >10 lit
52.4%

36
Figure - 4.17 Use of solar lights by the Van Gujjars.
4.7 Consumption of fodder
Van Gujjars use trees as a major source of fodder by lopping their branches
for consumption by livestock. These Van Gujjars graze their livestock freely in forests
and it was difficult to obtain reliable information on the consumption of fodder per
livestock per day. In case of scarcity of fodder in nearby forests, the Van Gujjars
provide by-product of wheat crop to their livestock and often buy it from the nearby
villages. According to respondents, some of the more abundant species like Mallotus
phillippinensis, Cassia fistula, Shorea robusta, are not good as fodder or firewood
and favoured species were Anogeissus latifolia, Terminalia alata, Ziziphus
mauritiana, Ougenia oogenensis, Acacia catechu, Phyllanthus emblica and Bauhinia
racemosa. Each Van Gujjar family had a particular permitted area from forest
department within which they are supposed to lop trees and graze their buffaloes.
However, this is not followed strictly as the Van Gujjar population density has
tremendously increased over the years. As a result, a particular zone of usage is
utilized more than the actual permitted number of families.
4.8 Wildlife damage patterns
4.8.1 Livestock damage and predator involved
A significant percentage of households (44.1%) reported losing livestock to
predators within the last two years. The total livestock killed in these settlements over
the last two years was found to be 362 individuals, with an average livestock killed
per household was found to be 1.06 ± 0.16 individuals. About 85% of households
reported loss of domestic livestock due to tiger (mostly buffaloes and cows),
whereas, 14.66% households reported damage due to leopard. This clearly confirms
the tiger as a primary livestock predator within the study area. The majority of
64.5%
35.6%
Uses solar
light
Not yet used
solar light (n=340)

37
households reported that most of the livestock damage takes place in monsoon
season. Some of the households, those growing agricultural crops, reported crop
damage by wildlife like elephant and other herbivores (Fig. - 4.18).
Figure - 4.18 Damage of livestock by wild animals.
4.8.2 Damage prevention measures/ guarding livestock
Nearly most of households (95.6%) deputed family members to guard their
livestock herds. Only 4.4% of households reported that they did not guard their
livestock, and some of these households owned no or very few livestock. The total
numbers of members guarding livestock in these settlements were 804 individuals
with an average number of members guarding livestock of 2.36±0.079 individuals.
Daytime livestock protection measures include use of guards and/or shouting aided
by other noisemaking practices such as beating of metal pots and pans and also
using trained domestic dogs. During the night they burn smoky fires around their
settlements. In some settlements, cattle graze in vicinity, thus allowing Van Gujjars to
keep a watch over them. Many respondents reported that they visit the grazing site
in forest many times a day to ensure that cattle are safe, which also increases their
chances of an encounter with tiger or leopard.
4.9 Vehicle ownership
Household material possessions are used as a measure of wealth. These
include land, livestock, transport means (e.g., motorcycle, vehicle), and the type of
house structure. An attempt was made to find out the number of households in
possession of vehicles. Transport opportunities are very restricted for the Van Gujjar
settlements. Only one respondent had a Jeep/Tipper, 27.4% had no vehicle at all,
and 60.6% had motorcycles. About 11.8 % of the respondents reported to have both
55.9%
37.6%
6.5%
No damage Damage by
tiger
Damage by
leopard
(n=340)

38
motor cycle and a tractor. People most travel by foot or motorcycle, or by using
available public and private transport (Fig. - 4.19).
Figure - 4.19 Vehicle possessions by households.
4.10 Discussion
Conducting a socio-economic and attitude survey in an illiterate community
presents a number of difficulties. For example, the questions needed to be delivered
orally, enumerators have to ensure that respondents understand each question, and
special measures have to be taken to avoid or minimize potential bias to survey
results. There are many factors that potential bias the survey’s outcome, all of which
need to be carefully considered well in advance of administering the actual
questionnaire (Salant and Dillman 1994; Fowler 1998). The present study used the
demographic and attitudinal survey to better understand how people perceive
problems, wildlife conservation, changes over the last decade, their dependence on
CTR and adjoining forests, and their opinions about their relocation. This instrument
enabled us to explore Van Gujjar’s beliefs, opinions, preferences, motivations and
perceptions. The Van Gujjars have been part of CTR for the last 60 to 70 years
(Kumar 1995). A total of 340 households were visited for door-to-door interviews in
37 settlements within four districts of Pauri, Nainital, Udhamsingh Nagar
(Uttarakhand) and Bijnor (Uttar Pradesh). Information collected showed the scattered
distribution of Van Gujjars population in and around CTR. Scattered and nomadic
nature of the community is likely to impact biotic resources much more in proportion
to their actual numbers and settlements. Distribution of these settlements in different
administrative units also creates problems in implementing rules and regulation
uniformly. It is noteworthy that Van Gujjars are able to maintain their family size for
quite a long time. In spite of high birth rate their numbers were not increased
dramatically as infant and mother’s mortality is quite common due to the absence of
primary health check up facilities in nearby areas.
27.4
%
60.6%
11.8% 0.3%
No
vechi
le
Bike Bike/tractor Tipper/jeep
(n=340)

39
About 66% of adults are literate in India (UN, 2009), but in present study
almost all the respondent were illiterate. The Van Gujjars have been educating their
children from the past 10-15 years. However, education remains minimal and only
17% of current population claimed to be literate, with only a few continuing their
education beyond primary level. The distance from the primary education facility,
infrastructure and trained manpower along with lack of accountability of the people
responsible for educating them plays a crucial negative role in the literacy levels of
this community. With exposure to modern day facilities, many of people wish to
continue with higher studies and change their present nomadic nature of life.
According to Gibson et al. (2000), rural communities in developing countries have
always been largely dependent on natural resources for their day-to-day lives. This
dependence continues even today for millions of forest dwellers. According to Gooch
(1998), Van Gujjars may be regarded as more of an exception than as a rule among
pastoralists of the world, as they rely almost entirely on their herds for their livelihood.
The same is the case for this study, in which all respondents depend entirely on
forest products for their livelihood. Shifting of livelihood sources from pastoralism to
other activities clearly shows that the Van Gujjars are looking for alternatives and can
be considered for effective relocation programme. However, this requires effective
intervention as many of them are still living nomadic life. Livestock being integral part
of their culture, they may not be willing to be relocated where they have to live
without any livestock.
In a similar study on Van Gujjars in Rajaji National Park ( Harihar, 2011) 158
Van Gujjar households were interviewed and it was found that production and selling
of milk was the primary source of income. This study showed that the average total
household income was similar among most households, although there are a few
exceptions. The estimated household income was sufficient to fulfil basic needs and
was comfortably above the cut-off limit of for the Government of India to consider a
family below the poverty line. Similar or more income should be ensured at the time
of making plans to relocate Van Gujjars from their present location and profession.
Chhatre and Saberwal (2005) in their study stated that lack of public support
and political will has resulted in weak or sporadic enforcement of the stringent forest
and wildlife laws and grazing is pervasive in most of the protected areas in the
country. Although Van Gujjars have officially been prohibited from using core areas
of CTR, the present study reveals that their livelihood still depends significantly on

40
forests, as 63.53% of the Van Gujjars reported dependence on forests of CTR and
adjoining forest divisions. It was found that 36.47% of Van Gujjars migrate to their
temporary locations with buffaloes for better availability of fodder and water, both
inside and outside CTR. According to Maikhuri et al. (2000) the creation of National
Parks and protected areas has led to the removal of local inhabitants and their
exclusion from traditionally used natural resources, and Van Gujjar families migrating
to the pastures today may face the restrictions considering the need for inviolate
space for tiger and other wild species and their conservation. This could be the
reason that majority of Van Gujjars in the present study utilize permanent places for
grazing throughout the year, but still some Van Gujjar households migrate with
livestock during May-August and September-March. This decline in nomadic nature
of Van Gujjars though reduces the pressure on biotic resources, however, migration
follows the same routes each year, meaning disturbance occurs in the same places,
and local vegetation does not get sufficient time to recover. However, regulating the
migration alone would not be the solution to reduce biotic pressure unless the
livestock holding is reduced drastically and the people are provided with some
alternative sources of income.
Availability of water near to their settlement is important for Van Gujjars. Most
of the households have good access to water. Even Van Gujjars have installed hand
pumps near their deras. Provision of hand pump and tap water inside or near to Van
Gujjar deras shows their intention to stay in a permanent settlement rather than
migrate seasonally to overcome water scarcity.
Kothari et al.(1995) state that local communities often have unclear or
unregistered right to natural resources and lands and many development facilities
(access to basic amenities, transport, health and education facilities, land
development, etc) do not reach villages located inside PAs. Similar results were
found in present study with vast majority of respondents are facing the same
problems for both basic amenities and from natural resources. The problems of
access to basic amenities mainly constitute electricity, access to the motor road,
distance from nearest market and primary health check up facilities. Any prospective
relocation programme must look into these aspects so that Van Gujjars can be
convinced and relocated successfully.
The economic contribution of protected areas to both local communities and
national revenues has been measured and discussed extensively by several authors

41
(Moyini et al., 2001; Purna et al., 2004). The present study shows the case of CTR is
also the same as the PA supports many economic activities of the local people. Only
31.47% of the total households grow agricultural crops and fodder on the allocated
forest land which is even not sufficient to meet the requirement. According to Karanth
et. al., (2006), benefits to local residents from PAs can be substantial, ranging from
basic services such as fuelwood, grazing land, and forest products, to economic
benefits derived from tourism-related employment income as well as religious and
cultural values. In the present study, Van Gujjars used to derive benefits from the
protected area and surrounding forests in terms of fuelwood and fodder collection.
Bromley (2000) stated that poor households were more likely to use firewood
as a principal energy source as opposed to more wealthy households who had
access to charcoal, kerosene and gas. In the present study though respondents were
dependent on fuelwood for cooking purposes but all of them were also using
alternative source of energy. The use of solar lights has been found as a preferred
alternative source of energy for the lighting purpose by the Van Gujjars with 64.5% of
respondents using solar lights for lighting their deras during the night.
Studies have documented that plant species most frequently grazed by
livestock and lopped for fodder within Rajaji National Park constitute some of the
most important food plants for wild ungulates and elephants (Williams, 2002),
indicating that wild herbivores were particularly susceptible to competition with
livestock (Madhusudan, 2004), and in the present study same species were found to
be most favoured by Van Gujjars for lopping as fodder.
Van Gujjars reported cattle lifting by tigers and leopards with most of the cattle
depredation incidents by tigers. According to Badola (1998) and Johnsingh et al.
(2002), countless incidents of livestock predation (by leopards and tigers) and crop
raiding (by wild boars, birds, elephants, and ungulates) also occur annually in
communities surrounding Rajaji National Park.

42
Plate 2: Demographic profile of Van Gujjars.

43
CHAPTER – 5
PERCEPTIONS AND ATTITUDES OF VAN GUJJARS
5.1 Introduction
Attitude surveys are a common tool in human dimensions research. Survey
results assist natural resource professionals in obtaining an improved,
interdisciplinary understanding of how public perceptions and preferences can
guide public representation and education. The methods of assessing people's
attitudes and behaviour are well documented in the social science literature (Lloyd et.
al., 1984). Generally, the manner in which local communities use forest resources
and react to forest rules determines their social behaviour and attitudes towards the
forest. According to Gross (1987), there is a relationship between one's attitude and
behaviour. Therefore, if one's attitude is known, it is possible to predict his/her
behaviour. But attitudes can only be used to predict behaviour when appropriate
measurement techniques are used. Socio-economic research has revealed that rural
household’s behaviour regarding natural resource management is influenced by
demographic and socio-economic factors. According to Allendorf (1999) there is
growing empirical evidence in support of that local people’s support for natural
resource management (especially through establishment of Protected Areas)
depends mainly on the tangible benefits and costs of living in or around such areas
against the background of socio-economic and demographic consideration. Mordi
(1987) proposed that education could make rural households more conscious and
less effective in their attitude towards conservation. Living in proximity to PAs also
poses costs such as damage or loss of crops, livestock lifting, and occasionally injury
or death to people.
In this chapter, a comprehensive picture of problems, use value of the CTR and
adjoining forests for Van Gujjars, perceptions and attitudes towards education,
wildlife conservation, changes from last decade, protected areas awareness, and
various opinions about their potential relocation are presented.
5.2 Problems of basic amenities for Van Gujjars
Van Gujjars are facing many problems related to their basic needs. Most of the
respondents were of the opinion that they are living far away from civilization and
there is no difference between them and wild animals. Nearly all of the respondents

44
reported that they didn’t have access to any kind of health facility in their respective
places. Respondents reported that they have lost many lives in past because it was
not possible for them to take an ailing person to the medical centre. Out of the 37
settlements, only 5 settlements had the opportunity to avail primary health check up
facility. As discussed, access to roads and vehicles is a problem for many Gujjars,
and this compounds the issue of access to healthcare.
According to the respondents, grazing permits are denied in traditional grazing
sites which have been converted into protected areas, wildlife sanctuaries and
national parks. Since 1990 not a single permit has been issued by the forest
department. Van Gujjars are managing somehow, at the field level, to allow animals
to enter protected areas for grazing and lopping purposes. Out of the total 37
settlements 24 settlements of Van Gujjars reported facing strict regulations from the
forest department.
The primary schools are being run by NGOs and no permanent teachers are
appointed. These teachers do not visit schools on a regular basis, mainly as they fear
in travelling through the forested routes. The literacy rate of the entire respondent
class was nil as all the respondents interviewed were uneducated. Out of the 37
settlements, 32 settlements of Van Gujjars are facing the problems of lack of
education for their children, whereas, children from 5 settlements go to schools
located in nearby villages.
Forest fire was also among the main threats to the settlements of Van Gujjars
because their deras/ houses are mostly made of wood and grass. It was observed
that 9 settlements have considerable risk of damage due to forest fire.
Prevention, control and eradication of diseases among domesticated animals
were major concerns as death of an animal lead to economic loss to the Van Gujjars.
Livestock were the main foundation of economy for the Van Gujjars. It was found that
none of the settlements have access to a veterinary facility.
It has been found that 36.47% of Van Gujjars migrate to their temporary locations
or deras with buffaloes for the better fodder and water availability. They rely on the
rains for water availability and good fodder production for their livestock, and shift
between settlements located in different areas accordingly. In case of water scarcity,
other than migrating to a different settlement, the other solution was using hand
pumps as some of the settlements were having hand pumps as well. Out of the 37

45
settlements of Van Gujjars, 27 settlements were found to be facing problems due to
shortage of fodder and water, thus forcing them to migrate (Fig.- 5.1).
Fig. 5.1 - The various problems faced by Van Gujjars for basic
amenities.
5.3 Problems of Van Gujjars from wildlife and other associated parameters
The main problem in the Van Gujjar settlements was found to be the threat from wild
animals. This has lead to school dropout as the children fear travelling through forest
roads and are often busy in guarding their livestock from wild animals. Most of the
Van Gujjar settlements (27) reported problems from wild animals. Other than wild
animals, water scarcity was found another major problem for Van Gujjars. Out of total
37 settlements, 23 settlements were also facing the problem of water scarcity for their
livestock.
The developmental projects taken up during the 1970s and large scale
plantations raised during the 1960s in many of the reserved forest areas such as
Haridwar (Part), Bijnor, Terai-west, Terai-central and Terai-east, largely to meet the
industrial needs, replaced mixed forests and grasslands. These monoculture
plantations resulted in drastic changes in the habitat composition for the wildlife.
Lantana camara, Parthenium hysterophorus, Adhatoda vasica, Cannabis sativa and
Cassia tora, are multiplying throughout in these areas, reducing the suitability of such
habitats for both wild herbivores and livestock of Van Gujjars.
Hospital Road Electricity Forest
department.
Education Fire Veterinary Migration
32
16
35
24
32
9
37
10
5
21
2
13
5
28
0
27
Ye
s
No
(n=37)

46
At present existing monoculture plantations (teak, eucalyptus), seen around the CTR,
offer very little to herbivores in terms of foraged goods and cover. This shortcoming
of plantations has also resulted in the shortage or scarcity of fodder for livestock of
Van Gujjars. Most of the respondents were of the opinion that monoculture forestry
was also among the main reasons for the temporary migration of Van Gujjars. The
respondents were also of the view that there should be a plantation of palatable
species which will benefit not only livestock of Van Gujjars but also several ungulate
species (Fig. - 5.2).
Fig. 5.2 - The problems faced by Van
Gujjars from natural resources.
5.4 Emotional Attachment
5.4.1 Emotional attachment of Van Gujjars with their settlements
It has been found that 62.3% respondents were emotionally attached to their
settlement (it is noteworthy that even these emotionally attached respondents
expressed that they would not have any problem in being relocated), whereas, 37.6%
respondents said that they want their future generations to leave these settlements
and move to bigger towns like Haridwar, Dehradun, hoping for better life and living
conditions.
5.4.2 Binding Factors with the Present Place
About 35.1% of respondents considered themselves to be emotionally bound
with the forests and their livestock, while 24.3% feel attached with ancestors or
Wild
animal
Water
scarcity
Fodder
SCARCITY
Plantation
27
23
28
17
10
14
9
20
Yes No
(n=37)

47
ancestral properties in the settlements. Moreover, 13.5% were attached to ancestor
properties as well as buffaloes, and a further 27.1% had no response to this
particular aspect (Fig. - 5.3).
Fig. 5.3 - Categories which emotionally bind Van Gujjars with present place.
5.5 Willingness for Shifting of Future Generations
5.5.1 Number of years living in these settlements
These Van Gujjars have been living within permanent and temporary
settlements inside and outside the CTR for several decades. The study showed that
45.9% of respondents have lived in their respective places for last 20 to 40 years,
followed by 37.8% of respondents living for 40 to 60 years and 16.2% living for last
10 to 20 years with permanent settlements inside and outside the CTR (Fig. - 5.4).
Figure - 5.4 Number of years of settlements establishment in park.
5.5.2 Respondents favouring to shift for their future generation
Almost all the respondents wanted to shift their future generation. Among
these, 78.3% of respondents wanted to shift their future generations to other places
27.1 24.3
35.1
13.5
Ancestors/ ancestral place
Nothing
Forests/buffaloes Ancestors/buffaloes
P
e
r
c
e
n
t
(n=340)
16.2
45.9
37.8 40-60
20-40
15-20 P
e
r
c
e
n
t
(n=340)

48
due to the lack of education and better facilities. Whereas, 10.8% of respondents
wanted to shift due to monoculture plantation and fodder scarcity and claimed that
forests are no longer sufficiently productive to support their livestock. A further 10.8%
wanted to shift their future generation to other places to avoid inconvenience due to
conservation programmes and seek better future for coming generations (Fig - 5.5).
Figure - 5.5 The categories for which they want to shift their future generation.
5.6 Status of dependency on alternative energy other than fuelwood
5.6.1 Alternative source of energy other than fuelwood
All the respondents agreed to the use of alternate source of energy. Study
showed that 81.1% were dependent on kerosene and solar, 18.9% were dependent
on Kerosene combined with solar and electricity. None of the respondent was using
the Liquefied Petroleum Gas (LPG) (Fig. - 5.6).
Figure - 5.6 Use of alternative sources of energy in study area.
81.1%
18.9%
(n=340)
Kerosene/solar
Kerosene/solar/electricity
(n=340)
10.8% 10.8%
Plantation/fodder scarcity
Forest department
78.3% Education/better facilities

49
5.7 Perception of Van Gujjars about changing pattern of natural resources
5.7.1 One decade dynamics of availability of fodder, fuelwood and timber
Fuelwood consumption was found to be very high because of lack of
alternative sources of energy. Mostly, the fuelwood is collected from nearby forests
and sometimes people have to go to collect it from long distances. The total fuelwood
consumption in all settlements for one day was found to be 10510 kg with average
consumption per household per day was 30.9kg. Most of the respondents (91.7%)
were of the perception that the availability of fodder, fuelwood and timber has
decreased, whereas, some respondents (8.3%) were of the view that the availability
of fodder, fuelwood and timber remained same in the last ten years (Fig. - 5.7).
Figure - 5.7 Perception of respondents about change in fodder, fuel wood, and timber during last 10 years
5.7.2 Reason for change in the availability of fodder, fuelwood and timber
According to 54.1% of respondents, the decrease in the availability of fodder,
fuelwood and timber was mainly due to monoculture plantation by the forest
department around their settlements. Whereas, 24.3% of respondents were of view
that decrease was due to increased dependency on forests with little or no
improvement of forest resources. It has also been found that 18.9% of respondents
were of the view that invasion of weeds had resulted in a decrease in the availability
of fodder, fuelwood and timber. 2.7% of respondents were of view that availability of
fodder, fuelwood and timber has remained same (Fig. - 5.8).
(n=340)
91.7%
8.3%
Decreased
Remained same

50
Fig. 5.8 - Reason behind change in availability of fodder/ fuelwood/timber during 2000 to 2011.
5.7.3 Perception about the change in the dependency on forest
About 67.6% of respondents were found to be of the view that there was
decrease in the dependency, while 16.2% of respondents were of view that there is
an increase in dependency of Van Gujjars on forests during last ten years. Among
them, 16.2% of respondents were of view that the dependency on forests remained
same during last ten years (Fig. - 5.9).
Figure - 5.9 Perception of Van Gujjars about the change in the dependency of settlements on forests of CTR.
5.7.4 Reason for change in dependency on forests
Most of the respondents (59.4%) were of view that fodder scarcity and
monoculture plantations caused decreased dependency on forest, whereas, 13.5%
of respondents are of view that the decrease in cattle population has resulted in
decreased dependency of Van Gujjars on forests. The remaining 27.1% of
respondents were of view that increase in Van Gujjar population has resulted in
increased dependency on forests (Fig.5.10).
(n=340)
24.3
54.1
18.9
2.7
P
e
r
c
e
n
t
Plantation
Weeds
(LANTANA) Same
Dependency increased/forests
same
(n=340)
16.2%
67.6%
16.2%
Increased
Decreased Same

51
Figure - 5.10 Perception of Van Gujjars about reasons behind changing dependency of Van Gujjars on forests of CTR
5.7.5 Perception about the change in forests structure and composition
According to respondents large scale monoculture plantations of Eucalyptus
spp, Acacia catechu, Dalbergia sissoo, Tectona grandis etc during last few decades
around CTR (largely to meet industrial needs) has replaced the mixed forests and
grasslands. During the survey, 43.2% of the respondents were of the opinion that
trees and canopy cover had decreased, whereas, 35.1% of the respondents were of
the view that there was change in species composition. While 21.7% of the
respondents were of view that trees number had increased but canopy cover of
forest decreased (Fig. - 5.11).
Figure - 5.11 Perception of Van Gujjars about change in forest of CTR.
5.7.6 Perception about change in livestock population
During the study 59.5% of respondents were of the view that there was
decrease in the livestock population, whereas, 40.5% of respondents were of the
view that there was an increase in the livestock population during the last ten years.
This statistic is closely linked with the present livelihood status of Van Gujjars. The
people who were still purely pastoralist and completely dependent on livestock were
(n=340)
43.2%
21.7%
35.1%
Trees have increased but canopy cover
declined Change in species composition
Trees have decreased and canopy cover
decreased
(n=340)
27.1%
59.4%
13.5%
Cattle population decreased Fodder scarcity/ plantation Population/deras increased

52
of the opinion that the livestock has increased, whereas, due to combination of
different other livelihood options, many of them actually had reduced their livestock
holding. This phenomenon leads us to understand that if the alternative options of
livelihood are provided to them; the community can reduce their livestock numbers
significantly which will reduce pressure on the forest resources. People who live
away from buffer zone also feel that less damage to livestock due to predators has
also resulted in increased livestock population (Fig. - 5.12).
Figure - 5.12 Change in livestock population during 2000-2011.
5.7.7 Perception about change in elephant population
Van Gujjars settlements in and around the CTR seem to have resulted in
shrinkage of elephant’s traditional migratory paths. Most respondents (67.6%) were
of the view that elephant population had increased, whereas, 12.3% of respondents
were of the view that elephant population had decreased during last ten years. This
perception is based on Van Gujjars encounter rate with the elephant, and is unlikely
to be a reliable indicator of the true scenario of elephant population in CTR. The
remaining 20.1% of respondents held no opinion about the change in elephant
population.
5.7.8 Perception about change in tiger population
During the survey 46% of respondents were of the view that there was an
increase in the tiger population, whereas, 10.8% of respondents were of view that
there was decrease in tiger population during the last ten years. Similarly, as in case
of elephant, this perception about tiger number is based on their encounter rates.
However, 43.2% of respondents held no opinion about the change in the tiger
population (Fig. - 5.13).
(n=340)
40.5% Increased
Decreased
59.5%

53
Figure - 5.13 Perception of Van Gujjars about change in tiger population during 2000 to 2011.
5.8 Awareness of laws and regulations applicable in and around CTR
It was found that 74.7% of respondents were aware about laws related to
conservation, whereas, 25.3% of respondents were unaware or had little knowledge
about such laws (Fig. - 5.14). The people with awareness of these laws need to be
sensitised towards maintaining these regulations, whereas, those who they are
unaware need immediate attention to facilitate the conservation effort by the forest
department and NGOs.
Figure - 5.14 Awareness of Van Gujjars about laws applicable in CTR.
5.9 Perception of Van Gujjars about threats from wildlife
About 44.1% of households reported losing some livestock to predators over
the last two years. The majority 67.6% of respondents reported that there had been a
greater threat from wild animals around their settlements. Some of the households
which are growing agricultural crops reported suffering from crop damage by wildlife,
namely elephants, wild boar, spotted dear and other herbivores (Fig - 5.15).
(n=340)
25.3%
74.7% No
Yes
(n=340)
46%
10.8%
43.2% Increased
Decreased
No opinion

54
Figure - 5.15 Perception of respondents about threats from wild animals.
5.10 Perception towards wildlife conservation
Most of the respondents had positive attitude towards nature conservation and
protected areas. These efforts include reporting of illegal hunting, forest fire and
protection of trees from illegal felling. The overall mean response also showed that
respondents had positive perception towards wildlife conservation and stated that
they even provide water to most of the wild animals around their deras and do not
harm any wild animal. Some of the respondent were against protected areas and
were of the view that conserving wildlife should not be important than the basic
survival of human beings.
5.11 Perception towards relocation process
Resettlement of Van Gujjar settlements, especially the ones in the core and
buffer zone of the CTR, is necessary both for the conservation of wildlife and
improving the socio-economic condition of the Van Gujjars. Almost all of the
respondents living inside and outside the national park were willing to be relocated.
The main reason was that they believe it will be beneficial for their future generations
in terms of better education, employment opportunities, healthcare and other basic
facilities. The Van Gujjars living in the buffer zone have been approached many times
by the government authorities and briefed that each family will get financial package
for relocation, but Van Gujjars believe that providing financial assistance as per the
existing government norms will not be a sound solution because this amount is
insufficient for relocation. Some of the respondents were of the view that there is a
high probability that Van Gujjars will waste away the money in purchasing motor
vehicles and household luxury items instead of investing in more necessary
amenities like housing, agriculture, irrigation, drinking water, etc.
(n=340)
32.4%
67.6% No
Yes

55
According to respondents, Van Gujjars should be involved in designing every
step of the resettlement process and should be done according to the models of
Ghaindikatha and Pathri (RNP), where Van Gujjars have been resettled in fringe
forest areas and were given incentives to build and live in their traditional huts.
Some of the respondents living inside the park were of the view that the
present political setting is conducive to successful relocation, and also feel that the
present mindset of the Van Gujjars is favourable for immediate intervention in
resettlement process. They also feel that the government should take step ahead
and raise funds for them, at least for all the Van Gujjars in the core and buffer zone of
the CTR, especially Sonanadi Wildlife Sanctuary, as early as possible.
It has been found that there is a well organized committee among Van Gujjars
of Uttarakhand which has been lobbying with government authorities for relocation
process, but there was no such working committee in Uttar Pradesh.
5.12 Discussion
In the present study it was found that Van Gujjars were facing various
problems like no access to primary health check up facilities, transportation,
electricity, education, veterinary facility and communication. The Van Gujjars were
also having problems from wild animals, water scarcity and fodder scarcity. This
condition of people living inside protected areas is common in various places in India.
According to a study by Karanth (2003), communities in Bhadra Wildlife Sanctuary
lacked basic amenities (no access to electricity, running water, quality health care,
schools, transportation, and communication). With exposure to the outside world and
realizing the status of their own, people are likely to develop mixed variable attitudes
to relocation and alternative livelihoods. People living closer to PAs may have
positive (Badola 1998) or negative attitudes (Mehta and Heinen 2001) towards the
PAs.
In the present study, all respondents were willing to relocate for the better
future of their coming generations. This condition is comparable to those of Van
Gujjars living in RNP (Harihar 2011). In RNP, Van Gujjars sited similar views behind
the reason for their relocation.
Presently, the monoculture plantations (teak, eucalyptus) seen around the CTR offer
very little to herbivores in terms of forage and cover. This shortcoming of such
plantations had also resulted in the shortage or scarcity of fodder for livestocks of

56
Van Gujjars. In the present study majority of respondents were of the view that there
was decrease in the availability of fodder, fuelwood and timber during last ten years.
Whereas, some feel that decrease was due to invasion of weeds.
In addition, almost half of respondents were of view that trees and canopy
cover have decreased, whereas, nearly one third of the respondents were of the view
that there was change in species composition. This indicates excessive lopping or
planting of open canopy species in areas where they usually live and venture.
According to a study by Mishra (2000), villagers claimed predation rates
increased following the establishment of the sanctuary, but surveys indicated a
dramatic increase in livestock numbers accompanying changes in animal husbandry
systems. In present study more than half of the respondents were of the view that
livestock population had decreased over the years. Most of the respondents reported
threat from wild animals around their settlements.
According to Daniel (1996) India currently has the largest surviving population
of the Asian elephant, approximately 50 % of the total world population of the
species. The elephant population in the country has increased in the past 15 years.
Van Gujjars also believe that there was an increase in elephant’s population during
the last ten years. According to the National Tiger Conservation Authority (NTCA) the
number of tigers has increased from 1,411 to 1,706 between 2006 and 2010 (MOEF,
2011). CTR has also been reported as having an increase in tiger numbers.
Approximately half of the Van Gujjars were of the view that tiger population had
increased in the last ten years.
In the present study, many of the respondents had positive attitude towards nature
conservation and protected areas. According to respondents, their presence does not
considerably affect the CTR and adjoining forests. On the contrary, it prevented
illegal activities like poaching or wood cutting by outsiders. On the other hand, the
idea that there is no impact on biodiversity due to human activity has been
scientifically refuted by several studies (Kibreab 1996; Kumar & Shahabuddin 2006).
Some respondents had negative perceptions regarding protected areas as the basic
survival of human being was a priority for them.
According to Brockington and Igoe (2006) in some cases people have
objected to resettlement, sometimes violently, and occasionally moved back into the
reserves. In many reserves, there are efforts to prevent relocation, but the study of
Karanth and Karanth (2007) stated that the fragile nature of biodiversity in many

57
nature reserves, ongoing conflicts, and the demand from people for better living
standards necessitates that the conservation community examine relocation as a
possible conservation solution.
In present study we find that the Van Gujjars can potentially be relocated
without any conflict if proper care is taken. While deciding the relocation process and
packages, it is important to involve the communities affected, and that the process is
systematic and transparent.

58
CHAPTER – 6
BIOTIC IMPACT ESTIMATION
6.1 Introduction
Nature reserves protect a mere 12% of the world’s land surface (Rodrigues et
al., 2004). In India, 5 million people live inside nature reserves, and 147 million
depend on resources that these reserves provide (Kutty and Kothari, 2001).
Biodiversity loss, habitat fragmentation and land cover changes are going on across
many Indian PAs (Gadgil and Guha, 1992; Kothari et al., 1995). Human densities
around these nature reserves often exceed 300 people per km2 (Rodgers et al.,
2003). Small protected areas size and enclosure by densely populated areas make
PAs in India vulnerable to human and domestic livestock populations, and the
associated environmental impacts (Karanth, 2002; Rodgers et al., 2003). In many
Asian PAs, human pressures continue to threaten wildlife survival, habitat protection
and biological diversity (Karanth, 2002). Although threats to Indian parks are much
like those within Africa and the Americas, higher human population densities may
have more immediate and severe consequences in India (Brandon, 1998; Neumann,
1998; Brashares et al., 2001; Ferraro, 2002; Peres, 2002; Oates, 2002). The study by
Kumar (1995) stated that Shivaliks have faced anthropogenic pressure from
migrating and resident human populations in this area for at least the last century.
According to Johnsingh and Negi (2003) apart from the 520 km2 core area of the
Corbett National Park, which is free from human disturbance, the rest of the area is
subjected to various types of pressures for fuelwood, fodder collection and grazing
both from the Van Gujjar community living inside the forests and the villages located
at the periphery of the CTR. The ever-increasing biotic pressure has rendered the
vital Rajaji-Corbett corridor a poor in tiger habitat and has fragmented the habitat
which was an unbroken 300 km long stretch of Sal dominated (Shorea robusta) forest
just three decades ago. Substantial extraction of forest resources as a result of
widespread lopping for firewood and fodder and grazing by livestock has maintained
a sustained disturbance regime within this fragile ecosystem (Edgaonkar, 1995). The
study conducted by Badola (1994) in four villages near the Rajaji-Corbett corridor
reveals that the forests of the corridor cater to 95% of the fuelwoodneeds of the
villagers besides fodder requirement. Such demanding pressure can alter the
vegetation structure and composition and may even induce land degradation and

59
weed invasion. The forest communities of Shivaliks have also faced pressures from
forestry management for timber extraction and targeted species were promoted for
this purpose. However, the impact of these various human disturbances on the forest
remains unidentified. Though there have been studies focusing on Central Himalayan
belt (Kumar & Ram 2005) and other regions of Sal dominated areas including
plantations (Pandey & Shukla 2003) but there have not been many studies within
protected areas in North India that analyzed the effect of anthropogenic disturbance
in shaping the forest ecosystems, particularly their structure as a result of chronic
disturbance. The study of Edgaonkar (1995) revealed that Van Gujjar communities
used to feed their livestock, largely buffaloes (Bubalus bubalis), by lopping trees and
grazing them in the forest. The intensive lopping, firewood extraction and grazing in
most of these parts had led to lack of sustainable regeneration and proliferation of
weeds. Lopping of trees in forest areas is a conventional practice and a significant
forest-based economic activity for villagers residing in the vicinity of forest areas
Studies have documented that plant species most frequently grazed by livestock and
lopped for fodder (e.g., Terminalia alata, Anogeissus latifolia, Terminalia bellerica,
Terminalia chebula, Acacia catechu, etc.) within Rajaji National Park (RNP)constitute
some of the most important food plants for wild ungulates and elephants (Williams
2002), indicating that wild herbivores were particularly susceptible to competition with
livestock (Sankar, 1994; Khan, 1996; Mathai, 1999; Madhusudan, 2004). According
to a study by Johnsingh and Joshua (1995), Van Gujjar buffaloes urinate and
defecate in waterholes making them unfit for use by wild animals. Habitat disturbance
and degradation due to overgrazing is also the major problem as overgrazing leads
to proliferation of weeds and lack of regeneration of palatable plant species.
According to Shaanker et al., (2004), the proportion of lopped or cut stems per
sampling unit has often been used as a quantitative measure of human induced
disturbance by various authors and some others used it as an index of disturbance. It
has proved to be a fairly accurate measure that reflects the relative anthropogenic
pressure at a site.

60
Figure - 6.1 Transects for estimation of biotic interference around Van Gujjar settlements in and around CTR.

61
6.2 Results
The data of various disturbance parameters were analysed using principal
components analysis (PCA), employed to examine correlation and reduce data
redundancy. PCA is a linear transformation of data which rotates the axes of variable
space along lines of maximum variance. Although a number of principal components
may be acquired in the analysis, the first few principal components usually account
for a high proportion of the variance in the original data. Thus PCA is a fact-finding
tool that reduces measurement problems, such as bias, and reduces the complexity
of correlated data, as it extracts only variables that have significant contributions
among a set of variables or principal components which account for most of the
variance in the observed variables.
The correlation matrix among disturbance variables suggested substantial
inter-relationships among many of the measured variables. Because the habitat
disturbance variables were all highly correlated with each other, principal component
analysis was used to derive a habitat disturbance that could be used to determine
Van Gujjars’ population impact on habitat disturbance parameters. To examine
relationships between the PCA composite disturbance parameters and Van gujjar
population, villages were divided into four size classes based on the total number of
populations in each village. These villages were grouped into four groups namely G1
category villages with population size of less than 50 individuals and other groups are
G2,G3,G4 category villages with population size of 51 to 100 individuals, 101 to 150
individuals and 151 to 200 individuals respectively.
In order to determine main components, only principal components with
eigenvalues greater than 1 were selected; components with an eigenvalue of less
than 1 accounted for less variance than did the original variable and so were of little
use, as such were not extracted. Component loadings (correlation coefficients) and
the variances (eigenvalues) for the various disturbance variable parameters were
computed.
For G1 category of villages, component matrix of disturbance parameter
variables showed that five principal components with eigenvalues ≥1 can be retained
as a measure of habitat disturbance. A scree plot of eigenvalues plotted against
principal component number suggested that five principal component be retained and
these principal components accounted for 73.4% variation. Subsequent components
each explained less than ten percent of overall disturbance variability. The first
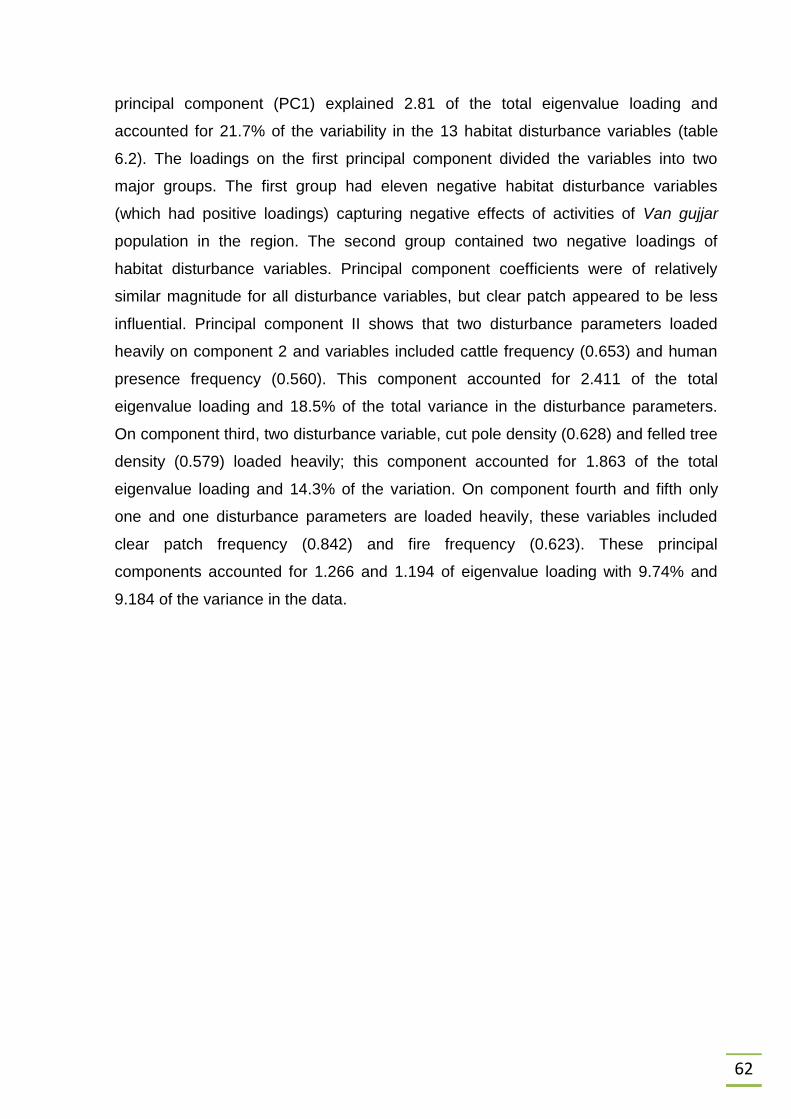
62
principal component (PC1) explained 2.81 of the total eigenvalue loading and
accounted for 21.7% of the variability in the 13 habitat disturbance variables (table
6.2). The loadings on the first principal component divided the variables into two
major groups. The first group had eleven negative habitat disturbance variables
(which had positive loadings) capturing negative effects of activities of Van gujjar
population in the region. The second group contained two negative loadings of
habitat disturbance variables. Principal component coefficients were of relatively
similar magnitude for all disturbance variables, but clear patch appeared to be less
influential. Principal component II shows that two disturbance parameters loaded
heavily on component 2 and variables included cattle frequency (0.653) and human
presence frequency (0.560). This component accounted for 2.411 of the total
eigenvalue loading and 18.5% of the total variance in the disturbance parameters.
On component third, two disturbance variable, cut pole density (0.628) and felled tree
density (0.579) loaded heavily; this component accounted for 1.863 of the total
eigenvalue loading and 14.3% of the variation. On component fourth and fifth only
one and one disturbance parameters are loaded heavily, these variables included
clear patch frequency (0.842) and fire frequency (0.623). These principal
components accounted for 1.266 and 1.194 of eigenvalue loading with 9.74% and
9.184 of the variance in the data.

63
Correlati
on
FTD LTD CPD PF FF NF DF CF HPF RBF CPF LRF
LTD 0.443
CPD 0.491 0.501
PF -0.223 0.126 0.012
FF 0.022 0.295 0.158 0.220
NF -0.100 0.003 0.042 0.151 0.013
DF 0.180 0.469 0.351 0.342 0.337 -0.110
CF -0.199 0.124 0.165 0.197 0.097 0.220 0.114
HPF 0.022 0.109 0.433 0.092 -0.033 0.135 0.130 0.315
RBF 0.313 0.654 0.293 0.268 0.310 -0.232 0.462 -0.130 -0.048
CPF 0.031 -0.176 0.025 0.256 0.020 -0.101 0.303 -0.031 0.269 -0.115
LRF 0.101 0.490 0.349 0.361 0.058 -0.107 0.390 0.009 0.075 0.697 -0.084
AF 0.022 -0.296 -0.156 -0.236 -0.234 0.201 -
0.412
-0.137 -0.138 -0.414 0.117 -0.322
Table 6.1 - The correlation matrix for thirteen habitat disturbance variables for category G1 villages.
Variables Component
1 2 3 4 5
FTD .391 -.482 .579 .186 .203
LTD .799 -.176 .188 -.239 .128
CPD .618 .049 .626 -.011 -.036
PF .385 .534 -.457 .074 .120
FF .422 .128 -.224 -.065 .623
NF -.133 .433 .249 -.481 .418
DF .725 .191 -.113 .307 .137
CF .131 .653 .145 -.394 -.127
HPF .231 .560 .514 .121 -.351
RBF .816 -.318 -.236 -.037 -.017
CPF .025 .409 .060 .842 .131
LRF .718 -.083 -.196 -.099 -.288
AF -.559 -.091 .329 .104 .353
Eigenvalues 2.81 2.411 1.863 1.266 1.194
%Variance 21.657 18.543 14.329 9.741 9.184
Cumulative explanation
21.657 40.201 54.53 64.27 73.455
Table 6.2 - The standardized loadings on the five principal components used to derive the forest disturbance for category G1 villages or settlements.
FTD=Felled trees/ Density/25m2, LTD=Lopped tree/ Density/25m
2, CPD=Cut poles/ Density/25m
2,
PF=Pellets/Frequency, FF=Fire/Frequency, NF=Noise/Frequency, DF=Dung/Frequency, CF=Cattle/Frequency, HPF=Human presence/Frequency, RBF=Remnants of branches and leaves/Frequency,
CPF=Clear Patch /Frequency, LRF=Lopped regeneration/Frequency, AF=Agriculture/Frequency

64
For G2 category of villages, component matrix of disturbance parameter
variables shows that five principal components with eigenvalues ≥1 can be retained
as a measure of habitat disturbance. A scree plot of eigenvalues plotted against
principal component number suggested that five principal components be retained
and these principal components accounted for 72.0% of variation (table 6.4).
Subsequent components each explained shows less than ten percent of overall
disturbance variability. The first principal component (PC1) explained 3.607 of the
total eigenvalue loading and accounted for 27.7% of the variability in the 13 habitat
disturbance variables. The loadings on the first principal component divided the
variables into two major groups. The first group had five negative habitat disturbance
variables (which had positive loadings) capturing negative effects of activities of Van
gujjar populations in the region. The second group contained eight negative loadings
of habitat disturbance variables. Principal component coefficients were of relatively
similar magnitude for all disturbance variables, but dung frequency (.306) appeared
to be less influential. Principal component shows that two disturbance parameters
loaded heavily on component 2 and variables included remnants of branches
frequency (0.770) and dung frequency (0.714). This component accounted for 1.816
of the total eigenvalue loading and 13.97% of the total variance in the disturbance
parameters. Principal component coefficients were of relatively similar magnitude for
all disturbance variables, but cut poles density (0.164) appeared to be less influential.
On component third, two disturbance variables, agriculture land frequency (0.774)
and cut pole density (0.629), loaded heavily; this component accounted for 1.587 of
the total eigenvalue loading and 12.2% of the variation. On component fourth and
fifth, only one disturbance parameter loaded heavily, these variables included pellets
frequency (0.711) and human presence frequency (0.600).These principal
components accounted for 1.328 and 1.019 of eigenvalue loading with 10.21% and
7.83%.
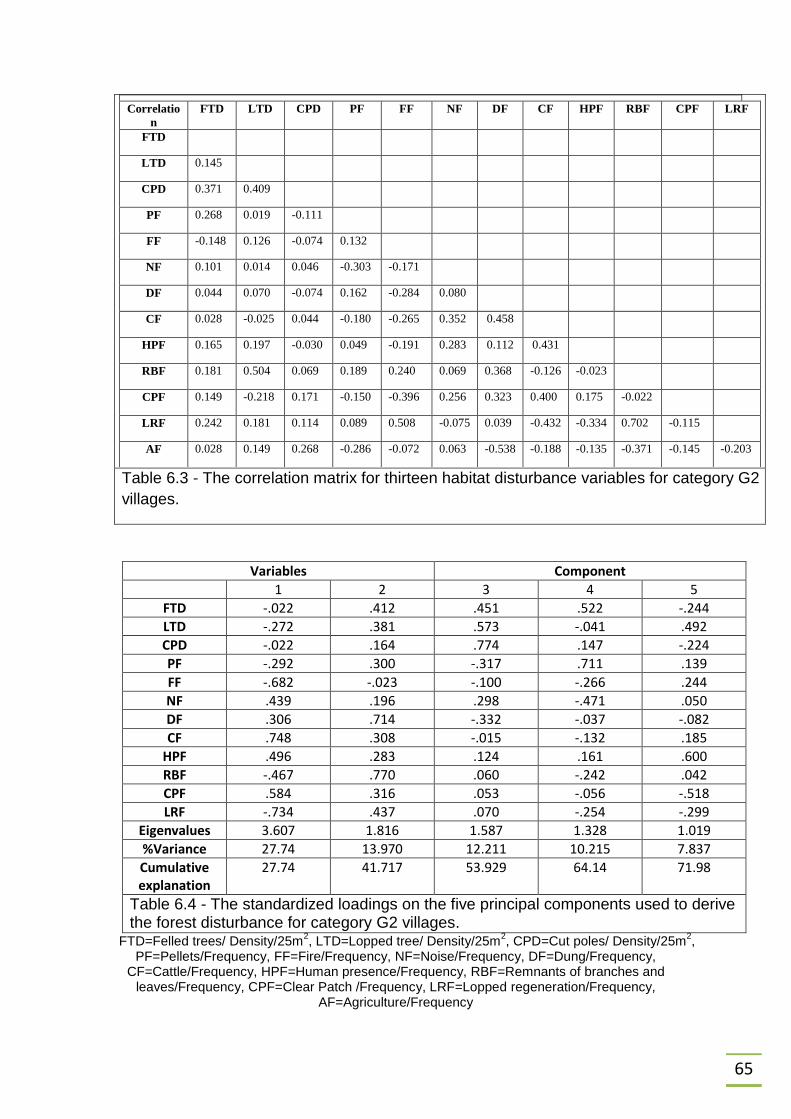
65
Correlatio
n
FTD LTD CPD PF FF NF DF CF HPF RBF CPF LRF
FTD
LTD 0.145
CPD 0.371 0.409
PF 0.268 0.019 -0.111
FF -0.148 0.126 -0.074 0.132
NF 0.101 0.014 0.046 -0.303 -0.171
DF 0.044 0.070 -0.074 0.162 -0.284 0.080
CF 0.028 -0.025 0.044 -0.180 -0.265 0.352 0.458
HPF 0.165 0.197 -0.030 0.049 -0.191 0.283 0.112 0.431
RBF 0.181 0.504 0.069 0.189 0.240 0.069 0.368 -0.126 -0.023
CPF 0.149 -0.218 0.171 -0.150 -0.396 0.256 0.323 0.400 0.175 -0.022
LRF 0.242 0.181 0.114 0.089 0.508 -0.075 0.039 -0.432 -0.334 0.702 -0.115
AF 0.028 0.149 0.268 -0.286 -0.072 0.063 -0.538 -0.188 -0.135 -0.371 -0.145 -0.203
Table 6.3 - The correlation matrix for thirteen habitat disturbance variables for category G2
villages.
Variables Component
1 2 3 4 5
FTD -.022 .412 .451 .522 -.244
LTD -.272 .381 .573 -.041 .492
CPD -.022 .164 .774 .147 -.224
PF -.292 .300 -.317 .711 .139
FF -.682 -.023 -.100 -.266 .244
NF .439 .196 .298 -.471 .050
DF .306 .714 -.332 -.037 -.082
CF .748 .308 -.015 -.132 .185
HPF .496 .283 .124 .161 .600
RBF -.467 .770 .060 -.242 .042
CPF .584 .316 .053 -.056 -.518
LRF -.734 .437 .070 -.254 -.299
Eigenvalues 3.607 1.816 1.587 1.328 1.019
%Variance 27.74 13.970 12.211 10.215 7.837
Cumulative explanation
27.74 41.717 53.929 64.14 71.98
Table 6.4 - The standardized loadings on the five principal components used to derive the forest disturbance for category G2 villages.
FTD=Felled trees/ Density/25m2, LTD=Lopped tree/ Density/25m
2, CPD=Cut poles/ Density/25m
2,
PF=Pellets/Frequency, FF=Fire/Frequency, NF=Noise/Frequency, DF=Dung/Frequency, CF=Cattle/Frequency, HPF=Human presence/Frequency, RBF=Remnants of branches and
leaves/Frequency, CPF=Clear Patch /Frequency, LRF=Lopped regeneration/Frequency, AF=Agriculture/Frequency

66
For G3 category of villages, component matrix of disturbance parameter
variables shows that five principal components with eigenvalues ≥1 can be retained as
a measure of habitat disturbance. A scree plot of eigenvalues plotted against principal
component number suggested that five principal components be retained and these
principal components accounted for 81.2% variation (table 6.6). Subsequent
components each explained shows less than ten percent of overall disturbance
variability. The first principal component (PC1) explained 2.985 of the total eigenvalue
loading and accounted for 23.0% of the variability for the 13 habitat disturbance
variables. The loadings on the first principal component divided the variables into two
major groups. The first group had seven negative habitat disturbance variables (which
had positive loadings) with higher loading on variables lopped regeneration frequency
(0.878) and remnants of branches (0.825), capturing negative effects of activities of Van
gujjar populations in the region. The second group contained six negative loadings of
habitat disturbance variables. Principal component coefficients were of relatively similar
magnitude for all disturbance variables, but pellet presence frequency (0.133) appeared
to be less influential. Principal component shows that two disturbance parameters
loaded heavily on component 2 and variables included pellet presence frequency
(0.813) and cattle presence frequency (0.645). This component accounted for 2.374 of
the total eigenvalue loading and 18.262% of the total variance in the disturbance
parameters. Principal component coefficients were of relatively similar magnitude for all
disturbance variables, but dung presence frequency (0.198) appeared to be less
influential. On component third, two disturbance variable, clear patch frequency (0.645)
and dung presence frequency (0.638) loaded heavily; this component accounted for
1.723 of the total eigenvalue loading and 13.250% of the variation. On component
fourth and fifth, there is no such higher loading of disturbance parameter variables as in
first three components. These principal components accounted for 1.551 and 1.175 of
eigenvalue loading with 11.9% and 9.040.

67
Correlation FTD LTD CPD PF FF NF DF CF HPF RBF CPF LRF
FTD
LTD -0.046
CPD 0.313 0.015
PF 0.197 0.314 -0.466
FF 0.358 -0.090 -0.032 0.083
NF -0.101 -0.021 -0.360 -0.003 0.145
DF 0.045 0.229 -0.230 -0.104 -0.020 0.098
CF 0.319 -0.017 -0.162 0.397 0.049 0.497 0.400
HPF -0.246 0.008 -0.343 0.257 0.267 0.544 -0.290 0.071
RBF 0.463 0.632 0.306 0.407 0.096 -0.437 0.263 0.085 -.317
CPF -0.058 -0.263 -0.042 -0.346 0.343 0.201 0.225 -0.136 .026 -0.144
LRF 0.303 0.494 0.193 0.269 0.015 -0.532 0.160 -0.103 -.460 0.764 -.399
AF -0.012 -0.052 -0.220 0.096 0.105 0.690 -0.392 0.097 .668 -0.434 -.015 -0.597
Table 6.5 - The correlation matrix for thirteen habitat disturbance variables for category G3 villages.
Variables Component
1 2 3 4 5
FTD 0.364 0.302 0.415 0.613 -0.313
LTD 0.432 0.479 -0.266 -0.195 0.368
CPD 0.412 -0.442 0.050 0.492 -0.251
PF 0.133 0.813 -0.272 0.044 0.029
FF -0.110 0.220 0.455 0.574 0.464
NF -0.741 0.408 0.241 -0.097 -0.082
DF 0.251 0.198 0.638 -0.620 0.064
CF -0.103 0.645 0.431 -0.147 -0.533
HPF -0.690 0.386 -0.251 0.187 0.290
RBF 0.825 0.391 0.071 0.147 0.191
CPF -0.289 -0.309 0.645 0.011 0.478
LRF 0.878 0.204 -0.130 0.027 0.122
AF -0.760 0.296 -0.212 0.301 -0.061
Eigenvalues 3.731 2.374 1.723 1.551 1.175 %Variance 28.700 18.262 13.250 11.928 9.040 Cumulative explanation 28.700
46.952
60.212
72.140
81.180
Table 6.6 - The standardized loadings on the five principal components used to derive the forest disturbance for category G3 villages.
FTD=Felled trees/ Density/25m2, LTD=Lopped tree/ Density/25m
2, CPD=Cut poles/
Density/25m2, PF=Pellets/Frequency, FF=Fire/Frequency, NF=Noise/Frequency,
DF=Dung/Frequency, CF=Cattle/Frequency, HPF=Human presence/Frequency, RBF=Remnants of branches and
leaves/Frequency, CPF=Clear Patch /Frequency, LRF=Lopped regeneration/Frequency, AF=Agriculture/Frequency

68
For G4 category of villages, component matrix of disturbance parameter variables
shows that four principal components with eigenvalues ≥1 can be retained as a
measure of habitat disturbance. A scree plot of eigenvalues plotted against principal
component number suggested that four principal components be retained and these
principal components accounted for 76.9% of variation (table. 6.8). Subsequent
components each explained less than ten percent of overall disturbance variability.
The first principal component (PC1) explained 4.572 of the total eigenvalue loading
and accounted for 35.1% of the variability for the 13 habitat disturbance variables.
The loadings on the first principal component divided the variables into two major
groups. The first group had twelve negative habitat disturbance variables (which had
positive loadings) with higher loading on disturbance variables such as: lopped
regeneration frequency (0.875), lopped tree density (863) and remnants of branches
(0.816), capturing negative effects of activities of Van gujjar populations in the region.
The second group contained only one negative loading of habitat disturbance
variables. Principal component coefficients were of relatively similar magnitude for all
disturbance variables, but felled tree density (0.103) appeared to be less influential.
Principal component shows that two disturbance parameters loaded heavily on
component second and variables included noise frequency (0.850) and human
presence frequency (0.826). This component accounted for 2.650 of the total
eigenvalue loading and 20.4% of the total variance in the disturbance parameters.
Principal component coefficients were of relatively similar magnitude for all
disturbance variables, but dung presence frequency (0.109) appeared to be less
influential. On component third, only one disturbance variable, clear patch frequency
(0.765), was loaded heavily; this component accounted for 1.443 of the total
eigenvalue loading and 11.1% of the variation. On component fourth, there is no
such higher loading of disturbance parameter variables as in first three components.
These principal components accounted for 1.330 of eigenvalue loading with 11.2% of
the variance in the data.

69
Corellation FTD LTD CPD PF FF NF DF CF HPF RBF CPF LRF
LTD .029
CPD .253 .524
PF .147 .560 .437
FF -.009 .377 .348 .211
NF .110 .095 .042 -.032 .338
DF -.170 .618 .367 .284 .381 .253
CF -.221 .446 .198 .047 .738 .651 .380
HPF
-.017
.033
.160
-.229
.227
.818
.364
.589
RBF
.271
.811
.675
.420
.275
.002
.397
.339
.029
CPF .078 -.047 .409 .192 -.027 -.045 .376 -.259 .000 -.149
LRF
.110
.760
.671
.499
.446
-.060
.607
.265
-.103
.790
.258
AF .070 -.246 -.204 -.107 -.210 .279 -.410 .098 .106 -.336 .027 -.447
Table 6.7 - The correlation matrix for thirteen habitat disturbance variables for category G4 villages.
Variables Component
1 2 3 4
FTD 0.103 -0.185 0.503 0.651
LTD 0.863 -0.118 -0.195 0.131
CPD 0.741 -0.206 0.377 0.079
PF 0.553 -0.366 0.138 0.165
FF 0.622 0.355 0.186 -0.027
NF 0.252 0.850 0.277 0.124
DF 0.733 0.109 0.067 -0.530
CF 0.562 0.732 -0.252 0.073
HPF 0.240 0.826 0.257 -0.092
RBF 0.816 -0.224 -0.154 0.364
CPF 0.160 -0.244 0.765 -0.522
LRF 0.875 -0.332 -0.025 -0.055
AF -0.380 0.358 0.373 0.370
Eigenvalues 4.57 2.65 1.44 1.33
%Variance 35.17 20.387 11.097 10.233
Cumulative explanation
35.17
55.55
66.65
76.88
Table 6.8 - The standardized loadings on the five principal components used to derive the forest disturbance for category G4 villages.
FTD=Felled trees/ Density/25m2, LTD=Lopped tree/ Density/25m
2, CPD=Cut poles/ Density/25m
2,
PF=Pellets/Frequency, FF=Fire/Frequency, NF=Noise/Frequency, DF=Dung/Frequency, CF=Cattle/Frequency, HPF=Human presence/Frequency, RBF=Remnants of branches and
leaves/Frequency, CPF=Clear Patch /Frequency, LRF=Lopped regeneration/Frequency, AF=Agriculture/Frequency

70
6.3 Discussion
Although Van Gujjars have been prohibited from using unauthorised areas of
Corbett Tiger Reserve but their livelihood still depends significantly on resources from
the CTR and adjoining forest area. The present study showed that Van Gujjars
depend on Corbett Tiger Reserve for basic amenities required for living and they
practically derive all such products from the adjoining forests. Though not statistically
significant, the correlation matrix among various disturbance variables suggested
substantial inter-relationships among many of the measured variables. Because
some of the habitat disturbance variables were highly correlated with each other, we
wanted to describe the impact of those together, and so principal component analysis
was used to derive a habitat disturbance that could be used to determine Van Gujjar
populations’ impact on habitat disturbance parameters.
For the lowest population category of settlements, component matrix of
disturbance parameter variables showed that five principal components with
eigenvalues ≥1 can be retained as a measure of habitat disturbance and these
principal components accounted for 73.4% variation. For G2 category of settlements,
five principal components with eigenvalues ≥1 can be retained as a measure of
habitat disturbance and these principal components accounted for 72.0% variation.
For G3 category of settlement’s component matrix of disturbance parameter
variables shows that five principal components with eigenvalues ≥1 can be retained
as a measure of habitat disturbance and these principal components accounted for
81.2% of variation. Subsequent components each explained shows less than ten
percent of overall disturbance variability. For G4 category, component matrix of
disturbance parameter variables shows that four principal components with
eigenvalues ≥1 can be retained as a measure of habitat disturbance and these
principal components accounted for 76.9% variation. All of these principal
components had some negative habitat disturbance variables (which had positive
loadings) capturing negative effects of activities of Van Gujjar populations in the
region.
The ecological survey provided evidence about the nature and extent of
damage to the park and adjoining forest area that surrounded these settlements. Van
Gujjar activities in the park probably have had serious affects on survival,
regeneration and recruitment of many plant species. In the present study, forest
disturbance effects were related to settlement population, with smaller settlements

71
having relatively restricted forest disturbance areas compared to larger settlements.
Karanth (2002) stated that for larger settlements, the chosen transect length of 1 km
was unable to capture all disturbance around the settlements and forest use impacts
continued beyond this distance. The same is the case with the current study, the
chosen transect length of 0.5km was unable to capture all disturbance around these
settlements because impacts continued beyond this distance. Disturbance of Van
Gujjars on migration routes cannot be summed up in the study. The present study
used information gathered from social and ecological surveys to gain a more
comprehensive understanding about effects that Van Gujjars’ livelihood activities
exerts on park area and adjoining forests.
However, it is clear that removal of these settlements is likely to improve the
quality of forest cover, as most of the disturbance parameters estimated to be
significant were temporary in nature and closely linked with the nomadic and
pastoralist nature of Van Gujjars. Disturbance and population density though were
closely linked with each other, although their significance is lower when other
livelihood options are available to the Van Gujjars.

72
Plate 3: Disturbance around settlements by Van Gujjars.
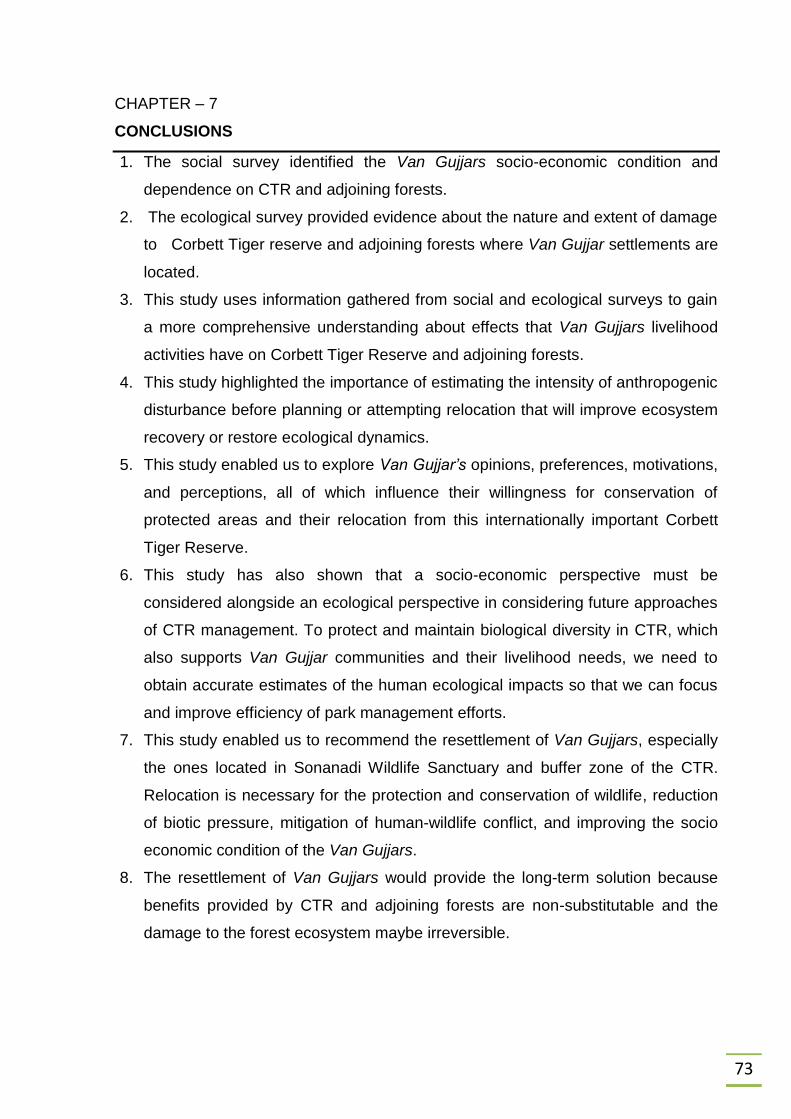
73
CHAPTER – 7
CONCLUSIONS
1. The social survey identified the Van Gujjars socio-economic condition and
dependence on CTR and adjoining forests.
2. The ecological survey provided evidence about the nature and extent of damage
to Corbett Tiger reserve and adjoining forests where Van Gujjar settlements are
located.
3. This study uses information gathered from social and ecological surveys to gain
a more comprehensive understanding about effects that Van Gujjars livelihood
activities have on Corbett Tiger Reserve and adjoining forests.
4. This study highlighted the importance of estimating the intensity of anthropogenic
disturbance before planning or attempting relocation that will improve ecosystem
recovery or restore ecological dynamics.
5. This study enabled us to explore Van Gujjar’s opinions, preferences, motivations,
and perceptions, all of which influence their willingness for conservation of
protected areas and their relocation from this internationally important Corbett
Tiger Reserve.
6. This study has also shown that a socio-economic perspective must be
considered alongside an ecological perspective in considering future approaches
of CTR management. To protect and maintain biological diversity in CTR, which
also supports Van Gujjar communities and their livelihood needs, we need to
obtain accurate estimates of the human ecological impacts so that we can focus
and improve efficiency of park management efforts.
7. This study enabled us to recommend the resettlement of Van Gujjars, especially
the ones located in Sonanadi Wildlife Sanctuary and buffer zone of the CTR.
Relocation is necessary for the protection and conservation of wildlife, reduction
of biotic pressure, mitigation of human-wildlife conflict, and improving the socio
economic condition of the Van Gujjars.
8. The resettlement of Van Gujjars would provide the long-term solution because
benefits provided by CTR and adjoining forests are non-substitutable and the
damage to the forest ecosystem maybe irreversible.

74
CHAPTER – 8
REFERENCES
1. Allendorf, T.D. 1999. Local residents’ perception of protected areas in Nepal:
Beyond conflicts and economics, Ph.D. thesis. The University of Minnesota, St.
Paul.
2. Atkinsonj. 1979. A handbook for interviews. HMSO. London.
3. Badola, R. 1998. Attitudes of local people towards conservation and alternatives
to forest resources: a case study from the lower Himalayas. Biodiversity and
Conservation 7:1245–1259.
4. Badola, R. 1994. People and protected areas in India: challenges of joint forest
management and eco-development. Unasylva 50:199.
5. Barve, N., Kiran, M.C., Vanaraj, G., Aravind, N.A., Rao, D., Uma Shaanker, R.,
Ganeshaiah, K.N. & Poulsen, J.G. 2005. Measuring and Mapping Threats to a
Wildlife Sanctuary in Southern India. Conservation Biology 19:1, 122–130.
6. Borrini-Feyerabend, G. (Ed.). 1997. Beyond fences: Seeking Social Sustainability
in Conservation. IUCN, Gland, Switzerland. 11-17.
7. Brandon, K., 1998. Comparing Cases: a review of findings. In: Brandon, K.,
Redford, K.H., Sanderson, S.E. (Eds.), Parks in Peril: People, Politics, and
Protected Areas. Island Press, Washington, DC. 375–414.
8. Brashares, J.S., Arcese, P., Sam, M.K., 2001. Human demography and reserve
size predict wildlife extinction in West Africa. Proc. R. Soc. London. 268: 2473–
2478.
9. Brockington, D., Igoe, J., 2006. Eviction for conservation. A global overview.
Conservation and Society 4: 424–470.
10. Bromley, T. 2000. Woodlots, wood fuel and Wildlife: Lessons from Queen
Elizabeth National Park Uganda. International Institute of Economics and
Development, Gatekeeper series. No.SA90.
11. Census of India, 2001. Census of India, Office of the Registrar General and
Census Commissioner, New Delhi, India.
12. Champion, H. G. and S. K. Seth. 1968. A revised Survey of the Forest Types of
India; Manager of Publication, Government of India, New Delhi.

75
13. Chape, S., Blyth, S., Fish, L., Fox, P., Spalding, M., 2003. United Nations List of
Protected Areas, IUCN, Gland, Switzerland and Cambridge, UK and
UNEPWCMC, Cambridge, UK.
14. Chhatre, A., Saberwal, V., 2005. Political incentives for biodiversity conservation.
Conservation Biology 19 (2): 310–317.
15. Colchester, M. 2004. Conservation policy and indigenous peoples. Cultural
Survival Quarterly 2(1): 17-22.
16. Dabadghao, P.M. and Shankarnaray an, K. A. 1973. The grass covers of India.
Indian Council of Agriculture Research, New Delhi, India.
17. Daniel, J.C. 1996. Conservation of Asian elephant. Gajah. 16: 9-16.
18. DFID, 1999. Sustainable livelihood guidance sheets. Department for International
Development, United Kingdom.
19. Edgaonkar A. 1995. Utilization of major fodder tree species with respect to the
food habits of domestic buffaloes in Rajaji National Park. M.Sc.
Thesis/Dissertation, Saurashtra University, Rajkot
20. Elephant Population on the rise’, The Tribune, 21/11/11.
21. Ellis, F. 2000. Rural livelihoods and diversity in developing countries. Oxford
University Inc., New York.
22. FAO (2005a) FAOSTAT data. Food and Agricultural Orginisation, Rome.
23. Ferraro, P.J., 2002. The local costs of establishing protected areas in low-income
nations: Ranomafana National Park, Madagascar. Ecol. Economics 43: 261–275.
24. Fowler, F. J., 1988. Survey Research Methods. 157. Newbury Park, California,
Sage Publications. Applied Social Research Methods Series.
25. Gadgil, M., Guha, R., 1992. This Fissured Land. An Ecological History of India.
Oxford University Press, New Delhi.
26. Ganeshaiah, K.N., and R. Uma Shaanker.1998. BRT Sanctuary: A
Biogeographic Bridge of the Deccan Plateau., in K.N. Ganeshaiah and R. Uma
Shaanker (eds), Biligiri Rangaswamy Temple Wildlife Sanctuary: Natural History,
Biodiversity and Conservation. 46.
27. Gibson, C.C., M.A. McKean and E. Ostrom. 2000. People and forests:
Communities, institutions, and governance. Cambridge: MIT Press.
28. GOI (Government of India). 2007. On-line metadata file posted for 2001 Census
of India: Definition of Household. Office of the Registrar General and Census

76
Commissioner of India, Census of India.
http://www.censusindia.gov.in/Metadata/Metada.htm#2d.
29. Gooch, Pernille. 1998. At the tail of the Buffalo, Dept of Sociology ,Lund
University.
30. Gross. R.D., Psychology: the science of mind and behaviour. Hodder and
Stoughton. London.
31. Harihar A., 2011. Understanding the response of wild ungulate prey to livestock-
mediated competition in western Terai Arc Landscape, India: implications for
developing management strategies to restore corridors. A report to Rufford Small
Grant (for Nature Conservation).
32. Heltberg, R., Arndt, T.C. and Sekhar, N.U., 2000. Fuelwood consumption and
forest degradation: A household model for domestic energy substitution in rural
India. Land Economics. 76 (2): 213-232.
33. http://www.moef.nic.in/downloads/public-information/tiger-ppt.pdf
34. Jhala, Y.V., Gopal, R., Qureshi, Q., 2008. Status of tigers, co-predators and prey
in India. National Tiger Conservation Authority, Ministry of Environment and
Forests, Government of India and the Wildlife Institute of India, Dehra Dun.
35. Jhala, Y.V., Qureshi, Q., Gopal, R. & Sinha, P.R., (eds.) (2011). Status of the
tigers, co-predators, and prey in India, 2010. National Tiger Conservation
Authority, Government of India, New Delhi, and Wildlife Institute of India,
Dehradun. TR 2011/003 pp-302.
36. Jim, C.Y., and Xi, S.S.W., 2002. Stifled Stakeholders and Subdued Participation:
Interpreting local responses toward Shimentai Nature Reserve in South China.
Environmental Management 30(3): 327-341
37. Johnsingh, A. J. T., Goyal, S. P., Rawat, G. S., Rajvanshi, A., Krausman, P.,
Williams, C. A., Hazra, A., Singh, A. K., Kakati, K., and Dasgupta, J., (2002). The
relationship among large herbivores, habitat, and humans in Rajaji-Corbett
National Parks, Uttaranchal. Wildlife Institute of India, Dehradun, India.
38. Johnsingh, A.J.T., Negi, A.S., 2003. Status of tiger and leopard in Rajaji-Corbett
Conservation Unit, northern India. Biological Conservation 111: 385–393.
39. Johnsingh, AJ.T., Prasad, S.N. and Goyal, S.P., 1990. Conservation status of the
Chilla-Motichur corridor for elephant movemenr in Rajaji-Corbett National Parks
area, India. Bialogical Consentation 5l: t25-I38.

77
40. Joshi R, Pande G.S., 2007. Rehabilitation of Gujjar community from the Rajaji
National Park: An approach for biological diversity conservation through
restoration ecology. Nat. Acad. Sci. Lett.;30(9&10):263-267
41. Joshua J, Johnsingh A.J.T., 1995. Ranging patterns of elephants in Rajaji
National Park: Implications for reserve design. In: Daniel JC, Datye HS, Eds. A
week with elephants. Bombay Natural History Society and Oxford University
Press: 256-260.
42. Karanth, K.K., 2003. Forest use and human-wildlife conflicts in Bhadra Wildlife
Sanctuary, India. Tropical Resources Bulletin 22: 44–54.
43. Karanth, K.K., Curran, L.M., Reuning-Scherer, J.D., 2006. Village size and forest
disturbance in Bhadra Wildlife Sanctuary, Western Ghats, India. Biological
Conservation 128: 147–157.
44. Karanth, K.U., 2002. Nagarahole: limits and opportunities in wildlife conservation.
In: Terborgh, J., van Schaik, C., Davenport, L., Rao, M. (Eds.), Making Parks
Work: Strategies for Preserving Tropical Nature. Island Press, Washington, DC.
189–202.
45. Karanth, K.U., Karanth, K.K., 2007. Free to move: conservation and resettlement
in the Western Ghats of Karnataka, India, In: Redford, K.H., Fearn, E., (Eds.),
Protected Areas and Human Displacement: A Conservation Perspective,
Working Paper 29. Wildlife Conservation Society, New York. 48–59.
46. Khan J.A., (1996) Factors governing the habitat occupancy of ungulates in Gir
Lion sanctuary, Gujarat, India. Int J Ecol Environ Sci. 22:73–83
47. Kibreab, G., 1996. People on the edge in the horn: Displacement, land-use and
the environment. London: James Currey Publications.
48. Kothari, A., Singh, N., and Suri, S., 1995. “Conservation in India: A New
Direction”, Economic & Political Weekly, Vol. 30.
49. Kothari, A., Suri, S., Singh, N., 1995. People and protected areas: rethinking
conservation in India. Ecologist. 25:188–194.
50. Kumar, A., & Ram, J., 2005. Anthropogenic disturbances and plant biodiversity in
forests of Uttaranchal, central Himalaya. Biodiversity & Conservation. 14: 309–
331.
51. Kumar, R., and Shahabuddin, G., 2006. Consequences of rural biomass
extraction for bird communities in an Indian tropical dry forest and the role of
vegetation structure. Conservation & Society. 4(4): 562-591.

78
52. Kumar. D., 1995. Management plan of the Rajaji National Park (U.P.) Dehradun,
1995-96 to 2005-06.
53. Kutty, R., Kothari, A., 2001. Protected Areas in India: A Profile. Kalpavriksh
Publications, New Delhi.
54. Lindberg. 1929. Social research. Dryden. New York.
55. Lloydp, Mayesamansteada.R., and Wagnerh.L., 1984. Introduction to psychology
- an integrated approach. Fontana. London.
56. Madhusudan, M. D., 2004. Recovery of wild herbivores following livestock
decline in a tropical Indian wildlife reserve. Journal of Applied Ecology. Vol. 41:
858-869.
57. Maikhuri, et.al., 2000. Analysis and resolution of protected area-people conflicts
in Nanda Devi Biosphere Reserve, India. Environmental Conservation 27(1): 43-
53.
58. Mathai M., 1999. Habitat occupancy across anthropogenic disturbances by
sympatric ungulate species in Panna Tiger Reserve. Dissertation, Saurashtra
University, Rajkot
59. Mehta J., Heinen J., 2001. Does community-based conservation shape
favourable attitudes among locals? An empirical study from Nepal.
Environmental Management. 28:165–177
60. Mehta, J.N., & Kellert, S.R., 1998. Local attitudes toward community-based
conservation policy and programmes in Nepal: a case study of the Makalu-Barun
Conservation Area. Environmental Conservation. 25(5): 320–333.
61. Mikkelsen, B., 1995. Methods for development work and research. A guide for
practitioners. SAGE publications, London, UK. 296.
62. Mishra, C., 2000. Socioeconomic transition and wildlife conservation in the Indian
Trans- Himalaya. Journal Bombay Natural History Society 97(1):25-32.
63. Mordi, R., 1987. Public attitudes towards wildlife in Botswana. Ph.D. Thesis, Yale
University, New Haven, Connecticut, USA.
64. Moyini, Y., Muramira, E., Emerton, L., and Schechambo, F., 2001. The costs of
environmental degradation and loss to Uganda’s economy with particular
reference to poverty eradication. IUCN Project No. UNTS/RAF/008/GEF.P.O. No.
93330.

79
65. Muller, D., Zeller, M., 2002. Land use dynamics in the central highlands of
Vietnam: a spatial model combining village survey data with satellite imagery
interpretation. Agricultural Economics 27: 333–354.
66. Negi, A S., 2003: “Relocation of People in Corbett Tiger Reserve, Uttaranchal:
History and Process” in CSD, op cit.
67. Neumann, R.P., 1998. Conservation versus custom: state seizure of natural
resource control. In: Neumann, R.P. (Ed.), Imposing Wilderness: Struggles over
Livelihood and Nature Preservation in Africa. University of California Press,
Berkeley.: 97–121.
68. Newell, R., 1993. Questionnaires. In: N. Gilbert (Ed.) Researching Social Life.
SAGE Publications Ltd. London, UK: 95-115.
69. Nusrat, R., 2011. Marginalization of Himalayan Pastoralists and exclusion from
their traditional habitat: A case study of Van Gujjars in India. International Journal
of Human Development and Sustainabilit. 4(1):93-102
70. Oates, J.F., 2002. West Africa tropical forests on the brink. In: Terborgh, J., van
Schiak, C., Davenport, L., Rao, M., (Eds.), Making Parks Work: Strategies for
Preserving Tropical Nature. Island Press, Washington, DC. 57–75.
71. Pandey, S.K., & Shukla, R.P., 2003. Plant diversity in managed Sal (Shorea
robusta Gaertn.) forests of Gorakhpur, India: species composition, regeneration
and conservation. Biodiversity & Conservation. 12: 2295–2319.
72. Peh, K.S.H., Jong, J.de, Sodhi, N.S., Lim, S.L.H., Yap, C.A.M., 2005. Lowland
rain forest avifauna and human disturbance: persistence of primary forest birds in
selectively logged forests and mixed-rural habitats of southern peninsular
Malaysia. Biology Conservation 123: 489–505.
73. Peres, C.A., 2002. Expanding conservation area networks in the last wilderness
frontiers: the case of Brazilian Amazonia. In: Terborgh, J., van Schiak, C.,
Davenport, L., Rao, M. (Eds.),
74. Pokhriyal, H. C., 1994. Human Environment and Socio-economic Development in
the Himalayas: An Institutional Study of Natural and Human Resource
Management in the Garhwal and Kumaon Himalayas. B.R. Publishing, New
Delhi.
75. Purna, B.C., Serugo, J., Kidiya, P., and Muhweezi, A., 2004. Improvement of
Protected area integrity. In: Purna, B.C., G.E, Edmund, Barrow and A. Muhweezi
(Eds) Securing Protected Area Integrity and Rural People’s livelihoods: Lessons

80
from twelve years of the Kibale and Semliki Conservation and Development
Project. IUCN, Nairobi.33-42.
76. Ramachandra, T.V., 2008. Geographical Information System approach for
regional biogas potential assessment. Research Journal of Environmental
Science, 2(3):170-184
77. Rangaran M., Shahabuddin G., 2006. Displacement and relocation from
protected areas: towards a biological and historical synthesis. Conservation and
Society, 4(3): 359-378.
78. Rawat J.K., 1993. Economic considerations in tree lopping. Indian Forester, 119:
703-707.
79. Rodgers, A., Hartley, D., Bashir, S., 2003. Community approaches to
conservation: some comparisons from Africa and India. In: Saberwal, V.,
Rangarajan, M., (Eds.), Battles Over Nature: Science and Politics of
Conservation. Permanent Black, New Delhi. 324–382.
80. Rodrigues, A.S.L., Andelman, S.J., Bakarr, M.I., Boitani, L., Brooks, T.M.,
Cowling, R.M., Fishpool, L.D.C., da Fonseca, G.A.B., Gaston, K.J., Hoffmann,
M., Long, J.S., Marquet, P.A., Pilgrim, J.D., Pressey, R.L., Schipper, J., Sechrest,
W., Stuart, S.N., Underhill, L.G., Waller, R.W., Watts, M.E.J., Yan, X., 2004.
Effectiveness of the global protected area network in maintaining species
diversity. Nature 428:640–643.
81. Salant, P., and Dillman, D.A., 1994. How to conduct your own survey. John Wiley
& Sons, New York.
82. Sankar. K., 1994. The ecology of three large sympatric herbivores (chital, sambar
and nilgai) with special reference for reserve management in Sariska Tiger
Reserve, Rajasthan. Thesis, University of Rajasthan, Jaipur.
83. Shylajan, C.S., 2001. Economic Valuation of Non-wood Forest Products: A Study
of Community Dependence on Protected Area of Forest. Thesis. Ph.D. University
of Madras.
84. Singh A.P., Sharma R.C., 2001. Conflicts between linear developments and
Asian elephants in sub-Himalayan zone of Uttaranchal. In: Irwin C.L., Garrett P.,
and McDermott K.P., (Eds.): Ecology and transportation. Raleigh, NC: Centre for
Transportation and the Environment, North Carolina State University. 423-432.
85. Singh, K. K., & Prakash, A., 2002. The Flora of Rajaji National Park, Uttaranchal.
(1st edition) Bishen Singh Mahendra Pal Singh Publishers, Dehradun. 275.

81
86. Tyagi, R. K., and Shankar, V., 1995. Forage supply demand analysis for
Saurashtra and Kachchh. Forage Research, 16(2): 45-57.
87. Uma Shaanker, R., Ganeshaiah, K.N., Nageswara Rao, M., & Aravind, N.A.,
2004. Ecological Consequences of Forest Use: From Genes to Ecosystem - A
Case Study in the Biligiri Rangaswamy Temple Wildlife Sanctuary, South India.
Conservation & Society.2: 2, 347-363.
88. UN (2009) Human development report. Overcoming barriers: human mobility and
development. United Nations Development Programme. Palgrave Macmillan,
New York
89. Valdiya K.S., 1980. Stratigraphic scheme of the sedimentary units of the Kumaon
lesser Himalaya. In: Valdiya, K.S., and Bhatiya, S.B., (eds.) Stratigraphy and
correlations of the lesser Himalayan formations, Hindustan Publication
Corporation, Delhi, India.7-48.
90. WWF. 2011. Fuelwood dependence from Ramnagar Forest Division,
Uttarakhand, India.
91. Williams A.C., 2002. Elephants (Elephas maximus), their habitats in Rajaji–
Corbett National Parks, Northwest India. Ph.D. Thesis. Saurashtra University,
Rajkot
92. Young. P.V., 1949. Scientific socio economic surveys and research. Prentice-
Hall. New York.

82
The Corbett Foundation is registered under the Delhi Public Trust Act, No.
183/94-95 dated 20.07.1994 w.e.f. 18.05.1994 and the Foreign Contribution
(Regulation) Act, 1976 under registration No. 231650853. Donations to The
Corbett Foundation are tax-exempt u/s 80-G of the Income Tax Act, 1961.