Embed Size (px)
Citation preview

STUDY EPRS | European Parliamentary Research Service
Lead author: Monika Kiss Members' Research Service
PE 646.181 – March 2020 EN
Demographic outlook for the
European Union 2020


EPRS | European Parliamentary Research Service
Demographic outlook for the European
Union 2020
Demography matters. The economy and the labour market, but also social protection, intergenerational fairness and healthcare, the environment, food and nutrition are all driven by demography. The population of EU countries has grown substantially – by around a quarter since 1960 – and currently it stands at almost 450 million. The numbers are now beginning to stagnate however and are expected to decline from around the middle of the century. With the world population having risen still more substantially and growth continuing, the EU represents a shrinking proportion of the global population. The EU population is also ageing dramatically, as life expectancy increases and fertility rates fall below past levels. This has serious implications across a range of areas including the economy, healthcare and pensions. Free movement within the EU and migration from third countries also play an important role in shaping demography in individual Member States and regions. The 'in-focus' section of this year's edition of the demographic outlook examines food and nutrition-related demographic challenges. It shows that, even if improving food quality and healthier eating habits lead to higher life expectancy, the EU still has to tackle the harmful consequences and prevent the causes of diet-related chronic conditions, such as obesity, diabetes and cardiovascular disease.

This is the third edition of the EPRS demographic outlook study, the previous two editions of which weredrafted by David Eatock. Its purpose is to highlight and explain major demographic trends as they affect the European Union.
AUTHORS
The paper was compiled under the lead authorship of Monika Kiss. The other contributors were Tarja Laaninen, Vasileios Margaras, Ionel Zamfir, Marie-Laure Augère-Granier and Nikolai Atanassov.
The statistics were prepared with the assistance of Giulio Sabbati, the graphics were produced by Samy Chahri and Nadejda Kresnichka-Nikolchova.
To contact the authors, please email: [email protected].
LINGUISTIC VERSIONS
Original: EN
Translations: DE, FR
Manuscript completed in February 2020.
DISCLAIMER AND COPYRIGHT
This document is prepared for, and addressed to, the Members and staff of the European Parliament as background material to assist them in their parliamentary work. The content of the document is the sole responsibility of its author(s) and any opinions expressed herein should not be taken to represent an official position of the Parliament.
Reproduction and translation for non-commercial purposes are authorised, provided the source is acknowledged and the European Parliament is given prior notice and sent a copy.
Brussels © European Union, 2020.
Photo credits: © European Union, 2020 – EPRS.
PE 646.181 ISBN: 978-92-846-6344-6 DOI:10.2861/999213 CAT: QA-03-20-110-EN-N
[email protected] http://www.eprs.ep.parl.union.eu (intranet) http://www.europarl.europa.eu/thinktank (internet) http://epthinktank.eu (blog)

Demographic outlook for the European Union 2020
I
Executive summary
Demography matters. The economy, the labour market, social protection, but also intergenerational fairness, healthcare, pensions, the environment, and food and nutrition are all driven by demography. The population of the European Union (EU) has grown substantially – by around a quarter since 1960 – and it currently stands at just under 450 million people.1 The world population has grown faster, however, more than doubling over the same timeframe and reaching nearly 7.7 billion today. While the EU population is now growing only slowly and is even expected to decline in the longer term, the world population is continuing to grow strongly. Indeed, the world population is projected to pass 10 billion in 2057; and although this growth is expected to slow down, the figure is nonetheless forecast to be almost 11 billion people in 2100. The EU therefore represents an ever-shrinking proportion of the world population, at just 6.9 % today (down from 13.5 % in 1960), and this percentage is projected to fall further to just 4.1 % by the end of the century.
In common with many other developed (and developing) parts of the world, the EU population is also ageing, as life expectancy increases and fertility rates drop compared to the past. At EU level, both men and women saw their average life expectancy increase by over 10 years between the early 1960s and today, although women continue to live longer than men on average. Meanwhile, the number of children being born has fallen from an EU-28 average of around 2.5 children per woman in 1960, to a little under 1.59 today. This is far below the 2.1 births per woman considered necessary in developed countries to maintain the population in the long term, in the absence of migration. Indeed, migration has become increasingly important for expanding or maintaining the EU population. In 2017, the natural population change (live births minus deaths) was slightly negative, and net inward migration was therefore key to the population growth seen in those years.
Combined, these trends are resulting in a dramatically ageing EU-28, whose working population (aged 15 to 64) shrank for the first time in 2010 and is expected to decline every year to 2060. By contrast, the proportion of people aged 80 or over in the EU-28 population is expected to more than double by 2050, reaching 11.4 %. In 2006, there were four people of working age (15 to 64) for each person aged 65 or over; by 2050, the ratio is projected to be just two people. This outlook is essentially set in the shorter term, at least, meaning the focus is on smoothing the transition to an older population and adapting to its needs.
While the starting point, speed and scale of ageing varies between the Member States depending on differing fertility rates, life expectancy and migration levels, all will see further ageing in the coming years. Free movement, as well as external migration, will also play a role in the population size and age profile both of countries and of regions within them. As a general trend, the population is growing in certain urban areas, while rural areas are suffering from depopulation, owing to a stagnating economy, lack of professional opportunities and increasing poverty.
The 'in-focus' section of this edition looks at the relationship between food and nutrition and demographic changes. Improved food quality and healthier eating habits have led to higher life expectancy in EU societies. However, this tendency is tempered by rising levels of obesity and diabetes, leading to an increasing number of deaths from heart disease and strokes. Certain age groups, such as children and the elderly are particularly vulnerable to the effects of malnutrition because of their specific nutritional needs. Moreover, a number of regions and social groups are facing food-related problems, such as hunger, scarce resources and climate change. Food
1 The United Kingdom left the EU with effect from 1 February 2020. The data used in this edition however cover the
EU-28, including for forecasts and projections. Whereas EU-27 data are available in most cases, this approach avoids inconsistencies between datasets across the paper, given that when drafting began the UK's date of withdrawal was not certain.

EPRS | European Parliamentary Research Service
II
insecurity2 also plays a significant role as one of the triggers for migration towards the EU, and is affecting the EU in other ways as well.
2 According to the FAO, food insecurity exists when people do not have adequate physical, social or economic access
to food. For more details, see points 2.2.4. and 3.6.

Demographic outlook for the European Union 2020
III
Table of contents
1. Introduction _________________________________________________________________ 2
1.1. Historical population growth in EU-28 now levelling off ____________________________ 2
1.2. Dramatic and continuing ageing of the EU population _____________________________ 3
1.3. Focus on adapting to ageing demographics _____________________________________ 3
2. Current situation ______________________________________________________________ 3
2.1. An ageing EU population ____________________________________________________ 3
2.2. Drivers of population change _________________________________________________ 8
2.2.1. Increasing life expectancy _________________________________________________ 8
2.2.2. Low fertility rates _______________________________________________________ 11
2.2.3. Demographic implications at the EU regional level: focus on rural areas ___________ 13
2.2.4. International migration and the link to food insecurity _________________________ 18
2.3. EU in the world ___________________________________________________________ 19
2.3.1. Demographic evolution in the G20 _________________________________________ 19
2.3.2. Developing countries: between ageing populations and youth bulges ____________ 20
2.3.3. Feeding a growing world population _______________________________________ 21
3. Focus on food and nutrition ___________________________________________________ 25
3.1. People and diets __________________________________________________________ 25
3.1.1. Current diets of Europeans ________________________________________________ 26
3.1.2. Dietary guidelines _______________________________________________________ 29
3.2. What can the EU do? _______________________________________________________ 32
3.3. New trends in consumer demands on food _____________________________________ 34
3.4. Looking for new solutions ___________________________________________________ 36
3.4.1. Labelling for healthier food _______________________________________________ 36
3.4.2. Climate labelling ________________________________________________________ 37
3.4.3. Plant-based (protein) alternatives __________________________________________ 38
3.4.5 Insect food _____________________________________________________________ 38
3.5. Transforming food systems __________________________________________________ 39

EPRS | European Parliamentary Research Service
IV
3.6. Food security in the EU _____________________________________________________ 42
3.6.1. Food security as a specific objective of the common agricultural policy ____________ 43
3.6.2. Overview of the EU farming sector as primary provider of food __________________ 44
3.6.3. EU agricultural production figures and self sufficiency__________________________ 46
3.6.4. Access to healthy and nutritious food in the EU _______________________________ 47
3.6.5. Progress towards the goal of Zero hunger ___________________________________ 50
4. Prospects___________________________________________________________________ 52
5. Main references _____________________________________________________________ 53

Demographic outlook for the European Union 2020
V
Table of figures
Figure 1 – EU-28 and world population (1960=100) ___________________________________ 2
Figure 2 – EU-28 population pyramids for 2001 and 2018 (number of women and men by age group) ______________________________________________________________ 4
Figure 3 – Population pyramids for the EU-28 (number of women and men by age group), 2020 and 2050 ________________________________________________________________ 5
Figure 4 – Median age of the population (years) in each of the EU-28 Member States in 1970 and 2018, and projected median age in 2070 ___________________________________ 7
Figure 5 – Average female and male life expectancy at birth ___________________________ 9
Figure 6 – Average female and male life expectancy at 60 years of age __________________ 10
Figure 7 – Total fertility rate (births per woman) ____________________________________ 11
Map 1 – Total fertility rates in the EU-28, 2017 _____________________________________ 13
Map 2 – Crude rate of total population change in NUTS 3 regions, 2018 ________________ 14
Figure 8 – Farmers' income compared with average gross wages and salaries in the total economy ___________________________________________________________ 16
Figure 9 – EU and other G20 countries, demographic forecasts for the 21st century ________ 20
Map 3 – Undernourishment prevalence in countries with an average fertility rate per woman of three children or more ________________________________________________ 21
Figure 10 – Daily calorie supply per capita __________________________________________ 27
Figure 11 – Most important factors when buying food ________________________________ 29
Figure 12 – The Nutri-Score logo __________________________________________________ 36
Figure 13 – Global dairy consumption trends ________________________________________ 39
Figure 14 – Global meat consumption trends ________________________________________ 39
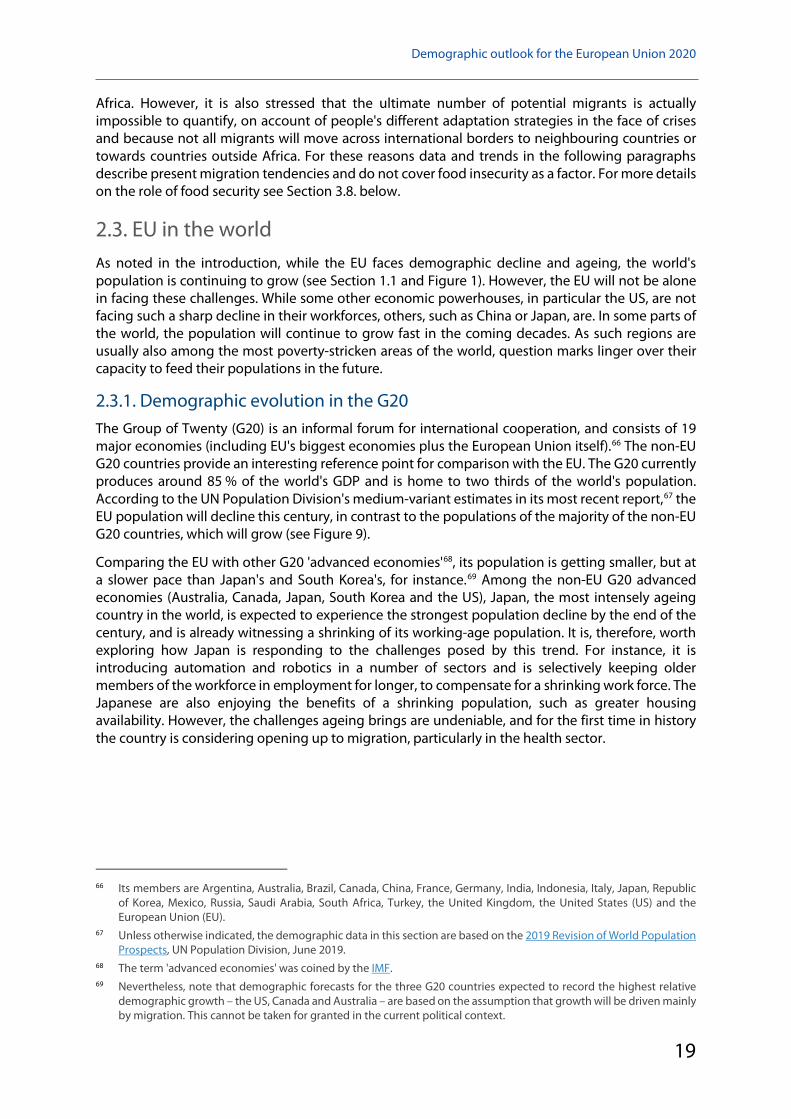
Figure 15 – Farm managers, by age group and gender, EU-28, 2016 _____________________ 45
Figure 16 – EU self-sufficiency rate for different categories of agricultural products in 2017-201846
Figure 17 – EU-28 exports and imports of agricultural products by category, 2018 __________ 47
Figure 18 – Population unable to afford a meal with meat, fish, chicken or a vegetarian equivalent every second day, 2018 ________________________________________________ 49
Table of tables
Table 1 – EU agri-food trade with non-EU countries _________________________________ 47
Table 2 – Progress achieved towards SDG 2 in the EU is measured against a set of indicators 50


Demographic outlook for the European Union 2020
1
Glossary and list of main acronyms used
A demographic dividend appears when, after a period of demographic growth, the fertility rate substantially declines and, as a result, there are fewer children than working-age adults. This, coupled with a small number of older people, leads to a low dependency rate, which can boost economic development.
G20, or the Group of Twenty, brings together the world's major advanced and emerging economies, comprising the EU and 19 participating countries.
Life expectancy: the mean additional number of years that a person of a certain age can expect to live if subjected throughout the rest of their life to the current mortality conditions (age-specific probabilities of dying, i.e. the death rates observed for the current period) (Eurostat).
Migrants: people arriving or returning from abroad to take up residence in a country for a certain period, having previously been resident elsewhere. The term EU-citizen is based on the notion of citizenship that is defined as the particular legal bond between an individual and her or his state, acquired by birth or naturalisation, either by declaration, choice, marriage or other means under national legislation. Third country national is defined as any person who is not a citizen of the EU, including stateless persons – see Article 2.1(i) of Council Regulation (EC) No 862/2007 (Eurostat).
Natural replacement rate: the average number of live births needed per woman to keep the population size constant in the long run, in the absence of migration. According to Eurostat, a total fertility rate (see definition below) of around 2.1 live births per woman is considered to be the replacement level in developed countries.
The total age-dependency ratio relates the number of individuals who are likely to be 'dependent' on the support of others – the young and the elderly – to the number of working age individuals who are capable of providing this support. It is the sum of the two ratios, the young-age-dependency ratio and the old-age-dependency ratio, which compare i) the number of those aged 0-14 to the number of those aged 15-64, and ii) the number of those aged 65 and over to the number of those aged 15-64 (Eurostat).
Total fertility rate: the mean number of children who would be born to a woman during her lifetime, if she were to spend her childbearing years conforming to the age-specific fertility rates that have been measured in a given year (Eurostat).
UNDESA: United Nations Department of Economic and Social Affairs.
Youth bulge: phenomenon whereby a large share of the population is comprised of children and young adults (World Bank).

EPRS | European Parliamentary Research Service
2
1. Introduction The demographic structure of the European Union (EU) and its development are of huge consequence for the EU and its citizens in a host of areas, including: the economy, the labour market, social protection, but also intergenerational fairness, healthcare, pensions, the environment, food and nutrition, and even election results and the EU's very place in the world. So, demography and how it is changing matter – indeed, 'demography is destiny'.3
1.1. Historical population growth in EU-28 now levelling off The population of the EU-28 grew from 406.7 million in 1960 to 513.5 million in 2019. Yet, there were only 5.075 million live births in 2018 compared to the 7.60 million in 1961. With 4.14 million deaths in 1961, the natural population increase at that time was nearly 3.5 million people. In contrast, the 5.26 million deaths in 2018 meant there was a slight decline in the natural population for that year.4 Eurostat's baseline projections suggest that the EU-28 population is set to grow more slowly than in the past, peaking at 524.7 million in 2040, before declining to 504.5 million by 2080.5
Figure 1 – EU-28 and world population (1960=100)
Data source: UNDESA data. Note: Projections (2016 onwards, shown with dotted line) use the UN 'medium fertility variant' scenario.6
At the same time, according to the UN, the world population has risen much more dramatically, from a little over 3 billion in 1960, to nearly 7.7 billion in 2019, and is projected to rise further still, passing 10 billion in 2057 to almost 11 billion in 2100. Therefore, even when it was growing strongly, the EU-28 population comprised an ever-shrinking proportion of the world population, down from 13.5 %
3 The quote is often attributed to the French philosopher A. Comte (1798-1857), although some suggest it was coined
much more recently. 4 Figures from Eurostat [demo_gind]. Natural population change is the difference between the number of live births
and deaths during a given time period (usually one year), which can be either positive or negative. 5 Figures from Eurostat [proj_18np]. 6 The medium fertility variant scenario assumes that fertility in each country will converge towards replacement level
(Population Analysis for Policies and Programmes). The results presented above for future years are based on the medium fertility variant projections of the UN World Population Prospects: 2019 Revision, according to which global fertility is projected to fall from just over 2.5 births per woman in 2010-2015, to around 2.2 in 2045-2050 and 2.0 in 2095-2100 (for further information, see World Population Prospects: The 2019 Revision, UN Population Division.

Demographic outlook for the European Union 2020
3
in 1960 to 6.7 % in 2019 – and it is projected to be smaller still at just 5.1 % in 2057 and 4.5 % in 21007 (see Section 2.3 for more on the EU in the world).
1.2. Dramatic and continuing ageing of the EU population Within the EU population, the age profile has undergone massive change and is expected to evolve still further. In short, Europe is ageing dramatically, driven by significant increases in life expectancy and lower birth rates:
the median age in the EU-28 has risen from 38.3 years in 2001 to 43.1 in 2018:8 a 4.8-year increase in just 17 years;
in 2004, there were, for the first time ever, as many elderly people (aged 65+) as children (aged 0 to 14) in the EU-28;9
the EU-28 working population (defined as those aged between 15 and 64) shrank for the first time in 2010 and is expected to decline every year until 2060.10
1.3. Focus on adapting to ageing demographics Policies to alter future demographics are limited and take time to produce an impact. Examples include policies seeking to encourage people to have, or have more, children through better support for families, or encouraging young people from third countries with sought-after skills to migrate to the EU. The demographic outlook is essentially set, at least in the short to medium term; therefore, over the coming period the focus will be on smoothing the transition to an older EU and adapting to its needs.
2. Current situation
2.1. An ageing EU population Figure 2 below shows the population pyramid for 2001 and 2018, giving the population distribution of women and men across the various age groups. Charts of this kind get their name from the classic shape they often take, with longer bars at the bottom (representing large numbers of people in the younger age groups), and shorter bars at the top (representing the older age groups, containing fewer people). However, in 2001 the shape of the EU population was far from the classic pyramid. In 2018, it was further away still, with the top parts of the pyramid being broader, due in part to people living longer on average than previously11 (see Section 2.2.1 on 'Increasing life expectancy'). The lower parts of the pyramid are also narrower due to people having fewer children than in the past, including total fertility rates falling below the natural replacement rate. However, the similar size of the bottom two age bands show this has stabilised in recent years (see Section 2.2.2 on 'Low fertility rates').
The impact of higher past fertility rates is also seen clearly in the chart, in the bulge caused by the so-called 'baby-boomer' generation and the following generation, often called 'generation X'. The baby-boomer cohort stems from high fertility rates in a number of EU countries in the years
7 Resulting from the comparison of UNDESA data for the world and Eurostat data for EU-28. 8 Source: Eurostat [demo_pjanind]. 9 Eurostat, Being young in Europe today – demographic trends, December 2017. 10 According to Demography Report 2015, p. 43, Directorate-General for Employment, Social Affairs and Inclusion (DG
EMPL), European Commission. 11 Note: the very top bar on the pyramid also represents the only open-ended age group, covering all those aged 85 and
over, whereas all the other bars represent age groups covering fixed five-year spans.

EPRS | European Parliamentary Research Service
4
following World War II. 'Generation X' (those born between 1965 and 1980) are mostly the children of the baby-boomers. Subsequent declines in fertility rates meant fewer children joining the bottom of the pyramid after the baby-boomer and 'generation X' cohorts. Those two cohorts therefore formed a population bulge that moved up the pyramid as they aged. As these outsized cohorts are reaching, or will soon reach, retirement age, they are expanding the numbers in the older age groups, skewing the age structure of the EU population towards an older Europe.12
Another notable feature of the older age groups is the prevalence of women in them, reflecting their greater longevity (on average) than men. Although this gender disparity in life expectancy has narrowed somewhat, it is currently expected to continue, with the EU-28 average life expectancy at birth in 2017 estimated at 83.5 years for women, but only 78.3 for men.13
Figure 2 – EU-28 population pyramids for 2001 and 2018 (number of women and men by age group)
Data source: Eurostat.
Projections of the age structure in the EU for 2020 and 2050 (see Figure 3 below) suggest that the shape will change further as the baby-boomer and 'generation X' bulge leaves the picture. Together with longer lifespans enlarging the proportion of the population in the older age group, a more rectangular shape associated with a stagnating or slow growing population will takes hold. The
12 Whilst there is no agreed definition of 'baby-boomer', it typically refers to those born in the final years of the Second
World War, up until around the mid-1960s, a period that saw high birth rates in many EU and other western countries. More information: The greying of the baby boomers, Eurostat, 2011. 'Generation X' is not a scientific term, although it is increasingly used in statistics for those born between 1965 and 1980, the generation situated between the baby-boomers and the millennials (the latter also referred to as 'generation Y').
13 Eurostat life expectancy by age and sex.

Demographic outlook for the European Union 2020
5
open-ended nature of the oldest age group of 85 years and over (rather than the fixed five year spans of all the others) accounts for the fact this age group is the most numerous.
Figure 3 – Population pyramids for the EU-28 (number of women and men by age group), 2020 and 2050
Data source: Eurostat.
An important measure of the age structure of a population is the total age-dependency ratio (see Glossary). In 2001, the total dependency ratio for the EU-28 was 48.9 %, meaning there were around two people of working age (15-64) for every younger or older person likely to be dependent on them (i.e. aged 0-14 or 65 and over). Breaking this down, the old-age dependency ratio (those 65 and over compared to those 15-64) was 23.5 %, so there were more than four people aged 15-64 for each person aged 65 or over. The young-age dependency ratio (those aged 0-14 compared to those 15-64) was 25.2 %, meaning there were four people of working age for each person aged 0-14.14
In 2018, the total dependency ratio for the EU-28 had increased to 54.6 %. Breaking this down, the old-age dependency ratio was now 30.5 %, meaning around seven working age (15-64) people for every two people aged 65 or over. The young-age dependency ratio was 24.1 %, meaning more than four people of working age for each person aged 0-14.15 Not only was there a growing proportion of people likely to be dependent on the working age population overall, but this was therefore skewed towards those aged 65 plus, rather than towards children aged 0-14, who would at least in the future form part of the working age population potentially supporting others.
Projections suggest that the worsening of the total age-dependency ratio will accelerate 14 Eurostat [demo_pjanind]. 15 Eurostat [demo_pjanind].

EPRS | European Parliamentary Research Service
6
dramatically, with the ratio reaching 62.4 % as soon as 2030. It will continue to increase rapidly, reaching 75.2 % in 2050 before increasing more slowly, nudging 80 % (projection 79.8 %) in 2080. At these levels, there would only be around five people of working age (15-64) for every four people older or younger than this age band. This shift has serious implications across a range of areas, including the economy, the labour market, healthcare and pensions.
Once again, the main driver for changes in the total age-dependency ratio is the old-age dependency ratio, which is projected to reach 38.7 % in 2030 and 49.9 % in 2050.16 This means that by 2050, there will then be just two people of working age (15-64) for every person aged 65 or over, a dramatic shift from the situation in 2001, when there were over four working-age people for every person aged 65 or over. In contrast, the young-age dependency ratio is projected to increase relatively slowly, to 23.7 % in 2030, 25.3 % in 2050 and 25.7 % in 2080.17
These EU-28 level figures convey a clear message of population ageing, on aggregate; without exception, this also holds true for each of the 28 Member States, with differences existing in terms of degree and timing.
16 Eurostat projection. 17 Eurostat [proj_18ndbims].

Demographic outlook for the European Union 2020
7
Figure 4 – Median age of the population (years) in each of the EU-28 Member States in 1970 and 2018, and projected median age in 2070
Data source: Eurostat [demo_pjanind]. Notes: 1) East and West Germany presented identical data in 1970; and 2) data for 1970 is not available for Cyprus, Malta, Croatia and Slovenia.
Figure 4 above shows the median age of the population in each of the EU-28 Member States in 1970 (where data is available) and in 2018, and the baseline projections for the median age in 2070. This shows the rather different starting points in 1970, ranging from Ireland with a median age of just 27.4 years, to the comparatively old – 35.5 years – median age in Sweden. By 2018, the median age of the population had increased in all Member States. Ireland's population remains the youngest in the EU-28, at 37.3 years, despite having aged substantially. However, Italy and Germany now have the highest median age at respectively 46.3 and 46 years, having both seen a substantial increase in the median age of their populations (13.6 and 12 years respectively) since 1970. In contrast, Sweden, having seen an increase in the median age of just 5.1 years, now has, together with Poland, the eighth-youngest median age in the EU-28, at 40.6 years. These variations in ageing between Member States will continue in the future. Eurostat projects that Italy will be the first to reach a

EPRS | European Parliamentary Research Service
8
median age of 50, in 2028,18 followed by Portugal in 2032 and Greece in 2036. Indeed, in 2050 Portugal is projected to have the oldest median age in the EU-28 at 52.6 years, with Italy just behind at 52.2; in 2070, the two countries with the highest median ages will be Portugal and Croatia (both with 53.6). These past and (projected) future differences are the product of varying starting points and evolving fertility rate, life expectancy and migration trends in the Member States (see Section 2.2 below).
2.2. Drivers of population change Population change is driven by changes in how long people live (life expectancy), birth-rates (fertility rates) and the movement of people within and between regions and countries (free movement and migration). These factors are briefly discussed below, along with the regional dimensions of population change.
2.2.1. Increasing life expectancy In recent decades, life expectancy has increased continuously in most developed countries, including in the EU, for a number of reasons.19 Whether this trend will continue concerns not only individual citizens, but also their governments, given the impacts across a range of public policy areas.
Eurostat data for the EU-28 is currently available from 2002 to 201720 for the commonly used 'life expectancy at birth' indicator. Figures show an initial slowing of the growth rate,21 followed by a slight fall in life expectancy in 2015. While this decline is small – less than the change from 2013 to 2014 for the EU-28 – it has stoked debate about slowing gains in life expectancy and their future direction and rate and the possible causes for these changing trends. However, the 2016 data once again showed growing life expectancy, reaching a level more than making up for the previous year's fall. Some are suggesting the decline seen in the 2015 data may have been partly driven by a virulent flu season, among a number of other factors.22 The debate continues, informed by ongoing research and new data. The latest figures from 2017 (no data from 2018 is available for the time being) once again show a fall in life expectancy, albeit only small (from 81.0 years to 80.9 years – EU-28 average.
18 Eurostat regional yearbook 2019 edition, Eurostat [proj_18ndbims] and Eurostat statistics from 2018. More discussion
on Member States' histories of ageing and future developments using various metrics (and noting the need to treat projections with caution) is available here: The greying of the baby boomers, G. Lanzieri, Eurostat, 2011.
19 These gains in life expectancy can be attributed to a number of factors, including improved education, socio-economic conditions and lifestyle, as well as progress in healthcare. OECD/European Union, Health at a Glance: Europe, 2018.
20 Eurostat life expectancy by age and sex. 21 This is a trend seen to varying degrees in most EU countries as well as in other developed countries such as Australia,
Canada and the US. See, for instance, Changing trends in mortality: an international comparison: 2000 to 2016, Office for National Statistics, UK, 2018.
22 See, for instance, V. Raleigh, Is the problem of excessive winter deaths unique to the UK?, The King's Fund, 2018, and OECD/European Commission, Health at a Glance: Europe 2018, p. 82.
Life expectancy
Life expectancy at birth is the average number of years a new-born is expected to live, under the assumption that prevailing patterns of mortality stay the same throughout her or his life.
Any other age can be used to calculate life expectancy from that point on, using current conditions. That age plus the remaining life expectancy then equals the total expected life span.
See Figures 5 and 6 below for the change in female and male life expectancy from 1960 onwards.

Demographic outlook for the European Union 2020
9
The EU-27 average remained flat at 81.0 years). In the meantime, it has yet to be determined whether life expectancy will revert to former trends of regularly increasing (indefinitely, or at least to a certain age, at present only reached by few people) or whether slower and more patchy increases, or even regular reversals, can be expected in future.
Figure 5 – Average female and male life expectancy at birth
Data source: UNDESA (from 2015 onwards: the 'medium fertility variant' scenario).
Taking a look further back, with data from UNDESA's World Population Prospects 2019,23 life expectancy has risen rather dramatically (see Figure 5 above). On average for the EU-28, women's life expectancy at birth increased from 72.4 years (1960-1965 period) to 82.6 years (2015-2020 period) – an increase of 10.2 years. The equivalent figures for men are 67.0 years and 77.1 years – an increase of 10.1 years.
As briefly mentioned in Section 2.1 above, women have a greater life expectancy than men. This gap is a worldwide phenomenon,24 indicating that gender specific characteristics, biological as well as behavioural, social and life circumstances, have an influence. Life expectancy also varies significantly between EU Member States today. Women born in the 1960-1965 period started out with approximately 72 years of life expectancy in all EU Member States. However, for the 2015-2020 period there is up to 7.6 years difference between Member States' life expectancy averages for
23 World Population Prospects: The 2019 Revision is the 26th round of official United Nations population estimates and
projections prepared by the Population Division of the Department of Economic and Social Affairs of the United Nations Secretariat.
24 R. Ostan et al.,'Gender, aging and longevity in humans: an update of an intriguing/neglected scenario paving the way to a gender-specific medicine', Clinical Science, Vol. 130(19), 2016, pp. 1711-1725.

EPRS | European Parliamentary Research Service
10
women. Figure 5 shows a similar if even more distinct scenario for men, with a difference of 11.7 years for the 2015-2020 period.
There is also a growing focus on life expectancy for later age brackets. A reason for this is the increase25 in the proportion and absolute number of older people in the population and the impact of this increase on society and economies. People aged 60 or over made up 26 % of the population of the EU-28 on 1 January 2018.26
Figure 6 – Average female and male life expectancy at 60 years of age
Data source: UNDESA (from 2015 onwards: the 'medium fertility variant' scenario).
As seen in Figure 6 above, life expectancy at 60 years of age has also risen rather dramatically. On average for the EU-28, women's life expectancy at the age of 60 increased from 18.8 years (1960-1965 period) to 24.9 years (2015-2020 period) – an increase of 6.1 years. The equivalent figures for men are 15.9 years and 21.1 years – an increase of 5.2 years.
Once again, life expectancy also varies significantly between EU Member States today, with the 2015-2020 period showing a 6.1-year difference between the highest and lowest Member State averages of life expectancy for women. It is a similar scenario for men, with a difference of seven years for the same 2015-2020 period.
25 United Nations, 2017 World Population Ageing Report. 26 Eurostat, Population structure and ageing, [demo_pjanind].

Demographic outlook for the European Union 2020
11
It is possible to tie variations in life expectancy to education,27 income and occupation.28 For example, life expectancy by educational attainment is one of the European Core Health Indicators (ECHI). Causes for change in life expectancy at an older age can be considered broadly in six categories29 of diseases. Among other factors, developments in medicine and healthcare have an impact on the prevalence of these health issues.
2.2.2. Low fertility rates Fertility rates have been declining in the EU-28 since the mid-1960s (see Figure 7 below). The EU-28 as a whole had a total fertility rate above 2.1 live births per woman until the mid-1970s, falling below this level in 1975. Rates continued to decline further, bottoming out at 1.44 in 1998 and 1999, until the mid-2000s saw a modest recovery, reaching 1.5 in 2005 before climbing to 1.61 in 2010. Total fertility rates for the EU-28 have since fallen back slightly, dipping to 1.55 in 2013; they currently stand at 1.59 (in 2017). Total fertility rates in the world as a whole have also been on a generally declining trend, albeit from a much higher starting point of around five live births per woman in 1960. They fell below four in 1977 and to under three by 1993, and currently (2017) stand at 2.43.30 See Section 2.3 below for more on the EU situation in comparison with other parts of the world.
Figure 7 – Total fertility rate (births per woman)
Data source: Word Bank World Development Indicators data.31
27 W.C. Sanderson, S. Scherbov,'A New Perspective on Patterns of Aging in Europe by Education and Gender', Journal of
Population Ageing, Vol. 9, Issue 3, September 2016, pp. 207-225. 28 Evidence shows that higher socio-economic groups live longer than lower socio-economic groups, OECD Business
and Finance Outlook 2016, 2016, p. 177. 29 Communicable diseases and nutritional deficiencies, cancers, cardiovascular diseases and diabetes mellitus, chronic
respiratory diseases, other non-communicable diseases, and injuries. C.D. Mather et al., 'Causes of international increases in older age life expectancy', The Lancet, Vol. 385, 2015, pp. 540-548.
30 World Bank data. 31 1) United Nations Population Division: World Population Prospects Report; 2) census reports and other statistical
publications from national statistical offices; 3) Eurostat: demographic statistics; 4) United Nations Statistical Division: Population and Vital Statistics Report (various years); 5) US Census Bureau: international database; and 6) Secretariat of the Pacific Community: Statistics and Demography Programme.

EPRS | European Parliamentary Research Service
12
In terms of number of live births, during the 1961–2017 period, the highest annual total in the EU-28 was recorded in 1964, at 7.8 million. By contrast, in 2018 there were 5.0 million live births – less than two thirds of the 1964 peak – despite the EU-28 population having grown in the meantime by around one quarter, to 513.5 million people.32 With 5.3 million deaths in the EU-28 in 2018, this meant a reduction in the natural population of the EU-28 that year for only the second time since the data series began in 1961.33 However, whilst the gap between births and deaths has been substantial in the past, reaching nearly 3.6 million in 1964, it has long been narrowing, halving to under 1.8 million in 1976 and nearly halving again by 1990 at just over 900 000. It then narrowed considerably by the mid-1990s to under 200 000. Since then, the gap has remained narrow, barring a period in the mid to late-2000s, where increasing live births, peaking in 2008, widened the gap somewhat before falling back. The last three years of data (2016 to 2018) saw a tiny increase in the natural population in 2016 and reductions the following two years.
With falling numbers of children being born in the EU-28, the relative importance of migration in increasing or maintaining the size of the EU-28 population has grown (see Section 2.2.4 –International migration). Migration can also have second order effects, at least for a period, by raising the total fertility rate, where, for a variety of reasons, migrants may display fertility rates higher than the native population.34 Numbers of new-borns may also be boosted by the migrant population being disproportionately of child-bearing age compared to the native population as a whole, thereby adding to the stock of potential parents.
Lower fertility rates compared with past periods not only mean slower (or no) population growth, but they also affect the age profile of the EU-28 (see Section 2.1 above). Together with increasing life expectancy (see Section 2.2.1 above) these past falls in fertility rates are driving the dramatic ageing of the EU population.
Looking below the EU-28 level (see Map 1 below), considerable national variations in fertility rates are apparent. France (at 1.90) had the highest total fertility rate in 2017, while Malta had the lowest (at 1.26). Other Member States with relatively high fertility rates included Sweden (1.78), Ireland (1.77), Denmark (1.75) and the United Kingdom (1.74). At the other end of the scale, with Malta, were Spain (1.31), Italy and Cyprus (both 1.32), Greece (1.35), Portugal (1.38), and Luxembourg (1.39). Fertility rates are falling worldwide and are associated with growing economic and social development. However, research suggests that once a certain level of development is achieved, fertility rates may stabilise or recover to some extent. Some argue that the idea that fertility rates, having declined alongside economic and social development, remain broadly stable or recover only slightly, does not take proper account of evolutionary biology, with heritable fertility. This posits that fertility tends to increase, as children from larger families represent a larger share of the population and partly share their parents' trait of having more offspring.35 In terms of policy actions, a common characteristic among countries with stable or even increasing birth rates is a high degree of female labour force participation.36
32 All figures from Eurostat [demo_gind], population total (estimated, provisional) as at 1 January 2019. 33 The other year seeing a reduction in the natural population was 2015. Revised 2016 data now shows that year as
having had a very small increase in the natural population of under 20 000 people. 34 For instance, page 45 of the Eurostat regional yearbook 2017 edition notes that '...several of these regions [those with
the highest fertility rates] were characterised by relatively high levels of migrants'. 35 J. Collins and L. Page, 'The heritability of fertility makes world population stabilization unlikely in the foreseeable
future', Evolution and Human Behaviour, Vol. 40, Issue 1, 2019, pp. 105-111. 36 'Mission not Accomplished', Population Europe, 2011; 'Policies for families: is there a best practice?', Population
Europe, 2016.

Demographic outlook for the European Union 2020
13
Map 1 – Total fertility rates in the EU-28, 2017
Data source: Eurostat.
2.2.3. Demographic implications at the EU regional level: focus on rural areas Demographic trends affect EU regions in a variety of ways, and hence there is no 'one size fits all' description of demographic developments. Nevertheless, a few basic demographic generalisations can be made.
Population decline can be observed across parts of eastern/southern Europe – the Baltic states, Bulgaria, Romania, the eastern part of Germany, Portugal, Greece, Spain, Italy, Croatia and the central regions of France. However, recent immigration trends stemming from non-EU countries have altered the demographic balance in various EU regions. Map 2 below presents the crude rate of total population change in 2018. The blue-coloured areas show the EU NUTS level 3 regions37 where the population grew, whereas the red areas show those where populations declined.
37 NUTS is the Nomenclature of Territorial Units for Statistics, a geographical nomenclature subdividing the economic
territory of the EU into regions at three different levels (NUTS 1, 2 and 3 respectively, moving from larger to smaller territorial units).

EPRS | European Parliamentary Research Service
14
Map 2 – Crude rate of total population change in NUTS 3 regions, 2018
Source: Eurostat.
Important demographic contrasts can be observed between the core and periphery, at both EU and Member State level. In the EU, considerable population growth has been recorded in Ireland, the United Kingdom, Belgium, the Netherlands and in metropolitan centres such as Paris and London. Parts of Germany also seem to benefit from population growth, as do Austria, parts of Czechia, Finland, Sweden and Denmark.
Overall, trends show a population increase in certain urban areas (especially capital cities) and some coastal areas. Conversely, peripheral, rural, mountainous and sparsely populated areas are affected by depopulation, as are towns and cities in economically backward EU regions, as well as post-industrial urban and mountain areas.38 According to an ESPON policy brief, by 2050, the population of Europe's urban regions is projected to increase by 24.1 million people and these regions will be home to almost half of the EU's population.39 By contrast, the population of predominantly rural regions is projected to fall by 7.9 million. This trend is also having a negative impact on the number of farmers in these territories (e.g. ageing farming population, lack of young farmers). However, rural regions that are close to dynamic urban centres or to areas within commuting distance, or that enjoy good transport connections with them, can experience good population development.
People tend to move to wherever there are jobs, career opportunities and favourable economic prospects. In recent years, more than three quarters of the total population increase in the EU has resulted from net inward migration.40 According to Eurostat, in 2018, one in five first residence permits was issued in Poland (635 000, or 20 % of total permits issued in the EU), followed by
38 How can regional and cohesion policies tackle demographic challenges?, Directorate-General for Internal Policies,
European Parliament, 2013. 39 ESPON Policy Brief, Shrinking rural regions in Europe, October 2017. 40 Ibidem.

Demographic outlook for the European Union 2020
15
Germany (544 000, or 17 %), the United Kingdom (451 000, or 14 %), France (265 000, or 8 %), Spain (260 000, also 8 %), Italy (239 000, or 7 %) and Sweden (125 000, or 4 %). When compared with the population of each Member State, the highest rates of first resident permits issued in 2018 were recorded in Malta (35 permits issued per thousand population), Cyprus (24), Poland (17), Slovenia (14) and Luxembourg (13).41
Concerning internal EU migration, a 2018 European Court of Auditors report on the free movement of workers in the EU42 indicates that in 2015, within a total EU working-age population of 306 million, 3.7 % (around 11 million people) were living on a long-term basis in an EU Member State other than their country of citizenship. Germany was the top destination country followed by the UK, while Luxembourg, Cyprus and Ireland had the highest share of mobile workers within their working-age population.
Within the EU, a number of seasonal workers also find work in rural areas. In certain EU areas (situated along borders and being predominantly of a rural character) the old-age dependency ratio (see Glossary) was higher than 50.0 % on 1 January 2017. In other words, there were fewer than two people of working-age for every elderly person.43 If such trends continue to affect more EU regions, they too may see adverse impacts such as declining business activity and reduced economic growth, which will also have an impact on the agricultural sector. As the farming population ages, the younger population seems to be less attracted to the prospects of a career in farming (see also Section 3.6).
The many roles played by women in rural communities help to maintain vibrant rural areas and viable farm businesses. According to a European Parliament report, in 2014 women were responsible for about 35 % of total working time in agriculture, carrying out 53.8 % of part-time work and 30.8 % of full-time work, thereby making a significant contribution to agricultural production; whereas work carried out by spouses and other female family members on farms may constitute 'invisible work'.44 Yet despite their crucial contribution, rural women still face numerous challenges, such as difficulties accessing the labour market, a lack of adequate public services and a weak presence in decision-making forums. It is a challenge for many rural areas to hold on to young professional women.
Rural population trends can raise a number of issues. Some EU area experiencing depopulation encounter problems such as a stagnating economy, lack of professional opportunities and increasing poverty. In addition, some of these areas are faced with inadequate health coverage, as public health provision is tending to decline and private health service practitioners find operations in these areas unprofitable.45 Other less predictable factors, such as natural disasters and climate change, can also have a considerable impact on the population of EU regions.46
A lack of job opportunities and career prospects as well as underperforming local economies can also have a detrimental effect on personal development and well-being in the rural population. Nevertheless, farmers' income is still lagging behind salaries in most EU economies (see Figure 8 below).
41 Eurostat Press Release, First residence permits issued in the EU Member States remain above 3 million in 2018,
25 October 2019. 42 Free Movement of Workers – the fundamental freedom ensured but better targeting of EU funds would aid worker
mobility, Special Report No 06, European Court of Auditors, 2018. 43 Eurostat regional yearbook, 2018 edition, p. 36. 44 European Parliament Report, Women and their roles in rural areas, 2017. 45 V. Margaras, Sparsely populated and underpopulated areas, EPRS, European Parliament, 2016. 46 'Increasing risk over time of weather-related hazards to the European population: a data-driven prognostic study',
G. Forzieri, A. Cescatti, F. Batista e Silva, and L. Feyen, The Lancet, Vol. 1, No 5, pp. 200-208, August 2017.

EPRS | European Parliamentary Research Service
16
Figure 8 – Farmers' income compared with average gross wages and salaries in the total economy
Source: European Commission communication, The Future of Food and Farming, 2017.
In 2015, just over one quarter (25.5 %) of the rural population was at risk of poverty or social exclusion, while relatively lower shares were recorded for people living in cities (24.0 %). According to Eurostat figures from 2016, this trend has deepened further, and now a higher proportion of the EU-28 population living in rural areas (compared with urban areas) face the risk of poverty or social exclusion.47 The risk of poverty or social exclusion is highest in the rural areas of several eastern and southern EU Member States. In Romania (and Malta), people living in rural areas are at least twice as likely as those living in cities to face the risk of poverty or social exclusion, with somewhat less pronounced differences recorded in Croatia, Poland and Bulgaria. By contrast, the rural populations of Austria, the Netherlands, Belgium, Denmark, Germany and the United Kingdom are much less likely to be at risk of poverty or social exclusion than those living in urban areas (particularly those living in cities).
A number of issues can force rural inhabitants to leave their areas or discourage others from moving into such areas. These include: fewer local education or job opportunities or choices, difficulties in accessing public services or transport services, inadequate health coverage or a lack of cultural venues or leisure activities. These drawbacks affect the long-term prospects of certain regions, as economic and social development requires adequate infrastructure, including fast broadband
47 For more information see: Eurostat: Urban Europe – statistics on cities, towns and suburbs – poverty and social
exclusion in cities.
-10.000
0
10.000
20.000
30.000
40.000
50.000
60.000
70.000
80.000
LU DK DE NL IE BE SE UK AT FI FR IT ES SI CY MT EL PT CZ EE HU SK PL LT LV RO BG HR
EUR/ Full time worker
Average CAP support
Average farmer income (without CAP support)
Average gross wages and salaries in the totaleconomy (in current prices)
FARMERS' INCOME IS STILL LAGGING BEHIND SALARIES IN THE WHOLE ECONOMY
Source: DG AGRI based on DG AGRI and Eurostat data, 2011-2013 Average CAP support = operating subsidies per worker incl. support covering possible negative market incomeAverage farmer income (without CAP support) = entrepreneurial income per worker - operating subsidiesNota: CAP support does not include investment support; average farmer income without CAP support in LU and FI was negative over the period considered - the negative income compensated by CAP support is hatched on the graph

Demographic outlook for the European Union 2020
17
services and a modern transport network – things that are sometimes lacking in those areas. In particular, some rural areas experiencing depopulation can enter into a 'vicious circle of decline', as more people need to migrate in search of better job prospects and provision of public or private services. Areas suffering from depopulation also sometimes see a decrease in transport services and the closure of public services (e.g. schools).48 Certain trends in some rural areas can hamper the opportunities available to local populations. People living in rural areas are generally more inclined to leave education or training early. In 2015, the share of young people (aged 18 to 24) who were living in rural areas of the EU and were neither in employment nor in further education or training, was 3.7 percentage points higher than for their peers in cities.49
In addition, according to Eurostat, for all but three of the EU Member States, the lowest proportion of people making use of the internet on a daily basis was recorded in rural areas.50 Lack of sufficient broadband connectivity is another issue that affects rural areas. In terms of the digital divide, in 2018, there were 48 regions across the EU that reported fewer than four out of every five households (less than 80 %) with broadband access at home. These were principally located in eastern and southern parts of the EU, although there were also relatively low rates in two southern regions of Belgium, 10 regions of France (five rural regions of mainland France, the island of Corsica, four of the five outermost regions; no data available for Mayotte), Latvia (a single region at this level of detail), and single, sparsely populated regions in Lithuania and Sweden.51 The lack of broadband connectivity also affects rural and agricultural businesses.
Nevertheless, rural areas and the food sector still constitute an important element for the social fabric of the EU and its economy. According to the European Commission's Future of Food and Farming communication farmers make a key contribution to the spatial development of rural regions as 'they care for the natural resources of soil, water, air and biodiversity on 48 % of the EU's land (foresters a further 36 %) and provide essential carbon sinks and the supply of renewable resources for industry and energy'.52 The communication states that large numbers of jobs depend on farming, either within the sector itself (which provides regular work for 22 million people) or within the wider food sector (farming, food processing and related retail and services together provide around 44 million jobs).
The appeal of a particular region matters when it comes to keeping and attracting population. This relates not only to job prospects and growth, but also to wider quality-of-life factors. There are a number of advantages that can attract people to live in rural areas. These include lower housing and living costs, more available space, a less polluted environment and a less stressful lifestyle. For instance, according to Eurostat, when it comes to housing, the EU-28 housing cost overburden rate in 2015 was lowest in rural areas (9.1 %), with a slightly higher rate recorded for people living in towns and suburbs (10.6 %), and a peak among those living in cities (13.3 %).53 Furthermore, according to the to the Future of Food and Farming communication, new rural value chains such as clean energy, the emerging bio-economy, the circular economy and ecotourism can offer good growth and job potential for rural areas.54 Ageing population trends may also lead to new economic activities such as provision of specific health and long-term care services, homes fitted out specifically for the elderly, digitalised services, etc.55
48 For further information, see V. Margaras, Sparsely populated and under-populated areas, EPRS, 2016. 49 Eurostat, Statistics on rural areas in the EU, 2017. 50 Ibid. 51 Ibid. 52 European Commission, The Future of Food and Farming, 2017, p. 3. 53 Eurostat, Statistics on rural areas in the EU, 2017. 54 European Commission communication, The Future of Food and Farming, 2017, p.20. 55 D. Eatock, The silver economy: Opportunities from ageing, EPRS, European Parliament, 2015.

EPRS | European Parliamentary Research Service
18
2.2.4. International migration and the link to food insecurity The term food insecurity describes a lack of reliable access to sufficient, affordable and nutritious food. Data from some studies suggest that food insecurity has played a significant role as one of the triggers for migration, particularly in the case of Syria, where it is seen as having contributed in a major way to the eruption of violence and conflict.56 In fact, according to estimates,57 refugee outflows increase by 0.4 % for every additional year of conflict, and by 1.9 % for each percentage point increase in food insecurity.
However, it should also be noted that, at present, food security does not seem to be universally regarded as a main direct trigger, with theories regarding main root causes focusing rather on human rights violations and poverty and their consequences.58 Some have argued that there is no general discernible automatic relationship between hunger levels or food insecurity per se and international migration.59 In this context, it is stressed that while climate change may lead to drought and food insecurity, the scale of vulnerability is shaped significantly by communities' varying capability to adapt and respond to worsening circumstances.60 In addition, researchers also differentiate clearly between the desire to migrate and actually doing so. For example, in the case of sub-Saharan Africa, it has been pointed out that while food insecurity may lead to a greater probability of desire to migrate internationally, in practice, the actual decision to migrate is influenced decisively by other factors such as age, education, wealth and other microfactors.61
On the other hand, while it has been difficult to establish a direct and solid causal correlation between climate change and migration,62 and food insecurity as a climate change-induced migration trigger, some possible future scenarios have begun to emerge. Thus, in 2008 the International Organisation for Migration (IOM) developed a range of scenarios, ranging from a 'good' one – a moderate usual increase of migration – to an 'ugly' one – a massive fall of agricultural yields and the permanent or temporary displacement (within countries or across borders) of more than 200 million people worldwide by 2050.63 Researchers also generally agree on a figure of 200-250 million potential climate refugees.64 In Africa alone, a projection by the European Commission's Joint Research Centre (JRC) points out65 that by 2100 climate change and related drought and heat waves could affect some 149 million people in Sub-Saharan Africa, and continuous extreme weather conditions some 236 million people (8 and 13 % of the population) in parts of north and sub-Saharan
56 Food and Agriculture Organization of the United Nations (FAO), The Linkages between Migration, Agriculture, Food
Security and Rural Development, 2018, pp. 30-31. 57 World Food Programme (WFP), At the Root of Exodus: Food Security, Conflict and International Migration, 2017,
quoted in: FAO, The Linkages between Migration, Agriculture, Food Security and Rural Development, 2018, pp. 30-31. 58 United Nations Refugee Agency (UNHCR), Desperate Journeys – Refugees and migrants arriving in Europe and at
Europe's borders, January – December 2018, 2019. See also UNHCR, Global Trends – Forced displacement in 2018, 2019, p. 4.
59 D. Laborde, L. Bizikova, T. Lallemant and C. Smaller, What Is the Link Between Hunger and Migration?, International Institute for Sustainable Development (IISD) and International Food Policy Research Institute (IFPRI), 2017, p. 4.
60 C. McMichael, 'Climate Change and Migration: Food Insecurity as a Driver and Outcome of Climate Change-Related Migration', in: A. Malik, E. Grohmann and R. Akhtar, (eds.), Environmental deterioration and human health: natural and anthropogenic determinants, Springer, 2013, pp. 291-313.
61 A. Sadiddin, A. Cattaneo, M. Cirillo and M. Miller, 'Food insecurity as a determinant of international migration: evidence from Sub-Saharan Africa', Food Security, Volume 11(3), June 2019, pp. 515–530. See also FAO, The Linkages between Migration, Agriculture, Food Security and Rural Development, Rome, 2018, p. 12.
62 European Commission – Joint Research Centre, International migration drivers – a quantitative assessment of the structural factors shaping migration, 2018, p. 8.
63 International Organization for Migration (IOM), Migration and Climate Change, IOM migration research series No 31, 2008, p. 29.
64 F. Biermann and I. Boas, 'Climate Change and Human Migration: Towards a Global Governance System to Protect Climate Refugees', in: Global Environmental Politics, Volume 10(1), February 2010, pp. 68.
65 European Commission, Joint Research Centre, Many more to come? Migration from and within Africa, 2018, pp. 28-29.
Demographic outlook for the European Union 2020
19
Africa. However, it is also stressed that the ultimate number of potential migrants is actually impossible to quantify, on account of people's different adaptation strategies in the face of crises and because not all migrants will move across international borders to neighbouring countries or towards countries outside Africa. For thеsе reasons data and trends in the following paragraphs describe present migration tendencies and do not cover food insecurity as a factor. For more details on the role of food security see Section 3.8. below.
2.3. EU in the world As noted in the introduction, while the EU faces demographic decline and ageing, the world's population is continuing to grow (see Section 1.1 and Figure 1). However, the EU will not be alone in facing these challenges. While some other economic powerhouses, in particular the US, are not facing such a sharp decline in their workforces, others, such as China or Japan, are. In some parts of the world, the population will continue to grow fast in the coming decades. As such regions are usually also among the most poverty-stricken areas of the world, question marks linger over their capacity to feed their populations in the future.
2.3.1. Demographic evolution in the G20 The Group of Twenty (G20) is an informal forum for international cooperation, and consists of 19 major economies (including EU's biggest economies plus the European Union itself).66 The non-EU G20 countries provide an interesting reference point for comparison with the EU. The G20 currently produces around 85 % of the world's GDP and is home to two thirds of the world's population. According to the UN Population Division's medium-variant estimates in its most recent report,67 the EU population will decline this century, in contrast to the populations of the majority of the non-EU G20 countries, which will grow (see Figure 9).
Comparing the EU with other G20 'advanced economies'68, its population is getting smaller, but at a slower pace than Japan's and South Korea's, for instance.69 Among the non-EU G20 advanced economies (Australia, Canada, Japan, South Korea and the US), Japan, the most intensely ageing country in the world, is expected to experience the strongest population decline by the end of the century, and is already witnessing a shrinking of its working-age population. It is, therefore, worth exploring how Japan is responding to the challenges posed by this trend. For instance, it is introducing automation and robotics in a number of sectors and is selectively keeping older members of the workforce in employment for longer, to compensate for a shrinking work force. The Japanese are also enjoying the benefits of a shrinking population, such as greater housing availability. However, the challenges ageing brings are undeniable, and for the first time in history the country is considering opening up to migration, particularly in the health sector.
66 Its members are Argentina, Australia, Brazil, Canada, China, France, Germany, India, Indonesia, Italy, Japan, Republic
of Korea, Mexico, Russia, Saudi Arabia, South Africa, Turkey, the United Kingdom, the United States (US) and the European Union (EU).
67 Unless otherwise indicated, the demographic data in this section are based on the 2019 Revision of World Population Prospects, UN Population Division, June 2019.
68 The term 'advanced economies' was coined by the IMF. 69 Nevertheless, note that demographic forecasts for the three G20 countries expected to record the highest relative
demographic growth – the US, Canada and Australia – are based on the assumption that growth will be driven mainly by migration. This cannot be taken for granted in the current political context.

EPRS | European Parliamentary Research Service
20
Figure 9 – EU and other G20 countries, demographic forecasts for the 21st century
Data source: World Population Prospects: The 2019 Revision, UN Population Division.
Looking at the emerging non-EU G20 countries, they are generally expected to see their populations grow further, with the notable exceptions of China and possibly Brazil. China stands in strong contrast to India, the other demographic giant in the group, and demographic trends do not bode well for China's economy.70 China's working-age population is expected to start contracting by 2020. The recent abolition of the one-child policy has failed to increase births to the level expected by the government. The UN predicts that India's population will outgrow China's in 2024, and will continue to grow for some time, albeit slowly. With its young population having reached a peak, India is entering a period of 'demographic dividend', which is considered a key driver of economic transformation. A skilled workforce is believed to be an essential prerequisite, but in today's India many young people lack the skills and qualifications required on the labour market.71
2.3.2. Developing countries: between ageing populations and youth bulges
Many developing countries, particularly in Latin America and South-East Asia, are set to see their populations get older and more or less stagnate or shrink, and this could happen before these countries become wealthy.72 In the global picture, however, one entire continent – Africa – stands apart. Sub-Saharan Africa in particular will be the demographic engine of the world in the 21st century; north Africa is also expected to see its population continue growing. Africa's population is projected to almost double, from 1.3 billion in 2019 to 2.5 billion by 2050, and then to increase significantly again by 70 % by the end of the century. Roughly one in four working-age persons in the world could be African by 2050 – a chance for Africa to reap the demographic dividend for developing its economy. However, the right conditions have to be in place: a well-educated and highly-skilled young workforce, on the one hand, and a sufficient supply of jobs (which is becoming more difficult to accomplish in the current age of declining manufacturing and increasing
70 According to US economist N. Eberstadt, quoted in Why Demographic Trends Spell Trouble for China and Russia –
and Prosperity for US, November 2015. 71 Demographic Dividend or Demographic Burden? India's Education Challenge, Institut Montaigne blog,
September 2019. 72 See, for example, Emerging Asia risks growing old before becoming rich, Y. N. Lee, CNBC, April 2017.
-50%
-40%
-30%
-20%
-10%
0%
10%
20%
30%
40%Ja
pan
Russ
ian
Fede
ratio
n
EU27
Repu
blic
of K
orea
Chin
a
Uni
ted
King
dom
Braz
il
USA
Turk
ey
Cana
da
Arg
entin
a
Indi
a
Mex
ico
Indo
nesi
a
Aus
tral
ia
Sout
h A
fric
a
Saud
i Ara
bia
% change by 2030 compared to 2019 % change by 2050 compared to 2019% change by 2100 compared to 2019
EPRS | European Parliamentary Research Service

Demographic outlook for the European Union 2020
21
automation), on the other. Unemployed and marginalised young people may contribute to continued political instability, including terrorism.73
On the whole, not only the EU but the entire planet is ageing. Even in regions still experiencing high birth rates, the number of elderly persons is rising rapidly. The number of those aged 65 or more is projected to grow from an estimated 612 million in 2015 to over 1.5 billion in 2050. Most of this increase will take place in developing countries. As this trend combines with lower fertility, most world regions will see their share of old people relative to their working populations increase sharply, which will lead to higher old-age dependency ratios. The EU is therefore not alone in this situation. However, very young societies, such as those in sub-Saharan Africa, also record, and will continue to see, high young-age dependency ratios, as numerous children are to be supported by working adults.
2.3.3. Feeding a growing world population
Demographic growth has already raised concerns in the past around the availability of sufficient food and, more recently, sufficient water for a growing population. A popular 1968 book The Population Bomb74made dire predictions for the future of humanity: unless humanity quickly reduced its numbers, it would face 'mass starvation'. However, technological progress achieved in agriculture – 'the green revolution' – has served to prevent the book's dark forecasts from materialising.
Map 3 – Undernourishment prevalence in countries with an average fertility rate per woman of three children or more
Data source: World Population Prospects: The 2019 Revision, UN Population Division, FAO.
As some countries continue to grow demographically very quickly, there is an ongoing debate about their capacity to feed their people and about the capacity humanity as a whole to produce enough food for a growing world population. As can be seen on Map 3, the majority of countries
73 On the issue of youth bulges and conflict, see, for example, Population Action International, The Security
demographic – Population and conflict after the Cold War, and H. Urdal, 'The Demographics of Political Violence: Youth Bulges, Insecurity and Conflict', in: Too Poor for Peace? Global Poverty, Conflict and Security in the 21st Century, 2007.
74 P.R. Ehrlich, The Population Bomb, 1968. The book incited a worldwide fear of overpopulation and triggered a wave of repression around the world according to one article on the subject.

EPRS | European Parliamentary Research Service
22
with a fertility rate of three or more children per woman75 currently have an undernourishment prevalence of over 10 %. The global population growth rate will also play a crucial role in this equation. If the countries that have not yet begun or not yet completed their demographic transition follow a path similar to those that have already done so, the growth of the world population will be moderate, but still significant because of the demographic momentum. According to the UN 'medium variant' estimates there will be almost 11 billion people on the planet by 2050 (see Section 0). A study published by the European Commission's Joint Research Centre,76 which goes beyond the conventional population projections by taking a multi-dimensional approach and adding educational attainment, makes lower forecasts, predicting that, most probably, the world population will only reach 9.5 billion by the end of the century. On the other hand, if global fertility remains at the same level as today – a very unlikely scenario, but useful to see why inaction is not an option – according to the UN forecasts, in 2100 there will be 21 billion people on the planet – a number that would pose challenges of a completely different order with regard to food. There is therefore a significant degree of uncertainty regarding population growth that makes it hard to predict how food production will cope with demographics in the coming decades. Nevertheless, there is a high likelihood that a combination of factors such as climate change (a significant rise in temperatures), combined with an increase in production and consumption as a result of high population growth, against a background of low adaptive capacity (such as low use of new technologies in agriculture), will result in significant risks of land degradation, water scarcity in dry lands and food insecurity.77 A variety of scenarios are being explored with a view to ensuring there is enough food available for the human population in the coming decades.
1) Reducing fertility to sustainable levels by empowering women and boosting education levels in countries still experiencing very quick demographic growth, in order to avoid food crises and environmental damage, is the most straightforward solution.78 However, any public policy aiming to reduce fertility has to fully respect human rights and take into account the social, cultural and religious values that determine family size in many regions of the world. The serious human rights violations that have occurred in the past in countries such as China and India (forced abortions, forced sterilisations) through state-managed population control are today broadly rejected. There is sufficient evidence to suggest that, female education and empowerment normally lead to fertility being reduced to sustainable levels,79 while promoting women's rights and gender equality. Some very poor countries are however caught in a spiral of rapid population growth and shortage of public resources, sometimes combined with conflict, making them unable to provide enough schooling for a continuously growing child population. EU development policy provides substantial aid for education. Between mid-2016 and mid-2017, over 12 million children were enrolled in primary education, and 3.3 million in secondary education, thanks to EU aid.80
75 36 out of the 49 countries for which FAO provides data on undernourishment, and which have a fertility rate of at
least 3 children per woman (based on the 2019 Revision of World Population Prospects). 76 W. Lutz, A. Goujon, S. Kc., M. Stonawski and N. Stilianakis, Demographic and Human Capital Scenarios for the 21st
Century: 2018 assessment for 201 countries, 2018. 77 The Special Report on Climate Change and Land by the Intergovernmental Panel on Climate Change (IPCC) explores
a number of scenarios combining these factors. 78 According to some experts on the matter, 'The food gap is mostly driven by population growth .... If Sub-Saharan
Africa achieved replacement-level fertility rates along with all other regions by 2050, it would close the land gap by one quarter and the GHG [greenhouse gas] mitigation gap by 17 percent while reducing hunger'. See J. Ranganathan, R. Waite, T. Searchinger and C. Hanson, How to sustainable feed 10 billion people by 2050, in 21 charts, World Resource Institute, 2018.
79 See Sub-Saharan Africa: Demography is not destiny... if women are empowered, D. Rechard, in Global Trendometer: Essays on medium- and long-term global trends - Summer 2017, EPRS study, September 2017; and Demographic and Human Capital Scenarios for the 21st Century: 2018 assessment for 201 countries, EU Science Hub, 2018.
80 European Commission, 2018 Annual report on the implementation of the European Union's instruments for financing external actions in 2017.

Demographic outlook for the European Union 2020
23
2) Progress in agriculture in a broad sense (innovative technology, farm management, land use) will help produce sufficient additional food for a growing global population. In the second half of the past century, the green revolution driven by technological advances is largely credited with avoiding food shortages in developing countries. However, it has become clear that modern agriculture is not without its drawbacks: the use of fertilisers, pesticides and herbicides, as well as intensive farming have had harmful effects on soils, raising serious questions of sustainability. Today, biotechnology and synthetic biology have the potential to increase food production without an increase of input. In farming management, precision agriculture81 uses digital technologies to monitor and optimise agricultural production processes, measuring variations within a field and assessing the needs and conditions of individual animals, in order to optimise the use of fertilisers, animal feed, etc. The application of these new technologies in countries with high fertility rates, which are usually among the least developed and still practice subsistence farming on a broad scale, will face certain economic and practical hurdles, but the potential impact is also great. Sub-Saharan Africa, which is expected to see the biggest population increase in the world in the coming decades, is home to more than half the world's usable uncultivated land.82 The economic partnerships that the EU is proposing to the African, Caribbean and Pacific (ACP) group of countries can contribute towards fast agricultural development, by removing customs duties on much needed machines that could be imported from the EU and by securing free access to the EU market for farmers from these countries.
3) Changing eating patterns (moving away from animal-based protein) is a broadly debated topic in the mass media today, particularly against the background of the need to cut greenhouse gas emissions. As developing countries' income per capita increases so does their consumption of animal-based proteins. Coupled with population increases this can put pressure on agricultural markets and lead to increased production with harmful environmental effects. The IPCC report describes plant-based diets as a major opportunity when it comes to mitigating and adapting to climate change, and it includes a policy recommendation to reduce meat consumption.83
4) Improving food distribution and reducing waste could also help. Even if populations continue to grow substantially in some parts of the world, food shortages could be avoided by first addressing their underlying causes. One solution that would be relatively easy to implement would be to improve the distribution of the food already available. According to one such proposal, there is already enough food grown on farms to feed 10 billion people, i.e. enough food for 2.5 billion humans more than currently exist.84 Food has to be better distributed and better preserved. Significant quantities of food are wasted because of inadequate refrigeration facilities in developing countries.
5) Reducing conflicts is another way to address local food shortages, particularly in fragile states. According to the Food and Agriculture Organization of the United Nations (FAO), 'The vast majority of the chronically food insecure and malnourished live in countries affected by conflict: an estimated 489 million of 815 million undernourished people and an estimated 122 million of 155 million stunted children'.85 Many conflict-affected countries are among those with higher fertility rates (Afghanistan, Democratic Republic of Congo, Mali, Nigeria, Somalia and Yemen).
81 See Precision Agriculture and the Future of Farming in Europe, Science and Technology Options Assessment, EPRS,
European Parliament, December 2016. 82 According to a World Bank 2013 report. 83 IPCC, op. cit. 84 Huston, T., How do we feed the planet in 2050?, in the Guardian, 2017. 85 FAO, The State of Food Security and Nutrition in the World 2017.

EPRS | European Parliamentary Research Service
24
EU policies and food security in the world
How the EU's external and internal policies prevent or increase food insecurity locally and globally is a topic of recurrent debate.86 Although there is still much criticism around EU agricultural policy, 'neither the EU agricultural policy nor the EU food aid policy have a considerable impact on world markets. And they no longer have significant negative consequences for food security'.87 EU trade policy has also been in the spotlight of criticism for undermining food security in developing countries. The vast majority of the world's countries with high fertility rates benefit from free access to the EU market, generally granted by the EU unilaterally. This 'helps them to find outlets for their market, in spite of many sanitary and regulatory obstacles. This has, overall, a positive impact on food security in these countries, through income generation and job creation'.88 Free access to EU markets also enables beneficiary countries (such as Pakistan89 and Bangladesh – textiles) to export other goods to the EU and thus to obtain the resources to import much needed food. This policy is evolving however: the EU has already established or is aiming to establish free trade areas with many of these countries, particularly in the ACP group.90 There are concerns that EU food and agricultural products will outcompete local production with harmful effects on local producers. However, the trade relationship the EU is offering these countries is an asymmetric one that allows certain agricultural sectors in third countries to be protected from tariff liberalisation.
86 For a comprehensive overview of the subject, see Jean-Christophe Bureau and Johan Swinnen, EU Policies and Global
Food Security, LICOS Discussion Paper Series, Discussion Paper 392/2017. This study concludes: 'Overall, a recurring theme from our review is that the impact of EU policies on global food security today is less obvious and more complex/nuanced than often argued.'
87 Ibidem. 88 Ibidem. 89 Appetite for food imports grows, Dawn Today`s Paper, 12 March 2018. 90 I. Zamfir, An overview of the EU-ACP countries' economic partnership agreements: Building a new trade relationship,
EPRS Briefing, July 2018.

Demographic outlook for the European Union 2020
25
3. Focus on food and nutrition
3.1. People and diets Food is an essential part of cultures and traditions. Not only is it a vital necessity for everyone, it is also something that easily evokes differing opinions and passions. While some advocate healthy eating habits or enjoy discovering new recipes from all around the world, others are more concerned about the affordability of food or the damage that certain diets can cause for the environment and animal well-being. An increasing number of people, in particular the younger generation, suffer from food allergies or intolerances and have to pay close attention to what they put into their mouths. Furthermore, the 'truth' about diets changes over time: what was once thought to be healthy, can now be regarded as unhealthy, or vice-versa (e.g. trans fats,91 and eggs92). In addition, recent research seems to point more and more in the direction of 'personalised diets': what is good for one, might not be for someone else, as everyone has his or her personal 'microbiome' (microbial community living in the gut). A plethora of conditions, from obesity to anxiety, appear to be linked to the gut microbiota.93
According to the Food and Agriculture Organization of the United Nations (FAO), by 2050 the agri-food sector will have to generate 50 % more food and feed to be able to meet the increased global demand for food. At the same time, shifts to unhealthy diets in middle- and high-income countries are increasing the prevalence of obesity and diet-related diseases. The latest report of the Organisation for Economic Co-operation and Development (OECD)94 argues that life expectancy gains have slowed recently across most OECD countries, especially in the United States, France and the Netherlands. The causes for this are multifaceted: rising levels of obesity and diabetes have made it difficult to maintain previous progress in cutting deaths from heart disease and strokes; and chronic diseases and mental ill health are affecting growing numbers of people. Obesity rates continue to rise in most OECD countries, with 56 % of adults overweight or obese and almost a third of children aged between 5 and 9 overweight.
Malnutrition poses challenges in all countries in its various forms: undernutrition and micronutrient deficiencies as well as excess weight and obesity (overnutrition).95 Diet-related non-communicable diseases include cardiovascular diseases (such as heart attacks and strokes and high blood pressure), type-2 diabetes and some cancers. Unhealthy diets, tobacco use, harmful use of alcohol and physical inactivity have been identified as the top risk factors for non-communicable diseases in the EU, all of which are, to a large extent, avoidable.96
Recent studies suggest that people in developed countries eat too many animal products, recommending a shift to plant-based diets and a reduction in meat consumption, in an effort to improve health and mitigate climate change. How achievable this is remains to be seen. It also raises the question of which diet would be the healthiest: one based on the Mediterranean97 diet or a
91 Report from the Commission regarding trans fats in foods and in the overall diet of the Union population,
December 2015. 92 The truth about eating eggs, BBC, 17 September 2019. 93 The Human Gut Microbiota: Overview and analysis of the current scientific knowledge and possible impact on
healthcare and well-being, JRC technical reports, 2018. 94 OECD, Health at a Glance 2019, November 2019. 95 World Health Organization, Malnutrition. 96 Prevention and control of noncommunicable diseases in the European Region: a progress report, World Health
Organisation (WHO) Regional Office for Europe, 2014. 97 The Mediterranean diet, EUFIC.

EPRS | European Parliamentary Research Service
26
Nordic98 one? Then there is the issue of the dangers of processed foods. The sections below delve into some of these topics.
3.1.1. Current diets of Europeans
Food production is an important economic sector in the EU, employing about 47 million people. Europe has 12 million farmers operating in farms of various sizes, and the EU food and drink industry employs 4.72 million people, being the largest manufacturing industry in the EU. In half of the EU's 28 Member States, the food and drink industry is the biggest manufacturing employer. About three quarters of EU food and drink exports are destined for the single market. At the same time, the EU is the largest exporter of food and drink products in the world, and the biggest or second biggest importer, alternating places with the United States.99
EU households spend about 11 % of their budget on food; this share has remained the same for the last 10 years. After a drop due to the 2008 economic crisis, spending on food services, including restaurants, cafés and canteens, has increased slightly to more than 7 % in 2017. It remains to be seen if and how the expansion of food delivery services will affect this trend.100
The latest Eurostat data (2018) indicate that 36 million people in the EU cannot afford a quality meal (including meat, chicken, fish or a vegetarian equivalent) every second day.101 Half of low-income households in the newer Member States of the EU struggle in their access to food. In addition to the rising number of overweight people, there is evidence of growing nutritional deficiencies in EU countries. There are also significant differences in levels of food deprivation across the EU, with the severest impacts observed for poorer households in Romania, Lithuania, Bulgaria, Malta, Poland, Slovakia and Estonia. There is a lack of statistics meanwhile to assess the prevalence of malnutrition in potentially vulnerable groups, for example migrants, the homeless and the elderly.102 Evidence suggests that food insecurity places adults and children at an elevated risk of eating poor quality diets, with long-term health implications including diet-related chronic conditions and more immediate risks such as nutrient inadequacy and iron deficiency.103
Another worrying trend is the increasing prevalence of eating disorders, such as anorexia, especially among young girls and – increasingly – young boys. Here, role models and social media are suspected to play a part.104
Of all the food produced in the EU, an estimated 20 % is wasted, with 70 % of food waste arising at household, food service and retail levels.105
98 What is the Nordic Diet?, International Food Information Council Foundation. 99 F. Bas-Defossez et al., Feeding Europe: Agriculture and sustainable food systems, IEEP, October 2018;
FoodDrinkEurope, Data & Trends of the European Food and Drink Industry 2019; Megatrends in the agri-food sector: global overview and possible policy response from an EU perspective, Research for AGRI committee, Policy Department for Structural and Cohesion Policies, European Parliament, September 2019.
100 European Commission, EU agricultural outlook for markets and income 2019-2030, DG Agriculture and Rural Development, 2019.
101 Food waste, European Commission website. 102 Stop food waste, European Commission website; Opportunities and challenges for research on food and nutrition
security and agriculture in Europe, EASAC policy report 34, December 2017. 103 R. Loopstra et al., 'Food insecurity and social protection in Europe: Quasi-natural experiment of Europe's great
recessions 2004-2012', Preventive Medicine, Vol. 89, August 2016, p. 44-50. 104 F. Bert et al., 'Risks and Threats of Social Media Websites: Twitter and the Proana Movement', Cyberpsychology,
Behaviour, and Social Networking, Vol 19(4), 8 April 2016. 105 Stop food waste, European Commission website.

Demographic outlook for the European Union 2020
27
Figure 10 – Daily calorie supply per capita
Data source: Eurostat.
Over the past 50 years, food consumption in Europe has undergone significant changes. The average European per capita consumption of animal protein is now 50 % higher than in the early 1960s, and double the global average. Economic, demographic and lifestyle changes have also led to an increase in the amount of food consumed outside the home and to a decrease in the amount of time spent cooking and eating.106 According to one OECD report, northern Europeans spend far less time eating and drinking than southern Europeans (1 hour 13 minutes a day for Swedes, 1 hour 16 minutes for Estonians and 1 hour 21 minutes for Finns, compared with 2 hours 2 minutes for the Spanish, 2 hours 4 minutes for Greeks and 2 hours 5 minutes for Italians). The French lead the European countries included in the study –spending 2 hours 11 minutes eating and drinking every day, while the Dutch devote the least time to this activity at only 1 hour and 10 minutes.107
Food consumption patterns vary substantially across the EU. For example, meat consumption ranges between 109 and 159 g/day, fish and seafood between 9 and 63 g/day and milk and dairy product consumption between 171 and 522 g/day. Many factors influence differences in eating
106 European Environment Agency (EEA), Food in a green light, EEA report No 16/2017. 107 OECD, Time spent eating and drinking, 5 March 2018.

EPRS | European Parliamentary Research Service
28
habits between countries, such as culture and climate, household composition, education and income, and degree of urbanisation.108
Eating habits can go a long way towards ensuring good health. The Council of the European Union noted in its conclusions in June 2014109 that obesity and its negative health effects 'have been described as having reached epidemic proportions and that the high level of overweight and obesity in children and adolescents is of particular concern'. The Council also pointed out that every year citizens lose their lives to diseases related to unhealthy diet and lack of physical activity, and that social inequalities are particularly relevant: lifestyle-related risk factors, such as unhealthy diet and physical inactivity, tend to be more prevalent among the less educated or lower income segments of population.
Obesity110 is a serious public health problem, as it significantly increases the risk of chronic diseases, such as cardiovascular disease, type-2 diabetes, hypertension and certain types of cancer. For society as a whole, it has substantial direct and indirect costs that put a considerable strain on healthcare and social resources. In 2017, 15.2 % of people over the age of 18 in the EU were obese, and another 36.8 % were pre-obese. This means more than half of the population above the age of 18 in the EU were overweight. The total share of overweight people grew slightly between 2014 and 2017, from 51.6 % in 2014 to 52.0 % in 2017.111
Obesity also disproportionately affects people with lower levels of education: 17.3 % and 16.2 % of adults with low and medium levels of education, respectively, were obese in 2017, whereas only 11.7 % of people with high education levels fell into this category. Because lower educational levels tend to be associated with economic and social disadvantages, obesity is a bigger issue among socially disadvantaged groups. While for women obesity seems to be negatively correlated with educational attainment (highly-educated women tend to be less obese), there seems to be no such clear-cut pattern for men.112
2019 Eurobarometer on food safety in the EU
A Special Eurobarometer report on food safety – an EU-wide survey commissioned by the European Food Safety Authority (EFSA) and published on the first ever UN World Food Safety Day on 7 June 2019 – revealed that Europeans have a somewhat limited understanding of how the EU food safety system works. Only three in ten (28 %) know that the EU relies on scientists to give expert advice on food safety issues. At least seven in ten respondents say that they trust scientists for information on food risks. This proportion is highest in Sweden and the Netherlands (both 94 %), Greece (93 %) and Finland (90 %), while respondents are least likely to trust scientists in Malta (70 %), Luxembourg (72 %), Slovenia (73 %) and Croatia (75 %).
The survey concluded that there is no single concern that predominates in all EU countries, and that there are significant differences between the Member States. However, three issues surface most frequently in 20 EU Member States or more: the misuse of antibiotics, hormones and steroids in farm animals (44 %), pesticide residues in food (39 %), and food additives (36 %).
108 European Environment Agency (EEA), Food in a green light, EEA report No 16/2017. 109 Council of the European Union, Council conclusions on nutrition and physical activity, June 2014. 110 According to World Health Organization (WHO) definition, people who are overweight have a body mass index (BMI)
greater than or equal to 25, and obesity corresponds to a BMI greater than or equal to 30. See WHO website on Obesity and overweight.
111 Eurostat, Sustainable development in the European Union – Monitoring report on progress towards the SDGs in an EU context – 2019 edition, Publications Office of the European Union, 2019.
112 Ibidem.

Demographic outlook for the European Union 2020
29
In Spain, France, Belgium, Greece, Cyprus and Hungary, people are most concerned about pesticide residues in food. In Finland, Sweden, Denmark, the Netherlands, Germany, Poland, Slovakia, Slovenia, Austria and Italy the main concern for the people are antibiotic or hormone residues in meat. In the Baltic states and in Bulgaria, Romania and Hungary people are concerned about additives, while diseases found in animals are worrying most people in the Czech Republic and Croatia. Food hygiene is the biggest concern in the UK and in Malta, while the Portuguese and Irish are most concerned about food poisoning. Microplastics have emerged as a new food safety issue for the first time: around a fifth say that they are concerned about microplastics in food.
The most important factors for Europeans when buying food are the origin (53 %), cost (51 %), food safety (50 %) and taste (49 %). Nutrient content is considered slightly less important (44 %), while personal ethics and beliefs (e.g. considerations of animal welfare, environmental concerns or religion) rank lowest in importance (19 %).
Nutrient content is important in Finland (64 %), the Netherlands (63 %) and Malta (61 %); only around a third of respondents say that this is an important factor in France (32 %) and Portugal (34 %). The origin of the food is one of the most important factors in France (71 %), Slovenia (70 %), Finland (68 %) and Luxembourg (67 %), while the lowest proportions considering it important are in the Netherlands (27 %), the UK (36 %) and Lithuania and Malta (both 37 %).
Figure 11 – Most important factors when buying food
Data source: Eurobarometer.
3.1.2. Dietary guidelines
A balanced diet is one that provides adequate amounts of various nutrients to maintain health and well-being. Protein, carbohydrate, fat, vitamins, minerals and water are all nutrients. Each nutrient has a particular function in the human body. Nutrient requirements vary depending on age and gender. Level of physical activity, physiological status (such as pregnancy), dietary habits and genetic background are also important factors.
European Food Safety Authority (EFSA)
In its June 2014 conclusions, the Council acknowledged113 that overall dietary patterns may be more relevant than specific foods in the etiology of diet-related diseases, and that healthy dietary patterns are characterised by high consumption of fruits and vegetables, consumption of fish and giving 113 Council of the European Union, Council conclusions on nutrition and physical activity, June 2014.

EPRS | European Parliamentary Research Service
30
preference to low-fat dairy, whole grains, lean meat and poultry and using vegetable oils as a replacement for solid fats where possible.
At international level, the FAO helps countries to develop dietary guidelines in line with current scientific evidence. More than 100 countries have adopted dietary guidelines that are adapted to their nutrition situation, food availability, culinary cultures and eating habits.114 At EU level, the European Food Safety Authority (EFSA) gives independent scientific advice on nutrient intake and dietary reference values,115 but establishing nutrition goals or recommendations is the responsibility of national policy makers and health professionals. Nutrient goals and recommendations are tailored to national contexts and may therefore differ from country to country. Most EU countries have set national dietary guidelines, although there is variation between countries in specific recommendations and definitions of portions and servings. In general, the average intake of fruit and vegetables is too low among the EU population, while intake of red meat, saturated fat, salt and sugar is too high compared with dietary recommendations.116
It can be assumed that most EU citizens know about dietary guidelines and what kind of food is healthy. The realities of life, however, can sometimes get in the way of all the good intentions: people sit in traffic jams, wait for buses and trains that run late and, when they finally get to their local supermarket, the priority is not necessarily to think about the most healthy option, but rather to find something quick and easy to make that everybody in the family will agree to eat.
In these situations ready-to-eat convenience foods come in handy; but they have their drawbacks. The European Commission's Joint Research Centre (JRC) recently concluded that up to two-thirds of packaged foods frequently sold on the EU market are too high in fat, sugar and salt, and do not contain enough fibre.117 JRC scientists evaluated the nutritional composition of nearly 2 700 products in five product categories (breakfast cereals, ready meals, processed meat, processed seafood, and yoghurts) in 20 countries. The study concluded that, given the considerable market share of many such products, they are likely to be consumed widely and in some cases regularly, including by children. Most often, breakfast cereals and yoghurts were too high in sugars; processed meat, processed seafood, and ready meals had too much salt; breakfast cereals did not have sufficient fibre; and yoghurts were too high in total and saturated fat. The researchers concluded that this is a matter of concern and may explain, in part, the high child obesity rates and health and economic burden of chronic diseases.
In a recent report, the FAO118 states that the significance of industrial processing, and in particular of techniques and ingredients developed or created by modern food science and technology, for the nature of food and the state of human health, is generally understated. Nevertheless, the FAO states that a number of commonly consumed processed foods and drinks are probably implicated in obesity and various chronic non-communicable diseases: these include energy-dense food products, fast foods, convenience foods, soft drinks, sugary drinks, various refined starchy foods, processed meat and salt-preserved foods. According to recent research,119 ultra-processed diets also
114 Food-based dietary guidelines, FAO. 115 Dietary Reference Values for nutrients – Summary report, European Food Safety Authority (EFSA), December 2017. 116 European Environment Agency (EEA), Food in a green light, EEA report No 16/2017. 117 Many popular packaged foods in the EU contain too much fat, sugar, salt and too little fibre, Joint Research Centre,
23 October 2019. 118 C. A. Monteiro et al, Ultra-processed food, diet quality, and health using the NOVA classification system, FAO, 2019. 119 K. D. Hall et al., 'Ultra-Processed Diets Cause Excess Calorie Intake and Weight Gain: An Inpatient Randomized
Controlled Trial of Ad Libitum Food Intake', Cell Metabolism, Vol. 30(1), 2 July 2019, pp. 67-77.

Demographic outlook for the European Union 2020
31
cause excess calorie intake and weight gain: people eat more calories when exposed to a diet composed of ultra-processed foods120 compared with a diet composed of unprocessed foods.
Aiming to steer the reformulation of foods in a healthier direction, a roadmap for action on food product improvement121 was endorsed during the Dutch Presidency of the European Union in 2016. The roadmap aims to accelerate concerted action on the part of national governments, food business operators, the European Commission, the World Health Organisation and non-governmental organisations (NGOs). To improve people's diet, the roadmap states that it is important to make the healthy choice the easy choice: food product improvement is an important way of achieving this. While national governments have responsibility for setting public health objectives, food business operators throughout the supply chain including industry, retail, catering, bars, restaurants and so on, have, according to the roadmap, a shared responsibility to improve their food products to contribute to improving people's diets. The roadmap acknowledges that there are cultural differences in taste and eating behaviour, and that gradual reduction of salt, saturated fats and added sugars in foods is needed to maintain consumer acceptance of improved products.
The European food industry has made a commitment to the EU Platform for Action on Diet, Physical Activity and Health to optimise the nutritional content in existing products and when creating innovative ones, whenever relevant and possible. For example, producers of retail margarines have drastically reduced the level of trans fatty acids in their products: the percentage of products complying with the recommended maximum 2 % trans-fats level increased from 29 % in 2004 to 93 % in 2016 for margarines sold to food manufacturers.122
Nutrition and the elderly As discussed above in Section 2, the EU population is ageing dramatically. On average across the EU Member States, the share of the population aged over 65 increased from less than 10 % in 1960 to nearly 20 % in 2015, and it is projected to increase further to nearly 30 % by 2060. Currently, around 50 million people in the EU live with two or more chronic conditions, and most of these people are over 65.123
The June 2014 Council conclusions124 emphasised that the elderly are vulnerable to malnutrition, not least because nutritional requirements change and physical activities tend to decline with age, affecting people's energy requirements. The Council concluded that this was an area requiring further attention.
For example, milk alternatives often made from soy, almond, rice or oats, might not be a good replacement for cow's milk in terms of protein, as the protein they contain may be of a lower quality, whereas children and the elderly in particular require high quality protein for bone development.125 Milk alternatives are usually fortified with nutrients that occur naturally in cow's milk, such as
120 The NOVA food classification system categorises foods, according to the nature, extent and purposes of the industrial
processes they undergo, into four groups: 1) unprocessed or minimally processed food (for example fresh fruit and vegetables, meat, fish, eggs and milk); 2) processed culinary ingredients (such as vegetable oils crushed from seeds; butter obtained from milk); 3) processed foods (for example canned or bottled vegetables; dried or smoked meats and fish) and 4) ultra-processed food (many ready-to-consume products such as soft drinks, breakfast cereals, fruit yoghurts). See: C. A. Monteiro et al, Ultra-processed food, diet quality, and health using the NOVA classification system, FAO, 2019.
121 Roadmap for Action on Food Product Improvement, Dutch Presidency EU Conference, Amsterdam, 22 February 2016. 122 Product formulation & innovation, FoodDrinkEurope. 123 D. Eatock, Demographic outlook for the European Union, EPRS, European Parliament, December 2017. 124 Council conclusions on nutrition and physical activity, June 2014. 125 Is it better to drink cow's milk or a dairy-free alternative?, BBC, 25 November 2019; Nutritionally-speaking, soy milk is
best plant-based milk: Closest to cow's milk in range of nutrients it offers, ScienceDaily, 29 January 2018: A new study looks at the four most-commonly consumed types of milk beverages from plant sources – almond milk, soy milk, rice milk and coconut milk – and compares their nutritional values with those of cow's milk.

EPRS | European Parliamentary Research Service
32
calcium, but it is unclear if added vitamins and minerals are absorbed as well in the body and give the same health benefits as those occurring naturally.126 In addition, milk substitutes often contain added sugar (used to replace lactose, a natural sugar present in cow's milk).
Meanwhile, as the proportion of elderly people in the European population grows, more and more people belong to groups that are vulnerable to the risk of food poisoning. There was recently, for example, a multi-country outbreak of listeria infection linked to ready-to-eat meat products. In addition to pregnant women and people with weak immune systems, elderly people are at higher risk of invasive listeriosis associated with severe symptoms, life-threatening complications and potential death. Therefore, special attention should also be paid to food products provided for people in hospitals and nursing homes. Listeria can be found in many foods, including fish, meat products, cheese (especially soft cheese) and raw vegetables.127
Obesity also generally tends to increase with age. In 2017, the obesity rate peaked among older Europeans aged 65 to 74 and fell again after the age of 75.128
3.2. What can the EU do? The European Union's food safety policy aims to protect consumers, while guaranteeing the smooth operation of the single market. The EU has agreed standards to ensure food hygiene, animal health and welfare, and plant health, and also to control contamination from external substances, such as pesticides. A high level of health protection is the EU's paramount objective in the food production sector. The EU and Member States have shared competences in the area of food safety, with Member States being responsible for controls on their own territories. An extensive body of EU-wide law covers the entire food production and processing chain within the EU, as well as imported and exported goods.
Outbreaks of foodborne diseases are monitored throughout the European Union. The European Food Safety Authority (EFSA) produces annual reports on zoonotic infections and foodborne outbreaks, in cooperation with the European Centre for Disease Prevention and Control (ECDC) on the basis of data collected by the Member States. The latest report, published in December 2019, found that nearly one in three foodborne outbreaks in the EU in 2018 were caused by Salmonella. In 2018, EU Member States reported 5 146 foodborne outbreaks affecting 48 365 people.129 Other common causes of foodborne outbreaks are Campylobacter, the most common bacteria causing food poisoning in Europe, and Shiga toxin-producing E. coli (STEC). Listeriosis accounts for the highest proportion of hospitalisations (97 %) and the highest number of deaths (229 cases in 2018), making it one of the most serious foodborne diseases.130
EFSA's task is to provide scientific advice for EU policy makers in areas related to food chain safety. It also collects information on food consumption trends and habits in EU countries and identifies emerging risks. For example, EFSA has been working on the question of climate change and food safety, and is organising a scientific seminar on the 'human health risks of micro- and nanoplastics in food' in June 2020.
126 Synthetic v Natural Nutrients: Does it matter?, Healthline, 17 August 2016. 127 European Food Safety Authority (EFSA), Listeria; Multi-country outbreak of Listeria monocytogenes sequence type 6
infections linked to ready-to-eat meat products, 25 November 2019. 128 Sustainable development in the European Union – Monitoring report on progress towards the SDGs in an EU context,
2019 edition, Eurostat. 129 A foodborne disease outbreak is an incident during which at least two people contract the same illness from the same
contaminated food or drink. 130 EFSA and ECDC, The European Union One Health 2018 Zoonoses Report, 11 December 2019.

Demographic outlook for the European Union 2020
33
In light of the growing childhood obesity epidemic, the European Commission and Member States have developed an EU action plan on childhood obesity.131 Supporting its implementation, the Joint Research Centre (JRC) has been mapping national school food policies132 and fostering stakeholder dialogue.133 The EU's school fruit and milk schemes134 have been instrumental in encouraging nearly 20 million children across the EU to acquire healthy eating habits.
The EU platform for action on diet, physical activity and health135 is a forum for European-level organisations, including food business operators, consumer organisations, public health NGOs and professional associations. The platform members make voluntary commitments in support of national governments attempts to reduce salt, sugars and fat in food products, increase the consumption of fruit and vegetables, reduce children's exposure to the marketing of foods and increase citizens' physical activity. In December 2019 the EU's Joint Research Centre published a tool kit to help EU Member States limit the marketing of food and non-alcoholic and alcoholic beverages to children and adolescents.136
The EU also funds a multitude of research programmes in the areas of health, food and nutrition. One example is Fit4Food2030,137 a Horizon 2020-funded programme aimed at finding solutions for the many food-related challenges Europe is facing, including hunger, malnutrition, obesity, climate change, scarce resources and waste. Another programme, FoodSHIFT2030,138 which began in January 2020, is exploring innovative food systems with a view to launching an 'ambitious citizen-driven transition of the European food system towards a low carbon, circular future, including a shift to less meat and more plant-based diets'.
In its December 2019 meeting, the Council of the European Union adopted conclusions on tackling food fraud.139 The Council notes with concern that fraudulent practices in the agri-food chain often lead to public health risks and/or financial losses for consumers and/or operators; it may also result in loss of confidence in the competent authorities and in the agri-food chain in general. The conclusions note that the cost of fraudulent practices for the global food industry is estimated at around €30 billion every year. The Council notes that it is the responsibility of each Member State to take primary action, but calls for strong cooperation between the relevant authorities and for the Commission to continue to develop an integrated strategy to combat food fraud.
The question of a possible EU-wide animal welfare labelling scheme, still open after years of discussion, was on the agenda in the Agriculture Council in December 2019, where the Council adopted conclusions on animal welfare.140 The Council's conclusions highlight the importance of animal welfare as an integral part of sustainable animal production, and acknowledge the need to further update current EU legislation, in particular in areas such as animal transport over long distances. The Council invites the Commission to assess the need for and impact of an EU regulatory framework with criteria for animal welfare labelling schemes, taking into account national
131 EU Action Plan on Childhood Obesity 2014-2020, February 2014. 132 Mapping of National School Food Policies across the EU28 plus Norway and Switzerland, JRC Science and Policy
Reports, 2014. 133 School Food and Nutrition in Europe: policies, interventions and their impact, JRC workshop report, 2014. 134 European Commission, The EU school fruit, vegetables and milk scheme, March 2019. 135 European Commission, EU platform for action on diet, physical activity and health. 136 A toolkit to limit marketing of food, non-alcoholic and alcoholic beverages to minors, JRC, 18 December 2019. 137 Fit4Food2030 project, European Commission. 138 FoodSHIFT2030 project. 139 Council conclusions of 16 December 2019 on next steps how to better tackle and deter fraudulent practices in the
agri-food chain. 140 Council conclusions of 16 December 2019 on animal welfare - an integral part of sustainable animal production.

EPRS | European Parliamentary Research Service
34
experience. In the absence of EU rules, some countries, such as Germany are currently drawing up their own national labelling systems.
In addition to addressing food safety issues, the EU also sets standards for industry: the Industrial Emissions Directive provides a framework regulating about 50 000 industrial installations across the EU. It requires these installations to hold a permit in accordance with the use of best available techniques (BAT). New EU environmental standards for the food, drink and milk industries were published in December 2019. In addition to their importance to the European food sector, these standards will help to achieve the EU's environmental policy goals – for instance in terms of reducing emissions to water and to air – and contribute to the circular economy – by increasing resource efficiency.141
3.3. New trends in consumer demands on food
Addressing food waste and food loss
The problem of food loss and waste is reflected in the United Nations 2030 Agenda for Sustainable Development. Target 12.3 of the sustainable development goals (SDGs) calls for the halving of per capita food waste by 2030 at retail and consumer level and the reduction of food losses along the production and supply chain.
The FAO itself notes in its latest report on The state of Food and Agriculture (2019) that it is surprising how little is known about how much food is lost or wasted, and where and why this happens. A broad estimate, made for the FAO in 2011, suggested that around a third of the world's food was lost or wasted every year. This estimate is still widely cited due to a lack of information in the field, but it can only be considered to be very rough. Therefore, to make effective progress towards reducing food loss and waste, it is first necessary to build a solid understanding of the problem.
There is a difference between food waste and food loss: they have different causes and require different solutions. Food waste occurs when food fit for consumption is wasted accidentally or intentionally at the retail level. Food losses occur along the food chain (for instance, during transport and storage) and are not always under the direct control of those involved. Food losses are often the result of inadequate technology, a lack of knowledge and skills, bad logistics or inefficient markets.
In the European Union, food waste prevention was singled out as a priority area for action in the circular economy package and related action plan, published in 2015. The EU-funded research programme FUSIONS was set up to explore challenges and seek a common definition of 'food waste'. FUSIONS concluded that an estimated 20 % of the total food produced each year is lost or wasted in the EU, costing approximately €143 billion. Households generate more than half of the total food waste in the EU, with 70 % of food waste arising at household, food service and retail level.
The EU Platform on Food Losses and Food Waste was established in 2016, bringing together the EU institutions, experts from Member States and relevant stakeholders. The platform supports actors in defining measures to prevent food waste, sharing best practice and evaluating progress made over time. Key recommendations for action of the platform were published in December 2019.
The European Parliament has repeatedly called for EU and national measures to improve the efficiency of the food supply and consumption chains and to tackle food wastage as a matter of urgency. In its resolution of May 2017 the Parliament proposed various measures to cut EU food waste, including clarification of labelling instructions for 'best before' and 'use by' dates. A recent study carried out by the European Commission estimates that up to 10 % of the 88 million tonnes of food waste generated annually in the EU are linked to date marking. Misinterpretation by consumers of the meaning of these dates can contribute to household food waste. The EU date marking guidance is expected to be finalised by 2021. In its resolution of January 2020 on the European Green Deal Parliament called for an 'enforceable EU-wide food waste reduction target of 50 % by 2030'.
141 New EU environmental standards for food, drink and milk industries, European Commission's Joint Research Centre,
4 December 2019.

Demographic outlook for the European Union 2020
35
European public opinion on animal welfare, environmental and food quality concerns are shifting. According to several Eurobarometer surveys,142 the majority of respondents consider that improvements are needed in farm animal welfare. EU citizens also find it important that products imported from outside the EU apply the same animal welfare standards as those applied in the EU. According to a special Eurobarometer on climate change, published in September 2019, 93 % of respondents think climate change is a serious problem, and 60 % of them say they have personally taken action to fight climate change in the past six months. Almost one in five (18 %) consider the carbon footprint of their food purchases and sometimes adapt their shopping accordingly.143 The millennial population ('Generation Y') – those aged between of 23 and 37 – and 'Generation Z' – those younger than 23 may be giving even more consideration to ethical issues.
In its 'Agricultural outlook for 2019-2030'144 the Commission predicts that, in the EU and beyond, consumers and citizens are going to become more demanding with respect to food, its sourcing, and its impact on the environment and climate change.
The Commission further acknowledges that for producers, these evolving demands often mean higher production costs, but also opportunities to differentiate their products, adding value while reducing negative climatic and environmental impacts. Alternative production systems, such as local, organic or other types of certified production are expected to increase further. Production of soya beans and pulses will continue to grow to address feed and food demand for locally produced plant-protein products. At world level, both demand and supply is projected to grow further, creating opportunities and pressures for EU imports and exports.145
One of the new consumer trends seems to be to reduce the use of animal products, including dairy and meat products. Restaurants and big fast food chains are already adding vegetarian alternatives to their menus, and vegetarian versions of traditional foods (such as 'chili sin carne') are emerging.
The Commission forecasts that EU meat consumption will decline slightly, from 69.8 kg to 68.7 kg per capita by 2030, because of growing social and ethical concerns, environmental and climate worries and health claims, but also because of the ageing population (eating smaller portions) and lower meat availability on the domestic market. The Commission also expects there to be a shift in preferred meats from beef and pig to poultry meat consumption. Sheep meat consumption is expected to increase slightly, thanks to changes in diet but also changes in the EU population relating to religious beliefs and migration. Lab-grown meat could also become a competitor, according to the Commission; but consumer acceptance of it and its environmental footprint remain unclear.146 Consumers – at least the younger generations – have access to more and more information. Apps provide information on food composition, calorie content and ingredients, and can influence choices. This can affect the food industry, as producers try to reformulate their products to contain fewer additives, salt and sugar. Social media can also be a powerful tool in promoting – or boycotting – certain products.
According to the Commission, rising consumer awareness of climate change and animal welfare issues is reflected in consumer behaviour: the number of vegetarians and vegans appears to be rising, at least in the younger generation, and the number of 'flexitarians' – people reducing their
142 Special Eurobarometers on Attitudes of Europeans towards Animal Welfare of March 2016 and on Agriculture and the
CAP of February 2018. 143 Special Eurobarometer on Climate Change, September 2019. 144 European Commission, EU agricultural outlook for markets and income 2019-2030, DG Agriculture and Rural
Development, 2019. 145 European Commission, EU agricultural outlook for markets and income 2019-2030, DG Agriculture and Rural
Development, 2019. 146 ibid.

EPRS | European Parliamentary Research Service
36
meat consumption – is increasing across all generations. At the same time, people's busy lifestyles drive the demand for ready meals, prepared salads and processed foodstuffs, such as frozen food and snacks.147
3.4. Looking for new solutions
3.4.1. Labelling for healthier food To help consumers make healthy choices when shopping, some EU countries have taken up voluntary labelling schemes to mark healthy products. Examples include the Green Keyhole symbol148 used in Sweden and Denmark, the Choices label149 in the Netherlands and the 'traffic lights' scheme in the United Kingdom.150 Italy has proposed its own 'battery label' scheme.151 Some other European countries152 have recently adopted a colour-coded 'Nutri-Score' system, where food products are ranked with a label on their packing ranging from 'A' to 'E', with corresponding colours from dark green to dark orange, according to their overall nutritional quality.153 The system takes into account both elements to limit, such as calories, saturated fat, sugars or salt, and those to favour, such as fibre, proteins, nuts, fruit and vegetables. The food is assigned a colour and a letter based on the resulting score, calculated per 100g or 100ml.154
Figure 12 – The Nutri-Score logo
Source: Santé publique France.
According to consumer research, the Nutri-Score labelling scheme seems to be the one best understood by consumers.155 But the scheme has also been criticised for sometimes giving results that might seem bizarre at first sight.156 For example, smoked salmon gets a D in the Nutri-Score system, while frozen pizza can get a C. Standard white pasta gets an A. Part of the explanation is that food products are compared with 'similar products', so smoked salmon is compared with fresh fish and gets a D for containing more salt. Virgin olive oil, one of the healthiest food oils, gets a D – because, after all, it is fat. It has been claimed that compared for example to the Dutch dietary guidelines, Nutri-Score is 'too positive' about white bread and 'too negative' about olive oil.157 It
147 ibid. 148 The Keyhole, Swedish Food Agency. 149 The Choices Programme. 150 Helping you eat well, British Nutrition Foundation. 151 Discover 'battery label', the Italian answer to Nutri-score, Italianfood.net, 22 November 2019. 152 France, Spain and Belgium; Germany has announced it will introduce NutriScore in 2020. The Netherlands is to adopt
the scheme after it has been subject to a scientific review, to adapt it to match better with Dutch nutrition guidelines; the review is to be completed by the middle of 2021.
153 Nutri-Score was designed by the Equipe de Recherche en Epidémiologie Nutritionnelle (EREN), a French public nutrition research team, led by Professor Serge Hercberg. It is based on the UK's Food Standards Agency nutritional score. The logo was created by Santé publique France.
154 Nutri-Score, Santé publique France. 155 M. Egnell et al., 'Objective Understanding of Front-of-Package Nutrition Labels: An International Comparative
Experimental Study across 12 Countries', Nutrients, Vol. 10(10), p.1542, 2018. 156 Le Scan: des frites "A" et de l'huile d'olive "D", peut-on se fier au Nutri-score ?, RTBF, 13 January 2020. 157 Netherlands backs nutritional labelling: 'Nutri-Score is best to promote healthy choices', Food Navigator,
2 December 2019.

Demographic outlook for the European Union 2020
37
would also be difficult to give an A for white pasta in Scandinavia, where there are plenty of pasta products made with whole grain, rye or oats on supermarket shelfs.
Major food manufacturer Nestlé has announced that it is launching the Nutri-Score scheme158 in five European countries in the first half of 2020 for its own brands. Consumer organisations broadly support these kinds of schemes, and are calling for them to be made mandatory across the EU.159 The European Commission has been working on a report on the front-of-package nutrition labelling used in Member States. The report was to be published in July 2019, but has been postponed, with no specific date set as yet for the publication.
These kinds of labelling schemes are also intended to encourage the food industry to reformulate their products to be healthier. This has been happening already with a variety of voluntary industry initiatives: for example, the soft drinks sector in the EU has pledged to reduce added sugars in soft drinks by 10 % by 2020, and in the Netherlands, the producers of soft drinks have committed to reduce the amount of sugars in soft drinks by 30 % by 2025. The soft drinks sector has also committed to remove all soft drinks for sale in EU primary schools and added sugar drinks from secondary schools, which has largely been achieved.160 The European Breakfast Cereal Association has committed to encourage its members to increase the number of products that contain positive nutrients, such as fibre, whole grains, vitamins and minerals, and to continue developing products that contain less sugar and salt 'where technologically feasible and in line with consumer acceptance'. In 2018 monitoring reports, the vast majority of these manufacturers reported having achieved reductions in sugar, as well as salt and saturated fat. In Spain, breakfast cereal producers agreed to reduce by 10 % the median content of total sugar in chocolate-flavoured children's breakfast cereals, and similar commitments have been made in several other EU countries.161
3.4.2. Climate labelling As consumers become more and more interested in the climate effects of their choices, the demand for more information is growing. The Swedish National Food Agency has developed dietary guidelines that focus on how to eat sustainably to benefit health and the environment.162 These wider environmental concerns are currently not regularly considered during the development of dietary guidelines. In the autumn of 2019, an online retailer in Sweden launched a pioneering system, making it possible for the customers to see a figure showing the carbon dioxide equivalent (CO2e) emitted in the production of a particular food product. The calculation system was developed by the Research Institutes of Sweden (RISE). Approximately 3 000 products have been labelled with a climate imprint based on life-cycle analyses that include emissions of all greenhouse gases in the production chain. A number of parameters affect the final value, such as country of origin, cultivation method, processing and transport.163
Food companies are seeing a business opportunity in these changing attitudes as well: food producers who are committed to sustainable operations can offer a competitive advantage to their customers in the food industry, as well as appealing directly to consumers. More and more companies of all sizes are committing themselves to sourcing raw materials sustainably, reducing their greenhouse gas emissions and/or offsetting their emissions by supporting sustainable projects, or setting deadlines by which they intend their operations to become carbon neutral.
158 Nestlé announces industry-leading push to use Nutri-Score in Europe, Nestlé news, 26 November 2019. 159 Nutri-Score factsheet, European Consumer Organisation (BEUC), September 2019. 160 Soft Drinks Europe (Unesda), Our Aspirations 2019-2024. 161 EU Platform on Diet, Physical Activity and Health, Details for action: Breakfast cereal industry commitment in the area
of product formulation and innovation. 162 Eco-smart food choices, Swedish Food Agency. 163 Unique database makes climate smart choices easier, RISE.

EPRS | European Parliamentary Research Service
38
3.4.3. Plant-based (protein) alternatives Plant-based dairy and meat alternatives are growing in popularity, and egg substitutes are in development as well. Soy is expected to be the dominant commodity in the global plant-protein market, accounting for around 77 % of plant protein demand, followed by wheat protein at 22 %, pea protein at 0.8 % and other plant proteins at 0.2 %. Soy is used in the food industry for example as a dairy alternative in milk, yoghurt and other products. Pea protein, in addition to soy, is used in meat substitutes – another growing food market sector.164 In addition, novel products using oats to substitute milk and meat are gaining popularity especially in Scandinavian countries.165
The health benefits of plant-based burgers are still mixed, however, since they usually contain a similar amount of calories, but are higher in sodium (or salt), though lower in fat. They are often also highly processed foods, which may lead to the loss of some nutrients naturally present in plant food. Some of the meat alternatives also have many additives in them.166
Estimates of the number of vegetarians in the world population vary – some sources suggest 8 % of the global population are vegan or vegetarian, while others give a figure as high as 22 %. According to a recent study,167 the share of vegetarians in the United States is around 5 %, while in Germany and Sweden it is 10 %, in Brazil 14 % and in India 31 %.
3.4.5 Insect food Insects are not traditionally consumed as food in Europe, unlike many other parts of the world, but this could possibly change. Insects are a sustainable source good-quality protein, fatty acids and micronutrients, such as iron, magnesium and selenium. They could replace, at least in part, the consumption of fish, as over-fishing is already a big problem.
The first applications for authorisation of insects as novel foods have already been submitted to the European Commission.168 In some Member States, insect burgers and nuggets are already on sale. In Finland a wholegrain bread was available containing dried house crickets, ground into powder and added to the flour, but after a promising start demand declined and the bread has since been withdrawn. One challenge when it comes to introducing insect protein into the European food chain seems to be the 'yuck-factor': public acceptance of insect food. But dietary habits can change quickly, examples being the consumption in Western societies of raw fish in the form of sushi and of the novel fungal protein product Quorn. According to one study,169 the most likely early adopters of insects as a novel protein source are younger males interested in the environmental impact of their food choices. Edible insects are also becoming more and more popular in certain specific markets such as sports nutrition, dietetic food and food supplements.170
What is more, even if people cannot be persuaded to add them to their diets, insects could still become important in the European animal feed chain, especially for fish, pigs and poultry.
164 Plant-based protein consumption 'set to double' by 2025, IEG Policy, 19 November 2019. 165 Meat from oats is the next big thing in veganism, Veganista, 10 May 2019. 166 Ask the Expert: Popular plant-based meat alternatives, Harvard T.H. Chan School of Public Health; Meat alternatives
have gone mainstream, but how can they fit in your diet?, American Heart Association News, 25 September 2019. 167 Megatrends in the agri-food sector: global overview and possible policy response from an EU perspective, Research
for AGRI committee, Policy Department for Structural and Cohesion Policies, European Parliament, September 2019. 168 European Commission, Summary of applications and notifications under the Novel Food Regulation. 169 W. Verbeke, 'Profiling consumers who are ready to adopt insects as a meat substitute in a Western society', Food
Quality and Preference, Vol. 39, 2015, pp.147-155. 170 Megatrends in the agri-food sector: global overview and possible policy response from an EU perspective, Research
for AGRI committee, Policy Department for Structural and Cohesion Policies, European Parliament, September 2019.

Demographic outlook for the European Union 2020
39
3.5. Transforming food systems According to a prognosis commonly used by the FAO, the agri-food sector will needs to generate 50 % more food and feed by 2050 on account of increased demand from a growing world population. Massive population growth is expected, especially in urban areas, with 70 % of the population likely to be living in cities by 2050. Population size changes the quantity of food produced, and income affects the types of foods produced: with increased income, consumption of animal source foods, such as meat and dairy is expected to increase.171 As the amount of suitable agricultural land available is limited, this will be an enormous challenge. Substantial dietary changes will be necessary, according to the EAT-Lancet Commission: global consumption of fruit, vegetables, nuts and legumes will have to double, and the consumption of foods such as red meat and sugar will have to be reduced by more than 50 %.172
Figure 13 – Global dairy consumption trends
Source: European Commission.
Figure 14 – Global meat consumption trends
Source: European Commission.
171 Food in the Anthropocene: the EAT-Lancet Commission on healthy diets from sustainable food systems, The Lancet,
16 January 2019. 172 Food Planet Health – Healthy diets from sustainable food systems, Summary Report of the EAT-Lancet Commission, 2019.

EPRS | European Parliamentary Research Service
40
On the other hand, one third of the food produced in the world is now wasted, so trying to find ways to address this problem could be part of the solution. Technological innovation could help to increase production, easing the pressure on the land available.
Organic farming is on the rise across the EU. The share of total agricultural area used for organic farming nearly doubled between 2005 and 2017, rising from 3.8 % to 7.0 %. Austria leads the EU with more than 23 % of its agricultural land farmed organically in 2017, followed by Estonia and Sweden with slightly below 20 %. In all other Member States, organic farming was practised on less than 15 % of farm land. Several statistics indicate that organic farming is set to continue growing in Europe. Demand for organic food, for example, has been rising steadily. The number of organic producers has also been increasing in Europe, reaching 295 577 in 2016.173
Climate change is going to affect agriculture in many ways: globally, the increase in droughts and floods will decrease yields, and international trade will be instrumental in the availability of food worldwide. Climate change will likely affect food quality as well as quantity.174 It also poses challenges for global food safety as it can affect the occurrence of some foodborne diseases, as well as favouring the establishment of invasive alien species harmful to plant and animal health, and increasing the incidence of toxin-producing algae causing seafood contamination.175
Tracking the environmental impacts and greenhouse gas emissions of food production is highly complicated. According to recent research, food production is the largest cause of global environmental change. Agriculture occupies approximately 40 % of global land area, and food production is responsible for up to 30 % of global greenhouse-gas emissions and 70 % of freshwater use.176
A recent study177 notes that food production appears at first glance to account for only a small portion of Europe's climate footprint: food production in the EU accounts for less than 5 % of global emissions from the agricultural and land use sector. However, since Europeans also eat products imported from all over the world, calculating EU food emissions on the basis of EU food production alone leaves out a major piece of the puzzle. The study found that meat and dairy account for more than 75 % of the greenhouse emissions from EU diets, because meat and dairy production causes not only direct emissions from animal production, but also contributes to deforestation from cropland expansion for feed, which is often produced outside of the EU. The study reinforces previous research arguing that eating less meat and dairy is one of the key actions individuals can take to reduce their climate footprint.
Controversial issues in food production linked with environmental issues are many and complex. One example is the use of palm oil. Palm oil is difficult to replace in food products, because of its highly useful characteristics and functional properties: it has a mild taste, remains semi-solid at room temperature, has a long shelf-life and is relatively cheap. In some countries consumers have turned against palm oil in food (and other) products because of its part in deforestation in the biggest producing countries, in particular in southeast Asia. As a result, food producers have changed their recipes to be able to label their products as 'palm oil-free'. However, deterring consumers from palm oil-containing products may not help the environment, given that other vegetable oils such as soy
173 Eurostat, Sustainable development in the European Union – Monitoring report on progress towards the SDGs in an
EU context – 2019 edition, Publications Office of the European Union, 2019. 174 K.L. Ebi and I. Loladze, 'Elevated atmospheric CO2 concentrations and climate change will affect our food's quality and
quantity', The Lancet Planetary Health, Vol. 3(7), 2019, pp. e283-e284. 175 EFSA, Climate change and food safety. 176 Food in the Anthropocene: the EAT-Lancet Commission on healthy diets from sustainable food systems, The Lancet,
16 January 2019. 177 For a lower climate footprint, vegetarian diet beats local, ScienceDaily, 23 October 2018. A new study published in
Global Food Security provides a more comprehensive accounting of the greenhouse gas emissions from EU diets.

Demographic outlook for the European Union 2020
41
and rapeseed are also linked to large-scale deforestation.178 In addition, in 2018, 65 % of all the palm oil imported into the EU was used for energy. Palm oil used for biodiesel grew by 3 % in 2018, while the use of palm oil to make food and animal feed dropped significantly, by 11 %.179
Millions of diverse producers are responsible for the environmental impact of food and there are many differences between producers. A recent research by Oxford University180 found that the environmental impact of food can vary 50-fold between producers of the same product, pointing to substantial mitigation opportunities. However, mitigation is complicated by trade-offs, multiple ways for producers to achieve low impacts, and interactions throughout the supply chain. Producers have limits on how far they can reduce impacts. Nevertheless, the same study found that the impacts of the lowest-impact animal products typically exceed those of vegetable substitutes, providing evidence for the importance of dietary change. However, comparing the carbon footprint of oat milk from producer A, soy milk from producer B and cow's milk from producers C and D is extremely complicated, as it means adding together the impacts on the total carbon footprint of all the individual stages of the production chain and lifecycle of an individual product.
One way to reduce the environmental impact of food might be for everyone to become flexitarian, diminishing the amount of animal products they eat. A strictly vegan diet is very restrictive, so a varied diet including small amount of animal products is more realistic and achievable for many people. Also, going strictly vegan demands a high level of knowledge about the nutritional needs of human beings at different ages, as well as about the nutrient content of different foods, to avoid nutritional deficiencies.181
In its latest 'Agricultural outlook' report, the Commission presents a scenario involving a possible protein shift in the EU diet, based on the assumption that EU diets change in the coming 10 years from the current situation – where 42 % of proteins comes from plants and 58 % from animal products – into a situation where the ratio would be 50/50. To achieve this, domestic consumption of animal products would have to drop by 17 % by 2030. According to the Commission, this would exert pressure on domestic meat prices, which would drop by 18 % and milk prices, which would drop by 17 % by 2030. Lower producer prices would increase the competitiveness of the EU meat sector in global markets, leading to an increase in exports and a decrease in imports. At the same time, meat, milk and livestock production would decline, also affecting feed demand.182
On a final note, farmers have been protesting lately in various parts of the EU against the low prices they get for their produce, also drawing attention to the very strict restrictions they are under with regard to health and environmental protection, while at the same time trade deals with third countries are opening EU borders to low-priced products that are not subject to the same standards. With the discussions on the future of the common agriculture policy (CAP) ongoing, agriculture Commissioner Janusz Wojciechowski has said183 that EU farmers need more support to introduce production methods that comply with high environmental, climate and animal welfare standards.
178 M. Russell, Palm oil: economic and environmental impacts, EPRS, European Parliament, February 2018. 179 Why is palm oil biodiesel bad?, Transport & Environment. 180 J. Poore and T. Nemecek, 'Reducing Food's Environmental Impacts through Producers and Consumers', Science,
Vol. 360(6392), 2018, pp. 987-992. 181 Vegans 'need to be aware of B12 deficiency risk', BBC news, 18 December 2019. 182 European Commission, EU agricultural outlook for markets and income 2019-2030, DG Agriculture and Rural
Development, 2019. 183 The 2019 EU Agricultural Outlook conference, 10-11 December 2019, Brussels.

EPRS | European Parliamentary Research Service
42
New 'farm to fork strategy' and climate emergency
In her political guidelines for the new Commission, Ursula von der Leyen declared that she would propose a 'European Green Deal', including a 'new Farm to Fork Strategy on sustainable food along the whole value chain'. This new strategy would shape EU food policy for the years to come. The mission letter to the new Commissioner for Health and Food Safety, Stella Kyriakides, puts her in charge of the new strategy, which 'should combine regulation with communication campaigns'.
According to the communication on the European Green Deal, published on 11 December 2019, the Commission will present the farm to fork strategy in spring 2020 and launch a broad stakeholder debate covering all the stages of the food chain, and paving the way for a more sustainable food policy.
The communication also states that European food should become the global standard for sustainability. The Commission acknowledges that feeding a fast-growing world population remains a challenge with current production patterns, but considers that new technologies and scientific discoveries, combined with growing public awareness and demand for sustainable food, will benefit all stakeholders.
According to the Green Deal, measures should reward farmers for improved environmental and climate performance, and the national strategic plans for agriculture will need to 'reflect an increased level of ambition' to reduce significantly the use of chemical pesticides, fertilisers and antibiotics. The Commission is committed to identifying legislative measures to bring about these reductions. It also wants the land area under organic farming to be increased in Europe, arguing that the EU needs to consider the potential role of new innovative techniques in order to improve the sustainability of the food system.
The farm to fork strategy will also contribute towards the circular economy and aim to reduce the environmental impact of the food processing and retail sectors by taking action on transport, storage, packaging and food waste. It will include measures to combat food fraud, and launch a process to identify new innovative food and feed products, such as seafood based on algae.
According to the Commission, the farm to fork strategy will strive to stimulate sustainable food consumption and promote affordable healthy food for all. The Commission insists that imported food that does not comply with EU environmental standards must not be allowed on EU markets. The Commission says it will propose action to help consumers choose healthy and sustainable diets and reduce food waste. The Commission will also explore new ways to give consumers better information, including by digital means, on questions such as where the food comes from, its nutritional value, and its environmental footprint.
The European Parliament, meanwhile, approved a resolution on 28 November 2019 declaring a climate and environmental emergency in Europe and globally. Parliament wants the Commission to ensure that all relevant legislative and budgetary proposals are fully aligned with the objective of limiting global warming to under 1.5 °C, and demands that the EU to cut emissions by 55 % by 2030, aiming to become climate neutral by 2050.
European Council adopted in its December 2019 summit conclusions endorsing the objective of making the EU climate-neutral by 2050. The Council recognised the need to put in place an enabling framework to ensure a cost-effective, as well as socially balanced and fair transition to climate neutrality, taking into account different national circumstances.
3.6. Food security in the EU The crucial issue of food security is generally raised in connection with those non-EU countries and regions where populations suffer from hunger and malnutrition. The EU population is not exempt from nutritional problems, but the main issue is the number of people who are overweight or obese. This does not mean that food security can be taken for granted in Europe however. A closer look reveals that the situation is far more complex and can be analysed from many angles: the quantities and variety of agricultural raw materials produced in the EU, the sustainability of current agricultural practices, the agri-food trade balance, demographic trends in Europe, and the responsibility of all stakeholders along the food supply chain, especially the food processing industry.

Demographic outlook for the European Union 2020
43
This section focuses on some of the terms of this complex equation. It begins by examining the concept of food security and its place in EU legislation. It then focuses on food security in the EU by analysing the two ends of the food supply chain: 1) the supply side, or the production of agricultural raw materials by a steadily declining number of European farmers and 2) the consumer side, or access by European citizens to healthy nutritional food. It asks if there sections of the population who do not have sufficient access to such food. This section ends on policy aspects, looking at the translation, at EU level, of the UN's 'zero hunger' sustainable development goal, devoted to putting an end to hunger and malnutrition, and asking whether the EU has made progress towards this goal.
3.6.1. Food security as a specific objective of the common agricultural policy According to the Food and Agriculture Organization of the United Nations (FAO), 'Food security exists when all people, at all times, have physical, social and economic access to sufficient, safe and nutritious food which meets their dietary needs and food preferences for an active and healthy life'. This definition was adopted during the 1996 World Food Summit held at FAO headquarters in Rome. The concept of food security rests on four pillars:184 the physical availability of food, economic and physical access to food, food utilisation, and stability of the other three dimensions over time.
Food availability addresses the 'supply side' of food security and is determined by the level of food production, stock levels and net trade. Access to food is related to incomes, intra-household distribution of food and markets. Utilisation is commonly understood as the way the body makes the most of various nutrients in the food.
Food security and food self-sufficiency are two different concepts.185 The concept of food self-sufficiency is generally taken to mean the extent to which a country can satisfy its food needs from its own domestic production.186 Food security may be achieved in a given country even if it is not self-sufficient in all commodities. Open trade and diversity of supply sources play an important role in food security.
Food security and the common agricultural policy The common agricultural policy (CAP) was created in 1962, at a time when post-war food shortages were still a vivid memory and Europe was a large net importer of agricultural products.187 It was necessary to take action at European level to make Europe self-sufficient in food, secure an adequate food supply and the free flow of food and agricultural products within Europe.188 The CAP was envisaged as a common policy, with the objective of providing affordable food for EU citizens and a fair standard of living for farmers.
The CAP has undergone many reforms over the years but food security remains a core objective. Article 39 of the Treaty on the Functioning of the European Union (TFEU) mentions both the availability of supplies and access by consumers.
Food security is specifically mentioned in Article 5 (General objectives) and Article 6 (Specific objectives) of the proposed regulation189 for the future 2021-2027 CAP. Recital 17 of this regulation also gives a definition of food security: 'The CAP should keep ensuring food security, which should be understood as meaning access to sufficient, safe and nutritious food at all times'.
184 More information on this topic can be found in the FAO's practical guide 'An introduction to the basic concepts of
food security'. 185 See for instance, J. Clap Food self-sufficiency: Making sense of it, and when it makes sense, Food policy, Elsevier, 2016. 186 Definition by FAO. 187 F. Heinemann, The Common Agricultural Policy and the Next EU Budget, Bertelsmann Stiftung, 2017. 188 R. Nieminen, Common Agricultural Policy, EPRS, European Parliament, 2018. 189 Proposal for a regulation of the European Parliament and of the Council establishing rules on support for strategic
plans, COM/2018/392 final.

EPRS | European Parliamentary Research Service
44
3.6.2. Overview of the EU farming sector as primary provider of food In practice, the main responsibility for food security and self-sufficiency lies with the agricultural sector.190 A particular feature of agricultural activity is the multi-faceted interaction between the environment and human activity. The capacity to produce enough agricultural raw commodities is determined by both natural conditions (soil and climate) and human factors, such as technological and scientific progress. Sustainability is key to the ability of European agriculture to keep providing a reliable supply of healthy and nutritious food to the EU population in the long term.
However the European farming sector is facing multiple challenges, including climate change (both suffering from its consequences and having to adopt more climate-friendly practices), the need to preserve the environment (reducing its negative impact on nature, soils and biodiversity), and income uncertainty, due to the globalisation of agricultural markets and the volatility of prices. Another particular challenge is the demographic situation of the farming population and the need to maintain the necessary level of workforce in agriculture in a context of ongoing structural change in the sector.
Unfavourable demographics in the EU farming sector The farming sector is facing a demographic challenge that could undermine its long-term sustainability and its capacity to carry on providing enough healthy food for EU citizens. The EU farming population has been declining continuously, in particular as a result of major structural changes over recent decades: productivity gains, specialisation and farm restructuration, leading to a loss of agricultural jobs.
Between 2000 and 2012, 4.8 million full-time jobs in EU agriculture disappeared while the average farm size was increasing.191 The share of people employed in agriculture fell from 5.7 % of total EU employment in 2005 to 4.2 % in 2016. The number of farms has been in steep decline for many years, decreasing by about one quarter between 2005 and 2016.192 The European agricultural workforce is expected to decline by a further 28 % between 2017 and 2030 as structural changes continue, with higher investments in technology.193
Another worrying trend is the ageing of farmers and the lack of generational renewal, with young farmers getting scarcer. A total of around 9.7 million people are employed in agriculture in the EU. 190 A. Baer-Nawrocka and A. Sadowski, Food security and food self-sufficiency around the world: A typology of countries,
PLoS One, 2019. 191 M. L. Augère-Granier, Supporting young farmers in the EU, EPRS, European Parliament, 2015. 192 Eurostat, Agriculture, forestry and fishery statistics, 2018 edition. 193 EU agricultural outlook, European Commission, 2017.
Article 39 (ex Article 33 of the Treaty establishing the European Community (TEC))
1. The objectives of the common agricultural policy shall be:
(a) to increase agricultural productivity by promoting technical progress and by ensuring the rational development of agricultural production and the optimum utilisation of the factors of production, in particular labour;
(b) thus to ensure a fair standard of living for the agricultural community, in particular by increasing the individual earnings of persons engaged in agriculture;
(c) to stabilise markets;
(d) to assure the availability of supplies;
(e) to ensure that supplies reach consumers at reasonable prices.
Demographic outlook for the European Union 2020
45
Nearly 60 % of farmers are 55 years old or more, while one third are 65 or older. Less than 11 % are young farmers under the age of 40 – a share even lower for female farmers (8.6 %) – and only 5.1 % are under the age of 35.194
Young farmers are particularly scarce in certain Member States such as Cyprus (3.3 %), Portugal (4.2 %) and the UK (5.3 %). Nevertheless, the youngest farmers tend to have bigger farms in terms of area, livestock and standard output than the oldest ones (over 65 years of age).
Figure 15 – Farm managers, by age group and gender, EU-28, 2016
Source: Eurostat.
A number of economic, financial and social factors are deterring young people from entering the farming sector. These include difficult access to land and credit, difficulty making a living, long hours and few holidays, many risks and uncertainties linked to markets and climate, possible social isolation, etc. Alongside the lack of attractiveness of agricultural careers specifically and rural areas more broadly for higher educated young people, another deterrent is the lack of incentives for older farmers to retire.195
The CAP seeks to address some of these factors, as it is vital to maintain a young farming population. Both pillars of the current CAP – direct payments and rural development – include financial incentives to encourage young people to go into farming. The current proposed regulation for the 2021-2027 CAP has made attracting young farmers and facilitating business development in rural areas one of its nine specific objectives.196 Complementary income support for young farmers is therefore provided for under the first pillar, and the proposal includes a rural development measure (second pillar) providing support for the installation of young farmers, which has been significantly increased compared with the current period.
Increased recourse to seasonal and migrant workers Seasonal and migrant workers play a key role in European agriculture as they respond to periodic peaks in labour demand that local workers cannot meet (for example, fruit and vegetable picking). In 2011, the share of foreign labour in the EU agricultural sector was 1.6 % for workers from EU Member States (intra-EU labour) and 2.7 % for workers from non-EU countries. By 2017, their numbers had increased by 26 % and 31 % respectively, compensating only partially for the outflow
194 Eurostat, Farmers and the agricultural labour force – statistics, 2016. 195 The EU farming employment: current challenges and future prospects, European Parliament, IPOL, Policy Department
for Structural and Cohesion Policies, 2019. 196 Proposal for a regulation of the European Parliament and of the Council establishing rules on support for strategic
plans, COM/2018/392 final.

EPRS | European Parliamentary Research Service
46
of national farm workers leaving the sector – more than 1.3 million between 2011 and 2017. The number of seasonal workers is predicted to increase further after 2020.197
3.6.3. EU agricultural production figures and self sufficiency Production of most EU agricultural commodities has risen over the last 15 years, with the exception of beef and sheep meat, and sugar. The EU is self-sufficient for most agricultural commodities, with the exception of sheep meat, sugar, maize and, to a lesser extent, beef. The self-sufficiency rate can be extremely high for export-oriented commodities, such as skimmed milk powder and whole milk powder; for most other commodities, it is in the range 100 to 125 %.198
Figure 16 – EU self-sufficiency rate for different categories of agricultural products in 2017-2018
Data source: European Commission, Directorate-General for Agriculture and Rural Development.
Overall, the EU is one of the largest producers of agricultural commodities in the world with a large trade surplus and growing self-sufficiency rates. The EU trade balance in agri-food is positive, and this has been the case since 2010. The CAP reforms and EU trade policy have helped turn the Union from a net importer to the world's largest exporter of agri-food products, ahead of the United States and Brazil. In 2018, EU agri-food exports totalled €138 billion, imports €116 billion.199
197 The EU farming employment: current challenges and future prospects, IPOL, Policy Department for Structural and
Cohesion Policies, 2019. 198 DG Agriculture and Rural Development, Production, yields and productivity, European Union, 2018. 199 Agri-food trade in 2018, European Commission, 2019.

Demographic outlook for the European Union 2020
47
Table 1 – EU agri-food trade with non-EU countries
Exports Imports Balance
EU-28 agri-food trade with non-EU countries
Agri-food trade value €137 528 m €116 310 m €21 218 m
As a share of EU-28 total trade with extra EU-28 7.0 % 5.9 %
Annual rate of change from 2008 to 2018 5.9 % 2.8 %
Data source: European Commission, Directorate-General for Agriculture and Rural Development.
Figure 17 – EU-28 exports and imports of agricultural products by category, 2018
Source: Eurostat.
In the above figure, foodstuffs consist of various types of processed goods deriving from vegetable and animal products, for example sugar, beverages, tobacco and prepared animal fodder.
3.6.4. Access to healthy and nutritious food in the EU
Not all European citizens enjoy food security As mentioned above, economic and physical access to food is the fourth pillar of food security as defined by the FAO. Food insecurity has been historically associated with the developing word. Yet, according to the FAO,200 there were 3.2 million women, 3.0 million men and a total of 8.4 million people including children in the EU who were severely food insecure201 over the 2015-2017 period. This corresponds to 1.6 % of the total EU population. These figures were obtained using the food insecurity experience scale (FieS) methodology. On the basis of eight simple questions regarding
200 FAO, Regional overview of food security and nutrition in Europe and Central Asia, 2018. 201 People experiencing severe food insecurity have typically experienced running out of food and, at worst, had to go a
day (or days) without eating.

EPRS | European Parliamentary Research Service
48
people's access to food of adequate quality and quantity, it is designed to assess the state of food security in terms of mild, moderate or severe food insecurity.202
Food insecurity is usually associated with deprivation and poverty, which currently affect a large number of EU citizens. In 2018, there were 109 million people in the EU-28 living in households at risk of poverty or social exclusion203 (according to AROPE),204 equivalent to 21.7 % of the entire population. Among this population, 29.4 million people were suffering from severe material deprivation, which is defined as the enforced inability to pay for at least four items in a list of nine items, including a meal involving meat, chicken or fish every second day. In 2017, more than a fifth of all people at risk of poverty in the EU were unable to afford a meal with meat, fish or a vegetarian equivalent every second day.205 This share ranged from 4.5 % in Ireland up to 45.8 % in Greece and 61.9 % in Bulgaria. Single-parent households are most often affected by severe material deprivation.
202 Prevalence of moderate or severe food insecurity in the population is one of the two indicators (the other being
prevalence of undernourishment) used to measure progress towards SDG 2.1 ('By 2030, end hunger and ensure access by all people, in particular the poor and people in vulnerable situations, including infants, to safe, nutritious and sufficient food all year round').
203 Eurostat, Living conditions in Europe – poverty and social exclusion, 2019. 204 At risk of poverty or social exclusion (AROPE) is the headline indicator to monitor the EU 2020 strategy poverty target
(to reduce poverty by lifting at least 20 million people out of the risk of poverty or social exclusion by 2020). 205 Eurostat, Living conditions in Europe – material deprivation and economic strain, 2019.
Special Eurobarometer 389: Europeans' attitudes towards food security, food quality and the countryside (March 2012)
In this 2012 survey, three quarters of EU citizens expressed concern at the challenge of feeding the world's population. When asked about the sufficiency of food production at EU or national level, a lower share of European citizens were concerned (40 %), while 57 % were either not very concerned or not at all concerned.
On the issue of national food security, answers varied widely between Member States. In countries such as Greece, Slovenia or Portugal, the vast majority of citizens were concerned that sufficient food was produced to meet the needs of the national population. At the other extreme, there were very low levels of concern in the Netherlands, Denmark, Sweden and Germany. Overall, in 17 out of 27 Member States, the proportion of respondents who were not concerned about food production in their own country was higher than the proportion of those who were concerned.

Demographic outlook for the European Union 2020
49
Figure 18 – Population unable to afford a meal with meat, fish, chicken or a vegetarian equivalent every second day, 2018
Source: Eurostat.
The Fund for European Aid to the Most Deprived (FEAD) Several studies206 establish a link between the 2008 financial crisis, which triggered an economic recession across the Union, and food insecurity. A rise in food bank usage has been observed in several EU countries.207 In 2018, the members of the European Food Bank Association208 redistributed 165 000 tonnes of FEAD food products.
The FEAD was created in 2014 to alleviate the worst forms of poverty such as homelessness, child poverty and food deprivation. It supports the actions of EU Member States to provide food and/or
206 For example O. Davis and B. Baumberg Geiger, 'Did Food Insecurity rise across Europe after the 2008 Crisis? An analysis
across welfare regimes', Cambridge University Press, 2016. 207 E. Garratt, Food insecurity in Europe: Who is at risk, and how successful are social benefits in protecting against food
insecurity? Cambridge University Press, 2019. 208 For more information see the European Foodbanks Federation website.

EPRS | European Parliamentary Research Service
50
basic material assistance to the most vulnerable groups in society, and to help them on the path to inclusion. Over €3.8 billion were earmarked for the FEAD for the 2014-2020 period. In addition, EU countries contribute at least 15 % in national co-financing to their national programmes.
For the 2021-2027 programming period, the European Commission has proposed to include the FEAD within the new European Social Fund ESF+.
3.6.5. Progress towards the goal of Zero hunger
In September 2015, under the United Nations 2030 Agenda for Sustainable Development, all UN Member States adopted 17 sustainable development goals (SDG). The SDGs provide a new policy framework aimed at ending all forms of poverty, fighting inequalities and tackling climate change. The EU has fully committed to delivering on the 2030 Agenda, and regularly monitors progress achieved towards the SDGs in the EU.
SDG 2 seeks to end hunger, achieve food security and improved nutrition and promote sustainable agriculture, by 2030. This comprehensive goal covers the four dimensions of food security (food availability, access, utilisation and stability) and nutrition.209
Regarding the 'zero hunger' goal, the EU focuses on monitoring progress on a) fighting malnutrition (mainly obesity), b) fostering sustainable agricultural production and c) reducing the environmental impacts of agriculture. Implementing sustainable agricultural practices can help to ensure future food security in a scenario of increasing demand and a changing climate.
Table 2 – Progress achieved towards SDG 2 in the EU is measured against a set of indicators
SDG 2 objectives Indicators
Fighting malnutrition The obesity rate
Sustainable agricultural
production
Agricultural factor income per annual work unit
Government support for agricultural research and development
Area under organic farming
Gross nitrogen balance on agricultural land
Reducing the environmental
impacts of agricultural
production
Ammonia emissions from agriculture
Nitrate in groundwater
Estimated soil erosion by water
Common farmland bird index
Data source: Eurostat.
Detailed results are presented in Eurostat's third regular report monitoring progress towards the SDGs in an EU context.210 The overall picture painted by the above indicators for SDG 2 is uneven.
Concerning malnutrition, obesity, which affects 15.2 % of the EU's adult population, has declined since 2014, but remains a big issue among socially disadvantaged groups (see also Section 3.1.)
When it comes to the sustainability of the agricultural sector, a number of economic and environmental factors are key. Results show that labour productivity in EU agriculture has increased, but investments for the future are lagging behind. Organic farming, which has sustainability benefits, is on the rise across the EU: its share in total agricultural area nearly doubled between 2005 209 UN Sustainable development goals, Goal 2: Zero hunger. 210 Eurostat, Sustainable development in the European Union — Monitoring report on progress towards the SDGs in an
EU context — 2019 edition.

Demographic outlook for the European Union 2020
51
and 2017, from 3.8 % to 7.0 %. As for the gross nitrogen balance on agricultural land, while there is a positive downward trend in the long term, figures for the short term indicate an increase from 46 kg per hectare in 2009 to 51 kg per hectare in 2015. High nitrogen levels can cause nitrate leaching (water pollution), ammonia emissions and ecosystem disruptions.
Finally, regarding the environmental impacts of agriculture, results show some worrying trends. Ammonia emissions from agriculture have been increasing since 2013 after a long period of constant decline. The EU Nitrate Directive introduced in 1991 contributed to improvements in the nitrogen balance, but in some places ground waters are heavily polluted and major efforts have still to be made. Soil erosion remains a major threat to soil health, but there are signs of improvement across the EU. Particularly worrying is the biodiversity loss caused by high agricultural productivity. Between 2001 and 2016, the EU's common farmland bird population declined by 14.8 %.

EPRS | European Parliamentary Research Service
52
4. Prospects As noted in Section 1.3 on adapting to ageing demographics, the broad demographic outlook at EU level is essentially set in the short to medium term. Fertility rates and life expectancy in the EU are unlikely to change suddenly, and even if they did, the effect would not be immediate. As has been seen in recent years, migration flows can change rapidly and dramatically. However, even at the unprecedented levels seen in some recent years, they cannot, at EU level at least, radically change demographic destiny on their own. The EU population will be slow in growing and will continue to age significantly for now, while also forming a decreasing proportion of the world population.
However, while this demographic outlook is set to be relatively stable in the shorter term, changes in fertility rates, life expectancy and migration, which may happen in the coming years, can build up over time to change the situation in the longer term. EU-level fertility rate averages have recovered a little from their mid-1990s lows, and the wide variation between Member States suggests there is nothing inherently rigid about current levels. EU average life expectancy gains have been slowing somewhat, and the 2015 data saw a (small) surprise drop in life expectancy, albeit the 2016 data show that this has already been more than recovered. How life expectancy will develop and the possible causes underpinning this will continue to be debated and informed by new research and data. Indeed, the latest data for 2017 again shows a small drop in life expectancy, so the debate remains lively. Developments in migration are also, by their nature, rather uncertain. With an ageing EU and significant population growth in the form of a 'youth bulge' expected in some other parts of the world, notably Africa, the potential for substantial migration inflows nevertheless clearly remains.
At sub-EU level, free movement and external migration are also influencing demography at Member State and regional level. This affects both the size of the populations in countries and regions, and their age profiles, for instance, as younger people move to more economically dynamic areas for work. These interact with the differing patterns of fertility and life expectancy across the EU.
Looking at the impact of food on demography, two opposing trends are observed at global and EU levels. At global level challenges mostly relate to the lack of adequate food reducing life expectancy. Possible solutions include reducing fertility rates by means of female empowerment and education; achieving progress in agriculture; changing eating patterns (such as moving away from animal based protein); improving food distribution and reducing waste; and reducing the number of military and political conflicts.
At EU level problems relate to unhealthy diets leading to health conditions such as obesity, type 2 diabetes and cardiovascular diseases, which are contributing to a slight decrease in life expectancy, despite the generally high rates in the EU-28 compared with the rest of the world. Possible solutions include awareness-raising from early childhood (for instance through school programmes), the promotion of physical activity, improved food safety by tackling food fraud or implementing better labelling schemes, and efforts to explore new, innovative food systems.

Demographic outlook for the European Union 2020
53
5. Main referencesBureau J.-C. and J. Swinnen, EU Policies and Global Food Security, LICOS Discussion Paper Series, Discussion Paper 392/2017. European Commission, Joint Research Centre, Many more to come? Migration from and within Africa, 2018, pp. 28-29. European Commission, EU agricultural outlook for markets and income 2019-2030, DG Agriculture and Rural Development, 2019. Eurostat, Regional Yearbook 2019, Chapter 2 'Population'. Eurostat, Sustainable development in the European Union – Monitoring report on progress towards the SDGs in an EU context – 2019 edition, Publications Office of the European Union, 2019. European Environment Agency (EEA), Food in a green light, EEA report No 16/2017. FAO, The State of Food Security and Nutrition in the World 2017. FAO, Regional overview of food security and nutrition in Europe and Central Asia, 2018. FAO, The Linkages between Migration, Agriculture, Food Security and Rural Development, Rome, 2018. Laborde D., Bizikova L., Lallemant T. and Smaller C., What Is the Link Between Hunger and Migration?, International Institute for Sustainable Development (IISD) and International Food Policy Research Institute (IFPRI), 2017. Lutz W., Goujon A., Kc S., Stonawski M. and Stilianakis N., Demographic and Human Capital Scenarios for the 21st Century: 2018 assessment for 201 countries, EU Science Hub, 2018. Sadiddin A., Cattaneo A., Cirillo M. and Miller M., Food insecurity as a determinant of international migration: evidence from Sub-Saharan Africa, Food Security, Volume 11(3), June 2019. The 2018 Ageing Report: Economic and Budgetary Projections for the EU Member States (2016-2070) and earlier iterations of the Ageing Report from 2009, 2012 and 2015, European Commission, jointly with the Economic Policy Committee. The EU farming employment: current challenges and future prospects, Policy Department for Structural and Cohesion Policies, European Parliament, 2019. World Population Prospects: The 2019 Revision, UN Population Division, 2019.

Demography matters. The economy and the labour market, but also social protection, intergenerational fairness and healthcare, the environment, food and nutrition are all driven by demography. The population of EU countries has grown substantially – by around a quarter since 1960 – and currently it stands at almost 450 million. The numbers are now beginning to stagnate however and are expected to decline from around the middle of the century. With the world population having risen still more substantially and growth continuing, the EU represents a shrinking proportion of the global population. The EU population is also ageing dramatically, as life expectancy increases and fertility rates fall below past levels. This has serious implications across a range of areas including the economy, healthcare and pensions. Free movement within the EU and migration from third countries also play an important role in shaping demography in individual Member States and regions. The 'in-focus' section of this year's edition of the demographic outlook examines food and nutrition-related demographic challenges. It shows that, even if improving food quality and healthier eating habits lead to higher life expectancy, the EU still has to tackle the harmful consequences and prevent the causes of diet-related chronic conditions, such as obesity, diabetes and cardiovascular disease.
This paper is the third in a series produced by EPRS on the demographic outlook for the European Union.
This is a publication of the Members' Research Service EPRS | European Parliamentary Research Service
This document is prepared for, and addressed to, the Members and staff of the European Parliament as background material to assist them in their parliamentary work. The content of
the document is the sole responsibility of its author(s) and any opinions expressed herein should not be taken to represent an official position of the Parliament.
PE 646.181 ISBN 978-92-846-6344-6 doi:10.2861/999213
QA
-03-20-110-EN-N


![Proposals to Extend Healthy Life Expectancy in Shizuoka ...€¦ · [Gap between life expectancy and healthy life expectancy in Shizuoka Prefecture] Healthy life expectancy *Source:](https://img.dokumen.tips/doc/110x75/5f427921a09c2479a15262fb/proposals-to-extend-healthy-life-expectancy-in-shizuoka-gap-between-life-expectancy.jpg)