Embed Size (px)
Citation preview

Demographic Change: Why understanding population
matters
Dr Helen FeistAustralian Population and Migration
Research Centre,
School of Social Sciences
University of Adelaide
Outline of the Presentation
• Why understanding demography is important
• Key Dimensions of Population Change• Three dimensions of population change
- Growth- Ageing- Migration
• Implications of population change on communities and society

Why Demography?
• Populations are constantly changing –dynamic
• Population change is usually gradual rather than sudden
• Much of the change is predictable• There have been massive improvements in
the comprehensiveness, spatial referencing, timeliness and accessibility of population data

How Can Demography Help?• Ability to profile communities by different
criteria in a timely way
• Enables better planning
• Precise targeting of support services
• Greatly improved availability of small area data
- mesh blocks- mapping capacity- census

Key Dimensions of Population
• Size, growth – mortality, fertility and migration
• Composition – age, ethnicity
• Distribution – urban/rural, internal and international migration

Characterising Australia’s Population
• One of the fastest growing in the world (grew by 1.7% p.a. 2011-12)
• One of the most multicultural populations (73.9% of the overseas-born speak a language other than English at home in 2011) and 46% identify as a first or second generation migrant
• One of the most urbanised and spatially concentrated (88.9% live in urban areas in 2011)
• One of the most mobile (41.7% changed their place of residence in 2006-11)

3 Key Elements of SA’s Population
Life Impact | University of Adelaide
• Population Growth
• Our Ageing Population
• Migration as Population Change

Australia and South Australia: Rate of Population Growth per Annum, 1947-2011
0.0
0.5
1.0
1.5
2.0
2.5
3.0
3.5
4.01
94
7
19
51
19
55
19
59
19
63
19
67
19
71
19
75
19
79
19
83
19
87
19
91
19
95
19
99
20
03
20
07
20
11
Pe
rce
nt
Year
South Australia
Australia

Processes of Population Growth
• Mortality
• Fertility
• Migration

Australia: Expectation of Life at Birth, 1870-2011
Source: Hugo 1986 and ABS Deaths Bulletins
Expectation of Life at Birth
Males Females
1947 66.1 70.6
1981 71.4 78.4
2011 79.7 84.2

Australia: Expectation of Life at age 50, 1901-1910, 1970-1972 and 2011
Source: ABS
Year Males Females
1901-1910 21.2 23.7
1970-1972 23.2 28.3
2011 32.0 35.6

South Australia: Total Fertility Rate,
1845-2011Source: Hugo 1983, CBCS Demography Bulletin and ABS Births Australia, various issues

South Australia2012 COMPONENTS OF GROWTH
Births 20,434
Deaths 13,177
Natural Increase 7,257
Net Overseas Migration 11,696
Net Interstate Migration -3,345
Population Increase 0.95%

Projected Total Population Projected Average Annual Growth Rates
2011 2021 Change 2011-2021
2006-2011 2011-2021
SOUTH AUSTRALIA 1663477 1852372 188895 1.3 1.1
Greater Adelaide 1284354 1443779 159425 1.4 1.2
Rest of State 379123 408593 29470 1.0 0.8
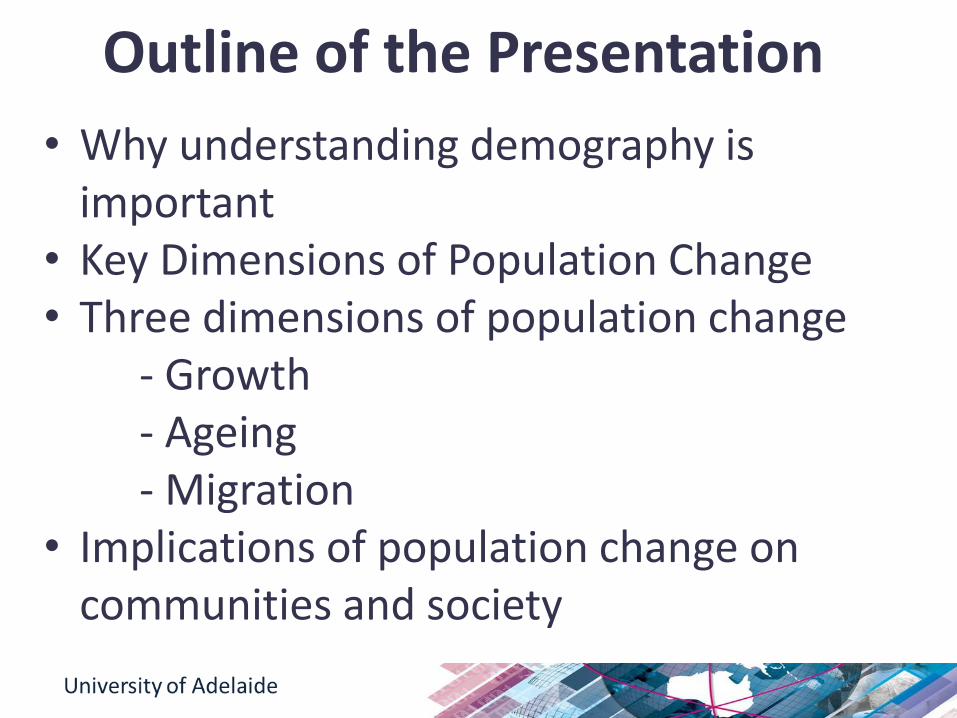
Projected Population Growth for SA
Projected Percent Change 2011 - 2021 by Age – Greater Adelaide Capital City Area
and Rest of State
-10
0
10
20
30
40
50
0-14 15-24 25-44 45-64 65-79 80+ TOTAL
Pro
ject
ed
Pe
rce
nta
ge G
row
th
Age
Adelaide Greater Capital City Area
Rest of State

South Australia: Age-Sex Distribution, 1981 and 2011
80000 60000 40000 20000 0 20000 40000 60000 80000
0-4
5-9
10-14
15-19
20-24
25-29
30-34
35-39
40-44
45-49
50-54
55-59
60-64
65-69
70-74
75-79
80-84
85+
Number
Age
1981 (shaded) and 2011
Males Females

LGAs with Highest % of the Population Aged 45-64, 65-79 and 80+ years, 2011
45-64 years 65-79 years 80+ years
LGA % LGA % LGA %
Yankalilla 35.1 Victor Harbor 24.2 Victor Harbor 10.5
Mid Murray 35.0 Yorke Peninsula 20.7 Orroroo/Carrieton 9.0
Kangaroo Island 35.0 Yankalilla 19.2 Holdfast Bay 8.8
Mount Remarkable 34.8 Peterborough 18.8 Walkerville 7.8
Karoonda East Murray
34.2 Barunga West 18.4 Barunga West 7.6
Orroroo/Carrieton 33.9 Copper Coast 18.3 Yorke Peninsula 7.2
Elliston 33.3 Alexandrina 18.0 Burnside 7.1
Barunga West 33.3 Coober Pedy 18.0 Norw. P'ham St Ptrs 6.8
Peterborough 32.7 Tumby Bay 17.6 Unley 6.8
Yorke Peninsula 32.4 Kingston 17.4 Kimba 6.8
South Australia 26.6 South Australia 11.3 South Australia 4.9

Net Internal Mobility: Top and Bottom Five Internal Migrant Receiving LGAs 2006-2011 by
Age 15-24 and 60+Age 15-24 Age 60+
Top Five LGAs
Adelaide 1371 Alexandrina 1017
West Torrens 1084 Victor Harbor 781
Playford 992 Copper Coast 372
Charles Sturt 754 Gawler 322
Norwood/Payneham/St Peters 603 Barossa 309
Bottom Five LGAs
Wattle Range -330 Marion -436
Loxton Waikerie -335 Adelaide Hills -488
Adelaide Hills -672 Pt Adelaide/ Enfield -492
Onkaparinga -740 Mitcham -511
Tea Tree Gully -957 Tea Tree Gully -624

Volunteering Rates by Age, Greater Adelaide, Rest of SA and South Australia, 2011
0.0
5.0
10.0
15.0
20.0
25.0
30.0
35.0
15-19 20-24 25-29 30-34 35-39 40-44 45 - 64 65 - 79 80+
Pe
rce
nt
Vo
lun
tee
r
Age
Greater Adelaide
Rest of SA
South Australia

Rates of Providing and Receiving Unpaid Assistance, 2011
PROVIDE ASSISTANCE % 80+ % 65-79 % 45-64
Greater Adelaide 6.8 12.8 18.0
Rest of SA 6.6 11.4 16.3
Total SA 6.8 12.4 17.5
TOTAL AUSTRALIA 6.9 12.1 16.1
RECEIVE ASSISTANCE % 80+ % 65-79 % 45-64
Greater Adelaide 38.1 10.4 4.5
Rest of SA 34.9 9.5 5.1
Total SA 37.4 10.2 4.6
TOTAL AUSTRALIA 36.6 10.6 4.2

Changing Demography of Ageing in SA
• Number aged 65 and over will increase by 66.8% by 2031
• Percentage aged 65+ will increase from 16.1 to 22.6
• The characteristics of the older population will change
• The spatial distribution will change

Indicators of Australian Diversity, 2011Source: ABS, 2011 Census
Indicator Percent
Born overseas 26.1
Born overseas in CALD country 16.6
Australia-born with an overseas-born parent 18.8
Speaks language other than English at home 19.2
Ancestry (multi response) in a CALD country (2006) 26.0
Non-Christian religion 22.3
Indigenous Population 2.6
No. of birthplace groups with 10,000 + 67
No. of birthplace groups with 1,000 + 133
No. of indigenous persons 548,369

Australia: Settler Arrivals by Region of Last Residence, 1947-2012
Source: DIMIA, Australian Immigration: Consolidated Statistics; DIAC, Immigration Update, various issues; DIAC, unpublished data
0
50,000
100,000
150,000
200,000
250,000
300,000
*194
5-47
1949
-50
1952
-53
1955
-56
1958
-59
1961
-62
1964
-65
1967
-68
1970
-71
1973
-74
1976
-77
1979
-80
1982
-83
1985
-86
1988
-89
1991
-92
1994
-95
1997
-98
2000
-01
2003
-04
2006
-07
2009
-10
Num
ber
Year
UK and Ireland Other Europe Africa Americas NZ and Pacif ic Middle East Asia
*July 1945 to June 1947
Note: Data from 2006-7 onwards are by region of birth

Indicators of Multicultural Diversity, Australia and South Australia: 2011 Census
South
AustraliaAustralia
% born overseas 23.2 26.1
% non-English-Speaking overseas-born 13.3 16.7
% mainly English-Speaking overseas-born 9.9 9.4
% speaking language other than English at home 15.0 19.2
% born in Asia 6.1 8.6
% born in Sub-Saharan Africa 0.9 1.3
% born in Europe 13.6 10.5
% Australia-born with overseas-born parent 18.8 18.8
% overseas-born not able to speak English at all or
well9.1 9.8
% with a non-Christian religion 5.3 7.9
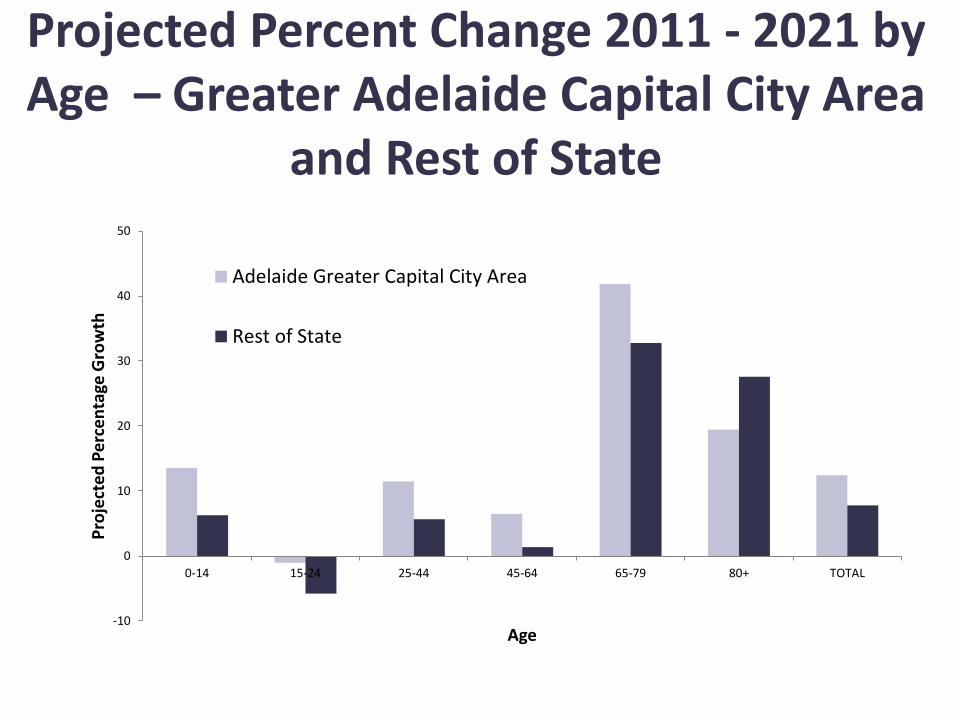
South Australia: Birthplace of the Population, 1991-2011
Birthplace 1991 2011 % Growth p.a.
Australia 1,065,284 1,170,790 0.47
UK-Ireland 145,872 125,273 -0.76
Other Europe 106,196 82,643 -1.25
Asia 32,761 92,512 5.33
Africa and the Middle East 8,433 25,646 5.72
Oceania 12,123 15,407 1.21
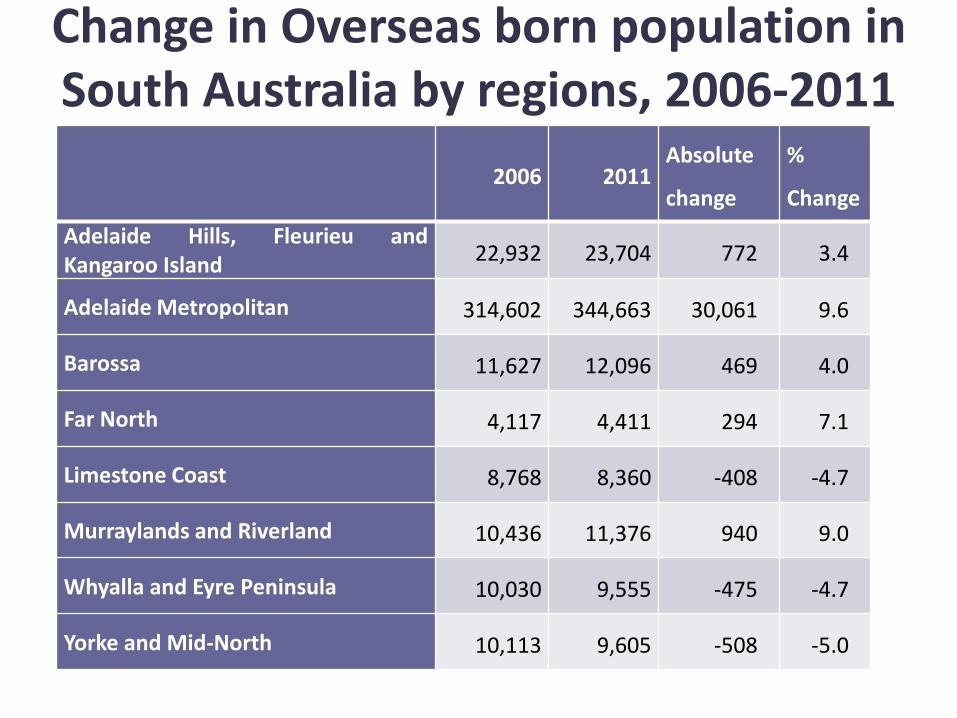
Change in Overseas born population in South Australia by regions, 2006-2011
2006 2011Absolute
change
%
Change
Adelaide Hills, Fleurieu andKangaroo Island 22,932 23,704 772 3.4
Adelaide Metropolitan 314,602 344,663 30,061 9.6
Barossa 11,627 12,096 469 4.0
Far North 4,117 4,411 294 7.1
Limestone Coast 8,768 8,360 -408 -4.7
Murraylands and Riverland 10,436 11,376 940 9.0
Whyalla and Eyre Peninsula 10,030 9,555 -475 -4.7
Yorke and Mid-North 10,113 9,605 -508 -5.0

South Australia Top 10 Countries of Birth for New Arrivals 2006 & 2011
Top 10 Country of birth 2006 No. Top 10 Country of birth 2011 No.
England 6708 India 13246
China (excludes SARs and Taiwan Province) 4570 England 10268
India 3539China (excludes SARs and Taiwan) 9884
Malaysia 2071 Philippines 3633
South Africa 1871 Malaysia 2850
New Zealand 1726 South Africa 2447
Sudan 1245 New Zealand 2238
Korea, Republic of (South) 1135 Afghanistan 2031
Philippines 1134 Korea, Republic of (South) 1899
Afghanistan 1007 Vietnam 1716

Mainly Non English Speaking Countries
Top 10 Metro LGAs No. Top 10 Non Metro LGAs No.
Port Adelaide Enfield 26835 Whyalla 1432
Salisbury 23376 Mount Gambier 1391
Charles Sturt 22018 Murray Bridge 1385
West Torrens 12941 Mount Barker 1308
Campbelltown 12791 Alexandrina 963
Marion 11728 Renmark Paringa 927
Onkaparinga 10686 Berri and Barmera 785
Tea Tree Gully 9953 Barossa 672
Mitcham 7829 Port Pirie City and Dists 632
Burnside 7628 Victor Harbor 582

Implications for Local Community
The most important resource of any community is its residents and knowing about
their changing size, composition and distribution. How or why they are changing is absolutely fundamental to good governance
and good planning at the local level.

Population Composition
Four main trends:
• Ageing
• Changing housing and household structures
• Patterns of ethnicity
• Socio-economic differences

Spatial Distribution
• For the Greater Adelaide Area
• For Non-Metropolitan SA
• The role of climate
• Shifting economies

Conclusion
Planning, infrastructure and efficient and equitable provision of services requires precise, accurate, timely and relevant information about the people needing
those services