Embed Size (px)
Citation preview

J. G. Daugman and C. J. Downing Vol. 12, No. 4/April 1995 /J. Opt. Soc. Am. A 641
Demodulation, predictive coding, and spatial vision
John G. Daugman and Cathryn J. Downing
The Computer Laboratory, University of Cambridge, Pembroke Street, Cambridge CB2 3QG, England
Received February 9, 1994; revised manuscript received November 7, 1994; accepted November 8, 1994
We argue that some aspects of human spatial vision, particularly for textured patterns and scenes, can bedescribed in terms of demodulation and predictive coding. Such nonlinear processes encode a pattern intolocal phasors that represent it completely as a modulation, in phase and amplitude, of a prediction associatedwith the image structure in some region by its predominant undulation(s). The demodulation representationof a pattern is an anisotropic, second-order form of predictive coding, and it offers a particularly efficientway to analyze and encode textures, as it identifies and exploits their underlying redundancies. In addition,self-consistent domains of redundancy in image structure provide a basis for image segmentation. We firstprovide an algorithm for computing the three elements of a complete demodulation transform of any image, andwe illustrate such decompositions for both natural and synthetic images. We then present psychophysicalevidence from spatial masking experiments, as well as illustrations of perceptual organization, that suggest apossible role for such underlying representations in human vision. In psychophysical experiments employingmasks with more than two oriented Fourier components, we find that peaks of threshold elevation occur atlocations in the Fourier plane remote from the orientations and frequencies of the actual mask components.Rather, as would occur from demodulation, these peaks in the frequency plane are related to the vectordifference frequencies between the actual masking components and their spectral centers of mass. We offera neural interpretation of demodulation coding, and finally we demonstrate a practical application of thisprocess in a system for automatic visual recognition of personal identity by demodulation of a facial feature.
1. INTRODUCTION
The notions of modulation and demodulation play im-portant roles in the theories of information, communi-cation, prediction, signal processing, coding, and datacompression.1 – 5 A pattern can be encoded for purposesof communication or storage by appropriate modulation ofa parameter of a carrier signal, and from this the originalpattern can subsequently be decoded or recovered througha process of demodulation. Familiar examples of sinus-oidal carrier parameters that are commonly modulatedand demodulated for constructing such codes include am-plitude modulation (AM), phase modulation (PM), andfrequency modulation (FM). Under certain conditionsthese encoding operations are information preserving(invertible) while at the same time removing possibleredundancies in the encoded signal, thereby reducing thebandwidth required for its communication; in addition,one can simultaneously encode many different signalsin the same medium by modulating them into separatechannels. The direct relationship between a signal’s in-formation density, or bit rate, and the minimum modula-tion bandwidth required for its encoding is made explicitin the theory of information.1 – 4 Closely related to theidea of redundancy reduction is the concept of predictivecoding,3,6 in which a signal is encoded by its deviationsfrom some prediction, such as its recent average value.
These notions have currency in vision research, both be-cause of well-known evidence for spatial frequency selec-tivity in early visual coding and because some phenomenaof perceptual organization reveal the extraction of modu-lation patterns. In addition, psychophysical probes fornonlinearities in spatial vision sometimes find evidenceof distortion products in the perception of multicompo-nent gratings; such observations could arise equally well
0740-3232/95/040641-20$06.00
from processes that demodulate7 those stimuli. Finally,the concept of predictive coding in spatial vision has beendiscussed8 as an interpretation of retinal inhibitory in-teractions: a balanced center–surround receptive fieldprofile that integrates to zero (no dc response) can be de-scribed as a first-order predictive coder, because it canonly signal contrast excursions from the spatial mean lu-minance level. By generalizing the notion of predictivecoding to a second-order form, in which the prediction isno longer just a constant luminance level but rather aparticular orientation and scale of variation (undulation)in image structure, it becomes possible to unify and ap-ply these several ideas to the perception and coding oftextures, patterns with several Fourier components, andnatural scenes.
An influential psychophysical paradigm for investigat-ing nonlinearities in spatial vision began two decadesago with seminal papers on beat frequencies by Burton9
and by Henning et al.,10 having ultimate roots in thenineteenth-century work of Seebeck11 on the auditorymissing fundamental. In 1841 Seebeck described the pe-riodicity pitch heard in a complex waveform at its repe-tition frequency, despite the absence of spectral energyin the waveform at or anywhere near this frequency;for example, the combination of 800, 1000, and 1200 Hzis usually perceived as having a pitch corresponding to200 Hz, its missing fundamental, thereby challenging au-ditory theories of pitch perception based on frequencyanalysis. Similarly, combining one-dimensional (1D) vi-sual sine-wave gratings whose spatial frequencies are 8,10, and 12 cycles per degree (cpd) produces both a per-cept and a masking effect at the beat or repetition fre-quency of 2 cpd; Henning et al.10 interpreted this in termsof filter interactions, whereas others (following Burton9)have favored theories of nonlinear distortion products.
1995 Optical Society of America

642 J. Opt. Soc. Am. A/Vol. 12, No. 4 /April 1995 J. G. Daugman and C. J. Downing
Much subsequent work has pursued this AM experimen-tal paradigm,12 – 16 but regrettably almost always with 1Dspatial frequency concepts and signals, thus greatly lim-iting both the richness and the relevance of the researchfor spatial vision. Moreover, this work for the most parthas focused narrowly on evaluating the hypothesis thatpolynomial (quadratic) point nonlinearities create distor-tion products, while it ignores larger and more interestingquestions about the possible general role of demodulationin visual perception.
An approach to image analysis, coding, classification,compression, and modeling will be introduced here thatis based on predictive coding of patterns in terms of pha-sors representing excursions of amplitude and phase fromthe locally predominant second-order image correlation(undulation). The predictive component of this demodu-lation process expresses the predominant frequency andorientation of second-order image correlation. The imagecode then takes the form of a complex phasor function overthe space domain that specifies the locally varying AMand PM of the carrier prediction that would be requiredfor it to generate the pattern fully. These three elementsprovide a complete and invertible representation for anyimage, and therefore they can regarded as constitutingits demodulation transform. A trade-off exists betweenthe complexity of the prediction and the complexity of thedemodulation phasor, so that for complicated images itmay be appropriate to combine multiple predictive carri-ers; however, in the present work we will use only mono-chromatic (i.e., single orientation and spatial frequency)predictive carriers. Although natural images do not gen-erally arise purely from modulation processes, we showthat for purposes of analysis, coding, and even recogni-tion they can sometimes be usefully regarded (throughsolution of an inverse problem) as though they did.
2. ANALYZING PATTERNS BYAMPLITUDE AND PHASE DEMODULATIONIt is instructive and perhaps surprising to realize that anypattern can be represented as the modulation of a singlecarrier wave by a complex phasor that specifies over thespace domain its amplitude modulation and phase modu-lation (AMPM). In the case of spectrally concentratedpatterns such as textures, the AMPM representation typi-cally has much lower complexity than the original imageitself, yielding a compact and efficient description of thepattern. Intuitively, the reason this claim does not vio-late information theory is that the local quasi-periodicitythat is characteristic of textures is an intrinsic second-order redundancy, expressed as locally preferred scalesand directions of undulation. Once such characteristicundulations are extracted and exploited as a predictionin the form of one (or more) carriers, then the remain-ing structure of the texture is captured and described bymuch more slowly varying components that modulate thatprediction in amplitude and phase. We propose that, inaddition to having practical applications in image codingand pattern recognition, such compact predictive repre-sentations seem to underlie some aspects of human per-ceptual organization for textured patterns.
An AMPM representation must not be confused withthe familiar amplitude spectrum and phase spectrum,
which are specified as functions of frequency in the two-dimensional (2D) Fourier domain and which represent the2D Fourier transform. Rather, we are concerned herewith deriving amplitude- and phase-controlling functionsover the space domain that modulate a derived carrierwave so as to represent some given pattern and thereby toencode it. We refer to the derivation of these three com-ponents as the process of demodulating the pattern. Thepresent approach should also not be confused with sim-ply convolving (filtering) the pattern with both the realand the imaginary parts of complex quadrature bandpassfilters and then converting the resulting pair of imagesinto polar phasor form as amplitude and phase functionsof space. That approach leads not to a complete imagerepresentation but rather to a specific bandpass one, al-though it has been shown to be useful for texture-basedimage segmentation and classification.17 – 20 At the mostabstract level, that filtering or passband energy approachis based on the duals21 of convolution and multiplication,whereas the present approach is based on the duals ofmodulation and shifting.
Given some arbitrary spatial stimulus pattern of im-age intensities Ssx, yd, our goal is to find a carrier waveCsx, yd together with its complex modulation phasorZsx, yd such that when Zsx, yd modulates Csx, yd, theircomplex modulation product represents the stimuluspattern completely. We show that interesting and non-trivial forms of such decompositions exist, and we claimthat, particularly in the case of textures, such represen-tations reduce redundancy and also serve further goals inperceptual organization and image interpretation. Themodulation phasor Zsx, yd specifies in complex polar formboth the carrier’s required amplitude modulation Asx, ydand its required phase modulation fsx, yd over the imagedomain
Zsx, yd Asx, ydexpfifsx, ydg (1)
such that the complex modulation product Zsx, ydCsx, ydexpresses the original pattern Ssx, yd. hWe exclude, ofcourse, the trivial solution Csx, yd 1, fsx, yd 0, andAsx, yd Ssx, yd, and also the trivial solution Csx, yd expfismcx 1 ncydg and Zsx, yd expf2ismcx 1 ncydgSsx, yd, neither of which entails any image projectioninto phase variation. The latter of these two solutionsonly shifts the negative frequencies within Ssx, yd higherin absolute terms, as the price for shifting its positive fre-quencies lower by the same amount, and this very simpleuse of the shift theorem accomplishes nothing useful.j
In order to illustrate the operation of the demodula-tion transform, Fig. 1 shows the three derived modula-tion components Csx, yd, Asx, yd, and fsx, yd in the caseof a particular synthetic texture together with its recon-struction from them. We now present the demodulationalgorithm for deriving these three components of a com-plete AMPM representation for any pattern.
A. Demodulation Transform Algorithm1. Express the original pattern Ssx, yd in terms of a 2DFourier series expansion
Ssx, yd NP
k2Nak expfisukx 1 nkydg (2)

J. G. Daugman and C. J. Downing Vol. 12, No. 4/April 1995 /J. Opt. Soc. Am. A 643
Fig. 1. Illustration of the demodulation transform for a syn-thetic six-component texture and its reconstruction from thetransform’s AM and PM parts.
having any required number 2N of paired conjugate 2Dfrequency components smk, nkd s2m2k, 2n2kd and theirassociated complex coefficients ak ak 1 bki, with a0 0.As Ssx, yd is an image and is therefore real, its complexexpansion coefficients ak are conjugate symmetric: ak a2k
p. For convenience, we specify that all values of thearbitrary labeling index k sharing the same sign s1/2dalways refer to components in the same half of the Fourierplane. It will be useful to denote the magnitude of eachcoefficient as kakk
pak
2 1 bk2 and its phase as uk
tan21sbkyakd, so that in polar form ak kakkexpsiukd.2. Use this expansion to compute the 2D coordinates
of the spectral center of mass smc, ncd of the stimuluspattern (regarding magnitude as mass) over the Fourierhalf-plane:
mc
NPk1
kakkmk
NPk1
kakk
, (3)
mc
NPk1
kakknk
NPk1
knkk
. (4)
(Such a spectral center of mass need not represent anyfrequency component actually present in the pattern, asis illustrated by the punctate spectral cluster in Fig. 1.)More than one such gravitational center can be chosenwhen appropriate, but for simplicity here we deal with asingle, spectrally monochromatic center.
3. Specify one (or more) 2D Fourier component(s) tobe the predictive carrier wave Csx, yd:
Csx, yd expfismcx 1 ncydg , (5)
using the gravitational center-of-mass frequency smc, ncdcomputed over the half-plane in Step 2. Although it isnot strictly necessary to do so, one obtains the simplestand most compact AMPM description by selecting a car-rier frequency at, or near, the spectral center of mass.(Again, generalization to multiple carriers, when appro-priate, is straightforward.)
4. Compute this carrier wave’s associated AMPM com-plex modulation phasor Zsx, yd by replacing each vectorfrequency smk, nkd in the half-plane expansion of Ssx, ydby the vector difference frequency sDmk, Dnkd between it-self and the carrier frequency smc, ncd:
Zsx, yd NP
k1ak expfisDmkx 1 Dnkydg , (6)
where Dmk mk 2 mc and Dnk nk 2 nc. As a conse-quence it should be noted that
Zsx, ydCsx, yd
(NP
k1ak expfisDmkx 1 Dnkydg
)3 expfismcx 1 ncydg
NP
k1ak expfismkx 1 nkydg , (7)
and as for the other half of the series,
Zpsx, ydCpsx, yd
(NP
k1ak
p expf2isDmkx 1 Dnkydg
)3 expf2ismcx 1 ncydg
NP
k1ak
p expf2ismkx 1 nkydg
21P
k2Nak expfismkx 1 nkydg , (8)
where the last step exploits the relations of conjugatesymmetry among the coefficients of 2D frequency compo-nents as noted in Step 1. This particular simplificationis a direct result of the fact that images are real, ratherthan complex, functions. The redundancy of Hermitian(conjugate) symmetry in the Fourier expansion of a realfunction allows both the positive and the negative fre-quency components to have their centers of mass shiftedto zero in the demodulation representation, rather thanreducing one set of frequencies and increasing the otherset, as would occur from mere application of the shift theo-rem. As Zsx, yd as defined in Eq. (6) contains only vectordifference frequencies from the half-plane (as specified bypositive values for index k), it inherently has less com-plexity, or more slowly varying structure, than does theoriginal pattern Ssx, yd.
644 J. Opt. Soc. Am. A/Vol. 12, No. 4 /April 1995 J. G. Daugman and C. J. Downing
It is clear by comparing Eqs. (2), (7), and (8) that theoriginal pattern Ssx, yd has been decomposed without lossinto a predictive carrier wave Csx, yd and its correspond-ing modulation phasor Zsx, yd:
Ssx, yd Zsx, ydCsx, yd 1 Zpsx, ydCpsx, yd , (9)
which may alternatively be expressed as
Ssx, yd 2 RefZsx, ydCsx, ydg . (10)
5. By expressing the modulation phasor Zsx, yd in po-lar form, project out its AM component Asx, yd and itsPM component fsx, yd:
Zsx, yd Asx, ydexpfifsx, ydg , (11)
where
Asx, yd
("NP
k1kakkcossDmkx 1 Dnky 1 ukd
# 2
1
"NP
k1kakksinsDmkx 1 Dnky 1 ukd
# 2)1/2
, (12)
fsx, yd tan21
2666664NP
k1kakksinsDmkx 1 Dnky 1 ukd
NPk1
kakkcossDmkx 1 Dnky 1 ukd
3777775 . (13)
It is noteworthy that the AM component Asx, yd is actu-ally independent of the chosen carrier frequency smc, ncd.By using trigonometric identities to combine terms inbinomial expansions of the quantities within Eq. (12) itmay be shown that Asx, yd can also be expressed just interms of all the vector difference frequencies among allthe components of Ssx, yd in the half-plane:
Asx, yd
(NP
m1
NPn1
kamkkankcosfsmm 2 mndx
1 snm 2 nndy 1 sum 2 undg
)1/2
. (14)
This expression is computationally less useful thanEq. (12) because its complexity is quadratic rather thanlinear in the number of expansion terms sN2 versus2Nd. However, it establishes the fact that the demodu-lation phasor’s AM component Asx, yd depends only onthe input image Ssx, yd and not on the choice of carrierfrequency for demodulating it. This reiterates an impor-tant difference between our demodulation approach andthe method of simply convolving an image with a particu-lar complex-valued bandpass filter and then resolving itscomplex output into amplitude and phase components.That method yields different AM functions for each chosenfilter, frequency, and orientation, whereas the present de-modulation approach yields a single (filter-independent)AM function that describes the pattern.
We have seen that any pattern Ssx, yd can be repre-sented completely in terms of a redundancy-reducing pre-dictive carrier Csx, yd, modulated in amplitude and phase.
The explicit computation of the carrier’s AMPM phasorcomponents Asx, yd and fsx, yd over the image, as de-fined in Eqs. (12) and (13), composes a demodulation rep-resentation of the original pattern. One could executethe same algorithm by employing more than one decorre-lating carrier, simply by breaking up the original Fourierseries in Eq. (2) into two or more separate series, eachcomprising the frequency terms nearest one of the carri-ers, or into quadrants or sectors of the Fourier plane, asappropriate. (In the illustrations presented in this pa-per, only one carrier is employed for each image.) Ofcourse, one can also carry out the steps outlined aboveacross the image on a region-by-region basis, rather thanglobally across the entire image, in order to select differ-ent regional carriers adaptively as the best predictors ofthe prevalent local image structure.
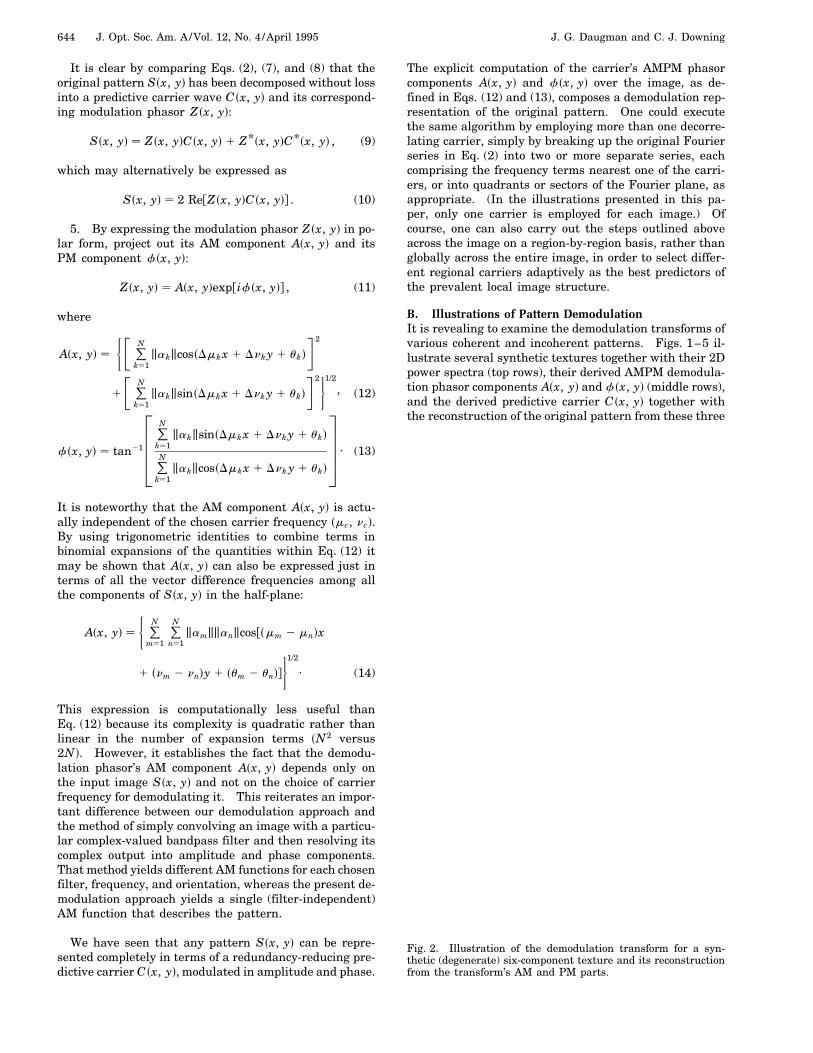
B. Illustrations of Pattern DemodulationIt is revealing to examine the demodulation transforms ofvarious coherent and incoherent patterns. Figs. 1–5 il-lustrate several synthetic textures together with their 2Dpower spectra (top rows), their derived AMPM demodula-tion phasor components Asx, yd and fsx, yd (middle rows),and the derived predictive carrier Csx, yd together withthe reconstruction of the original pattern from these three
Fig. 2. Illustration of the demodulation transform for a syn-thetic (degenerate) six-component texture and its reconstructionfrom the transform’s AM and PM parts.

J. G. Daugman and C. J. Downing Vol. 12, No. 4/April 1995 /J. Opt. Soc. Am. A 645
Fig. 3. Illustration of the demodulation transform for a syn-thetic five-component texture and its reconstruction from thetransform’s AM and PM parts.
components (bottom rows). The same format will applyto all such six-panel figures in this paper. The 2D powerspectra in the top-right corners are included only for inter-est; the mean luminance or zero frequency component ofeach texture has been omitted from the coordinate originof the spectral plots.
Because the demodulation phasor AM componentAsx, yd is made up only of vector difference frequen-cies in the Fourier half-plane, as specified in Eq. (12),it always inherently has lower spatial frequency struc-ture than the original pattern Ssx, yd. For patterns suchas textures that are spectrally concentrated (i.e., whoseoverall bandwidths are rather narrow), the vector dif-ference frequencies that define Asx, yd can become verylow indeed, as may be seen from Figs. 1–3. The de-modulation phasor PM component fsx, yd is also definedonly in terms of vector difference frequencies in Eq. (13),but it generally creates a more complicated pattern, bothbecause it involves a ratio of such functions and also be-cause of the phase unwrapping problem22 associated withmapping a variable that is cyclic on f0, 2pg onto a linearcontinuum of luminance. Degeneracies resulting fromthe existence of axes of symmetry in the spectrum arealso recapitulated in the space-domain plots of the AM
and PM components. In the case of the coherent texturein Fig. 2, the degeneracies that are inherent in a hexag-onal spectrum possessing twofold, threefold, and sixfoldsymmetry lead to AM and PM components with regularlattice structures and a PM that takes on only two values.
3. FIRST-ORDER VERSUS SECOND-ORDERPREDICTIVE CODINGThere is a noteworthy duality (a reciprocal relatedness)between (i) first-order versus second-order predictive cod-ing and (ii) signal correlation in amplitude versus phase.It is well known that a low-pass signal having a band-width (or upper roll-off frequency) of V must have a cor-relation distance that is greater than or equal to 1yV. Itis perhaps less widely recognized, although it was pointedout many years ago by Wiener,23 that a similar correla-tion relationship exists for bandpass signals. A bandpasssignal whose passband has width V must be correlatedin phase over at least a distance given by 1yV, just asfor amplitude correlation distance in the low-pass case.In effect, a spectrally concentrated bandpass signal has
Fig. 4. Illustration of the demodulation transform for a plaidpattern and its reconstruction from the transform’s AM andPM parts. The AM component of the transform predicts theperceived beat pattern’s spatial frequency, orientation, anddrift velocity, as described in the psychophysical experimentsin Section 5.

646 J. Opt. Soc. Am. A/Vol. 12, No. 4 /April 1995 J. G. Daugman and C. J. Downing
Fig. 5. Illustration of the demodulation transform for athree-component texture in a pure-AM configuration and itsreconstruction. Such stimuli were used as the masker patternsin the psychophysical experiments described in Section 6 below.The AM component of the demodulation transform of suchmasker patterns predicts the spatial frequency and orientationat which peaks of threshold elevation occur in the Fourier plane.
a phase coherence that lingers for a greater number ofcycles, the narrower its bandwidth; this is easily graspedintuitively by consideration of the gradual transition tothe limiting case of zero bandwidth, i.e., a completely co-herent sinusoid.
First-order predictive coding3,6 requires taking an aver-age of a signal over some window and using this averagelevel as a baseline from which deviations are encoded.Second-order predictive coding (in our usage) requires de-modulating the signal into its locally most characteristicundulation(s) and then using these as a prediction fromwhich deviations in phase and amplitude are encoded.For signals that tend to be spectrally concentrated, suchas textures, second-order predictive coding through de-modulation exploits their underlying redundancies24 inthe same way that first-order predictive coding exploitsthe level redundancy in areas of slowly changing lumi-nance. The duality, then, is that second-order predictivecoding decorrelates spectrally concentrated (i.e., band-pass) signals by predicting a phasor correlation, whereasfirst-order predictive coding decorrelates low-pass signalsby predicting a dc amplitude correlation.
4. DEMODULATION ANDPERCEPTUAL ORGANIZATIONFigures 1–5 indicate that our perceptual organizationof such textures corresponds in certain respects to theirAMPM decomposition. The multicomponent patterns il-lustrated in Figs. 1–3 are perceived in terms of a prevail-ing (carrier) undulation that has some patchy islands ofhigher contrast, partitioned by a meandering net of lowercontrast, phase distortion, and occasional phase rever-sals. This perceptual description is essentially the sameas that which is made explicit by the AM and PM demodu-lation phasor components, and they correspond to thepercept both in structure and scale and in spatial reg-istration. Certainly our perceptual organization of thesetextures does not in any way correspond to their 2D spec-tral description; for example, the original incoherent tex-ture in Fig. 1 is not perceived as the six superimposedsine waves that it comprises. Even the fact that its spec-trum is punctate rather than continuous is lost on thevisual system. The texture in Fig. 1 is difficult to dis-tinguish perceptually from 2D white noise that has beenbandpass filtered to restrict it to the same 2D frequencyband, despite the fact that filtered white noise possesses acontinuous rather than a punctate spectrum.
Perceptual organization for textures containing onlytwo or three 2D frequency components is especially welldescribed by the AM component of the demodulationtransform, as illustrated by Figs. 4 and 5. For such pat-terns the dominant percept is generally the beat pattern,especially if the components are also in motion. The spa-tial frequency, orientation, and drift velocity of the beatpattern correspond precisely to those of the demodulationAM component. In Subsection 4.A this exact correspon-dence will be derived algebraically, and psychophysicalmatching experiments will be described that confirm theperceptual relationship.
It must first be noted that, for the trivial case of tex-tures containing only two components (plaids), the spatialbeat pattern has a 2D frequency that is just the vector dif-ference between the two frequency components presentin the pattern. Figure 6 illustrates two examples of tex-tures (left column) that comprise frequency pairs as indi-cated, together with their beat pattern frequencies (rightcolumn). The central schematic illustrates that the par-allelogram rule, famous from Newton’s construction forthe composition of forces, geometrically generates the vec-tor difference beat frequency. As there is no spectral en-ergy at this vector difference frequency, it is labeled thenonspectral beat to distinguish it from the true spectralcomponents. The perceptual salience of the beat patternis of some interest for this reason.
The AMPM phasor representation for arbitrary pat-terns can be regarded as based on a generalization of thisconcept of difference frequency because, as noted above,the spectral structure of the complex demodulation phasorZsx, yd as defined in Eqs. (6), (12), and (14) is constructedentirely from vector difference frequencies. We will nowexamine these relationships more precisely.
A. Demodulation Representation forTwo-Component PlaidsIn the special case of textures that comprise only two si-nusoids, the AM component of their demodulation trans-

J. G. Daugman and C. J. Downing Vol. 12, No. 4/April 1995 /J. Opt. Soc. Am. A 647
Fig. 6. Parallelogram rule for calculating 2D beat frequenciesin the case of textures containing only two Fourier com-ponents (plaids). The vector difference frequency for eachtwo-component plaid at the left is shown at the right, and thiscorresponds to the periodicity of the phasor AM componentAsx, yd defined in Eq. (12) or (14) as illustrated in Fig. 4. Thisvector difference frequency corresponds to the perceived beatspatial frequency and orientation.
forms explicitly captures their perceived beat frequency.It is illuminating to derive the relationship between theperiodicity of the demodulation phasor component Asx, ydand the beat frequency generated by the vector differ-ence parallelogram rule illustrated in Fig. 6. If the twosuperimposed sine-wave gratings that compose the plaidpattern have 2D frequencies sm1, n1d and sm2, n2d, so thatSsx, yd sinsm1x 1 n1yd 1 sinsm2x 1 n2yd, then the seriesexpansion of the plaid stimulus as specified in Eq. (2) inthe demodulation algorithm is
Ssx, yd i2
hexpf2ism1x 1 n1ydg 2 expfism1x 1 n1ydgj
1i2
hexpf2ism2x 1 n2ydg 2 expfism2x 1 n2ydgj . (15)
The derived carrier wave Csx, yd at the spectral center ofmass of Ssx, yd, per Eqs. (3) and (4), is
Csx, yd exp
(i
"√m1 1 m2
2
!x 1
√n1 1 n2
2
!y
#). (16)
Thus the complex demodulation phasor Zsx, yd for a two-component plaid, following Eq. (6), is
Zsx, yd 2i2
exp
(i
"√m1 2 m2
2
!x 1
√n1 2 n2
2
!y
#)
2i2
exp
(i
"√m2 2 m1
2
!x 1
√n2 2 n1
2
!y
#) 2 i cosfsm1 2 m2dxy2 1 sn1 2 n2dyy2g , (17)
whose AM component, by definition, is
Asx, yd hcos2fsm1 2 m2dxy2 1 sn1 2 n2dyy2gj1/2
j cosfsm1 2 m2dxy2 1 sn1 2 n2dyy2gj
h1/2 1 1/2 cosfsm1 2 m2dx 1 sn1 2 n2dygj1/2. (18)
[One may also get these expressions for Asx, yd directlyfrom Eq. (12) or (14) by recognizing that, in this case, a1 a2 2iy2 so ka1k ka2k 1y2 and u1 u2 2py2.]
This function is periodic with vector frequency sm, nd fsm1 2 m2d, sn1 2 n2dg, which is indeed the vector differencefrequency between the two components of the plaid, aswas indicated graphically by the parallelogram rule forbeat frequencies in Fig. 6. An illustration of Eq. (18) wasgiven earlier in the AM panel of Fig. 4. The square rootimposed on the raised cosinusoid should be noted, whichleads Asx, yd down linearly to cusps at the minima [asthe raised cosinusoid inside the square root of Eq. (18) isitself inherently quadratic around those minima]. ThisAM profile can also be expressed as the absolute valueof an unraised cosinusoid at half its vector frequency,as indicated above algebraically. It should be recalledthat Asx, yd does not depend on the chosen demodulationcarrier frequency, which for convenience we have placedat the spectral center of mass.
The above steps can be generalized for plaids in mo-tion by inclusion of temporal frequency terms v1t andv2t in the two components of the plaid defined in Eq. (15),with the result that a temporal difference frequency beatterm sv1 2 v2dt then appears inside the cosinusoid inEq. (18). This simple generalization expresses the dy-namic demodulation transform AM component Asx, y, tdfor the case of moving plaids. The important point estab-lished here is that the AMPM demodulation in the caseof two-component plaids always explicitly captures theirbeat vector frequency in its AM component. This beatvector frequency often dominates our perceptual organi-zation of plaid patterns, just as we noted that, for the morecomplex patterns of Figs. 1–3 and 5 (which containedmultiple components), the vector difference frequencies(which can be regarded as beats among the ensemble ofcomponents) tended to govern our perceptual organiza-tion for those.
B. Demodulation and Illusory ContoursA final illustration of perceptual organization related tothe AMPM decomposition is provided by the illusory con-tour stimulus shown in Fig. 7, together with its demodu-lation transform. The essence of this illusion is that acontinuous edge contour is interpolated perceptually be-tween the two half-line fields, forming a salient illusoryS shape. The AM panel in Fig. 7 shows that the Asx, ydcomponent of the demodulation transform has a ridge thattraces out the S-shaped illusory contour that is perceived.

648 J. Opt. Soc. Am. A/Vol. 12, No. 4 /April 1995 J. G. Daugman and C. J. Downing
Fig. 7. Demodulation transform of a pattern that induces illu-sory contours. The S-shaped contour perceived in the originalstimulus corresponds to a ridge that is explicit in the AM com-ponent of the pattern’s demodulation transform.
Once again, it should be recalled that the derived AM pha-sor component is independent of the demodulation carrierfrequency and (unlike in standard filter energy models)independent of any frequency-specific operation such asfiltering to select a particular passband.
It is tempting to speculate on the possibility that de-modulation and second-order predictive coding may playsome role in other illusory perceptual phenomena, suchas the familiar filling-in processes, motion capture, illu-sory motion, and figural completion. In Subsection 6.Cwe will comment on the relationship between demodu-lation and non-Fourier motion perception. It is alsopossible that more general phenomena related to preat-tentive segregation of texture fields and the attentionalphenomenon of pop-out may be related to second-orderpredictive coding. We leave examination of these ques-tions to future work.
5. DEMODULATION AND THEPERCEPTION OF SPATIOTEMPORAL BEATS
A. Phenomenology of Multicomponent BeatsDirect phenomenology confirms the tendency of thehuman visual system to extract spatial and spatiotem-
poral beat frequencies and modulation structures frommulticomponent patterns. The textures shown inFigs. 1–5 were generated by a Picasso CRT image syn-thesizer and displayed on a linearized Tektronix 608monitor at a frame rate of 250 Hz. The textures hadtemporal as well as spatial structure because eachFourier component k was moving with a temporal driftfrequency vk. When all the Fourier components in agiven texture shared the same temporal frequency, astationary netlike modulation structure was perceived,imposed upon an underlying carrier that was perceivedto be in motion. This perceptual organization corre-sponds exactly to AMPM demodulation of the dynamicmulticomponent pattern. Examination of Eqs. (2)–(13)reveals that when the stimulus patterns are generalizedto Ssx, y, td to include temporal frequency componentsvk, their derived carrier Csx, y, td is in motion unlessthe weighted average of all the vk temporal frequencycomponents happens to be zero. But neither Asx, y, tdnor fsx, y, td will have any time dependence if all thevk temporal frequency components are equal to oneanother, because then all vector difference frequenciesin Eqs. (12) and (13) would have zero as their temporalfrequency component: Dvk 0 for all k. Once againit appears that the AMPM demodulation representationcorresponds closely to human perceptual organization ofsuch dynamic textures by representing them as a movingcarrier (not actually present in the Fourier spectrum)multiplied by a stationary, netlike modulation structure.
B. Psychophysical Spatiotemporal BeatMatching ExperimentsPsychophysical matching experiments were performed toprobe whether persons had reliable perceptual access tosuch components of an AMPM representation and coulduse them to perform a matching task. Viewing a varietyof randomly interleaved dynamic textures each containingonly two Fourier components, three observers were askedto identify the moving spatiotemporal beat frequency thatthey perceived in each pattern. Their task was to try tomatch in each case the perceived beat vector’s orientation,spatial frequency, and velocity by manually setting theseparameters for a single grating generated simultaneouslyby a Picasso synthesizer on a separate monitor positioned30 deg from the first.
The observers’ settings for these three parameters,when presented with a variety of dynamic two-componenttextures, are plotted in Figs. 8–10. Each point, the av-erage of three interleaved manual parameter settings, isplotted against the predicted value of the correspondingparameter (spatial frequency, orientation, or velocity) ofthe phasor AM component derived according to Eq. (12)by AMPM demodulation of the dynamic texture. The re-sults could have been anticipated from consideration ofFig. 4 or 5. The agreement between the parameters pre-dicted by demodulation and the observers’ correspondingsettings to match the perceived spatiotemporal beat pat-terns is compatible with the view that in these respectsthe human visual system has access to some internal rep-resentation for textured patterns that corresponds to theAM part of the demodulation transform, or at least tosome structure equivalent to this.

J. G. Daugman and C. J. Downing Vol. 12, No. 4/April 1995 /J. Opt. Soc. Am. A 649
Fig. 8. Observers’ settings for spatial frequency to match thebeat component perceived in moving plaids, plotted againstthe spatial frequency of the AM component of the plaid’s de-modulation transform as defined in Eq. (12). Observers HW,JD, and RF.
Fig. 9. Observers’ settings for orientation to match the beatcomponent perceived in moving plaids, plotted against the ori-entation of the AM component of the plaid’s demodulation trans-form as defined in Eq. (12). Observers HW, JD, and RF.
C. Equivalent Product Description for Moving PlaidsFinally, it is worth noting that any such superimposedpair of drifting, oriented sine-wave gratings (plaids) withmatched contrast is equivalent to the product of a dif-ferent pair of sine-wave gratings (apart from their meanluminance component). Because the observed spatio-temporal beats occur wherever one of the equivalentproduct pair members has a zero crossing, it might beargued that such a multiplicative representation may be
a better and simpler description of our perceptual organi-zation of plaids than either their additive description ortheir AMPM description would be. Specifically, if thetwo sine-wave components that are added together tomake a plaid have spatial frequencies s f1, f2d, orienta-tions su1, u2d, and temporal drift frequencies sv1, v2d, onecan show that their additive superposition is equivalentto the multiplicative product of a different pair of gratingshaving spatial frequencies s f3, f4d, orientations su3, u4d,and temporal drift frequencies sv3, v4d, where
f3 1/2f f12 1 f2
2 1 2f1f2 cossu1 2 u2dg1/2, (19)
f4 1/2f f12 1 f2
2 2 2f1f2 cossu1 2 u2dg1/2, (20)
u3 tan21
"f1 sinsu1d 1 f2 sinsu2df1 cossu1d 1 f2 cossu2d
#, (21)
u4 tan21
"f1 sinsu1d 2 f2 sinsu2df1 cossu1d 2 f2 cossu2d
#, (22)
v3 1/2sv1 1 v2d , (23)
v4 1/2sv1 2 v2d . (24)
However, this equivalent multiplicative representationfor the two-component plaids fails in two respects to corre-spond to our perceptual organization of them. First, theperceived beats have twice the spatial frequency of thesine-wave component whose zero crossings generate themin the equivalent multiplicative representation, becauseeach cycle of the sine wave contains not one but two zerocrossings. In comparison, the demodulation transformgenerates an AM component having exactly the same pe-riodicity as the beat pattern, as was illustrated in Fig. 4.Second, the equivalent multiplicative representation pre-dicts not one but two different sets of beat patterns, indifferent orientations (one for each of the two compo-nent product sine waves, along their respective lines ofzero crossings); yet we tend to perceive only the lower-
Fig. 10. Observers’ settings for velocity to match the beat com-ponent perceived in moving plaids, plotted against the velocityof the AM component of the plaid’s demodulation transform asdefined in Eq. (12). Observers HW, JD, and RF.

650 J. Opt. Soc. Am. A/Vol. 12, No. 4 /April 1995 J. G. Daugman and C. J. Downing
frequency beat pattern. Similarly, the demodulationtransform (being based on difference frequencies) ex-tracts only the lower-frequency beat pattern in its AMcomponent.
6. THRESHOLD ELEVATION AT THE AMORIENTATION AND FREQUENCYThe preceding observations about perceptual organizationof such textures and their perceived spatiotemporalbeat structure suggest more quantitative psychophysi-cal masking experiments. The three-component textureshown in Fig. 5 has the spectral structure of a verticalcarrier plus two sidebands that are inclined at 26 deg toeither side of vertical, each with half the contrast of thecarrier; yet the pattern is perceived with predominantlyhorizontal structure. This visual percept of a strong pe-riodicity remote in orientation from the pattern’s Fouriercomponents is the 2D spatial analog of auditory period-icity pitch25 (a dominant perceived frequency at whichthere is no spectral energy). The traditional frameworkof spatial frequency channels, suitably generalized so thattheir tuning characteristics are measured and describedin two-dimensional form,26,27 cannot account for the per-ceived horizontal periodicity in this pattern. But Fig. 5reveals that the AMPM representation does decomposethis texture into a vertical carrier multiplied by a hori-zontal raised sinusoidal AM component, with no phasemodulation. Once again, we find that components of thedemodulation representation correspond with our perceptof the pattern.
We conducted masking experiments using such three-component textures to investigate whether there was anycontrast threshold elevation corresponding to this hori-zontal AM demodulation structure, despite the fact thatall the spectral energy in the mask is limited to com-ponents at or around vertical. As the AMPM demodu-lation description of this texture generates a horizontalAM component, and as our perceptual organization of thepattern does include a strong horizontal percept, the de-modulation theory would predict such a horizontal mask-ing effect. A further interesting feature of this maskstimulus is the fact that if it is convolved with the isotropicLaplacian-of-a-Gaussian =2Gssx, yd operator that is popu-lar in some vision models,28 at any scale of analysis sig-nified by the scale constant s of the Gaussian Gssx, yd,the only resulting zero crossings lie along vertical lines,as noted previously by Daugman.29 These are the zerocrossings of the vertical carrier component, and they areindependent of the oblique modulating sidebands thatcreate the horizontal structure perceived in the pattern.Thus a finding of a horizontal masking effect as pre-dicted by the AMPM demodulation description of the pat-tern would be difficult to explain, both for the =2Gssx, ydtheory of early vision28 and for the popular general frame-work of visual representation based on spatial frequency-and orientation-tuned channels.
A. Demodulation Representation forThree-Component AM TexturesFirst we derive the demodulation representation forthree-component textures in the general AM configu-ration. A noteworthy difference arises here between 1D
and 2D double-sideband AM signals. For 1D signals thefamiliar10 pure-AM configuration of a carrier with twosidebands requires one sideband to be above the carrierfrequency and the other below it, by an equal interval.But for 2D signals the pure-AM situation can arise fromconfigurations in which both sidebands have a higherfrequency than the carrier. One such configuration wasillustrated in the spectrum of Fig. 5, and that rectangulararrangement was used in the psychophysical maskingexperiments described below. However, here we de-rive the general three-component pure-AM configuration,which has no constraints on the two sideband frequencies(of equal amplitude and cosine phase) except that theirvector average be equal to the carrier vector frequency.
For simplicity we assume full modulation depth ofthe three-component AM complex. Partial modulationdepths of m, where 0 , m , 1, would be implementedby replacement of the 1:2:1 ratio of amplitudes (side-band:carrier:sideband) by the ratios m:2:m.
The general three-component AM texture stimuluswith carrier frequency smc, ncd and sideband intervals6Dm, 6Dnd is described by
Ssx, yd 2 cossmcx 1 ncyd
1 cosfsmc 1 Dmdx 1 snc 1 Dndyg
1 cosfsmc 2 Dmdx 1 snc 2 Dndyg , (25)
whose series expansion as required by Eq. (2) of the de-modulation algorithm is
Ssx, yd expfismcx 1 ncydg 1 expf2ismcx 1 ncydg
1 1/2 exphifsmc 1 Dmdx 1 snc 1 Dndygj
1 1/2 exph2ifsmc 1 Dmdx 1 snc 1 Dndygj
1 1/2 exphifsmc 2 Dmdx 1 snc 2 Dndygj
1 1/2 exph2ifsmc 2 Dmdx 1 snc 2 Dndygj . (26)
The derived carrier wave Csx, yd per Eqs. (3) and (4) ofthe algorithm is
Csx, yd expfismcx 1 ncydg , (27)
and the derived demodulation phasor Zsx, yd per Eq. (6) is
Zsx, yd 1 1 1/2 expfisxDm 1 yDndg
1 1/2 expfis2xDm 2 yDndg
1 1 cossxDm 1 yDnd . (28)
Thus, for three-component textures in the pure-AM con-figuration, the demodulation phasor Zsx, yd has no imag-inary part. It is equivalent to its AM component alone,
Asx, yd 1 1 cossxDm 1 yDnd , (29)
and its PM component fsx, yd is constant at zero:
fsx, yd 0 . (30)
Figure 11 illustrates the generic 2D spectrum of such anAM texture. The carrier and two sidebands are shownas filled forms, forming a parallelogram, while the non-spectral phantom component (open circles) represents thephasor AM frequency. As noted above and illustrated inFig. 5, this nonspectral periodicity (analogous to auditoryperiodicity pitch) is often quite pronounced in our percep-tual organization of such patterns. In Subsection 6.B wedemonstrate that significant contrast threshold elevationis present at this phantom spectral location in maskingexperiments that use such three-component textures.

J. G. Daugman and C. J. Downing Vol. 12, No. 4/April 1995 /J. Opt. Soc. Am. A 651
Fig. 11. General 2D spectral configuration for a three-com-ponent pure-AM stimulus. Filled symbols represent actualspectral components, which must lie on a parallelogram as indi-cated, and open circles represent the perceived but nonspectral(phantom) AM component. This component can always be com-puted (as in Subsection 2.A) by the demodulation transform algo-rithm. Numerical values are indicated for one such sampleconfiguration.
B. Psychophysical Masking ExperimentsTwo observers (the authors) participated in four experi-ments investigating the masking produced by three-component AM textures. Stimuli were generated on alinearized Tektronix 608 monitor by a Picasso synthe-sizer. In the first two experiments we used a two-
alternative forced-choice paradigm that required theobservers to indicate which of two successive trial in-tervals contained a horizontal sine-wave test component.On half of the trials, a three-component texture mask likethat in Fig. 5 was presented alone in one interval, whichwas chosen at random, and the same mask plus the hori-zontal test grating was presented in the other interval.On the remaining trials, no mask was presented: thetest alone was presented in one of the two intervals,chosen at random, and the other interval displayed onlythe unmodulated mean luminance (roughly 25 cdym2).The contrast of all pattern components was ramped on(500 ms), held (200 ms), and ramped off (500 ms), overa time course of 1.2 s. The peak contrast of the mask’svertical (carrier) component was 12%, and that of eachsideband was 6%, whereas that of the test component wasgoverned by its staircase procedure. Over the course ofeach experiment, the horizontal test was presented at fivedifferent spatial frequencies, one of which corresponded tothat of the mask’s demodulation phasor AM component.All the tests matched this demodulation phasor compo-nent in orientation, but only in one case did it also matchit in spatial frequency. In one experiment (upper pan-els of Fig. 12) the 6n spectral component of the mask’stwo sidebands matched the carrier’s spatial frequency of2.45 cpd, and in the second experiment (lower panels)the sidebands’ 6n component was one half of this carrierfrequency, as indicated by arrows. In both experimentsthe m spectral component of both sidebands equaled thecarrier frequency. These two different sideband con-figurations generate different demodulation phasor AMcomponents (see Figs. 5 and 11) and hence different pre-dictions about where masking should be greatest.
Fig. 12. Threshold elevation factors for detection of a horizontal test grating of various spatial frequencies. The masks were three-component textures as illustrated in Fig. 5, comprising a vertical carrier plus two oblique sidebands. An arrow indicates the spatialfrequency of the horizontal AM phasor component in the demodulation representation of each mask. Even though no such componentwas spectrally present in the mask, this AM demodulation component correctly predicts the location of the peak horizontal maskingeffect for observers cjd and jgd in both experiments.

652 J. Opt. Soc. Am. A/Vol. 12, No. 4 /April 1995 J. G. Daugman and C. J. Downing
The experiments determined contrast threshold (71%-correct performance) for horizontal test sine-wave grat-ings at each of the five spatial frequencies, both with andwithout the three-component mask. We accomplishedthis by randomly interleaving 10 two-down one-up stair-case procedures30 within each session, one for each of theabove conditions. Each observer participated in four toeight sessions for each experiment. In each session, eachstaircase began at a contrast of 6.25% and had an initialstep size of
p2 and a final step size of 4
p2. We calcu-
lated the average and the standard error of the thresholdestimates over sessions for masked and unmasked testfrequencies, using the largest even number of reversalpoints produced on each staircase. We then calculatedthe threshold elevation factor for each of the test spatialfrequencies by taking the ratio of its average masked andunmasked thresholds. Standard errors for these ratiosof measurements were calculated by Monte Carlo simu-lation, based on the sampled distributions of masked andunmasked thresholds.
Threshold elevation factors for the first experiment areshown in the top panels of Fig. 12; those for the secondexperiment are in the bottom panels. The arrow in eachpanel indicates the spatial frequency of the phasor AMcomponent generated by the demodulation description ofthe mask. This is 2.45 cpd for the mask used in the firstexperiment and 1.23 cpd for the mask used in the secondexperiment. In each case, this is the spatial frequencyat which demodulation would predict the greatest mask-ing effect and, indeed, the frequency at which the greatestmasking is found. The strength of masking falls off asthe test frequency departs from this predicted value and,as a rule, is significantly less than the peak threshold ele-
vation once the test frequency differs by approximately afactor of 2 from the frequency of the demodulation phasorAM component.
In a second pair of experiments, we sought to deter-mine whether the threshold elevation produced by thethree-component mask could be explained by the mask-ing potency of the mask’s individual constituent gratings,either alone or in pairs. These experiments were simi-lar to the previous two experiments, with the followingexceptions. Instead of five different test frequencies, asingle test frequency was used in each experiment. Inaddition to trials on which no mask was used and trialson which the three-component mask described above wasused, there were trials on which one of four other maskingstimuli was used. Each of these masks was constructedfrom a subset of the components of the three-componentmask: (1) the vertical component alone, (2) one of the di-agonal components alone, (3) the vertical component andone of the diagonal components combined, and (4) the twodiagonal components combined. These masking condi-tions are identified by icons along the abscissas of thepanels of Fig. 13. In experiment 3, the test was a hori-zontal sine-wave grating at 2.45 cpd (the demodulationAM component of experiment 1), whereas in experiment 4it was at 4.90 cpd (twice the frequency of that demodula-tion AM component). The three-component mask in eachexperiment was identical to the one used in experiment 1.
The two authors again served as observers. In each ofthe four sessions for each experiment, there were twelverandomly interleaved two-down one-up staircases: twofor each of the six masking conditions. The initial con-trast for each staircase was generally set to the thresholdfound in the previous session. However, for the fourth
Fig. 13. Threshold elevations for a horizontal test grating in the presence of one, two, or all three of the components used in the AMmasking experiments summarized in Figs. 5 and 12. The icons beneath each panel signify both the orientation(s) and the number ofmask components that were present. Bars sharing a common filled symbol overhead represent the only conditions in which thresholddifferences are not statistically significant. This pattern of results is predicted by the demodulation phasor AM component of each mask.The results show that the effectiveness of multicomponent masks does not stem from the separate action of their individual components.

J. G. Daugman and C. J. Downing Vol. 12, No. 4/April 1995 /J. Opt. Soc. Am. A 653
and final session, the initial contrast was set to theweighted average of the thresholds found in the previ-ous sessions, and both initial and final step sizes weredecreased by a power of 1y2.
Mean threshold contrasts were calculated as before andare shown in Fig. 13. Results for the test at 2.45 cpd areshown in the left-hand panels of this figure, and resultsfor the test at 4.90 cpd are shown in the right-handpanels. The components that make up the mask foreach condition are indicated schematically by icons: nomask, vertical component only, diagonal component only,vertical plus diagonal, two diagonals, and the full three-component mask. For the two single-component casesthe mask orientation and relative spatial frequency areindicated by the stripes filling their corresponding barsin the bar plots. For the multiple-component masks itis the demodulation phasor AM component whose orien-tation and relative spatial frequency are indicated bythese stripes. Numerically, for the two-component maskcontaining a vertical and an oblique component, the fre-quency of the demodulation phasor AM component is2.45 cpd, as it is for the full three-component mask,whereas for the two-component mask containing onlythe two oblique components it is 4.90 cpd.
All differences between thresholds shown within anypanel in Fig. 13 are statistically significant, except thosebetween conditions marked with a common symbol abovethe bar (where p . 0.05). It is clear from the pat-tern of results shown that the threshold elevation pro-duced by a multiple-component mask does not result fromthe addition of the effects of its constituent components.Even the ordinal relationships that would be predictedfor the two dual-component masks, based on the ordi-nal relationship between the single components, are vio-lated. If, for instance, the two-component masks owedtheir masking efficacy to the action of their componentsindividually, and not to their demodulation AM compo-nent, we would expect the ordinal relationship betweenthe masking strengths of the single components to pre-dict the ordinal relationship between the strengths of thetwo-component masks. Thus, because the vertical com-ponent and the oblique component are equally effectivemasks when presented singly for observer cjd, additivitywould predict that the two dual-component masks, verti-cal plus oblique and oblique plus oblique, would be equalin masking strength. This prediction is clearly violated:the former is stronger in experiment 3, and the latter isstronger in experiment 4.
Instead, the pattern of results can be explained by thedegree to which the frequency of the demodulation pha-sor AM component of the dual-component mask matchesthe frequency of the test: the test frequency and the de-modulation phasor AM frequency are identical for the ver-tical plus oblique mask in the third experiment, and theyare again identical for the oblique plus oblique mask inthe fourth experiment. Similarly, for observer jgd, whosedata show the single oblique component to be a more effec-tive mask than the single vertical component, additivitywould predict the two-component mask containing twoobliques to be more effective than the two-componentmask containing a vertical and one oblique. This pre-diction from the Fourier-based masking perspective isviolated in experiment 3, and, although it is supported
by experiment 4, this occurs only when the prediction ofdemodulation theory and that of the Fourier-based per-spective coincide. For both observers, demodulationtheory provides the more consistent explanation of themasking effects.
The results from this set of four experiments are com-patible with the idea that AMPM demodulation com-ponents underlie at least some aspects of our visualrepresentation of textured patterns. We found signifi-cant masking effects at the orientation and spatial fre-quency of the demodulation phasor AM component of themasks, despite the masks’ lack of any corresponding spec-tral energy there; and we presented evidence that the ef-fectiveness of multiple-component masks does not stemfrom the separate action of their individual components.
C. Comparisons with Other Studies
1. Non-Fourier Motion PerceptsIn 1984 Daugman et al.31 demonstrated various non-Fourier motion percepts with AM/PM stimuli all of whoseenergy in the three-dimensional spatiotemporal frequencydomain lay on an inclined plane not passing through theorigin. We pointed out then that the inclined spectralplane’s coordinates (elevation and azimuth) correspond tothe speed and the direction of a multiplicative envelopeand that this moving (non-Fourier) AM pattern “can domi-nate the motion percept.” Recently Fleet and Langley32
repeated this earlier observation that the velocity of aperceived multiplicative envelope corresponds to the ori-entation of the spectral distribution (noncoplanar withthe origin), and they suggested that a wide variety ofnon-Fourier motion percepts can be accounted for withinthis unifying framework. The present paper expandson these two earlier studies31,32 of non-Fourier motionby specifying a computational method (the demodulationtransform of Subsection 2.A) for obtaining the exact formof the multiplicative AMPM envelope for any stimulus.Since this algorithm creates Zsx, y, td by shifting downthe spectrum toward the origin (from both sides) as indi-cated in Eq. (6), the coplanar spectral energy underlyingnon-Fourier motion stimuli is just translated down to theorigin in order to generate explicitly the spatiotemporalAM moving envelope perceived for such stimuli.
2. Slowly Moving PlaidsDerrington and Badcock33 observed that human perfor-mance in discriminating the direction of composite plaidmotion can be slightly better than discrimination of thedirection of motion of the two component gratings whentheir speed is extremely slow. Therefore those authorsdisputed a model of plaid motion that begins with extrac-tion of the two component motions, followed by constraintsatisfaction to compute the direction in which the compos-ite plaid pattern is undergoing simple translation. In-herently, plaid motion is an interesting phenomenon onlyif one believes in that first stage; otherwise the stimulus isjust another rigidly translating 2D pattern whose motionthe visual system is capable of detecting and representing,like that of any other rigidly moving pattern. (Becausethree points are always coplanar, the two spectral com-ponents in three-dimensional spatiotemporal frequencyspace that create a moving plaid are always coplanar withthe spectral origin, and therefore such patterns undergo

654 J. Opt. Soc. Am. A/Vol. 12, No. 4 /April 1995 J. G. Daugman and C. J. Downing
simple rigid translation. As noted by Daugman,29 whatis therefore interesting about coherent plaid motion is notthe fact that we perceive it but rather the fact that some-times we do not.)
In Derrington and Badcock’s33 slow-motion experiment,the two gratings creating the plaid had spatial frequenciesof 1.6 cpd, orientations at 160 and 260 deg relative tovertical, and typical drift frequencies (their median case)of 10.01 and 20.01 degys (i.e., the oblique rightwardand leftward drift velocities). These drift rates corre-spond to temporal frequencies of vt 10.016 Hz andvt 20.016 Hz, which the subjects could not reliably dis-criminate above the 75% performance level within theirallotted 1-s window of observation. It must be noted thatthe temporal frequency uncertainty, or “spectral splatter,”in Derrington and Badcock’s experiment was inherently,1 Hz: the 1-s window of observation unavoidably im-posed an uncertainty of ,1 Hz in any temporal frequencyestimates, so the subjects were asked, in effect, to dis-tinguish between 10.016 6 1.0 and 20.016 6 1.0 Hz.These two cases have 97% spectral overlap, and thus itshould not be surprising that this study failed to findreliable discrimination for the direction of motion of suchslowly moving grating components within the brief ob-servation window. A second factor is that the plaids (byconstruction) had twice as much spectral power as theirisolated components in the comparison experiments, andtwice their peak-to-peak contrast of 0.05, which mightby itself explain their slightly better motion discrimin-ability. But leaving these confounding issues aside,let us compute the AM component of the demodulationrepresentation of this moving plaid pattern. In three-dimensional spatiotemporal frequency space, the twodrifting Fourier components of this plaid have spatialfrequency components m1 10.8 cpd, m2 10.8 cpd andn1 11.38 cpd, n2 21.38 cpd, and temporal frequenciesv1 10.016 Hz and v2 20.016 Hz. Therefore, ac-cording to the demodulation transform of two-componentplaids as discussed in Subsection 4.A, the AM componentof this plaid has a temporal drift frequency of 0.032 Hzand a spatial periodicity of 2.76 cpd. Its drift velocity istherefore 0.032y2.76 0.012 degys, which is 20% fasterthan the drift velocity of 0.010 degys for either gratingcomponent of the plaid by itself. Therefore the demodu-lation representation can offer an explanation for why thesubjects in Derrington and Badcock’s slow-motion experi-ment were “slightly better” able to discriminate the plaidmotion than the motion of its individual components.
3. Distortion ProductsDerrington and Henning34 evaluated and rejected (asdid Nachmias16) the hypothesis that nonlinear distortionproducts arising from quadratic and higher even-orderedpowers of a point nonlinearity produce the masking ef-fects observed with contrast-modulated maskers. Un-like Nachmias,13,16 who used maskers that were 1D andtherefore of limited use for probing 2D spatial visualmechanisms,26 Derrington and Henning34 employed 2Dmaskers composed of two grating components inclinedat various angles (622.5, 645, and 667.5 deg) to eitherside of vertical. In each case, they measured contrastthreshold elevation for a vertical test grating, at vari-ous spatial frequencies. Their finding was that, regard-
less of the relative 6 orientation of the mask compo-nents, the peak spatial frequency of threshold elevationwhen vertical test gratings were used was always in arange slightly lower than the spatial frequency sharedby the two mask components. However, Derrington andHenning34 considered only test gratings in the verticalorientation. They did not look for horizontal masking bysuch patterns, where the AM component of the demodu-lation transform of such masker patterns sometimes lies.This is where the present demodulation theory predictsthat significant masking should be found, as indicated inFig. 5 and as documented empirically in Figs. 12 and 13.
4. Texture Boundary DetectionThe perception of illusory contours similar to that seen inFig. 7 but using grating stimuli was alternatively modeledby Wilson and Richards35 with linear filtering in one ori-entation, followed by a nonlinearity (response squaring),followed by more linear filtering in the perpendicular ori-entation. This simple model was, however, designed asan ad hoc detector for the types of stimuli used in theirpsychophysical experiments (boundaries defined by a con-trast reversal in gratings) rather than as a general frame-work. Such a model is also specific to a particular spatialfrequency passband, determined by the filters. A moresophisticated and general approach to texture boundarydetection was presented by Bovik et al.36 This reliedon detecting phase discontinuities after convolution-baseddemodulation in particular 2D Gabor bandpass channels.In comparison, in our approach the illusory contour be-comes explicit in the AM component and, more important,this component is carrier independent (and filter indepen-dent) rather than linked to a particular passband. Asstressed above, this difference springs ultimately from thefact that our approach creates a complete (i.e., lossless andinvertible) demodulation transform based on the duals ofmodulation and shifting, whereas the other approachesare passband specific (not complete or invertible) and arebased on the duals of convolution and multiplication.
7. PASSBAND-SPECIFIC NEURALDEMODULATION NETWORKA simple nonlinear neural circuit model7 whose function-ing approximates (within a particular frequency pass-band) the extraction of demodulation phasor AM andPM components is illustrated in Fig. 14. The imageis projected onto a network of coupled pairs of even-and odd-symmetric receptive fields, representing corticalsimple cells in quadrature phase as described by Pollenand Ronner.37 Canonical symmetric and antisymmetricmodulation phases are shown in the figure, but any pair oforthogonal phase angles would serve equally well. Twoseparate nonlinear outputs from the network are com-puted over each image location sx, yd based on theseinner-product projection responses; these parallel re-solved outputs are indicated in the figure as emergingfrom the top and the bottom of the network. At the top,the sum of the squared responses from each quadraturepair approximates the squared modulus of the phasorAM component Asx, yd. At the bottom, the simultaneouspassage of the ratio of their responses through an ogivalsquashing function resembling the arc tangent (for range

J. G. Daugman and C. J. Downing Vol. 12, No. 4/April 1995 /J. Opt. Soc. Am. A 655
Fig. 14. Quadrature demodulator network whose functionapproximates (within a particular passband) the extraction ofdemodulation phasor AM and PM components. The phasordiagram at the bottom indicates how some basic operationsof complex algebra are implemented by this neural model, allof whose elements are real valued, in resolving the AM andPM components of image projections onto the receptive fields.From Daugman.17
compression onto f2p, pg) approximates the phasor PMcomponent fsx, yd. The polar representation21 of thesetwo complex phasor components, Asx, yd and fsx, yd, isgiven at the bottom of the figure.
Although this quadrature demodulator circuit resolvescomplex phasor components, it only approximately rep-resents the demodulation algorithm of Subsection 2.Abecause it functions only within a particular spectral pass-band. This approximation is valid in the limit that theinput image is spectrally concentrated, as in the caseof a bandpass texture. The receptive field modulationwave vector indicated in Fig. 14, which determines thepreferred orientation and spatial frequency of the pairedsimple cells, plays the role of the carrier wave Csx, yd. Inorder for the network approximation to be valid, the in-put image should be spectrally concentrated around this2D frequency. Also, Fig. 14 represents a local model,whereas for simplicity the demodulation transform wasdeveloped in this paper as a global process.
One degree of freedom that exists within a local codingmodel is the lengthywidth aspect ratio of the elementarycoding primitives. The receptive field shapes indicatedin Fig. 14 have roughly a 2:1 aspect ratio, elongated or-thogonally to the modulation wave vector, because psy-chophysical measurement of the 2D tuning surfaces26
of spatial visual channels by use of classical single-
component masking (but spanning the 2D Fourier planerather than just the usual 1D frequency domain) revealsthis 2:1 spatial aspect ratio of the coding primitives fromtheir 2D bandwidths. Finally, the phasor AM output ormodulus Asx, yd that emerges from the top of the networkin Fig. 14 could be described as resembling the responsebehavior of cortical complex cells (i.e., phase insensitivebut tuned to local spatial frequency and orientation).Most of the perceptual and psychophysical claims in thispaper are related to this type of computed AM compo-nent but are generalized to a frequency-invariant formrather than to the passband-specific AM modulus thatis extracted by the network in Fig. 14. The ratio com-putation implemented at the bottom of the network doesnot have a compelling physiological parallel (nor do werely on it to explain any of our perceptual observations),although such arc-tangentlike squashing functions arecommonplace features of many neural network models.
Fig. 15. Illustration of how the complexity of the demodulationtransform’s PM component is related to the predictive power ofthe carrier. The regions of the collage are defined by differentprimary orientations of correlation, but in this example thedemodulation carrier was forced to be vertical. The resultingPM complexity is lowest when the vertical carrier most closelymatches the correlation moments of the texture and thus bestpredicts its redundant structure. This clearly occurs in theT-shaped (vertically correlated) region of the original texture.

656 J. Opt. Soc. Am. A/Vol. 12, No. 4 /April 1995 J. G. Daugman and C. J. Downing
8. PHASOR PM STRUCTURE AND THEPREDICTIVE VALUE OF THE CARRIERIn deriving the demodulation transform in Subsection 2.Awe noted that the demodulation phasor’s AM componentAsx, yd as expressed in Eq. (14) was independent of thechosen carrier frequency and was instead entirely a prop-erty of the image itself. However, the structure of thetransform’s PM component fsx, yd does depend on thechosen carrier Csx, yd, and its complexity can be inter-preted as a measure of how good this carrier is at pre-dicting local image structure. The greater the predictivepower of the carrier, the simpler will be the structure ofthe demodulation phasor PM component.
This principle is illustrated in Fig. 15, in which theoriginal pattern is a collage of incoherent texture fieldssharing a common set of scalar spatial frequencies butwhose characteristic orientations differ. The principalcorrelation directions for the different subfields of thecollage are 0, 45, 90, and 135 deg. For the vertical car-rier wave shown, the PM demodulation component asindicated in the PM panel is simplest (most coarse) whenit is representing the T-shaped region that contains pri-marily vertical correlations, but it varies most rapidly inrepresenting the rectangular region that contains texturewith predominantly horizontal correlations. In a curiousway, the demodulation transform’s PM component con-verts variation that exists in the orientation structure ofthe original pattern into variation within its own spatialfrequency structure. (This observation is made less mys-terious by the fact that spatial frequency can be regardedas the spatial derivative of phase, both in the scalarsense and in the vector sense.) Finally, Fig. 15 furtherreveals the image compression potential of the demodu-lation transform for input images containing textureswith well-concentrated spectra, because suitably cho-sen demodulation carriers remove the predictable redun-dancies and can thus encode the textures in terms ofmuch more slowly varying functions. Representationsthat are more slowly varying than their inputs can besampled more sparsely and are therefore compressive.
9. DEMODULATION REPRESENTATIONSFOR NATURAL SCENESFigures 16 and 17 illustrate the extraction of the threecomponents of a demodulation representation for twonatural images and the reconstruction of the images fromthese components. Because these scenes are far from be-ing spectrally concentrated, but instead have very broadFourier power spectra as shown in the top-right pan-els, their global demodulation transform PM componentsare nearly as complex as the original images. From thestandpoint of data compression and redundancy reductionby predictive coding, it would be better in such cases tosegment either the image or its spectrum, or both, intodistinct regions that use different demodulation carriers.Partitioning the Fourier spectrum into domains centeredon concentrations of spectral energy, or simply partition-ing the Fourier plane into quadrants, would permit a moreefficient choice of carriers; the complete demodulation rep-resentation would then become simply the sum of suchseparate representations. Similarly, it would be more ef-
ficient to segment a complex patchwork-quilt–like imageinto separate spatial regions based on criteria of locallyquasi-homogeneous spectra18 and then to compute sepa-rate demodulation transforms for all such regions. In-deed, the overall strategy of minimizing the complexity ofthe demodulation representation as a criterion for choos-ing among candidate partitionings of images into separateclosed regions could offer a powerful basis for image seg-mentation. This principle reflects the comments madeearlier in Section 8 that the predictive value of the car-rier becomes greater, the simpler its demodulation PMcomponent becomes. Investigation into the partitioningof either the image domain or the 2D Fourier domain, orboth, into regions with different demodulation carriers isleft to future work.
10. PRACTICAL APPLICATION OFTEXTURE DEMODULATION: AUTOMATICVISUAL RECOGNITION OF PERSONSWe now describe a practical application of the AMPM de-modulation approach to image analysis, in the field ofautomatic face recognition. The most distinctive pheno-typic feature visible in a person’s face is the detailed tex-ture of each eye’s iris. The morphogenesis of the iristrabecular meshwork (the colored connective tissue) in-volves the random adhesion of elastic pectinate ligaments,creating a visible texture whose detailed structure de-pends on initial conditions in the embryonic mesodermfrom which it develops. Thus this texture appears sto-chastic or even chaotic, but after its morphogenesis thepattern is stable, apart from a simple elastic deforma-tion associated with the pupillary light reflex. Becauseof the lack of genetic penetrance in the phenotypic ex-pression of this organ beyond its color, form, and physi-ology, its textural details are uncorrelated from eye toeye, even when two irises with the same genetic geno-type are compared (as in identical twins, or the pair pos-sessed by one person). By cross correlation of the visibletextures from a population of irises, an estimate of theirstatistical complexity (dimensionality) reveals variationcorresponding to several hundred independent degrees offreedom.38,39 Therefore, as an internal organ of the eyedisplaying a high-dimensional texture that is visible ex-ternally at some distance with an ordinary video camera,this complex yet stable biometric signature could providea very reliable basis for automatically determining or con-firming the identity of persons. For these practical rea-sons, the task of designing a method for rapidly encodingand reliably recognizing the iris texture is a worthwhileengineering problem.
Using the AMPM demodulation ideas presented in thispaper, we have developed a multicarrier 256-byte iriscode. It has been implemented in a practical system forperforming automatic visual personal identification withextremely high confidence levels, in a computation timeof less than 1 s on a 486 processor. Most of this compu-tation time is spent in locating the iris itself within thelarger image, precisely determining its inner and outerboundaries by contour integral operators designed todetect arcs of circular edges. These (often somewhatnonconcentric) boundaries specify a doubly dimensionlesspolar coordinate system, in which the elastic deforma-

J. G. Daugman and C. J. Downing Vol. 12, No. 4/April 1995 /J. Opt. Soc. Am. A 657
Fig. 16. Demodulation transform of a natural wilderness sceneand its exact reconstruction from the AM and PM componentsshown.
tions of iris texture that arise from pupillary dilation orconstriction are mathematically reversed, because radialdistances between the inner and outer boundaries of theiris (regardless of its dilation) are mapped invariantlyonto the unit interval. Demodulation in these invariantspatial coordinates then generates a phasor PM com-ponent from which the iris code is extracted by coarsequantization; one example is shown at the top of Fig. 18together with the eye image from which it was computed.Superimposed upon the iris are demarcated the concen-tric zones within which the complex harmonic carriersare defined in polar coordinates. By retaining only thetwo most significant bits of the phasor PM component,thus specifying only its quadrant in the complex plane,we transform the problem of recognizing iris patterns intoan efficient test of statistical independence operating onphase variation.
Figure 19 summarizes the quantization principle bywhich the iris codes are extracted. (A more detailed ac-count of the entire process, including the steps for locat-ing the iris, may be found in Refs. 38 and 39.) 2-D Gaborwavelets at multiple scales and in quadrature phase areused to compute raw complex image projection coeffi-cients. This family of image coding filters were origi-nally proposed in 1980 as a framework for modeling
visual cortical simple cell receptive field profiles, simul-taneously by Marcelja40 in 1D form and by Daugman41 in2D form. The carrier component of demodulation corre-sponds to the harmonic wave vector modulating the 2DGabor wavelets. We quantize the phase of the complexprojection coefficients to just two bits, as suggested bythe four quarter-planes in the phasor diagram in Fig. 19,using the quadrature demodulation method illustratedearlier in Fig. 14. Such bit pairs signifying the phasorquadrant of local iris texture, for each location and scale,constitute the elements of the 256-byte iris code. All fourquadrants are equiprobable for the demodulation phasor;therefore a good metric of similarity between any two iriscodes is simply the Hamming distance norm (fraction ofdisagreeing bits) between their complete bit vectors. AsHamming distance can be obtained just from computingthe exclusive OR (XOR) between two complete demodula-tion phasor bit vectors, and as Boolean operators such asXOR can be integerized and executed in parallel (XORingtwo 32-bit integers at once on a 32-bit CPU), it is possibleto compare tens of thousands of complete iris codes persecond. This permits high confidence recognition of per-sonal identity by an extremely rapid exhaustive searchthrough a large enrolled database.
The Neyman–Pearson formalism for decision problemsin which the prior probabilities are not known and the
Fig. 17. Demodulation transform of a natural stone texture andits exact reconstruction from the AM and PM components shown.

658 J. Opt. Soc. Am. A/Vol. 12, No. 4 /April 1995 J. G. Daugman and C. J. Downing
Fig. 18. Application of AMPM texture demodulation in auto-matic visual recognition of personal identity, using the texturevisible in the iris. A multicarrier, 256-byte iris code constructedfrom quantization of the phasor PM component is shown in-scribed in the corner. Computing this code from a video imageof the eye can establish its owner’s identity in less than 1 s withextremely high confidence.
Fig. 19. Phase-quadrant quantization of the demodulationphasor PM component to only two bits for constructing theidentifying iris code.
error costs are not fixed, but the posterior distributionsare available, provides the appropriate framework forbasing identification decisions on comparisons among iriscodes. It also formalizes the calculation of confidencelevels associated with all decisions. Figure 20 showssame–different separation performance in which phase-quadrant demodulation is used to code the monochro-matic iris texture across a database of 592 eye images(image format 640 3 480, with the iris diameter usuallyat least 100 pixels). The dissimilarities between differ-ent images acquired at different times from the sameirises (Authentics), defined as the normalized Hammingdistance between their demodulation phasor PM bit vec-tors, are plotted in the white histogram. Using the sameHamming distance measure, we plot dissimilarities be-tween images of different eyes (Imposters) in the blackhistogram. There is no empirical overlap between thesetwo distributions, but one can estimate their theoreticaloverlap, and hence the confidence levels associated with
such recognition decisions, by realizing that the XOR op-erators that compare the phasor PM bits are Bernoullitrials whose values of p and q depend on whether a com-pared pair of iris codes comes from the same eye or fromdifferent eyes. The binomial distribution for N Bernoullitrials with outcome probabilities p and q predicts thatthe likelihood of observing a fraction x myN “True” XOR
outcomes (i.e., disagreeing bits) is
f sxd N!
m!sN 2 md!pmqsN2md. (31)
The solid curves that have been fitted to the two observeddistributions in Fig. 20 are computed from the binomialexpression in Eq. (31), and they provide good fits to thedata. The best-fitting value for N indicates that, whendifferent irises are compared by our method of phase-quadrant demodulation (at this resolution), there are ap-proximately 173 independent degrees of freedom spannedby such textural signatures.
The formal decidability of this recognition task, analo-gous to detectability in a signal detection task, is mea-sured at d0 8.41 for the two distributions shown inFig. 20. The crossover point between the two fitted dis-tributions (where the theoretical false accept rate equalsthe theoretical false reject rate, around an operating crite-rion of 0.321 Hamming distance) corresponds to an errorprobability of 1 in 131,000 for both types of error. Forthe typical valid match, near the mean of the white distri-bution (Hamming distance 0.084), the conditional proba-bility of a false recognition is 10231; that is the portionof the black probability distribution theoretically lying tothe left of this Hamming distance. Some potential appli-cations of this high-confidence technique for recognition ofpersonal identity by demodulation of the visible iris tex-ture include passport control, automatic teller machines(ATM’s), premises access control, computer log-in, birthcertificates, security systems, financial authorization,licenses, and generally any existing use of keys or iden-tification cards.
Fig. 20. Performance histograms for the automatic personalidentification system based on AMPM demodulation of visibleiris texture. Measured Hamming distances between the multi-carrier iris codes as illustrated in Fig. 18 tallied both for imagescomparing different eyes (Imposters, black histogram) and fordifferent images of the same eye (Authentics, white histogram).The resulting decision task has d0 8.41 formal decidability.Solid curves are Eq. (31).

J. G. Daugman and C. J. Downing Vol. 12, No. 4/April 1995 /J. Opt. Soc. Am. A 659
11. DISCUSSION
Visual processing of texture is a generic form of imageanalysis that raises many issues involving perceptual or-ganization, classification, coding, data compression, andpattern recognition. In this paper we have developed theconcept of complete AMPM demodulation as a generalcoding scheme that can be used to represent any patternbut that is particularly useful for textures. The schemeidentifies the predominant or characteristic scale and di-rection of undulation within the pattern, thus specifying a2D predictive carrier frequency, and represents the wholepattern in terms of relative AM’s and PM’s of such a car-rier across the image or across a local region of the image.One can readily generalize the scheme to the use of twoor more predictive carriers when that would be more ap-propriate, by partitioning up either the spectrum or theimage, or both. Because these AMPM modulation com-ponents are more slowly varying across the image thanthe original texture, given that the carrier has capturedsome redundancy in image structure, they constitute anefficient coding strategy as well as an inherent form ofimage analysis.
Our demodulation scheme is a kind of predictive coding.It represents a spatial pattern by its departures froma predicted 2D undulation. In this respect, AMPM de-modulation can be regarded as an oriented, second-ordervariant of the isotropic first-order predictive coding thatothers8 have proposed as an interpretation of retinal gan-glion cell center–surround interactions. Such neuronsare active only when the light integrated across their re-ceptive field surround fails to predict correctly the lightintegrated across their central region. They respond inproportion to this imbalance, in analogy with linear pre-dictive coding of TV signals,3,6 and thus they create a rela-tively decorrelated delta code for the structure of thespatial image.
By incorporating orientation into this older first-orderform of predictive coding, our scheme extends the conceptin a way that may illuminate neural codes in the mam-malian primary visual cortex. First, the use of orientedcoding primitives rather than isotropic center–surroundprimitives assigns to the prediction a certain correlationdirection, or moment. Second, what is predicted is not lu-minance but a scale and direction for its variation. Thequadrature phase relationship reported37 among adjacentoriented cortical simple cells would play an obvious rolein the computation of the AMPM phasor components de-fined in Eqs. (12) and (13), which could be implementedor approximated in several ways. One such (passband-specific) approximation to a full demodulation transform,based on 2D Gabor filters,41 is the quadrature demodu-lator network shown in Fig. 14. We have stressed thatsuch filter-based methods lead to a passband-specific de-modulation by each filter pair rather than to a completeand invertible image demodulation as in our proposednew transform. The currently popular energy modelsfor texture segregation,42 as originally proposed in 1983by Caelli43 using Fourier kernels to compute energy, arenow typically based on this earlier idea17,18 of taking themodulus of the output of local oriented quadrature 2DGabor filters. Coding schemes based on these filtersenjoy the advantage of maximizing their simultaneous
resolution for both “what” and “where” information7 be-cause the underlying complex primitives minimize theconjoint 2D spatial/2D spectral uncertainty,44 and theylead to decorrelated image representations18 that there-fore achieve large factors of entropy reduction.24
At a still more general level, the coding scheme dis-cussed in the present paper can be regarded as drivenby redundancy reduction. This interpretation of sensorymechanisms was anticipated at the beginning of thiscentury in Mach’s work45 on inhibition, but it was firstarticulated as a general principle of sensory processingin the mid-1950’s by Attneave46 and independently byBarlow.47 In recent years the idea has reemerged im-portantly in both theory8 and experiment.48 If we re-formulate in a more general way this interpretation ofcenter–surround lateral inhibition as a mechanism forredundancy reduction, so that it applies across the do-mains of orientation and spatial frequency rather thanjust to luminance, then the result is something like ourscheme for second-order predictive coding by AMPM de-modulation. A neural analog of the predominance of acarrier that serves as the second-order predictive compo-nent might be local winner-take-all competition amongdifferently tuned neurons, such as the quenching cross-inhibitory interactions observed among cells tuned for dif-ferent orientations and spatial frequencies.49 Then themodulation of complex cells receiving inputs from theprevailing subspace of simple cells would correspond tothe AM component of the derived demodulation phasorZsx, yd. Our observations about the perceptual organi-zation of textures in relation to their AMPM demodulationcomponents (Figs. 1–7), and the close match between thephasor AM component and the perceived spatiotemporalbeat structure (Figs. 8–10), together with the multicom-ponent psychophysical masking effects that correspondin each case to the phasor AM component of the mask(Figs. 12 and 13), are all compatible with the idea of acortical mechanism that resembles AMPM demodulation.Finally, this work has led to the formulation of a new andinvertible transform, the demodulation transform, whichappears to have potential value in image compression,texture analysis, and pattern recognition applications.
ACKNOWLEDGMENTSThis research was supported by U.S. Air Force Officeof Scientific Research contracts F4962081K0016 andF4962090J0175, National Science Foundation Presiden-tial Young Investigator award IRI-8858819, UK Scienceand Engineering Research Council Award GR/H50579,and research grants from Kodak Corporation.
REFERENCES1. R. V. L. Hartley, “Transmission of information,” Bell Syst.
Tech. J. 7, 535–563 (1928).2. C. Shannon and W. Weaver, The Mathematical Theory of
Communication (U. Illinois Press, Urbana, Ill., 1949).3. C. W. Harrison, “Experiments with linear prediction in tele-
vision,” Bell Syst. Tech. J. 31, 764–783 (1952).4. G. M. Russell, Modulation and Coding in Information Sys-
tems (Prentice-Hall, Englewood Cliffs, N.J., 1962).5. R. Gallagher, Information Theory and Reliable Communica-
tion (Wiley, New York, 1968).

660 J. Opt. Soc. Am. A/Vol. 12, No. 4 /April 1995 J. G. Daugman and C. J. Downing
6. B. M. Oliver, “Efficient coding,” Bell Syst. Tech. J. 31,724–750 (1952).
7. J. G. Daugman, “Quadrature-phase simple-cell pairs are ap-propriately described in complex analytic form,” J. Opt. Soc.Am. A 10, 375–377 (1993).
8. M. V. Srinivasan, S. B. Laughlin, and A. Dubs, “Predictivecoding: a fresh view of inhibition in the retina,” Proc R.Soc. London Ser. B 216, 427–459 (1982).
9. G. J. Burton, “Evidence for non-linear response processes inthe human visual system from measurements of the thresh-olds of spatial beat frequencies,” Vision Res. 13, 1211–1225(1973).
10. G. B. Henning, B. G. Hertz, and D. E. Broadbent, “Some ex-periments bearing on the hypothesis that the visual systemanalyzes spatial patterns in independent bands of spatialfrequency,” Vision Res. 15, 887–897 (1975).
11. A. Seebeck, “Beohachtungen uber einige Bedingungen derEntstehung von Tonen,” Ann. Phys. Chem. 53, 417–436(1841).
12. D. G. Albrecht and R. L. DeValois, “Striate cortex responsesto periodic patterns with and without the fundamental har-monics,” J. Physiol. 319, 497–514 (1981).
13. J. Nachmias and B. Rogowitz, “Masking by spatially-modulated gratings,” Vision Res. 23, 1621–1629 (1983).
14. A. M. Derrington and D. R. Badcock, “Detection of spatialbeats: non-linearity or contrast-increment detection?” Vi-sion Res. 26, 343–348 (1986).
15. A. M. Derrington, “Distortion products in geniculate X-cells:a physiological basis for masking by spatially modulatedgratings,” Vision Res. 27, 1377–1387 (1987).
16. J. Nachmias, “Contrast-modulated maskers: test of a latenonlinearity hypothesis,” Vision Res. 29, 137–142 (1989).
17. J. G. Daugman, “Image analysis and compact coding byoriented 2D Gabor primitives,” in Image Understanding andthe Man–Machine Interface, J. J. Pearson and E. Barrett,eds., Proc. Soc. Photo-Opt. Instrum. Eng. 758, 19–30 (1987).
18. J. G. Daugman, “Complete discrete 2-D Gabor transformsby neural networks for image analysis and compression.Invited Paper,” IEEE Trans. Acoust. Speech Signal Process.36, 1169–1179 (1988).
19. A. C. Bovik, M. Clark, and W. S. Geisler, “Multichanneltexture analysis using localized spatial filters,” IEEE Trans.Pattern Anal. Mach. Intell. 12, 55–73 (1990).
20. A. C. Bovik, “Analysis of multichannel narrow-band fil-ters for image texture segmentation,” IEEE Trans. SignalProcess. 39, 2025–2043 (1991).
21. A. V. Oppenheim and A. S. Willsky, Signals and Systems(Prentice-Hall, Englewood Cliffs, N.J., 1983).
22. D. C. Ghiglia and L. A. Romero, “Robust two-dimensionalweighted and unweighted phase unwrapping that uses fasttransforms and iterative methods,” J. Opt. Soc. Am. A 11,107–117 (1994).
23. N. Wiener, Time Series (MIT Press, Cambridge, Mass.,1949).
24. J. G. Daugman, “Entropy reduction and decorrelation in vi-sual coding by oriented neural receptive fields,” IEEE Trans.Biomed. Eng. 36, 107–114 (1989).
25. D. M. Green, An Introduction to Hearing (Erlbaum, Hills-dale, N.J., 1976).
26. J. G. Daugman, “Spatial visual channels in the Fourierplane,” Vision Res. 24, 891–910 (1984).
27. L. O. Harvey, Jr., and V. V. Doan, “Visual masking at dif-ferent polar angles in the two-dimensional Fourier plane,”J. Opt. Soc. Am. A 7, 116–127 (1990).
28. D. Marr, Vision: A Computational Investigation into theHuman Representation and Processing of Visual Information(Freeman, New York, 1982).
29. J. G. Daugman, “Pattern and motion vision without Lapla-cian zero-crossings,” J. Opt. Soc. Am. A 5, 1142–1148(1988).
30. G. B. Wetherill and H. Levitt, “Sequential estimation ofpoints on a psychometric function,” Brit. J. Math. Stat. Psy-chol. 18, 1–10 (1965).
31. J. G. Daugman, R. E. Kronauer, and Y. Y. Zeevi, “Perceptionof two-dimensional phase modulation and amplitude modu-lation signals in spatio-temporal bandlimited textures,” Per-ception 13, A16 (1984).
32. D. J. Fleet and K. Langley, “Computational analysis of non-Fourier motion,” Vision Res. 34, 3057–3079 (1994).
33. A. M. Derrington and D. R. Badcock, “Two-stage analysis ofthe motion of 2-D patterns: what is the first stage?” VisionRes. 32, 691–698 (1992).
34. A. M. Derrington and G. B. Henning, “Some observations onthe masking effects of two-dimensional stimuli,” Vision Res.29, 241–246 (1989).
35. H. R. Wilson and W. A. Richards, “Curvature and separationdiscrimination at texture boundaries,” J. Opt. Soc. Am. A 9,1653–1662 (1992).
36. A. C. Bovik, M. Clark, and W. S. Geisler, “Multichanneltexture analysis using localized spatial filters,” IEEE Trans.Pattern Anal. Mach. Intell. 12, 55–73 (1990).
37. D. A. Pollen and S. F. Ronner, “Phase relationships be-tween adjacent simple cells in the visual cortex,” Science212, 1409–1411 (1981).
38. J. G. Daugman, “High confidence visual recognition of per-sons by a test of statistical independence,” IEEE Trans. Pat-tern Anal. Mach. Intell. 15, 1148–1161 (1993).
39. J. G. Daugman, “Biometric personal identification systembased on iris analysis,” U.S. patent 5,291,560 (March 1,1994).
40. S. Marcelja, “Mathematical description of the responses ofsimple cortical cells,” J. Opt. Soc. Am. 70, 1297–1300 (1980).
41. J. G. Daugman, “Two-dimensional spectral analysis of corti-cal receptive field profiles,” Vision Res. 20, 847–856 (1980).
42. M. S. Landy and J. R. Bergen, “Texture segregation andorientation gradient,” Vision Res. 31, 679–691 (1991).
43. T. Caelli, “Energy processing and coding factors in texturediscrimination and image processing,” Percept. Psychophys.34, 349–355 (1983).
44. J. G. Daugman, “Uncertainty relation for resolution inspace, spatial frequency, and orientation optimized by two-dimensional visual cortical filters,” J. Opt. Soc. Am. A 2,1160–1169 (1985).
45. E. Mach, “Uber den Einfluss raumlich und zeitlich variieren-der Lichtreize auf die Gesichtswahrnehmung,” Sitzungsber.Math. Naturwiss. Kl. Kaiser. Akad. Wiss. 115, 633–648(1906).
46. F. Attneave, “Some informational aspects of visual percep-tion,” Psycholog. Rev. 61, 183–193 (1954).
47. H. B. Barlow, “The coding of sensory messages,” in CurrentProblems in Animal Behavior, W. Thorpe and L. Zangwill,eds. (Cambridge U. Press, Cambridge, 1961), pp. 331–360.
48. D. Kersten, “Predictability and redundancy of natural im-ages,” J. Opt. Soc. Am. A 4, 2395–2400 (1987).
49. M. C. Morrone, D. C. Burr, and L. Maffei, “Functional im-plications of cross-orientation inhibition of cortical visualcells. I. Neurophysiological evidence,” Proc. R. Soc. Lon-don Ser. B 216, 335–354 (1982).


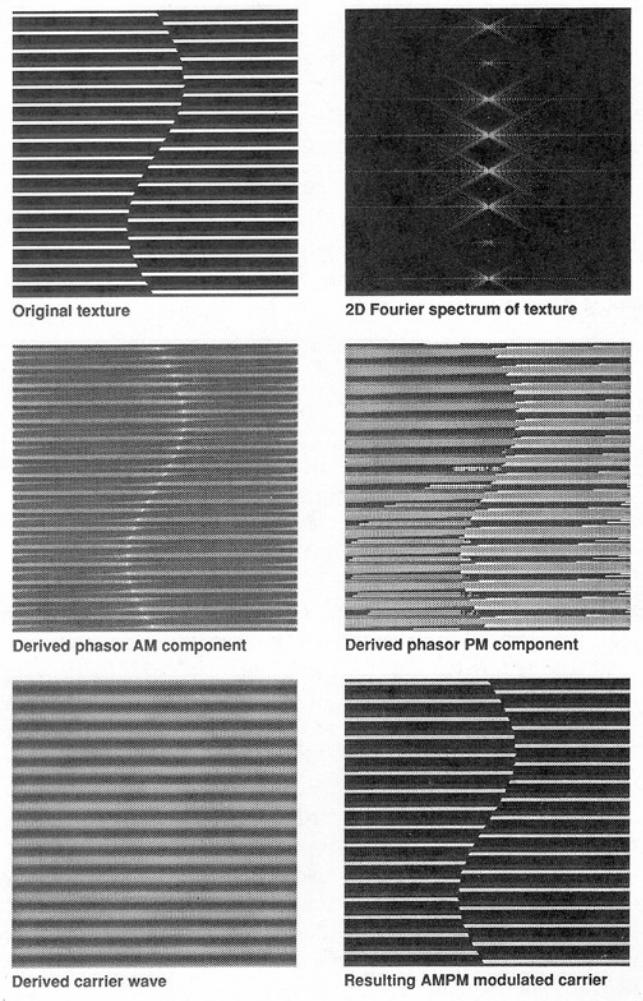


![PREDICTIVE CODING AND THE PROPORTIONALITY … · PREDICTIVE CODING AND THE PROPORTIONALITY DOCTRINE: A MARRIAGE MADE IN BIG DATA Ralph C. Losey* ... 2013] PREDICTIVE CODING AND THE](https://img.dokumen.tips/doc/110x75/5b9279b509d3f280378b5f70/predictive-coding-and-the-proportionality-predictive-coding-and-the-proportionality.jpg)


![Predictive Coding Introduction Predictive Coding - TU · PDF fileOperational distortion rate function of a predictive coding ... [Makhoul, 1975, Vaidyanathan, 2008, Gray, 2010] 2 U](https://img.dokumen.tips/doc/110x75/5aa4d3607f8b9afa758c6555/predictive-coding-introduction-predictive-coding-tu-distortion-rate-function.jpg)