Embed Size (px)
Citation preview
© 2005 International Monetary Fund June 2005
IMF Country Report No. 05/250
Democratic Republic of Timor-Leste: Selected Issues and Statistical Appendix
This Selected Issues paper and Statistical Appendix for the Democratic Republic of Timor-Leste was prepared by a staff team of the International Monetary Fund as background documentation for the periodic consultation with the member country. It is based on the information available at the time it was completed on May 31, 2005. The views expressed in this document are those of the staff team and do not necessarily reflect the views of the government of Democratic Republic of Timor-Leste or the Executive Board of the IMF. The policy of publication of staff reports and other documents by the IMF allows for the deletion of market-sensitive information.
To assist the IMF in evaluating the publication policy, reader comments are invited and may be sent by e-mail to [email protected].
Copies of this report are available to the public from
International Monetary Fund ● Publication Services 700 19th Street, N.W. ● Washington, D.C. 20431
Telephone: (202) 623 7430 ● Telefax: (202) 623 7201 E-mail: [email protected] ● Internet: http://www.imf.org
Price: $15.00 a copy
International Monetary Fund
Washington, D.C.

INTERNATIONAL MONETARY FUND
DEMOCRATIC REPUBLIC OF TIMOR-LESTE
Selected Issues and Statistical Appendix
Prepared by Valeria Fichera, Ashok Bhundia (both APD), and Yitae Kevin Kim (FAD)
Approved by the Asia and Pacific Department
May 31, 2005 Contents Page
I. Removing Impediments to Growth Through Public Investment and Private Sector Development ..................................................................................................................3 A. Growth Performance in Timor-Leste, 2000-04.........................................................3 B. The Outlook for Growth............................................................................................6 C. Policies to Remove Impediments to Growth.............................................................7 D. Conclusion ..............................................................................................................14
References....................................................................................................................15
II. Managing Oil/Gas Wealth in Timor-Leste ..................................................................16 A. Introduction.............................................................................................................16 B. Managing Natural Resources: Challenges Facing Oil/Gas Producing Countries ..16 C. Oil/Gas Sector Prospects.........................................................................................18 D. A Long-term Strategy for Oil/Gas Wealth Management........................................21 E. Conclusions .............................................................................................................28
References....................................................................................................................29
III. Dollarization in Timor-Leste: The Early Years ...........................................................30 A. Introduction.............................................................................................................30 B. A Brief History of Dollarization in Timor-Leste ....................................................30 C. The Benefits and Costs of Dollarization .................................................................32 D. Conclusion: The Balance of Benefits and Costs for Timor-Leste ..........................36
References....................................................................................................................38 Boxes I.1 Revisions to the National Accounts, 2001–2003...........................................................5 II.1 Fiscal Environment for the New Oil Exporter.............................................................18 II.2 Timor Gap....................................................................................................................20 II.3 Experience with Petroleum Funds in Oil/Gas Producing Countries............................23 II.4 A Petroleum Fund for Timor-Leste—Key Principles..................................................25
- 2 -
Statistical Appendix Tables 1. Selected Social Indicators ..........................................................................................41 2. Selected Economic Indicators, 2000–2005 ................................................................42 3. Gross Domestic Product by Sectoral Origin, 1999–2004 ..........................................43 4. Gross Domestic Product by Expenditure, 1999–2004 ...............................................44 5. Consumer Price Index, 2000–04 ................................................................................45 6. Monetary Survey, 2000–05 ........................................................................................46 7. Balance sheet of the Banking and Payments Authority, 2000–05 .............................47 8. Consolidated Balance Sheet of Financial Institutions, 2000–05................................48 9. Central Government Budget Operations (CFET) FY2000/01–FY2004/05 ...............49 10. Central Government Domestic Revenues, FY2000/01–FY2004/05..........................50 11. Oil/Gas Revenues, FY2000/01–FY2004/05...............................................................51 12. Central Government Expenditure Composition, FY2001/02–FY2004/05.................52 13. Public Sector Employment and Wages, FY2000/01–FY2004/05..............................53 14. Autonomous Agencies Operations, FY2000/01–FY2004/05 ....................................54 15. Operations of the Power Authority, FY2000/01–FY2004/05 ....................................55 16. Combined Sources of Fiscal Operations, FY2000/01–FY2004/05............................56 17. Balance of Payments, 2000–2004 ..............................................................................57 18. Banking Indicators .....................................................................................................58 19. Summary of Tax System ............................................................................................59 20. Summary of the Exchange and Payments System .....................................................63
- 3 -
Indonesia and T imor-Leste: comparative economic and social indicators (1997, or nearest prior year)
0
5
10
15
2 0
2 5
3 0
3 5
4 0
Avg . p er cap itainco me g rowth
(19 83 -9 7)
Agriculture in %of GDP
Go vernment in% ofGDP
Manufacturingin % o f GDP
Poverty Illiteracy
Indonesia
Timor Leste
Timor Leste: sectoral contribution to growth: 1994-2004
-40
-30
-20
-10
0
10
20
30
Avg. 199 4-9 8 19 99 20 00 20 01 2 00 2 2 00 3 20 04-40
-30
-20
-10
0
10
20
30
Others
Public administration andconstructionAgriculture
Non-oil GDP growth
I. REMOVING IMPEDIMENTS TO GROWTH THROUGH PUBLIC INVESTMENT AND PRIVATE SECTOR DEVELOPMENT1
This chapter provides an overview of past growth performance and an assessment of the outlook for growth in Timor-Leste. It identifies impediments to growth and discusses policies that would contribute to the accelerated rates of growth needed to reduce poverty and unemployment and the other objectives of the National Development Plan.
A. Growth Performance in Timor-Leste, 2000-04
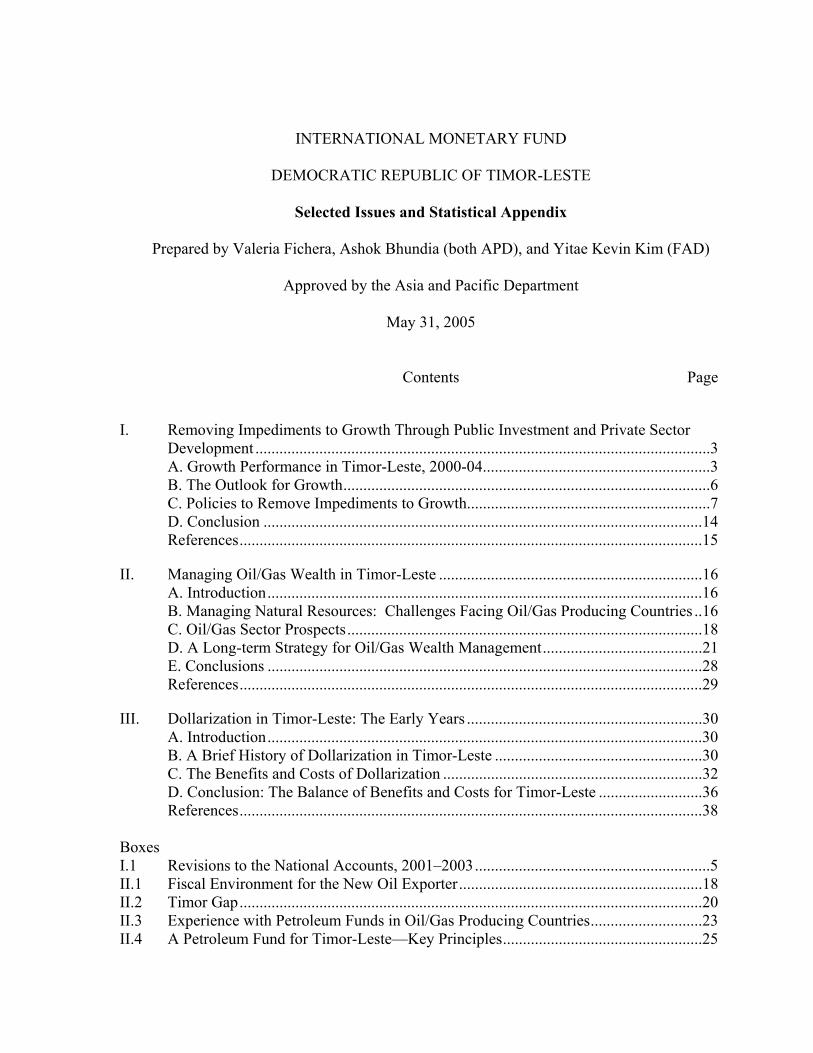
1. For more than a decade before the 1999 post-referendum violence, Indonesia-governed Timor-Leste experienced high growth rates. However, per capita income and
social indicators lagged well behind those for Indonesia as a whole. From the early 1980’s until the 1997-98 Asian crisis, the Timor-Leste economy grew at an average rate of 5.6 percent.2 Nonetheless, in 1997 Timor-Leste’s per capita income was estimated at 36 percent of that for Indonesia as a whole, while most social indicators also lagged those in Indonesia. The structure of the economy was dominated by activity in the agriculture and government sectors, reflecting the large subsistence-agriculture sector, the dominance of coffee as an export crop, and a large government sector including military. The relative importance of the government sector in the rapid growth during this period suggests that much of the benefits may have fallen to households employed by the administration, generally personnel from outside Timor-Leste. The construction sector was also relatively
1 Prepared by Valeria Fichera.
2 Pre-1999 estimates of economic and social indicators are based on extrapolations from official Indonesian regional statistics by Hill (2001).
- 4 -
Per capita non-oil GDP growth and UN presence
-15.0
-10 .0
-5.0
0 .0
5.0
10 .0
15.0
2 0 .0
2000 2001 2002 2003 2004
-40 00
-20 00
0
200 0
400 0
600 0
800 0Gro wth in rea l no n-o il per capita GDP (le ft s ca le)
Change in UN pres ence (right s ca le )
Real per capita non-oil GDP and GNP 2000-2004
0
100
200
300
400
500
600
2000 2001 2002 2003 2004
non-oil GDP GNP
dynamic, given significant public investment in infrastructure (although much of it reportedly geared to military and security considerations). This unbalanced economic structure is likely to have amplified the economic downturn from the 1999 conflict, when most administrative activity broke down and Indonesian civil servants and military personnel left Timor-Leste.
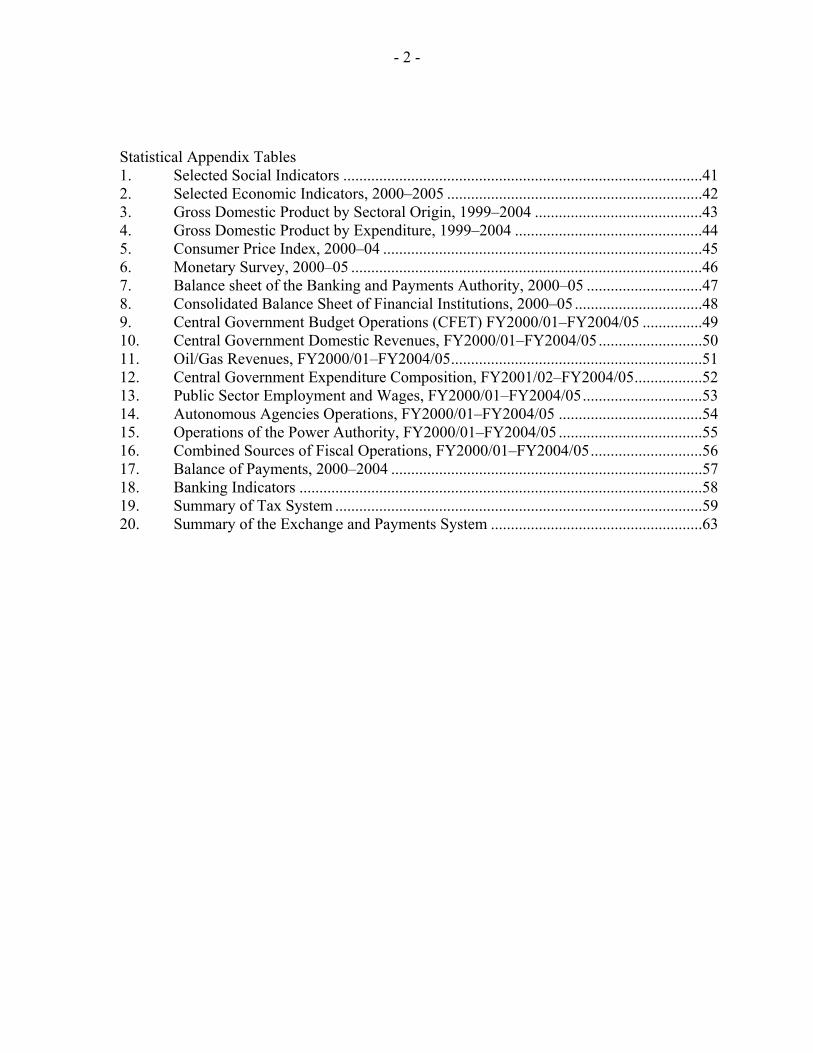
2. During the first four years following the withdrawal of Indonesia, the growth path in post-conflict Timor-Leste was largely driven by the dynamics of the UN presence. Following a collapse in GDP by about 35 percent in 1999, foreign-financed emergency reconstruction, humanitarian aid, and consumption by expatriates and national staff hired by the UN mission spurred an economic recovery in 2000 and 2001.3 Since 2002, the numbers of UN military peace-keepers, civilian staff and volunteers in Timor-Leste declined sharply, as did economic activity. Recently revised national accounts estimates indicate an even worse decline than initially assessed (Box 1). A drought in 2003 compounded the negative impact on the economy of the withdrawal of the foreign presence, and, together with continued rapid population growth (reflecting both the return of refugees and a high fertility rate) contributed to a decline in real per capita non-oil GDP by a cumulative 20 percent between 2001 and 2003.
3. The year 2004 was marked by moderate recovery in non-oil economic activity and the start of oil production. A post-drought rebound in agriculture and expansion in banking activity offset the impact of some further decline in donor activity. However, the modest non-oil economic recovery was not sufficient to offset continued rapid population growth; as a result, per capita non-oil GDP is estimated to have declined further. At the same time, substantial oil
3 UN expatriate personnel rose to about 10,000 in 2001, dropped to about 7,500 in 2002 and declined further in 2003 and 2004. The number of Timorese nationals hired by the UN rose to above 1,700 in 2001 and then declined by about 25 percent per year until end 2004. For an analysis of the economic impact of UN operations in Timor-Leste in 2000-2004, see Carnahan, Gilmore, Rahman (2005).
- 5 -
income came on stream from the Bayu-Undan field, resulting in large tax and royalty payments to the government and a 40 percent jump (to US$ 563) in gross national per capita income.4
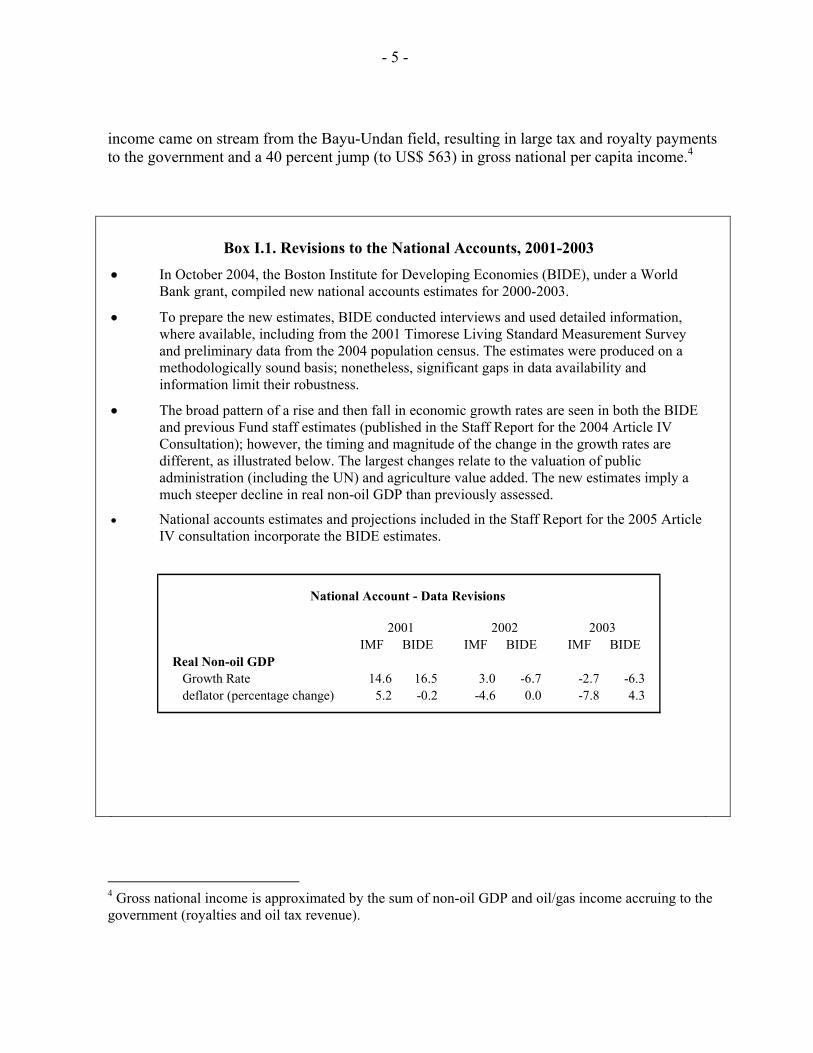
Box I.1. Revisions to the National Accounts, 2001-2003 • In October 2004, the Boston Institute for Developing Economies (BIDE), under a World
Bank grant, compiled new national accounts estimates for 2000-2003.
• To prepare the new estimates, BIDE conducted interviews and used detailed information, where available, including from the 2001 Timorese Living Standard Measurement Survey and preliminary data from the 2004 population census. The estimates were produced on a methodologically sound basis; nonetheless, significant gaps in data availability and information limit their robustness.
• The broad pattern of a rise and then fall in economic growth rates are seen in both the BIDE and previous Fund staff estimates (published in the Staff Report for the 2004 Article IV Consultation); however, the timing and magnitude of the change in the growth rates are different, as illustrated below. The largest changes relate to the valuation of public administration (including the UN) and agriculture value added. The new estimates imply a much steeper decline in real non-oil GDP than previously assessed.
• National accounts estimates and projections included in the Staff Report for the 2005 Article IV consultation incorporate the BIDE estimates.
National Account - Data Revisions
2001 2002 2003IMF BIDE IMF BIDE IMF BIDE
Real Non-oil GDP Growth Rate 14.6 16.5 3.0 -6.7 -2.7 -6.3deflator (percentage change) 5.2 -0.2 -4.6 0.0 -7.8 4.3
4 Gross national income is approximated by the sum of non-oil GDP and oil/gas income accruing to the government (royalties and oil tax revenue).
- 6 -
05
1015202530354045
2000 Est. 2001 Est. 2002 Est. 2003 Est. 2004 Est.
Public Private
Timor Leste: non-oil investment as a share of non-oil GDP
Source: IMF staff estimates
Gross fixed capital formation in percent of GDP(Average 2000-2004 )
Tim
or L
este
Emer
ging
Asia
Dev
elop
ing
Coun
tries
Emer
ging
Mar
kets
Leas
t Dev
elop
ed
Coun
tries
Sub-
Saha
ra A
fric
a
0
5
10
15
20
25
30
35
40
Sources: WEO database and IMF staff estimates
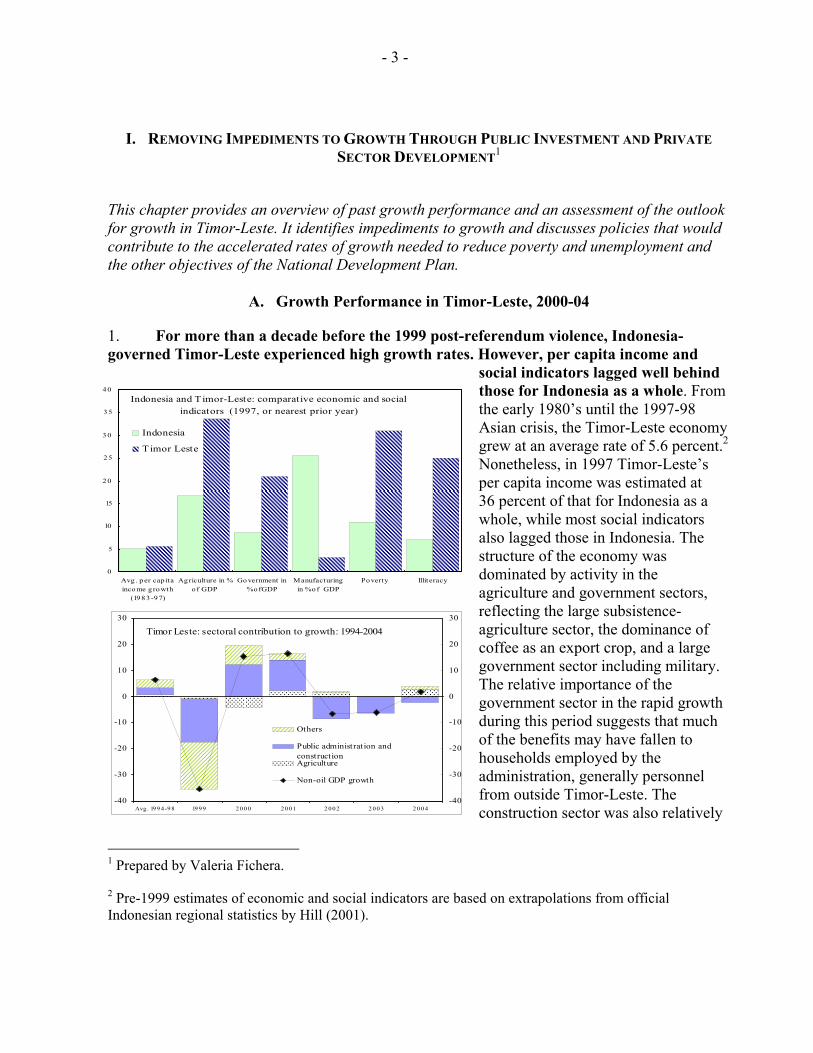
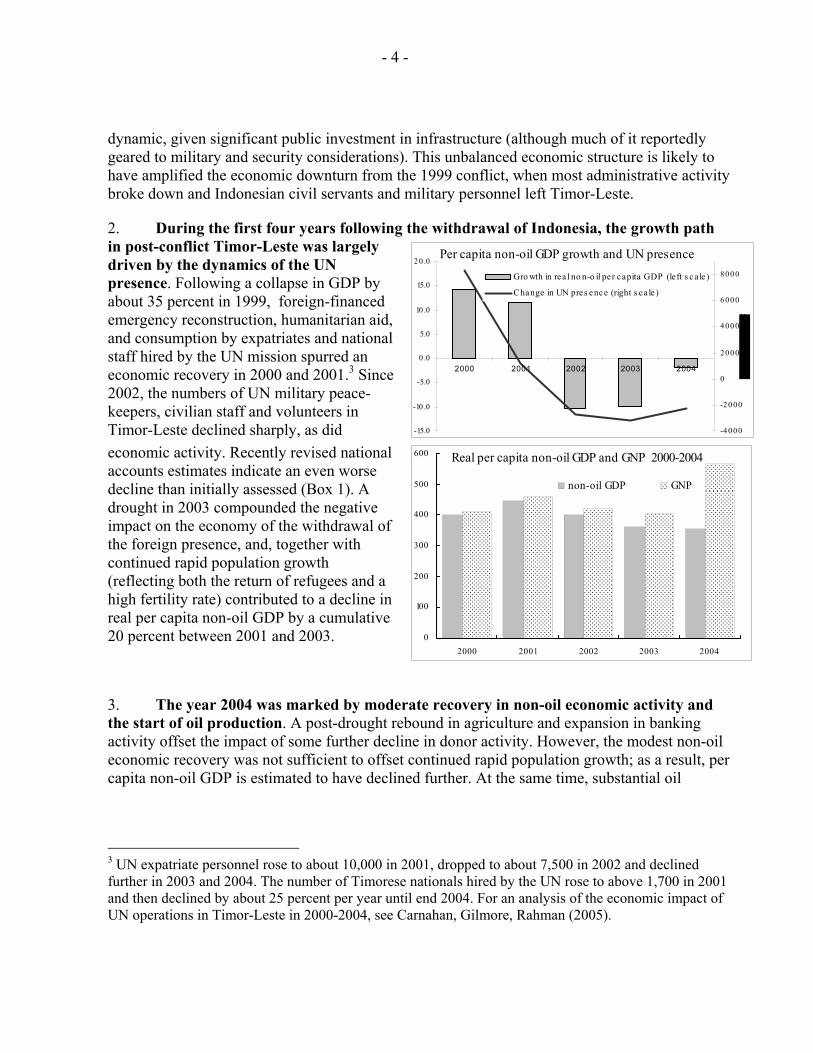
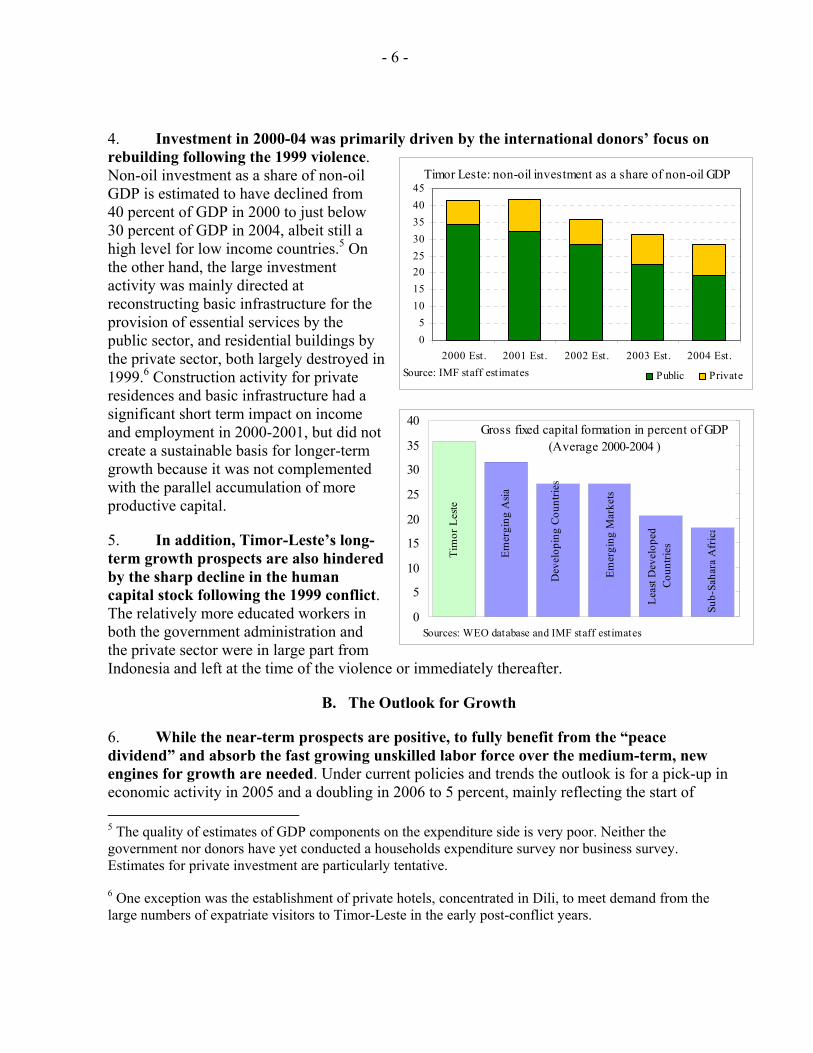
4. Investment in 2000-04 was primarily driven by the international donors’ focus on rebuilding following the 1999 violence. Non-oil investment as a share of non-oil GDP is estimated to have declined from 40 percent of GDP in 2000 to just below 30 percent of GDP in 2004, albeit still a high level for low income countries.5 On the other hand, the large investment activity was mainly directed at reconstructing basic infrastructure for the provision of essential services by the public sector, and residential buildings by the private sector, both largely destroyed in 1999.6 Construction activity for private residences and basic infrastructure had a significant short term impact on income and employment in 2000-2001, but did not create a sustainable basis for longer-term growth because it was not complemented with the parallel accumulation of more productive capital.
5. In addition, Timor-Leste’s long-term growth prospects are also hindered by the sharp decline in the human capital stock following the 1999 conflict. The relatively more educated workers in both the government administration and the private sector were in large part from Indonesia and left at the time of the violence or immediately thereafter.
B. The Outlook for Growth
6. While the near-term prospects are positive, to fully benefit from the “peace dividend” and absorb the fast growing unskilled labor force over the medium-term, new engines for growth are needed. Under current policies and trends the outlook is for a pick-up in economic activity in 2005 and a doubling in 2006 to 5 percent, mainly reflecting the start of 5 The quality of estimates of GDP components on the expenditure side is very poor. Neither the government nor donors have yet conducted a households expenditure survey nor business survey. Estimates for private investment are particularly tentative.
6 One exception was the establishment of private hotels, concentrated in Dili, to meet demand from the large numbers of expatriate visitors to Timor-Leste in the early post-conflict years.
- 7 -
increased public investment spending along with some parallel response from the private sector. However, the authorities’ medium-term growth objective of 6 percent set out in the NDP will be difficult to achieve. Moreover, an even more rapid growth rate may be needed to absorb likely new entrants to the labor force.
7. With respect to other post-conflict economies, Timor-Leste has rapidly established relatively stable social and political conditions, and a solid macroeconomic policy framework—all essential ingredients for growth. On the other hand, the structure of the economy remains skewed toward government activity (including donor-funded projects) and subsistence agriculture. The still limited stock of physical and human capital assets suggests that well-targeted public investment in infrastructure and education and health, together with accelerated private investment in labor-intensive sectors, could trigger a significant productivity and growth response in the economy.
8. Currently, the bright spot in Timor-Leste’s growth outlook is the new oil and gas production although the experience of other low-income resource-rich countries invites caution. Generally, the onset of oil and gas activity triggers limited direct spillovers on the non-oil domestic economy of a country—particularly when activity occurs fully off-shore. Moreover, empirical evidence shows that resource wealth often results in highly volatile growth and destabilizing macroeconomic effects with negative long-term consequences, if the policy framework to manage the resource wealth (or its implementation) is inadequate.7 The contribution of the oil sector to non-oil domestic activity and employment in Timor-Leste will mainly occur through the fiscal channel. In view of the government’s decision to establish sound practices for the management of the oil wealth, as described in Chapter II, Timor-Leste has a good chance of escaping the “oil curse”. The chosen policy framework for using Timor-Leste’s oil/gas wealth should provide a relatively stable and permanent flow of budget resources that would relax some of the constraints faced by most low-income countries for medium-term expenditure planning, particularly for public investment.8
C. Policies to Remove Impediments to Growth
9. Aside from uncertainties in the oil sector, the main risks to the growth outlook for Timor-Leste relate to the pace and strength of further reform. This section looks at the policies needed to remove impediments to growth through realization of well-targeted public investment and introduction of a legislative, regulatory, and administrative framework to attract private investment.
7 See Sachs and Warner (2001) on the natural resource curse and Richard Auty (2000) on the role of domestic economic policy and governance structure in explaining the impact of natural resource abundance on economic growth.
8 A successful example of effective long-term natural resource management and public investment set in a sustainable fiscal framework is Botswana.
- 8 -
Sectoral Composition of public spending(in percent of total spending)
Infrastructure Health and Education
Governance, Security and
Peace-buildingOther
0
5
10
15
20
25
30
35
40
FY 1999/2000-FY 2003/04
SIP s : FY 2004/05-2008/09
Source: Ovrview o f Secto r Inves tment Prog rams, Ap ril 2 005, Minis t ry o f Planning and Finance.
Well-Targeted Public Investment
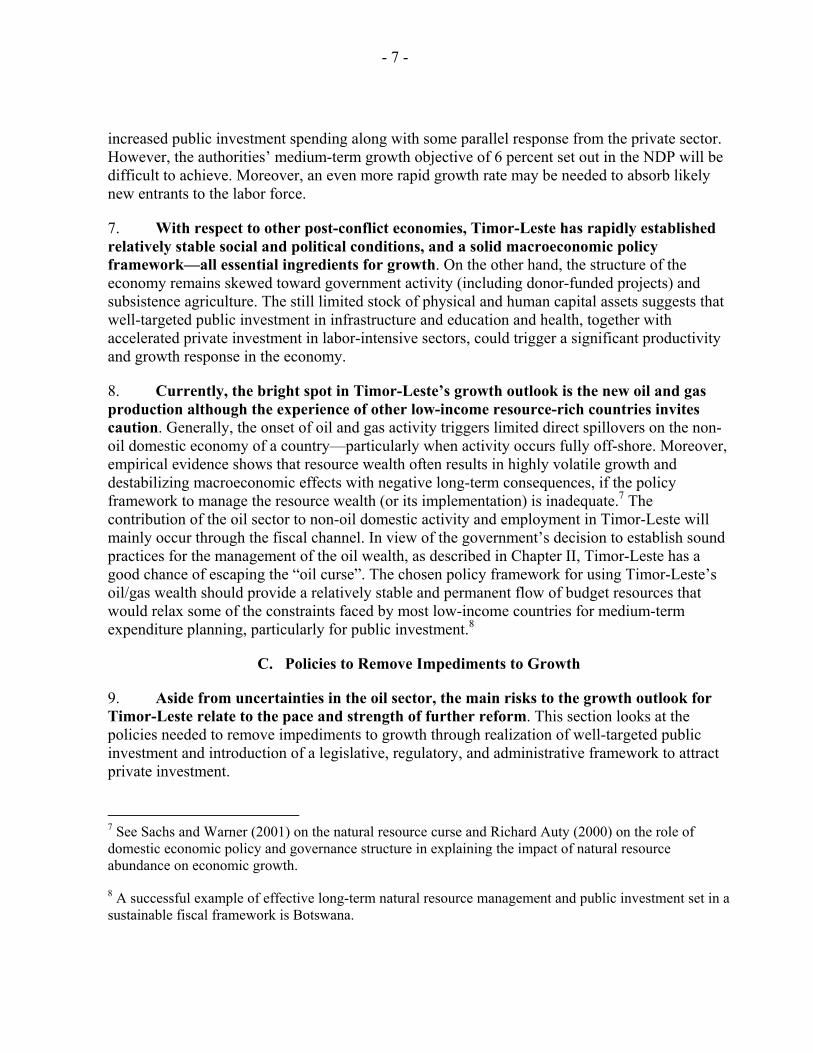
10. With the transition from post conflict emergency now ending, public investment should become more growth-oriented. Through the Sector Investment Programs (SIPs), the government has strengthened its commitment to use fiscal resources in support of non-oil sector growth and poverty reduction. The SIPs appropriately presume the maintenance of stable macroeconomic conditions; and the draft budget for FY 2005/06 and the
accompanying medium-term fiscal framework are in line with this assumption.9 The investment programs have been refocused on infrastructure and the maintenance of still significant allocations to human capital development. The choice is wise and respects the need for complementarities between public and private investment for long term development. However, the slow pace of execution of on-budget public investment must accelerate, particularly to offset any possibility of emerging slack from declining donor funded off-budget projects. The government needs to be ready to further refine public investment priorities to ensure that projects with the highest expected economic and social return are undertaken first, if donors support falls short of desired levels.
11. Limited access to electricity and relatively high prices suggests that investment in the power sector could impact growth positively, including in the rural areas. The SIPs include a large budget allocation to the power sector to increase supply, reduce costs, expand coverage and enhance reliability. In FY 2005/06, the government envisages starting the construction of the first large hydro-power project in the country (Ira Lalaro) and of transmission lines to connect to the Dili system, once the environmental impact assessment has been completed. Studies are also ongoing to gauge the economic feasibility of using onshore oil/gas seeps for power generation, particularly for the use of local communities close to the seeps, some of which are located in very poor areas. Currently, an external management contractor is operating the state electricity agency EDTL. The external contractor started running EDTL in
9 Despite a large increase in spending (particularly for development expenditure) in the draft FY 2005/06 budget, total spending is programmed below sustainable spending. This choice will limit the risk that demand pressures on the small domestic economy trigger inflation pressures. It also reduces the risks that public funds would be wasted, particularly given still weak domestic administration.
- 9 -
0 10 20 30 40 50 60
0-14
15-29
30-44
45-59
60+ Population by age group
Source: Demographic and Health Survey. (World Bank, 2003)
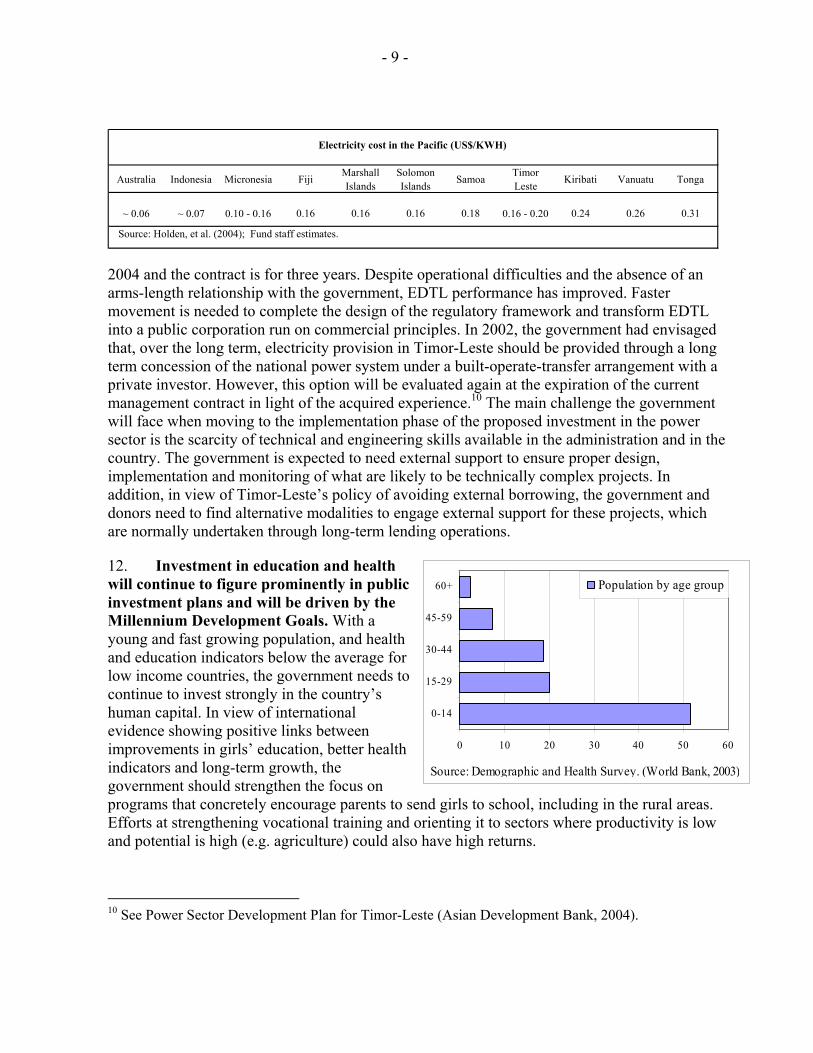
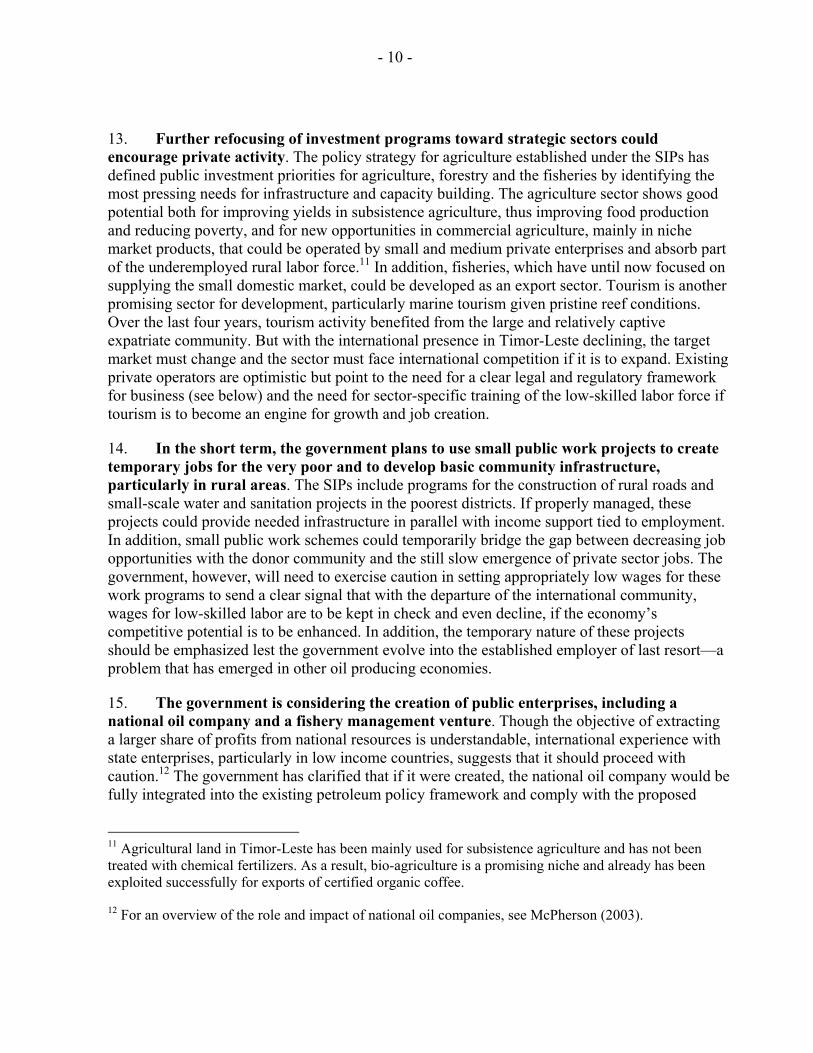
2004 and the contract is for three years. Despite operational difficulties and the absence of an arms-length relationship with the government, EDTL performance has improved. Faster movement is needed to complete the design of the regulatory framework and transform EDTL into a public corporation run on commercial principles. In 2002, the government had envisaged that, over the long term, electricity provision in Timor-Leste should be provided through a long term concession of the national power system under a built-operate-transfer arrangement with a private investor. However, this option will be evaluated again at the expiration of the current management contract in light of the acquired experience.10 The main challenge the government will face when moving to the implementation phase of the proposed investment in the power sector is the scarcity of technical and engineering skills available in the administration and in the country. The government is expected to need external support to ensure proper design, implementation and monitoring of what are likely to be technically complex projects. In addition, in view of Timor-Leste’s policy of avoiding external borrowing, the government and donors need to find alternative modalities to engage external support for these projects, which are normally undertaken through long-term lending operations.
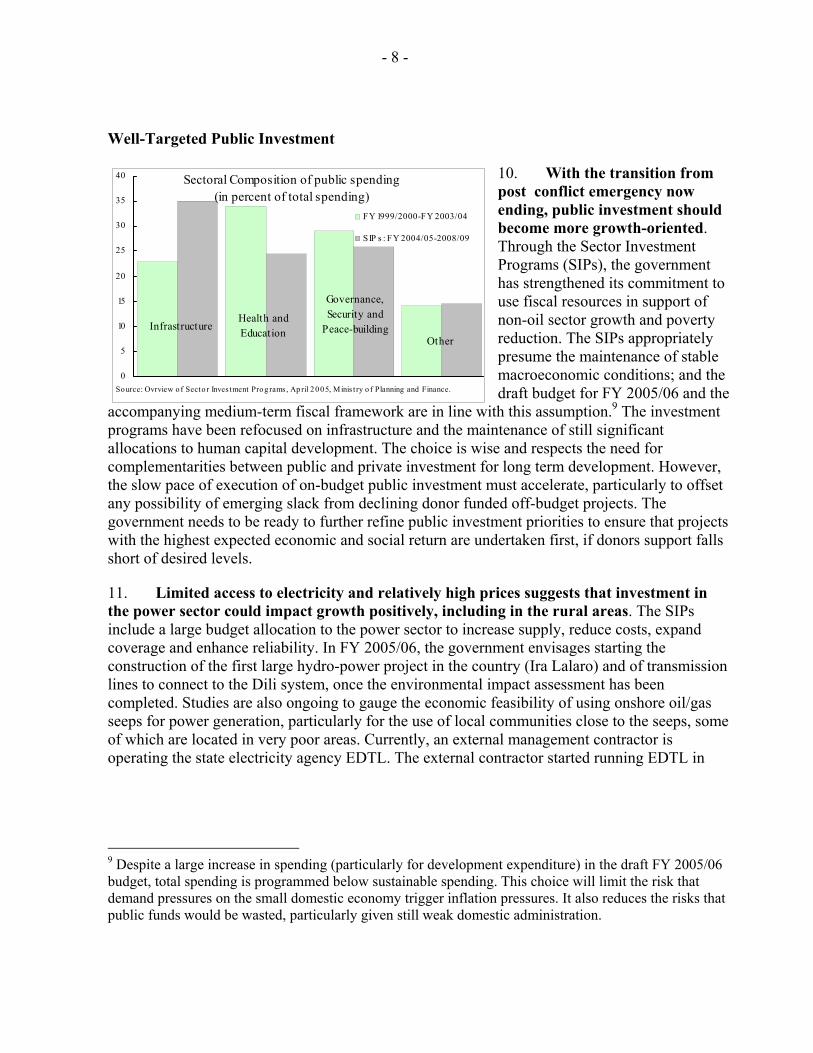
12. Investment in education and health will continue to figure prominently in public investment plans and will be driven by the Millennium Development Goals. With a young and fast growing population, and health and education indicators below the average for low income countries, the government needs to continue to invest strongly in the country’s human capital. In view of international evidence showing positive links between improvements in girls’ education, better health indicators and long-term growth, the government should strengthen the focus on programs that concretely encourage parents to send girls to school, including in the rural areas. Efforts at strengthening vocational training and orienting it to sectors where productivity is low and potential is high (e.g. agriculture) could also have high returns.
10 See Power Sector Development Plan for Timor-Leste (Asian Development Bank, 2004).
Electricity cost in the Pacific (US$/KWH)
Australia Indonesia Micronesia Fiji Marshall Islands
Solomon Islands Samoa Timor
Leste Kiribati Vanuatu Tonga
~ 0.06 ~ 0.07 0.10 - 0.16 0.16 0.16 0.16 0.18 0.16 - 0.20 0.24 0.26 0.31
Source: Holden, et al. (2004); Fund staff estimates.
- 10 -
13. Further refocusing of investment programs toward strategic sectors could encourage private activity. The policy strategy for agriculture established under the SIPs has defined public investment priorities for agriculture, forestry and the fisheries by identifying the most pressing needs for infrastructure and capacity building. The agriculture sector shows good potential both for improving yields in subsistence agriculture, thus improving food production and reducing poverty, and for new opportunities in commercial agriculture, mainly in niche market products, that could be operated by small and medium private enterprises and absorb part of the underemployed rural labor force.11 In addition, fisheries, which have until now focused on supplying the small domestic market, could be developed as an export sector. Tourism is another promising sector for development, particularly marine tourism given pristine reef conditions. Over the last four years, tourism activity benefited from the large and relatively captive expatriate community. But with the international presence in Timor-Leste declining, the target market must change and the sector must face international competition if it is to expand. Existing private operators are optimistic but point to the need for a clear legal and regulatory framework for business (see below) and the need for sector-specific training of the low-skilled labor force if tourism is to become an engine for growth and job creation.
14. In the short term, the government plans to use small public work projects to create temporary jobs for the very poor and to develop basic community infrastructure, particularly in rural areas. The SIPs include programs for the construction of rural roads and small-scale water and sanitation projects in the poorest districts. If properly managed, these projects could provide needed infrastructure in parallel with income support tied to employment. In addition, small public work schemes could temporarily bridge the gap between decreasing job opportunities with the donor community and the still slow emergence of private sector jobs. The government, however, will need to exercise caution in setting appropriately low wages for these work programs to send a clear signal that with the departure of the international community, wages for low-skilled labor are to be kept in check and even decline, if the economy’s competitive potential is to be enhanced. In addition, the temporary nature of these projects should be emphasized lest the government evolve into the established employer of last resort—a problem that has emerged in other oil producing economies.
15. The government is considering the creation of public enterprises, including a national oil company and a fishery management venture. Though the objective of extracting a larger share of profits from national resources is understandable, international experience with state enterprises, particularly in low income countries, suggests that it should proceed with caution.12 The government has clarified that if it were created, the national oil company would be fully integrated into the existing petroleum policy framework and comply with the proposed
11 Agricultural land in Timor-Leste has been mainly used for subsistence agriculture and has not been treated with chemical fertilizers. As a result, bio-agriculture is a promising niche and already has been exploited successfully for exports of certified organic coffee.
12 For an overview of the role and impact of national oil companies, see McPherson (2003).
- 11 -
Private sector investment and growth (Avg. 1981-2003) 1/
Thai
land
Mal
aysia
Mal
dive
s
Mau
ritiu
s
Tim
or L
este
0
5
10
15
20
25
0
1
2
3
4
5
6
7
Real GDP growth rate(right scale)
Sources: WEO database and Fund staff estimates.1/ For T imor Leste estimated average for 2000-2004 (non-oil GDP).
Private sector investment in percent of GDP (left scale)
petroleum fund and saving policy requirements. On the other hand, the limited availability of human capital and the persistent scarcity of capacity in government administration suggests the possible diversion of the most skilled workers toward the national oil company could further delay capacity building in the non-oil sector.13 In the fisheries sector, creation of a public enterprise raises the risk of discouraging the emergence of private commercial enterprises, particularly if the sector regulator is also the owner of a company competing in the sector. In any decision regarding the creation of state-owned enterprises, the government should carefully weigh the risk of crowding out private sector investment. If a decision to establish a state company is taken nonetheless, a transparent regulatory framework that credibly addresses potential conflicts of interest should be established upfront.
Creating the Environment to Stimulate Private Sector Activity
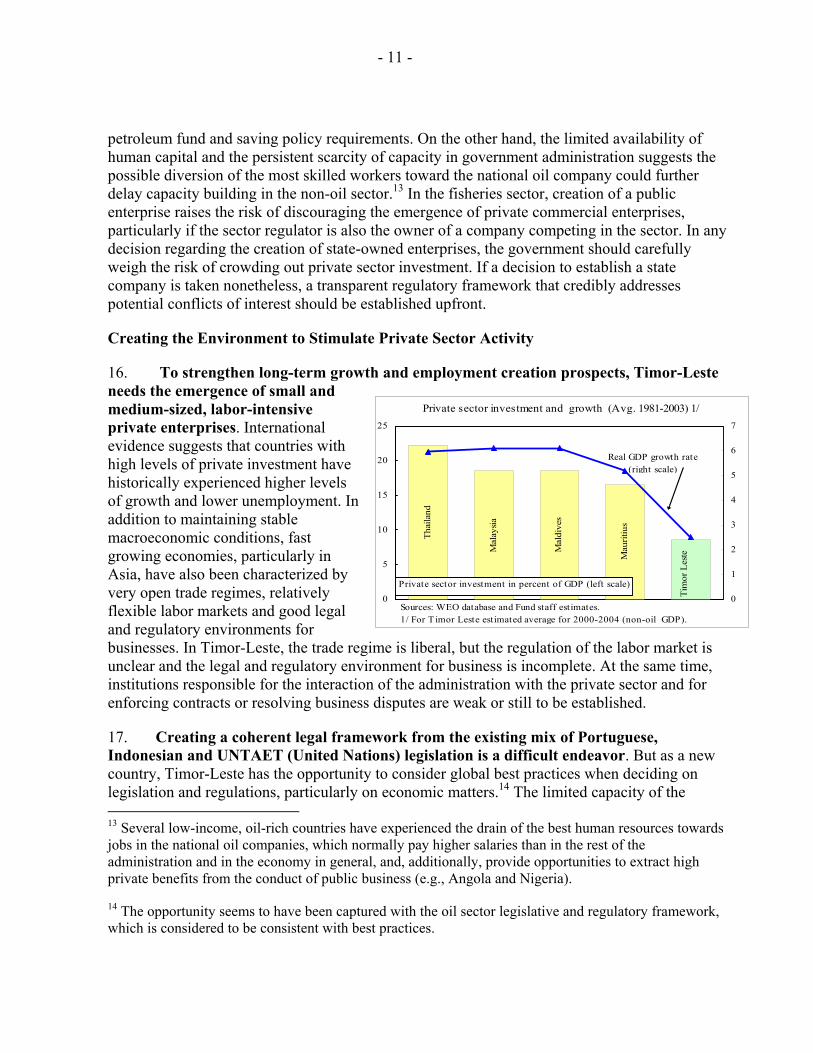
16. To strengthen long-term growth and employment creation prospects, Timor-Leste needs the emergence of small and medium-sized, labor-intensive private enterprises. International evidence suggests that countries with high levels of private investment have historically experienced higher levels of growth and lower unemployment. In addition to maintaining stable macroeconomic conditions, fast growing economies, particularly in Asia, have also been characterized by very open trade regimes, relatively flexible labor markets and good legal and regulatory environments for businesses. In Timor-Leste, the trade regime is liberal, but the regulation of the labor market is unclear and the legal and regulatory environment for business is incomplete. At the same time, institutions responsible for the interaction of the administration with the private sector and for enforcing contracts or resolving business disputes are weak or still to be established.
17. Creating a coherent legal framework from the existing mix of Portuguese, Indonesian and UNTAET (United Nations) legislation is a difficult endeavor. But as a new country, Timor-Leste has the opportunity to consider global best practices when deciding on legislation and regulations, particularly on economic matters.14 The limited capacity of the 13 Several low-income, oil-rich countries have experienced the drain of the best human resources towards jobs in the national oil companies, which normally pay higher salaries than in the rest of the administration and in the economy in general, and, additionally, provide opportunities to extract high private benefits from the conduct of public business (e.g., Angola and Nigeria).
14 The opportunity seems to have been captured with the oil sector legislative and regulatory framework, which is considered to be consistent with best practices.
- 12 -
administration and the diverse background of external advisors have occasionally transformed this opportunity into a serious challenge, and raised the risk for inconsistencies in the legal framework that could hinder economic activity. To limit this risk and accelerate the preparation of legislation in support of private sector activity, strengthened legal and economic expertise in business-related legislation is needed. The focus should be on ensuring coherence and identifying at an early stage the by-laws, implementing regulations and administrative responsibilities needed for effective introduction of economic legislation.
18. The recent adoption by parliament of the investment laws, the insurance laws and the law regulating private lease contracts bodes well for further progress with the lagging agenda on private sector development. Most of the approved laws indicate deadlines for the issuance of implementing regulations and the government should strive to abide by them.
• The investment laws establish a framework for domestic and foreign investment in Timor-Leste and the interaction of investors with the administration. However, tax incentives included in the laws may complicate implementation and entail difficult to assess revenue costs. The implementing regulations for the investment laws should minimize the risks for unwarranted revenue losses and establish clear limits to administrative discretion.
• The creation of an investment and export promotion agency to operate as a one-stop-shop for foreign investors is envisaged in the foreign investment law. The agency is scheduled to start operating by end-2005.
• The adoption of the insurance law was also a much awaited step by the business community that was confronted with higher costs because of lack of access to insurance against standard risks. The Banking and Payments Authority is designated as the sector regulator. It is important that the licensing of insurance companies starts soon, but also that new entrants in the market are competent and financially solid.
• The law on leasing between private parties together with the decree law on the leasing of government property will encourage property rental and increase transparency in how public land and properties are leased.
19. However, the still pending legislative agenda in support of the economy remains large and calls for enhanced commitment by the government.
• The completion of land legislation will take time because of the need to establish a cadastre before comprehensive land titling can go forward.15 Progress with land titling is essential for resolving land disputes, to encourage investment in land improvements and allow for the use of land as collateral in financial transactions. The government therefore
15 Experts estimate that the set up of the cadastre and comprehensive land titling may require 3 to 5 years.
- 13 -
needs to keep a fast pace in progressing with the land legislation agenda, even if the task will require a few years.
• The government also needs to accelerate action towards the finalization of a bankruptcy law, for which the first draft has been under preparation for more than a year. Though the small size of the formal private sector might suggest that business solvency crisis would not have widespread effect, the lack of a bankruptcy law creates a regulatory vacuum and adds uncertainty for investors. The recent rapid increase in bank credit to the private sector, including small businesses, strengthen the case for faster progress in establishing a legal framework that defines the rights of different categories of creditors in the case of insolvency.
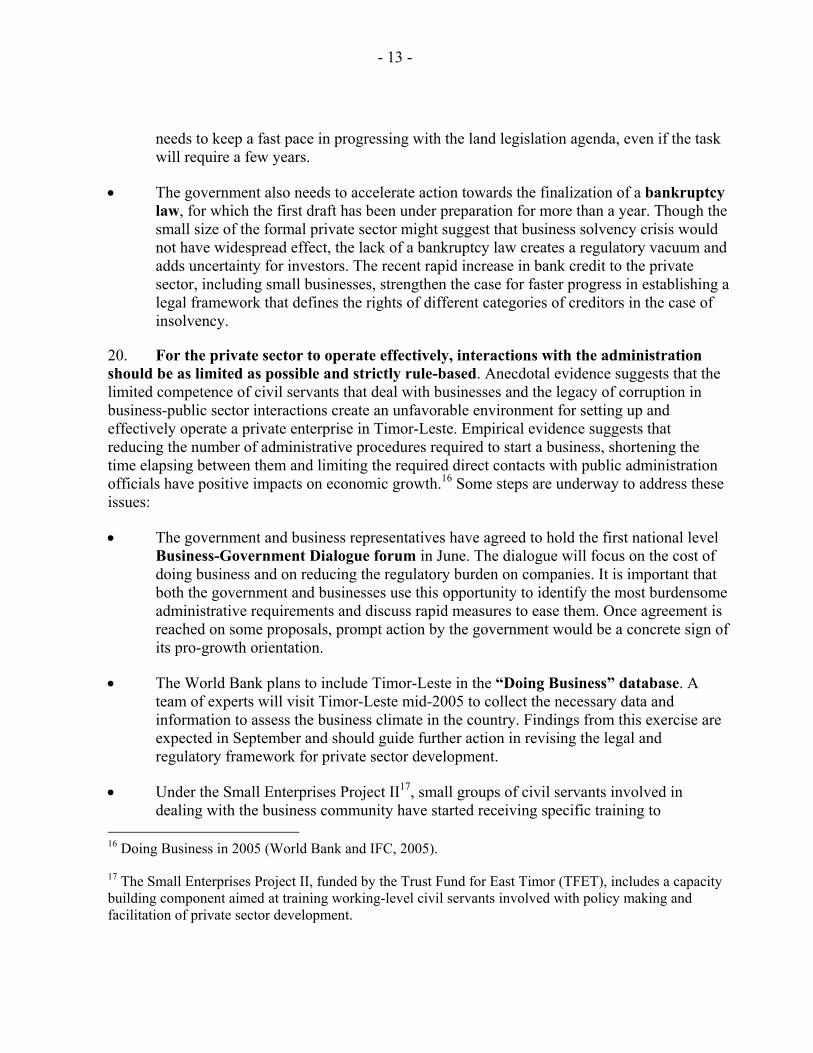
20. For the private sector to operate effectively, interactions with the administration should be as limited as possible and strictly rule-based. Anecdotal evidence suggests that the limited competence of civil servants that deal with businesses and the legacy of corruption in business-public sector interactions create an unfavorable environment for setting up and effectively operate a private enterprise in Timor-Leste. Empirical evidence suggests that reducing the number of administrative procedures required to start a business, shortening the time elapsing between them and limiting the required direct contacts with public administration officials have positive impacts on economic growth.16 Some steps are underway to address these issues:
• The government and business representatives have agreed to hold the first national level Business-Government Dialogue forum in June. The dialogue will focus on the cost of doing business and on reducing the regulatory burden on companies. It is important that both the government and businesses use this opportunity to identify the most burdensome administrative requirements and discuss rapid measures to ease them. Once agreement is reached on some proposals, prompt action by the government would be a concrete sign of its pro-growth orientation.
• The World Bank plans to include Timor-Leste in the “Doing Business” database. A team of experts will visit Timor-Leste mid-2005 to collect the necessary data and information to assess the business climate in the country. Findings from this exercise are expected in September and should guide further action in revising the legal and regulatory framework for private sector development.
• Under the Small Enterprises Project II17, small groups of civil servants involved in dealing with the business community have started receiving specific training to
16 Doing Business in 2005 (World Bank and IFC, 2005).
17 The Small Enterprises Project II, funded by the Trust Fund for East Timor (TFET), includes a capacity building component aimed at training working-level civil servants involved with policy making and facilitation of private sector development.
- 14 -
strengthen the capacity of the administration to deal professionally with the private sector. The training will need to be extended and re-tailored once the results of the business-government forum and the “doing business” assessment would have provided indications for priority needs.
21. Finally, a competent and independent judiciary is essential for contract enforcement and business dispute resolution. Progress with capacity building in the judiciary has been particularly slow. The courts remain very weak and judicial activity is currently managed by internationally appointed judges, following the failure of all Timorese judges to pass a qualification exam. The national judges are now undergoing training, partly on the job, which is scheduled to last two years. Eventually, the country will also need to establish specialized commercial courts or commercial divisions in regular courts to attend to commercial disputes. In the interim, the government will need to rely on the set-up of alternative out-of-court dispute resolution mechanisms, while starting planning on specific training for the judges and court actors that will be involved in commercial cases.
D. Conclusion
22. Timor-Leste’s public investment program and plans to set up a legal and regulatory framework supportive of private sector development point in the right direction, but faster implementation is needed. The main challenges will come from the limited capacity of the administration to design, execute and monitor investment programs of increasing complexity; and from the low capacity of the administration and other public institutions to meet the needs of the business community.
23. Creative solutions will be needed to proceed at a faster speed with complex public investment projects that are essential for long-term growth. The government and its development partners will need to design new modalities to ensure that the implementation of complex projects, including major extension to power generation and the distribution network, can proceed despite the limited domestic technical capacity. At the same time, new projects should include substantial training and capacity building components in order to relax over time the binding capacity constraint.
24. Completing the essential legislative and regulatory framework to enable new non-oil private sector activities remains an immediate priority. The steps taken with the adoption of the investment laws, the insurance law and the creation of the investment and export promotion agency are promising signs to investors. However, implementation will remain the ultimate test of the government’s commitment to private sector development. Over the longer term, it is important to strengthen the administrative agencies dealing with businesses and to build the necessary institutions for proper contract enforcement and dispute resolution.
- 15 -
References
Asian Development Bank, 2004, Power Sector Development Plan for Timor-Leste.
Auty, Richard M., 2000, “How Natural Resources Affect Economic Development,” Development Policy Review, Vol. 18, pp. 347–364.
Carnahan, Michael, Scott Gillmore, and Monika Rahman, 2005, “Economic Impact of Peacekeeping,” Interim Report Phase I, United Nations Peacekeeping.
Hill, Hall, 2001, “Tiny, Poor and War-Torn: Development Policy Challenges for East Timor” World Development, Vol. 29, pp. 1137–1156.
Holden, Paul, Malcom Bale, and Sarah Holden, 2004, “Swimming Against the Tide?: An Assessment of the Private Sector in the Pacific,” Pacific Studies Series, Asian Development Bank.
McPherson, Charles, 2003, “National Oil Companies: Evolution, Issues, Outlook” in Fiscal Policy Formulation and Implementation in Oil-Producing Countries, Ed. by J.M. Davis, R. Ossowski, A. Fedelino, International Monetary Fund.
Sachs, Jeffrey D., and Andrew Warner, 2001, “The Curse of Natural Resources” European Economic Review, Vol. 45, pp. 827–838.
World Bank, 2005, “Doing Business in 2005, Removing Obstacles to Growth.”

- 16 -
II. MANAGING OIL/GAS WEALTH IN TIMOR-LESTE1
A. Introduction
1. The 2004 onset of oil/gas production in Timor-Leste marks a turning point for the impoverished and newly independent country. Oil/gas revenue from the existing Bayu Undan field is estimated at $3.2 billion (NPV terms) over 20 years, more than nine times Timor-Leste’s 2004 non-oil GDP. These prospects are uncertain: they could be higher if new projects are undertaken or lower if oil prices return to historical norms. To date the new oil revenue has contributed to a sharp improvement in the fiscal situation, with the central government surplus (including grants) moving from 10 percent of non-oil GDP in FY03/04 to 70 percent of non-oil GDP in FY04/05.2
2. Many economies with significant natural resources have suffered from the “resource curse.” Weak institutions, lack of transparency, and political pressures have often resulted in misuse and misallocation of the resources. Boom-burst cycles in oil/gas-producing countries have been at least partially caused by fiscal policies that followed oil/gas price developments. To date, many oil/gas producing countries have had difficulty achieving economic stability and high sustained growth.
3. Timor-Leste’s long-run economic prospects will thus depend on its strategy for use of its oil/gas wealth. The key challenge for the government will be the effective use of oil/gas wealth for the development of the economy by preserving the right balance between spending and saving for future generations. This chapter is organized as follows: Section B reviews the macroeconomic challenges commonly faced by oil/gas exporters, Section C discusses Timor-Leste’s oil/gas revenue outlook, Section D describes Timor-Leste’s plans for managing its oil/gas wealth through a natural resource (petroleum) fund and a saving policy, and Section E provides some conclusions.
B. Managing Natural Resources: Challenges Facing Oil/Gas Producing Countries
4. The past experience of resource-rich economies is often one of poor macroeconomic performance in the absence of good policies for managing the wealth. Studies show that resource-rich economies generally grow less rapidly than those without natural resource wealth. The challenges that arise include the following:
5. Fiscal policy in oil/gas countries may be excessively expansionary. Frequently, government spending exceeds appropriate levels given long-term considerations, without convincing signs that the higher spending has been able to lift the productive potential of the economy. This is related to volatile oil/gas prices, which may translate into pro-cyclical 1 Prepared by Yitae Kevin Kim.
2 The fiscal year runs July to June.
- 17 -
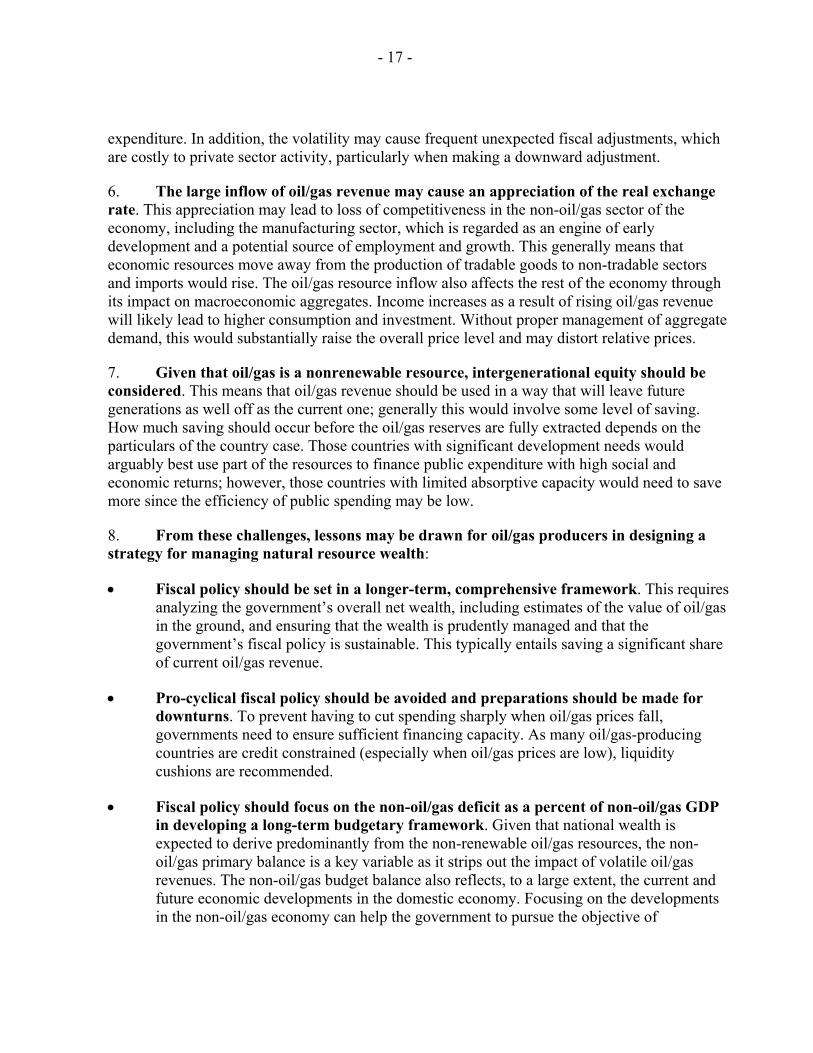
expenditure. In addition, the volatility may cause frequent unexpected fiscal adjustments, which are costly to private sector activity, particularly when making a downward adjustment.
6. The large inflow of oil/gas revenue may cause an appreciation of the real exchange rate. This appreciation may lead to loss of competitiveness in the non-oil/gas sector of the economy, including the manufacturing sector, which is regarded as an engine of early development and a potential source of employment and growth. This generally means that economic resources move away from the production of tradable goods to non-tradable sectors and imports would rise. The oil/gas resource inflow also affects the rest of the economy through its impact on macroeconomic aggregates. Income increases as a result of rising oil/gas revenue will likely lead to higher consumption and investment. Without proper management of aggregate demand, this would substantially raise the overall price level and may distort relative prices.
7. Given that oil/gas is a nonrenewable resource, intergenerational equity should be considered. This means that oil/gas revenue should be used in a way that will leave future generations as well off as the current one; generally this would involve some level of saving. How much saving should occur before the oil/gas reserves are fully extracted depends on the particulars of the country case. Those countries with significant development needs would arguably best use part of the resources to finance public expenditure with high social and economic returns; however, those countries with limited absorptive capacity would need to save more since the efficiency of public spending may be low.
8. From these challenges, lessons may be drawn for oil/gas producers in designing a strategy for managing natural resource wealth:
• Fiscal policy should be set in a longer-term, comprehensive framework. This requires analyzing the government’s overall net wealth, including estimates of the value of oil/gas in the ground, and ensuring that the wealth is prudently managed and that the government’s fiscal policy is sustainable. This typically entails saving a significant share of current oil/gas revenue.
• Pro-cyclical fiscal policy should be avoided and preparations should be made for downturns. To prevent having to cut spending sharply when oil/gas prices fall, governments need to ensure sufficient financing capacity. As many oil/gas-producing countries are credit constrained (especially when oil/gas prices are low), liquidity cushions are recommended.
• Fiscal policy should focus on the non-oil/gas deficit as a percent of non-oil/gas GDP in developing a long-term budgetary framework. Given that national wealth is expected to derive predominantly from the non-renewable oil/gas resources, the non-oil/gas primary balance is a key variable as it strips out the impact of volatile oil/gas revenues. The non-oil/gas budget balance also reflects, to a large extent, the current and future economic developments in the domestic economy. Focusing on the developments in the non-oil/gas economy can help the government to pursue the objective of
- 18 -
diversifying the economy and to create a tax base that does not solely rely on oil/gas revenues.
• Transparency should be a guidepost in managing the oil/gas wealth and fiscal policy. At the same time, accumulated assets could be invested overseas to prevent real exchange rate appreciation and minimize risks to the real value of the asset.
C. Oil/Gas Sector Prospects
9. The prospects for oil/gas production in Timor-Leste are favorable, although still highly uncertain. Production of oil/gas in the Timor Sea is already providing Timor-Leste with
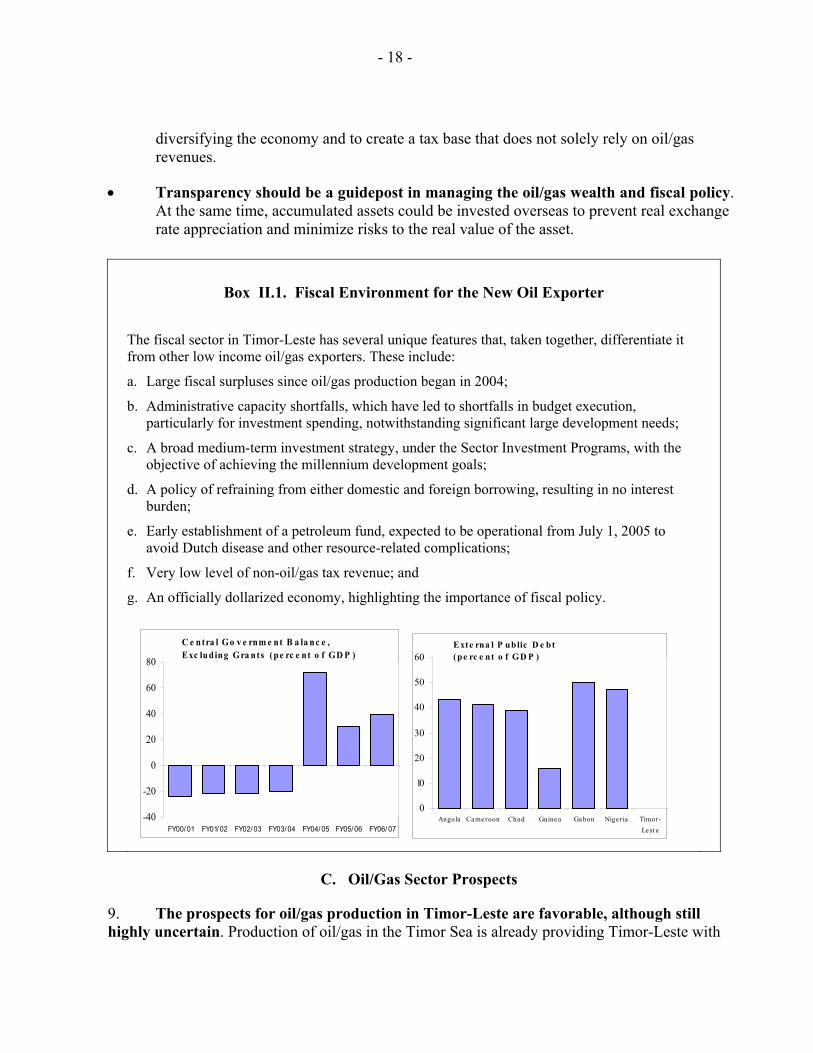
Box II.1. Fiscal Environment for the New Oil Exporter
The fiscal sector in Timor-Leste has several unique features that, taken together, differentiate it from other low income oil/gas exporters. These include:
a. Large fiscal surpluses since oil/gas production began in 2004;
b. Administrative capacity shortfalls, which have led to shortfalls in budget execution, particularly for investment spending, notwithstanding significant large development needs;
c. A broad medium-term investment strategy, under the Sector Investment Programs, with the objective of achieving the millennium development goals;
d. A policy of refraining from either domestic and foreign borrowing, resulting in no interest burden;
e. Early establishment of a petroleum fund, expected to be operational from July 1, 2005 to avoid Dutch disease and other resource-related complications;
f. Very low level of non-oil/gas tax revenue; and
g. An officially dollarized economy, highlighting the importance of fiscal policy.
C e ntra l Go v e rnm e nt B a la nc e , Exc luding Gra nts (pe rc e nt o f GD P )
-40
-20
0
20
40
60
80
FY00/ 01 FY01/ 02 FY02/ 03 FY03/ 04 FY04/ 05 FY05/ 06 FY06/ 07
Exte rna l P ublic D e bt (pe rc e nt o f GD P )
0
10
20
30
40
50
60
Angola Ca me roon Cha d Guine a Ga bon Nige ria Timor-Le st e
- 19 -
significant revenues; updated revenue projections show petroleum revenues of around US$ 3.2 billion, more than 9 times 2004 non-oil GDP.3 Development of other fields and additional exploration for both onshore and off-shore areas are planned. The Phoenix field, adjacent to the current Bayu-Undan production area, has an estimated value of 2.26 trillion cubic feet of gas, and could extend the life of the Bayu-Undan field by around 15 years from 2023. The Greater Sunrise field has 8.3 trillion cubic feet of gas (three times that of Bayu-Undan) and around 200 million barrels of oil/gas. The allocation of revenue from Greater Sunrise will depend on the outcome of current negotiations with Australia.
10. Major oil/gas fields. Timor-Leste’s oil/gas revenue is generated from the commercial exploitation of oil/gas/ resources mostly in the “Timor Gap” (Box 2). Major oil/gas fields discovered to date include the Elang-Kakatua-North (EKKN), Bayu-Undan, Phoenix, and Great Sunrise fields. The Bayu-Undan field is currently the main source of oil/gas revenue. Resources from the EKKN field were limited and are nearing exhaustion. The timeframe for the Great Sunrise field remains uncertain, pending conclusion of negotiations with Australia regarding an area of disputed sovereignty with some recent reports suggesting these negotiations are nearing conclusion.
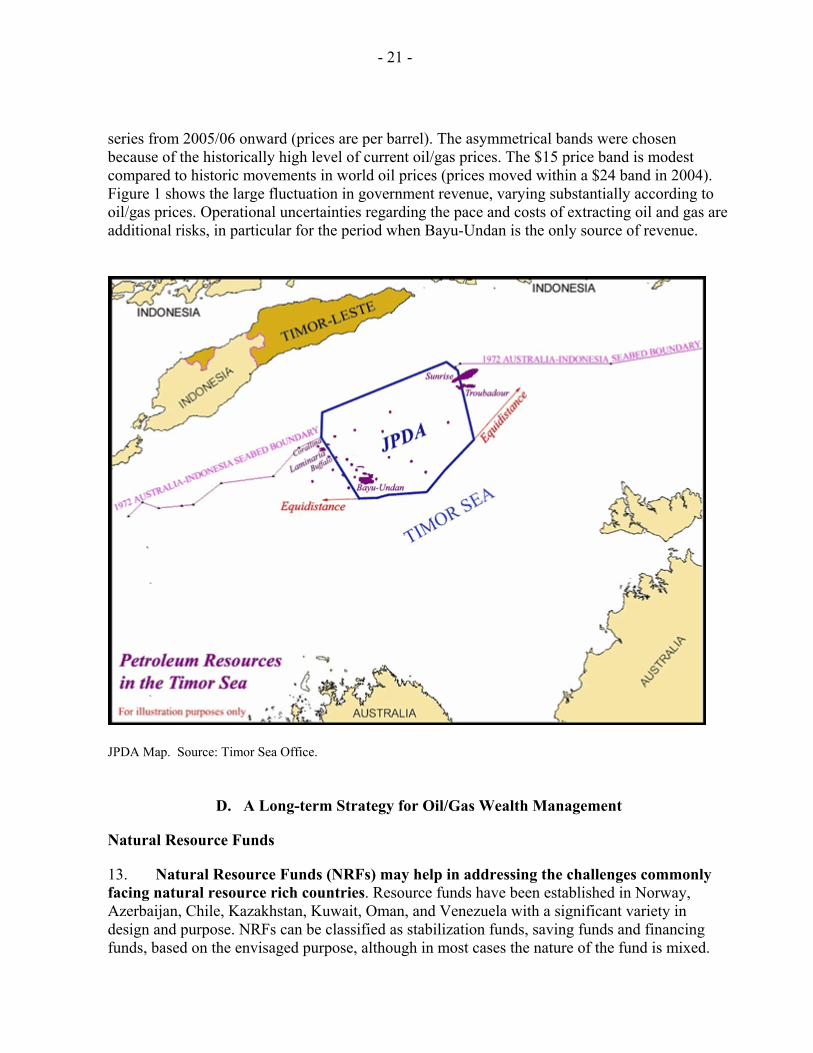
11. Revenue sharing arrangement. The commercial exploitation of oil/gas in the Timor Gap is governed by the Timor Sea Treaty signed between Timor-Leste and Australia on May 29, 2002. Under the Treaty, the Timor Gap is partitioned into tree areas: (1) the Joint Petroleum Development Area (JPDA) (see JPDA Map below), (2) an area under Australian jurisdiction, and (3) an area under Timor-Leste jurisdiction. Oil/gas revenue in the JPDA are shared between Timor-Leste and Australia with a 90/10 split.4 The Bayu-Undan field is located entirely in the JPDA, while the Great Sunrise field straddles the boundary of the JPDA to areas that are claimed by both countries.
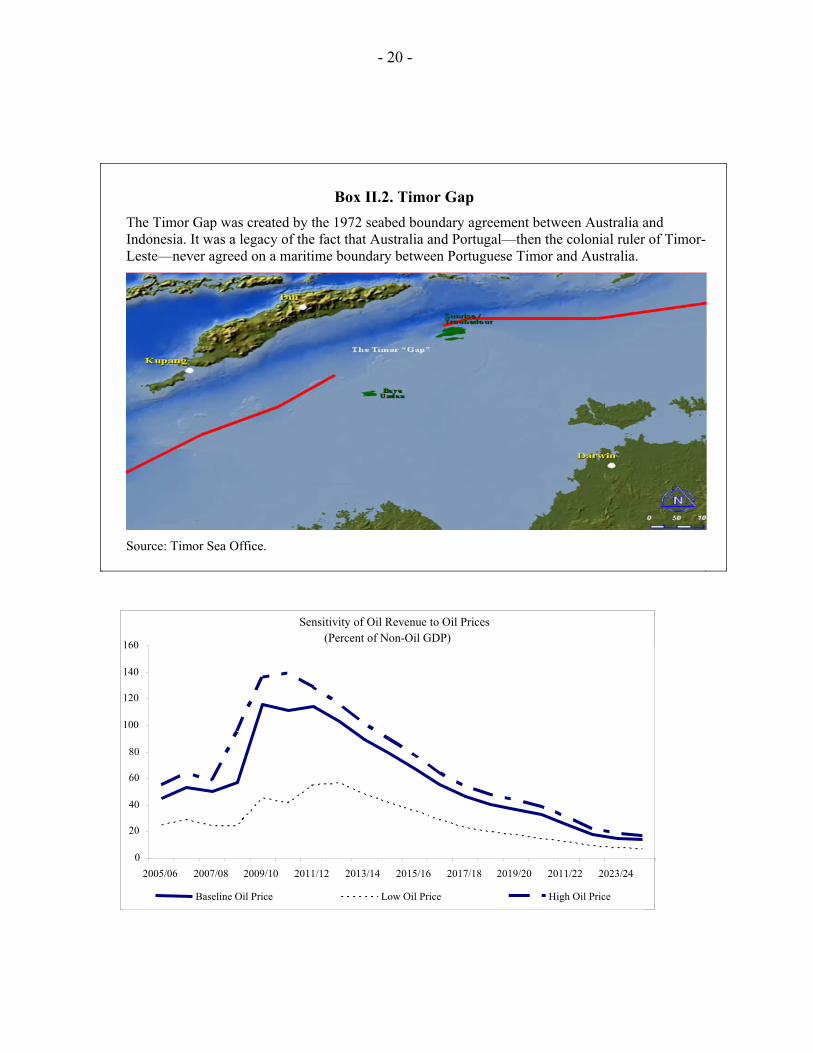
12. The outlook for oil/gas revenue is highly sensitive to oil/gas prices as well as production. The sensitivity analysis of the projection for revenue from Bayu-Undan is based on data provided by the authorities and is largely derived from ConocoPhillips, the oil/gas extraction company that is the principal “operator” for Bayu-Undan. Estimating oil/gas revenue is highly difficult mainly due to the non-linearity of price elasticity oil/gas revenue (profit oil/gas revenue is contingent on movements in oil/gas prices) and the volatility of world oil prices. The scenarios taken for the analysis assume prices that are $5 higher and $10 lower than the baseline 3 Oil/gas revenue is based on the NYMEX forward price minus 5 dollars ($39.6, $38.2, $35.9, $34.5, $33.7, and $33.2 per barrel, 2004/05–2009/10). Future prices after 2010/11 are assumed to grow 2.5 percent a year. 4 The Timor-Leste Government receives two streams of revenue from the petroleum fields in the JDPA, tax revenue and royalty payments. Tax revenue is gained by levying taxes (including income and withholding taxes and VAT) on companies (e.g., petroleum and construction companies) operating in the JDPA. The Government also gets royalty payments, called first tranche petroleum (FTP), from the Bayu-Undan field when the petroleum companies sell the Government's share of petroleum on the Government's behalf.
- 20 -
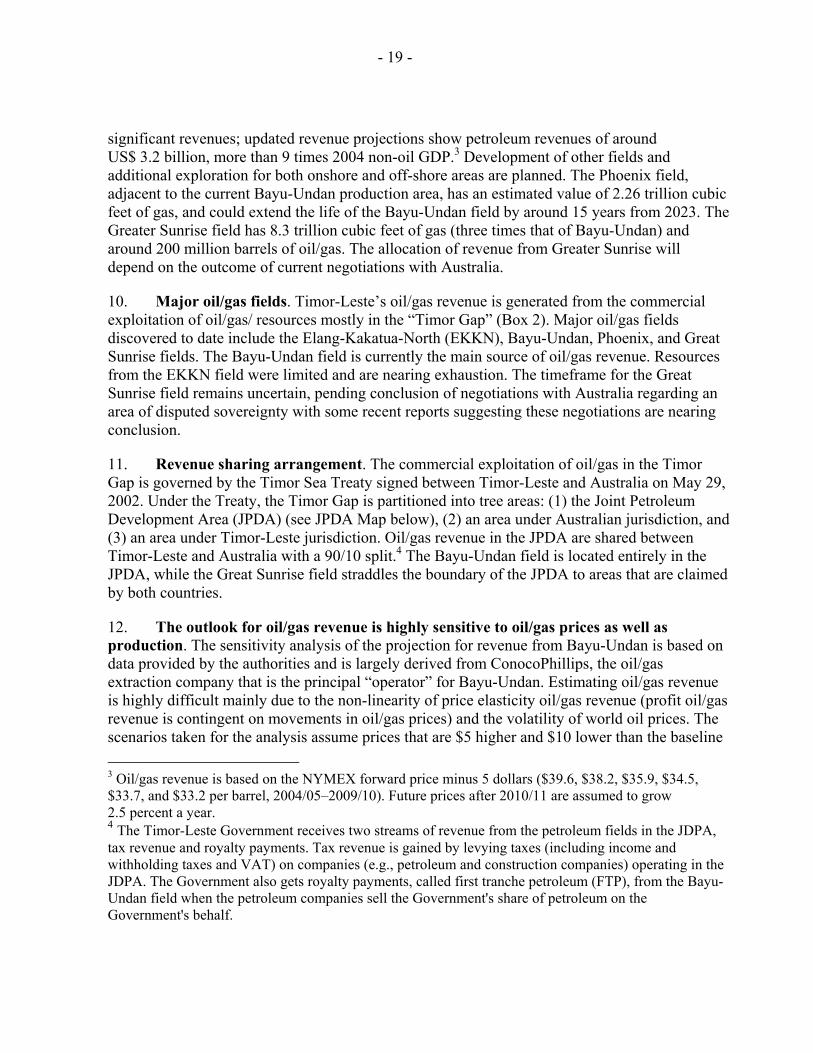
Box II.2. Timor Gap The Timor Gap was created by the 1972 seabed boundary agreement between Australia and Indonesia. It was a legacy of the fact that Australia and Portugal—then the colonial ruler of Timor-Leste—never agreed on a maritime boundary between Portuguese Timor and Australia.
Source: Timor Sea Office.
Sensitivity of Oil Revenue to Oil Prices(Percent of Non-Oil GDP)
0
20 40
60 80
100
120 140
160
2005/06 2007/08 2009/10 2011/12 2013/14 2015/16 2017/18 2019/20 2011/22 2023/24 Baseline Oil Price Low Oil Price High Oil Price
- 21 -
series from 2005/06 onward (prices are per barrel). The asymmetrical bands were chosen because of the historically high level of current oil/gas prices. The $15 price band is modest compared to historic movements in world oil prices (prices moved within a $24 band in 2004). Figure 1 shows the large fluctuation in government revenue, varying substantially according to oil/gas prices. Operational uncertainties regarding the pace and costs of extracting oil and gas are additional risks, in particular for the period when Bayu-Undan is the only source of revenue.
JPDA Map. Source: Timor Sea Office.
D. A Long-term Strategy for Oil/Gas Wealth Management
Natural Resource Funds
13. Natural Resource Funds (NRFs) may help in addressing the challenges commonly facing natural resource rich countries. Resource funds have been established in Norway, Azerbaijan, Chile, Kazakhstan, Kuwait, Oman, and Venezuela with a significant variety in design and purpose. NRFs can be classified as stabilization funds, saving funds and financing funds, based on the envisaged purpose, although in most cases the nature of the fund is mixed.

- 22 -
Stabilization funds are designed to reduce the impact of volatile revenue inflow, saving funds emphasize the accumulation of wealth for future generations, and financing fund primarily focus on effectively financing the overall budget deficit.
14. Well-designed NRFs may help stabilize aggregate demand and dampen real exchange rate appreciation. Investing NRF assets abroad reduces the need for domestic sterilization of foreign exchange inflows. NRFs may also enable a build-up of financial savings for future generations on political economy grounds. In their absence, the large inflow of natural resources can prompt considerable political pressure to spend the higher revenues for the current generation by increasing budget expenditure or reducing taxation. Against this backdrop, establishing a NRF with clear and transparent objectives may provide support for governments in building public consensus for saving part of the revenue from natural resources.
15. The performance of NRFs across countries has been mixed. If not properly set up or managed, NRFs carry risks, including the fragmentation of the budget account, asset management losses, and lack of transparency. If the fund is abused or mismanaged by the authorities, it can often be more of a problem than a solution. For instance, the oil/gas fund in some countries may be seen as a way to avoid public scrutiny and accountability. The lack of the transparency of operations and the poor quality of management could further aggravate economic performance. An assessment of established oil/gas funds in selected countries (Fasano, 2000) shows that savings funds in Norway, Azerbaijan and Kuwait have contributed to building sizeable assets to meet needs for future generations and some stabilization funds have helped to alleviate the volatility of fiscal expenditure by making fiscal policy less driven by revenue availability. However, the experience of stabilization funds in Oman and Venezuela was less successful because of frequent changes to rules and weak commitment to the intended purpose. Success, therefore, does not hinge on the establishment of NRFs, but rather on prudent fiscal management and fiscal discipline conducted through NRFs. Indeed, some argue (Sala-i-Martin and Subramanian, 2003) that where weak institutions and governance may lead to waste and increase vulnerability to corruption, distributing natural resource wealth directly to the population would be more efficient and conducive to long-term growth on the assumption that the private sector could spend the windfall more efficiently than the public sector.
A Petroleum Fund for Timor-Leste5
16. The Timor-Leste government has announced the intention to establish an oil/gas (petroleum) fund as of July 2005. Based on the experiences of other countries, a petroleum fund could be a useful tool for Timor-Leste to manage its petroleum wealth wisely—particularly given Timor-Leste’s petroleum revenues are large relative to the size of the economy and its limited absorptive capacity. The design of the petroleum fund draws on the Norwegian model, including the emphasis on transparent operations of the fund.
5 This section draws heavily on the public consultation paper on the establishment of a petroleum fund for Timor-Leste, prepared by the Ministry of Planning and Finance (2004).
- 23 -
Box II.3. Experience with Petroleum Funds in Oil/Gas Producing Countries
Norway. Oil/gas wealth is managed through the State Petroleum Fund (SPF), which was established in 1990. The purpose is to preserve national wealth so that future generations inherit as large an amount of wealth as the present generation. All of the government’s net income from oil/gas revenue is fed into the SPF, from which an annual transfer is made to the treasury to meet the non-oil/gas deficit in the budget. The Fund contributes to increasing transparency in the use of oil/gas revenue. The SPF can be considered a successful institutional arrangement. It has served as a tool for managing the resources needed in connection with the increase in pension outlays and helped enhance the effectiveness of fiscal policy by facilitating the adoption of a countercyclical fiscal stance.
Azerbaijan. The State Oil/gas Fund of the Republic of Azerbaijan (SOFAZ) was established in 1999 as an extra-budgetary institution. The main objective is the professional management of oil/gas revenue for the benefit of the country and future generations. The SOFAZ receives all government revenues arising from oil/gas production. The Fund’s rules currently prohibit spending in excess of inflows in any given year. A conservative expenditure policy has ensured a steady growth of savings in the fund. The creation of an oil/gas fund in Azerbaijan has had a positive impact on fiscal discipline and contributed to better transparency and accountability of oil/gas revenue management.
Kuwait. In 1976, the Kuwaiti authorities created a saving fund, the Reserve Fund for Future Generations (RFFG), aimed at providing a stream of income for future generations. Transfers to the RFFG—10 percent of total government revenue—are made independently of budget or oil/gas market developments. Nearly all assets are managed offshore and accumulated sizeable assets helped cover government expenditure during the 1990-91 regional crisis when oil/gas facilities were damaged and helped finance a large part of the reconstruction effort.
Oman. While the initial State General Reserve Fund(SGRF) was created in 1980, several revisions including in 1990 and 1993 have adulterated well-established operational guidelines. Notwithstanding the stated objective of building assets for future generations, accumulated assets have been frequently used for budget support in the face of external shocks.
Venezuela. A 1999 revision to the Macroeconomic Stabilization Fund (MSF) may have weakened the stabilization objectives by introducing presidential discretion for withdrawals, changes to the reference values, and earmarking the use of resources for social and investment expenditure and debt repayment.
Source: Fasano (2000).

- 24 -
17. The Petroleum Fund is to be fully integrated into the budget process. The Petroleum Fund will operate as a government account rather than a separate institution. Annual budget formulation and reporting will focus on the consolidated presentation, including the Fund, and expenditure of Petroleum Fund assets will be executed—as with other government revenue—by the Treasury Directorate of the Ministry of Planning and Finance. In addition, the return on the Petroleum Fund’s investments will be added to the Fund. The outflow from the Petroleum Fund will depend on the government’s saving policy (described below).
18. The Petroleum Fund’s assets are to be prudently managed and invested offshore. The Petroleum Fund’s savings are to be invested securely in low risk financial assets abroad, so that they are available when there is a need to draw on them. This strategy also has the benefit of putting less pressure on the domestic economy and contributes to balanced economic development. There is also a concern that investing domestically may increase the risk of corruption and bad governance. The government will have overall responsibility for the management of the Fund and the Minister of Planning and Finance will exercise key functions and competences. The Minister of Planning and Finance will be advised by an Investment Advisory Board that includes experienced financial advisers.
19. The guidelines and operations of the Petroleum Fund are to be transparent with stringent mechanisms to ensure accountability and prevent misuse. Regular and frequent disclosure and reporting are among the key principles governing the Fund, its inflows and outflows, and its investment strategy and return on assets. The Petroleum Fund’s activities will be audited by an independent external agency, and investment performance will be periodically evaluated. These policies are consistent with the principles in the Extractive Industries Transparency Initiative.
Timor-Leste Oil/Gas Saving Policy
20. A key element of Timor-Leste strategy for managing its oil/gas wealth is the adoption of a saving policy to guide the use of its resources. From the range of strategies for managing oil/gas resources, the Timor-Leste authorities chose to follow one that draws on Friedman’s Permanent Income Hypothesis (PIH) of consumption. The oil/gas saving policy adopted by the authorities envisages the use of only the permanent income from the oil/gas wealth to finance the non-oil fiscal deficit. Accordingly, annual budget “sustainable” spending is set equal to the sum of annual domestic non-oil revenue and the estimated permanent income from the total oil/gas wealth. Under this option, the government preserves oil/gas wealth constant in real terms, which can be calculated by discounting the future value of oil/gas revenue inflows. Based on conservative projections of oil/gas revenue over the life of Bayu-Undan, permanent income from oil/gas wealth of about $100 million, together with projected domestic revenue of about $30 million, would allow “sustainable” spending of about $130 million. Central government expenditure during the period of oil/gas extraction could be maintained at around 30 percent of non-oil GDP, on average.
- 25 -
Box II.4. A Petroleum Fund for Timor-Leste—Key Principles
1. The fund will receive all revenue accruing to the Government of Timor-Leste from its ownership of petroleum resources.
2. The fund has strong inter-generational equity objectives.
3. A process, or mechanism, for drawing on the fund which will enable it to support fiscally responsible levels of budget expenditure over the long term.
4. The design of the fund aims to strengthen the role of the budgetary process and existing institutions, with clear lines of responsibility and maintaining democratic accountability.
5. The fund is designed to have a high degree of legislative protection from governments of the day for the objectives of the fund, including its major institutional arrangements for custody and management.
6. The investment of fund resources is to be exercised according to written and approved guidelines which emphasize a conservative, low risk, approach to the placement and management of fund assets.
7. Implementation of the investment guidelines is to be assigned to a carefully selected group of professionals, drawing on appropriate experience, advice and quality information.
8. There will be maximum transparency of fund operations to parliament and the public through frequent, easily accessible and simple reporting.
9. Institutional arrangements will incorporate a role for eminent persons who are widely trusted within the Timorese community.
Source: Public consultation paper “Establishing a Petroleum Fund for Timor-Leste” and Timor-Leste Petroleum Fund Draft Act.
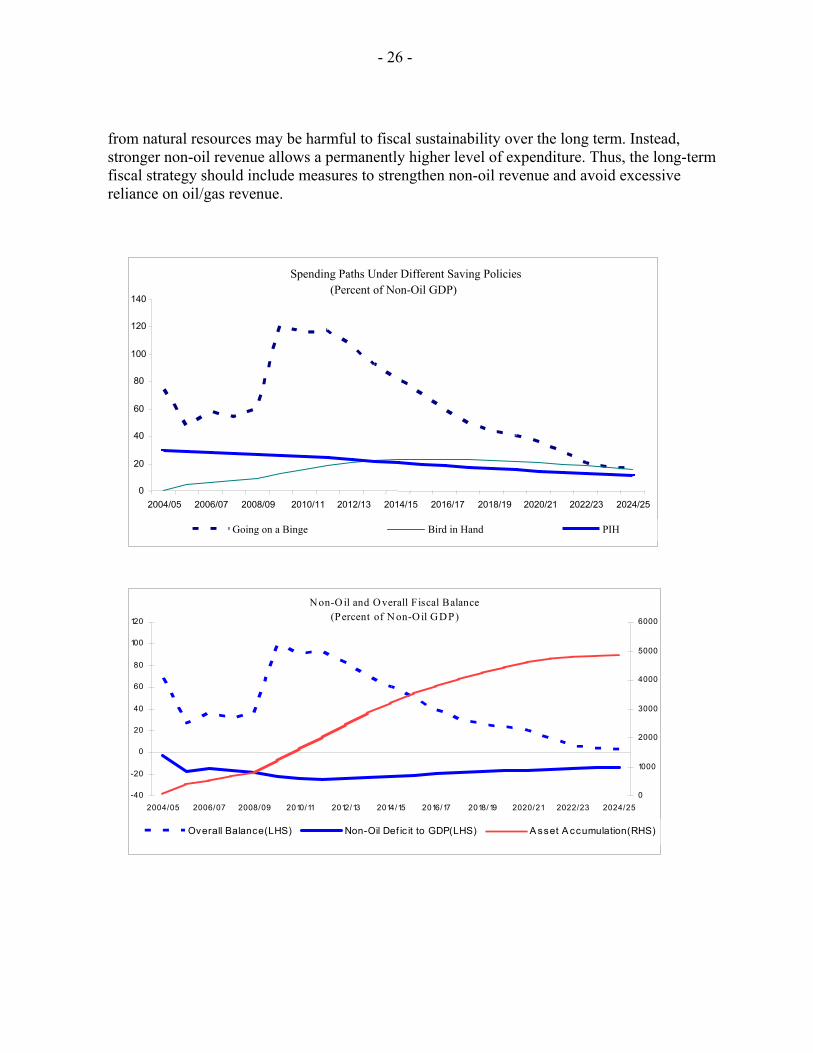
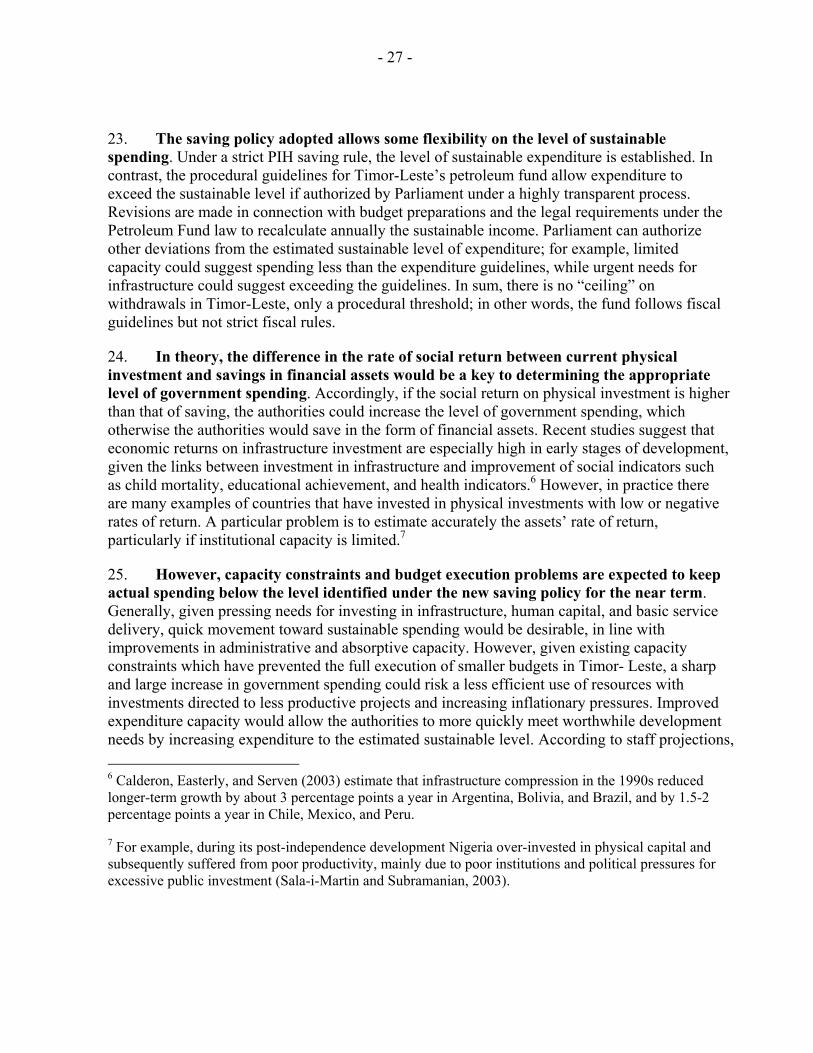
21. Different oil/gas management strategies have considerably different implications for spending paths over the long term. Under one extreme of the resource management strategies, “going on a binge,” the budget is designed to spend all of the oil/gas revenue available. No saving from natural resource revenue is envisaged and budget expenditure depends on production and world oil/gas prices. Under the other extreme, the Bird-in-Hand (BIH) rule, a country saves all current oil/gas revenues in the form of income generating assets, and spends only the real projected income from the available stock of assets. One drawback of the second approach is a lower level of income generation in the initial stage of the fund primarily due to the slow initial accumulation of oil/gas wealth.
22. The non-oil/gas deficit in Timor-Leste is expected to be very large over the long term, while the overall fiscal balance should run significant surpluses during the period of oil/gas extraction. This result is driven by the dominance of oil/gas revenue and the relatively weaker production from the non-oil/gas sector. Studies indicate that higher reliance on transfers
- 26 -
from natural resources may be harmful to fiscal sustainability over the long term. Instead, stronger non-oil revenue allows a permanently higher level of expenditure. Thus, the long-term fiscal strategy should include measures to strengthen non-oil revenue and avoid excessive reliance on oil/gas revenue.
Spending Paths Under Different Saving Policies (Percent of Non-Oil GDP)
0
20
40
60
80
100
120
140
2004/05 2006/07 2008/09 2010/11 2012/13 2014/15 2016/17 2018/19 2020/21 2022/23 2024/25 Going on a Binge Bird in Hand PIH
Non-O il and Overall Fiscal Balance(Percent of N on-Oil GDP)
-40
-20
0
20
40
60
80
100
120
2004/05 2006/07 2008/09 2010/11 2012/13 2014/15 2016/17 2018/19 2020/21 2022/23 2024/250
1000
2000
3000
4000
5000
6000
Overall Balance(LHS) Non-Oil Def ic it to GDP(LHS) A sset A ccumulation(RHS)
- 27 -
23. The saving policy adopted allows some flexibility on the level of sustainable spending. Under a strict PIH saving rule, the level of sustainable expenditure is established. In contrast, the procedural guidelines for Timor-Leste’s petroleum fund allow expenditure to exceed the sustainable level if authorized by Parliament under a highly transparent process. Revisions are made in connection with budget preparations and the legal requirements under the Petroleum Fund law to recalculate annually the sustainable income. Parliament can authorize other deviations from the estimated sustainable level of expenditure; for example, limited capacity could suggest spending less than the expenditure guidelines, while urgent needs for infrastructure could suggest exceeding the guidelines. In sum, there is no “ceiling” on withdrawals in Timor-Leste, only a procedural threshold; in other words, the fund follows fiscal guidelines but not strict fiscal rules.
24. In theory, the difference in the rate of social return between current physical investment and savings in financial assets would be a key to determining the appropriate level of government spending. Accordingly, if the social return on physical investment is higher than that of saving, the authorities could increase the level of government spending, which otherwise the authorities would save in the form of financial assets. Recent studies suggest that economic returns on infrastructure investment are especially high in early stages of development, given the links between investment in infrastructure and improvement of social indicators such as child mortality, educational achievement, and health indicators.6 However, in practice there are many examples of countries that have invested in physical investments with low or negative rates of return. A particular problem is to estimate accurately the assets’ rate of return, particularly if institutional capacity is limited.7
25. However, capacity constraints and budget execution problems are expected to keep actual spending below the level identified under the new saving policy for the near term. Generally, given pressing needs for investing in infrastructure, human capital, and basic service delivery, quick movement toward sustainable spending would be desirable, in line with improvements in administrative and absorptive capacity. However, given existing capacity constraints which have prevented the full execution of smaller budgets in Timor- Leste, a sharp and large increase in government spending could risk a less efficient use of resources with investments directed to less productive projects and increasing inflationary pressures. Improved expenditure capacity would allow the authorities to more quickly meet worthwhile development needs by increasing expenditure to the estimated sustainable level. According to staff projections, 6 Calderon, Easterly, and Serven (2003) estimate that infrastructure compression in the 1990s reduced longer-term growth by about 3 percentage points a year in Argentina, Bolivia, and Brazil, and by 1.5-2 percentage points a year in Chile, Mexico, and Peru.
7 For example, during its post-independence development Nigeria over-invested in physical capital and subsequently suffered from poor productivity, mainly due to poor institutions and political pressures for excessive public investment (Sala-i-Martin and Subramanian, 2003).
- 28 -
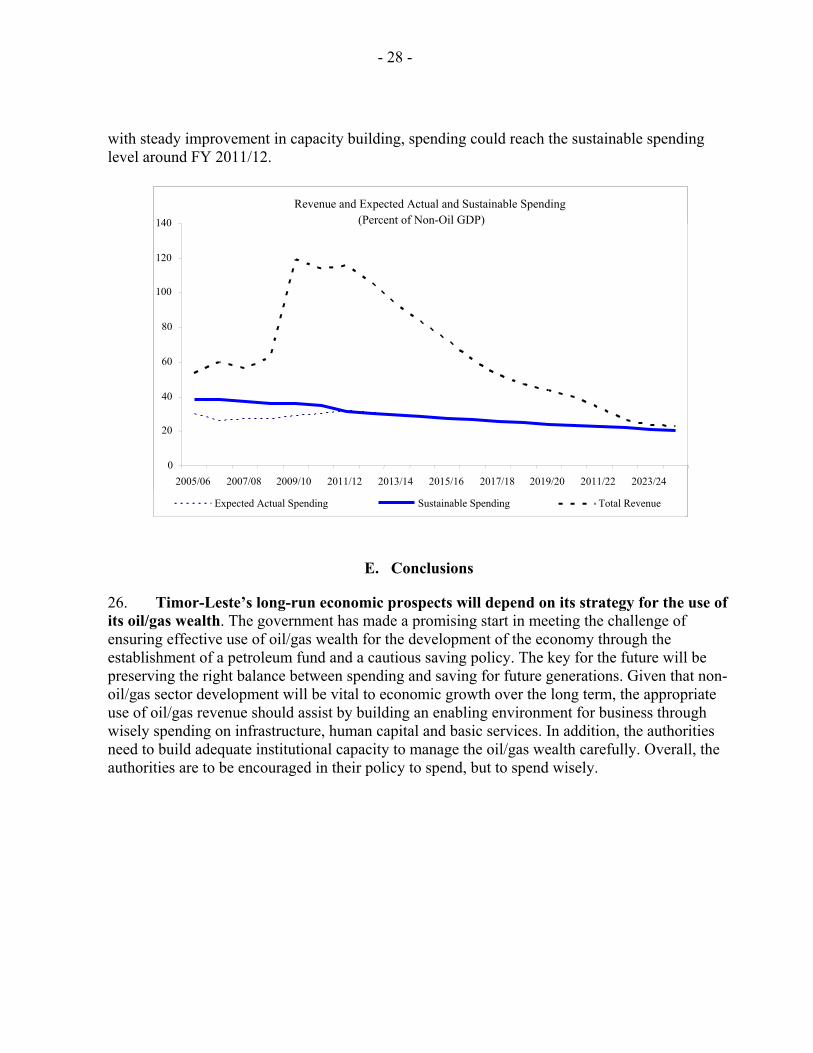
with steady improvement in capacity building, spending could reach the sustainable spending level around FY 2011/12.
E. Conclusions
26. Timor-Leste’s long-run economic prospects will depend on its strategy for the use of its oil/gas wealth. The government has made a promising start in meeting the challenge of ensuring effective use of oil/gas wealth for the development of the economy through the establishment of a petroleum fund and a cautious saving policy. The key for the future will be preserving the right balance between spending and saving for future generations. Given that non-oil/gas sector development will be vital to economic growth over the long term, the appropriate use of oil/gas revenue should assist by building an enabling environment for business through wisely spending on infrastructure, human capital and basic services. In addition, the authorities need to build adequate institutional capacity to manage the oil/gas wealth carefully. Overall, the authorities are to be encouraged in their policy to spend, but to spend wisely.
Revenue and Expected Actual and Sustainable Spending(Percent of Non-Oil GDP)
0
20
40
60
80
100
120
140
2005/06 2007/08 2009/10 2011/12 2013/14 2015/16 2017/18 2019/20 2011/22 2023/24
Expected Actual Spending Sustainable Spending Total Revenue
- 29 -
References
Barnett, Steven and Rolando Ossowski, 2002, “Operational Aspects of Fiscal Policy in Oil- Producing Countries,” IMF Working Paper 02/177, International Monetary Fund.
Calderon, Cesar, William Easterly, and Luis Serven, 2003, “Infrastructure Compression and Public Sector Solvency in Latin America,” in The Limits of Stabilization-Infrastructure, Public Deficits, and Growth in Latin America, ed. Easterly and Serven, World Bank.
Cerdi et al, (2004, “Sub-Saharan Africa: Mobilizing Tax Resources for Development Summary,” Ministry of Foreign Affairs, France.
Chalk, Nigel,1998, “Fiscal Sustainability with Non-Renewable Resources,” IMF Working Paper 98/26, International Monetary Fund.
Daniel, James, 2001, “Hedging Government Oil/gas Price Risk,” IMF Working Paper 01/185, International Monetary Fund.
Davis, Jeffrey, Rolando Ossowski, and Analisa Fedelino, 2004, “Fiscal Policy Formulation and Implementation in Oil Producing Countries,” International Monetary Fund.
Fasano, Ugo, 2000, “Review of the Experience with Oil Stabilization and Savings Funds in Selected Countries,” IMF Working Paper 00/112, International Monetary Fund.
Friedman, M., 1957, “A Theory of the Consumption Function,” Princeton: Princeton University Press.
Katz, Menachem,Ulrich Bartsch, Harinder Malothra, and Milan Cuc, 2004, “Lifting the Oil/Gas Curse: Improving Petroleum Revenue Management in Sub-Saharan Africa,” International Monetary Fund.
Ministry of Planning and Finance of Timor-Leste, 2004, “Establishing a Petroleum Fund For Timor-Leste,” Public Consultation Paper, Government of Timor-Leste.
Sala-i-Martin, Xavier and Arvind Subramanian, 2003, “Addressing the Natural Resource Curse: an Illustration from Nigeria,” IMF Working Paper 03/139, International Monetary Fund.
Shafik, Nemat, 2004, “Public Investment and Fiscal Space: Perspectives from Infrastructure,” IMF Outreach Meeting, April 2004.

- 30 -
III. DOLLARIZATION IN TIMOR-LESTE: THE EARLY YEARS1
A. Introduction
1. Timor-Leste has been officially dollarized since January 2000.2 As part of the transition to full independence, the initial decision to adopt the U.S. dollar was taken by the United Nations Transitional Administration in East Timor (UNTAET). The decision was made in consultation with the National Consultative Council of Timor-Leste (NCC), and drew on the expert advice of the International Monetary Fund. Following the move to full independence in May 2002, the government of Timor-Leste decided to maintain the U.S. dollar as the official currency.
2. As Timor-Leste moves beyond the post-conflict phase to consolidation focusing on strengthening national institutions and implementing reforms that promote growth and alleviate poverty, it is timely to review the early experience with official dollarization. This chapter also looks ahead and discusses the costs and benefits of continuing with dollarization, while taking into account that the still low level of institutional capacity severely constrains how soon Timor-Leste can move successfully to an alternative exchange rate regime. In this regard, the main objective should be to ensure that the monetary and exchange regime continues to support macroeconomic stability and growth, including by delivering low inflation.
B. A Brief History of Dollarization in Timor-Leste
What motivated the decision to dollarize?
3. The decision to dollarize was both a political and economic decision that also reflected the reality of weak institutional capacity in the new nation. At a political level the decision to remove the Indonesian rupiah from circulation and replace it with the U.S. dollar was a symbolic break from Indonesian rule that helped to reinforce the sense of an independent Timorese national identity, which culminated in the introduction of Timorese coins in November 2003. Institutions were emerging slowly after the conflict in 1999 and were already faced with significant challenges such as setting up a basic economic infrastructure, including an adequate payments system.3 Therefore it was important that the new currency regime could be 1 Prepared by Ashok Bhundia.
2 This is in contrast to a de facto dollarized economy in which, alongside a domestic currency, residents to a lesser or greater degree hold foreign currency and foreign-currency denominated deposits at domestic banks. A high degree of de facto dollarization is usually evident in countries that have high inflation and other forms of macroeconomic instability, because residents try to hedge against the loss in purchasing power of the domestic currency.
3 The more general point is that an inappropriate sequencing of reforms can lead to macroeconomic instability especially in the face of economic shocks as institutions are insufficiently developed to adapt and deal with such shocks.

- 31 -
implemented successfully within these constraints if it was to be credible and provide an effective nominal anchor.
4. The introduction of the U.S. dollar was also meant to deal with the distortions caused by having multiple currencies in circulation. After the UNTAET took on the responsibility in 1999 to manage the transition to full independence, several currencies began circulating in Timor-Leste which created inefficiencies and problems in the payments system. The Indonesian rupiah was familiar to the Timorese, but other currencies such as the Australian dollar, and Portuguese escudo also began circulating due to the international presence. Introducing a single currency was intended to eliminate problems such as exchange risk from exchange rate fluctuations, and introduce more transparency in the pricing of goods and services.
The implications of weak institutional capacity
5. The menu of options open to Timor-Leste for reforming its currency regime was constrained by the weak institutional capacity. This meant that the new currency regime had to be simple to administer, and minimize the burden on the newly created Central Payments Office (CPO) whose immediate priority was to set up a functioning payments system for the country.4
6. During Indonesian rule, the civil service and administration was dominated by native Indonesians with the Timorese population filling low level responsibilities with relatively little training. Once conflict broke out in 1999, and it became clear that the referendum vote would be strongly in favor of independence, the administration effectively collapsed as Indonesian staff returned home. After the return of relative peace, institutions had to be built up from scratch as almost all institutional memory was lost (it was not simply a matter of reviving already existing capacity).5 This was in contrast to some other post conflict countries, including Bosnia, where institutional capacity was already well developed before the period of conflict and so could be revived as peace took hold.
7. Dollarization was seen as a suitable option for Timor-Leste because it was simple to administer and would anchor the economy to the low inflation monetary policy of the United States.6 Introducing a national currency, including a relatively simple arrangement such as a currency board was much more difficult. Had a more ambitious monetary framework been planned, the chances of even limited success were not promising. For example, targeting the 4 The CPO was established in January 2000 and was the precursor to the Banking and Payments Authority (BPA) which was established in November 2001.
5 Aaron (2002) argues that institutional capacity is probably easier to resuscitate than build from scratch.
6 Notwithstanding the significant (initial) technical challenges of replacing notes and coins in circulation with U.S. dollars and educating the public on the benefits of the new currency system.
- 32 -
money supply either through market-based instruments or direct quantitative measures was constrained by the lack of even a rudimentary functioning payments system and financial system, and a limited capacity at the new CPO to analyze the link between money, economic activity and inflation.
Early progress with dollarization
8. Progress with dollarization was initially disappointing. Between 2000 and 2002, there were four currencies in circulation—the Indonesian rupiah, Australian dollar, Portuguese escudo and U.S. dollar. For historical reasons, the Indonesian rupiah was the most familiar and widely used currency. Moreover, NGOs and international agencies continued to pay their local staff in rupiah. The Portuguese escudo, Australian dollar and U.S. dollar were in circulation in a limited sphere of the economy such as shops, restaurants and hotels in the Dili area that were frequented by expatriate personnel. The dollarization process began to accelerate once regulations were amended to make it illegal to settle payments in currencies other than the U.S. dollar (supported by stronger enforcement including against transgressions by large businesses), and with the introduction of Timorese coins. By 2003, the initial problems with promoting the dollar as the legal tender had been addressed, the U.S. dollar was fully entrenched, and other currencies were out of circulation.
9. The initial lack of progress with dollarization was explained by several challenges faced by the Transitional Administration, including:
• a lack of resources for the publicity campaign needed to familiarize the population with the use of U.S. dollars;
• an insufficient supply of small denomination notes and coins since the average value of transactions was less than US$1. This constraint eased considerably with the introduction of Timorese coins (centavos) in November 2003. Supported by an extensive education campaign, these coins helped improve the popularity of the new currency regime by being seen as a symbol of national identity and by facilitating small transactions;
• the continued use by international donors (including U.N. agencies and NGOs) of currencies other than the U.S. dollar, since initially regulations did not make it illegal to settle transactions in other currencies.
C. The Benefits and Costs of Dollarization
10. Choosing an exchange rate regime involves a trade off. On the one hand dollarization means giving up an independent monetary policy. Nevertheless, it is likely wise to adopt an international anchor currency if policy credibility or institutional capacity is weak, since under these circumstances the benefits of an independent monetary policy cannot be realized in any case. In the case of Timor-Leste, another important consideration for policymakers is the role that dollarization can play in facilitating the economy’s adjustment to large inflows of oil revenue. The experience of other countries is that large inflows of oil revenue (in relation to
- 33 -
economic size) can result in pressure for a real exchange rate appreciation and make it more difficult to diversify the economy, including its export base.7 In a dollarized economy, the real exchange rate appreciation would have to come through higher relative prices for nontraded goods and services (versus traded goods and services) and higher wages, so that the relative price adjustment would probably take longer than if the nominal exchange rate were flexible.
11. While the experience of other countries may also shed some light on the costs and benefits of dollarization there are some issues to bear in mind. First, most dollarized economies have tended to be island economies with very small populations and strong colonial links (see Appendix Table 1). The few larger economies that have dollarized officially have tended to do so in reaction to prolonged economic instability—Ecuador dollarized after a history of economic crisis which made it difficult for the government to credibly commit to low inflation without “tying its own hands” and eliminating the option of printing its domestic currency to finance government spending. 8 Second, Timor-Leste’s oil and gas production could have implications for its choice of exchange rate regime. Thus, drawing on the experience of other oil exporters may provide a guide as to whether a hard currency peg as opposed to a more flexible exchange rate regime is appropriate (Appendix Table 2). Third, Timor-Leste is a new nation with a short history, but many of the benefits of dollarization are necessarily long-term, and so may not yet be evident in the data (Berg et al., 2000).
Benefits of dollarization
12. The experience during the first few years of dollarization has been favorable and has supported the broader objective of nation building after the conflict of 1999. Given still deepening institutional capacity, Timor-Leste would have faced significant challenges in introducing its own currency and an independent monetary policy framework aimed at delivering similarly low inflation and exchange rate stability. First, the requisite analytical and organizational skills needed to conduct an independent monetary policy has yet to be developed. Second, the temptation to use monetary policy as a means of monetary financing for the government budget deficits may have proved difficult to resist in face of large budget financing gaps in the first few years after the referendum vote.9 Overall, the most important benefits of dollarization for Timor-Leste include;
7 The full extent of the real exchange appreciation would depend on how the oil resources are spent. Other things equal, there would be less pressure for an appreciation if expenditures were more import intensive, or if a significant proportion of the oil resource flow was saved by accumulating assets abroad.
8 See Zarmeno, Mayra and Mariano Cortes, “Dollarization,” Ecuador, Selected Issues and Statistical Annex, IMF Staff Country Report no. 00/125, International Monetary Fund, for a discussion of the pros and cons of dollarization in Ecuador.
9 These financing gaps were closed through budget support from donors.
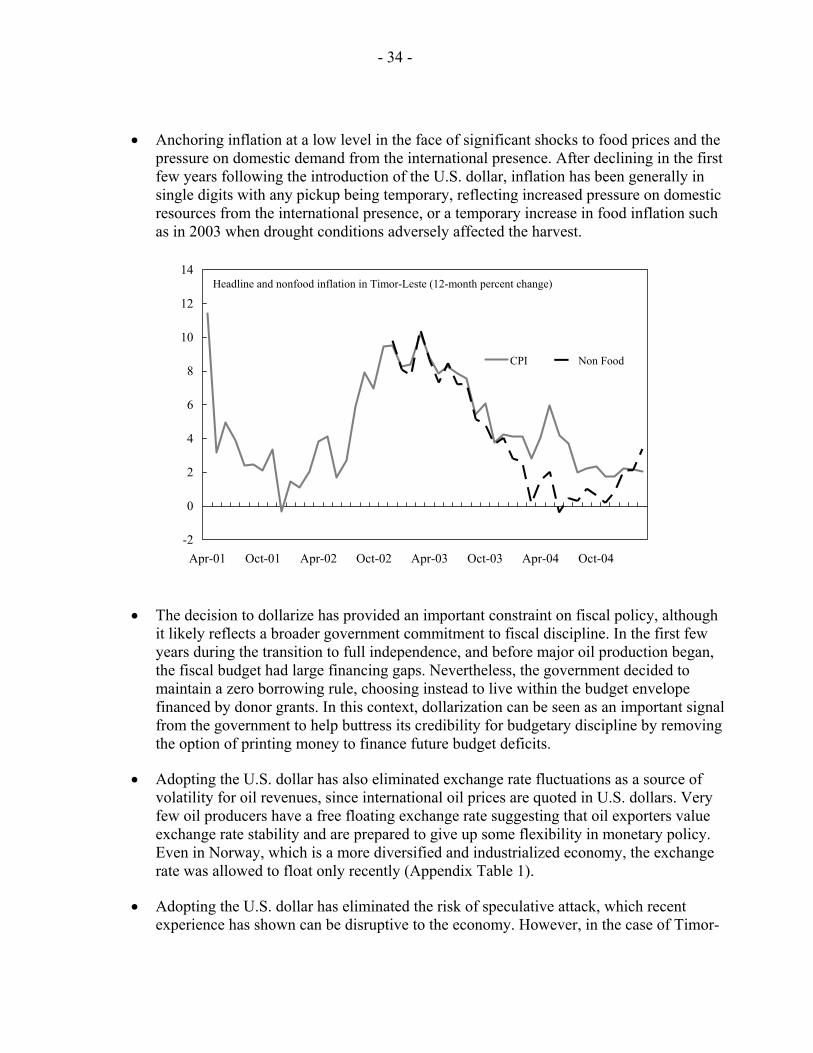
- 34 -
• Anchoring inflation at a low level in the face of significant shocks to food prices and the pressure on domestic demand from the international presence. After declining in the first few years following the introduction of the U.S. dollar, inflation has been generally in single digits with any pickup being temporary, reflecting increased pressure on domestic resources from the international presence, or a temporary increase in food inflation such as in 2003 when drought conditions adversely affected the harvest.
Headline and nonfood inflation in Timor-Leste (12-month percent change)
-2
0
2
4
6
8
10
12
14
Apr-01 Oct-01 Apr-02 Oct-02 Apr-03 Oct-03 Apr-04 Oct-04
CPI Non Food
• The decision to dollarize has provided an important constraint on fiscal policy, although it likely reflects a broader government commitment to fiscal discipline. In the first few years during the transition to full independence, and before major oil production began, the fiscal budget had large financing gaps. Nevertheless, the government decided to maintain a zero borrowing rule, choosing instead to live within the budget envelope financed by donor grants. In this context, dollarization can be seen as an important signal from the government to help buttress its credibility for budgetary discipline by removing the option of printing money to finance future budget deficits.
• Adopting the U.S. dollar has also eliminated exchange rate fluctuations as a source of volatility for oil revenues, since international oil prices are quoted in U.S. dollars. Very few oil producers have a free floating exchange rate suggesting that oil exporters value exchange rate stability and are prepared to give up some flexibility in monetary policy. Even in Norway, which is a more diversified and industrialized economy, the exchange rate was allowed to float only recently (Appendix Table 1).
• Adopting the U.S. dollar has eliminated the risk of speculative attack, which recent experience has shown can be disruptive to the economy. However, in the case of Timor-
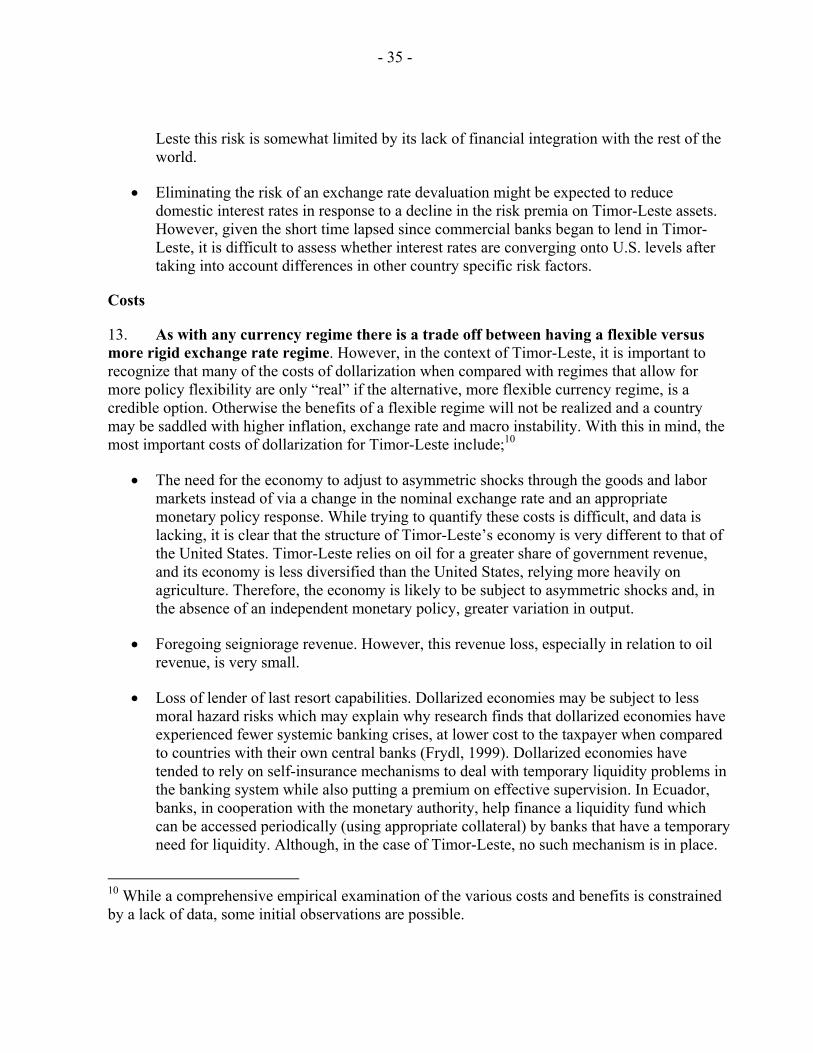
- 35 -
Leste this risk is somewhat limited by its lack of financial integration with the rest of the world.
• Eliminating the risk of an exchange rate devaluation might be expected to reduce domestic interest rates in response to a decline in the risk premia on Timor-Leste assets. However, given the short time lapsed since commercial banks began to lend in Timor-Leste, it is difficult to assess whether interest rates are converging onto U.S. levels after taking into account differences in other country specific risk factors.
Costs
13. As with any currency regime there is a trade off between having a flexible versus more rigid exchange rate regime. However, in the context of Timor-Leste, it is important to recognize that many of the costs of dollarization when compared with regimes that allow for more policy flexibility are only “real” if the alternative, more flexible currency regime, is a credible option. Otherwise the benefits of a flexible regime will not be realized and a country may be saddled with higher inflation, exchange rate and macro instability. With this in mind, the most important costs of dollarization for Timor-Leste include;10
• The need for the economy to adjust to asymmetric shocks through the goods and labor markets instead of via a change in the nominal exchange rate and an appropriate monetary policy response. While trying to quantify these costs is difficult, and data is lacking, it is clear that the structure of Timor-Leste’s economy is very different to that of the United States. Timor-Leste relies on oil for a greater share of government revenue, and its economy is less diversified than the United States, relying more heavily on agriculture. Therefore, the economy is likely to be subject to asymmetric shocks and, in the absence of an independent monetary policy, greater variation in output.
• Foregoing seigniorage revenue. However, this revenue loss, especially in relation to oil revenue, is very small.
• Loss of lender of last resort capabilities. Dollarized economies may be subject to less moral hazard risks which may explain why research finds that dollarized economies have experienced fewer systemic banking crises, at lower cost to the taxpayer when compared to countries with their own central banks (Frydl, 1999). Dollarized economies have tended to rely on self-insurance mechanisms to deal with temporary liquidity problems in the banking system while also putting a premium on effective supervision. In Ecuador, banks, in cooperation with the monetary authority, help finance a liquidity fund which can be accessed periodically (using appropriate collateral) by banks that have a temporary need for liquidity. Although, in the case of Timor-Leste, no such mechanism is in place.
10 While a comprehensive empirical examination of the various costs and benefits is constrained by a lack of data, some initial observations are possible.
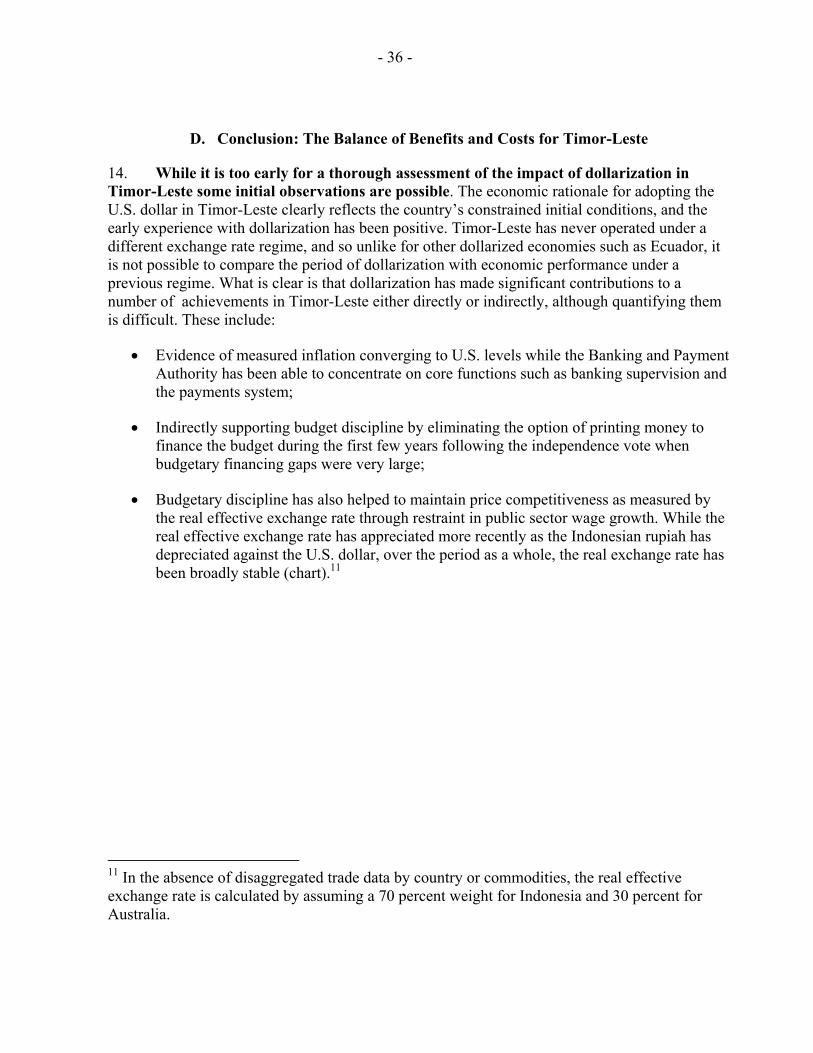
- 36 -
D. Conclusion: The Balance of Benefits and Costs for Timor-Leste
14. While it is too early for a thorough assessment of the impact of dollarization in Timor-Leste some initial observations are possible. The economic rationale for adopting the U.S. dollar in Timor-Leste clearly reflects the country’s constrained initial conditions, and the early experience with dollarization has been positive. Timor-Leste has never operated under a different exchange rate regime, and so unlike for other dollarized economies such as Ecuador, it is not possible to compare the period of dollarization with economic performance under a previous regime. What is clear is that dollarization has made significant contributions to a number of achievements in Timor-Leste either directly or indirectly, although quantifying them is difficult. These include:
• Evidence of measured inflation converging to U.S. levels while the Banking and Payment Authority has been able to concentrate on core functions such as banking supervision and the payments system;
• Indirectly supporting budget discipline by eliminating the option of printing money to finance the budget during the first few years following the independence vote when budgetary financing gaps were very large;
• Budgetary discipline has also helped to maintain price competitiveness as measured by the real effective exchange rate through restraint in public sector wage growth. While the real effective exchange rate has appreciated more recently as the Indonesian rupiah has depreciated against the U.S. dollar, over the period as a whole, the real exchange rate has been broadly stable (chart).11
11 In the absence of disaggregated trade data by country or commodities, the real effective exchange rate is calculated by assuming a 70 percent weight for Indonesia and 30 percent for Australia.
- 37 -
Timor Leste: Nominal and Real Effective Exchange Rate Developments 1/ (Jan 2002=100)
75
80
85
90
95
100
105
110
Jan-02 May-02 Sep-02 Jan-03 May-03 Sep-03 Jan-04 May-04 Sep-04 Jan-05
REER Index (Jan 2002=100)
NEER Index (Jan2002=100)Relative CPI
1/ Includes Indonesia and Australia, Timor-Leste's main trade partners. In absence of a trade weighted series, the NEER and REER are based on weights of 70 percent for Indonesia and 30 percent for Australia.
• A recent pickup in credit growth. As the banking system has remained stable and confidence in the dollarization process has grown, credit growth accelerated sharply in the second half of 2003 (see chart).
Credit growth and bank intermediation in Timor-Leste
0
100
200
300
400
500
600
700
Jun-03 Aug-03 Oct-03 Dec-03 Feb-04 Apr-04 Jun-04 Aug-04 Oct-040
10
20
30
40
50
60
70
80
90
Credit growth (LHS) Loan-to-deposit ratio (RHS)

- 38 -
15. Looking ahead, there are several areas in which the BPA, together with the government, can make efforts to lay the necessary preconditions for a more flexible exchange rate regime should that be deemed appropriate in the future. Further strengthening of institutional capacity remains a priority in this regard, including steps to strengthen capacity at the Banking and Payments Authority that would make it a fully functioning central bank at an operational level. Other steps include:
• Enhancing the depth and sophistication of the financial system, including by setting up of a foreign exchange market and domestic money market. These elements would ensure that indirect instruments could be used to set monetary policy, and that a freely traded domestic currency reflects economic fundamentals;
• Strengthening fiscal institutions. The sound management of petroleum resources will be key, and in this regard the passing of the new Petroleum Fund act is an important step in setting up a transparent framework that has public support. In addition, it will be important that fiscal policy continues to support macroeconomic stability as well as providing for the much-needed investment in human and physical capital.
References
Aaron, Janine, 2002, “Building institutions in post conflict African countries,” Wider Discussion paper No. 2002/124, United Nations.
Berg, Andrew, and Eduardo Borenzstein, 2000, “Full dollarization: the Pros and Cons,” Economic Issues Number 24, International Monetary Fund.
Frydl, Edward, 1999, “The length and cost of banking crises,” IMF Working Paper No. 99/30.
Zarmeno, Mayra and Mariano Cortes, “Dollarization,” Ecuador, Selected Issues Paper, IMF Staff Country Report No. 00/125.
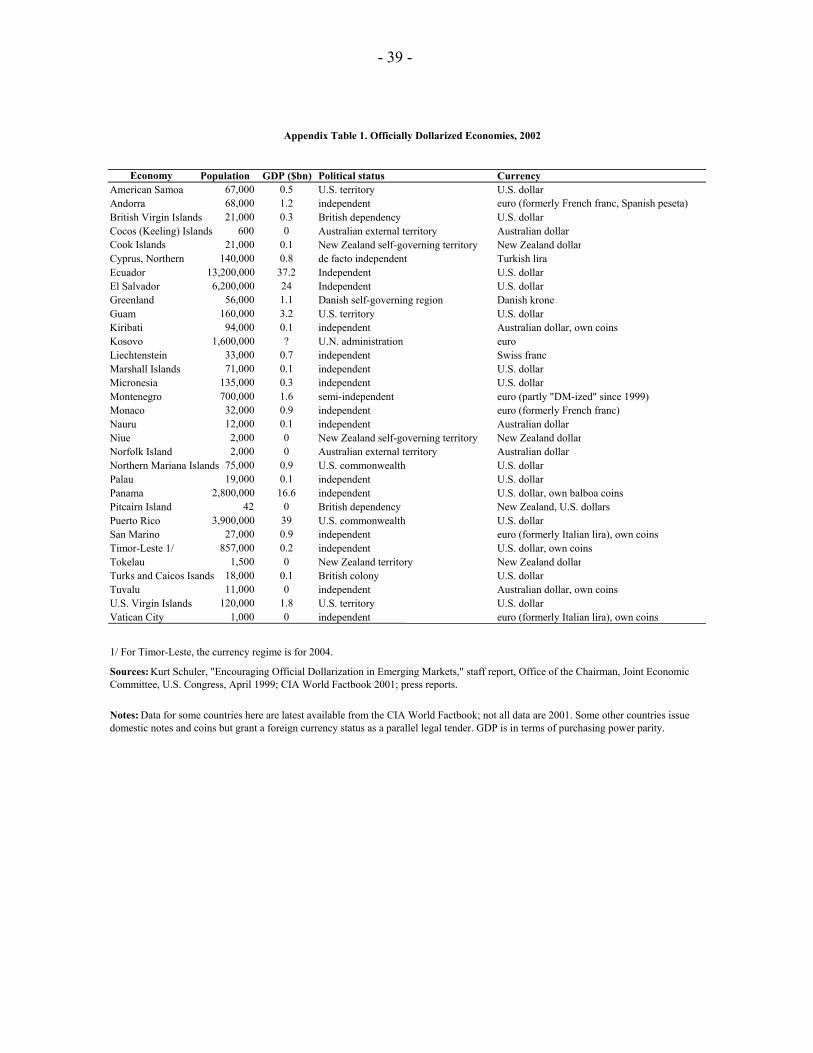
- 39 -
Economy Population GDP ($bn) Political status CurrencyAmerican Samoa 67,000 0.5 U.S. territory U.S. dollarAndorra 68,000 1.2 independent euro (formerly French franc, Spanish peseta)British Virgin Islands 21,000 0.3 British dependency U.S. dollarCocos (Keeling) Islands 600 0 Australian external territory Australian dollarCook Islands 21,000 0.1 New Zealand self-governing territory New Zealand dollar Cyprus, Northern 140,000 0.8 de facto independent Turkish liraEcuador 13,200,000 37.2 Independent U.S. dollarEl Salvador 6,200,000 24 Independent U.S. dollarGreenland 56,000 1.1 Danish self-governing region Danish kroneGuam 160,000 3.2 U.S. territory U.S. dollarKiribati 94,000 0.1 independent Australian dollar, own coins Kosovo 1,600,000 ? U.N. administration euroLiechtenstein 33,000 0.7 independent Swiss francMarshall Islands 71,000 0.1 independent U.S. dollarMicronesia 135,000 0.3 independent U.S. dollarMontenegro 700,000 1.6 semi-independent euro (partly "DM-ized" since 1999) Monaco 32,000 0.9 independent euro (formerly French franc) Nauru 12,000 0.1 independent Australian dollarNiue 2,000 0 New Zealand self-governing territory New Zealand dollar Norfolk Island 2,000 0 Australian external territory Australian dollarNorthern Mariana Islands 75,000 0.9 U.S. commonwealth U.S. dollarPalau 19,000 0.1 independent U.S. dollarPanama 2,800,000 16.6 independent U.S. dollar, own balboa coins Pitcairn Island 42 0 British dependency New Zealand, U.S. dollars Puerto Rico 3,900,000 39 U.S. commonwealth U.S. dollarSan Marino 27,000 0.9 independent euro (formerly Italian lira), own coinsTimor-Leste 1/ 857,000 0.2 independent U.S. dollar, own coins Tokelau 1,500 0 New Zealand territory New Zealand dollar Turks and Caicos Isands 18,000 0.1 British colony U.S. dollarTuvalu 11,000 0 independent Australian dollar, own coins U.S. Virgin Islands 120,000 1.8 U.S. territory U.S. dollarVatican City 1,000 0 independent euro (formerly Italian lira), own coins
1/ For Timor-Leste, the currency regime is for 2004.
Sources: Kurt Schuler, "Encouraging Official Dollarization in Emerging Markets," staff report, Office of the Chairman, Joint Economic Committee, U.S. Congress, April 1999; CIA World Factbook 2001; press reports.
Notes: Data for some countries here are latest available from the CIA World Factbook; not all data are 2001. Some other countries issue domestic notes and coins but grant a foreign currency status as a parallel legal tender. GDP is in terms of purchasing power parity.
Appendix Table 1. Officially Dollarized Economies, 2002
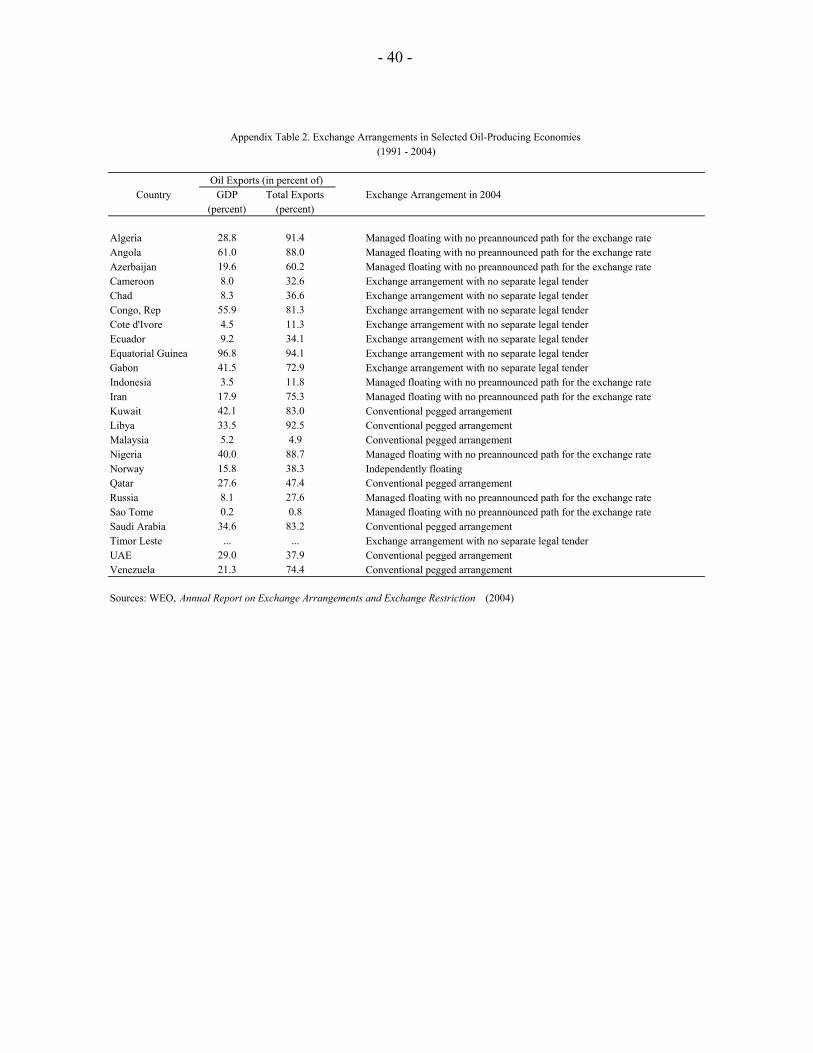
- 40 -
Country GDP Total Exports Exchange Arrangement in 2004(percent) (percent)
Algeria 28.8 91.4 Managed floating with no preannounced path for the exchange rate Angola 61.0 88.0 Managed floating with no preannounced path for the exchange rate Azerbaijan 19.6 60.2 Managed floating with no preannounced path for the exchange rate Cameroon 8.0 32.6 Exchange arrangement with no separate legal tender Chad 8.3 36.6 Exchange arrangement with no separate legal tender Congo, Rep 55.9 81.3 Exchange arrangement with no separate legal tender Cote d'Ivore 4.5 11.3 Exchange arrangement with no separate legal tender Ecuador 9.2 34.1 Exchange arrangement with no separate legal tender Equatorial Guinea 96.8 94.1 Exchange arrangement with no separate legal tender Gabon 41.5 72.9 Exchange arrangement with no separate legal tender Indonesia 3.5 11.8 Managed floating with no preannounced path for the exchange rate Iran 17.9 75.3 Managed floating with no preannounced path for the exchange rate Kuwait 42.1 83.0 Conventional pegged arrangementLibya 33.5 92.5 Conventional pegged arrangementMalaysia 5.2 4.9 Conventional pegged arrangementNigeria 40.0 88.7 Managed floating with no preannounced path for the exchange rate Norway 15.8 38.3 Independently floatingQatar 27.6 47.4 Conventional pegged arrangementRussia 8.1 27.6 Managed floating with no preannounced path for the exchange rate Sao Tome 0.2 0.8 Managed floating with no preannounced path for the exchange rate Saudi Arabia 34.6 83.2 Conventional pegged arrangementTimor Leste ... ... Exchange arrangement with no separate legal tender UAE 29.0 37.9 Conventional pegged arrangementVenezuela 21.3 74.4 Conventional pegged arrangement
Sources: WEO, Annual Report on Exchange Arrangements and Exchange Restriction (2004)
Appendix Table 2. Exchange Arrangements in Selected Oil-Producing Economies (1991 - 2004)
Oil Exports (in percent of)
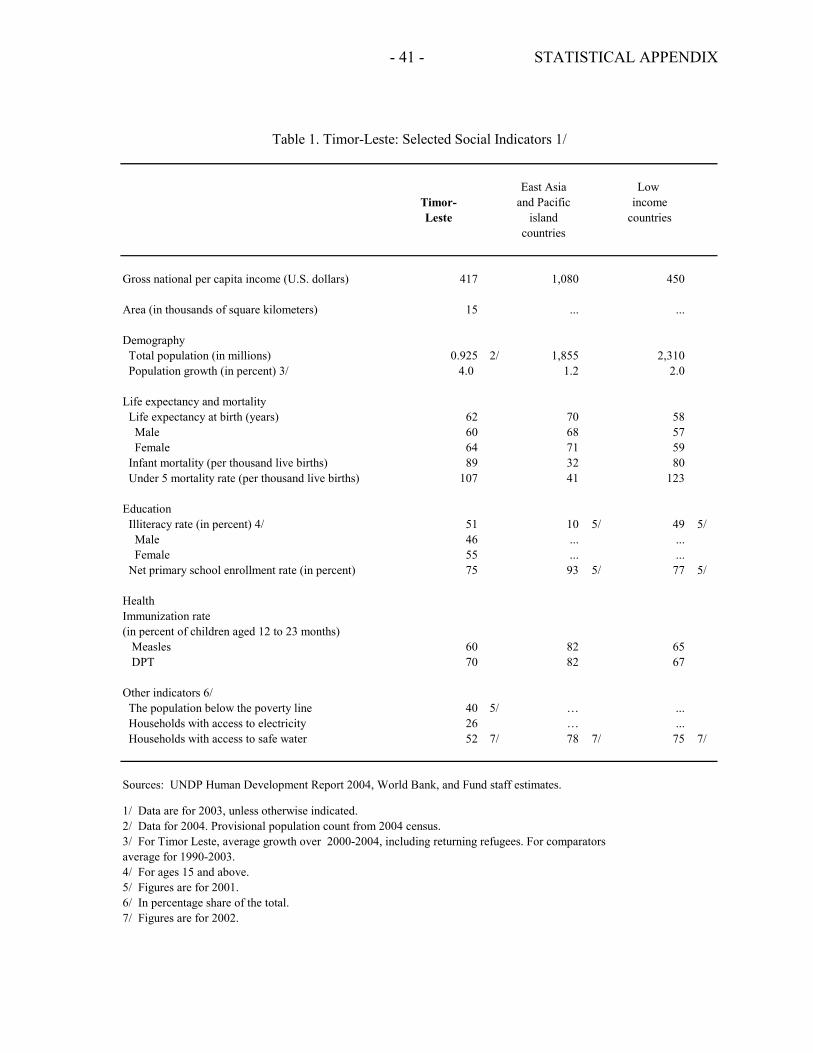
- 41 - STATISTICAL APPENDIX
Table 1. Timor-Leste: Selected Social Indicators 1/
East Asia Low Timor- and Pacific incomeLeste island countries
countries
Gross national per capita income (U.S. dollars) 417 1,080 450
Area (in thousands of square kilometers) 15 ... ...
Demography Total population (in millions) 0.925 2/ 1,855 2,310 Population growth (in percent) 3/ 4.0 1.2 2.0
Life expectancy and mortality Life expectancy at birth (years) 62 70 58 Male 60 68 57 Female 64 71 59 Infant mortality (per thousand live births) 89 32 80 Under 5 mortality rate (per thousand live births) 107 41 123
Education Illiteracy rate (in percent) 4/ 51 10 5/ 49 5/ Male 46 ... ... Female 55 ... ... Net primary school enrollment rate (in percent) 75 93 5/ 77 5/ Health Immunization rate(in percent of children aged 12 to 23 months)
Measles 60 82 65 DPT 70 82 67
Other indicators 6/ The population below the poverty line 40 5/ … ... Households with access to electricity 26 … ... Households with access to safe water 52 7/ 78 7/ 75 7/
Sources: UNDP Human Development Report 2004, World Bank, and Fund staff estimates.
1/ Data are for 2003, unless otherwise indicated.2/ Data for 2004. Provisional population count from 2004 census.3/ For Timor Leste, average growth over 2000-2004, including returning refugees. For comparatorsaverage for 1990-2003.4/ For ages 15 and above.5/ Figures are for 2001.6/ In percentage share of the total.7/ Figures are for 2002.
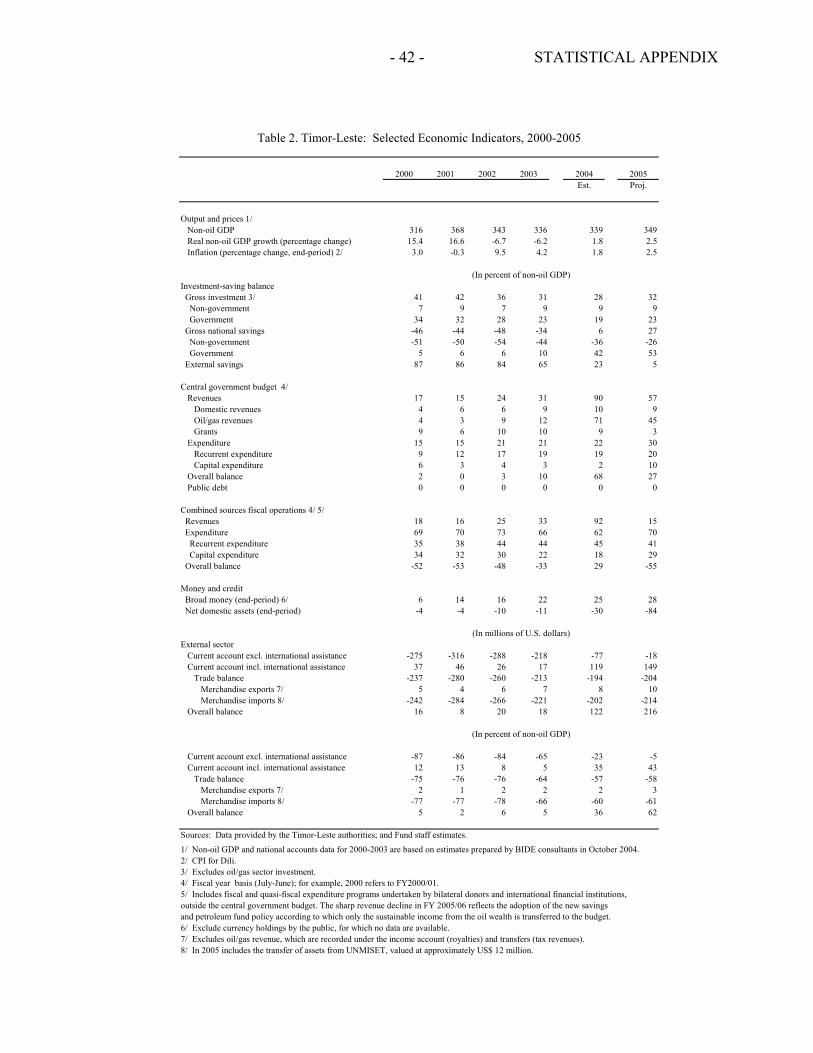
- 42 - STATISTICAL APPENDIX
Table 2. Timor-Leste: Selected Economic Indicators, 2000-2005
2000 2001 2002 2003 2004 2005Est. Proj.
Output and prices 1/Non-oil GDP 316 368 343 336 339 349Real non-oil GDP growth (percentage change) 15.4 16.6 -6.7 -6.2 1.8 2.5Inflation (percentage change, end-period) 2/ 3.0 -0.3 9.5 4.2 1.8 2.5
(In percent of non-oil GDP)Investment-saving balance Gross investment 3/ 41 42 36 31 28 32 Non-government 7 9 7 9 9 9 Government 34 32 28 23 19 23 Gross national savings -46 -44 -48 -34 6 27 Non-government -51 -50 -54 -44 -36 -26 Government 5 6 6 10 42 53 External savings 87 86 84 65 23 5
Central government budget 4/ Revenues 17 15 24 31 90 57
Domestic revenues 4 6 6 9 10 9Oil/gas revenues 4 3 9 12 71 45Grants 9 6 10 10 9 3
Expenditure 15 15 21 21 22 30Recurrent expenditure 9 12 17 19 19 20Capital expenditure 6 3 4 3 2 10
Overall balance 2 0 3 10 68 27Public debt 0 0 0 0 0 0
Combined sources fiscal operations 4/ 5/ Revenues 18 16 25 33 92 15 Expenditure 69 70 73 66 62 70 Recurrent expenditure 35 38 44 44 45 41 Capital expenditure 34 32 30 22 18 29 Overall balance -52 -53 -48 -33 29 -55
Money and credit Broad money (end-period) 6/ 6 14 16 22 25 28 Net domestic assets (end-period) -4 -4 -10 -11 -30 -84
(In millions of U.S. dollars)External sector
Current account excl. international assistance -275 -316 -288 -218 -77 -18Current account incl. international assistance 37 46 26 17 119 149
Trade balance -237 -280 -260 -213 -194 -204Merchandise exports 7/ 5 4 6 7 8 10Merchandise imports 8/ -242 -284 -266 -221 -202 -214
Overall balance 16 8 20 18 122 216
(In percent of non-oil GDP)
Current account excl. international assistance -87 -86 -84 -65 -23 -5Current account incl. international assistance 12 13 8 5 35 43
Trade balance -75 -76 -76 -64 -57 -58Merchandise exports 7/ 2 1 2 2 2 3Merchandise imports 8/ -77 -77 -78 -66 -60 -61
Overall balance 5 2 6 5 36 62
Sources: Data provided by the Timor-Leste authorities; and Fund staff estimates.
1/ Non-oil GDP and national accounts data for 2000-2003 are based on estimates prepared by BIDE consultants in October 2004.2/ CPI for Dili.3/ Excludes oil/gas sector investment.4/ Fiscal year basis (July-June); for example, 2000 refers to FY2000/01.5/ Includes fiscal and quasi-fiscal expenditure programs undertaken by bilateral donors and international financial institutions, outside the central government budget. The sharp revenue decline in FY 2005/06 reflects the adoption of the new savings and petroleum fund policy according to which only the sustainable income from the oil wealth is transferred to the budget.6/ Exclude currency holdings by the public, for which no data are available. 7/ Excludes oil/gas revenue, which are recorded under the income account (royalties) and transfers (tax revenues).8/ In 2005 includes the transfer of assets from UNMISET, valued at approximately US$ 12 million.
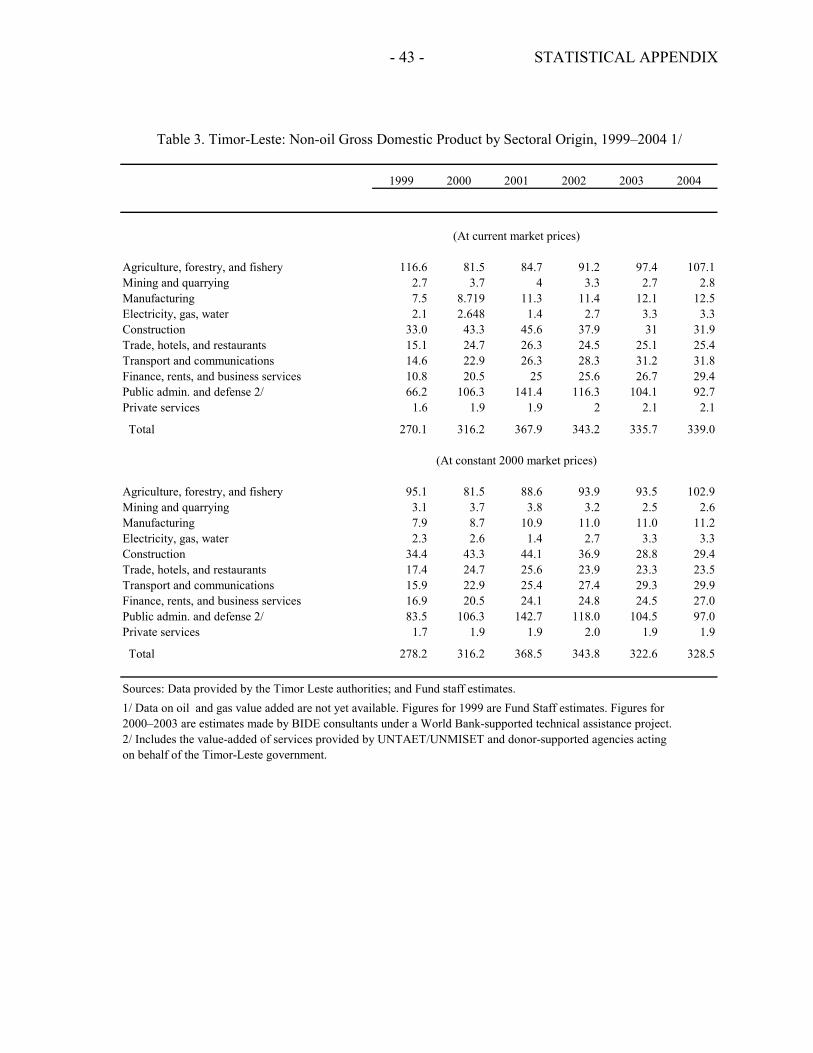
- 43 - STATISTICAL APPENDIX
Table 3. Timor-Leste: Non-oil Gross Domestic Product by Sectoral Origin, 1999–2004 1/
1999 2000 2001 2002 2003 2004
(At current market prices)
Agriculture, forestry, and fishery 116.6 81.5 84.7 91.2 97.4 107.1Mining and quarrying 2.7 3.7 4 3.3 2.7 2.8Manufacturing 7.5 8.719 11.3 11.4 12.1 12.5Electricity, gas, water 2.1 2.648 1.4 2.7 3.3 3.3Construction 33.0 43.3 45.6 37.9 31 31.9Trade, hotels, and restaurants 15.1 24.7 26.3 24.5 25.1 25.4Transport and communications 14.6 22.9 26.3 28.3 31.2 31.8Finance, rents, and business services 10.8 20.5 25 25.6 26.7 29.4Public admin. and defense 2/ 66.2 106.3 141.4 116.3 104.1 92.7Private services 1.6 1.9 1.9 2 2.1 2.1
Total 270.1 316.2 367.9 343.2 335.7 339.0
(At constant 2000 market prices)
Agriculture, forestry, and fishery 95.1 81.5 88.6 93.9 93.5 102.9Mining and quarrying 3.1 3.7 3.8 3.2 2.5 2.6Manufacturing 7.9 8.7 10.9 11.0 11.0 11.2Electricity, gas, water 2.3 2.6 1.4 2.7 3.3 3.3Construction 34.4 43.3 44.1 36.9 28.8 29.4Trade, hotels, and restaurants 17.4 24.7 25.6 23.9 23.3 23.5Transport and communications 15.9 22.9 25.4 27.4 29.3 29.9Finance, rents, and business services 16.9 20.5 24.1 24.8 24.5 27.0Public admin. and defense 2/ 83.5 106.3 142.7 118.0 104.5 97.0Private services 1.7 1.9 1.9 2.0 1.9 1.9
Total 278.2 316.2 368.5 343.8 322.6 328.5
Sources: Data provided by the Timor Leste authorities; and Fund staff estimates.1/ Data on oil and gas value added are not yet available. Figures for 1999 are Fund Staff estimates. Figures for 2000–2003 are estimates made by BIDE consultants under a World Bank-supported technical assistance project.2/ Includes the value-added of services provided by UNTAET/UNMISET and donor-supported agencies actingon behalf of the Timor-Leste government.

- 44 - STATISTICAL APPENDIX
Table 4. Timor-Leste: Non-oil Gross Domestic Product by Expenditure, 1999–2004 1/
1999 2000 2001 2002 2003 2004Estimates
(In millions of U.S. dollars)
Non-oil GDP at current prices 270.1 316.2 367.8 343.3 335.7 339.0Consumption 305.3 376.0 438.2 403.0 393.0 381.4 Private 264.8 206.0 213.0 203.8 200.0 207.9 Public 2/3/ 40.5 170.0 225.2 199.2 193.0 173.5Gross investment 4/ 56.7 130.7 153.6 122.5 105.0 96.3 Private 13.5 22.5 34.9 25.4 29.2 30.7 Public 2/ 43.2 108.2 118.7 97.1 75.8 65.6Net exports of goods/non-factor services -91.9 -190.5 -224.0 -182.2 -162.3 -138.7
GNP at current prices 270.1 322.7 379.7 363.4 371.1 481.7 non-oil GDP 270.1 316.2 367.8 343.3 335.7 339.0 Oil income 0.0 6.5 11.9 20.1 35.4 142.7Gross national savings 19.8 -144.6 -161.9 -165.1 -112.7 19.5 Private 22.5 98.3 118.0 67.1 23.0 18.7 Public 2/ -2.7 -242.9 -280.0 -232.1 -135.8 0.7External savings 37.0 275.3 315.5 287.6 217.7 76.8
(In percent of non-oil GDP)
GDP at current prices 100.0 101.0 102.0 103.0 104.0 105.0Consumption 113.0 118.9 119.1 117.4 117.1 112.5 Private 98.0 65.1 57.9 59.4 59.6 61.3 Public 2/3/ 15.0 53.8 61.2 58.0 57.5 51.2Gross investment 21.0 41.3 41.8 35.7 31.3 28.4 Private 5.0 7.1 9.5 7.4 8.7 9.0 Public 2/ 16.0 34.2 32.3 28.3 22.6 19.4Net exports of goods/non-factor services -34.0 -60.2 -60.9 -53.1 -48.3 -40.9
GNP at current prices 100.0 102.1 103.2 105.9 110.6 142.1 non-oil GDP 100.0 100.0 100.0 100.0 100.0 100.0 Oil income 0.0 2.1 3.2 5.9 10.6 42.1Gross national savings 7.3 -45.7 -44.0 -48.1 -33.6 5.7 Private 8.3 31.1 32.1 19.5 6.9 5.5 Public 2/ -1.0 -76.8 -76.1 -67.6 -40.4 0.2External savings 13.7 87.1 85.8 83.8 64.9 22.7
Sources: Data provided by the Timor-Leste authorities; and Fund staff estimates.1/ For 2000–2003 the estimates are partially based on provisional national account data prepared by BIDE under a World Bank grant. Data for 1999 and 2004 are Fund staff estimates.2/ Includes fiscal and quasi-fiscal activities undertaken by multinational institutions and bilateral donors. 3/ Does not necessarily correspond to recurrent expenditures shown in Table 16 due to differences in the coverage of data (particularly those relating to technical assistance).
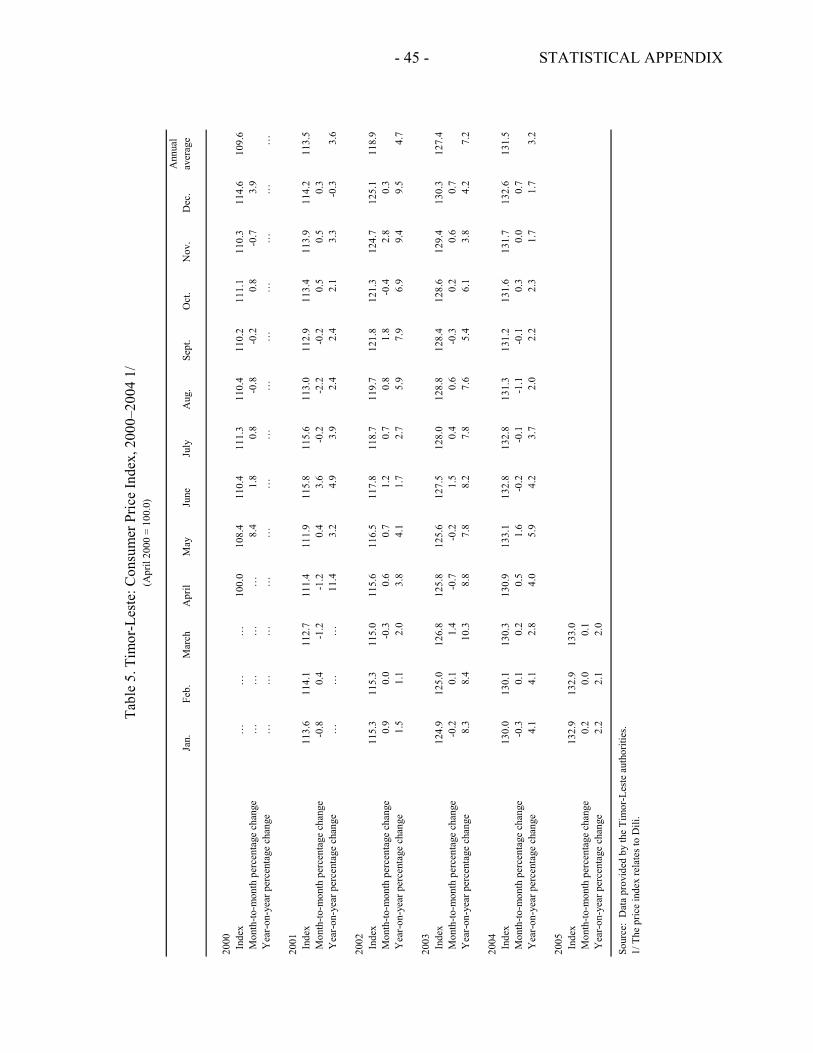
- 45 - STATISTICAL APPENDIX
Tabl
e 5.
Tim
or-L
este
: Con
sum
er P
rice
Inde
x, 2
000–
2004
1/
(Apr
il 20
00 =
100
.0)
Ann
ual
Jan.
Feb.
Mar
chA
pril
May
June
July
Aug
.Se
pt.
Oct
.N
ov.
Dec
.av
erag
e
2000
Ind
ex
…
…
…
100.
010
8.4
110.
411
1.3
110.
411
0.2
111.
111
0.3
114.
610
9.6
Mon
th-to
-mon
th p
erce
ntag
e ch
ange
…
…
…
…
8.4
1.8
0.8
-0.8
-0.2
0.8
-0.7
3.9
Yea
r-on
-yea
r per
cent
age
chan
ge
…
…
…
…
…
…
…
…
…
…
…
…
…
2001
Ind
ex11
3.6
114.
111
2.7
111.
411
1.9
115.
811
5.6
113.
011
2.9
113.
411
3.9
114.
211
3.5
Mon
th-to
-mon
th p
erce
ntag
e ch
ange
-0.8
0.4
-1.2
-1.2
0.4
3.6
-0.2
-2.2
-0.2
0.5
0.5
0.3
Yea
r-on
-yea
r per
cent
age
chan
ge
…
…
…
11.4
3.2
4.9
3.9
2.4
2.4
2.1
3.3
-0.3
3.6
2002
Ind
ex11
5.3
115.
311
5.0
115.
611
6.5
117.
811
8.7
119.
712
1.8
121.
312
4.7
125.
111
8.9
Mon
th-to
-mon
th p
erce
ntag
e ch
ange
0.9
0.0
-0.3
0.6
0.7
1.2
0.7
0.8
1.8
-0.4
2.8
0.3
Yea
r-on
-yea
r per
cent
age
chan
ge1.
51.
12.
03.
84.
11.
72.
75.
97.
96.
99.
49.
54.
7
2003
Ind
ex12
4.9
125.
012
6.8
125.
812
5.6
127.
512
8.0
128.
812
8.4
128.
612
9.4
130.
312
7.4
Mon
th-to
-mon
th p
erce
ntag
e ch
ange
-0.2
0.1
1.4
-0.7
-0.2
1.5
0.4
0.6
-0.3
0.2
0.6
0.7
Yea
r-on
-yea
r per
cent
age
chan
ge8.
38.
410
.38.
87.
88.
27.
87.
65.
46.
13.
84.
27.
2
2004
Ind
ex13
0.0
130.
113
0.3
130.
913
3.1
132.
813
2.8
131.
313
1.2
131.
613
1.7
132.
613
1.5
Mon
th-to
-mon
th p
erce
ntag
e ch
ange
-0.3
0.1
0.2
0.5
1.6
-0.2
-0.1
-1.1
-0.1
0.3
0.0
0.7
Yea
r-on
-yea
r per
cent
age
chan
ge4.
14.
12.
84.
05.
94.
23.
72.
02.
22.
31.
71.
73.
2
2005
Ind
ex13
2.9
132.
913
3.0
Mon
th-to
-mon
th p
erce
ntag
e ch
ange
0.2
0.0
0.1
Yea
r-on
-yea
r per
cent
age
chan
ge2.
22.
12.
0
Sour
ce:
Dat
a pr
ovid
ed b
y th
e Ti
mor
-Les
te a
utho
ritie
s.1/
The
pric
e in
dex
rela
tes t
o D
ili.

- 46 - STATISTICAL APPENDIX
Table 6. Timor-Leste: Monetary Survey, 2000–05 1/
2000 2001 2002 2003 2004 2005Dec. Dec. Dec. Dec. Mar. June Sept. Dec. Mar.
(In millions of U.S. dollars; end of period)
Net foreign assets 33.8 65.4 89.9 108.3 127.7 122 141.2 186.6 283.7 Assets 33.8 72.9 93.3 141.6 184.1 154 179.7 228.2 326.1 Cash holdings 6.3 11.7 18.1 19.0 28.6 17.8 27.8 28.4 24.5 Claims on foreign banks 27.5 61.2 75.3 122.6 155.6 136.1 86.9 65.8 65.5 Treasury bills 0.0 0.0 0.0 0.0 0.0 0.0 65.0 134.0 236.1 Other 0.0 0.1 0.0 0.0 0.0 0.0 0.0 0.0 0.0 Liabilities 0.0 7.5 3.5 33.3 56.4 32 38.5 41.6 42.4
Net domestic assets -13.8 -14.3 -35.3 -36.0 -52.7 -35.7 -54.4 -102.6 -197.0 Claims on government (net) -19.0 -21.1 -33.7 -49.7 -74.3 -78.7 -104.3 -168.4 -269.0 Loans and advances to private sector 0.3 3.0 5.1 22.1 32.4 53.4 66.3 70.5 75.6 Other items (net) 4.9 3.8 -6.7 -8.4 -10.8 -10.4 -16.4 -4.7 -3.6
Broad money 2/ 20.0 51.1 54.6 72.3 75.0 84.4 86.8 84.0 86.7 Demand deposits 19.3 36.9 39.1 40.1 43.9 49.7 53.6 49.4 52.4 Saving deposits 0.0 8.2 10.2 22.6 25.2 28.5 27.3 27.8 26.7 Time deposits 0.7 6.0 5.3 9.6 5.9 6.2 5.9 6.8 7.5
(In percent of non-oil GDP)
Net foreign assets 10.7 17.8 26.2 32.3 37.7 36.0 41.7 55.0 81.2Net domestic assets -4.4 -3.9 -10.3 -10.7 -15.5 -10.5 -16.0 -30.3 -56.4Broad money 2/ 6.3 13.9 15.9 21.5 22.1 24.9 25.6 24.8 24.8 Demand deposits 6.1 10.0 11.4 11.9 13.0 14.7 15.8 14.6 15.0 Saving deposits 0.0 2.2 3.0 6.7 7.4 8.4 8.1 8.2 7.7 Time deposits 0.2 1.6 1.6 2.9 1.7 1.8 1.7 2.0 2.1
Memorandum item: Bank loan/broad money ratio (in percent) 1.5 5.9 9.4 30.6 43.1 63.3 76.4 83.9 87.2
Source: Data provided by the Banking and Payments Authority.1/ The banking system consists of the Banking and Payments Authority (BPA), four commercial banks, and one microfinance institution.2/ Excludes currency in circulation, for which no data is available due to dollarization of the financial system.

- 47 - STATISTICAL APPENDIX
Table 7. Timor-Leste: Balance Sheet of the Banking and Payments Authority, 2000–05(In millions of U.S. dollars; end of period)
2000 2001 2002 2003 2004 2005Dec. Dec. Dec. Dec. Mar. June Sept. Dec. Mar.
Net foreign assets 16.0 23.7 43.5 61.3 86.8 91.9 119.4 183.1 284.5 Assets 16.0 23.7 43.5 61.3 86.8 91.9 119.4 183.1 284.5 Cash in vault 1.3 4.9 13.0 6.9 20.4 8.7 21.8 21.1 18.4 Claims on central banks 14.7 18.8 30.5 54.4 66.4 83.2 32.6 28.0 29.9 Reserve Bank of Australia 14.7 18.7 30.5 54.4 66.4 83.2 32.6 28.0 29.9 o/w Timor Sea account 1/ 3.1 7.4 7.5 10.6 13.9 13.9 13.9 14.0 ... Other foreign banks 0.0 0.0 0.0 0.0 0.0 0.0 0.0 0.0 0.0 Other 2/ 0.0 0.1 0.0 0.0 0.0 0.0 65.0 134.0 236.1 Liabilities 0.0 0.0 0.0 0.0 0.0 0.0 0.0 0.0 0.0
Net domestic assets -16.0 -22.7 -39.1 -55.0 -80.9 -86.2 -112.6 -177.6 -279.0 Government (net position) -19.0 -21.1 -33.7 -49.7 -74.3 -78.7 -104.3 -168.4 -269.0 Budget -16.0 -13.8 -26.2 -39.1 -60.4 -64.8 -90.4 -154.4 -214.6 Timor Sea account 1/ -3.1 7.4 -7.5 -10.6 -13.9 -13.9 -13.9 -14.0 -54.4 Claims on financial institutions 3.0 3.5 2.4 3.4 2.5 1.3 1.3 0.7 0.2 Commercial banks 3.0 3.5 2.4 3.0 2.1 0.9 1.5 1.3 1.9 Microfinance institution 0.0 0.0 0.0 0.4 0.4 0.4 -0.3 -0.6 -1.7 Other items (net) 0.0 -5.0 -7.8 -8.8 -9.2 -8.8 -9.5 -9.9 -10.3 O/w: capital and reserves -0.7 -5.0 -6.9 -7.7 -7.7 8.4 8.6 9.0 9.5
Liabilities 0.0 0.0 4.5 6.3 5.9 5.8 6.9 5.5 5.4 Financial institutions 0.0 0.0 4.5 6.3 5.9 5.8 6.9 5.5 5.4 Commercial banks 0.0 0.0 2.3 4.5 4.1 3.9 5.0 3.6 3.6 Microfinance institution 0.0 0.0 2.2 1.8 1.8 1.9 1.8 1.9 1.9 Other 0.0 0.0 0.0 0.0 0.0 0.0 0.0 0.0 0.0
Source: Data provided by the Banking and Payments Authority.1/ Cumulative oil/gas revenue savings (First Tranche Petroleum and interest thereon). After 2004, funds invested in US treasury bills.2/ Investment in US treasury bills of FTP and part of the government cash-balances.

- 48 - STATISTICAL APPENDIX
Table 8. Timor-Leste: Consolidated Balance Sheet of Financial Institutions, 2000–05 1/(In millions of U.S. dollars; end of period)
Memorandum2000 2001 2002 2003 2004 2005 ItemsDec. Dec. Dec. Dec. Mar. June Sept. Dec. Mar. Interest
rates 2/
Net foreign assets 17.8 41.7 46.4 47.0 40.9 30.1 21.8 3.5 -0.8 Assets 17.8 49.2 49.8 80.3 97.4 62.1 60.3 45.1 41.7 Cash holdings 5.0 6.8 5.0 12.1 8.2 9.1 6.0 7.4 6.1 Claims on foreign banks 12.8 42.4 44.8 68.2 89.2 53.0 54.3 37.8 35.6 Other 0.0 0.0 0.0 0.0 0.0 0.0 0.0 0.0 0.0 Liabilities 0.0 7.5 3.5 33.3 56.4 32.0 38.5 41.6 42.4
Net domestic assets 5.2 12.9 10.7 28.8 36.6 57.5 66.3 81.2 87.7 Deposits with BPA 0.0 1.0 4.5 6.3 5.9 5.8 6.9 6.0 5.5 Claims on government (net) 0.0 0.0 0.0 0.0 0.0 0.0 0.0 0.0 0.0 Loans and advances to private sector 0.3 3.0 5.1 22.1 32.4 53.4 66.3 70.5 75.6 Other items (net) 4.9 8.9 1.1 0.4 10.5 10.5 4.2 17.6 -16.5
Deposit liabilities 20.0 51.1 54.6 72.3 75.0 86.3 86.8 84.0 86.7 Demand deposits 19.3 36.9 39.1 40.1 44.0 50.0 53.6 49.4 52.4 0.4 Saving deposits 0.0 8.2 10.2 22.6 25.1 30.1 27.4 27.8 26.7 0.3 Time deposits 0.7 6.0 5.3 9.6 6.0 6.2 5.9 6.8 7.5 0.4-0.8
Liabilities to BPA 3.0 3.5 2.4 3.4 2.5 1.3 1.3 0.7 0.2
Source: Data provided by the Banking and Payments Authority.1/ Comprise four commercial banks and the microfinance institution.2/ Refers to weighted average interest rates at end-2004.
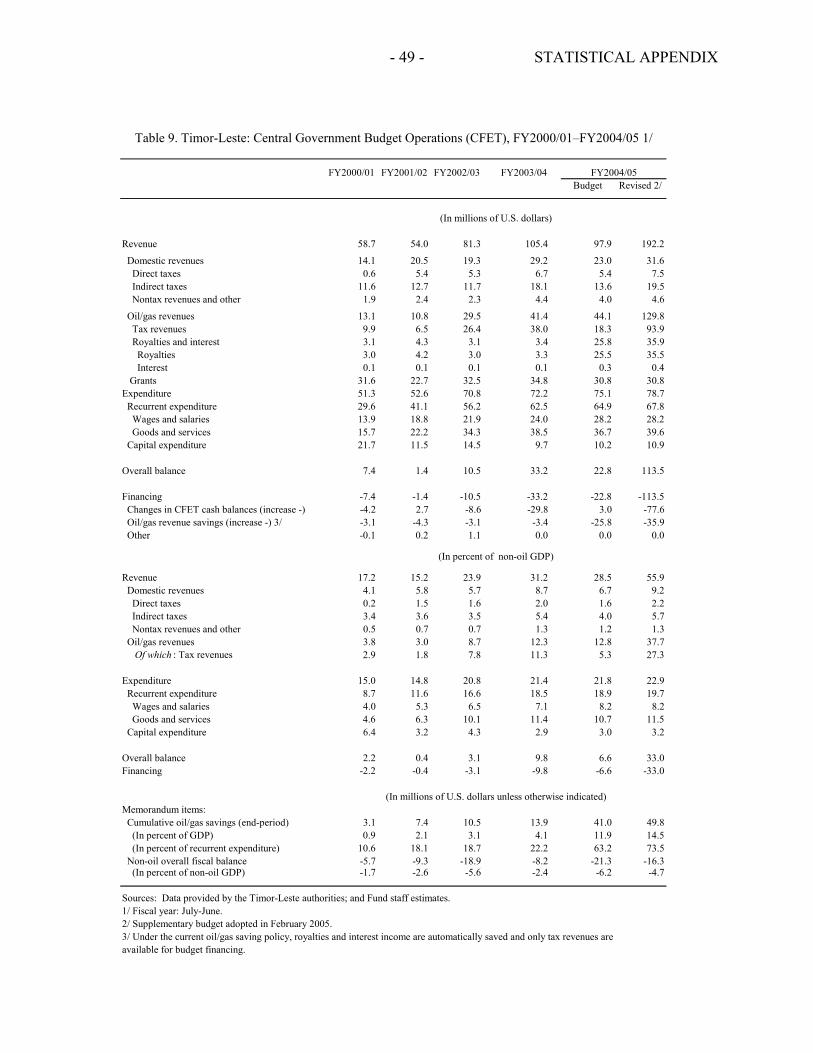
- 49 - STATISTICAL APPENDIX
Table 9. Timor-Leste: Central Government Budget Operations (CFET), FY2000/01–FY2004/05 1/
FY2000/01 FY2001/02 FY2002/03 FY2003/04Budget Revised 2/
(In millions of U.S. dollars)
Revenue 58.7 54.0 81.3 105.4 97.9 192.2
Domestic revenues 14.1 20.5 19.3 29.2 23.0 31.6 Direct taxes 0.6 5.4 5.3 6.7 5.4 7.5 Indirect taxes 11.6 12.7 11.7 18.1 13.6 19.5 Nontax revenues and other 1.9 2.4 2.3 4.4 4.0 4.6
Oil/gas revenues 13.1 10.8 29.5 41.4 44.1 129.8 Tax revenues 9.9 6.5 26.4 38.0 18.3 93.9 Royalties and interest 3.1 4.3 3.1 3.4 25.8 35.9 Royalties 3.0 4.2 3.0 3.3 25.5 35.5 Interest 0.1 0.1 0.1 0.1 0.3 0.4
Grants 31.6 22.7 32.5 34.8 30.8 30.8Expenditure 51.3 52.6 70.8 72.2 75.1 78.7 Recurrent expenditure 29.6 41.1 56.2 62.5 64.9 67.8 Wages and salaries 13.9 18.8 21.9 24.0 28.2 28.2 Goods and services 15.7 22.2 34.3 38.5 36.7 39.6 Capital expenditure 21.7 11.5 14.5 9.7 10.2 10.9
Overall balance 7.4 1.4 10.5 33.2 22.8 113.5
Financing -7.4 -1.4 -10.5 -33.2 -22.8 -113.5 Changes in CFET cash balances (increase -) -4.2 2.7 -8.6 -29.8 3.0 -77.6 Oil/gas revenue savings (increase -) 3/ -3.1 -4.3 -3.1 -3.4 -25.8 -35.9 Other -0.1 0.2 1.1 0.0 0.0 0.0
(In percent of non-oil GDP)
Revenue 17.2 15.2 23.9 31.2 28.5 55.9 Domestic revenues 4.1 5.8 5.7 8.7 6.7 9.2 Direct taxes 0.2 1.5 1.6 2.0 1.6 2.2 Indirect taxes 3.4 3.6 3.5 5.4 4.0 5.7 Nontax revenues and other 0.5 0.7 0.7 1.3 1.2 1.3 Oil/gas revenues 3.8 3.0 8.7 12.3 12.8 37.7 Of which : Tax revenues 2.9 1.8 7.8 11.3 5.3 27.3
Expenditure 15.0 14.8 20.8 21.4 21.8 22.9 Recurrent expenditure 8.7 11.6 16.6 18.5 18.9 19.7 Wages and salaries 4.0 5.3 6.5 7.1 8.2 8.2 Goods and services 4.6 6.3 10.1 11.4 10.7 11.5 Capital expenditure 6.4 3.2 4.3 2.9 3.0 3.2
Overall balance 2.2 0.4 3.1 9.8 6.6 33.0Financing -2.2 -0.4 -3.1 -9.8 -6.6 -33.0
(In millions of U.S. dollars unless otherwise indicated)Memorandum items: Cumulative oil/gas savings (end-period) 3.1 7.4 10.5 13.9 41.0 49.8 (In percent of GDP) 0.9 2.1 3.1 4.1 11.9 14.5 (In percent of recurrent expenditure) 10.6 18.1 18.7 22.2 63.2 73.5 Non-oil overall fiscal balance -5.7 -9.3 -18.9 -8.2 -21.3 -16.3 (In percent of non-oil GDP) -1.7 -2.6 -5.6 -2.4 -6.2 -4.7
Sources: Data provided by the Timor-Leste authorities; and Fund staff estimates.1/ Fiscal year: July-June.2/ Supplementary budget adopted in February 2005.3/ Under the current oil/gas saving policy, royalties and interest income are automatically saved and only tax revenues are available for budget financing.
FY2004/05
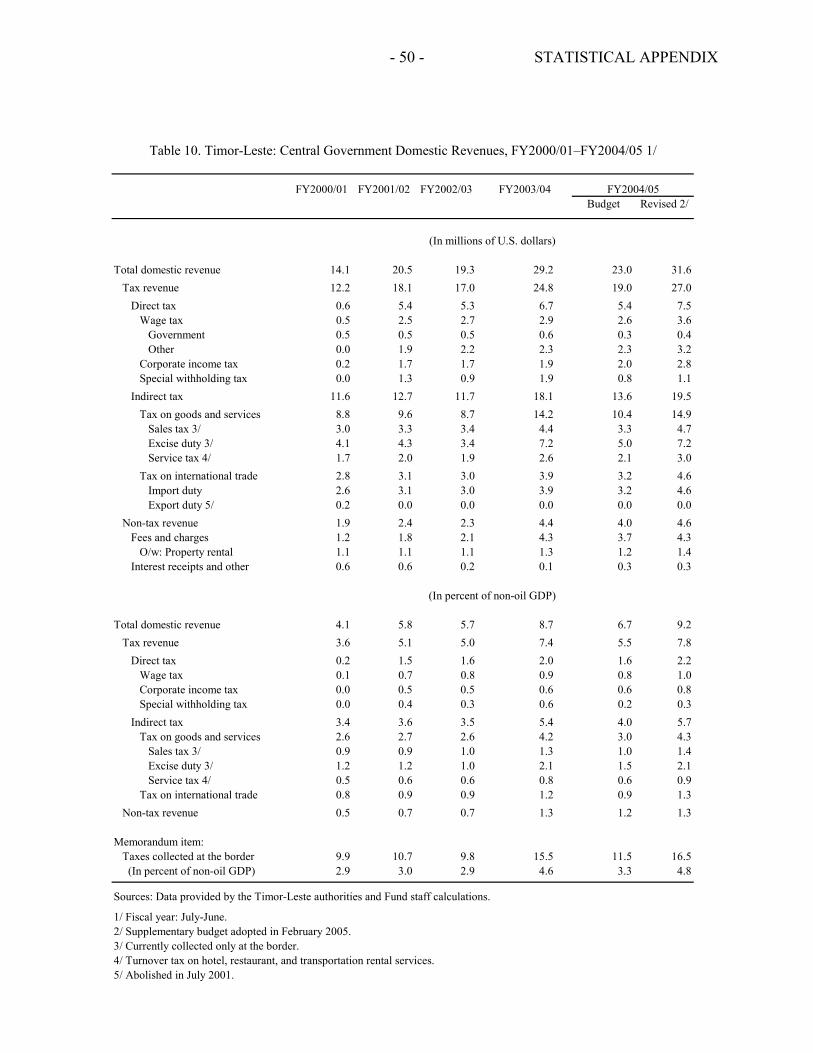
- 50 - STATISTICAL APPENDIX
Table 10. Timor-Leste: Central Government Domestic Revenues, FY2000/01–FY2004/05 1/
FY2000/01 FY2001/02 FY2002/03 FY2003/04Budget Revised 2/
(In millions of U.S. dollars)
Total domestic revenue 14.1 20.5 19.3 29.2 23.0 31.6Tax revenue 12.2 18.1 17.0 24.8 19.0 27.0
Direct tax 0.6 5.4 5.3 6.7 5.4 7.5Wage tax 0.5 2.5 2.7 2.9 2.6 3.6
Government 0.5 0.5 0.5 0.6 0.3 0.4Other 0.0 1.9 2.2 2.3 2.3 3.2
Corporate income tax 0.2 1.7 1.7 1.9 2.0 2.8Special withholding tax 0.0 1.3 0.9 1.9 0.8 1.1
Indirect tax 11.6 12.7 11.7 18.1 13.6 19.5 Tax on goods and services 8.8 9.6 8.7 14.2 10.4 14.9
Sales tax 3/ 3.0 3.3 3.4 4.4 3.3 4.7 Excise duty 3/ 4.1 4.3 3.4 7.2 5.0 7.2 Service tax 4/ 1.7 2.0 1.9 2.6 2.1 3.0
Tax on international trade 2.8 3.1 3.0 3.9 3.2 4.6 Import duty 2.6 3.1 3.0 3.9 3.2 4.6 Export duty 5/ 0.2 0.0 0.0 0.0 0.0 0.0
Non-tax revenue 1.9 2.4 2.3 4.4 4.0 4.6Fees and charges 1.2 1.8 2.1 4.3 3.7 4.3 O/w: Property rental 1.1 1.1 1.1 1.3 1.2 1.4Interest receipts and other 0.6 0.6 0.2 0.1 0.3 0.3
Total domestic revenue 4.1 5.8 5.7 8.7 6.7 9.2Tax revenue 3.6 5.1 5.0 7.4 5.5 7.8
Direct tax 0.2 1.5 1.6 2.0 1.6 2.2Wage tax 0.1 0.7 0.8 0.9 0.8 1.0Corporate income tax 0.0 0.5 0.5 0.6 0.6 0.8Special withholding tax 0.0 0.4 0.3 0.6 0.2 0.3
Indirect tax 3.4 3.6 3.5 5.4 4.0 5.7 Tax on goods and services 2.6 2.7 2.6 4.2 3.0 4.3
Sales tax 3/ 0.9 0.9 1.0 1.3 1.0 1.4 Excise duty 3/ 1.2 1.2 1.0 2.1 1.5 2.1 Service tax 4/ 0.5 0.6 0.6 0.8 0.6 0.9
Tax on international trade 0.8 0.9 0.9 1.2 0.9 1.3Non-tax revenue 0.5 0.7 0.7 1.3 1.2 1.3
Memorandum item:Taxes collected at the border 9.9 10.7 9.8 15.5 11.5 16.5 (In percent of non-oil GDP) 2.9 3.0 2.9 4.6 3.3 4.8
Sources: Data provided by the Timor-Leste authorities and Fund staff calculations.
1/ Fiscal year: July-June.2/ Supplementary budget adopted in February 2005.3/ Currently collected only at the border.4/ Turnover tax on hotel, restaurant, and transportation rental services.5/ Abolished in July 2001.
(In percent of non-oil GDP)
FY2004/05
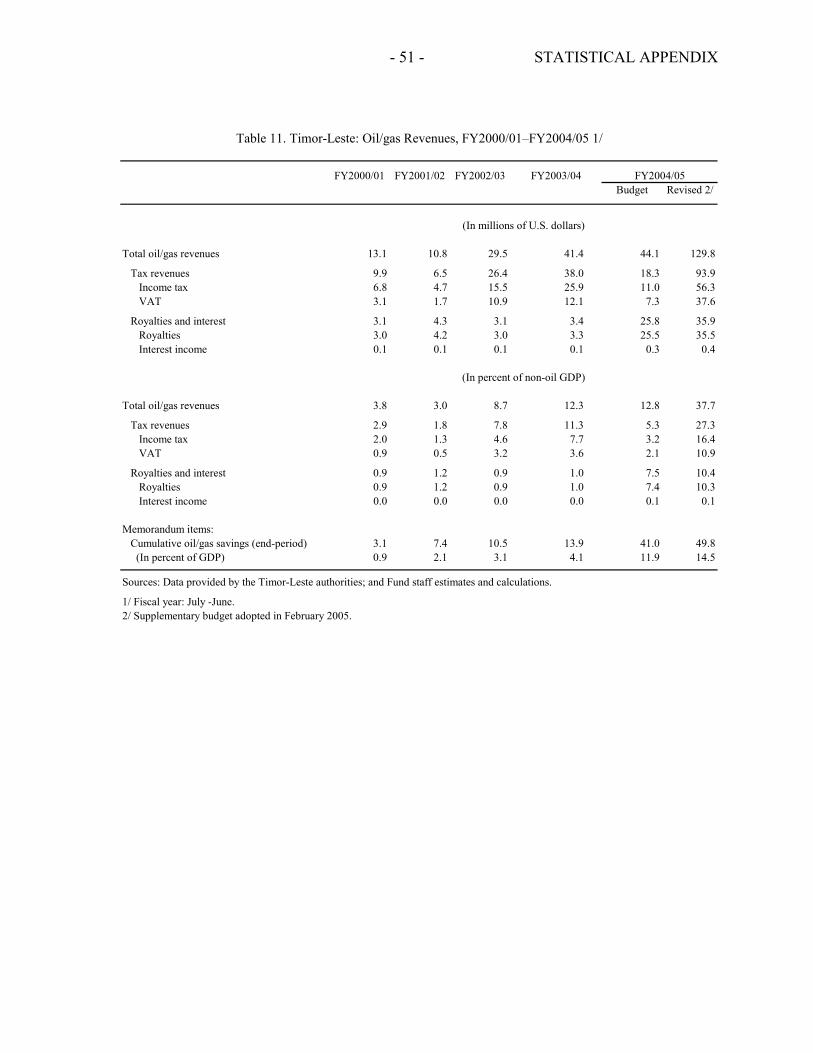
- 51 - STATISTICAL APPENDIX
Table 11. Timor-Leste: Oil/gas Revenues, FY2000/01–FY2004/05 1/
FY2000/01 FY2001/02 FY2002/03 FY2003/04Budget Revised 2/
(In millions of U.S. dollars)
Total oil/gas revenues 13.1 10.8 29.5 41.4 44.1 129.8
Tax revenues 9.9 6.5 26.4 38.0 18.3 93.9Income tax 6.8 4.7 15.5 25.9 11.0 56.3VAT 3.1 1.7 10.9 12.1 7.3 37.6
Royalties and interest 3.1 4.3 3.1 3.4 25.8 35.9 Royalties 3.0 4.2 3.0 3.3 25.5 35.5 Interest income 0.1 0.1 0.1 0.1 0.3 0.4
(In percent of non-oil GDP)
Total oil/gas revenues 3.8 3.0 8.7 12.3 12.8 37.7
Tax revenues 2.9 1.8 7.8 11.3 5.3 27.3Income tax 2.0 1.3 4.6 7.7 3.2 16.4VAT 0.9 0.5 3.2 3.6 2.1 10.9
Royalties and interest 0.9 1.2 0.9 1.0 7.5 10.4 Royalties 0.9 1.2 0.9 1.0 7.4 10.3 Interest income 0.0 0.0 0.0 0.0 0.1 0.1
Memorandum items:Cumulative oil/gas savings (end-period) 3.1 7.4 10.5 13.9 41.0 49.8 (In percent of GDP) 0.9 2.1 3.1 4.1 11.9 14.5
Sources: Data provided by the Timor-Leste authorities; and Fund staff estimates and calculations.
1/ Fiscal year: July -June.2/ Supplementary budget adopted in February 2005.
FY2004/05
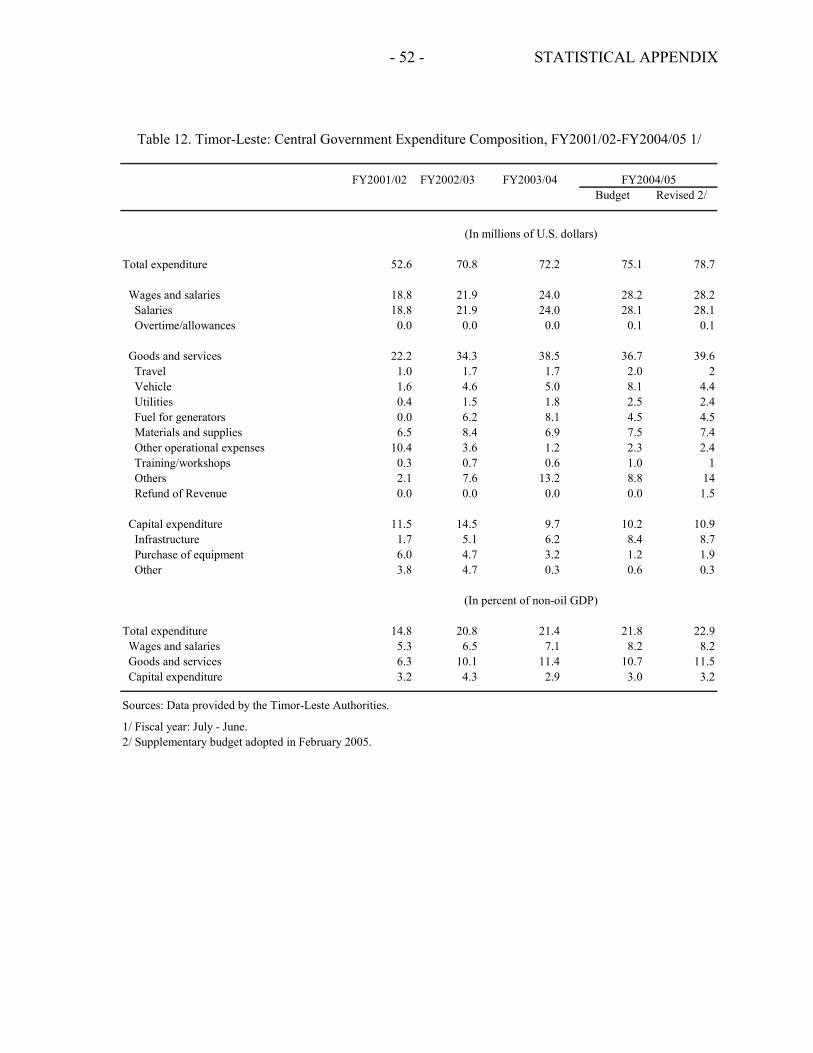
- 52 - STATISTICAL APPENDIX
Table 12. Timor-Leste: Central Government Expenditure Composition, FY2001/02-FY2004/05 1/
FY2001/02 FY2002/03 FY2003/04Budget Revised 2/
Total expenditure 52.6 70.8 72.2 75.1 78.7
Wages and salaries 18.8 21.9 24.0 28.2 28.2 Salaries 18.8 21.9 24.0 28.1 28.1 Overtime/allowances 0.0 0.0 0.0 0.1 0.1
Goods and services 22.2 34.3 38.5 36.7 39.6 Travel 1.0 1.7 1.7 2.0 2 Vehicle 1.6 4.6 5.0 8.1 4.4 Utilities 0.4 1.5 1.8 2.5 2.4 Fuel for generators 0.0 6.2 8.1 4.5 4.5 Materials and supplies 6.5 8.4 6.9 7.5 7.4 Other operational expenses 10.4 3.6 1.2 2.3 2.4 Training/workshops 0.3 0.7 0.6 1.0 1
Others 2.1 7.6 13.2 8.8 14 Refund of Revenue 0.0 0.0 0.0 0.0 1.5
Capital expenditure 11.5 14.5 9.7 10.2 10.9 Infrastructure 1.7 5.1 6.2 8.4 8.7 Purchase of equipment 6.0 4.7 3.2 1.2 1.9 Other 3.8 4.7 0.3 0.6 0.3
Total expenditure 14.8 20.8 21.4 21.8 22.9 Wages and salaries 5.3 6.5 7.1 8.2 8.2 Goods and services 6.3 10.1 11.4 10.7 11.5 Capital expenditure 3.2 4.3 2.9 3.0 3.2
Sources: Data provided by the Timor-Leste Authorities.
1/ Fiscal year: July - June.2/ Supplementary budget adopted in February 2005.
FY2004/05
(In percent of non-oil GDP)
(In millions of U.S. dollars)
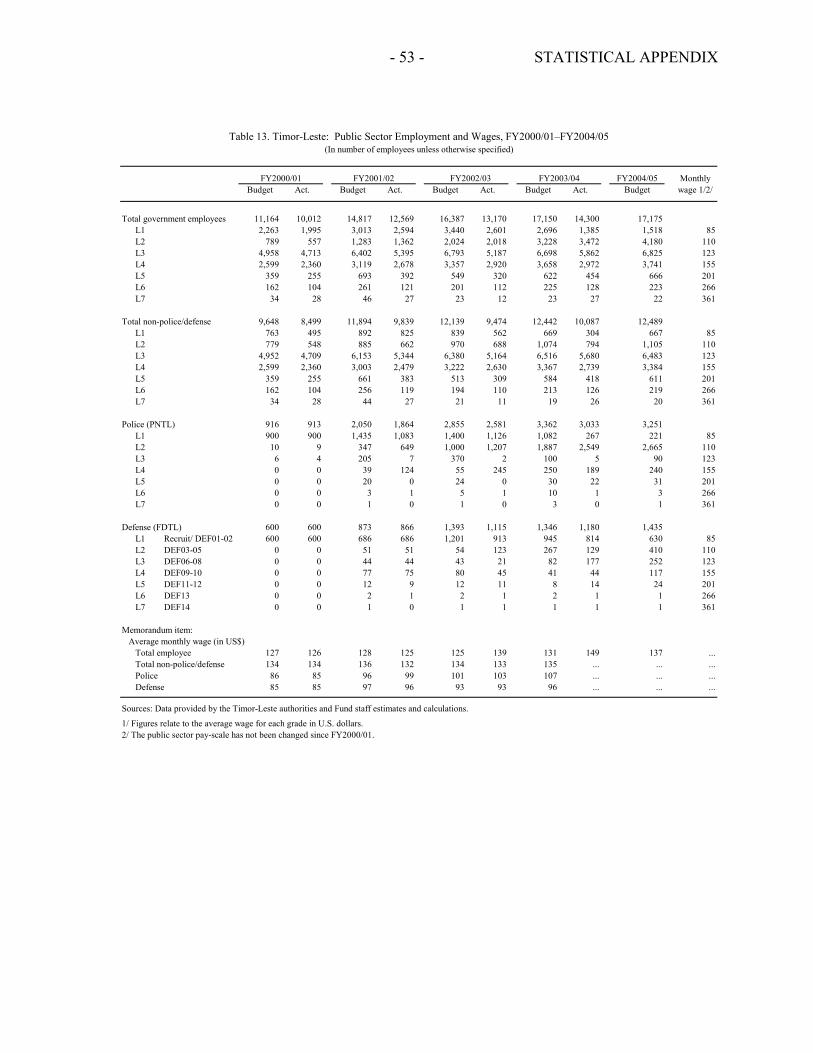
- 53 - STATISTICAL APPENDIX
Table 13. Timor-Leste: Public Sector Employment and Wages, FY2000/01–FY2004/05
FY2000/01 FY2001/02 FY2002/03 FY2004/05 MonthlyBudget Act. Budget Act. Budget Act. Budget Act. Budget wage 1/2/
Total government employees 11,164 10,012 14,817 12,569 16,387 13,170 17,150 14,300 17,175L1 2,263 1,995 3,013 2,594 3,440 2,601 2,696 1,385 1,518 85L2 789 557 1,283 1,362 2,024 2,018 3,228 3,472 4,180 110L3 4,958 4,713 6,402 5,395 6,793 5,187 6,698 5,862 6,825 123L4 2,599 2,360 3,119 2,678 3,357 2,920 3,658 2,972 3,741 155L5 359 255 693 392 549 320 622 454 666 201L6 162 104 261 121 201 112 225 128 223 266L7 34 28 46 27 23 12 23 27 22 361
Total non-police/defense 9,648 8,499 11,894 9,839 12,139 9,474 12,442 10,087 12,489L1 763 495 892 825 839 562 669 304 667 85L2 779 548 885 662 970 688 1,074 794 1,105 110L3 4,952 4,709 6,153 5,344 6,380 5,164 6,516 5,680 6,483 123L4 2,599 2,360 3,003 2,479 3,222 2,630 3,367 2,739 3,384 155L5 359 255 661 383 513 309 584 418 611 201L6 162 104 256 119 194 110 213 126 219 266L7 34 28 44 27 21 11 19 26 20 361
Police (PNTL) 916 913 2,050 1,864 2,855 2,581 3,362 3,033 3,251L1 900 900 1,435 1,083 1,400 1,126 1,082 267 221 85L2 10 9 347 649 1,000 1,207 1,887 2,549 2,665 110L3 6 4 205 7 370 2 100 5 90 123L4 0 0 39 124 55 245 250 189 240 155L5 0 0 20 0 24 0 30 22 31 201L6 0 0 3 1 5 1 10 1 3 266L7 0 0 1 0 1 0 3 0 1 361
Defense (FDTL) 600 600 873 866 1,393 1,115 1,346 1,180 1,435L1 Recruit/ DEF01-02 600 600 686 686 1,201 913 945 814 630 85L2 DEF03-05 0 0 51 51 54 123 267 129 410 110L3 DEF06-08 0 0 44 44 43 21 82 177 252 123L4 DEF09-10 0 0 77 75 80 45 41 44 117 155L5 DEF11-12 0 0 12 9 12 11 8 14 24 201L6 DEF13 0 0 2 1 2 1 2 1 1 266L7 DEF14 0 0 1 0 1 1 1 1 1 361
Memorandum item:Average monthly wage (in US$)
Total employee 127 126 128 125 125 139 131 149 137 ...Total non-police/defense 134 134 136 132 134 133 135 ... ... ...Police 86 85 96 99 101 103 107 ... ... ...Defense 85 85 97 96 93 93 96 ... ... ...
Sources: Data provided by the Timor-Leste authorities and Fund staff estimates and calculations.
1/ Figures relate to the average wage for each grade in U.S. dollars.2/ The public sector pay-scale has not been changed since FY2000/01.
FY2003/04
(In number of employees unless otherwise specified)
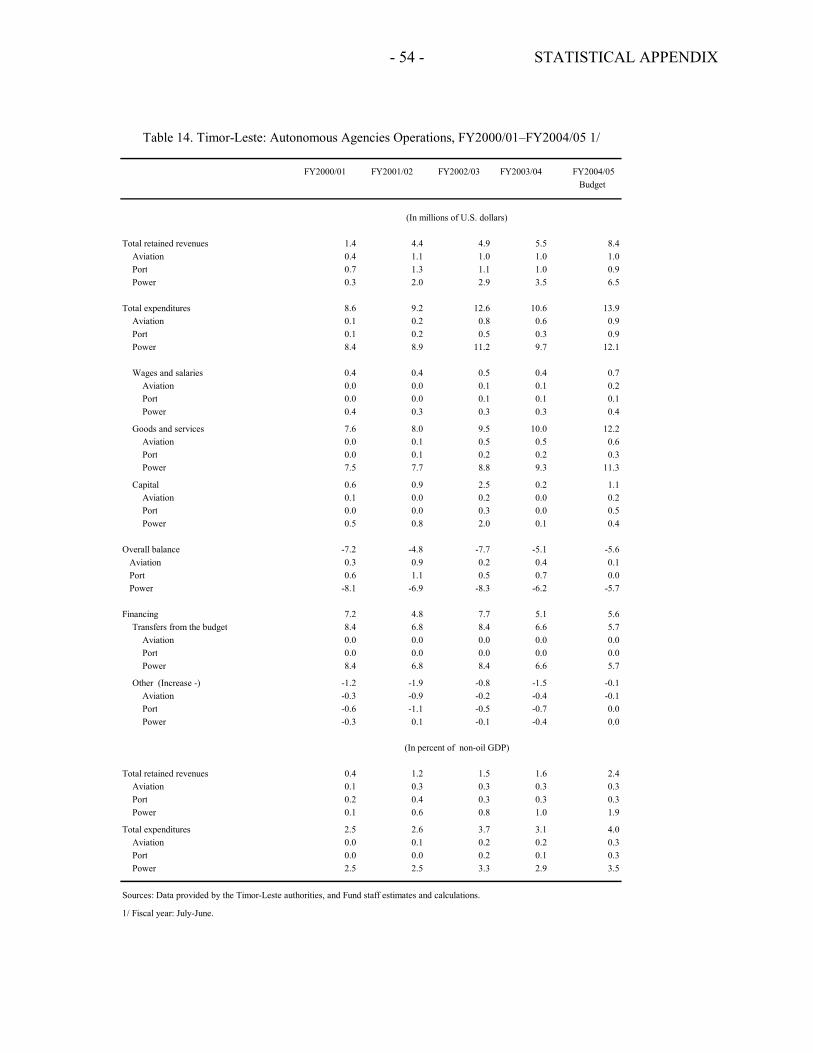
- 54 - STATISTICAL APPENDIX
Table 14. Timor-Leste: Autonomous Agencies Operations, FY2000/01–FY2004/05 1/
FY2000/01 FY2001/02 FY2002/03 FY2003/04 FY2004/05Budget
(In millions of U.S. dollars)
Total retained revenues 1.4 4.4 4.9 5.5 8.4Aviation 0.4 1.1 1.0 1.0 1.0Port 0.7 1.3 1.1 1.0 0.9Power 0.3 2.0 2.9 3.5 6.5
Total expenditures 8.6 9.2 12.6 10.6 13.9Aviation 0.1 0.2 0.8 0.6 0.9Port 0.1 0.2 0.5 0.3 0.9Power 8.4 8.9 11.2 9.7 12.1
Wages and salaries 0.4 0.4 0.5 0.4 0.7Aviation 0.0 0.0 0.1 0.1 0.2Port 0.0 0.0 0.1 0.1 0.1Power 0.4 0.3 0.3 0.3 0.4
Goods and services 7.6 8.0 9.5 10.0 12.2Aviation 0.0 0.1 0.5 0.5 0.6Port 0.0 0.1 0.2 0.2 0.3Power 7.5 7.7 8.8 9.3 11.3
Capital 0.6 0.9 2.5 0.2 1.1Aviation 0.1 0.0 0.2 0.0 0.2Port 0.0 0.0 0.3 0.0 0.5Power 0.5 0.8 2.0 0.1 0.4
Overall balance -7.2 -4.8 -7.7 -5.1 -5.6 Aviation 0.3 0.9 0.2 0.4 0.1 Port 0.6 1.1 0.5 0.7 0.0 Power -8.1 -6.9 -8.3 -6.2 -5.7
Financing 7.2 4.8 7.7 5.1 5.6Transfers from the budget 8.4 6.8 8.4 6.6 5.7
Aviation 0.0 0.0 0.0 0.0 0.0Port 0.0 0.0 0.0 0.0 0.0Power 8.4 6.8 8.4 6.6 5.7
Other (Increase -) -1.2 -1.9 -0.8 -1.5 -0.1Aviation -0.3 -0.9 -0.2 -0.4 -0.1Port -0.6 -1.1 -0.5 -0.7 0.0Power -0.3 0.1 -0.1 -0.4 0.0
(In percent of non-oil GDP)
Total retained revenues 0.4 1.2 1.5 1.6 2.4Aviation 0.1 0.3 0.3 0.3 0.3Port 0.2 0.4 0.3 0.3 0.3Power 0.1 0.6 0.8 1.0 1.9
Total expenditures 2.5 2.6 3.7 3.1 4.0Aviation 0.0 0.1 0.2 0.2 0.3Port 0.0 0.0 0.2 0.1 0.3Power 2.5 2.5 3.3 2.9 3.5
Sources: Data provided by the Timor-Leste authorities, and Fund staff estimates and calculations.
1/ Fiscal year: July-June.
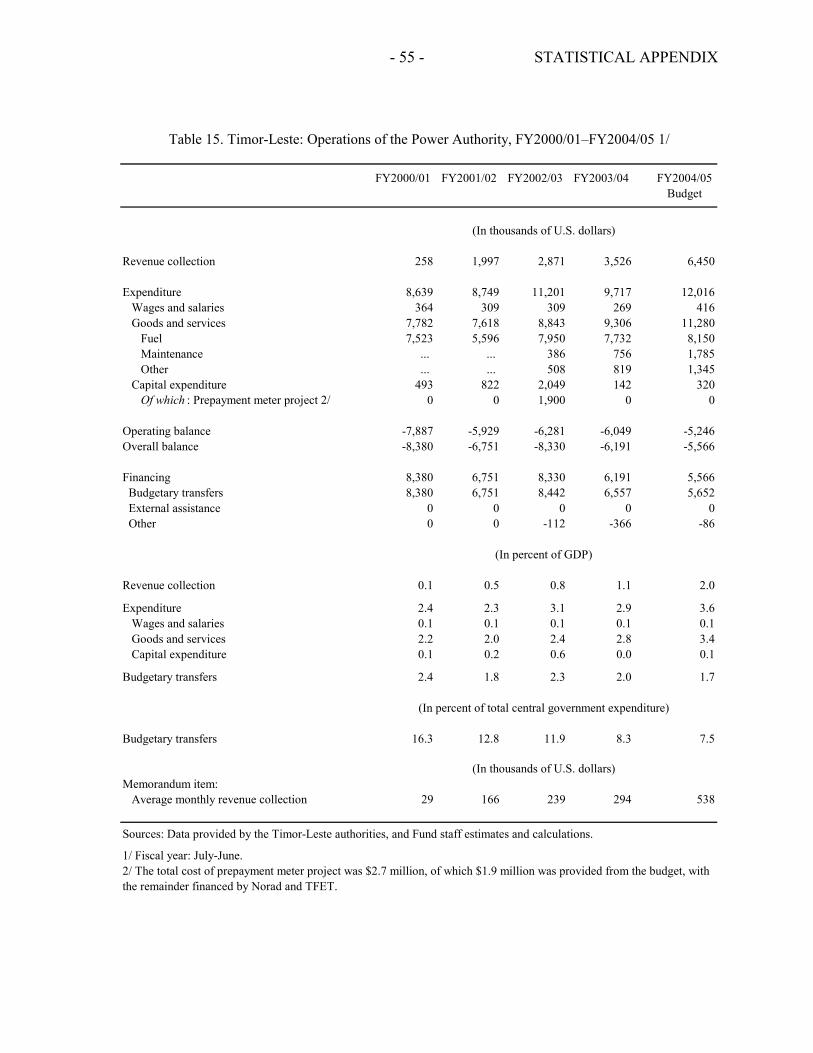
- 55 - STATISTICAL APPENDIX
Table 15. Timor-Leste: Operations of the Power Authority, FY2000/01–FY2004/05 1/
FY2000/01 FY2001/02 FY2002/03 FY2003/04 FY2004/05Budget
(In thousands of U.S. dollars)
Revenue collection 258 1,997 2,871 3,526 6,450
Expenditure 8,639 8,749 11,201 9,717 12,016Wages and salaries 364 309 309 269 416Goods and services 7,782 7,618 8,843 9,306 11,280 Fuel 7,523 5,596 7,950 7,732 8,150 Maintenance ... ... 386 756 1,785 Other ... ... 508 819 1,345Capital expenditure 493 822 2,049 142 320 Of which : Prepayment meter project 2/ 0 0 1,900 0 0
Operating balance -7,887 -5,929 -6,281 -6,049 -5,246Overall balance -8,380 -6,751 -8,330 -6,191 -5,566
Financing 8,380 6,751 8,330 6,191 5,566 Budgetary transfers 8,380 6,751 8,442 6,557 5,652 External assistance 0 0 0 0 0 Other 0 0 -112 -366 -86
(In percent of GDP)
Revenue collection 0.1 0.5 0.8 1.1 2.0
Expenditure 2.4 2.3 3.1 2.9 3.6Wages and salaries 0.1 0.1 0.1 0.1 0.1Goods and services 2.2 2.0 2.4 2.8 3.4Capital expenditure 0.1 0.2 0.6 0.0 0.1
Budgetary transfers 2.4 1.8 2.3 2.0 1.7
(In percent of total central government expenditure)
Budgetary transfers 16.3 12.8 11.9 8.3 7.5
(In thousands of U.S. dollars)Memorandum item:
Average monthly revenue collection 29 166 239 294 538
Sources: Data provided by the Timor-Leste authorities, and Fund staff estimates and calculations.
1/ Fiscal year: July-June.2/ The total cost of prepayment meter project was $2.7 million, of which $1.9 million was provided from the budget, withthe remainder financed by Norad and TFET.
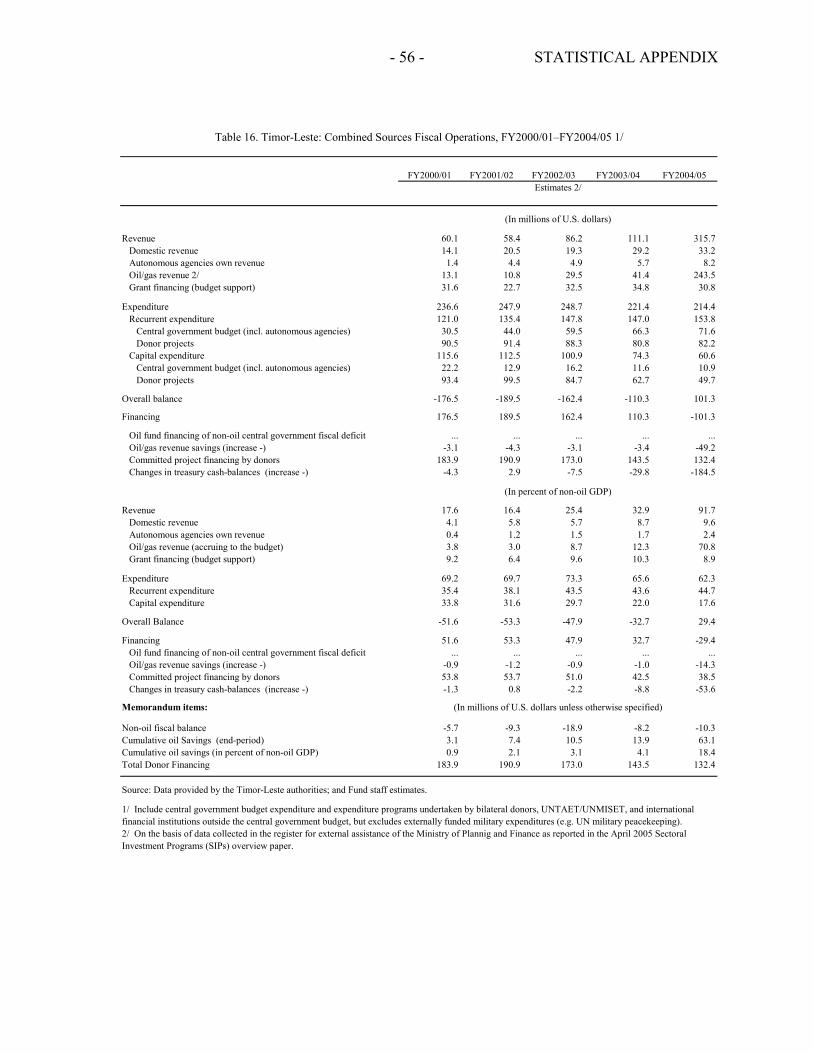
- 56 - STATISTICAL APPENDIX
Table 16. Timor-Leste: Combined Sources Fiscal Operations, FY2000/01–FY2004/05 1/
FY2000/01 FY2001/02 FY2002/03 FY2003/04 FY2004/05
(In millions of U.S. dollars)
Revenue 60.1 58.4 86.2 111.1 315.7Domestic revenue 14.1 20.5 19.3 29.2 33.2Autonomous agencies own revenue 1.4 4.4 4.9 5.7 8.2Oil/gas revenue 2/ 13.1 10.8 29.5 41.4 243.5Grant financing (budget support) 31.6 22.7 32.5 34.8 30.8
Expenditure 236.6 247.9 248.7 221.4 214.4Recurrent expenditure 121.0 135.4 147.8 147.0 153.8
Central government budget (incl. autonomous agencies) 30.5 44.0 59.5 66.3 71.6Donor projects 90.5 91.4 88.3 80.8 82.2
Capital expenditure 115.6 112.5 100.9 74.3 60.6Central government budget (incl. autonomous agencies) 22.2 12.9 16.2 11.6 10.9Donor projects 93.4 99.5 84.7 62.7 49.7
Overall balance -176.5 -189.5 -162.4 -110.3 101.3
Financing 176.5 189.5 162.4 110.3 -101.3
Oil fund financing of non-oil central government fiscal deficit ... ... ... ... ...Oil/gas revenue savings (increase -) -3.1 -4.3 -3.1 -3.4 -49.2Committed project financing by donors 183.9 190.9 173.0 143.5 132.4Changes in treasury cash-balances (increase -) -4.3 2.9 -7.5 -29.8 -184.5
(In percent of non-oil GDP)
Revenue 17.6 16.4 25.4 32.9 91.7Domestic revenue 4.1 5.8 5.7 8.7 9.6Autonomous agencies own revenue 0.4 1.2 1.5 1.7 2.4Oil/gas revenue (accruing to the budget) 3.8 3.0 8.7 12.3 70.8Grant financing (budget support) 9.2 6.4 9.6 10.3 8.9
Expenditure 69.2 69.7 73.3 65.6 62.3Recurrent expenditure 35.4 38.1 43.5 43.6 44.7Capital expenditure 33.8 31.6 29.7 22.0 17.6
Overall Balance -51.6 -53.3 -47.9 -32.7 29.4
Financing 51.6 53.3 47.9 32.7 -29.4Oil fund financing of non-oil central government fiscal deficit ... ... ... ... ...Oil/gas revenue savings (increase -) -0.9 -1.2 -0.9 -1.0 -14.3Committed project financing by donors 53.8 53.7 51.0 42.5 38.5Changes in treasury cash-balances (increase -) -1.3 0.8 -2.2 -8.8 -53.6
Memorandum items: (In millions of U.S. dollars unless otherwise specified)
Non-oil fiscal balance -5.7 -9.3 -18.9 -8.2 -10.3Cumulative oil Savings (end-period) 3.1 7.4 10.5 13.9 63.1Cumulative oil savings (in percent of non-oil GDP) 0.9 2.1 3.1 4.1 18.4Total Donor Financing 183.9 190.9 173.0 143.5 132.4
Source: Data provided by the Timor-Leste authorities; and Fund staff estimates.
1/ Include central government budget expenditure and expenditure programs undertaken by bilateral donors, UNTAET/UNMISET, and international financial institutions outside the central government budget, but excludes externally funded military expenditures (e.g. UN military peacekeeping).2/ On the basis of data collected in the register for external assistance of the Ministry of Plannig and Finance as reported in the April 2005 SectoralInvestment Programs (SIPs) overview paper.
Estimates 2/
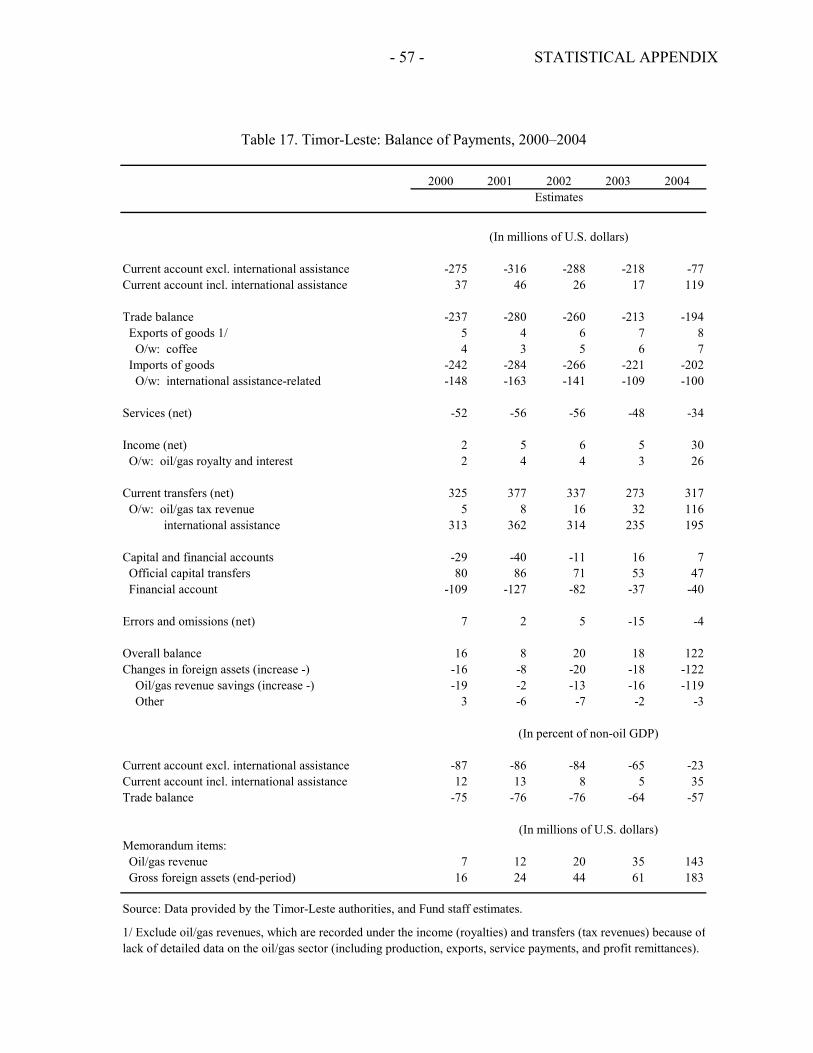
- 57 - STATISTICAL APPENDIX
Table 17. Timor-Leste: Balance of Payments, 2000–2004
2000 2001 2002 2003 2004Estimates
(In millions of U.S. dollars)
Current account excl. international assistance -275 -316 -288 -218 -77Current account incl. international assistance 37 46 26 17 119
Trade balance -237 -280 -260 -213 -194 Exports of goods 1/ 5 4 6 7 8 O/w: coffee 4 3 5 6 7 Imports of goods -242 -284 -266 -221 -202 O/w: international assistance-related -148 -163 -141 -109 -100
Services (net) -52 -56 -56 -48 -34
Income (net) 2 5 6 5 30 O/w: oil/gas royalty and interest 2 4 4 3 26
Current transfers (net) 325 377 337 273 317 O/w: oil/gas tax revenue 5 8 16 32 116 international assistance 313 362 314 235 195
Capital and financial accounts -29 -40 -11 16 7 Official capital transfers 80 86 71 53 47 Financial account -109 -127 -82 -37 -40 Errors and omissions (net) 7 2 5 -15 -4
Overall balance 16 8 20 18 122Changes in foreign assets (increase -) -16 -8 -20 -18 -122 Oil/gas revenue savings (increase -) -19 -2 -13 -16 -119 Other 3 -6 -7 -2 -3
(In percent of non-oil GDP)
Current account excl. international assistance -87 -86 -84 -65 -23Current account incl. international assistance 12 13 8 5 35Trade balance -75 -76 -76 -64 -57
(In millions of U.S. dollars)Memorandum items: Oil/gas revenue 7 12 20 35 143 Gross foreign assets (end-period) 16 24 44 61 183
Source: Data provided by the Timor-Leste authorities, and Fund staff estimates.
1/ Exclude oil/gas revenues, which are recorded under the income (royalties) and transfers (tax revenues) because oflack of detailed data on the oil/gas sector (including production, exports, service payments, and profit remittances).
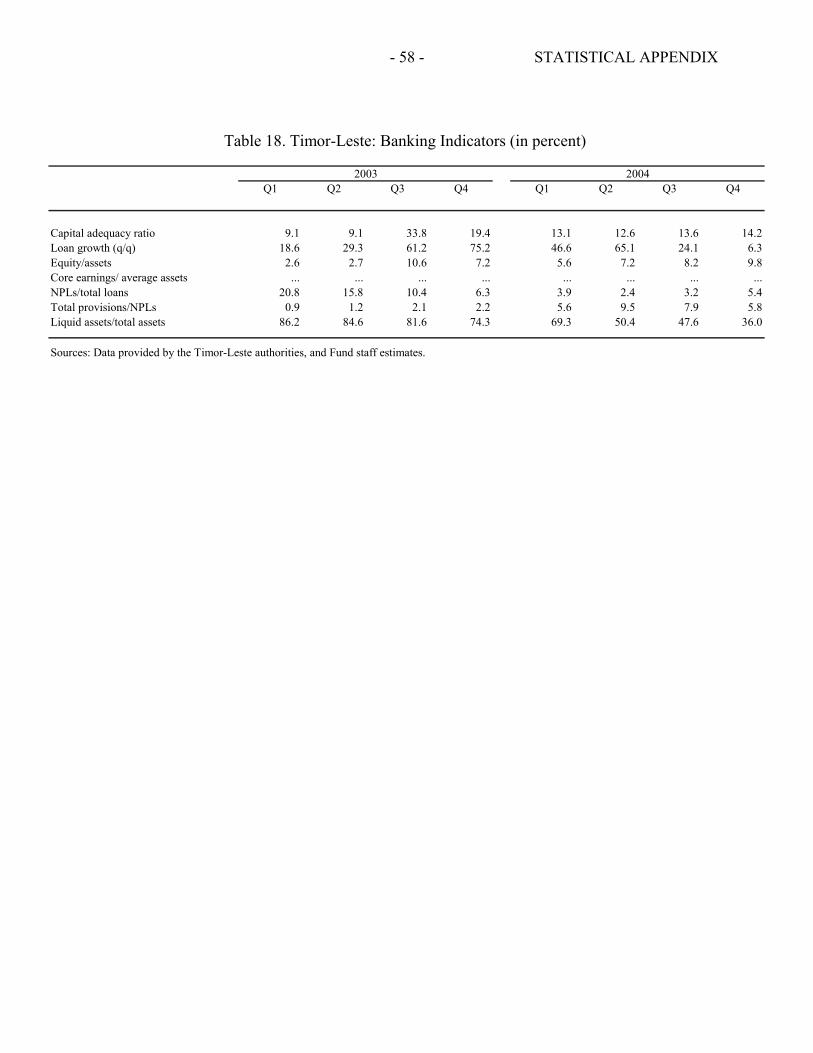
- 58 - STATISTICAL APPENDIX
Table 18. Timor-Leste: Banking Indicators (in percent)
2003 2004Q1 Q2 Q3 Q4 Q1 Q2 Q3 Q4
Capital adequacy ratio 9.1 9.1 33.8 19.4 13.1 12.6 13.6 14.2Loan growth (q/q) 18.6 29.3 61.2 75.2 46.6 65.1 24.1 6.3Equity/assets 2.6 2.7 10.6 7.2 5.6 7.2 8.2 9.8Core earnings/ average assets ... ... ... ... ... ... ... ...NPLs/total loans 20.8 15.8 10.4 6.3 3.9 2.4 3.2 5.4Total provisions/NPLs 0.9 1.2 2.1 2.2 5.6 9.5 7.9 5.8Liquid assets/total assets 86.2 84.6 81.6 74.3 69.3 50.4 47.6 36.0
Sources: Data provided by the Timor-Leste authorities, and Fund staff estimates.
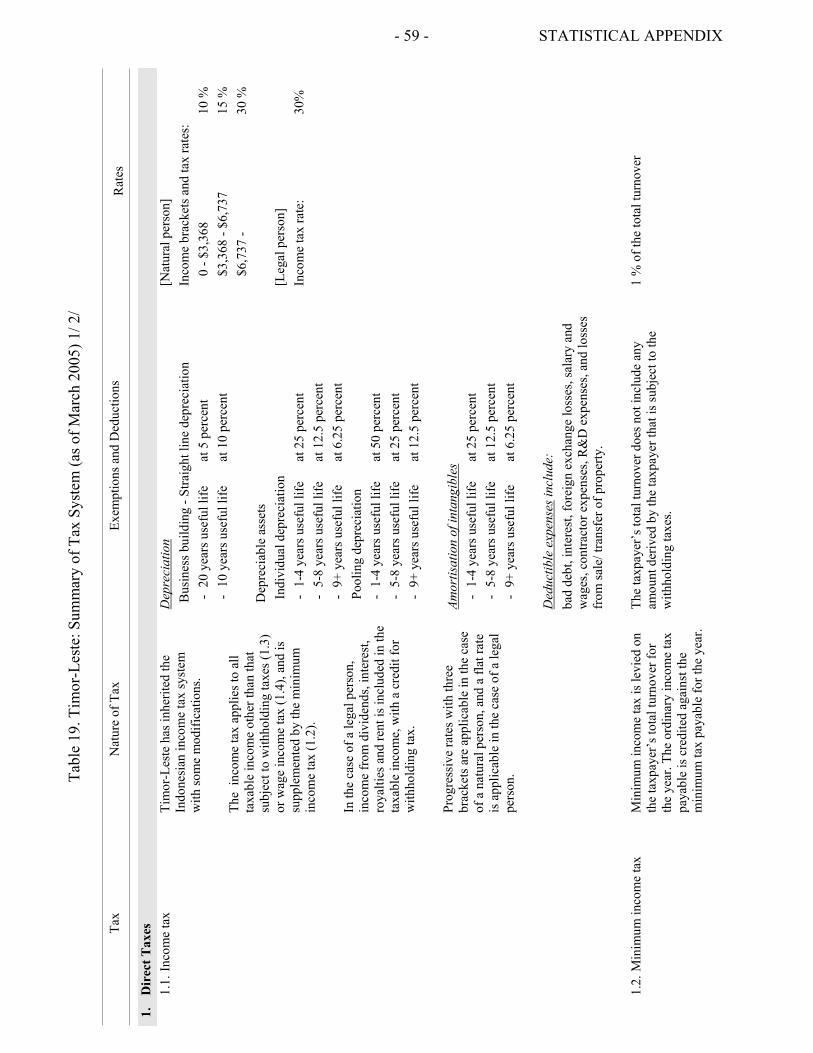
- 59 - STATISTICAL APPENDIX
Tabl
e 19
. Tim
or-L
este
: Sum
mar
y of
Tax
Sys
tem
(as o
f Mar
ch 2
005)
1/ 2
/
Tax
Nat
ure
of T
ax
Exem
ptio
ns a
nd D
educ
tions
Rat
es
1.
Dir
ect T
axes
1.1.
Inco
me
tax
Ti
mor
-Les
te h
as in
herit
ed th
e In
done
sian
inco
me
tax
syst
em
with
som
e m
odifi
catio
ns.
The
inco
me
tax
appl
ies t
o al
l ta
xabl
e in
com
e ot
her t
han
that
su
bjec
t to
with
hold
ing
taxe
s (1.
3)
or w
age
inco
me
tax
(1.4
), an
d is
su
pple
men
ted
by th
e m
inim
um
inco
me
tax
(1.2
).
In th
e ca
se o
f a le
gal p
erso
n,
inco
me
from
div
iden
ds, i
nter
est,
roya
lties
and
rent
is in
clud
ed in
the
taxa
ble
inco
me,
with
a c
redi
t for
w
ithho
ldin
g ta
x.
Prog
ress
ive
rate
s with
thre
e br
acke
ts a
re a
pplic
able
in th
e ca
se
of a
nat
ural
per
son,
and
a fl
at ra
te
is a
pplic
able
in th
e ca
se o
f a le
gal
pers
on.
Dep
reci
atio
n
Bus
ines
s bui
ldin
g - S
traig
ht li
ne d
epre
ciat
ion
-
20 y
ears
use
ful l
ife
at 5
per
cent
-
10 y
ears
use
ful l
ife
at 1
0 pe
rcen
t
Dep
reci
able
ass
ets
In
divi
dual
dep
reci
atio
n -
1-4
year
s use
ful l
ife
at 2
5 pe
rcen
t -
5-8
year
s use
ful l
ife
at 1
2.5
perc
ent
- 9+
yea
rs u
sefu
l life
at
6.2
5 pe
rcen
t Po
olin
g de
prec
iatio
n -
1-4
year
s use
ful l
ife
at 5
0 pe
rcen
t -
5-8
year
s use
ful l
ife
at 2
5 pe
rcen
t -
9+ y
ears
use
ful l
ife
at 1
2.5
perc
ent
Amor
tisat
ion
of in
tang
ible
s -
1-4
year
s use
ful l
ife
at 2
5 pe
rcen
t -
5-8
year
s use
ful l
ife
at 1
2.5
perc
ent
- 9+
yea
rs u
sefu
l life
at
6.2
5 pe
rcen
t D
educ
tible
exp
ense
s inc
lude
: ba
d de
bt, i
nter
est,
fore
ign
exch
ange
loss
es, s
alar
y an
d w
ages
, con
tract
or e
xpen
ses,
R&
D e
xpen
ses,
and
loss
es
from
sale
/ tra
nsfe
r of p
rope
rty.
[Nat
ural
per
son]
In
com
e br
acke
ts a
nd ta
x ra
tes:
0 - $
3,36
8 10
%
$3
,368
- $6
,737
15
%
$6
,737
- 30
%
[Leg
al p
erso
n]
Inco
me
tax
rate
: 30
%
1.
2. M
inim
um in
com
e ta
x
Min
imum
inco
me
tax
is le
vied
on
the
taxp
ayer
’s to
tal t
urno
ver f
or
the
year
. The
ord
inar
y in
com
e ta
x pa
yabl
e is
cre
dite
d ag
ains
t the
m
inim
um ta
x pa
yabl
e fo
r the
yea
r.
The
taxp
ayer
’s to
tal t
urno
ver d
oes n
ot in
clud
e an
y am
ount
der
ived
by
the
taxp
ayer
that
is su
bjec
t to
the
with
hold
ing
taxe
s.
1 %
of t
he to
tal t
urno
ver

- 60 - STATISTICAL APPENDIX
Tabl
e 19
. Tim
or-L
este
: Sum
mar
y of
Tax
Sys
tem
(as o
f Mar
ch 2
005)
1/ 2
/
Tax
Nat
ure
of T
ax
Exem
ptio
ns a
nd D
educ
tions
Rat
es
1.
3. W
ithho
ldin
g ta
xes
In
com
e ea
rned
from
des
igna
ted
sour
ces (
incl
udin
g di
vide
nd,
inte
rest
, roy
alty
, and
rent
) is
subj
ect t
o w
ithho
ldin
g ta
x at
a
varie
ty o
f rat
es.
The
tax
is w
ithhe
ld b
y a
pers
on
mak
ing
paym
ents
to th
e re
cipi
ent
of th
e in
com
e.
The
with
hold
ing
taxe
s are
fina
l, ex
cept
for d
ivid
ends
, int
eres
t, ro
yalti
es a
nd re
nt p
aid
to a
lega
l pe
rson
.
Ta
x ra
tes v
ary
acco
rdin
g to
the
sour
ce
of in
com
e:
Paya
ble
to re
side
nts a
nd n
on-r
esid
ents
w
ith p
erm
anen
t est
ablis
hmen
t: Ty
pe o
f inc
ome
Tax
rate
di
vide
nd/ i
nter
est/
roya
lty
15
%
rent
from
land
/ bui
ldin
g
10 %
in
com
e fr
om :
pr
izes
and
lotte
ries
15
%
co
nstru
ctio
n ac
tiviti
es
2
%
co
nstru
ctio
n co
nsul
ting
4
%
pr
ovis
ion
of tr
ansp
orta
tion
2.64
%
pe
trole
um d
rillin
g/ m
inin
g 4
.5 %
prov
isio
n of
sele
cted
serv
ices
0 %
Pa
yabl
e to
non
-res
iden
t with
out
perm
anen
t est
ablis
hmen
t: al
l inc
ome
20
%
1.4.
Wag
e in
com
e ta
x
The
wag
e in
com
e ta
x is
with
held
by
the
empl
oyer
. Ea
ch e
mpl
oyee
is a
llow
ed a
mon
thly
tax
cred
it of
$10
ag
ains
t the
wag
e in
com
e ta
x pa
yabl
e fo
r the
mon
th.
Exce
ss c
redi
t is n
eith
er re
fund
ed n
or c
arrie
d fo
rwar
d.
Exem
pt w
ages
incl
ude:
(a
) w
ages
rece
ived
for o
ffic
ial d
utie
s by
dipl
omat
ic st
aff
of a
fore
ign
gove
rnm
ent’s
repr
esen
tativ
e of
fice
(b)
wag
es o
f a p
ublic
serv
ant o
f a fo
reig
n go
vern
men
t (c
) w
ages
of a
n em
ploy
ee o
f the
UN
or i
ts a
genc
ies
Resi
dent
with
Tax
Iden
tific
atio
n N
umbe
r (TI
N)
Mon
thly
wag
e in
com
e Ta
x ra
te
$0
to $
550
10 p
erce
nt
ab
ove
$550
30
per
cent
N
on-r
esid
ent
20 p
erce
nt
Resi
dent
with
out T
IN
30 p
erce
nt
1.
5. P
resu
mpt
ive
inco
me
tax
on c
offe
e ex
ports
Impo
sed
on e
xpor
ts o
f cof
fee
bean
s, w
heth
er p
roce
ssed
or
unpr
oces
sed,
at t
he ti
me
of e
xpor
t. N
ot a
pplic
able
for c
offe
e ex
port
afte
r 05/
31/0
1
Up
to 5
kilo
gram
s of c
offe
e be
ans e
xpor
ted
in
acco
mpa
nied
bag
gage
by
a pe
rson
dep
artin
g fr
om T
imor
-Le
ste
are
exem
pt.
5 pe
rcen
t of t
he v
alue
of c
offe
e be
ans.
The
valu
e of
the
coff
ee b
eans
is th
e ar
m’s
leng
th fr
ee o
n bo
ard
valu
e of
the
bean
s.
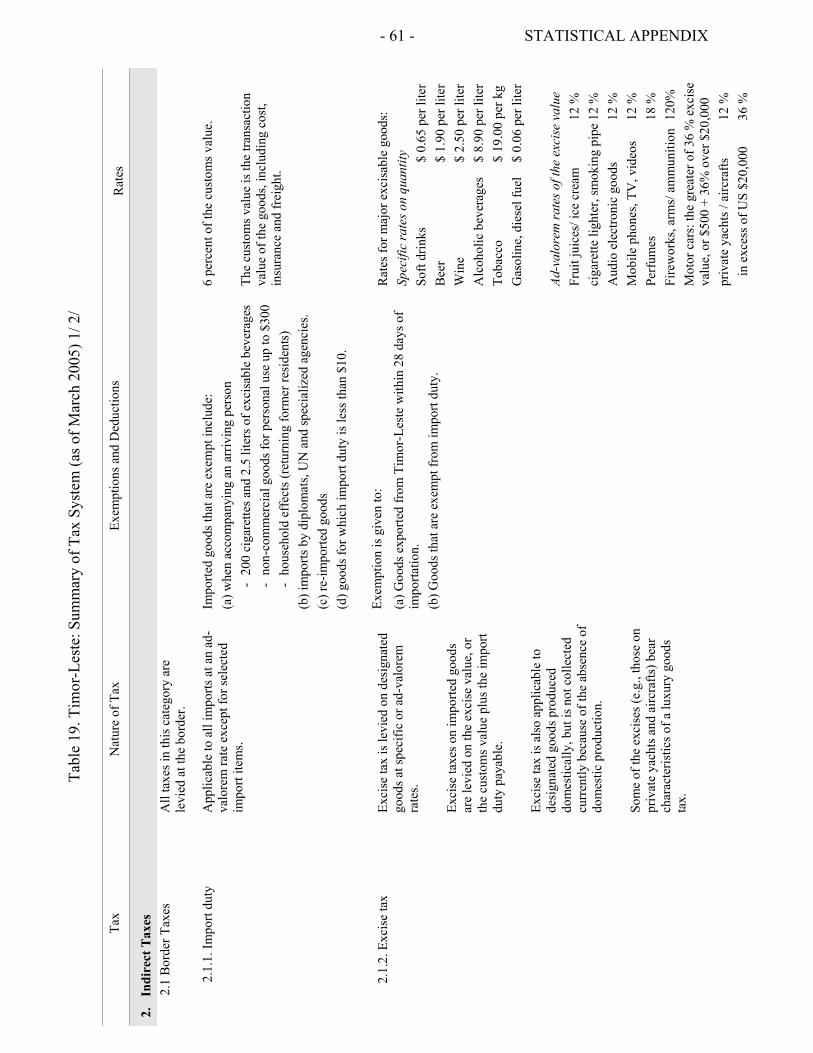
- 61 - STATISTICAL APPENDIX
Tabl
e 19
. Tim
or-L
este
: Sum
mar
y of
Tax
Sys
tem
(as o
f Mar
ch 2
005)
1/ 2
/
Tax
Nat
ure
of T
ax
Exem
ptio
ns a
nd D
educ
tions
Rat
es
2.
Indi
rect
Tax
es
2.1
Bor
der T
axes
A
ll ta
xes i
n th
is c
ateg
ory
are
levi
ed a
t the
bor
der.
2.
1.1.
Impo
rt du
ty
App
licab
le to
all
impo
rts a
t an
ad-
valo
rem
rate
exc
ept f
or se
lect
ed
impo
rt ite
ms.
Impo
rted
good
s tha
t are
exe
mpt
incl
ude:
(a
) whe
n ac
com
pany
ing
an a
rriv
ing
pers
on
-
200
ciga
rette
s and
2.5
lite
rs o
f exc
isab
le b
ever
ages
- no
n-co
mm
erci
al g
oods
for p
erso
nal u
se u
p to
$30
0
- ho
useh
old
effe
cts (
retu
rnin
g fo
rmer
resi
dent
s)
(b) i
mpo
rts b
y di
plom
ats,
UN
and
spec
ializ
ed a
genc
ies.
(c
) re-
impo
rted
good
s (d
) goo
ds fo
r whi
ch im
port
duty
is le
ss th
an $
10.
6 pe
rcen
t of t
he c
usto
ms v
alue
. Th
e cu
stom
s val
ue is
the
trans
actio
n va
lue
of th
e go
ods,
incl
udin
g co
st,
insu
ranc
e an
d fr
eigh
t.
2.
1.2.
Exc
ise
tax
Exci
se ta
x is
levi
ed o
n de
sign
ated
go
ods a
t spe
cific
or a
d-va
lore
m
rate
s. Ex
cise
taxe
s on
impo
rted
good
s ar
e le
vied
on
the
exci
se v
alue
, or
the
cust
oms v
alue
plu
s the
impo
rt du
ty p
ayab
le.
Exci
se ta
x is
als
o ap
plic
able
to
desi
gnat
ed g
oods
pro
duce
d do
mes
tical
ly, b
ut is
not
col
lect
ed
curr
ently
bec
ause
of t
he a
bsen
ce o
f do
mes
tic p
rodu
ctio
n.
Som
e of
the
exci
ses (
e.g.
, tho
se o
n pr
ivat
e ya
chts
and
airc
rafts
) bea
r ch
arac
teris
tics o
f a lu
xury
goo
ds
tax.
Exem
ptio
n is
giv
en to
: (a
) Goo
ds e
xpor
ted
from
Tim
or-L
este
with
in 2
8 da
ys o
f im
porta
tion.
(b
) Goo
ds th
at a
re e
xem
pt fr
om im
port
duty
.
Rat
es fo
r maj
or e
xcis
able
goo
ds:
Spec
ific
rate
s on
quan
tity
Soft
drin
ks
$ 0.
65 p
er li
ter
Bee
r $
1.90
per
lite
r W
ine
$ 2.
50 p
er li
ter
Alc
ohol
ic b
ever
ages
$
8.90
per
lite
r To
bacc
o $
19.0
0 pe
r kg
Gas
olin
e, d
iese
l fue
l $
0.06
per
lite
r Ad
-val
orem
rate
s of t
he e
xcis
e va
lue
Frui
t jui
ces/
ice
crea
m
12 %
ci
gare
tte li
ghte
r, sm
okin
g pi
pe 1
2 %
A
udio
ele
ctro
nic
good
s 12
%
Mob
ile p
hone
s, TV
, vid
eos
12 %
Pe
rfum
es
18 %
Fi
rew
orks
, arm
s/ a
mm
uniti
on 1
20%
M
otor
car
s: th
e gr
eate
r of 3
6 %
exc
ise
valu
e, o
r $50
0 +
36%
ove
r $20
,000
pr
ivat
e ya
chts
/ ai
rcra
fts
12 %
in e
xces
s of U
S $2
0,00
0 36
%
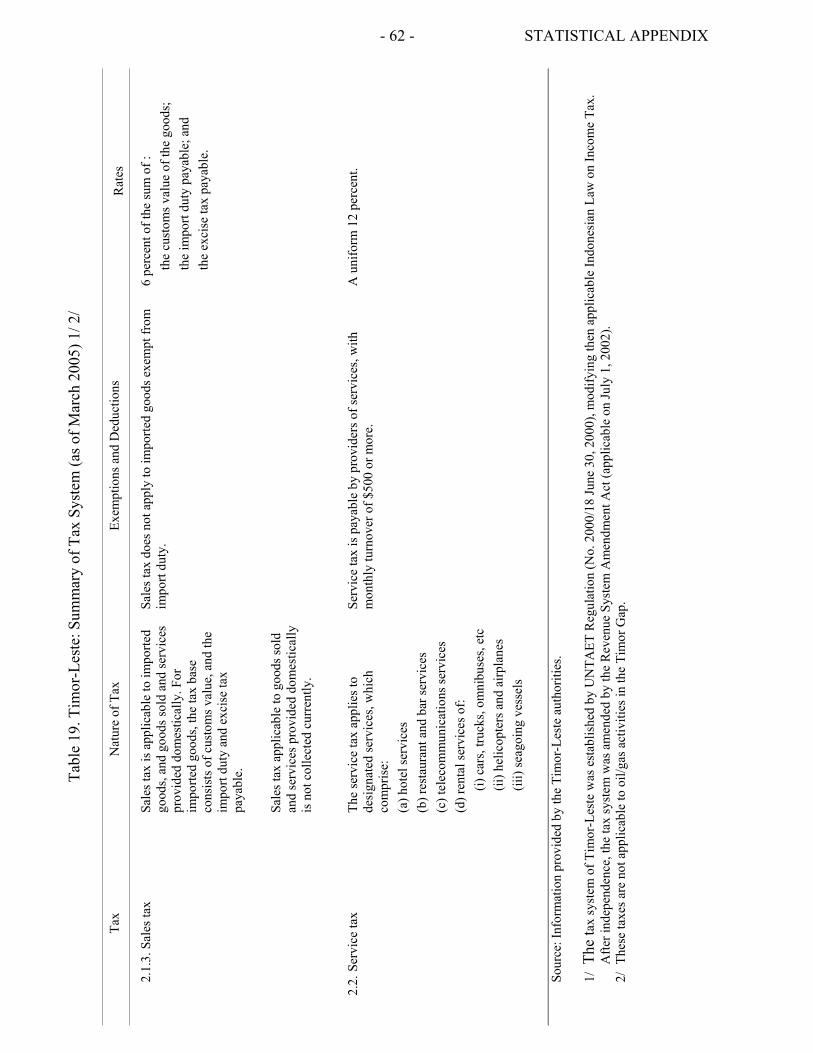
- 62 - STATISTICAL APPENDIX
Tabl
e 19
. Tim
or-L
este
: Sum
mar
y of
Tax
Sys
tem
(as o
f Mar
ch 2
005)
1/ 2
/
Tax
Nat
ure
of T
ax
Exem
ptio
ns a
nd D
educ
tions
Rat
es
2.
1.3.
Sal
es ta
x
Sale
s tax
is a
pplic
able
to im
porte
d go
ods,
and
good
s sol
d an
d se
rvic
es
prov
ided
dom
estic
ally
. For
im
porte
d go
ods,
the
tax
base
co
nsis
ts o
f cus
tom
s val
ue, a
nd th
e im
port
duty
and
exc
ise
tax
paya
ble.
Sa
les t
ax a
pplic
able
to g
oods
sold
an
d se
rvic
es p
rovi
ded
dom
estic
ally
is
not
col
lect
ed c
urre
ntly
.
Sale
s tax
doe
s not
app
ly to
impo
rted
good
s exe
mpt
from
im
port
duty
.
6 pe
rcen
t of t
he su
m o
f :
th
e cu
stom
s val
ue o
f the
goo
ds;
th
e im
port
duty
pay
able
; and
the
exci
se ta
x pa
yabl
e.
2.
2. S
ervi
ce ta
x
The
serv
ice
tax
appl
ies t
o de
sign
ated
serv
ices
, whi
ch
com
pris
e:
(a) h
otel
serv
ices
(b
) res
taur
ant a
nd b
ar se
rvic
es
(c) t
elec
omm
unic
atio
ns se
rvic
es
(d) r
enta
l ser
vice
s of:
(i)
car
s, tru
cks,
omni
buse
s, et
c
(ii) h
elic
opte
rs a
nd a
irpla
nes
(ii
i) se
agoi
ng v
esse
ls
Serv
ice
tax
is p
ayab
le b
y pr
ovid
ers o
f ser
vice
s, w
ith
mon
thly
turn
over
of $
500
or m
ore.
A u
nifo
rm 1
2 pe
rcen
t.
Sour
ce: I
nfor
mat
ion
prov
ided
by
the
Tim
or-L
este
aut
horit
ies.
1/ T
he ta
x sy
stem
of T
imor
-Les
te w
as e
stab
lishe
d by
UN
TAET
Reg
ulat
ion
(No.
200
0/18
June
30,
200
0), m
odify
ing
then
app
licab
le In
done
sian
Law
on
Inco
me
Tax.
A
fter i
ndep
ende
nce,
the
tax
syst
em w
as a
men
ded
by th
e R
even
ue S
yste
m A
men
dmen
t Act
(app
licab
le o
n Ju
ly 1
, 200
2).
2/ T
hese
taxe
s are
not
app
licab
le to
oil/
gas a
ctiv
ities
in th
e Ti
mor
Gap
.
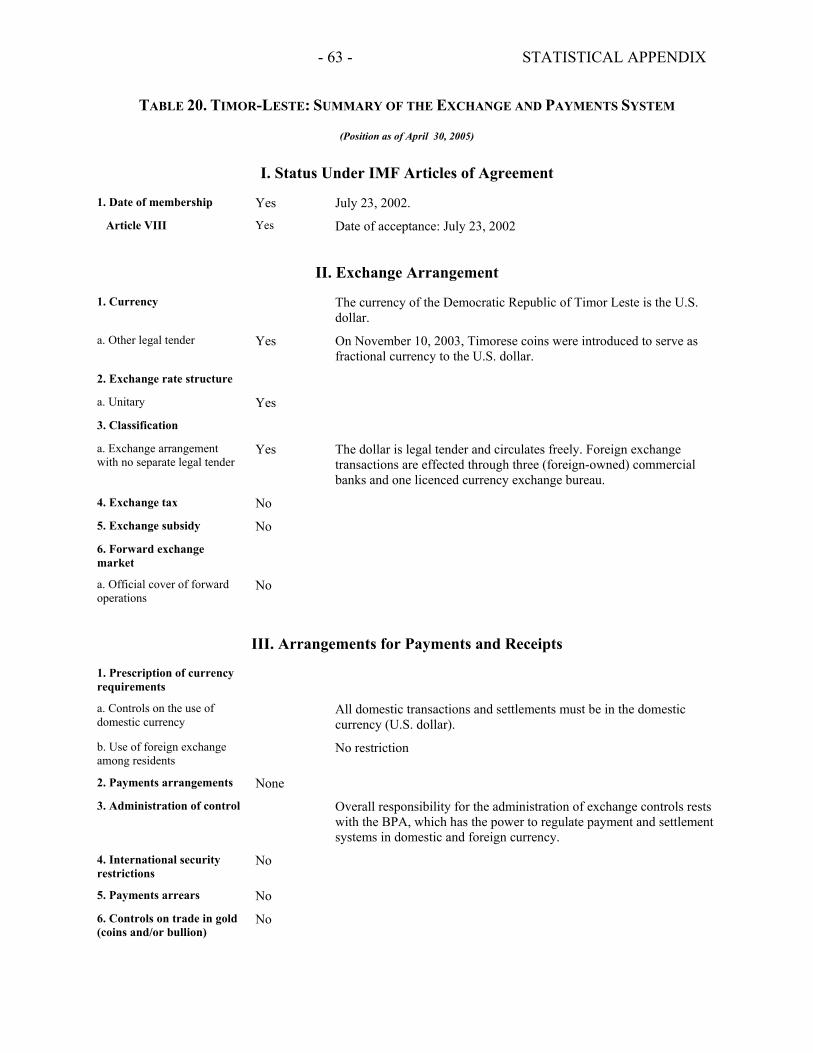
- 63 - STATISTICAL APPENDIX
TABLE 20. TIMOR-LESTE: SUMMARY OF THE EXCHANGE AND PAYMENTS SYSTEM
(Position as of April 30, 2005)
I. Status Under IMF Articles of Agreement
1. Date of membership Yes July 23, 2002.
Article VIII Yes Date of acceptance: July 23, 2002
II. Exchange Arrangement
1. Currency The currency of the Democratic Republic of Timor Leste is the U.S. dollar.
a. Other legal tender Yes On November 10, 2003, Timorese coins were introduced to serve as fractional currency to the U.S. dollar.
2. Exchange rate structure
a. Unitary Yes
3. Classification
a. Exchange arrangement with no separate legal tender
Yes The dollar is legal tender and circulates freely. Foreign exchange transactions are effected through three (foreign-owned) commercial banks and one licenced currency exchange bureau.
4. Exchange tax No
5. Exchange subsidy No
6. Forward exchange market
a. Official cover of forward operations
No
III. Arrangements for Payments and Receipts
1. Prescription of currency requirements
a. Controls on the use of domestic currency
All domestic transactions and settlements must be in the domestic currency (U.S. dollar).
b. Use of foreign exchange among residents
No restriction
2. Payments arrangements None
3. Administration of control Overall responsibility for the administration of exchange controls rests with the BPA, which has the power to regulate payment and settlement systems in domestic and foreign currency.
4. International security restrictions
No
5. Payments arrears No
6. Controls on trade in gold (coins and/or bullion)
No
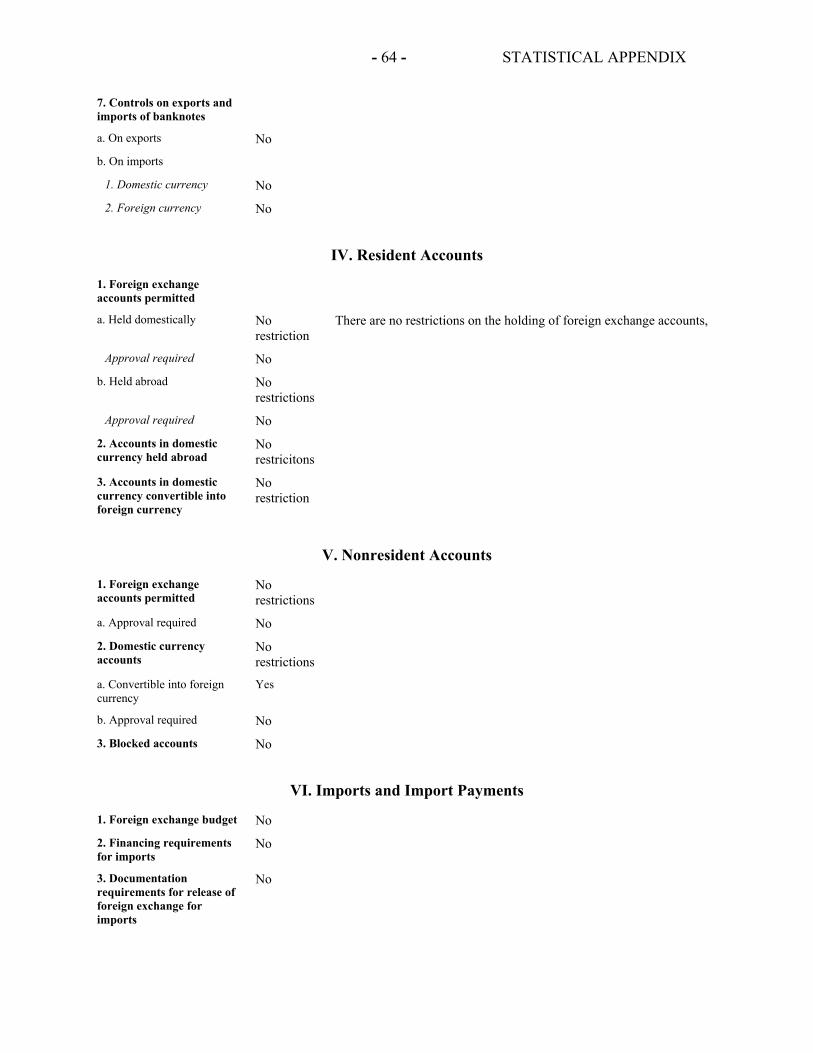
STATISTICAL APPENDIX
- 64 -
7. Controls on exports and imports of banknotes
a. On exports No
b. On imports
1. Domestic currency No
2. Foreign currency No
IV. Resident Accounts
1. Foreign exchange accounts permitted
a. Held domestically No restriction
There are no restrictions on the holding of foreign exchange accounts,
Approval required No
b. Held abroad No restrictions
Approval required No
2. Accounts in domestic currency held abroad
No restricitons
3. Accounts in domestic currency convertible into foreign currency
No restriction
V. Nonresident Accounts
1. Foreign exchange accounts permitted
No restrictions
a. Approval required No
2. Domestic currency accounts
No restrictions
a. Convertible into foreign currency
Yes
b. Approval required No
3. Blocked accounts No
VI. Imports and Import Payments
1. Foreign exchange budget No
2. Financing requirements for imports
No
3. Documentation requirements for release of foreign exchange for imports
No
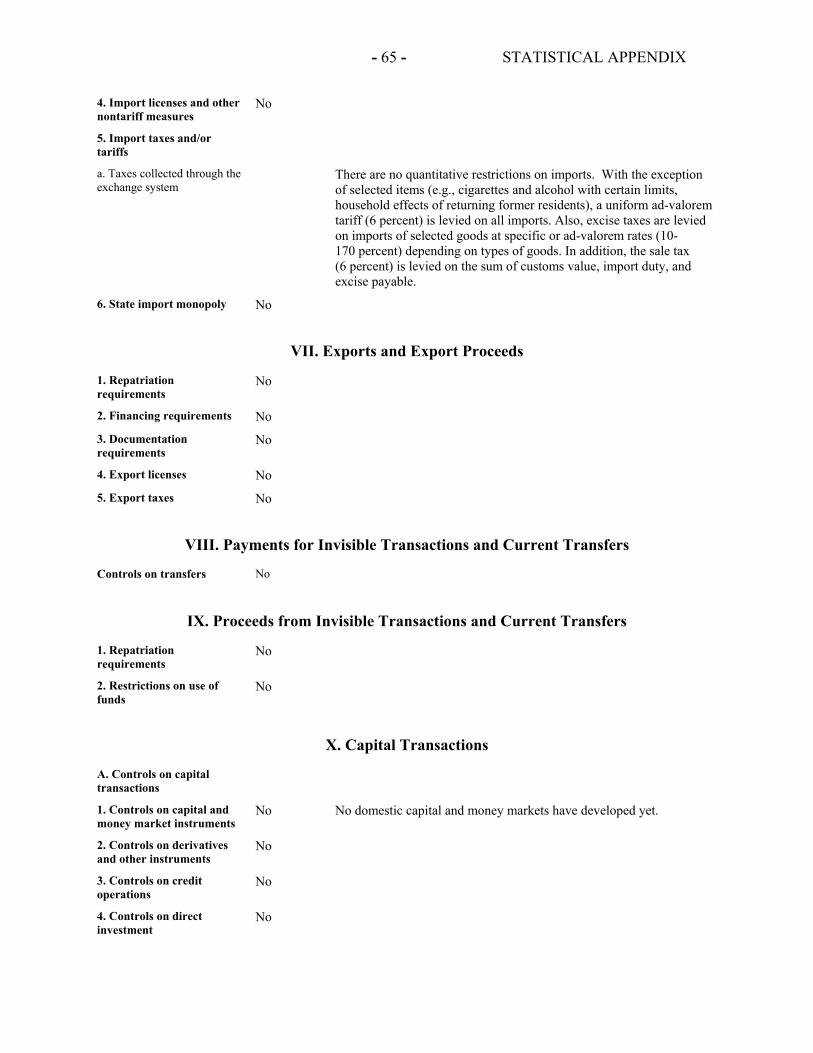
STATISTICAL APPENDIX
- 65 -
4. Import licenses and other nontariff measures
No
5. Import taxes and/or tariffs
a. Taxes collected through the exchange system
There are no quantitative restrictions on imports. With the exception of selected items (e.g., cigarettes and alcohol with certain limits, household effects of returning former residents), a uniform ad-valorem tariff (6 percent) is levied on all imports. Also, excise taxes are levied on imports of selected goods at specific or ad-valorem rates (10-170 percent) depending on types of goods. In addition, the sale tax (6 percent) is levied on the sum of customs value, import duty, and excise payable.
6. State import monopoly No
VII. Exports and Export Proceeds
1. Repatriation requirements
No
2. Financing requirements No
3. Documentation requirements
No
4. Export licenses No
5. Export taxes No
VIII. Payments for Invisible Transactions and Current Transfers
Controls on transfers No
IX. Proceeds from Invisible Transactions and Current Transfers
1. Repatriation requirements
No
2. Restrictions on use of funds
No
X. Capital Transactions
A. Controls on capital transactions
1. Controls on capital and money market instruments
No No domestic capital and money markets have developed yet.
2. Controls on derivatives and other instruments
No
3. Controls on credit operations
No
4. Controls on direct investment
No
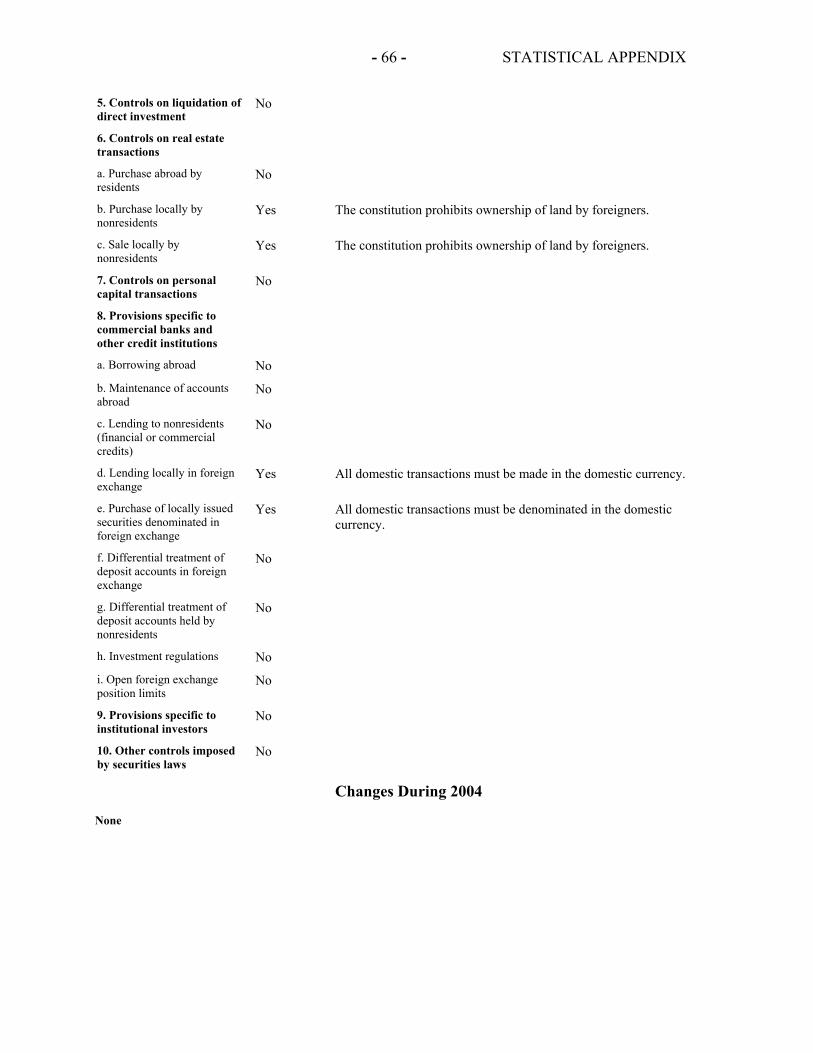
STATISTICAL APPENDIX
- 66 -
5. Controls on liquidation of direct investment
No
6. Controls on real estate transactions
a. Purchase abroad by residents
No
b. Purchase locally by nonresidents
Yes The constitution prohibits ownership of land by foreigners.
c. Sale locally by nonresidents
Yes The constitution prohibits ownership of land by foreigners.
7. Controls on personal capital transactions
No
8. Provisions specific to commercial banks and other credit institutions
a. Borrowing abroad No
b. Maintenance of accounts abroad
No
c. Lending to nonresidents (financial or commercial credits)
No
d. Lending locally in foreign exchange
Yes All domestic transactions must be made in the domestic currency.
e. Purchase of locally issued securities denominated in foreign exchange
Yes All domestic transactions must be denominated in the domestic currency.
f. Differential treatment of deposit accounts in foreign exchange
No
g. Differential treatment of deposit accounts held by nonresidents
No
h. Investment regulations No
i. Open foreign exchange position limits
No
9. Provisions specific to institutional investors
No
10. Other controls imposed by securities laws
No
Changes During 2004
None