Embed Size (px)
Citation preview

1www.deme-group.com
DEME Financial Information 2015
DEME: Creating land for the future

1www.deme-group.com
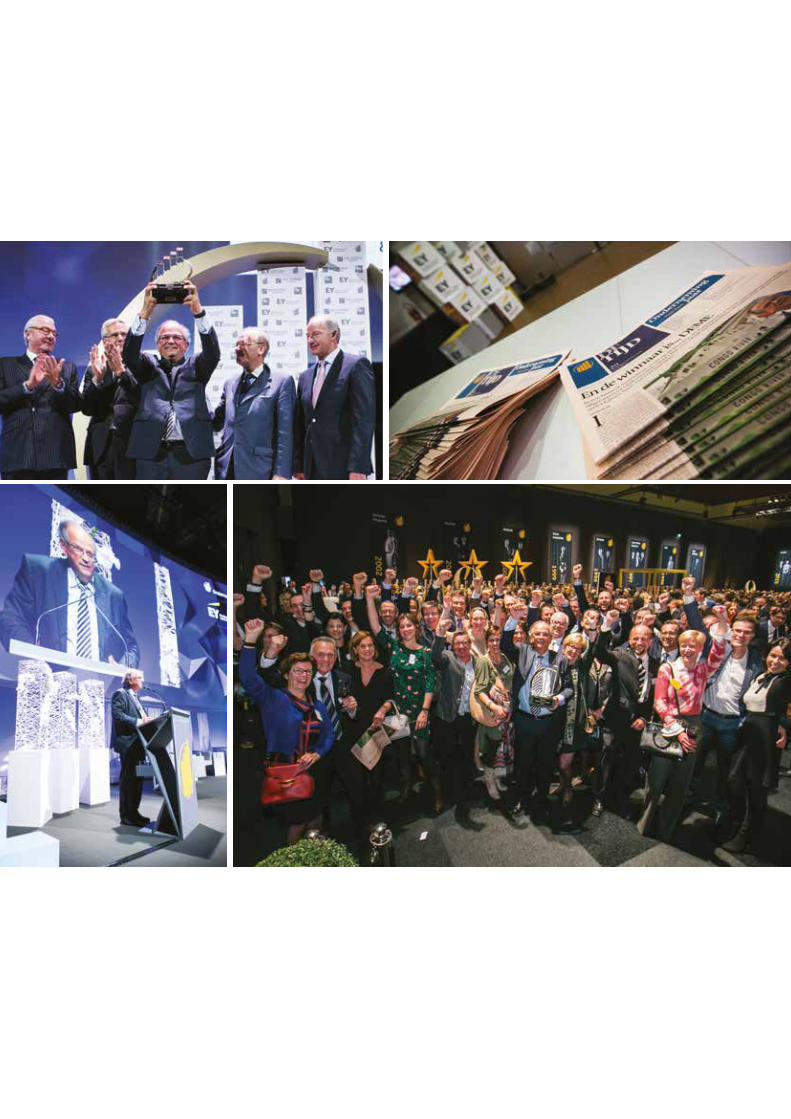
“DEME is an impressive international company, but this is not the only reason it was nominated winner of ‘Entrepreneur of the Year 2015’. As a group it complied with most if not all of the objectives set by the jury. It has numerous qualities that explain our choice.
The organisation has created a well-balanced relationship between management and shareholders, and continuously strives to be the best in the world in terms of technology and innovation. Moreover, the organisation’s culture is based on respect for its employees and other stakeholders. DEME can also boast of an impressive record of sustained and profitable growth.”
Count Paul Buysse, Chairman of the jury’Entrepreneur of the Year 2015’

2
3www.deme-group.com
PRELIMINARYREMARK
The financial annual report of DEME is a
separate brochure, which contains both the
officially approved and published DEME
statutory and consolidated accounts that are
prepared in accordance with Belgian Generally
Accepted Accounting Principles (Belgian Gaap).
In February 2013 DEME successfully emitted a
6 year corporate bond of 200 million EUR on
NYSE Alternext. The financial annual report is
prepared in accordance with the Belgian Royal
Decree on the obligations of issuers of financial
instruments.
To serve the needs of our shareholders,
customers, banks and other stakeholders
DEME chose to prepare an activity report
accompanied by this financial information
brochure that is prepared in accordance with
the recognition and measurement principles
of International Financial Reporting Standards
(IFRS) as adopted by the European Union.
This information does not contain all the
explanatory notes required by those standards
and does not constitute a complete set of
financial statements established in accordance
with International Financial Reporting
Standards (IFRS) as adopted by the European
Union.
This report includes the financial highlights,
consolidated balance sheet and profit and loss
statement, consolidated cash flow statement,
consolidated statement of changes in equity
and the relevant explanatory notes. The DEME
statutory balance sheet and profit and loss
statement are also included.

4
TABLE OF
CONTENTS
‘Innovation’ & ‘Congo River’ in Antwerp on the occasion of DEME’s family day - October 2015

5www.deme-group.com
6 FINANCIAL HIGHLIGHTS
7 DEME GROUP figures
7 DEME GROUP economic figures
8 DEME GROUP financial performance
9 DEME GROUP evolution of consolidated turnover
9 DEME GROUP evolution of net result, EBIT and EBITDA
10 DEME GROUP turnover by region, by activity and by customer
12 CONSOLIDATED ANNUAL ACCOUNT
13 DEME IFRS consolidated profit and loss statement
14 DEME IFRS consolidated statement of comprehensive income
15 DEME IFRS consolidated balance sheet
17 DEME IFRS consolidated statement of cash flows (indirect method)
18 DEME IFRS consolidated statement of changes in equity
19 DEME IFRS share capital and reserves
19 DEME IFRS summary of principal accounting policies
19 Statement of compliance 19 Basis of preparation 19 Business combinations 20 Business combinations between entities under common control 20 Business combinations and disposals in the course of 2015 20 Significant judgments and estimates 22 Principles of consolidation and list of company’s significant subsidiaries, associates and joint-ventures 25 Foreign currencies 26 Intangible assets 26 Goodwill 27 Property, plant and equipment 28 The Group as lessee 28 Inventories 28 Contracts in progress - revenue recognition 28 Trade and other receivables 28 Cash and cash equivalents 28 Impairment tangible and intangible assets including goodwill 29 Share capital 29 Provisions 29 Employee benefit obligations 30 Interest-bearing loans and borrowings 30 Trade and other payables 30 Income taxes 30 Investment tax credits 30 Derivative financial instruments and hedging 31 Revenue 31 Expenses
34 DEME IFRS explanatory notes to the consolidated financial statements 34 note (1) Employment
34 note (2) Intangible assets
35 note (3) Goodwill
35 note (4) Property, plant and equipment
36 note (5) Financial assets
36 note (6) Financial liabilities and net financial debt
37 note (7) FInancial derivatives
37 note (8) Right and commitments not refelcted in the balance sheet
38 Independent auditor’s report
40 STATUTORY ANNUAL ACCOUNT
41 DEME NV introduction
41 DEME NV balance sheet
43 DEME NV profit and loss statement

6
FINANCIAL HIGHLIGHTS
Dredging project Mersin, Turkey

7www.deme-group.com
According to IFRS (*) - In millions of EUR 2015 2014 ∆
Turnover 2,286.1 2,419.7 -133.6
EBITDA 489.2 443.6 45.6
EBIT 269.2 223.5 45.7
Net result share of the Group 199.2 168.9 30.3
Average # personnel (in FTE) 4,099 4,194 -95
Shareholders' equity (excl. minority interests) 1,132.9 986.7 146.2
Net financial debt -269.5 -126.8 -142.7
Total assets 3,149.8 2,901.5 248.3
Total investments 343.1 172.1 171.0
Dividend of the year 60.0 50.7 9.3
According to IFRS (**) - In millions of EUR 2015 2014 ∆
Turnover 2,351.0 2,586.9 -235.9
EBITDA 558.4 501.5 56.9
EBIT 318.4 259.1 59.3
Net result share of the Group 199.2 168.9 30.3
Order book 3,185.0 2,420.0 765.0
Average # personnel (in FTE) 4,186 4,311 -125
Shareholders' equity (excl. minority interests) 1,132.9 986.7 146.2
Net financial debt -266.7 -212.8 -53.9
Total assets 3,233.4 3,132.7 100.7
Total investments 343.9 182.0 161.9
Dividend of the year 60.0 50.7 9.3
DEME GROUP
FIGURES
DEME GROUP
ECONOMIC FIGURES
Definitions:
EBITDA is the sum of operating result (EBIT) , depreciation and amortisation expenses.
EBIT is operating result excluding impairment losses.
Net financial debt is the sum of current and non-current financial liabilities decreased with cash and cash equivalents.
Total investments is the amount paid for the acquisition of intangible, tangible and financial fixed assets.
(*) Following the introduction of the new accounting standards IFRS 10 and IFRS 11, group companies jointly-controlled by DEME are accounted for using the equity method with effective date as from January 1, 2014.
(**) In this presentation, the group companies that are jointly-controlled by DEME are still proportionally integrated. Although this is not in accordance with the new IFRS 10 and IFRS 11 accounting standards, it gives a more complete and economical view of the operations and assets/liabilities of those companies. In the equity accounting as applied under IFRS (*), the contribution of the group companies jointly-controlled by DEME is summarised and presented as one single item on the balance sheet and in the income statement.
as of December 31, 2015 and 2014
as of December 31, 2015 and 2014

8
DEME GROUP
FINANCIAL PERFORMANCE
DEME’s turnover according to the economic approach
amounted to 2,351.0 million EUR, i.e. down 9,1 % on 2014.
The previous year was marked by an exceptional level of
activity in Australia (Wheatstone) and Qatar (New Port
Project Doha).
During the third quarter of 2015, DEME successfully
completed the deepening and widening of a section of the
Suez Canal at Great Bitter Lake. This involved dredging 40
million m3 in just 10 months.
In Singapore, DEME is working on two major projects: the
extension of Jurong Island (JIWE), which is progressing
according to plan, and the mega project Tuas Terminal –
phase 1 (TTP1), which began in the summer of 2015 and will
take six years.
In Yamal, Russia, the second phase of the dredging works
was completed in October 2015.
2015 was also a busy year for GeoSea, the subsidiary
specialising in offshore marine engineering. Several major
projects were carried out to the customers’ satisfaction,
primarily in Germany (Godewind project) and the United
Kingdom (Kentish Flat Extension project). GeoSea has also
just started construction work on the Nordsee One offshore
wind farm in the North Sea, off the German coast.
Despite the decrease in revenue, EBITDA and operating
income increased significantly compared to 2014. The
execution and/or finalisation of important projects have
contributed greatly to this exceptional performance.
The order book of the DEME Group amounts to 3,185.0
million EUR as of 31 December 2015 compared to 2,420.0
million EUR as of 31 December 2014.
Amongst others, DEME won major orders in Singapore
(TTP1 project), Nigeria (Eko Atlantic project) and in Belgium
(maintenance dredging of the river Scheldt). GeoSea was
awarded two major projects in the United Kingdom: the
Galloper and Race Bank projects. Works will begin in 2016.
Investments in 2015 amounted to 343.1 million EUR. These
mainly involve the acquisition of the offshore assets of
Hochtief, such as the pontoons ‘Wismar’, ‘Bremen’ and
‘Stralsund’, the jack-up vessel ‘Thor’, and 50% of the shares
of HGO Infrasea Solutions GmbH & Co KG, owner of the
jack-up vessel ‘Innovation’, the most powerful self-elevating
platform for offshore wind farm construction.
In the last few months, DEME also started building six new
vessels:
• The self-propelled jack-up vessel ‘Apollo’;
• The multipurpose vessel ‘Living Stone’;
• The trailing suction hopper dredger ‘Bonny River’
(14,500m3);
• The trailing suction hopper dredger ‘Scheldt River’
(8,000 m3);
• The trailing suction hopper dredger ‘Minerva’ (3,500 m3);
• The crane vessel ‘Gulliver’ (in joint-venture).
Those vessels, for which down payments were made in 2015,
will progressively join DEME’s fleet from 2017 onwards.
The slight increase in working capital requirement and the
abovementioned investments were largely offset by the
operating cash flow.
DEME’s net financial debt amounted to 266.7 million EUR
(economic approach), or 53.9 million EUR up on the previous
year.
At the end of the financial year, DEME decided to set up
a new division, comprising two new subsidiaries: DEME
Infra Sea Solutions (DISS) and DEME Infra Marine Contractor
(DIMCO), specialising in marine and river civil engineering.
The establishment of this new division is inspired by DEME’s
aim to offer its customers global and integrated solutions
in dredging and marine civil engineering. As part of this
process, the entities CFE Nederland BV and GEKA Bouw
BV, direct subsidiaries of CFE NV, were repositioned under
DIMCO at the end of the year. At the same time, part of
the civil engineering staff of CFE was transferred to DIMCO.

9www.deme-group.com
DEME GROUP
EVOLUTION OF NET RESULT, EBIT AND EBITDA
DEME GROUP
EVOLUTION OF CONSOLIDATED TURNOVER
2006 2007 2008 2009 2010 2011 2012 2013 2014 2015
economic figures* (in millions of EUR)
600
0
100
200
300
400
500
EBITDA
EBIT
Net result
20152014201320122011
economic figures* (in millions of EUR)
* In the economic figures the group companies that are jointly-controlled by DEME are still proportionally integrated which is not in accordance with the new IFRS 10 and IFRS 11 accounting standards. It nevertheless gives a more complete picture of the operations and assets/liabilities of those companies.
1,077
104137
300
89
140
351
109
217
438
169
259
502
558
199
318
3,000
2,500
2,000
1,500
1,000
500
0
1,5091,403
1,801 1,7661,915
2,532 2,587
2,351

10
2015
2015 2014
2015 2014
2014
DEME GROUP
CONSOLIDATED TURNOVER
BY REGION
BY ACTIVITY
BY TYPE OF CUSTOMER
economic figures* (in %)
* In the economic figures the group companies that are jointly-controlled by DEME are still proportionally integrated which is not in accordance with the new IFRS 10 and IFRS 11 accounting standards. It nevertheless gives a more complete picture of the operations and assets/liabilities of those companies.
12%Asia and Oceania
23%Marineworks
3%Mining
12%Renewables
12%Renewables
54%Government
41%Government
20%Oil and gas 33%
Oil and gas
11%Other
7%Other
7%Mining
9%Environmental
7%Environmental
9%Fallpipe and
landfalls
9%Fallpipe and
landfalls
11%Maintenance
Dredging
11%Maintenance
Dredging
18%Marineworks48%
CapitalDredging
55%Capital
Dredging
10%Europe non-EU
7%Europe non-EU
30%Asia andOceania33%
Europe EU
34%Europe EU
7%Middle East
8%Middle East
4%Indian
subcontinent1%
Indiansubcontinent
4%America
6%America
30%Africa
14%Africa

11www.deme-group.com
New Fishing PortAbidjan, Ivory Coast

12
CONSOLIDATED ANNUAL ACCOUNT
C-Power offshore wind project, Belgium

13www.deme-group.com
(in thousands of EUR) Notes 2015 2014
REVENUES 2,329,109 2,425,624
Turnover 2,286,124 2,419,656
Movement in contracts in progress 9,318 -17,221
Other operating income 33,667 23,189
OPERATING EXPENSES -2,066,155 -2,202,100
Operating costs other than personnel costs and depreciation -1,484,241 -1,607,260
Personnel expenses (1) -355,653 -374,730
Depreciation and impairment losses -226,261 -220,110
OPERATING RESULT 262,954 223,524
FINANCIAL RESULT -45,353 -23,231
Net finance cost -27,570 -27,562
Other financial charges and income -17,783 4,331
RESULT BEFORE TAXES 217,601 200,293
Income taxes and deferred taxes -56,521 -56,570
RESULT AFTER TAXES 161,080 143,723
Result from participations accounted for using the equity method (5) 39,597 25,366
NET GROUP PROFIT 200,677 169,089
Attributable to:
Non-controlling interests 1,481 98
Owners of the parent 199,196 168,991
DEME IFRS
CONSOLIDATED PROFIT AND LOSS STATEMENT
as of December 31, 2015 and 2014

14
(in thousands of EUR) 2015 2014
Net income attributable to non-controlling interests 1,481 98
Net income attributable to owners of the parent 199,196 168,991
Net income for the period 200,677 169,089
Changes in fair value related to hedging instruments 4,645 1,495
Changes in cumulative translation adjustment reserve -4,202 -3,223
Other comprehensive income that may be reclassified to profit and loss in subsequent periods 443 -1,728
Remeasurement of net liabilities related to defined benefit plans -2,301 1,526
Other comprehensive income not to be reclassified to profit and loss in subsequent periods -2,301 1,526
Total other comprehensive income -1,858 -202
Comprehensive income: 198,819 168,887
Attributable to:
Non-controlling interests 1,990 -195
Owners of the parent 196,829 169,082
DEME IFRS
CONSOLIDATED STATEMENT OF COMPREHENSIVE INCOME
as of December 31, 2015 and 2014
HQ DEME Zwijndrecht, Belgium

15www.deme-group.com
(in thousands of EUR) Notes 2015 2014
ASSETS
NON-CURRENT ASSETS 1,922,841 1,656,082
Intangible assets (2) 12,378 6,536
Goodwill (3) 18,732 17,055
Property, plant and equipment (4) 1,652,499 1,397,545
Land and buildings 42,835 42,653
Plant, machinery and equipment 1,404,554 1,291,871
Furniture and vehicles 4,857 3,555
Leasing and similar rights 112,554 57,482
Other 380 447
Assets under construction and advance payments 87,319 1,537
Financial assets 124,099 115,343
Financial derivatives (7) 1,381 674
Participations accounted for using the equity method (5) 64,660 83,197
Other financial assets (5) 58,058 31,472
Loans and receivables 18,149 16,673
Deferred tax assets 96,984 102,930
CURRENT ASSETS 1,226,928 1,245,417
Inventories 37,302 35,112
Raw materials and consumables 11,259 18,387
Contracts in progress 26,043 16,725
Amounts receivable 756,410 607,138
Trade receivables 689,545 548,881
Other receivables 66,865 58,257
Financial assets 8,514 4,220
Financial derivatives (7) 8,514 4,220
Cash and cash equivalents (6) 378,464 579,691
Deferred charges and accrued income 46,238 19,256
TOTAL ASSETS 3,149,769 2,901,499
DEME IFRS
CONSOLIDATED BALANCE SHEET
as of December 31, 2015 and 2014

16
(in thousands of EUR) Notes 2015 2014
GROUP EQUITY AND LIABILITIES
SHAREHOLDERS' EQUITY 1,132,861 986,736
Issued capital 31,110 31,110
Share premium 5,645 5,645
Reserves and retained earnings 1,125,427 976,934
Hedging reserve -14,781 -19,426
Actuarial gains (losses) defined benefit pension plans -11,834 -9,594
Cumulative translation adjustment -2,706 2,067
NON-CONTROLLING INTERESTS 10,963 11,007
GROUP EQUITY 1,143,824 997,743
NON-CURRENT LIABILITIES 724,021 673,918
Employee benefit obligations 31,031 28,343
Provisions 7,661 6,048
Deferred tax liabilities 109,049 81,731
Financial liabilities (6) 539,028 502,023
Subordinated loans – 300
Bond 199,780 199,706
Finance leases 86,028 51,716
Credit institutions 252,545 249,576
Other loans 675 725
Financial derivatives (7) 33,359 15,758
Advances received on contracts in progress (long term) – 527
Other long term liabilities 3,893 39,488
CURRENT LIABILITIES 1,281,924 1,229,838
Financial liabilities (6) 108,901 204,509
Current portion of non-current financial liabilities 108,901 161,091
Credit institutions – 418
Other current financial liabilities – 43,000
Financial derivatives (7) 34,607 21,434
Trade payables 912,004 822,786
Advances received on contracts in progress 44,160 35,131
Remuneration and social security 65,021 42,952
Income taxes 80,619 72,552
Other amounts payable 18,117 14,409
Accrued charges and deferred income 18,495 16,065
TOTAL GROUP EQUITY AND LIABILITIES 3,149,769 2,901,499
DEME IFRS
CONSOLIDATED BALANCE SHEET
as of December 31, 2015 and 2014

17www.deme-group.com
(in thousands of EUR) 2015 2014
CASH AND CASH EQUIVALENTS - OPENING BALANCE 579,691 318,342
Profit (loss) from operating activities 266,095 223,652
Dividends from participations accounted for using the equity method 449 –
Reclassification of (income) loss from sales of property, plant and equipment to cash flow from divestments
-17,939 -7,159
Other non-operating income (expenses) – –
Income taxes - 52,509 - 46,256
Non-cash adjustments 224,039 221,074
Depreciation and impairment losses 223,120 220,110
(Decrease) increase of provisions 919 964
Other non-cash expenses (income) – –
CASH FLOW FROM OPERATING ACTIVITIES BEFORE CHANGES IN WORKING CAPITAL 420,135 391,311
Changes in working capital -38,974 229,685
Decrease (increase) of inventories and construction contracts -8,305 22,787
Decrease (increase) of amounts receivable -131,297 5,550
Increase (decrease) of liabilities (other than financial debts) 100,628 201,348
CASH FLOW FROM OPERATING ACTIVITIES 381,161 620,996
Investments -343,129 -172,162
Acquisition of intangible and tangible assets -263,132 -165,361
Acquisition of financial fixed assets -63,770 -4,307
Loans granted -16,227 -2,494
Divestments 31,020 9,747
Disposal of intangible and tangible assets 26,009 9,747
Disposal of financial fixed assets 682 –
Repayments on loans granted 4,329 –
CASH FLOW FROM INVESTING ACTIVITIES -312,109 -162,415
Financial operations -293,993 -198,748
Interest received 4,269 5,512
Interest paid -31,840 -33,075
Other financial income (costs) -17,783 4,203
Decrease (increase) of treasury shares – 5,064
(Decrease) increase of financial debts -197,935 -145,342
Dividends paid -50,704 -35,110
CASH FLOW FROM FINANCIAL ACTIVITIES -293,993 -198,748
NET INCREASE (DECREASE) IN CASH AND CASH EQUIVALENTS -224,941 259,833
Change in consolidation scope or method 24,014 -664
Impact of exchange rate changes on cash and cash equivalents -300 2,180
CASH AND CASH EQUIVALENTS - ENDING BALANCE 378,464 579,691
DEME IFRS
CONSOLIDATED STATEMENT OF CASH FLOWS (INDIRECT METHOD)
as of December 31, 2015 and 2014

18
Share capital
and share premium
Hedging reserve
Defined benefit pension
plans
Treasury shares
Consolidated reserves
Cumulative translation adjustment
Shareholders' equity
Equity non-
controlling interests
Total equity
Opening, January 1, 2015
36,755 -19,426 -9,594 – 976,934 2,067 986,736 11,007 997,743
Profit 199,196 199,196 1,481 200,677
Other comprehensive income
4,645 -2,239 -4,773 -2,367 509 -1,858
Total comprehensive income
4,645 -2,239 – 199,196 -4,773 196,829 1,990 198,819
Dividends paid -50,704 -50,704 -2,093 -52,797
Sale treasury share
– – –
Other – 59 59
Ending, December 31, 2015
36,755 -14,781 -11,833 – 1,125,426 -2,706 1,132,861 10,963 1,143,824
Share capital
and share premium
Hedging reserve
Defined benefit pension
plans
Treasury shares
Consolidated reserves
Cumulative translation adjustment
Shareholders' equity
Equity non-
controlling interests
Total equity
Opening, January 1, 2014
36,755 -20,918 -11,240 -1,575 839,565 5,114 847,701 11,385 859,086
Profit 168,991 168,991 98 169,089
Other comprehensive income
1,492 1,646 -3,047 91 -293 -202
Total comprehensive income
1,492 1,646 – 168,991 -3,047 169,082 -195 168,887
Dividends paid -35,110 -35,110 -2,329 -37,439
Sale treasury share
1,575 3,489 5,064 – 5,064
Other -1 -1 2,146 2,145
Ending, December 31, 2014
36,755 -19,426 -9,594 – 976,934 2,067 986,736 11,007 997,743
DEME IFRS
CONSOLIDATED STATEMENT OF CHANGES IN EQUITY
as of December 31, 2015
DEME IFRS
CONSOLIDATED STATEMENT OF CHANGES IN EQUITY
as of December 31, 2014

19www.deme-group.com
DEME IFRS
SUMMARY OF PRINCIPAL ACCOUNTING POLICIES
DEME IFRS
SHARE CAPITAL AND RESERVES
STATEMENT OF COMPLIANCE
The consolidated financial statements have been prepared in accordance with the recognition and measurement principles of International Financial Reporting Standards (IFRS) as adopted by the European Union (EU), but do not contain all the explanatory notes required by IFRS as adopted by the European Union.
BASIS OF PREPARATION
To serve the needs of our shareholders, customers, banks and other stakeholders, DEME chose to prepare an activity report accompanied by financial information that is prepared in accordance with the recognition and measurement principles of International Financial Reporting Standards (IFRS) as adopted by the European Union.
The consolidated financial statements are presented in thousands of EUR. They are prepared on the historical cost basis except for derivative financial instruments, investments held for trading and investments available-for-sale which are stated at fair value.
The consolidated financial statements are prepared as of and for the period ending December 31, 2015.
They are presented before the effect of the profit appropriation of the parent company proposed to the general assembly of shareholders.
NEW IFRS STANDARDS AND INTERPRETATIONS THAT BECAME EFFECTIVE FOR 2015:
• IFRIC 21 Levies• Improvements to IFRSs - 2011-2013 cycles
The IASB issued the 2011-2013 cycle improvements to its standards and interpretations. These improvement clarify:
• IFRS 3; A scope exemption for the formation of a ‘joint-venture’;
• IFRS 13; Measurement of the fair value of a group of financial assets and financial liabilities on a net basis;
• IAS 40; Determines whether the acquisition of an investment property in a business combination requires judgment of the specific requirements of IFRS 3.
The financial position and performance of the group was not affected by the initial application of above Standards and Interpretations.
As for new IFRS Standards and Interpretations the Group did not perform any early adoption.
BUSINESS COMBINATIONS
Acquisitions of businesses are accounted for using the acquisition method. The consideration transferred in a business combination is measured at fair value, which is calculated as the sum of the acquisition-date fair values of the assets transferred by the Group, liabilities incurred by the Group to the former owners of the acquiree and the equity interests issued by the Group in exchange for control of the acquiree. Acquisition-related costs are generally recognised in profit or loss as incurred. At the acquisition date, the identifiable assets acquired and the liabilities assumed are recognised at their fair value, except that: • deferred tax assets or liabilities, and assets or liabilities
related to employee benefit arrangements are recognised and measured in accordance with IAS 12 Income Taxes and IAS 19 respectively;
• liabilities or equity instruments related to share-based
payment arrangements of the acquiree or share-based payment arrangements of the Group entered into to replace share-based payment arrangements of the acquiree are measured in accordance with IFRS 2 at the acquisition date;
• assets (or disposal groups) that are classified as held for
sale in accordance with IFRS 5 Non-current Assets Held for Sale and Discontinued Operations are measured in accordance with that Standard.
Goodwill is measured as the excess of the sum of the consideration transferred, the amount of any non-controlling interests in the acquiree, and the fair value of the acquirer’s previously held equity interest in the acquiree (if any) over the net of the acquisition-date amounts of the identifiable assets acquired and the liabilities assumed. If, after reassessment, the net of the acquisition-date amounts
The share capital on December 31, 2015 was composed of 4,538,100 ordinary shares. These shares are without any nominal value. The owners of ordinary shares have the right to receive dividends and have one vote per share in Shareholders’ General Meetings. On March 11, 2016, the board of directors proposed a dividend of 60,002,758
EUR, corresponding to 13,222 EUR gross per share. The final dividend is subject to shareholder approval in the Shareholders’ General Meeting. The appropriation of income was not included in the financial statements at December 31, 2015. The final dividend for the year ended December 31, 2014 was 50,704,191 EUR.
on December 31, 2015

20
of the identifiable assets acquired and liabilities assumed exceeds the sum of the consideration transferred, the amount of any non-controlling interests in the acquiree and the fair value of the acquirer’s previously held interest in the acquiree (if any), the excess is recognised immediately in profit or loss as a bargain purchase gain. Non-controlling interests that are present ownership interests and entitle their holders to a proportionate share of the entity’s net assets in the event of liquidation may be initially measured either at fair value or at the non-controlling interests’ proportionate share of the recognised amounts of the acquiree’s identifiable net assets. The choice of measurement basis is made on a transaction-by-transaction basis. Other types of non-controlling interests are measured at fair value or, when applicable, on the basis specified in another IFRS. When the consideration transferred by the Group in a business combination includes assets or liabilities resulting from a contingent consideration arrangement, the contingent consideration is measured at its acquisition-date fair value and included as part of the consideration transferred in a business combination. Changes in the fair value of the contingent consideration that qualify as measurement period adjustments are adjusted retrospectively, with corresponding adjustments against goodwill. Measurement period adjustments are adjustments that arise from additional information obtained during the ‘measurement period’ (which cannot exceed one year from the acquisition date) about facts and circumstances that existed at the acquisition date. The subsequent accounting for changes in the fair value of the contingent consideration that do not qualify as measurement period adjustments depends on how the contingent consideration is classified. Contingent consideration that is classified as equity is not remeasured at subsequent reporting dates and its subsequent settlement is accounted for within equity. Contingent consideration that is classified as an asset or a liability is remeasured at subsequent reporting dates in accordance with IAS 39, or IAS 37 Provisions, Contingent Liabilities and Contingent Assets, as appropriate, with the corresponding gain or loss being recognised in profit or loss. When a business combination is achieved in stages, the Group’s previously held equity interest in the acquiree is remeasured to its acquisition-date fair value and the resulting gain or loss, if any, is recognised in profit or loss. Amounts arising from interests in the acquiree prior to the acquisition date that have previously been recognised in other comprehensive income are reclassified to profit or loss where such treatment would be appropriate if that interest were disposed of. If the initial accounting for a business combination is incomplete by the end of the reporting period in which the combination occurs, the Group reports provisional amounts for the items for which the accounting is incomplete. Those provisional amounts are adjusted during the measurement period (see above), or additional assets or liabilities are recognised, to reflect new information obtained about facts and circumstances that existed at the acquisition date that, if known, would have affected the amounts recognised at that date.
BUSINESS COMBINATIONS BETWEEN ENTITIES UNDER COMMON CONTROL
As current IFRSs do not specify recognition and measurement principles in respect of business combinations between entities under common control (these are excluded from the scope of IFRS 3 Business Combinations), the Group applied generally the same principles as specified under IFRS 3 except that the assets and liabilities of the acquiree are initially recognised at their carrying amount (no fair value adjustment at acquisition date are recognised).
BUSINESS COMBINATIONS AND DISPOSALS IN THE COURSE OF 2015
On May 13th, GeoSea, a 100% affiliate of DEME, acquired the additional 50% in HGO Infrasea Solutions GmbH & Co KG (HGO) from the German Group Hochtief, and became as such sole shareholder of HGO. This company is the owner of the the jack-up vessel ‘Innovation’, the most powerful self-elevating platform for offshore windfarm construction. Since April 1, 2015, HGO is fully consolidated. Next to the acquisition of the shares, the sale and purchase agreement also includes the sale of 3 pontoons (‘Wismar’, ‘Bremen’ and ‘Stralsund’) and the legal position as lessee of the jack-up vessel ‘Thor’. A residual goodwill on the full transaction is booked for an amount of 1,26 million EUR, which is determined by comparing the consideration with the fair value of all identifiable assets and liabilities recognised at acquisition date. The fair value of the fleet is supported by a valuation report made by an independent valuator.
At the end of the financial year, the entities CFE Nederland BV and GEKA Bouw BV, direct subsidiaries of CFE NV, were repositioned under DEME Infra Marine Contractor NV (DIMCO). A residual goodwill of 3,5 million EUR is booked on this transaction.
In the course of 2015, DEME sold all of its shares, 50 %, in the company FLiDAR NV to AXYS Technologies Inc., a Canadian company. FLiDAR NV was a joint-venture established between 3E and OWA (DEME Group), to build, service and commercialise a floating LiDAR based measurement device.
SIGNIFICANT JUDGMENTS AND ESTIMATES
The preparation of financial statements under IFRSs requires estimates to be used and assumptions to be made that affect the amounts shown in those financial statements, particularly as regards the following items:
• the period over which non-current assets are depreciated or amortised;
• the measurement of provisions and defined benefit plans and other long term employee benefits;
• the measurement of income or expense on construction contracts using the percentage of completion method;
• estimates used in impairment tests;• estimates used in the assessment of income taxes;• the fair value measurement of derivatives.

21www.deme-group.com

22
These estimates assume the operation is a going concern and are made on the basis of the information available at the time. Estimates may be revised if the circumstances on which they were based alter or if new information becomes available. Actual results may be different from these estimates.
PRINCIPLES OF CONSOLIDATION AND LIST OF COMPANY’S SIGNIFICANT SUBSIDIARIES, ASSOCIATES AND JOINT-VENTURES
The consolidated financial statements incorporate the financial statements of the Company and entities (including structured entities) controlled by the Company and its subsidiaries.
Control is achieved when the Company:
• has power over the investee;
• is exposed, or has rights, to variable returns from its
involvement with the investee;
• has the ability to use its power to affect its returns.
The Company reassesses whether or not it controls an investee if facts and circumstances indicate that there are changes to one or more of the three elements of control listed above.
Consolidation of a subsidiary begins when the Company obtains control over the subsidiary and ceases when the Company loses control of the subsidiary. Specifically, income and expenses of a subsidiary acquired or disposed of during the year are included in the consolidated statement of profit or loss and other comprehensive income from the date the Company gains control until the date when the Company ceases to control the subsidiary.
Profit or loss and each component of other comprehensive income are attributed to the owners of the Company and to the non-controlling interests. Total comprehensive income of subsidiaries is attributed to the owners of the Company and to the non-controlling interests even if this results in the non-controlling interests having a deficit balance.
When necessary, adjustments are made to the financial sta-tements of subsidiaries to bring their accounting policies into line with the Group’s accounting policies.
All intragroup assets and liabilities, equity, income, expenses and cash flows relating to transactions between members of the Group are eliminated in full on consolidation.
Changes in the Group’s ownership interests in subsidiaries that do not result in the Group losing control over the
subsidiaries are accounted for as equity transactions. The carrying amounts of the Group’s interests and the non-controlling interests are adjusted to reflect the changes in their relative interests in the subsidiaries. Any difference between the amount by which the non-controlling interests are adjusted and the fair value of the consideration paid or received is recognised directly in equity and attributed to owners of the Company.
When the Group loses control of a subsidiary, a gain or loss is recognised in profit or loss and is calculated as the difference between (i) the aggregate of the fair value of the consideration received and the fair value of any retained interest and (ii) the previous carrying amount of the assets (including goodwill), and liabilities of the subsidiary and any non-controlling interests. All amounts previously recognised in other comprehensive income in relation to that subsidiary are accounted for as if the Group had directly disposed of the related assets or liabilities of the subsidiary (i.e. reclassified to profit or loss or transferred to another category of equity as specified/permitted by applicable IFRSs).
An investment retained is initially measured at fair value. This fair value becomes the initial carrying amount at the date when control is lost and for the purposes of subsequently accounting for the retained interest as an associate, joint venture or financial asset.
Associated companies are those in which the DEME Group has significant influence. The significant influence is the power to take part in financial and operating policies of a company without having a control or joint-control on these policies.
A joint-venture is a joint-arrangement whereby the parties exerting joint-control over the arrangement have rights to the net assets of the joint-arrangement. Joint-control is the contractually agreed sharing of control of an arrangement, which exists only when decisions about the relevant activities require unanimous consent of the parties sharing control.
Assets, liabilities, revenues and expenses from joint-ventures and joint-operations are accounted for under the equity method in the consolidated financial statements. Under the equity method, an investment in a joint-venture or associate is firstly recorded at cost in the consolidated financial statement and then adjusted to record the share of the Group in the net result and in the comprehensive income of the associate or joint-venture. When the Group’s share of losses of an associate or a joint-venture exceeds the Group’s interest in that associate or joint-venture (which includes any long-term interests that, in substance, form part of the Group’s net investment in the associate or joint-venture), the Group discontinues recognising its share of further losses.
Additional losses are recognised only to the extent that the Group has incurred legal or constructive obligations or made payments on behalf of the associate or joint-venture. At the

23www.deme-group.com
acquisition of the interest, any surplus between the cost of the investment and the share in the fair value of net assets of the entity is recorded as goodwill included in the carrying amount of the investment.
Any surplus between the share of the group in the fair value of net assets and the cost of the investment after remeasurement is immediately recorded in the income statement during the period of acquisition of the investment.The Group continues to use the equity method when an investment in an associate becomes an investment in a joint-venture or an investment in a joint-venture becomes an investment in an associate. There is no remeasurement to fair value upon such changes in ownership interests.
When the Group reduces its ownership interest in an associate or a joint-venture but the Group continues to use the equity method, the Group reclassifies to profit or loss the proportion of the gain or loss that had previously been recognised in other comprehensive income relating to that reduction in ownership interest if that gain or loss would be reclassified to profit or loss on the disposal of the related assets or liabilities.
When a group entity transacts with an associate or a joint-venture of the Group, profits and losses resulting from the transactions with the associate or joint-venture are recognised in the Group’s consolidated financial statements only to the extent of interests in the associate or joint-venture that are not related to the Group.
A joint-operation is a joint-arrangement in which the parties (joint-operators) have direct rights over the assets and direct obligations with respect to the entity’s liabilities. Joint-control is the contractually agreed sharing of control of an arrangement, which exists only when decisions about the relevant activities require unanimous consent of the parties sharing control. When a DEME Group entity starts activity in a joint-operation, DEME recognises in relation to its interest in the joint-operation:
• its assets, including its share of any assets held jointly;
• its liabilities, including its share of any liabilities incurred jointly;
• its revenue from the sale of its share of the output arising from the joint-operation;
• its share of the revenue from the sale of its share of the output by the joint-operation;
• its expenses, including its share of any expenses incurred jointly.
The Group accounts for the assets, liabilities, revenues and expenses relating to its interest in a joint-operation in accordance with the IFRSs applicable to the particular assets, liabilities, revenues and expenses.
When a group entity transacts with a joint-operation in which a group entity is a joint-operator such as a sale or contribution of assets, the Group is considered to be conducting the transaction with the other parties to the joint-operation, and gains and losses resulting from the transactions are recognised in the Group’s consolidated financial statements only to the extent of other parties’ interests in the joint-operation.
When a group entity transacts with a joint-operation in which a group entity is a joint operator such as a purchase of assets, the Group does not recognise its share of the gains and losses until it resells those assets to a third party.
A listing of the company’s significant subsidiaries and associates can be found on the next page.

24
Name Place% of shareholdingas of 31/12/2015
Dredging International, NV Zwijndrecht, Belgium 100 %Baggerwerken Decloedt en Zoon, NV Ostend, Belgium 100 %DEME Building Materials, NV Zwijndrecht, Belgium 100 %DEME Concessions, NV Zwijndrecht, Belgium 100 %DEME Coordination Center, NV Zwijndrecht, Belgium 100 %DEME Infrasea Solutions, NV Zwijndrecht, Belgium 100 %DEME Infra Marine Contractors, NV Zwijndrecht, Belgium 100 %GeoSea, NV Zwijndrecht, Belgium 100 %Offshore Wind Assistance, NV Zwijndrecht, Belgium 100 %M.D.C.C. Insurance Brokers, NV Brussels, Belgium 100 %Global Sea Mineral Resources, NV Ostend, Belgium 99.97 %Agroviro, NV Zwijndrecht, Belgium 74.90 %DEME Environmental Contractors, NV Zwijndrecht, Belgium 74.90 %Purazur, NV Zwijndrecht, Belgium 74.90 %Ecoterres Holding, SA Gosselies, Belgium 74.90 %Ecoterres, SA Gosselies, Belgium 74.90 %DEME Blue Energy, NV Zwijndrecht, Belgium 69.99 %Scaldis Salvage & Marine Contractors, NV Antwerp, Belgium 54.37 %Combined Marine Terminal Operations Worldwide, NV Zwijndrecht, Belgium 54.37 %Grondrecyclagecentrum Kallo, NV Zwijndrecht, Belgium 52.43 %Dragagem Angola Serviços, Lda. Luanda, Angola 100 %GeoSea Australia, Pty., Ltd. Brisbane, Australia 100 %DI Australia Pty., Ltd. Brisbane, Australia 100 %Dragabras Serviços de Dragagem, Ltda. Rio de Janeiro, Brazil 100 %Dredging International Services Cyprus, Ltd. Nicosia, Cyprus 100 %Novadeal, Ltd. Nicosia, Cyprus 100 %DEME Cyprus, Ltd. Nicosia, Cyprus 100 %Energies du Nord, SAS Lambersart, France 100 %Société de Dragage International, SA Lambersart, France 100 %HGO Infrasea Solutions, GmbH & Co KG Bremen, Germany 100 %Nordsee Nassbagger- und Tiefbau, GmbH Bremen, Germany 100 %DEME Building Materials, Ltd. West-Sussex, Great Britain 100 %Dredging International (UK), Ltd. Weybridge, Surrey, Great Britain 100 %DEME Environmental Contractors UK, Ltd. Weybridge, Surrey, Great Britain 74.90 %Far East Dredging, Ltd. Hong Kong 100 %International Seaport Dredging, Pvt Ltd. Chennai, India 86 %DI India, Pvt Ltd. New Delhi, India 99.78 %Sidra, Spa Rome, Italy 100 %Dredging International Luxembourg, SA Windhof, Luxembourg 100 %GeoSea Luxembourg, SA Windhof, Luxembourg 100 %Safindi, SA Windhof, Luxembourg 100 %Tideway Luxembourg, SA Windhof, Luxembourg 100 %DI Mexico, SA Mexico D.F., Mexico 100 %Dragamoz, Limitada Maputo, Mozambique 100 %Dredging International Services (Nigeria), Ltd. Lagos, Nigeria 100 %Dredging International de Panama, SA Panama, Panama 100 %Dragmorstroy, LLC. St. Petersburg, Russia 100 %Dredging International Asia Pacific Pte., Ltd. Singapore 100 %Dredging International España, SA Madrid, Spain 100 %Tideway, BV Breda, The Netherlands 100 %CFE Nederland, BV Dordrecht, The Netherlands 100 %Geka Bouw, BV Dordrecht, The Netherlands 100 %DEME Building Materials, BV Flushing, The Netherlands 100 %De Vries & van de Wiel Kust- en Oeverwerken, BV Schiedam, The Netherlands 87.45 %De Vries & van de Wiel, BV Amsterdam, The Netherlands 74.90 %
MAIN SUBSIDIARIES (FULLY CONSOLIDATED)

25www.deme-group.com
Name Place% of shareholdingas of 31/12/2015
Power@Sea, NV Zwijndrecht, Belgium 51.10 %
Power@Sea Thornton, NV Zwijndrecht, Belgium 51.10 %
High Wind, NV Zwijndrecht, Belgium 50.40 %
Terranova, NV Zwijndrecht, Belgium 43.73 %
Sédisol, SA Charleroi, Belgium 37.45 %
Silvamo, NV Roeselare, Belgium 37.45 %
Renewable Energy Base Ostend, NV Ostend, Belgium 25.50 %
C-Power Holdco, NV Zwijndrecht, Belgium 19.67 %
Otary RS, NV Ostend, Belgium 18.89 %
Rentel, NV Ostend, Belgium 18.89 %
C-Power, NV Ostend, Belgium 11.67 %
DEME Brasil Serviços de Dragagem, Ltda. Rio de Janeiro, Brazil 50 %
Extract - Ecoterres, SA Villeneuve-le-Roi, France 37.45 %
Merkur Offshore, GmbH Hamburg, Germany 12,5%
Normalux Maritime, SA Windhof, Luxembourg 37.50 %
Middle East Dredging Company, Q.S.C. Doha, Qatar 44.10 %
Mordraga, LLC. St. Petersburg, Russia 40 %
Deeprock, CV Breda, The Netherlands 50 %
Oceanflore, BV Kinderdijk, The Netherlands 50 %
MAIN ASSOCIATES (EQUITY METHOD)
FOREIGN CURRENCIES
The euro is used as presentation currency for the consolidated financial statements.
Financial statements of foreign entities whose functional currencies are other than the euro, are translated as follows:
• assets and liabilities are translated at the year-end rate; • income and expenses are translated at the average
exchange rate for the year;• shareholders’ equity accounts are translated at historical
exchange rates.
Exchange differences arising, if any, are recognised in other comprehensive income and accumulated in equity (and attributed to non-controlling interests as appropriate).
On the disposal of a foreign operation (i.e. a disposal of the Group’s entire interest in a foreign operation, a disposal involving loss of control over a subsidiary that includes a foreign operation, or a partial disposal of an interest in a joint-arrangement or an associate that includes a foreign operation of which the retained interest becomes a financial asset), all of the exchange differences accumulated in equity
in respect of that operation attributable to the owners of the Company are reclassified to profit or loss.
In addition, in relation to a partial disposal of a subsidiary that includes a foreign operation that does not result in the Group losing control over the subsidiary, the proportionate share of accumulated exchange differences are re-attributed to non-controlling interests and are not recognised in profit or loss. For all other partial disposals (i.e. partial disposals of associates or joint-arrangements that do not result in the Group losing significant influence or joint-control), the proportionate share of the accumulated exchange differences is reclassified to profit or loss.
Foreign currency transactions are accounted for at exchange rates prevailing at the date of the transactions. Monetary assets and liabilities denominated in foreign currencies are translated at the balance sheet date rate. Gains and losses resulting from the settlement of foreign currency transactions and from the translation of monetary assets and liabilities denominated in foreign currencies are recognised in the income statement. Non-monetary items that are measured in terms of historical cost in a foreign currency are not retranslated.

26
INTANGIBLE ASSETS
Acquired licences, patents and similar rightsThese intangibles that are separately acquired and that have a finite useful life are carried at cost less accumulated amor-tisation and accumulated impairment losses. Amortisation is recognised on a straight-line basis over their estimated useful lives.
Research and developmentExpenditure on research activities is recognised in the income statement as an expense as incurred.
An internally-generated intangible asset arising from deve-lopment (or from the development phase of an internal pro-ject) is recognised if, and only if, all of the following have been demonstrated:
• the technical feasibility of completing the intangible asset so that it will be available for use or sale;
• the intention to complete the intangible asset and use or sell it;
• the ability to use or sell the intangible asset;• how the intangible asset will generate probable future
economic benefits;• the availability of adequate technical, financial and other
resources to complete the development and to use or sell the intangible asset;
• the ability to measure reliably the expenditure attributable to the intangible asset during its development.
The amount initially recognised for internally-generated in-tangible assets is the sum of the expenditure incurred from the date when the intangible asset first meets the recogniti-on criteria listed above. Where no internally-generated intan-gible asset can be recognised, development expenditure is re-cognised in profit or loss in the period in which it is incurred.
Subsequent to initial recognition, internally-generated intan-gible assets are reported at cost less accumulated amortisati-on and accumulated impairment losses, on the same basis as intangible assets that are acquired separately.
Exploration for and evaluation of mineral resourcesDEME has opted to expense costs incurred for the exploration and evaluation of mineral resources on the seabed.
GOODWILL
Goodwill arising from a business combination is recognised as an asset on the date on which control was obtained (the acquisition date). Goodwill is measured as the excess of the consideration transferred, the non-controlling interests in the acquired company and the fair value of the stake already owned by the group in the acquired company (if any) over the net amount of identifiable assets acquired and liabilities assumed on the acquisition date.
Non-controlling interests are initially measured either at fair value, or at the non-controlling interests’ share of the acqui-ree’s recognised identifiable net assets. The basis of measure-ment is selected on a transaction-by-transaction basis.
Goodwill is not amortised, but is subject to impairment tests taking place annually or more frequently if there is an indi-cation that the cash-generating unit to which it is allocated (generally a subsidiary) could have suffered a loss of value. Goodwill is stated on the balance sheet at cost less accumula-ted impairment losses, if any. Impairment of goodwill is not reversed in future periods. When a subsidiary is divested from the group, the resulting goodwill and other comprehensive income relating to the subsidiary are taken into account in determining the net gain or loss on disposal.
If, after reassessment, the net balance, at the acquisition date, of identifiable assets acquired and liabilities assumed is higher than the sum of the consideration transferred, non-controlling interests in the acquiree and the fair value of the stake in the acquiree previously owned by the group (if any), the surplus is recognised immediately in the income statement as a gain from a bargain purchase.
Processing installation Boulogne-sur-Mer, France

27www.deme-group.com
Equipment Useful life in years Residual value
Buildings 25 years
Trailing suction hopper dredgers 18 years 5%
Cutter suction dredgers 18 years 5%
Fallpipe vessels 21 years 5%
Bucket dredgers 25 years 5%
Self-propelled hopper and transportation barges 25 years 5%
Backhoe dredgers and pontoons 18 years
Specific spare parts related to vessels Identical to useful life of related vessel
Other barges, auxiliaries and booster stations 18 years
Self-propelled jack-up platforms: pontoon part 20 years 5%
Self-propelled jack-up platforms: crane and jack-up system 10 years
Cranes 12 years 5%
Earth moving material 5 years
Pipelines 3 years
Site equipment and installations 5 years
Transportation equipment 3 years
Office equipment and furniture 10 years
Computers 3 years
PROPERTY, PLANT AND EQUIPMENT
Property, plant and equipment are stated at historical cost, less accumulated depreciation and impairment losses. Histo-rical cost includes all direct costs and all expenditure incurred to bring the asset to its working condition and location as well as for its intended use. Historical cost includes the ori-ginal purchase price, borrowing costs incurred during the construction period, and related direct costs. Dredging equip-ment consists of components with different useful lives that are accounted for as separate items.
Subsequent costs are included in the asset’s carrying amount or recognised as a separate asset, as appropriate, only when it is probable that future economic benefits associated with the item will flow to the group and the cost of the item can be measured reliably. The carrying amount of the replaced part is derecognised. The wear and tear of dredging equipment is highly dependent on project-specific combinations of soil conditions, material to be processed, maritime circumstan-ces, and the intensity of the deployment of the equipment (factors that are difficult to predict). Due to these erratic and
time-independent patterns, the maintenance and repair ex-penses for upkeep of the assets during the operation of the vessel are predominantly charged to the profit and loss ac-count.
Dry-docking costs are recognised in the carrying amount of vessels, rigs, etc. when incurred and depreciated over the pe-riod until the next dry-docking.
Depreciation is charged to the income statement on a straight-line basis over the useful lives at an estimated residu-al value as indicated in the table below. Land is not deprecia-ted as it is deemed to have an infinite life, except for landfills used for sand production that are depreciated according to the tons extracted. Methods for depreciation, useful life and residual value are reassessed at the end of each financial year and amended if necessary.
At initial recognition, estimated useful lives and residual values are as follows:
Gains and losses on disposals are determined by comparing the proceeds with the carrying amount and are recognised within result from operations.
28
THE GROUP AS LESSEE
Finance leasesLeases under which the Group assumes substantially all the risks and rewards of ownership are classified as finance lea-ses. Property, plant and equipment acquired by way of finan-ce lease are stated at an amount equal to the lower of their fair value and the present value of the minimum lease pay-ments at inception of the lease, less accumulated deprecia-tion and impairment losses. Each lease payment is allocated between the liability and finance charges so as to achieve a constant periodic rate of interest on the finance balance out-standing. The corresponding liability, net of finance charges, is presented as part of financial debt. The interest element is charged to the income statement as a finance charge over the lease period. The depreciation policy for leased assets is consistent with that for depreciable assets which are owned. However, when there is no reasonable certainty that owner-ship will be obtained by the end of the lease term, the asset is depreciated over the shorter of the lease term and its ex-pected useful life.
Operating leasesLeases under which substantially all the risks and rewards of ownership are effectively retained by the lessor are classified as operating leases. Lease payments under an operating lease are recognised as an expense on a straight-line basis over the lease term.
INVENTORIES
Inventories are measured at the lower of cost and net rea-lisable value. Cost is determined using the weighted average method. Net realisable value is the estimated selling price in the ordinary course of business, less the costs of completion and variable selling expenses.
CONTRACTS IN PROGRESS - REVENUE RECOGNITION
Results on contracts in progress are accounted for pro rata the progress of the contract. To the extent that the total re-sult on contracts in progress cannot be considered as reaso-nably predictable and certain, profits on such contracts are only recorded for at the delivery of the work. In the period in which it is determined that a loss will result from the per-formance of a contract, the entire amount of the estimated ultimate loss is charged against income.
The progress of a project or the percentage of completion is determined on the basis of the cost of the work done in rela-tion to the expected cost price of the project as a whole. The cost price includes all project costs, consisting of direct payroll costs, materials, costs of sub-contracted work, other costs and rates for equipment used. The positive correction on net mar-gin that is booked based on the percentage of completion rule explained above is accounted for as contracts in progress.
In the start-up phase of a project, this means when actual cost of the work is less than 10 % of the total expected cost price, no profit is recognised at all.
When there is any constraint on transferring cash from the working country to the headoffice, the profit on a contract is only recognised at cash basis.
TRADE AND OTHER RECEIVABLES
Trade and other receivables are stated initially at fair value and subsequently at amortised cost less accumulated impair-ment losses, such as doubtful debts. Amortised cost is deter-mined using the effective interest rate.
CASH AND CASH EQUIVALENTS
Cash and cash equivalents consist of cash in hand and balan-ces with banks and short-term investments.Cash, cash equivalents and short-term deposits are carried in the balance sheet at nominal value.
IMPAIRMENT TANGIBLE AND INTANGIBLE ASSETS INCLUDING GOODWILL
At the end of each reporting period, the Group reviews the carrying amounts of its tangible and intangible assets to de-termine whether there is any indication of impairment. If any such indication exists, the asset’s recoverable amount is estimated. For intangible assets that are not yet available for use, and for goodwill, the recoverable amount is estimated at each balance sheet date. An impairment loss is recogni-sed whenever the carrying amount of an asset or its cash-ge-nerating unit exceeds its recoverable amount. Recoverable amount is the higher of fair value less costs of disposal and value in use. In assessing value in use, the estimated future cash flows are discounted to their present value using a pre-tax discount rate that reflects current market assessments of the time value of money and the risks specific to the asset for which the estimates of future cash flows have not been adjusted.
If the recoverable amount of an asset (or cash-generating unit) is estimated to be less than its carrying amount, the car-rying amount of the asset (or cash-generating unit) is reduced to its recoverable amount. An impairment loss is recognised immediately in profit or loss.
When an impairment loss subsequently reverses, the carrying amount of the asset (or a cash-generating unit) is increased to the revised estimate of its recoverable amount, but so that the increased carrying amount does not exceed the carrying amount that would have been determined had no impair-ment loss been recognised for the asset (or cash-generating unit) in prior years. A reversal of an impairment loss is re-cognised immediately in profit or loss. An impairment loss on goodwill is never reversed.

29www.deme-group.com
SHARE CAPITAL
Repurchase of share capitalWhen the company purchases its own shares the amount paid, including any directly imputable expenses, is recognised as a deduction in equity. Proceeds from selling shares are directly included in equity, with no impact on the income statement.
PROVISIONS
Provisions are recognised in the balance sheet when the Group has a presented obligation (legal or constructive) resulting from a past event, when it is probable (more likely than not) that an outflow of resources embodying economic benefits will be required to settle the obligation, and a reliable estimate of the amount of the obligation can be made.
The amount recognised as a provision is the best estimate of the consideration required to settle the present obligation at the end of the reporting period, taking into account the risks and uncertainties surrounding the obligation. When a provision is measured using the cash flows estimated to settle the present obligation, its carrying amount is the present value of those cash flows (when the effect of the time value of money is material).
EMPLOYEE BENEFIT OBLIGATIONS
Defined contribution plansContributions to defined contribution plans are recognised as an expense in the income statement when incurred.
Belgian defined contribution plans with guaranteed returnBy law, defined contribution pension plans in Belgium are subject to minimum guaranteed rates of return. Hence, strictly speaking, those plans classify as defined benefit plans. The IASB recognized that the accounting for such so-called “contribution-based plans” in accordance with the currently applicable defined benefit methodology is problematic. Considering as well the uncertainty with respect to the future evolution of the minimum guaranteed rates of return in Belgium, the Company until 2014 adopted a retrospective approach whereby the net liability recognized in the statement of financial position is based on the sum of the positive differences, determined by individual plan participant, between the minimum guaranteed reserves and the accumulated contributions based on the actual rates of return at the closing date (i.e. the net liability is based on the deficit measured at intrinsic value, if any).As a result of the law of April 28, 2003 related to supplementary pension plans, the employer guaranteed a minimum rate of return on the employees’ contributions (i.e. 3.75%) and, in case of a defined contribution plan 3.25% on the employers’ contribution.
As a result of the law of December 18, 2015 aiming to guarantee the sustainability and the social nature of the supplementary pension plans these minimum guaranteed rates of return have been adjusted. On contributions paid as from January 1, 2016 onwards, a new, variable minimum guaranteed rate of return is applicable. This percentage is calculated as 65%
of the average 10 year OLO return considered over a period of 24 months, with a minimum of 1.75% and a maximum of 3.5%. In view of the overall low OLO returns over the last years, the current percentage is fixed at 1.75%. For the existing pensions plans at DEME, the old 3.25% and 3.75% guaranteed minimum rates of return remain applicable on the cumulative reserves per December 31, 2015, until the employee leaves the company. The new guaranteed rate of return (1.75% per January 1st, 2016) is only applicable on contributions made during 2016. In view of the minimum guaranteed rates of return, these “defined contribution” plans classify as “defined benefit” plans. Based on an analysis of the pension plans, the immaterial difference between the cumulative reserves and the minimum reserves per December 31, 2015, and the immaterial difference between the minimum guaranteed rate of return applicable to DEME and the technical rate of return guaranteed by the insurers, it is assumed that application of the “Projected Unit method” to “defined contribution” plans, would not have a material impact. Accordingly, no provision has been accounted for in this respect in the financial information per December 31, 2015.
Defined benefit plansFor defined benefit retirement plans, the cost of providing benefits is determined using the projected unit credit method, with actuarial valuations being carried out at the end of each annual reporting period. Remeasurement, comprising actuarial gains and losses, the effect of the changes to the asset ceiling (if applicable) and the return on plan assets (excluding interest), is reflected immediately in the statement of financial position with a charge or credit recognised in other comprehensive income in the period in which they occur. Remeasurement recognised in other comprehensive income is reflected as a separate reserve in equity and will not be reclassified to profit or loss. Past service cost is recognised in profit or loss in the period of a plan amendment. Net interest is calculated by applying the discount rate at the beginning of the period to the net defined benefit liability or asset. Defined benefit costs are categorised as follows:
• service cost (including current service cost,
past service cost, as well as gains and losses on
curtailments and settlements);
• net interest expense or income;
• remeasurement.
The Group presents the first two components of defined benefit costs in profit or loss. Curtailment gains and losses are accounted for as past service costs.
The retirement benefit obligation recognised in the consolidated statement of financial position represents the actual deficit or surplus in the Group’s defined benefit plans. Any surplus resulting from this calculation is limited to the present value of any economic benefits available in
30
the form of refunds from the plans or reductions in future contributions to the plans.
BonusesBonuses received by company employees and management are based on financial key indicators and personal performance.
INTEREST-BEARING LOANS AND BORROWINGS
Interest-bearing loans and borrowings are recognised initially at fair value adjusted for the attributable transaction costs. Subsequent to initial recognition, interest-bearing loans and borrowings are stated at amortised cost with any difference between the proceeds (adjusted for transaction costs) and redemption value being recognised in the income statement over the period of the loan or borrowings on an effective interest rate basis.
TRADE AND OTHER PAYABLES
Trade and other payables are stated at nominal value.
INCOME TAXES
Income taxes are classified as either current or deferred taxes. Income tax is recognised in the income statement except to the extent that it relates to items recognised directly in equity, in which case it is recognised in equity.
Current income taxes include expected tax charges based on the accounting profit for the current year and adjustments to tax charges of prior years.Deferred taxes are calculated using the liability method, on temporary differences arising between the tax bases of assets and liabilities and their carrying amounts in the financial sta-tements. The principal temporary differences arise from de-preciation of property, plant and equipment, provisions for defined benefit plans, fair value measurement of derivatives and tax losses carried forward.
Deferred taxes are measured using the tax rates expected to apply to taxable income in the years in which those tempo-rary differences are expected to be realised or settled, based on tax rates enacted or substantively enacted by the balance sheet date. Deferred tax assets are recognised to the extent that it is probable that future taxable profit will be available against which the temporary differences can be utilised; this criterion is reassessed at each balance sheet date.
INVESTMENT TAX CREDITS
Investment tax credits are excluded from the scope of IAS 12 Income Taxes and IAS 20 Accounting for Government Grants and Disclosure of Government Assistance. In accordance with IAS 8 Accounting Policies, Changes in Accounting Estimates and Errors, the Group defined an accounting policy in respect of investment tax credits by making an analogy to IAS 12 In-come Taxes. By making this analogy a credit will be recogni-sed in profit or loss, and the related asset in the statement of
financial position recognised in the line item Deferred Tax As-sets, when the entity satisfies the criteria to receive the credit.
DERIVATIVE FINANCIAL INSTRUMENTS AND HEDGING
DEME uses derivative financial instruments to hedge its ex-posure to foreign exchange, interest-rate and commodity price risks (mainly fuel) arising from operational, financing and investment activities. The exposure of all subsidiaries is managed on a centralised basis, in accordance with the aims and principles laid down by general management. As a po-licy, the Group does not engage in speculative or leveraged transactions, nor does it hold or issue financial instruments for trading purposes.
Derivative financial instruments are initially recognised and subsequently measured at fair value. Recognition of any re-sulting unrealised gain or loss depends on the nature of the item being hedged.
It is the policy of the Group to use cash flow hedges to cover all operational currency risks that mainly relate to future cash flows from contracts that are highly probable to be realised and that are denominated in currencies other than the re-levant functional currency. Fuel price risks and interest rate risks in future cash flows can be hedged from time to time using specific derivatives.
Hedge accounting is applied to the majority of cash flow hed-ges as follows. On initial designation of the hedge, the Group formally documents the relationship between the hedging instrument(s) and hedged item(s), including the risk manage-ment objectives and strategy in undertaking the hedge trans-action, together with the methods that will be used to assess the effectiveness of the hedging relationship. The Group ma-kes an assessment, both at the inception of the hedge relati-onship as well as on an ongoing basis, whether the hedging instruments are expected to be “effective” in offsetting the changes in the fair value or cash flows of the respective hed-ged items during the period for which the hedge is designa-ted, and whether the actual results of each hedge are within a range of 80 - 125 percent. For a cash flow hedge of a fore-cast transaction, the transaction should be highly probable to occur and should present an exposure to variations in cash flows that could ultimately affect reported net income.
The application of hedge accounting means that movements in the market value of cash flow hedges not yet settled – in-cluding results realised on the “rolling forward” of existing hedges as a result of differences between the duration of the hedges concerned and the underlying cash flows – will be di-rectly added or charged to the hedging reserve in group equi-ty, taking taxation into account. If a cash flow hedge added or charged to the group equity either expires, is closed or is settled, or the hedge relation with the underlying cash flows can no longer be considered effective, the accumulated result will continue to be recognised in group equity as long as the underlying cash flow is still expected to take place.
When the underlying cash flow actually takes place, the accu-mulated result is included directly in the income statement. Movements in the market value of cash flow hedges to which no hedge accounting is applied (ineffective cash flow hedges

31www.deme-group.com
and the ineffective portion of effective cash flow hedges) are included in the income statement for the reporting period.Results from settled effective cash flow hedges and the move-ments in the market value of ineffective cash flow hedges in-sofar these relate to non-current receivables, loans and other borrowings are recognised as finance income and finance ex-penses and otherwise in the related items within operating result. The purchase or sale of financial instruments is gene-rally recorded at transaction rate. Derivatives are stated at fair value; attributable transaction costs are recognised in the income statement as incurred. Subsequent to initial recogni-tion, derivatives are measured at fair value, and changes the-rein are accounted for as described.
REVENUE
Revenue from construction contractsRevenue from a construction contract includes the initial amount of revenue agreed in the contract and variations in the work specified by the contract, claims and performance bonuses to the extent that it is probable that these will gene-rate revenue and that they can be reliably measured.
Contract revenue is measured at the fair value of the conside-ration received or receivable.
When the outcome of a construction contract can be estimated reliably, revenue and costs are recognised by reference to the stage of completion of the contract activity at the end of the reporting period, measured based on the proportion of contract costs incurred for work performed to date relative to the estimated total contract costs, except where this would not be representative of the stage of completion. When the outcome of a construction contract cannot be estimated reliably, contract revenue is recognised to the extent of contract costs incurred that it is probable will be recoverable. Contract costs are recognised as expenses in the period in which they are incurred. When it is probable that total contract costs will exceed total contract revenue, the expected loss is recognised as an expense immediately.
See also above for the accounting policy regarding contracts in progress - revenue recognition.
Rendering of servicesThe accounting policy applied is very similar to revenue from construction contracts.
Financial incomeFinancial income comprises interest income, dividend income, foreign exchange gains and gains on financial derivatives that are recognised in the income statement.
Interest income is accrued on a time basis, by reference to the principal outstanding and at the effective interest rate applicable. Dividend income is recognised when the shareholder’s right to receive payment has been established (provided that it is probable that the economic benefits will flow to the Group and the amount of income can be measured reliably).
EXPENSES
Financial expensesFinancial expenses comprise interest expenses on borrowings, foreign exchange losses, and losses on hedging instruments that are recognised on the income statement.
All interest expenses and other costs incurred in connection with borrowings, except those which were eligible to be capitalised, are taken to profit or loss as financial expenses. The interest expense is recognised in the income statement using the effective interest rate method.
Research and development, advertising and promotional costs and IT systems development costs Research, advertising and promotional costs are expensed in the year in which they are incurred. Development costs and IT systems development costs are expensed in the year in which they are incurred if they do not meet the criteria for capitalisation.

32
Suez Canal extension project, Egypt

33www.deme-group.com

34
DEME IFRS
EXPLANATORY NOTES TO THE CONSOLIDATED FINANCIAL STATEMENTS
Note 2 Intangible assets
(in thousands of EUR)Research and development
expenses
Concessions, patents, licences,
etc.
Other intangible
assetsTotal
Acquisition cost at January 1, 2015 1,993 16,221 – 18,214
Movements during the year:
Acquisitions, including fixed assets, own production 2 173 – 175
Sales and disposals 17 –226 – –209
Transfers from one heading to another – – – –
Translation differences – 609 – 609
Change in consolidation scope and other – 12,091 10,022 22,113
At December 31, 2015 2,012 28,868 10,022 40,902
Depreciation and amounts written off at January 1, 2015
224 11,454 – 11,678
Movements during the year:
Recorded 1,786 2,412 120 4,318
Written down after sales and disposals – –132 – –132
Transfers from one heading to another – – – –
Translation differences – 610 – 610
Change in consolidation scope and other – 3,586 8,464 12,050
At December 31, 2015 2,010 17,930 8,584 28,524
Net book value at the end of the year 2 10,938 1,438 12,378
Note 1 Employment
Average number of persons employed during the year (in FTE) 2015 2014
Workers 2,135 2,180
Employees and management personnel 1,964 2,014
Total 4,099 4,194
Personnel expenses
(in thousands of EUR) 2015 2014
Remuneration and social charges 348,650 367,603
Pension expenses 7,002 7,127
Total 355,652 374,730

35www.deme-group.com
Note 3 Goodwill
(in thousands of EUR)Land andbuildings
PlantMachinery
and equipment
Furnitureand
vehicles
Leasingand similar
rights
Othertangible
assets
Assetsunder
construction
Acquisition cost at January 1, 2015 78,442 2,561,543 20,869 83,658 12,235 1,537
Movements during the year:
Acquisitions, including fixed assets, own production
808 113,372 2,967 59,543 – 86,266
Sales and disposals -5,652 -163,613 -1,379 -650 -52 -39
Transfers from one heading to another – 827 -18 -67 -404 -338
Translation differences 39 5,635 -15 – 1,198 -107
Change in consolidation scope and other 4,920 266,113 1,563 5,436 404 –
At December 31, 2015 78,557 2,783,877 23,987 147,920 13,381 87,319
Depreciation and amounts written off at January 1, 2015
35,789 1,269,672 17,314 26,176 11,788 –
Movements during the year:
Recorded 3,359 199,625 1,880 9,872 951 –
Written down after sales and disposals -4,528 -156,982 -1,178 -650 -52 –
Transfers from one heading to another 19 257 -19 -32 -225 –
Translation differences 187 5,496 12 – 285 –
Change in consolidation scope and other 896 61,255 1,121 – 254 –
At December 31, 2015 35,722 1,379,323 19,130 35,366 13,001 –
Net book value at the end of the year 42,835 1,404,554 4,857 112,554 380 87,319
(in thousands of EUR) Goodwill
Balance at January 1, 2015 17,055
Movements during the year:
Acquisitions through business combinations 4,792
Disposals –
Impairment losses -3,115
Balance at December 31, 2015 18,732
Note 4 TProperty, plant and equipment

36
(in thousands of EUR)Participations accounted for
using the equity methodOther non-current
financial assets
Balance at January 1, 2015 83,197 31,472
Movements during the year:
Additions 16,184 30,915
Disposals (-)/Change in consolidation scope -35,867 -4,329
Share in the result of participations accounted for using the equity method 39,597 –
Dividends distributed by the participations -449 –
Transfer (to) from other items -33,981 –
Other movements 2,998 –
Translation differences -7,019 –
Balance at December 31, 2015 64,660 58,058
Net financial debt as defined by the group 2015 2014
(in thousands of EUR) Non-current Current Total Non-current Current Total
Subordinated loan – – – -300 – -300
Bond -199,780 – -199,780 -199,706 – -199,706
Finance Leases -86,028 -13,799 -99,827 -51,716 -5,810 -57,526
Credit institutions -252,545 -95,102 -347,647 -249,576 -155,281 -404,857
Other loans -675 – -675 -725 – -725
Total long-term financial liabilities -539,028 -108,901 -647,929 -502,023 -161,091 -663,114
Cash and cash equivalents – 378,464 378,464 – 579,691 579,691
Credit institutions – – – – -418 -418
Other current financial liabilities – – – – -43,000 -43,000
Total net financial debt – – -269,465 – – -126,841
Debt maturity schedule of total long-term financial liabilities
More than 5 years
Between 1 and 5 years
Less than one year
Total
Subordinated loan – – – –
Bond – -199,780 – -199,780
Finance Leases -21,214 -64,814 -13,799 -99,827
Credit institutions -24,911 -227,634 -95,102 -347,647
Other loans – -675 – -675
Total at December 31, 2015 -46,125 -492,903 -108,901 -647,929
Note 5 Financial assets
Note 6 Financial liabilities and net financial debt

37www.deme-group.com
(in thousands of EUR)Non-current
assetNon-current
liabilityCurrent
assetCurrentliability
Net balance
Exchange rate instruments
(forward sales/purchase agreements) 1,381 -94 8,514 -4,795 5,006
Interest rate swaps – -8,517 – -7,323 -15,840
Fuel hedges – -24,748 – -22,489 -47,237
Total mark to market value at December 31, 2015 1,381 -33,359 8,514 -34,607 -58,071
Note 7 Financial derivatives
Note 8 Rights and commitments not reflected in the balance sheet
(in thousands of EUR) 2015
Amount of real guarantees, given or irrevocably promised by the enterprises included in the consolidation on their own assets, as security for debts and commitments, of enterprises included in the consolidation.
526,499
Bank guarantees or corporate guarantees as security for commitments of enterprises included in the consolidation.
1,135,606
Dredging project Mersin, Turkey

38
DREDGING ENVIRONMENTAL & MARINE ENGINEERING NVSTATUTORY AUDITOR’S REPORT ON THE CONSOLIDATED FINANCIAL STATEMENTS FOR THE YEAR ENDED DECEMBER 31, 2015
To the board of directors in accordance with our engagement letter dated December 10, 2015, we are pleased to report to you on the audit assignment which you have entrusted to us. This report includes our report on the consolidated financial statements. These consolidated financial statements compri-se the consolidated balance sheet as at December 31, 2015, the consolidated income statement, the consolidated state-ment of comprehensive income, the consolidated statement of changes in equity and the consolidated statement of cash flows for the year then ended, as well as the summary of prin-cipal accounting policies and a selection of explanatory notes.
REPORT ON THE CONSOLIDATED FINANCIAL STATEMENTS – UNQUALIFIED OPINION
We have audited the consolidated financial statements of Dredging Environmental & Marine Engineering NV (‘the Com-pany’) and its subsidiaries (jointly ‘the Group’), prepared in accordance with the recognition and measurement principles of International Financial Reporting Standards as adopted by the European Union. The consolidated statement of financial position shows total assets of 3,149,769 (000) EUR and the consolidated income statement shows a consolidated profit (group share) for the year then ended of 199,196 (000) EUR.
BOARD OF DIRECTORS’ RESPONSIBILITY FOR THE PREPARATION OF THE CONSOLIDATED FINANCIAL STATEMENTS
The board of directors is responsible for the preparation and fair presentation of consolidated financial statements in accordance with International Financial Reporting Standards (IFRS) as adopted by the European Union, and for such internal control as the board of directors determines is necessary to enable the preparation of consolidated financial statements that are free from material misstatement, whether due to fraud or error.
STATUTORY AUDITOR’S RESPONSIBILITY
Our responsibility is to express an opinion on these consoli-dated financial statements based on our audit. We conduc-ted our audit in accordance with International Standards on Auditing (ISA). Those standards require that we comply with ethical requirements and plan and perform the audit to ob-tain reasonable assurance about whether the consolidated financial statements are free from material misstatement.
An audit involves performing procedures to obtain audit evi-dence about the amounts and disclosures in the consolidated financial statements. The procedures selected depend on the statutory auditor’s judgment, including the assessment of the risks of material misstatement of the consolidated financial
statements, whether due to fraud or error. In making those risk assessments, the statutory auditor considers internal con-trol relevant to the Group’s preparation and fair presentation of consolidated financial statements in order to design audit procedures that are appropriate in the circumstances, but not for the purpose of expressing an opinion on the effectiveness of the Group’s internal control.
An audit also includes evaluating the appropriateness of accounting policies used and the reasonableness of accounting estimates made by the board of directors, as well as evaluating the overall presentation of the consolidated financial statements. We have obtained from the Group’s officials and the board of directors the explanations and information necessary for performing our audit.
We believe that the audit evidence we have obtained is sufficient and appropriate to provide a basis for our opinion.
UNQUALIFIED OPINION
In our opinion, the consolidated financial statements of Dredging Environmental & Marine Engineering NV as of December 31, 2015 are prepared, in all material respects, in accordance with the recognition and measurement principles of International Financial Reporting Standards as adopted by the European Union.
EMPHASIS OF MATTER
We draw the attention to the ‘Basis of Preparation’ note of the consolidated financial statements that details the basis of preparation of the consolidated financial statements. The consolidated financial statements are based on the recognition and measurement principles of International Financial Reporting Standards as adopted by the European Union, but do not contain all the explanatory notes required by those standards and do not constitute a complete set of financial statements established in accordance with International Financial Reporting Standards as adopted by the European Union.
Antwerpen, 14/03/2016
The statutory auditor DELOITTE Bedrijfsrevisoren / Reviseurs d’Entreprises
BV o.v.v.e. CVBA / SC s.f.d. SCRL Represented by Luc Van Coppenolle

39www.deme-group.com
Climbing for LifeVosges, France
40
STATUTORY ANNUAL
ACCOUNT
Mersin project,Turkey

41www.deme-group.com
DEME NV
BALANCE SHEET
as of December 31, 2015 and 2014 (according to Belgian GAAP)
DEME NV
INTRODUCTION
(in thousands of EUR) 2015 2014
ASSETS
FIXED ASSETS 351,628 287,466
Formation expenses 220 294
Intangible assets 1,098 1,443
Property, plant and equipment 19,774 2,212
Land and buildings – –
Plant, machinery and equipment 1,702 2,212
Furniture and vehicles – –
Leasing and other similar rights – –
Other tangible fixed assets – –
Assets under construction and advance payments 18,072 –
Financial assets 330,536 283,516
Affiliated enterprises 326,514 278,882
Participating interests 296,882 278,882
Amounts receivable 29,632 –
Other enterprises linked by participating interests 4,000 4,612
Participating interests 4,000 4,472
Amounts receivable – 140
Other financial assets 22 22
Shares 22 22
Amount receivable and cash guarantees – –
CURRENT ASSETS 165,832 203,090
Amounts receivable after more than one year 151,177 173,256
Trade receivables – –
Other amounts receivable 151,177 173,256
Inventories and contracts in progress – –
Amounts receivable within one year 14,592 29,572
Trade receivables 9,533 23,821
Other amounts receivable 5,059 5,751
Own shares and other investments – –
Cash at bank and in hand 60 248
Deferred charges and accrued income 3 13
TOTAL ASSETS 517,460 490,556
The statutory annual accounts of Dredging Environmental & Marine Engineering NV are prepared in accordance with Belgian Generally Accepted Accounting Principles. The entire version of the statutory annual accounts of Dredging Environmental & Marine Engineering NV, along with the annual report and the report of the statutory au-ditor, will be deposited within the legal time frame at the National
Bank of Belgium and can be obtained for free through the website of the company (www.deme-group.com).
The statutory auditor has issued an unqualified auditor’s report on the statutory annual accounts of Dredging Environmental & Marine Engineering NV.

42
DEME NV
BALANCE SHEET
as of December 31, 2015 and 2014 (according to Belgian GAAP)
(in thousands of EUR) 2015 2014
LIABILITIES
CAPITAL AND RESERVES 189,169 184,131
Capital 31,110 31,110
Issued capital 31,110 31,110
Uncalled capital (-) – –
Share premium account 5,645 5,645
Revaluation surplus – –
Reserves 35,697 35,573
Legal reserves 3,111 3,111
Reserves not available for distribution – –
Untaxed reserves 29,315 29,191
Reserves available for distribution 3,271 3,271
Profit carried forward 116,718 111,804
PROVISIONS AND DEFERRED TAXES 202 138
Provisions for liabilities and charges – –
Deferred tax liabilities 202 138
CREDITORS 328,089 306,286
Amounts payable after more than one year 200,000 200,000
Financial liabilities 200,000 200,000
Subordinated loans – –
Bond 200,000 200,000
Finance leases – –
Credit institutions – –
Other long term financial liabilities – –
Amounts payable within one year 120,776 98,973
Current portion of amounts payable after more than one year – –
Financial liabilities – –
Credit institutions – –
Other current financial liabilities – –
Trade payables 5,099 20,593
Advances received on contracts in progress – –
Taxes, remuneration and social security 712 495
Taxes 286 303
Remuneration and social security 426 192
Other amounts payable 114,965 77,885
Accrued charges and deferred income 7,313 7,313
TOTAL LIABILITIES 517,460 490,556

43www.deme-group.com
DEME NV
PROFIT AND LOSS STATEMENT
as of December 31, 2015 and 2014 (according to Belgian GAAP)
(in thousands of EUR) 2015 2014
Operating income 21,487 51,654
Turnover 21,186 51,050
Increase (+), decrease (-) in contracts in progress – –
Fixed assets - own construction – –
Other operating income 301 604
Operating charges -23,553 -51,948
Raw materials and consumables – –
Purchases – –
Increase (-), decrease (+) in inventories – –
Services and other goods 15,370 45,836
Remuneration, social security costs and pensions 7,087 5,049
Depreciation and other amounts written off on (in)tangible fixed assets 978 982
Increase (+), decrease (-) in amounts written off on inventories, contracts
in progress and trade debtors – –
Increase (+), decrease (-) in provisions for liabilities and charges – –
Other operating charges 118 81
OPERATING PROFIT -2,066 -294
Financial income 101,686 109,064
Income from financial assets 94,070 102,137
Income from current assets 7,120 6,822
Other financial income 496 105
Financial charges -9,347 -10,244
Interests and other debt charges 9,095 9,858
Other financial charges 252 386
PROFIT ON ORDINARY ACTIVITIES BEFORE TAXATION 90,273 98,526
Extraordinary income – 1,598
Gain on disposal of fixed assets – 1,598
Other extraordinary income – –
Extraordinary charges -24,809 -20,206
Loss on disposal of fixed assets – 206
Other extraordinary charges 24,809 20,000
PROFIT FOR THE FINANCIAL PERIOD BEFORE TAXATION 65,464 79,918
Transfer from (to) deferred taxes -64 -138
Income taxes -360 -518
Income taxes 375 527
Adjustment of income taxes and write-back of tax provisions 15 8
PROFIT FOR THE FINANCIAL PERIOD 65,040 79,261
Transfer to the untaxed reserves -124 -269
Profit for the period available for appropriation 64,916 78,992
Transfer from profit carried forward 111,804 83,516
Transfer to legal reserves – –
Distribution of dividends 60,002 50,704
Transfer to profit carried forward 116,718 111,804

44

45www.deme-group.com
COLOFON
COMPLIED ANDCOORDINATED BY DEMEFinance Department Internal & External Communication
FINAL EDITINGHilde Vermeire & Els Verbraecken
DESIGN AND REALISATIONKA.AD
PRINTINGDrukkerij Lowyck
PHOTOSWe wish to thank all members of our personnel who provided us with pictures of the works. Special thanks to photographer Tom D’Haenens

46
Haven 1025, Scheldedijk 30
2070 Zwijndrecht, Belgium
T +32 3 250 52 11
F +32 3 250 56 50
www.deme-group.com